Article

Influence of Logos on Social Attitudes toward the Landscape of Protected Areas: The Case of National and Natural Parks in Spain

by
Andrés Caballero-Calvo
1,* and
José Luis Serrano-Montes
2
1
Department of Architecture and Urbanism, km 5 Vía Puerto Colombia, Universidad del Norte, Barranquilla 081007, Colombia
2
Department of Human Geography, Faculty of Arts and Humanities, University of Granada, 18071 Granada, Spain
*
Author to whom correspondence should be addressed.
Land 2020, 9(4), 106; https://doi.org/10.3390/land9040106
Submission received: 5 March 2020 / Revised: 26 March 2020 / Accepted: 27 March 2020 / Published: 1 April 2020

Abstract

:
This study is the first analysis of the influence of the design of the logos of the National and Natural Parks of Spain on social attitudes toward these protected areas (PAs). The effect of certain elements in the logo of a PA on its attractiveness and on support for its conservation was explored through a questionnaire survey of groups of university students. The respondents were asked to choose between different park logos, using three main criteria: tourist interest, conservation priority, and willingness to pay for conservation. The results showed a higher preference for PAs whose logos include animals and a lower preference for those with heritage elements. No significant differences were found in terms of types of university programs. The results suggest that greater attention should be paid to the role of iconographic elements in considerations of the protection and management of landscapes. This study adds to our understanding of the social mechanisms that influence the interest of the public in Natural and National Parks. These results can be used to increase the involvement of the general population in conservation goals, contributing to the social, economic, and environmental sustainability of PAs.

1. Introduction

In recent decades, international treaties, such as the European Landscape Convention (ELC) [1] and the Latin American Landscape Initiative (LALI) [2], have foregrounded the incorporation of public participation in landscape protection, management, and planning. Research on perceptions of and preferences for different landscapes, as a basis for the definition of “landscape quality objectives” [1], provides an optimal framework for the investigation of citizen participation mechanisms. There is an extensive body of scientific literature on the subject [3,4,5].
Studies have emphasized the role played by sociocultural variables, such as age, place of residence, interest, or educational background in a person’s perception of and attitude toward a landscape [6,7,8,9]. Likewise, the influence of both natural (water, floral, faunal, topographical, etc.) and cultural (traditional construction, new construction, agricultural, etc.) elements have been investigated in relation to perceptions and landscape preferences [10,11,12,13].
However, few researchers have analyzed symbolic and iconographic representations of landscapes, even though they have a fundamental influence on how landscapes are perceived [14,15,16]. The logos of Protected Areas (PAs) contribute to the creation of a collective landscape imagery, which has received little attention in the existing literature.
Furthermore, given that PAs are often the sites of conflicts of interest [17,18,19] and taking into consideration the recommendations of the ELC and the LALI, the development of participatory approaches and strategies to increase consensus among the different stakeholders involved is essential to guaranteeing their sustainable use [20]. This is clear in the case of the Law of Natural Heritage and Biodiversity in Spain, Law 42/2007 [21], and Europarc Spain [22], which states that the management of PAs must “encourage the participation of the local population in the preservation of their cultural and natural heritage” [22] (p. 72). On an international level, organizations such as the International Union for the Conservation of Nature also discuss the need to develop participatory approaches toward PA landscapes [23].
Understanding the factors of participatory conservation is vital to obtaining the support and participation of local communities within a PA [24]. Several conservation organizations have adopted logos featuring charismatic animal species to improve fundraising and to promote the involvement of the population in conservation [25]. In this sense, the elements present in logos of PAs not only constitute an iconographic image that contributes to the construction of a collective imagery of the landscape [26], they are also a first-order instrument for involving the local population, promoting citizen awareness, and ultimately increasing social support for the conservation of these landscapes, all of which are key aspects that are necessary to achieve social, economic, and environmental sustainability. In marketing and business research, there is an important body of literature which shows how the election of an adequate logo for a company may improve its corporate image and revenue. Numerous studies show that customers’ perceptions of logos are associated with significant differences in terms of how they evaluate companies [27,28,29,30]. Logos which contain natural forms and are aesthetically appealing tend to receive positive responses [28,31,32,33,34]. There is evidence which indicates that associating logos with naturalness [32] and the figurativeness of their design [33] can be the main criteria for choosing a given logo. The significant influence of logos on consumers means that they are a relevant factor which affects the behavior of the customers towards companies [33,34]. In the context of PAs, logos can become an important tool for management and planning if they were used to increase the attractiveness of PAs and the number of people willing to visit and pay for conservation.
We hypothesized that the use of different elements in the design of logos of PAs could have an impact on the social imagery of these landscapes, which, in turn, could lead to different degrees of tourist interest, conservation priorities, and willingness to pay for their conservation. This study, for the first time, analyzed and classified the logos of the National and Natural Parks of Spain according to their elements (flora and fauna, topography, heritage components, etc.). Likewise, this work aims to evaluate the attraction generated by the elements of these logos, as well as the attitudes and support for conservation that they trigger among different groups of university students.

2. Materials and Methods

2.1. Study Area

Beginning in the 1980s, Spain has sharply increased its PAs via various management categories. The PAs currently cover more than 7 million hectares, or 13% of the country. This proportion rises to 27% if we include the areas declared by the Natura 2000 Protected Areas Network [35]. In Spain, types of PAs differ according to their degree of protection, the managing body (international, European, national, or regional) and the natural or cultural values that each space represents (Figure 1). The 129 Natural Parks and the 15 National Parks constitute 83% and 8% of the protected national surface, respectively. Despite their limited number and small spatial area, the National Parks receive more than 45% of the total number of annual visits to PAs, which, in 2014, was nearly 30 million visitors [35].

2.2. Methodology

We consulted the databases of the Ministry of Agriculture and Fisheries, Food and Environment of Spain, which contains information on all the PAs of the country (name, surface area, regional distribution, etc.). This allowed the Natural and National Parks of Spain to be listed, and a search, compilation, and classification of the relevant logos were carried out. For this purpose, the official websites of different PAs were consulted. For any park that did not have a website, informational brochures and official planning documents were analyzed (namely, the Master Plan for Use and Management, the Plan for the Regulation of Natural Resources, and the Plan for Sustainable Development).
Once the logos of the parks were compiled, they were analyzed and classified into the following categories, according to their main components: (1) fauna, (2) flora, (3) landforms, (4) heritage elements, and (5) other types of elements.
Next, a questionnaire with six closed-ended questions was designed to evaluate the attractiveness of and support for landscape conservation provoked by the different components of the logos of Spanish PAs.
The questionnaire was composed of three sections, with two questions in each, which corresponded to three issues related to the logos of the PAs and their sustainability: (i) the tourist interest (TI) generated by these symbols, as the logo is part of the brand image of a PA and, in general, it constitutes the iconographic element most reproduced in information brochures and posters; (ii) the conservation priority (CP) that each promotes, as the presence in logos of threatened species, unique landforms, and elements of heritage interest can influence social attitudes toward the conservation of a PA; and (iii) willingness to pay (WP) for the conservation of the PA, following the methodological approaches established by previous research [36,37,38]. The questions were as follows:
  • Section TI: Considering only the logos of the protected areas shown below, indicate in which order you would visit them.
  • Section CP: From their logos, which of the following protected areas do you think deserves greater conservation?
  • Section WP: If you were choosing to give money to the financing of these protected areas, in what order would you choose to contribute to them?
The logos were gathered into six groups, for each of which the respondents ordered four logos of Spanish Natural Parks. That is, each set consisted of four logos, among which one focused on fauna, one on flora, one on landforms, and one on cultural heritage. The logos were changed for each question to better indicate the effect of the represented element and to minimize the influence of the design of a particular logo. A total of 23 original logos of Spanish Natural Parks were selected. To increase homogeneity, in one group, the logo of a Natural Monument was used. Homogeneity in the design of the logo was sought in terms of color, geometric shape, image quality, and clarity of the elements present to avoid the possibility that these factors would influence the participants’ responses. The order of presentation of the four logos in each question changed and was established randomly. Logos with especially charismatic fauna species [39,40,41] were discarded, namely, the Iberian lynx (Lynx pardinus) and the Spanish imperial eagle (Aquila adalberti).
Finally, demographic information on the respondents (age, sex, birthplace, and educational background) was collected to check if these variables have an influence on the responses.
After the elaboration of the provisional questionnaire, we conducted a pre-test in order to ensure that the questions were formulated adequately. Thus, a test of 25 students of the Faculty of Philosophy and Letters of the University of Granada (Spain) was conducted to achieve the final format of the questionnaire for the development of the research (see Appendix A and Appendix B).
The survey, conducted with university students, took place in different faculties of the University of Granada. Previous studies of landscape perception and preferences [5,42,43] have been done on students, and there is a broad consensus that their use is valid [44]. During October 2016, 182 students (n = 182) from the specializations: Geography and Land Management (n1 = 62), Environmental Sciences (n2 = 29), Sociology (n3 = 34), Anthropology (n4 = 38), and Tourism (n5 = 19) were surveyed in their classrooms. The response rate was 100%. The questionnaire was presented to the classes using a projection of a PowerPoint file, and the survey took 10 minutes for each group, on average. The respondents were 55.5% men and 44.5% women; their ages ranged between 18 and 62 years, with an average of 22.6 years.
Analyses of the data were carried out using IBM SPSS Statistics Version 20. The frequency calculation tool was used, which allowed the creation of a matrix of questions and groups that reflected the number of times a specific logo appeared in the first, second, third, or fourth position. We also performed a chi-square test to analyze the differences among students by their university degree.

3. Results

3.1. Classification and Characterization of the Logos of National and Natural Parks

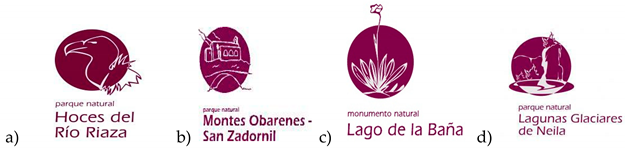
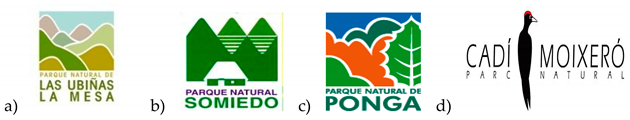
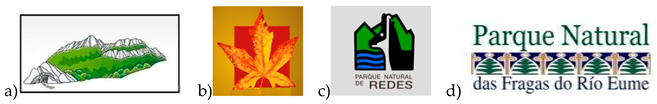
Among the logos of National and Natural Parks chosen for this study, we distinguished five large groups according to the elements they contained: (1) landforms, (2) fauna, (3) flora, (4) cultural heritage and (5) other elements (Table 1).
Fauna elements were the most commonly found, appearing in the logos of 2 National Parks and 43 Natural Parks. A total of 31.3% of the logos contained an animal species. The most common were the logos with landforms, used by 35 PAs, followed by flora, which was used by 27 PAs. The category of cultural heritage, with 11 logos, was the least represented.
The category of other elements included logos whose characteristics did not match any of the other categories (abstract elements, cartographic representations, etc.).
The existence of generic logos that are used by all Natural Parks of some autonomous communities should be noted, as is the case in the Valencian Community or in the Canary Islands, where all parks use the same logo, for which only the name of the Natural Park in question changes.
Birds and mammals were the most common classes of animals depicted. Among birds, raptors were dominant, with the Eurasian griffon vulture (Gyps fulvus), the Spanish imperial eagle (Aquila adalberti), and the peregrine falcon (Falco peregrinus), followed by some species of aquatic birds. For mammals, there were carnivores, such as the brown bear (Ursus arctos), the Iberian lynx (Lynx pardinus), and the European otter (Lutra lutra); ungulates, such as the Iberian wild goat (Capra pyrenaica) and the chamois (Rupicapra rupicapra); and cetaceans, such as the common bottlenose dolphin (Tursiops truncatus). In addition to these species, the common starfish (Asterias rubens) and other fish species were found, as in the logo of Bay of Cadiz Natural Park.
Several species of flora stood out, mainly arboreal and shrubby ones, which are characteristic of the protected spaces they represent. These include the common yew (Taxus baccata), used in the Sierras de Tejeda, Almijara, and Alhama Natural Park, and the Mediterranean dwarf palm (Chamaerops humilis), used for the Cabo de Gata-Níjar Natural Park. The leaves of certain species were commonly found instead of a representation of the whole plant. Logos containing landform elements generally showed outstanding geomorphological forms, such as gorges and valleys, or silhouettes of summits and horizons. The heritage elements were represented in logos by various constructions, whether archaeological or modern (churches, castles, etc.).

3.2. Preferences and Social Attitudes toward PAs Relative to the Elements Present in Their Logos

The analysis of the answers for each of the three question sets of the questionnaire revealed specific differences. The TI section, in which respondents were asked to indicate the order in which they would visit each PA based on its logo (Table 2), indicated a greater interest in logos containing landform elements, chosen as first by 50% of the respondents. This was followed by the fauna category, which was selected as the first option by 23.6% of respondents. Logos with heritage elements were less often chosen as most attractive than the two previous groups, and logos with flora were selected the least often. Cultural heritage logos were placed as the last option with the highest frequency (38.2%).
For the CP section (Table 3), the respondents were asked to indicate which PA they judged to deserve greater conservation effort from their logos. Our analysis indicated that fauna appeared in the first place in the highest percentage of selections (45.3%), followed by those with landform elements, chosen as the first option by 25% of the respondents. Logos containing fauna were the most common in the second position (34.3%), followed by those with species of flora (28.3%). Cultural heritage logos were considered to require fewer conservation measures than the others, taking the lowest percentage of first-place choices (11.3%) and the highest rate of last place choices (55.5%).
For the WP section (Table 4), respondents indicated their willingness to collaborate economically in the conservation of certain PAs in relation to their logos. The results maintained the pattern of the previous sections. The fauna category had the most first-place choices, at 64.3%, while logos with heritage elements were once again selected the most often as the last option (61.8%). Logos with landforms and flora were most often selected second and third, respectively, in relation to the willingness of the respondents to contribute economically to the conservation of the related PA.
A synthesis of the elements chosen as the first option by sections is included in Table 5.
Table 6 shows the position and corresponding number of choices, in both absolute and relative values, for which each category of logo was chosen. Our results indicated the highest preference for the logos with faunal species, with 44% of instances appearing in the first place and 26.8% in the second place. The subsequent most commonly selected category was landforms, chosen in 30.7% of instances as the first option and in 28.2% as the second.
The lowest preferences were registered for logos with heritage or floral elements, chosen first in only 12.7% and 12.2% of instances, respectively. When evaluating the highest percentage of elections in the fourth position, we also observed how the "cultural heritage" category was chosen more than half the time (51.8%), followed by the logos that contain elements of flora (22.8%).

3.3. Differences among Respondent Groups

The elements chosen as the first option by each respondent group were statistically tested using chi-square. The results were not significant at p < 0.05 (Table 7). Therefore, the university degree did not have a significant effect on the results.
However, some differences can be observed in terms of the frequency calculation. Sociology students assigned a higher preference to heritage elements (25%) in response to the TI questions than the whole body of students did (17%). For sections CP and WP, this group of students presented a higher predisposition toward conservation for PAs with logos that contained species of fauna by assigning them first place 57.4% and 69.1% of the time, respectively, whereas the total group chose them 45.3% and 64.3% of the time for these two sections, respectively.
Environmental science students showed less interest in heritage elements. In general, this group chose these logos last in 67.8% of cases, compared to 51.8% on average for all the groups. Environmental science students placed logos with faunal elements first less often than the total group: 36.2% vs. 45.3% in the CP section, and 46.6% vs. 64.3% in the WP section. In these two sections, flora elements were the most valued. In the CP section, 27.6% of the environmental science students put flora elements in the first place, whereas in the WP section it was 19%. If we compare these figures to the average of all the groups, it is clear that the latter attributed less importance to flora, as 18.4% chose it in the first place in the CP section and only 8.8% in the WP section. Tourism students showed a greater preference for certain iconographic elements than the average. Wildlife was given first place with a frequency that was above the average in the TI (31.7% vs. 23.6%) and WP (78.9% vs. 64.3%) sections. This greater preference for faunal elements was expressed to the detriment of other categories, such as vegetation and landforms. On the other hand, in this group, logos containing heritage elements were chosen last with a lower frequency (45.6%) than the general average (51.8%).
Anthropology students showed a lower preference, in all the sections, for logos that represented elements related to cultural heritage; these were chosen as the last option by 58.8% of the respondents, compared to 51.8% of the total sample. This group also highlighted a greater willingness to pay for conservation (section WP) of PAs whose logos represented fauna. This category was selected for first place in 75% of instances, compared to 64.3% among the total respondent group.
Finally, the answers reported by geography and land management students showed a lower preference for logos with flora species. For all sections, this typology was chosen last in 32.5% of instances, compared to 22.8% in the total group. On the other hand, we found a higher preference for logos with cultural heritage, which was chosen last in 42.7% of instances, compared to 51.8% for the total group. For the remainder of the instances, the choice percentages of this group were near the means of the total group.
Because of the general homogeneity of respondent age, this variable was not analyzed. Likewise, no students in our survey were from any of the natural parks whose logos were used in the questionnaire, so the place of origin was also not analyzed.

4. Discussion and Conclusions

In this research, we evaluated preferences regarding landscape protection, management, and planning in relation to the logos of PAs among five groups of university students. The results showed contrasting attitudes toward different elements of the logos. The components of the logos triggered distinct responses toward PAs in terms of such criteria as their tourist interest, conservation priority, and willingness to pay for their conservation. In general, we observed a preference for PAs whose logos contain species of fauna and a lower preference for logos that include heritage elements. We did not find significant differences in preferences regarding the area of specialization of the students who took part in the study.
Although Stamps [44] considered students to be acceptable substitutes for broader populations, other authors have reported significant differences between the landscape perceptions and preferences shown by local population groups and those of students [7,45]. Tempesta [46] observed that the perceptions of university students are likely more complex than those of other social groups, so their background may imply a more critical vision of landscapes. Among the disadvantages of working with students is their relative uniformity in educational background and their relative homogeneity in age. Both factors may be an important source of bias. In addition, since some of the students could have previously visited these areas, we must also take into consideration that there is a possibility that the choices of some respondents could be influenced by their previous knowledge and experiences. To minimize this effect, we omitted the names of the PAs used in the questionnaire. If the study had been conducted with local populations which inhabit PAs, due to their stronger bond with the landscapes, the results could have shown different attitudes toward the iconographic elements of the logos [9,47].
In reference to the sample, we must take into account that there are some differences in size between respondents’ groups and this could also have an effect on our findings. However, it must be emphasized that these differences were due to the size of the groups of students in the classroom since all the members of each group took part in the survey.
In addition to the characteristics of the sample, the design of the logos and even the particular animal, plant, landform, or type of heritage element represented likely influenced preferences and attitudes toward certain PAs. For instance, in replies to question TI1, the presence of a logo with a waterfall could condition responses, due to the marked preference for scenes containing water, as previously observed [7,48,49].
According to Maurín Álvarez [26] (p. 170), in a PA, “the same logos of each of these spaces clearly transmit this reality, with its common aspects (the mountainous profile) and differentials (morphological, biological, and cultural)”. Therefore, to accurately reflect reality, the logo of each PA should represent the most characteristic element or elements within it. However, this is not always done because logos are often configured to have charismatic or socially attractive attributes, and these may not represent the most common or representative aspect.
Thus, many logos of National and Natural Parks in Spain contain charismatic animal species, although they may be neither exclusive to the given PA or the most abundant in it, due to the strategic role that these flagship species play in developing public awareness, action, and fundraising for conservation [50,51]. As noted by Clucas, McHugh, and Caro [25], many organizations use charismatic animals in their logos to increase social support for conservation, including the African Wildlife Foundation, which uses the African elephant; the World Wildlife Fund for Nature, which uses the giant panda; and the Fauna & Flora International (FFI), which uses the Arabian oryx.
Ernoul et al. [52] highlighted the usefulness of iconic species for PA logos in a study of landscape values and their potential to stimulate interest in conservation planning. The general results of our study show a higher preference for logos that contained charismatic species of fauna. The presence of iconic animals in logos indicated great social support for the conservation of the corresponding PA (sections CP and WP). In this line, previous studies have shown the strategic role that some charismatic species play in raising public awareness, stimulating action and fundraising for the conservation of PAs [53,54]. Likewise, this pattern has been broadly analyzed by conservation organizations. These organizations adopt logos featuring charismatic animal species to improve fundraising and to promote the involvement of the population in conservation [25,39].
However, this category was not the most attractive representation for PAs (TI section). Fauna may be considered ephemeral [55,56], meaning that visitors may not see or hear it, conditioning the degree of attraction it may generate.
On the other hand, landforms are relatively stable elements, allowing outdoor activities (climbing, hiking, canyoning, etc.) and not requiring expertise for their enjoyment. Therefore, its presence in a logo had more importance for tourist interests and generated essential social support for conservation, as our research showed.
The results for flora showed a lower preference for logos containing plant species in all sections, compared to those logos in which fauna or landforms appeared. However, as noted by Ryan [57] and Serrano-Montes et al. [58], certain plant species are also charismatic, especially for local populations, so their appearance in some logos could have a similar effect to that of animals for these areas.
In the TI section, cultural heritage occupied the third position, only surpassing logos with flora. However, in a study of visual preferences in the agricultural landscapes of western Norway, Strumse [59] found that the category of traditional structures (stone bridges and walls or traditional rural housing) received the highest rating among respondents. Given the low preference for cultural heritage elements found in our study, we suggest that in PAs, the population may not have associated such attributes with any natural character, assumed for PAs and perceived to be linked more closely to vegetation, fauna, or landforms.
Although our results did not show significant differences among students’ groups, the possible varying attitudes toward logos observed in relation to the background of the respondents support the work of Zheng et al. [43]. Those authors found that, while students of agricultural economics, horticulture, and social sciences tended to choose clean and well-tended environments around their homes, wildlife science students showed a higher preference for more natural landscapes.
In addition to the diversity of attitudes found in relation to the logos of protected areas, this iconographic representation indicates elements of the collective imagery of the landscape of these spaces. According to Greider and Garkovich [16], laws, customs, myths, legends, novels, stories, historical events, art, music, photography, and film can create, recreate, and define landscapes; PA logos also play an essential role. The logo of a PA generates expectations in the visitor, who links the represented attribute to the PA (Figure 2). However, the absence of studies of logos in the imagery of the PAs compromises our understanding of how these iconographic elements influence social perceptions of the landscape.
The adoption of a single logo for all PAs in certain districts (observed in the Canary Islands and the Valencian Community) may strengthen the unified image of the region but could also lead to a loss of individual identity in the different PAs from an iconographic point of view.
The ELC, asserting the concept of the landscape quality objectives, emphasized the need to take into account “the aspirations of the public with regard to the landscape features of their surroundings” [1]. Given the importance of their logos, both for social attitudes and for the creation of the collective imagery of these spaces, their analysis plays a fundamental role in the adequate planning, management, and protection of PAs. The incursion of this research into citizen preferences, the degree of attractiveness of the logos, and the influence they have on conservation suggest that the choice of a PA’s logo be made more carefully, as it may affect the degree of acceptance, support, and conservation of each area and, therefore, of its long-term sustainability. In addition, the rise of social support motivated by the logos of the PAs could also be an essential tool for moving forward toward the accomplishment of Goal 15 of the Sustainable Development Goals, and especially Target 15.A, which emphasizes the need to “mobilize and significantly increase financial resources from all sources to conserve and sustainably use biodiversity and ecosystems” [60].
Likewise, as animal reintroduction projects move forward worldwide [61], the reappearance of wildlife that is charismatic and important from an ecological point of view, such as the wild horse, the European bison, and the beaver, should be taken into consideration in the design of future PA logos. Managers and decision-makers may wish to consider the reconfiguration of the logos of existing PAs because some reintroduced species may become characteristic elements of these areas.
In summary, PA logos constitute an essential tool for the promotion of social support and involve the public in the planning and management of these areas. The potential impact of this study is made clear by the ongoing growth of the number of PAs, which are covering an increasingly larger proportion of the planet. Future research should focus on the influence of PA logos on the construction of the collective imagery of the landscape of PAs. Likewise, it is necessary to study the aspirations and the attitudes expressed by local populations in relation to these iconographic elements, as well as those expressed by visiting populations or managers. The analysis of other sociodemographic variables, such as the sex, age, and origin of the populations surveyed, should also be performed in future studies.

Author Contributions

Conceptualization, A.C.-C. and J.L.S.-M.; methodology, A.C.-C. and J.L.S.-M.; software, J.L.S.-M.; validation, A.C.-C.; formal analysis, A.C.-C. and J.L.S.-M.; investigation, A.C.-C. and J.L.S.-M.; resources, A.C.-C.; data curation, J.L.S.-M.; writing—original draft preparation, A.C.-C. and J.L.S.-M.; writing—review and editing, A.C.-C. and J.L.S-M.; visualization, A.C-C. and J.L.S-M.; supervision, J.L.S-M.; project administration, A.C.-C.; funding acquisition, A.C.-C. All authors have read and agree to the published version of the manuscript.

Funding

This research received no external funding.

Conflicts of Interest

The authors declare no conflict of interest.

Appendix A

Questions showed to the participants.
TI1 Considering only the logos of the protected areas shown below, indicate in which order you would visit them (write the sequence order).
Land 09 00106 g003
TI2. Considering only the logos of the protected areas shown below, indicate in which order you would visit them (write the sequence order).
Land 09 00106 g004
CP1. From their logos, which of the following protected areas do you think deserves greater conservation (write the sequence order)?
Land 09 00106 g005
CP2. From their logos, which of the following protected areas do you think deserves greater conservation (write the sequence order)?
Land 09 00106 g006
WP1. If you were choosing to give money to the financing of these protected areas, in what order would you choose to contribute to them (write the sequence order)?
Land 09 00106 g007
WP2. If you were choosing to give money to the financing of these protected areas, in what order would you choose to contribute to them (write the sequence order)?
Land 09 00106 g008

Appendix B

Questionnaire completed by the participants.
  • Where is your birth place?
    ⬜ Urban Area ⬜ Rural Area ⬜ Protected Area
  • Age: ____
  • Sex:
    ⬜ Male ⬜ Female
  • Background
    ⬜ Sociology   ⬜ Environmental Sciences ⬜ Tourism
    ⬜ Anthropology ⬜ Geography and Land Management
  • Considering only the logos of the protected areas shown below, indicate in which order you would visit them (write the sequence order).
     1.___ 2.___  3.___ 4.___
  • Considering only the logos of the protected areas shown below, indicate in which order you would visit them (write the sequence order).
     1.___ 2.___ 3.___ 4.___
  • From their logos, which of the following protected areas do you think deserves greater conservation (write the sequence order)?
     1.___ 2.___ 3.___ 4.___
  • From their logos, which of the following protected areas do you think deserves greater conservation (write the sequence order)?
     1.___ 2.___ 3.___ 4.___
  • If you were choosing to give money to the financing of these protected areas, in what order would you choose to contribute to them (write the sequence order)?
     1.___ 2.___ 3.___ 4.___
  • If you were choosing to give money to the financing of these protected areas, in what order would you choose to contribute to them (write the sequence order)?
     1.___ 2.___ 3.___ 4.___

References

  1. Council of Europe. The European Landscape Convention 2000. Available online: http://conventions.coe.int/Treaty/en/Treaties/Html/176.htm (accessed on 20 March 2019).
  2. International Federation of Landscape Architects. Latin American Landscape Initiative (LALI) 2013. Available online: http://www.csla-aapc.ca/sites/csla-aapc.ca/files/IFLA/120910%20LALI_EN--.pdf (accessed on 20 March 2019).
  3. Barroso, F.L.; Pinto-Correia, T.; Ramos, I.L.; Surová, D.; Menezes, H. Dealing with landscape fuzziness in user preference studies: Photo-based questionnaires in the Mediterranean context. Landsc. Urban Plan. 2012, 104, 329–342. [Google Scholar] [CrossRef] [Green Version]
  4. Ode, A.; Hagerhall, C.M.; Sang, N. Analysing visual landscape complexity: Theory and application. Landsc. Res. 2010, 35, 111–131. [Google Scholar] [CrossRef]
  5. Sevenant, M.; Antrop, M. Cognitive attributes and aesthetic preferences in assessment and differentiation of landscapes. J. Environ. Manag. 2009, 90, 2889–2899. [Google Scholar] [CrossRef] [PubMed]
  6. Adevi, A.A.; Grahn, P. Preferences for landscapes: A matter of cultural determinants or innate reflexes that point to our evolutionary background? Landsc. Res. 2012, 37, 27–49. [Google Scholar] [CrossRef]
  7. Yang, B.; Kaplan, R. The perception of landscape style: A cross-cultural comparison. Landsc. Urban Plan. 1990, 19, 251–262. [Google Scholar]
  8. Múgica, M.; De Lucio, J.V. The role of on-site experience on landscape preferences. A case study at Doñana National Park (Spain). J. Environ. Manag. 1996, 47, 229–239. [Google Scholar]
  9. Van den Berg, A.E.; Koole, S.L. New wilderness in the Netherlands: An investigation of visual preferences for nature development plans. Landsc. Urban Plan. 2006, 78, 362–372. [Google Scholar] [CrossRef]
  10. Arias-García, J.; Serrano-Montes, J.L.; Gómez-Zotano, J. Fauna in wetland landscapes: A perception approach. Landsc. Res. 2015, 41, 510–523. [Google Scholar] [CrossRef]
  11. Arnberger, A.; Eder, R. Exploring the heterogeneity of rural landscape preferences: An image-based latent class approach. Landsc. Res. 2011, 36, 19–40. [Google Scholar] [CrossRef]
  12. Arriaza, M.; Cañas-Ortega, J.F.; Cañas-Madueño, J.A.; Ruiz-Aviles, P. Assessing the visual quality of rural landscapes. Landsc. Urban Plan. 2004, 69, 115–125. [Google Scholar] [CrossRef]
  13. Gomez-Limon, J.; De Lucio Fernández, J.V. Changes in use and landscape preferences on the agricultural livestock landscapes of central Iberian Peninsula (Madrid, Spain). Landsc. Urban Plan. 1999, 44, 165–175. [Google Scholar] [CrossRef]
  14. Cosgrove, D.; Daniels, S. The Iconography of Landscape: Essays on the Symbolic Representation, Design and Use of Past Environments; Cambridge University Press: Cambridge, UK, 1988; Volume 9. [Google Scholar]
  15. Cosgrove, D.E. Social formation and Symbolic Landscape, 2nd ed.; University of Wisconsin Press: Madison, WI, USA, 1998. [Google Scholar]
  16. Greider, T.; Garkovich, L. Landscapes: The social construction of nature and the environment. Rural Sociol. 1994, 59, 1–24. [Google Scholar] [CrossRef]
  17. Allendorf, T.D.; Smith, J.L.; Anderson, D.H. Residents’ perceptions of Royal Bardia National Park, Nepal. Landsc. Urban Plan. 2007, 82, 33–40. [Google Scholar] [CrossRef]
  18. Illsley, D.; Richardson, T. New national parks for Scotland: Coalitions in conflict over the allocation of planning powers in the Cairngorms. J. Environ. Plan. Manag. 2004, 47, 219–242. [Google Scholar] [CrossRef]
  19. Fiallo, E.A.; Jacobson, S.K. Local communities and protected areas: Attitudes of rural residents toward conservation and Machalilla National Park, Ecuador. Environ. Conserv. 1995, 22, 241–249. [Google Scholar] [CrossRef]
  20. Kothari, A. Protected areas and people: The future of the past. PARKS (IUCN) 2008, 17, 23–34. [Google Scholar]
  21. Nature protection and biodiversity - National Responses (in Spanish). Available online: https://www.boe.es/buscar/act.php?id=BOE-A-2007-21490 (accessed on 16 March 2019).
  22. EUROPARC-España. Anuario 2016 del estado de las áreas protegidas en España; Fundación Interuniversitaria Fernando González Bernáldez para los espacios naturales, 2017; Available online: http://www.redeuroparc.org/system/files/shared/Publicaciones/Anuario_2016/anuario_2016_europarc-espana.pdf (accessed on 28 March 2019).
  23. Dudley, N.; Shadie, P.; Stolton, S. Guidelines for Applying Protected Area Management Categories Including IUCN WCPA Best Practice Guidance on Recognising Protected Areas and Assigning Management Categories and Governance Types; IUCN: Gland, Switzerland, 2013. [Google Scholar]
  24. Paudyal, R.; Thapa, B.; Neupane, S.S.; KC, B. Factors associated with conservation participation by local communities in Gaurishankar Conservation Area Project, Nepal. Sustainability 2018, 10, 3488. [Google Scholar] [CrossRef] [Green Version]
  25. Clucas, B.; McHugh, K.; Caro, T. Flagship species on covers of US conservation and nature magazines. Biodivers. Conserv. 2008, 17, 1517–1528. [Google Scholar] [CrossRef]
  26. Maurín Álvarez, M. Protected areas: A geographic approach. Ería: Revista Cuatrimest. de Geogr. 2008, 76, 165–195. [Google Scholar]
  27. Henderson, P.W.; Cote, J.A. Guidelines for selecting or modifying logos. J. Mark. 1998, 62, 14–30. [Google Scholar] [CrossRef]
  28. Balmer, J.; Van Riel, C.; Van den Ban, A. The added value of corporate logos-An empirical study. Eur. J. Mark. 2001, 35, 428–440. [Google Scholar] [CrossRef]
  29. Park, C.W.; Eisingerich, A.B.; Pol, G.; Park, J.W. The role of brand logos in firm performance. J. Bus. Res. 2013, 66, 180–187. [Google Scholar] [CrossRef]
  30. Hagtvedt, H. The impact of incomplete typeface logos on perceptions of the firm. J. Mark. 2011, 75, 86–93. [Google Scholar] [CrossRef] [Green Version]
  31. Small, J.; Melewar, T.C.; Pittard, N.; Ewing, M.; Jevons, C. Aesthetic theory and logo design: Examining consumer response to proportion across cultures. Int. Mark. Rev. 2007, 24, 457–473. [Google Scholar] [CrossRef]
  32. Machado, J.C.; de Carvalho, L.V.; Torres, A.; Costa, P. Brand logo design: Examining consumer response to naturalness. J. Prod. Brand Manag. 2015, 24, 78–87. [Google Scholar] [CrossRef] [Green Version]
  33. Machado, J.C.; Vacas de Carvalho, L.; Torres, A.; Van de Velden, M.; Costa, P. Logo Design: Examining Consumer Response to Figurativeness Across Cultures. In Proceedings of the 43rd European Marketing Academy Annual Conference, Valencia, Spain, 3–6 June 2014; pp. 1–7, ISBN 978-84-370-9453-3. [Google Scholar]
  34. Van Grinsven, B. Logo Design and Logo Change: Experimental Tests of Consumer Responses; Proefschrift Vrije Universiteit Amsterdam: Amsterdam, The Netherlands, 2016. [Google Scholar]
  35. EUROPARC-España. Anuario 2018 del estado de las áreas protegidas en España.; Fundación Interuniversitaria Fernando González Bernáldez para los espacios naturales, 28 March; Available online: http://www.redeuroparc.org/system/files/shared/Publicaciones/Anuario_2018/anuario2018.pdf (accessed on 28 March 2019).
  36. Dharmaratne, G.S.; Sang, F.Y.; Walling, L.J. Tourism potentials for financing protected areas. Ann. Tour. Res. 2000, 27, 590–610. [Google Scholar] [CrossRef]
  37. Wang, P.-W.; Jia, J.-B. Tourists’ willingness to pay for biodiversity conservation and environment protection, Dalai Lake protected area: Implications for entrance fee and sustainable management. Ocean Coast. Manag. 2012, 62, 24–33. [Google Scholar] [CrossRef]
  38. White, P.C.L.; Lovett, J.C. Public preferences and willingness-to-pay for nature conservation in the North York Moors National Park, UK. J. Environ. Manag. 1999, 55, 1–13. [Google Scholar] [CrossRef]
  39. Home, R.; Keller, C.; Nagel, P.; Bauer, N.; Hunziker, M. Selection criteria for flagship species by conservation organizations. Environ. Conserv. 2009, 36, 139–148. [Google Scholar] [CrossRef] [Green Version]
  40. Lorimer, J. Nonhuman charisma: Which species trigger our emotions and why? Ecos-Br. Assoc. Nat. Conserv. 2006, 27, 20. [Google Scholar]
  41. Lorimer, J. Nonhuman charisma. Environ. Plan. D Soc. Space 2007, 25, 911–932. [Google Scholar] [CrossRef]
  42. Tveit, M. Indicators for visual scale as predictors of landscape preference: A comparison between groups. J. of Environmental Management 2009, 90, 2882–2888. [Google Scholar] [CrossRef]
  43. Zheng, B.; Zhang, Y.; Chen, J. Preference to home landscape: Wildness or neatness? Landsc. Urban Plan. 2011, 99, 1–8. [Google Scholar] [CrossRef]
  44. Stamps, A.E. Demographic effects in environmental aesthetics: A meta-analysis. J. Plan. Lit. 1999, 14, 155–175. [Google Scholar] [CrossRef]
  45. Dramstad, W.E.; Tveit, M.S.; Fjellstad, W.J.; Fry, G.L.A. Relationships between visual landscape preferences and map-based indicators of landscape structure. Landsc. Urban Plan. 2006, 78, 465–474. [Google Scholar] [CrossRef]
  46. Tempesta, T. The perception of agrarian historical landscapes: A study of the Veneto plain in Italy. Landsc. Urban Plan. 2010, 97, 258–272. [Google Scholar] [CrossRef]
  47. Durrant, J.O.; Shumway, J. Attitudes Toward Wilderness Study Areas: A Survey of Six Southeastern Utah Counties. Environ. Manag. 2004, 33, 271–283. [Google Scholar] [CrossRef]
  48. Howley, P. Landscape aesthetics: Assessing the general publics’ preferences towards rural landscapes. Ecol. Econ. 2011, 72, 161–169. [Google Scholar] [CrossRef]
  49. Kaltenborn, B.P.; Bjerke, T. Associations between environmental value orientations and landscape preferences. Landsc. Urban Plan. 2002, 59, 1–11. [Google Scholar] [CrossRef]
  50. Caro, T. Conservation by Proxy: Indicator, Umbrella, Keystone, Flagship, and Other Surrogate Species; Island Press: Washington (Washington), USA, 2010. [Google Scholar]
  51. Hambler, C.; Canney, S.M. Conservation; Cambridge University Press: New York, NY, USA, 2013. [Google Scholar]
  52. Ernoul, L.; Wardell-Johnson, A.; Willm, L.; Béchet, A.; Boutron, O.; Mathevet, R.; Arnassant, S.; Sandoz, A. Participatory mapping: Exploring landscape values associated with an iconic species. Appl. Geogr. 2018, 95, 71–78. [Google Scholar] [CrossRef]
  53. Supriatna, J.; Ario, A. Primates as flagships for conserving biodiversity and parks in Indonesia: Lessons learned from West Java and North Sumatra. Primate Conserv. 2015, 29, 123–131. [Google Scholar] [CrossRef] [Green Version]
  54. Stevens, S.S. Flagship Species, Tourism, and Support for Rubondo Island National Park, Tanzania. Ph.D. Thesis, University of Massachusetts Amherst, Amherst, MA, USA, September 2011. [Google Scholar]
  55. Brassley, P. On the unrecognized significance of the ephemeral landscape. Landsc. Res. 1998, 23, 119–132. [Google Scholar] [CrossRef]
  56. Tveit, M.; Ode, A.; Fry, G. Key concepts in a framework for analysing visual landscape character. Landsc. Res. 2006, 31, 229–255. [Google Scholar] [CrossRef]
  57. Ryan, J.C. Botanical memory: Exploring emotional recollections of native flora in the Southwest of Western Australia. Emot. Space Soc. 2013, 8, 27–38. [Google Scholar] [CrossRef] [Green Version]
  58. Serrano-Montes, J.L.; Olmedo-Cobo, J.A.; Gómez-Zotano, J.; Martínez-Ibarra, E. Dactylopius opuntiae vs. Opuntiaficus-indica in Spain: Spatial and temporal analysis and landscape impact evaluation through on-line media. An. de Geogr. de la Univ. Complut. 2018, 38, 195–217. [Google Scholar]
  59. Strumse, E. Perceptual dimensions in the visual preferences for agrarian landscapes in western Norway. J. Environ. Psychol. 1994, 14, 281–292. [Google Scholar] [CrossRef]
  60. Sustainable Development Goal 15 2015. Available online: https://sustainabledevelopment.un.org/sdg15# (accessed on 25 May 2019).
  61. Serrano-Montes, J.L.; Gómez-Zotano, J.; Olmedo-Cobo, J.A. Rewilding and wildlife comeback: Approaches, experiences and landscape changes. Cuadernos Geogr. 2017, 56, 136–161. [Google Scholar]
Figure 1. Natural and National Parks of Spain. Source: Prepared by the authors on the basis of data from the Ministry of Agriculture and Fisheries, Food and Environment (Government of Spain).
Land 09 00106 g001
Figure 2. Informative panel at Sierra de Cardeña y Montoro Natural Park (Cordoba, Spain). (Photography: José Luis Serrano-Montes).
Land 09 00106 g002
Table 1. Classification of the logos of Spanish National and Natural Parks.
CategoriesNational ParksNatural ParksTotal%
Fauna2434531.3
Landforms7283524.3
Flora2252718.8
Cultural heritage011117.6
Other elements4596.3
No logo/logo not available0171711.8
TOTAL15129144100
Source: Own elaboration.
Table 2. Preferential ordering in responses to questions TI1 (Section TI, question 1) and TI2 (Section TI, question 2).
OrderFaunaFloraLandformsCultural Heritage
Frequency%Frequency%Frequency%Frequency%
18623.6349.318250.06217.0
29826.97821.410027.58824.2
310127.713837.95013.77520.6
47921.711431.3328.813938.2
Source: Own elaboration.
Table 3. Preferential ordering in responses to questions CP1 (Section CP, question 1) and CP2 (Section CP, question 2).
OrderFaunaFloraLandformsCultural Heritage
Frequency%Frequency%Frequency%Frequency%
116545.36718.49125.04111.3
212534.310328.38222.55414.8
34011.012333.813436.86718.4
4349.37119.55715.720255.5
Source: Own elaboration.
Table 4. Preferential ordering in responses to questions WP1 (Section WP, question 1) and WP2 (Section WP, question 2).
OrderFaunaFloraLandformsCultural Heritage
Frequency%Frequency%Frequency%Frequency%
123464.3328.86217.0369.9
27019.212333.812634.64512.4
34712.914539.811431.35815.9
4133.66417.66217.022561.8
Source: Own elaboration.
Table 5. First place choices by section (%).
TICPWP
Fauna23.645.364.2
Flora9.318.38.8
Landforms49.925.017.0
Cultural heritage17.011.29.8
Source: Own elaboration.
Table 6. Preferential ordering in responses to questions 1 to 6.
OrderFaunaFloraLandformsCultural Heritage
Frequency%Frequency%Frequency%Frequency%
148544.413312.233530.713912.7
229326.830427.830828.218717.1
318817.240637.229827.320018.3
412611.524922.815113.856651.8
Source: Own elaboration.
Table 7. Results of the chi-square test by sections.
Chi-Square Statisticp-Value
Section TI 8.55340.743441
Section CP9.72540.689956
Section WP15.49120.203472
All sections5.72050.929513

