Article

Climate Change Affected Vegetation Dynamics in the Northern Xinjiang of China: Evaluation by SPEI and NDVI

1
Key Laboratory of Wetland Ecology and Environment, Northeast Institute of Geography and Agroecology, Chinese Academy of Sciences, Changchun 130102, China
2
University of Chinese Academy of Sciences, Beijing 100049, China
*
Author to whom correspondence should be addressed.
Submission received: 6 February 2020 / Revised: 6 March 2020 / Accepted: 17 March 2020 / Published: 18 March 2020
(This article belongs to the Section Land Systems and Global Change)

Abstract

:
Drought and vegetation dynamics in the northern Xinjiang Uygur Autonomous Region of China (NXC), the centre of Asia with arid climate, were assessed using the standardized precipitation evapotranspiration index (SPEI) and the normalized difference vegetation index (NDVI). Analyses were performed through the use of Sen’s method and Spearman’s correlation to investigate variations in the NDVI and the impacts of drought on vegetation from 1998 to 2015. The severity of droughts in the NXC was assessed by the SPEI, which was revealed to increase over the last 60 years at a rate of 0.017 per decade. This indicates that an alleviating tendency of drought intensity occurred in the NXC. Specifically, the spatial pattern of drought intensity increased gradually from the north-western to south-eastern regions. The average yearly NDVI was 0.28 and increased slightly by 0.001 yr−1 (r = 0.94, p = 3.64) between 1998 and 2015. Additionally, the NDVI showed an obviously spatial heterogeneity, with greater values in the west and small values in the east. Significantly, positive correlations between SPEI and NDVI were observed, while drought exerted a five-year lag effect on vegetation.

1. Introduction

The impact of worldwide climate change has led to changes in terrestrial ecosystems, of which vegetation is a fundamental element and forms a core component of the soil–vegetation–atmosphere continuum. Various studies have proven the sensitivity of vegetation in various regions of the world to environmental changes [1], where vegetation dynamics are significantly affected by climate change, particularly in the arid zone. Therefore, the investigation and examination of dynamic vegetation changes and the major drivers for such changes has an important significance in the understanding of the response mechanism and managing regional ecosystems [2,3].
The use of the normalized difference vegetation index (NDVI) enables the effective monitoring of vegetation activity and natural environments at multiple scales [4,5], as well as aiding investigations relating to climate change influences on the growth of vegetation and the structure and functions of the ecosystem [6,7,8,9,10]. Previous studies have shown that the climate warming was not occurred only at the global scale, but also in regional scale. Specifically to the arid zone, the implications of environmental changes on regional vegetation is complex due to the spatiotemporal variations in such changes and eco-environmental circumstances [11,12,13].
Temperature and precipitation were primarily used as indicators in previous studies focusing on the relationship between vegetation and climate change. With the further study of climate change, the “time-lag” effect is a common method of studying climate change, due to the cumulative effect of plants on climate change, in addition to the influence of climate conditions at that time on vegetation change, the climate conditions in the previous period also have an impact on vegetation growth [14,15]. Some researches tried to use the drought index to analyze the impact of drought on the vegetation dynamics. For example, Liu et al. [16] showed that the correlation between annual average values of the NDVI and the standardized precipitation evapotranspiration index (SPEI) in Yunnan Province of China was very weak, while the annual maximum value of the NDVI was positively correlated with the SPEI. Li et al. [17] found a positive correlation of the NDVI and SPEI from 2001 to 2015 in China’s Hutuo River basin. The SPEI taken at multiple time scales from the monthly averages of temperature and precipitation clearly reflect the regional dry-wet evolution and the availability of water resources. Furthermore, the SPEI serves as an indicator of drought by taking into account the multi-scale characteristics of the standardized precipitation index (SPI) and the implications of evaporation on the Palmer drought severity index(PDSI), enabling a better evaluation of the recent drought crises due to global warming, particularly those in semi-arid and arid areas [18,19].
In drylands, the loss of any precipitation-induced moisture at the ground surface is largely caused by evaporation. The infertile nature of soils of arid and semi-arid areas and the long-term sparsity of vegetation cover result in their fragility and sensitivity to environmental changes. The northern region of Xinjiang (NXC) is situated within the center of Eurasia at a considerable distance from surrounding seas, with landscapes characteristic of arid Eurasian areas. At the present time, the understanding of vegetation dynamics in NXC is still inadequate in several respects, despite efforts made to evaluate the impacts of environmental changes on vegetation dynamics in NXC [20,21]. Additionally, reports have revealed an overall rise in vegetation cover in Xinjiang and evident geographical differences, while differing climate characteristics have led to a varied response from vegetation vertical bands [22,23,24,25]. This growth in vegetation cover is attributed to the enhancement of precipitation and subsequent evaporation in certain ecoregions of Xinjiang [22,26,27]. Liu et al. [20] found an increase in vegetation dynamics in Xinjiang between 2001–2012, during which the NDVI mainly exhibited a decreasing spatial trend. Most existing studies focused on the pattern of spatio-temporal variation of the NDVI in Xinjiang and its relationship with climate factors of temperature and precipitation, which cannot comprehensively reflect climate change. Furthermore, research on the time-delay characteristics of vegetation cover and meteorological factors at different spatial scales in Xinjiang is not clear, and the scale of studies correlating the NDVI and individual climate variables is singular and incomplete, resulting in a lack of information available to evaluate the interactions between the climate and vegetation. The objectives of this study were (1) to investigate the frequency and intensity of drought using SPEI in the NXC, and (2) to analyze the spatiotemporal characteristics of vegetation characterized by NDVI, and (3) to explore the correlation between SPEI and NDVI with different time lags. It is expected that the findings will promote regional ecological protection and maintain ecological construction achievements under the local climate change.

2. Materials and Methods
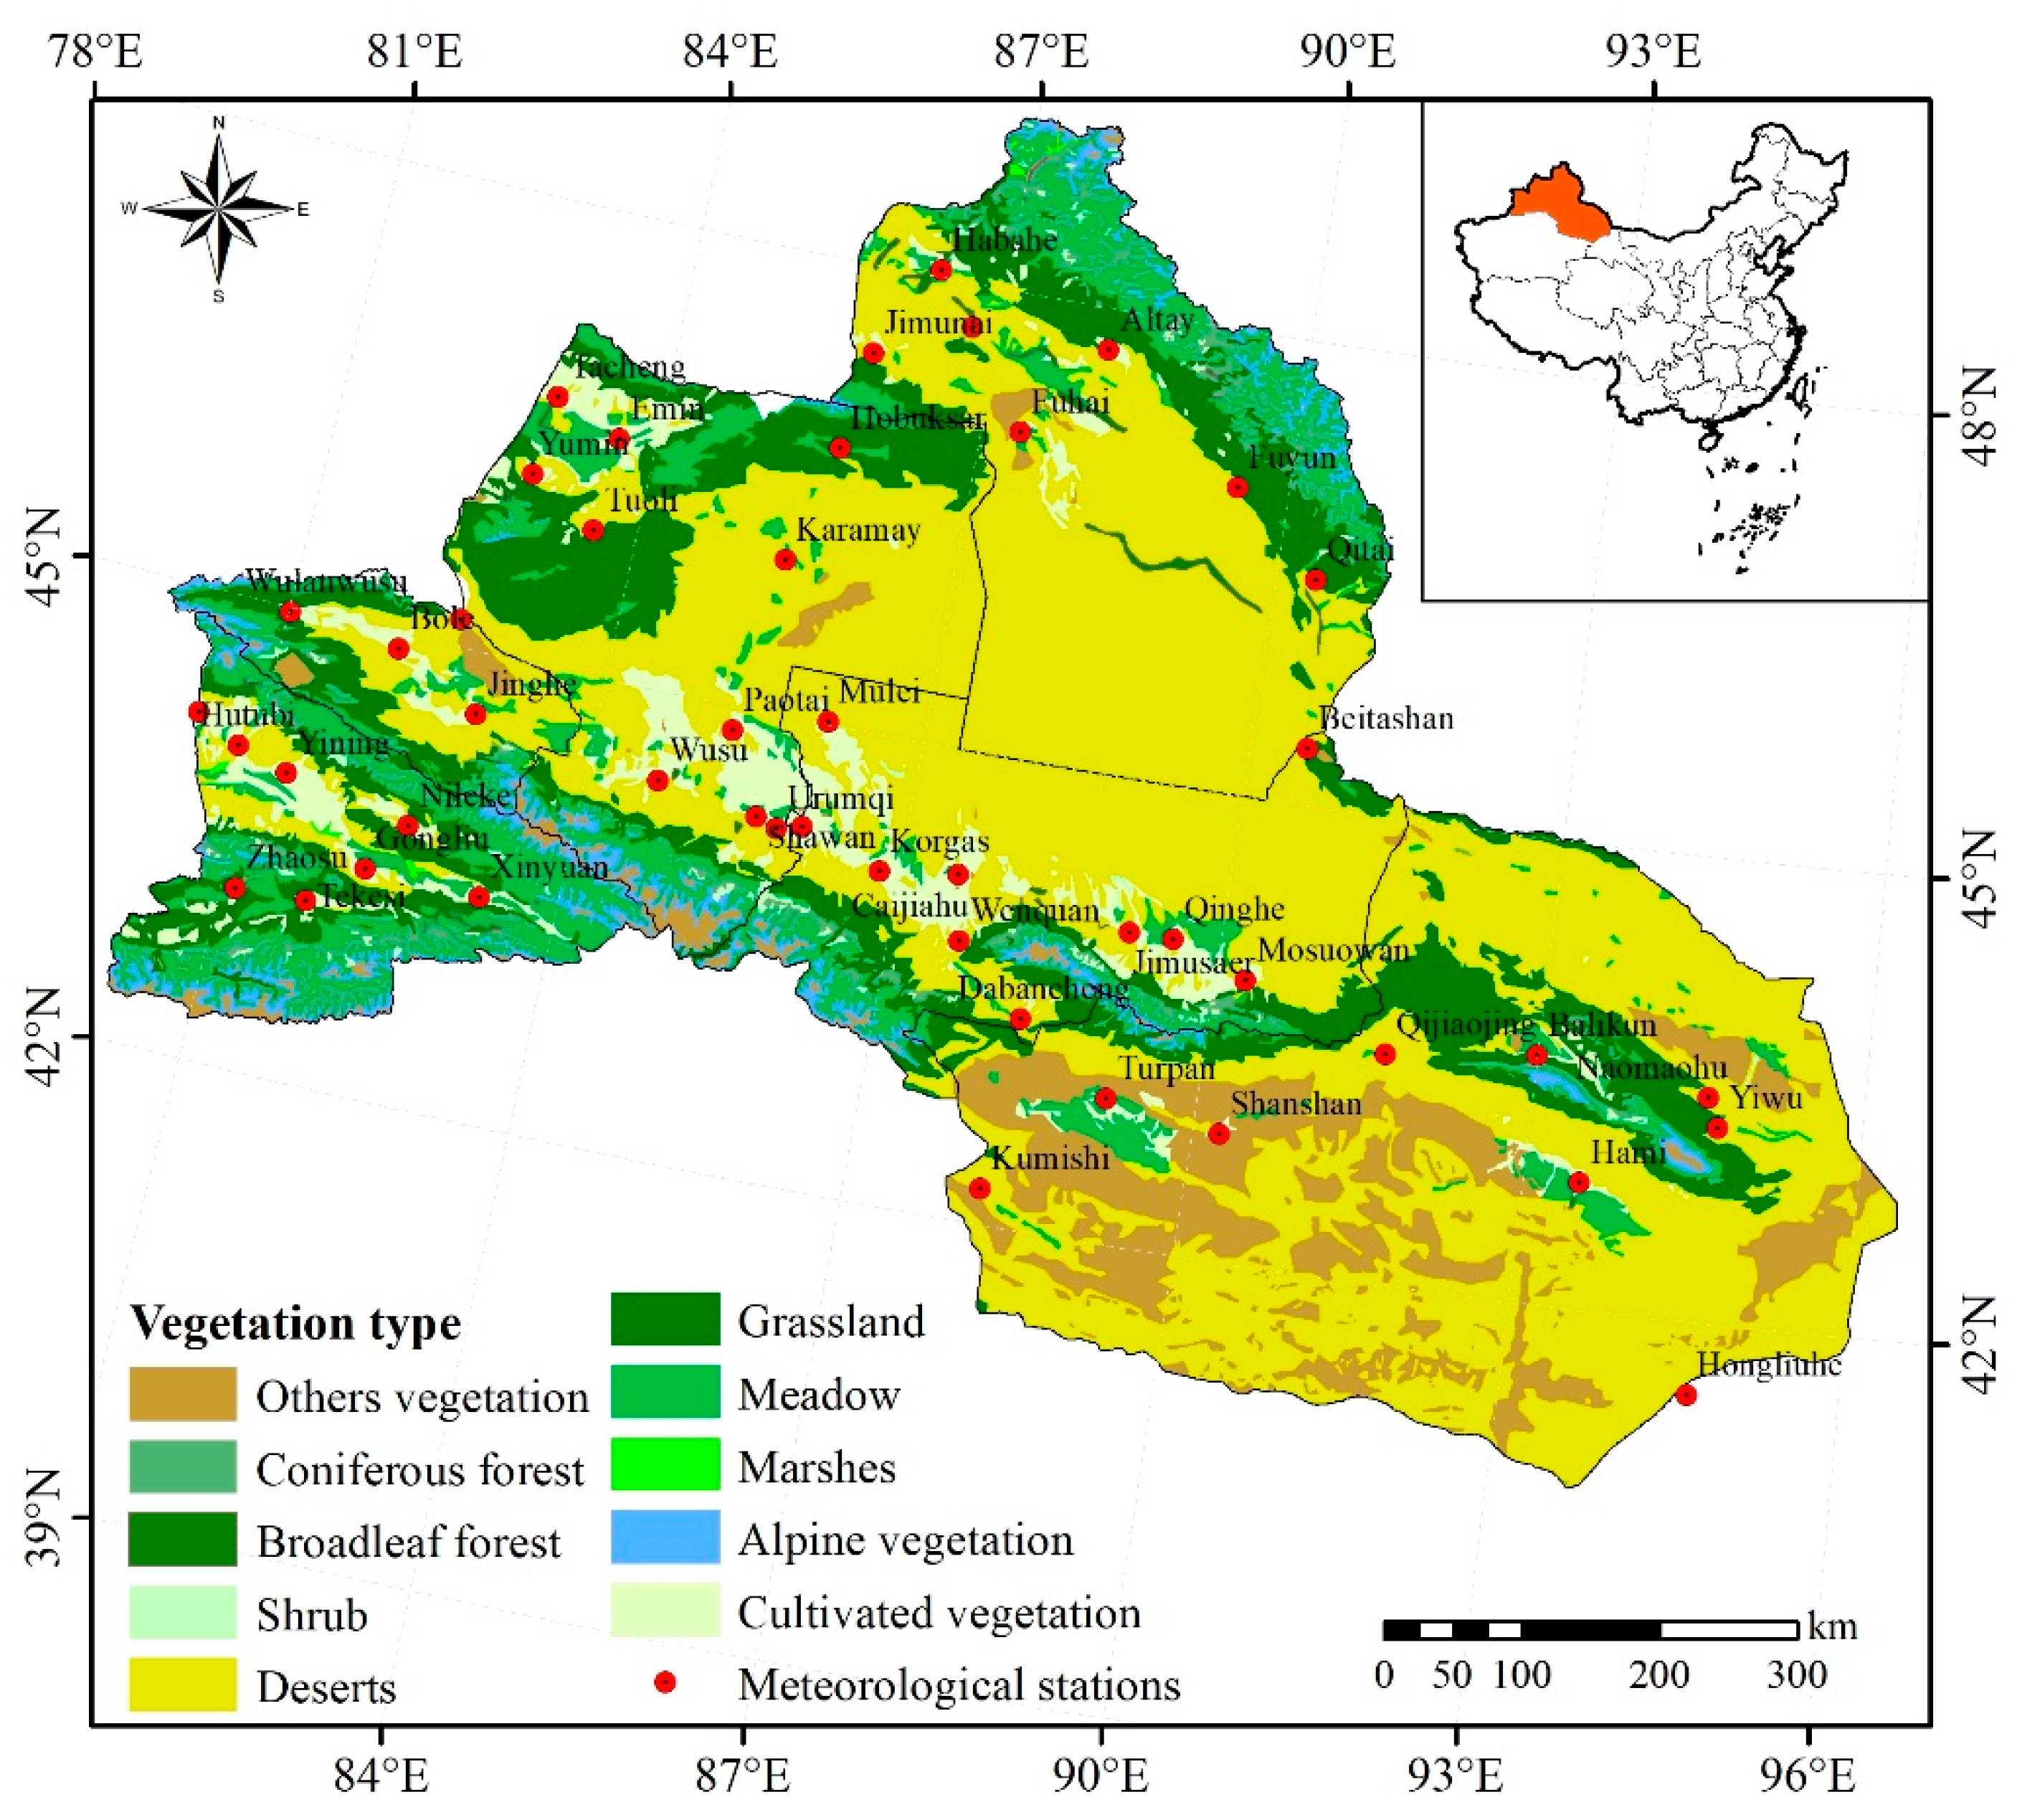
2.1. Study Area

The NXC covers an area of 5.95 × 10⁵ km2 with a longitude if 75° to 95° E and a latitude of 35° to 50° N, encompassing the Junggar basin, Yili and Tacheng valleys, Hami region and the Turpan basin (Figure 1). This area of land has a climate characteristics of a central Asian desert with greater amounts of rain in the spring season. The NXC region receives between 150 to 250 mm of rain annually with copious amounts of sunlight and heat. The annual values of temperature accumulation above 10 °C and average evaporation are 3500 to 4500 °C and 1000–1600 mm, respectively. The land cover data shared from the Data Center for Resources and Environmental Sciences of the Chinese Academy of Sciences (http://www.resdc.cn). It has a spatial resolution of 300m and contains 22 land cover categories. The data were generated by visual interpretation using Landsat series images [28].
We used a vegetation map (vector data) with a scale of 1:1,000,000, which was created in 2001 as a part of the Atlas of China’s Vegetation. The vector data were converted into raster format at a 1/12 spatial resolution. The vegetation present across the NXC region can be classified into ten types, as indicated by Figure 1. It is evident that grassland and broadleaf forest cover the largest area, and cultivated vegetation are primarily present in areas of industrial and economic development. In areas with mountainous cover, inappropriate land usage and alterations in climate typically lead to the degradation of vegetation and soil [29].

2.2. Sources of Data and Subsequent Processing

2.2.1. Remote Sensing

The Global Inventory Monitoring and Modelling Systems (GIMMS 3g) NDVI dataset was obtained from (https://ecocast.arc.nasa.gov) as the remote sensing data of this investigation. The data were processed to reduce cloud cover, atmospheric and solar altitude angle impacts through the maximum value composite procedure [30]. The annual value of NDVI was obtained by the monthly average values of each year.

2.2.2. Meteorological Data

Data of temperature and precipitation recorded at 48 meteorological stations in the NXC region shown in Figure 1 was accessed through the China Meteorological Data Sharing Service System (http://cdc.cma.gov.cn/index.jsp). The SPI was numerically evaluated using data of monthly precipitation, and the SPEI dataset, which can be openly accessed from the Spanish National Research Council (CSIC) (http://digital.csic.es), was calculated using the average values of monthly temperature and precipitation of.

2.2.3. Drought Metric

The drought in NXC was examined using SPEI, allowing for a greater understanding of its commencement, timespan, severity and scope of impact. The data obtained from (http://digital.csic.es/handle/10261/153475). Further details of SPEI calculation are described in the Appendix A.

2.3. Statistical Analyses

2.3.1. Trend Analysis

The identification of critical trends of climatological changes over a period of time can be performed through parametric and non-parametric techniques. For both methods of trend detection, the data must be independent and additionally exhibit a normal distribution for parametric trend testing. This investigation utilized the non-parametric methods of Mann-Kendall (M-K) and Sen’s slope estimator to analyze the trends of meteorological variables [31].
(1) Sen’s slope estimator
The Sen’s slope estimation and Mann-Kendall trend test are combined to identify the trend in the long time series vegetation cover [32]. Sen’s slope estimation method was used to calculate the slope equation of the sequence. Slope is the average rate of change of the sequence and the trend of the time series, The Sen’s slope estimation is a robust nonparametric statistics method and the calculation formula is
β = M e d i a n ( N D V I i N D V I j i j ) , i j
where 1 < i < j < n. β is utilized to quantify the monotonic trend. The equation represents the median of the combined slope of the data (the data number is n (n − 1)/2). When β > 0, it reflects that the vegetation cover in this time series shows an increasing trend; otherwise, a decreasing trend occurs.
(2) Mann–Kendall trend test
The Mann–Kendall analysis was first developed by Mann and Kendall. It is a non-parametric, rank-based method for evaluating trends in time-series data [33]. Compared to other analysis methods, the use of nonparametric techniques is known to be more resilient to outliers. After a series of improvements, the current calculation process in this study was perfected. To perform this test, you first construct a rank sequence (Sk) for time series:
S k = i = 1 k r i ( k = 2 , 3 , , n )
where k is the dataset record length, here is the year. In addition, ri is
r i = { 1 x i x k 0 x i x j } ( j = 1 , 2 , , i )
Under the assumption of random and independent time series, the statistic Z is defined as
Z k = ( S k E ( S k ) ) V a r ( S K )   ( K = 1 , 2 , , n )
Moreover, Z1 = 0, E(Sk) and Var (Sk) are the mathematical expectation and variance, respectively:
E ( S k ) = n ( n 1 ) 4
V a r ( S k ) = n ( n 1 ) ( 2 n + 5 ) 72
The value of Zk is positive, thus averages an increasing trend, and vice versa. Compared Zk with Zα (α is the significance level, α = 0.05 for this study), the result of |Zk| > Zα (Z0.05 = 1.96) represents that the series has a significant trend during this period. All Zk will form a UF curve. The reliability test can be used to determine whether there is an obvious change trend. Applying the same method to the inverse sequence, to another curve UB. UF > 0, the table sequence shows an upward trend, and UF < 0 shows a downward trend. If the two curves of UF and UB intersect at the critical point, the moment corresponding to the intersection point is the time when the abrupt transition begins [34,35,36].
This trend analysis and significance testing is also applied to the meteorology data, which can be implemented by Raster calculator in ArcGIS and writing a piece of code in MATLAB

2.3.2. Frequency of Drought

The frequency of drought occurrence was examined through the ratio (Pi), defined in Equation (7) [37]:
Pi = (n/N) × 100%
where n represents the number of the years over which a region experiences a drought with SPEI ≤ −0.50, N is the number of years between 1960 to 2015, and i represents the identifier for each region.
The SPEI dataset was obtained from the differences between precipitation and potential evapotranspiration which are standardized by the long-term climatic balance [38]. Thus, the SPEI can provide an effective indication of drought severity under precipitation and temperature effects. The evaluation of SPEI spans over a course of 1 to 48 months, reflecting the cumulative water availability over the specific time period. As such, the severity of droughts can be assessed through the SPEI [39,40], and further details are available in Appendix A. This study utilized a 12-month SPEI (SPEI12) to assess droughts from 1960 to 2015, which has been shown to accurately reflect the behaviors of soil moisture variations over the short-term. According to the standards proposed by the Chinese Academy of Meteorological Sciences in 2006 [41], the categorization of the SPEI meteorological drought index can be seen in Table 1.

2.3.3. Linear Regression Analysis

The least squares method was applied to the slope (or gradient) of the trendline to dynamically analyze the changes in vegetation of each pixel and expressed in Equation (8). This method allows for a representation of the spatiotemporal changes of vegetation coverage to be obtained [42]:
θ s l o p e = n × i = 1 n i × C i ( i = 2 n i ) ( i = 1 n C i ) n × i = 1 n i 2 ( i = 1 n i ) 2
where θ s l o p e is the slope of the trend line, n represents the duration of study (n = 18), and Ci represents the NDVI of the ith year.

2.3.4. Correlation Analysis

Each pixel was analyzed spatially to obtain the coefficient of correlation R between the NDVI and SPEI:
R = i = 1 n [ ( x i x ¯ ) ( y i y ¯ ) ] i = 1 n ( x i x ¯ ) 2 i = 1 n ( y i y ¯ ) 2
where xi and yi represent the respective values of SPEI and NDVI for the ith year, while x ¯ and y ¯ are average SPEI and NDVI values over many years.
The points of trend variations of the SPEI and NDVI over time were identified through the least squares method, after which the behaviors of the two indices were evaluated at each phase between points of variation. The correlation coefficient (R) between the average NDVI, rainfall and temperature per year versus the NDVI value of the same year were evaluated to understand the impacts of inter-annual climatic variables on vegetation dynamics.

3. Results

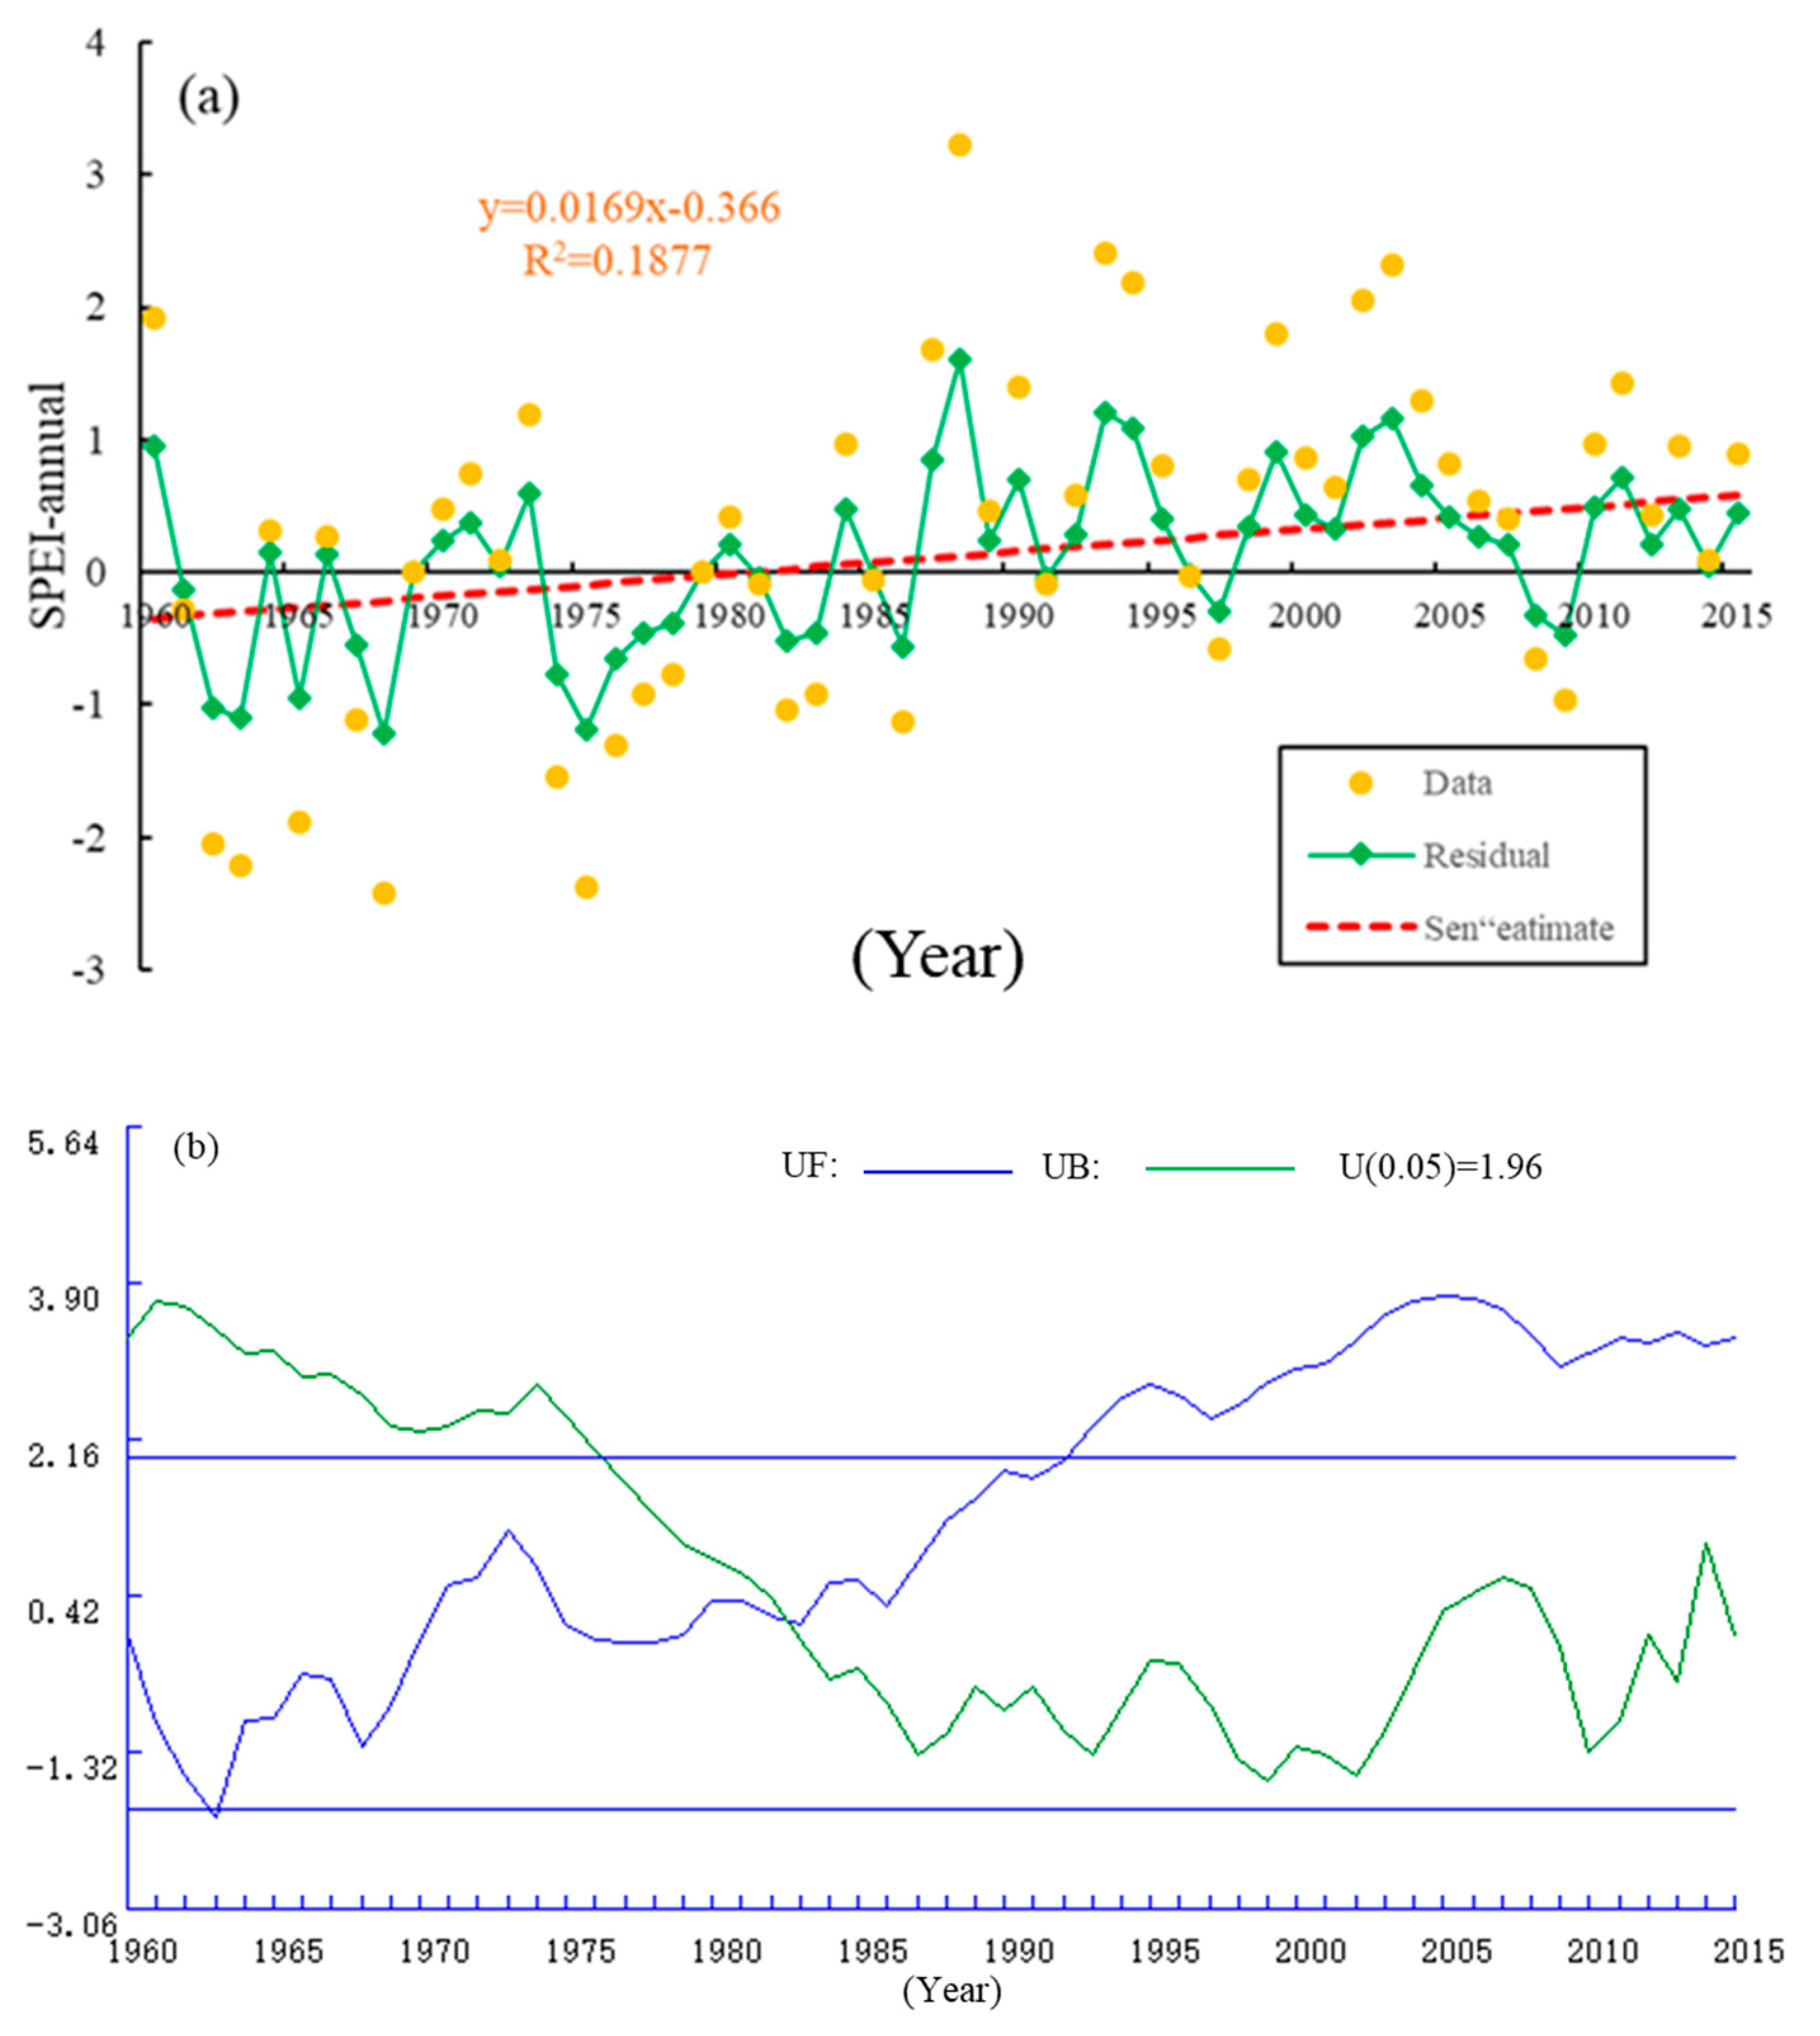
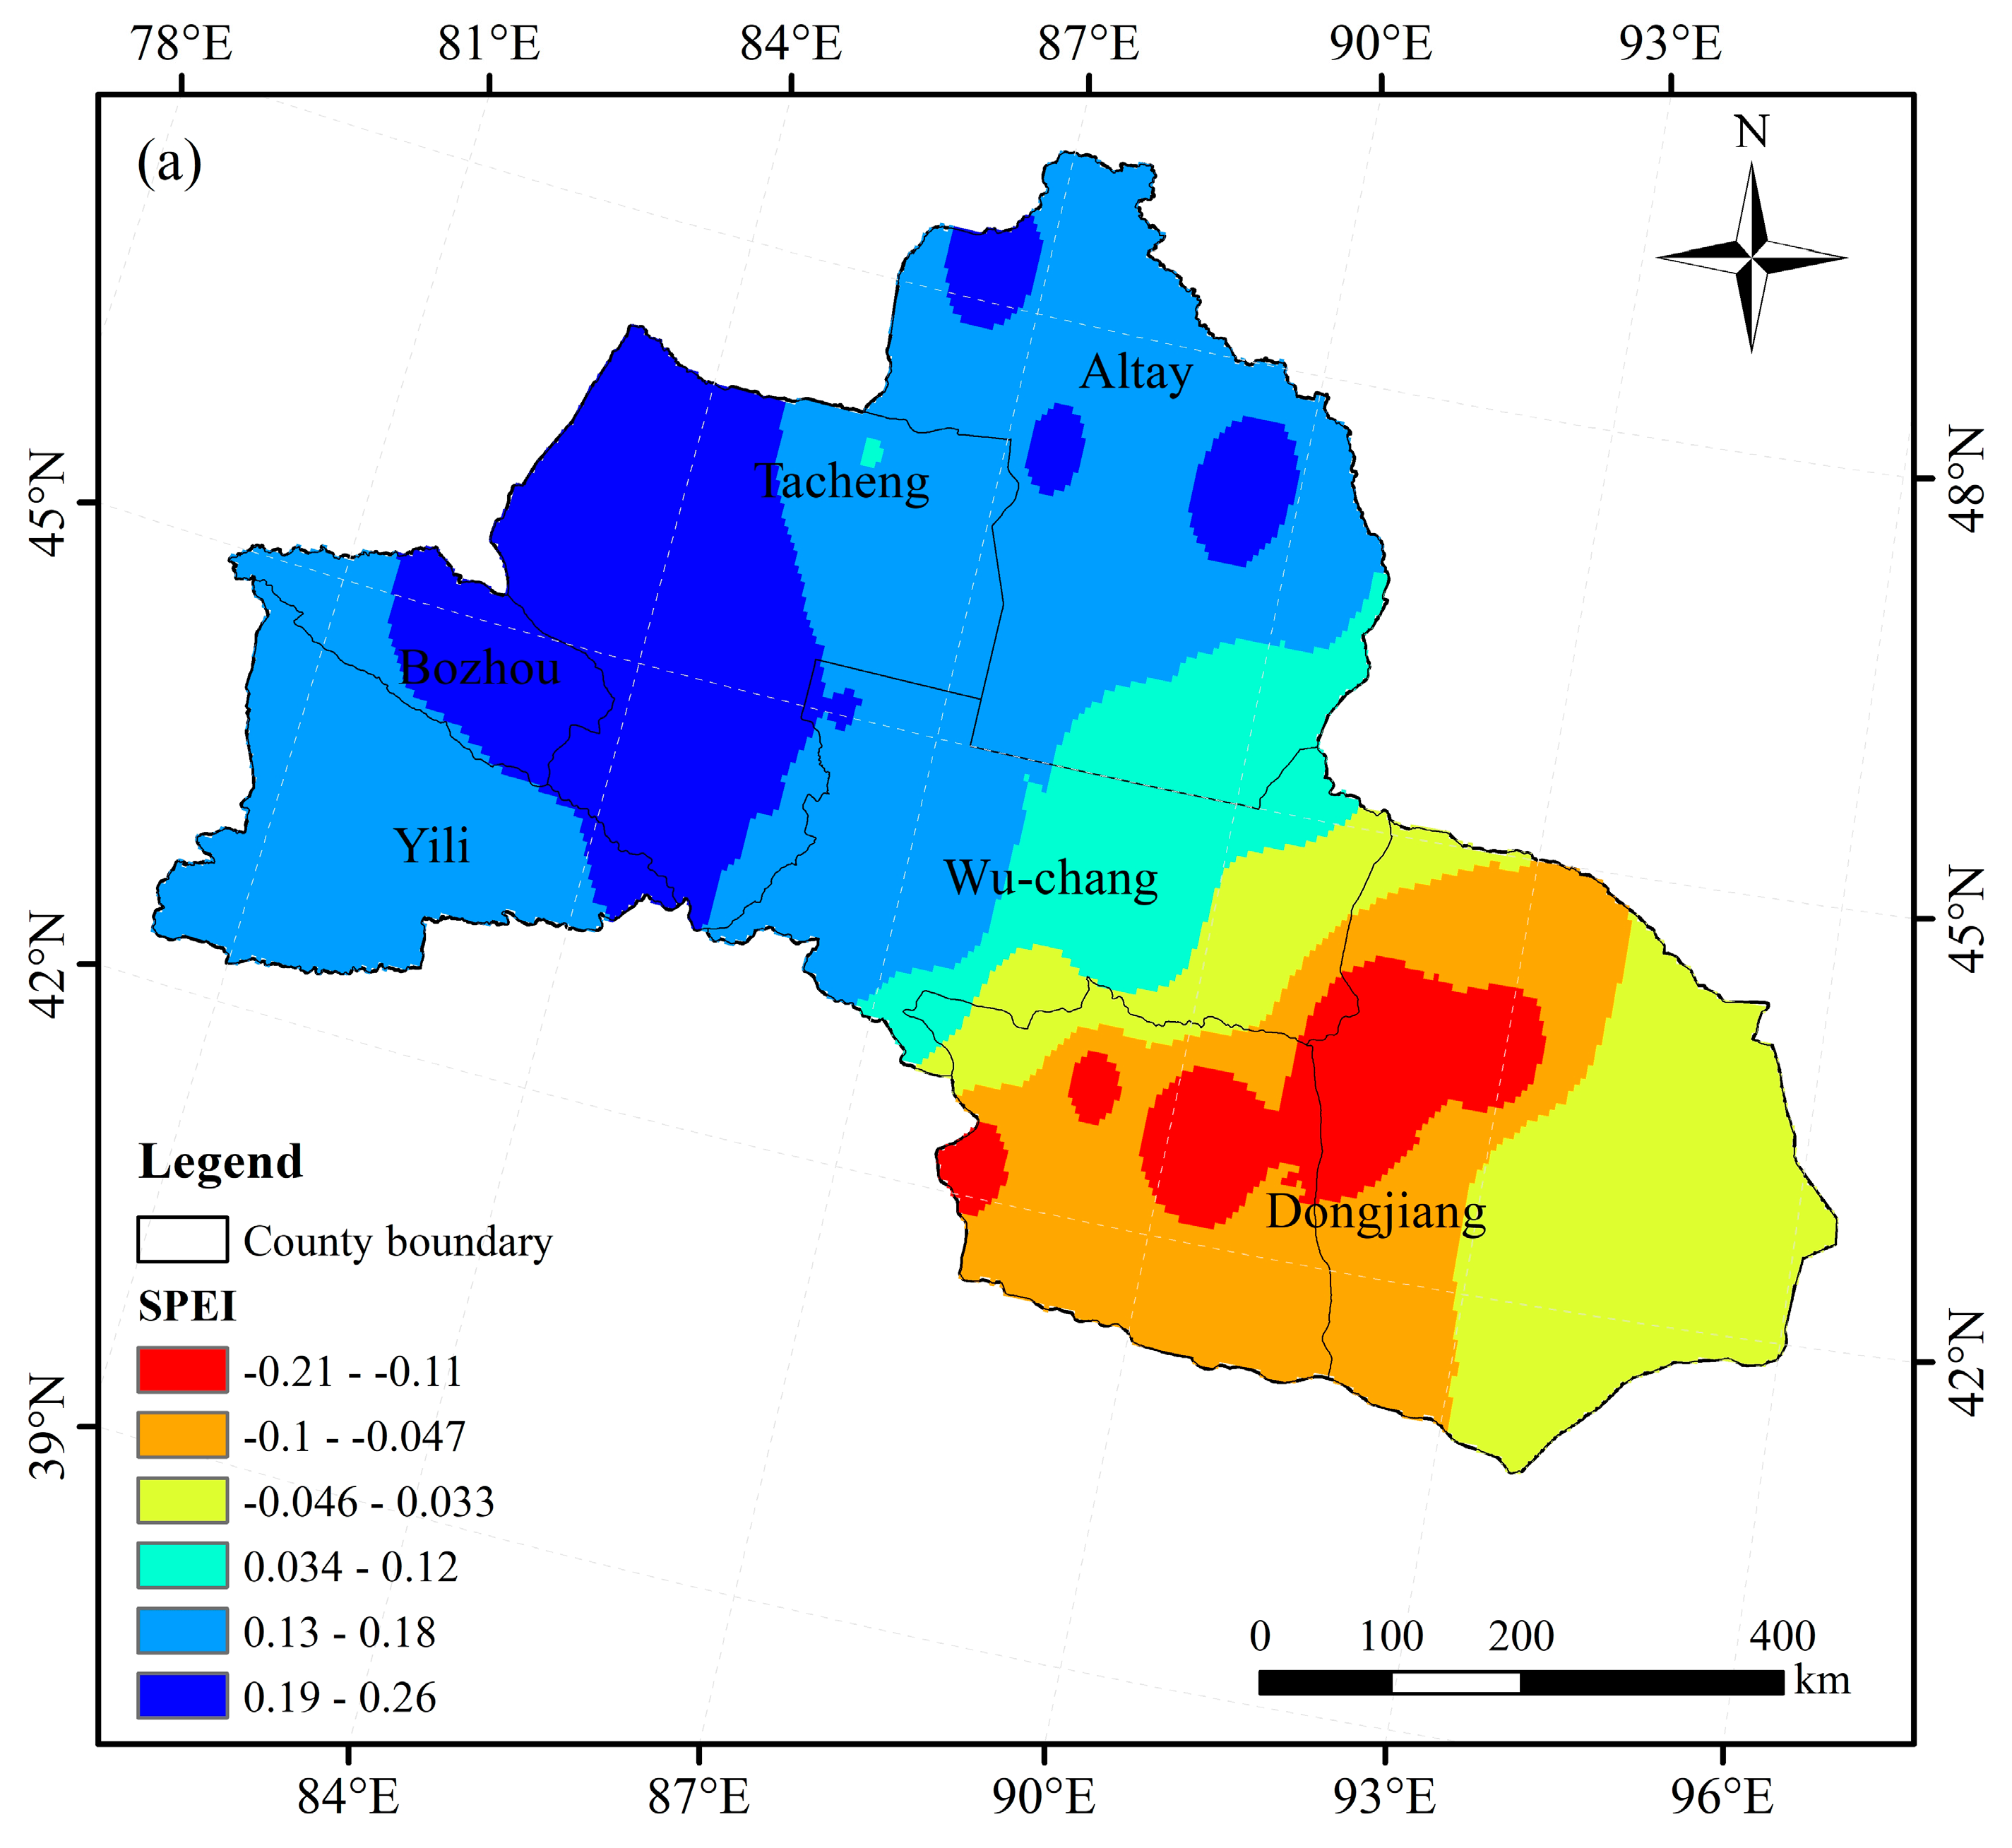
3.1. The Spatial and Temporal Distributions of Drought

Annual average SPEI from 1960 to 2015 is shown in Figure 2. Applying Sen’s slope estimation, the annual SPEIs increased at a linear rate of 0.017yr−1 (p < 0.01), and shows a significance level of α = 0.05 based on the M–K test (Figure 2b).The lower the SPEI was, the heavier the drought occurrence was; that is, an increasing trend of SPEI indicates that drought occurrence has been decreasing. With reference to the drought classifications of Table 1, the inter-annual variation of the SPEI indicates a total of 16 droughts from 1960 to 2015 in the NXC region, at a frequency of 28.57% (Figure 2a). The data also show light occurrences of drought in 1964, 1966, 1973, 1975, 1981 and 1985, and moderate droughts in 1961, 1962, 1967 and 1974. Furthermore, it can be seen from the UF curve that the average SPEI in NXC shows an increasing trend and exceeds the critical line at 0.05 significance level. In the critical line of 0.05 of the significant level, the UF and UB curves intersect in 1982, which is the beginning of the NXC annual average SPEI mutation and exceeded the 0.05 significant level in 1993.
The changes of the SPEI spatial pattern in the NXC region from 1960–2015 is presented in Figure 3, showing a gradual increase in spatial distribution of drought intensity from northwest to southeast, with the drought intensity strongest in the eastern regions (Dongjaing), including Turpan and Hami. Overall, large differences in drought frequency exist, with greater dryness observed in about 16.7% of the investigated area. The areas of the western and northern regions of Altay, Tacheng, Yili, Wu-chang area, and the Bozhou regions experienced increasingly wet climates. The regions which experienced drier conditions were basins at low elevations with barely utilized land. The areas are described as wasteland, saline–alkaline land, or sandy land, which encompass the Turpan and Hami basins (SPEI tendency rate value was from −0.21 to 0.26). Although regions which retain water more effectively exhibit greater wetness, other areas are likely to lose moisture, causing further imbalances in water resources between arid and semi-arid land.

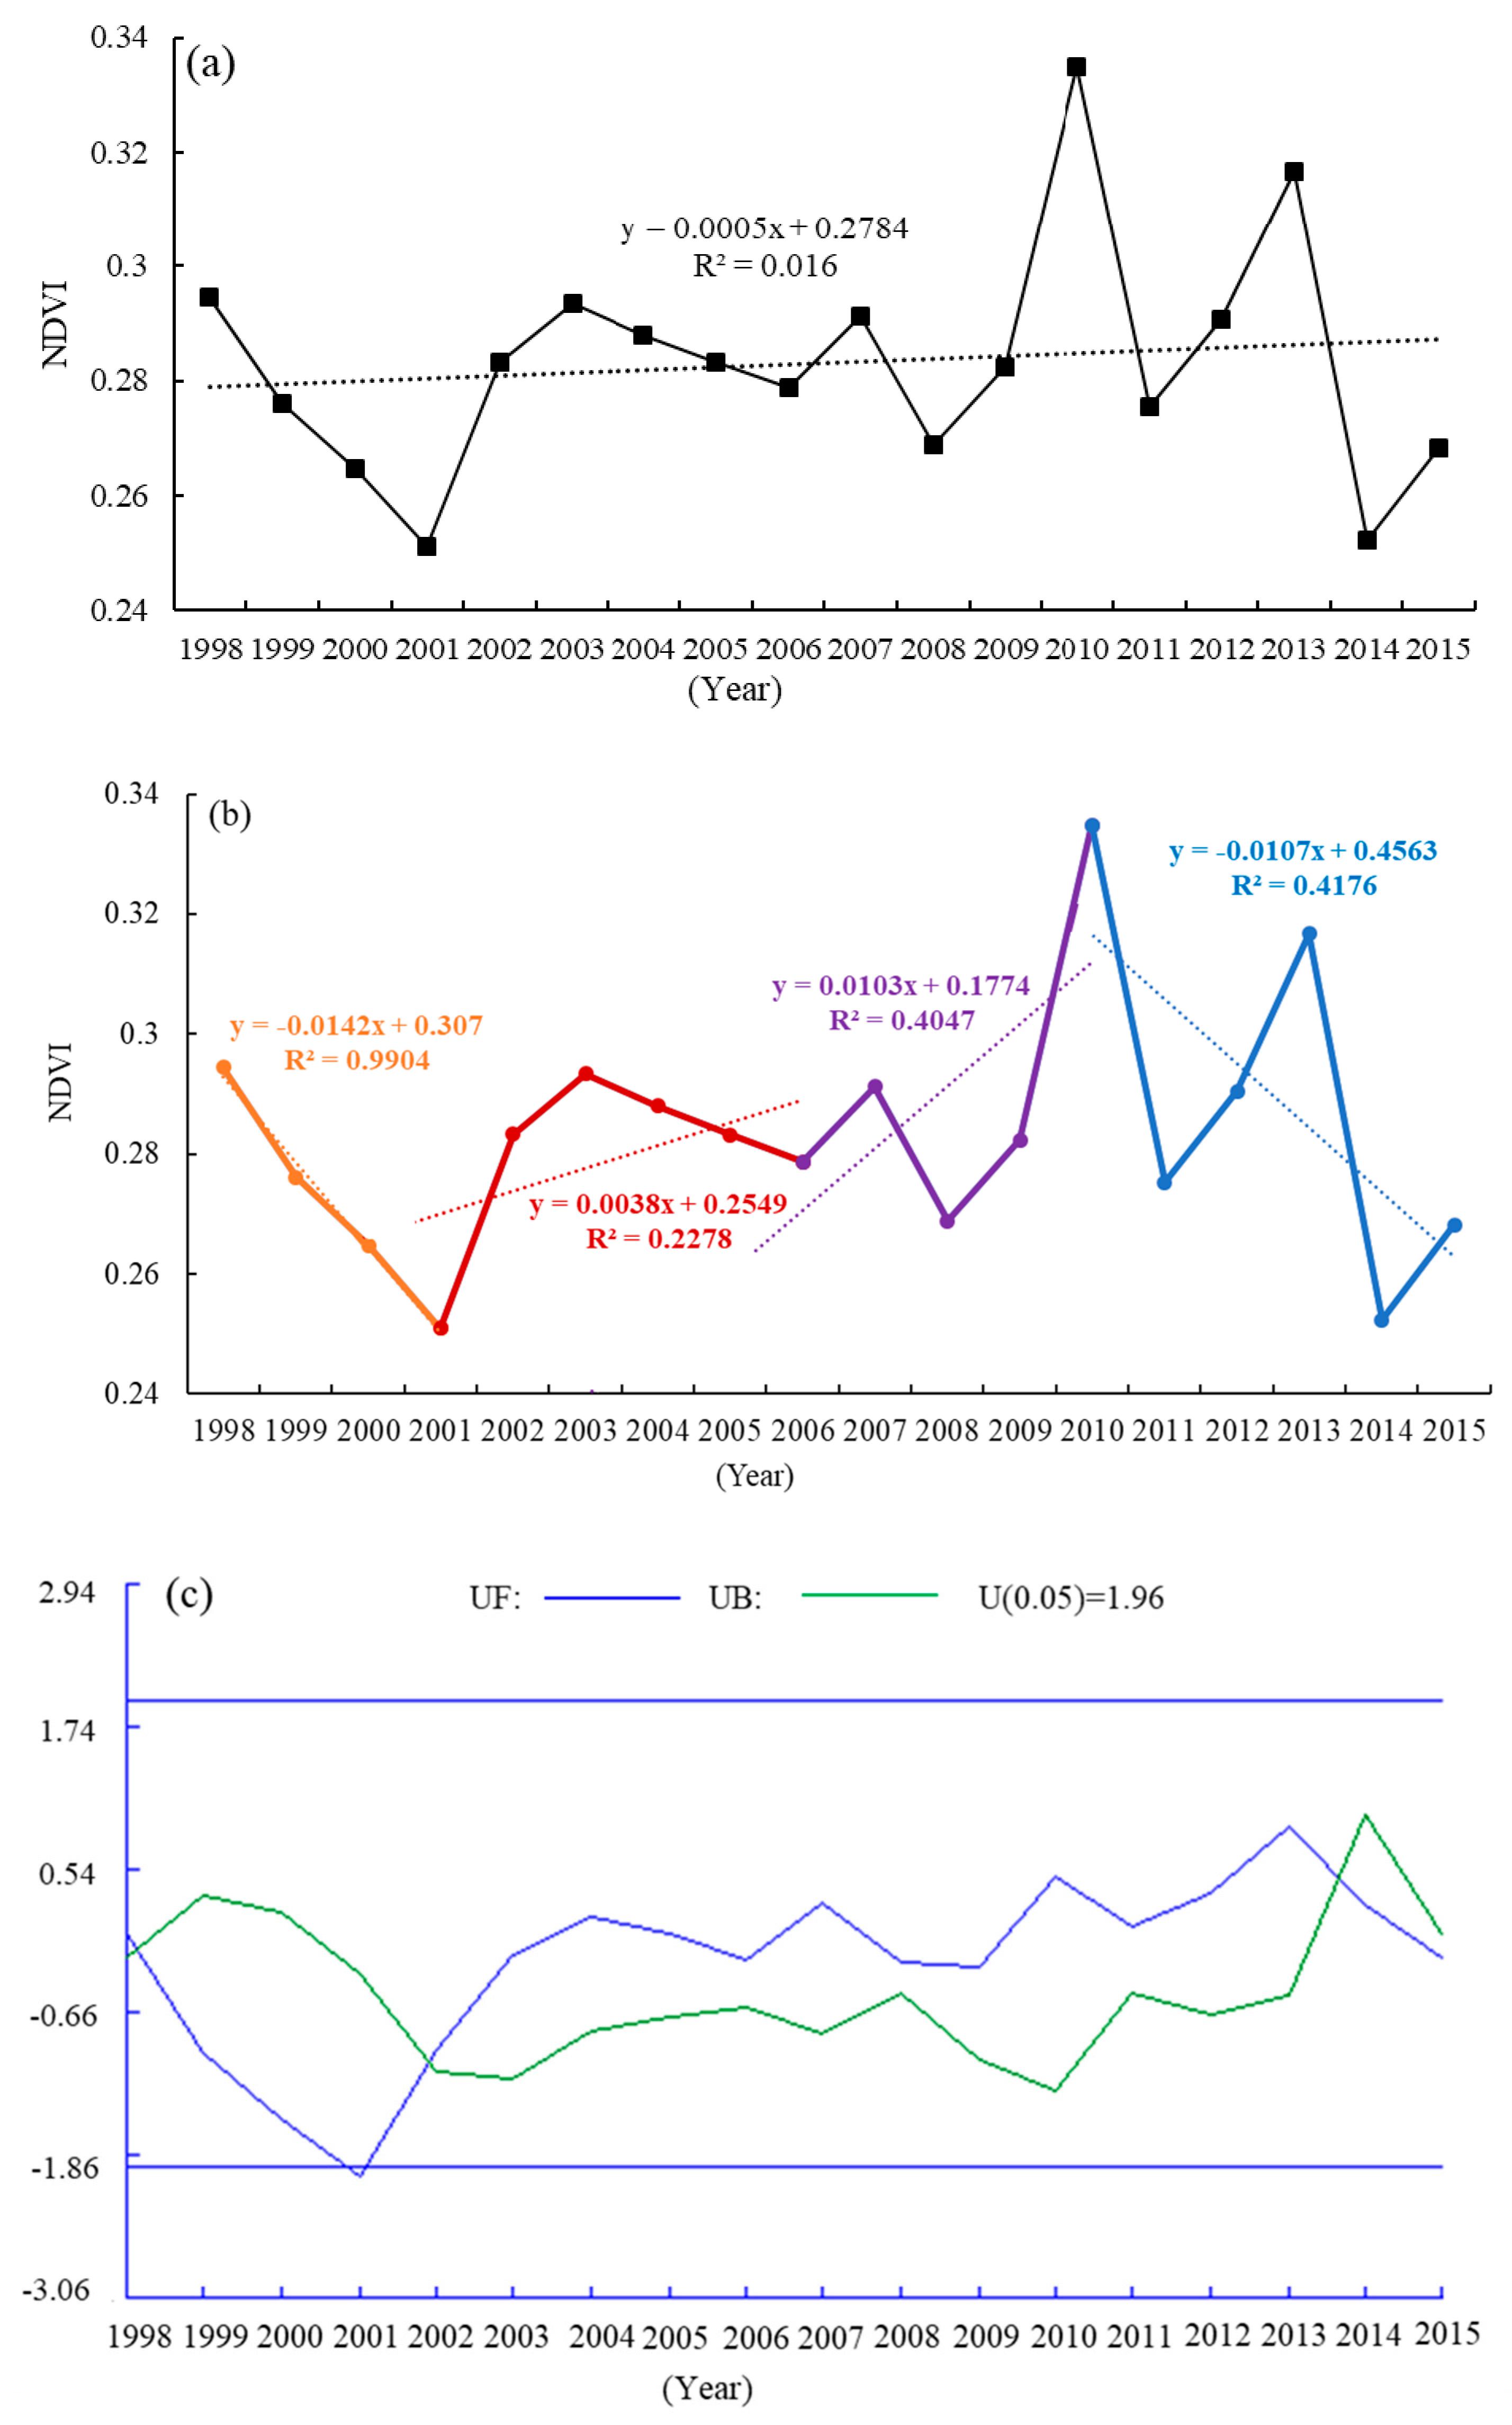
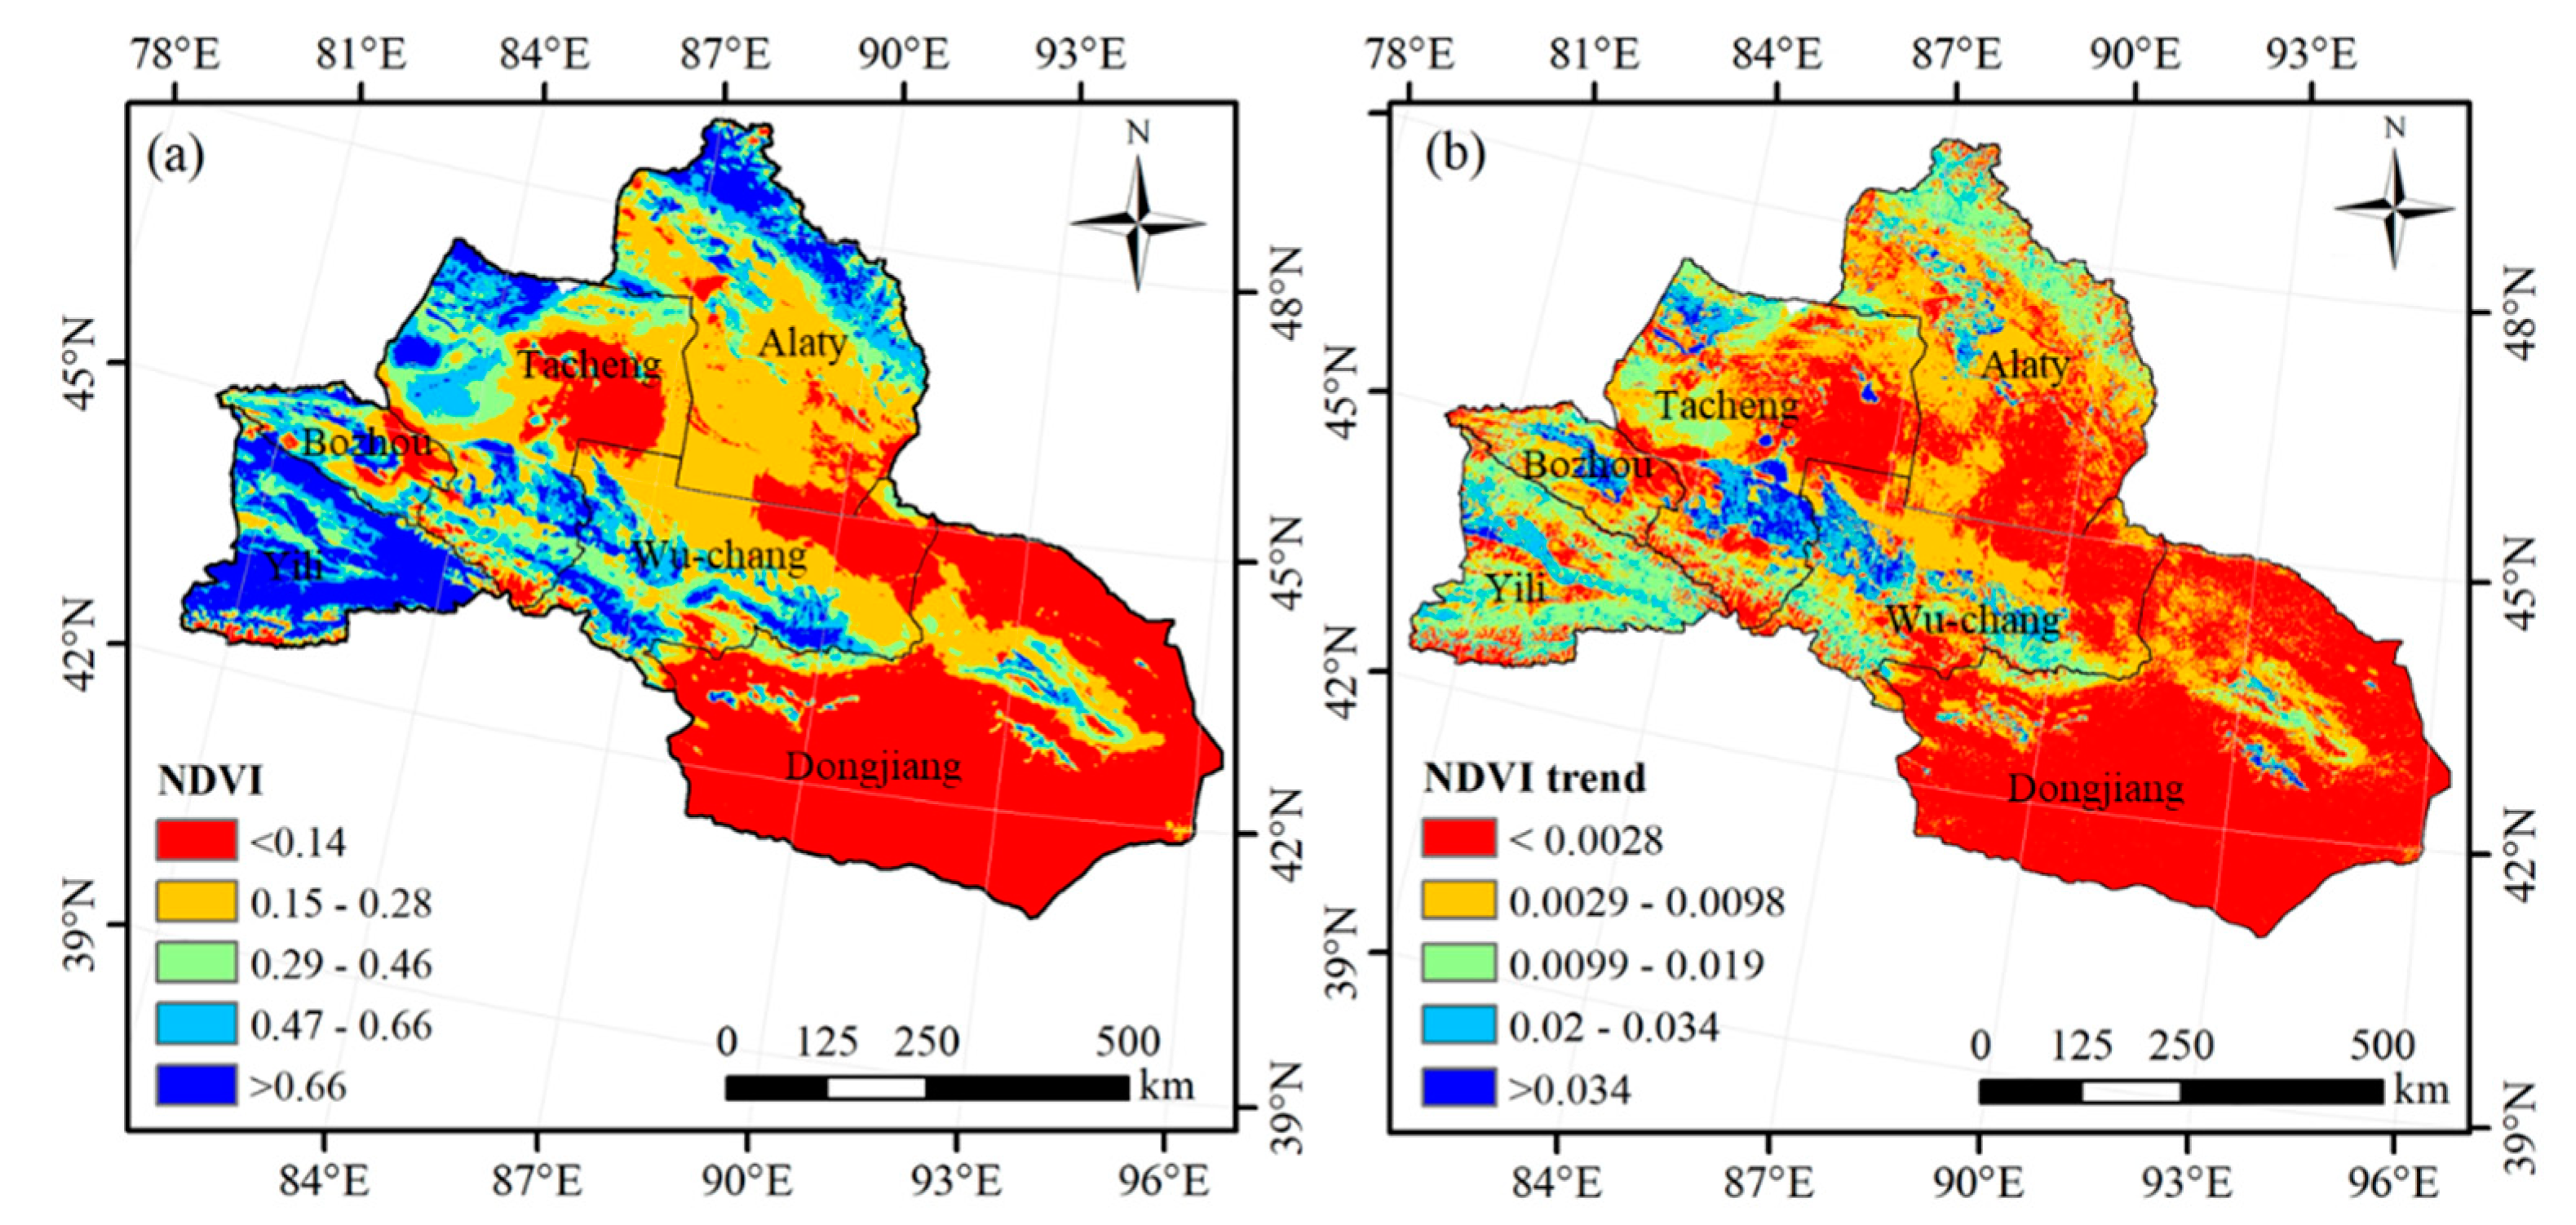
3.2. The Spatial and Temporal Distributions of vegetations

The interannual variations in NDVI for the NXC are shown in Figure 4. It is indicated that NDVI significantly increased at the rate of 0.0015/year (r = 0.64, p = 0.0001) from 1998 to 2015. In addition, the maximum appears in the year 2010 (Figure 4a).The findings of point analysis suggest the occurrence of trend variations in 2001, 2006 and 2010 (Figure 4b) with a decreasing average NDVI value from 1988 to 2001 (r = 0.98, p = 0.001), demonstrating a degradation in vegetation during this time. Conversely, an increase in the average NDVI by 0.01 from 2001 to 2006 (r = 0.98, p = 1.29) was observed, while further increases from 2006 to 2010 (r =0.99, p = 0.0001) and 2010 to 2015 (r = 0.99, p = 2.24), signal growing improvements in vegetation of this area. The results reveal an average yearly NDVI of 0.28, rising at 0.001/year (r = 0.94, p = 3.64) from 1998 to 2015 (Figure 5b), with a maximum observed in the year 2010. Although deviations in NDVI were largely negative prior to 2002, positive anomalies can be observed from 2002 onwards. Moreover, the M-K test (Figure 4c). Moreover, from the Mann-Kendall test (Figure 4c). From the UF curve, it can be seen that the average NDVI index of NXC shows a decreasing—continuously increasing—decreasing trend from 1998 to 2015, However, neither exceed the 0.05 significant level. Within the significant level of 0.05, The UF and UB curves intersect in 2002, which is the beginning of the NDVI exponential mutation in NXC.
According to the GIMMS data, the maximum and minimum NDVI of the NXC region were 0.344 and 0.25, respectively, between 1960 and 2015. Figure 5a presents a spatial map of the average NDVI for all the regions of investigation the regional variations in the gradient of yearly NDVI from 1960 to 2015 is depicted in Figure 5b. Regional values were segregated into five categories depending on the difference between the highest and lowest NDVI values. The results of Figure 5 reveal evident variations in average NDVI throughout the region, ranging from 0.14 to 0.66 with greater values observed in the west and lower indices in the east. Areas with significant vegetation coverage such as the forestry and grassland of the Altay and Tianshan Mountains in Yili, Bozhou, and Tacheng, which make up most of the study area, generally exhibited an NDVI of over 0.66. The distribution of vegetation is consistent with the regional water balance apart from the Junggar and Turpan basins due to the elevated altitude and human impacts on the environment. Lower NDVI values were primarily found in the Dongjiang area and Gurbantunggut Desert, owing to the sparse vegetation cover and lack of land usage. The trend of NVDI variance over the region suggests an overall reduction from the west to the east. Furthermore, the index displays a rising tendency in most areas, particularly near the Ebinur Lake and central NXC (Shihezi, Urumqi), where the greatest rate of NDVI increase of over 0.034/year can be found (Figure 5b).

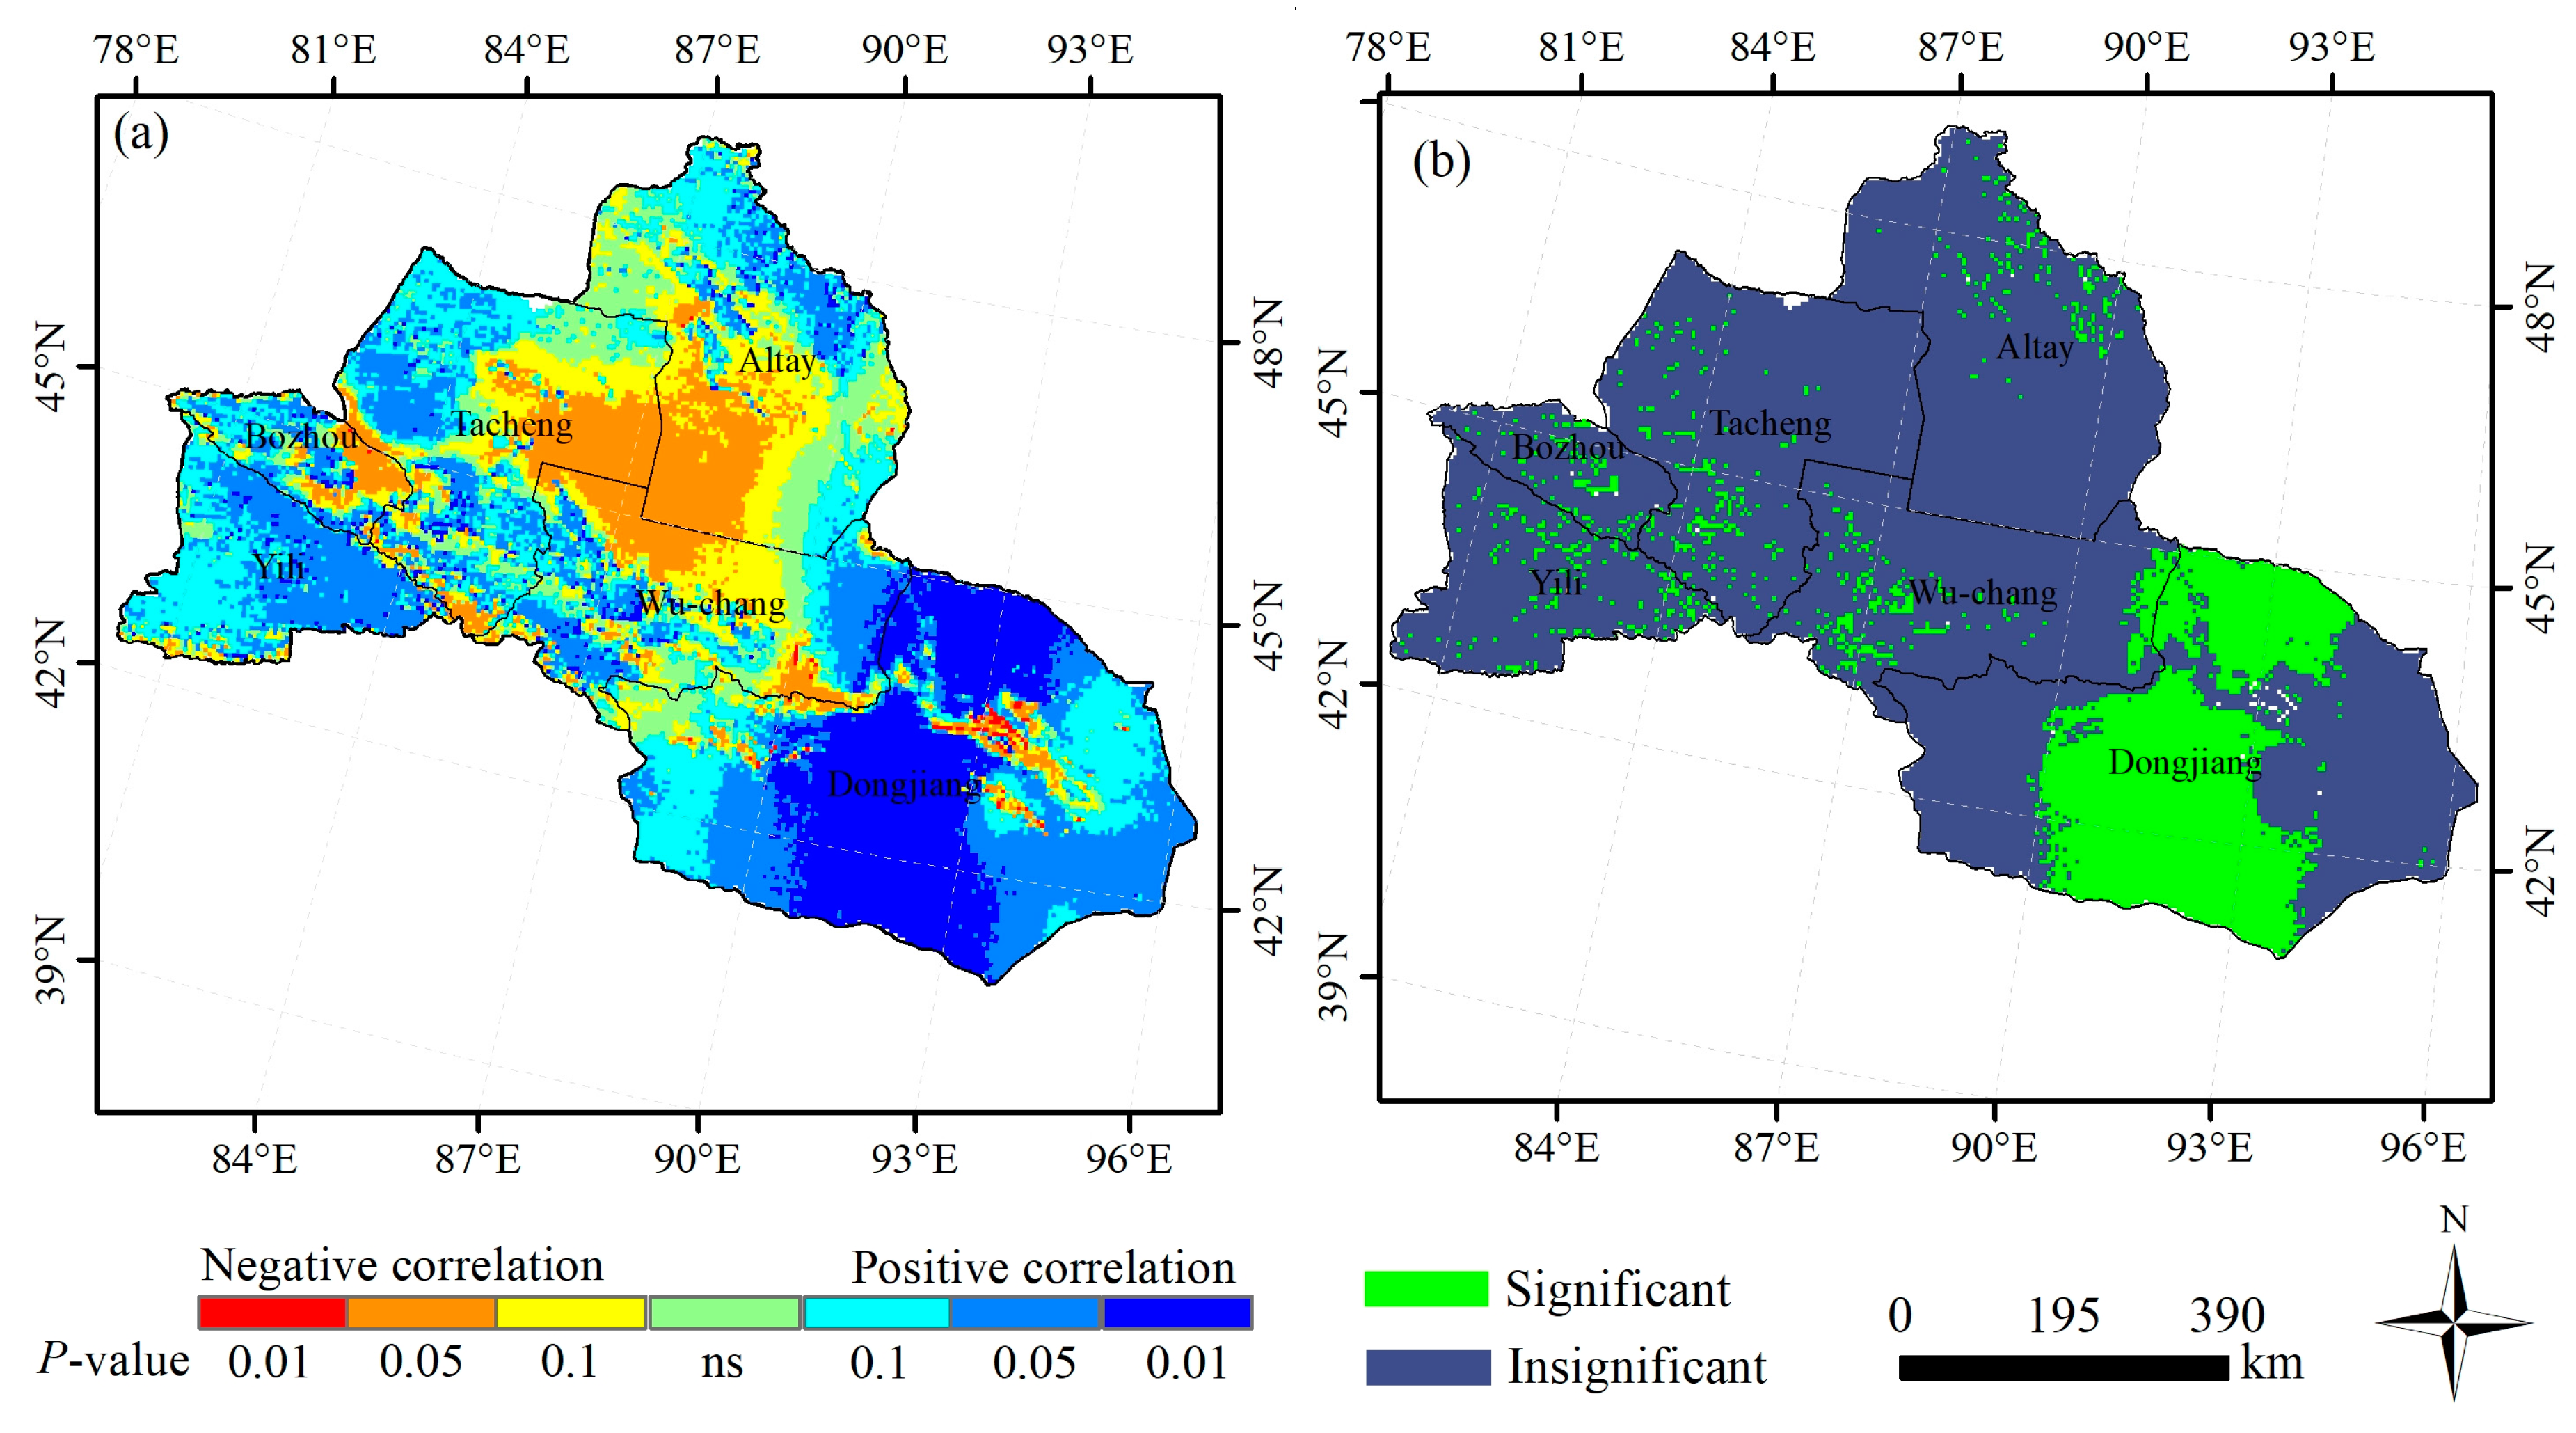
3.3. Climate Change Influences on Vegetation Dynamics

The average NDVI is seen to respond differently to variations in the inter-annual variability of precipitation and temperature, as presented in Table 2 and Figure 6. The NDVI was strongly and positively correlated with precipitation (reached the significance level of 0.05), but the relation is weak to temperature, implying that precipitation has a great influence on vegetation in the NXJ over the long term. The average NDVI correlates positively with the annual precipitation (0.541, p < 0.05) in most of the vegetated areas (Figure 6a,b), and the correlation coefficients display regional variations over the investigated area. This significant correlation of the NDVI and precipitation in the mountains and basins was markedly greater than in the desert areas of NXC. Specifically, it is observed in the southwestern (Yili, Bozhou, Tacheng) and northern regions of Altay and Turpan, and the Hami Basin. In contrast, the NDVI of the deserts were negatively correlated to precipitation, particularly in the Gurbantunggut Desert and the Gobi Desert.
Figure 6c,d illustrates the that the average NDVI was insignificantly and positively correlated to the inter-annual variability of temperature in the majority of vegetated areas (correlation coefficient of 0.127), while the Altay Mountains, Gurbantunggut Desert and Gobi Desert of eastern Xinjiang showed negative correlations. Furthermore, the correlation coefficients in the southwest regions (Yili, Bozou, Tacheng), Hami Basin and Tianshan Mountains were highly positive.
The annual average SPEI from 1998–2012 and the NDVI data from 1998–2015 at each station of NXC were used to analyze the correlation coefficient R between the two in different years and to explore the correlation and hysteresis between the two in the inter-annual change. Table 3 shows the correlation coefficient between annual average NDVI and annual average SPEI, including the correlation coefficient between the same years (1998–2015), in the lag of one year (1997–2014), in the lag of three years (1995–2012) and in the lag of five years (1993–2010). Greater positive values of SPEI suggest meteorological conditions of higher humidity, which favour vegetal development. NDVI with a lag of one year in the study area showed a negative correlation with SPEI, which may be related to the climatic zone, indicating that the change of drought degree affected the vegetation status in this area to a certain extent. Moreover, the SPEI and NDVI are positively correlated at temporal scales with a five-year lag (Table 3), and changes in vegetation indices such as the NDVI also exhibited a time lag to variations in SPEI. Obvious positive responses to the SPEI were found for the NDVI, demonstrating the clear influence of drought on the annual NDVI values and its high sensitivity to changes in the drought index.
The relationship between the SPEI and NDVI in NXC from 1998 to 2015 (Figure 7a) and its corresponding significance are depicted in Figure 7b. Most of the investigated area exhibits positively correlated SPEI and NDVI values at the 0.05 level. These findings demonstrate the dependence of vegetation growth on the availability of water. However, negative correlations were found in the smaller areas of the Junggar and Turpan basins, which can be attributed to severe drought conditions where the moisture level is incapable of supporting vegetation. The significance tests show that the relationships are insignificant except for those in the Dongjiang central region.

4. Discussion

Among the various types of natural disasters, droughts are considered to cause some of the greatest damage to the social economy, environment, and humans [43]. The results indicate an increase in the spatial extent of droughts throughout the NXC between 1960 and 1986, primarily due to reduced precipitation and increased evaporation, although droughts decreased in 1986 [44]. Since the 1990s, the frequency of droughts in NXC has dropped due to greater humidification, and the scope and incidents of drought have also reduced [45]. As discussed, the NXC is located in north-western China, and because of the dry conditions, the majority of land in the NXC is arid, while the south-western areas, including the Yili River basin, exhibits a more humid climate [46]. The findings of this investigation also reveal the occurrence of moderate drought four times since the 1960s. Droughts can lead to regional alterations in water balance, causing adverse effects on grassland productivity and in turn hindering sustainable animal farming, which is an important industry of the NXC region.
The SPEI of the NXC showed an increasing trend from 1961 to 2015, indicating an alleviation in drought frequency. Moreover, the results of the M–K mutation test show that the SPEI increased significantly after the mutations in 1990, and a mutation in the NDVI was observed in 2002. This phenomenon is due to the incoherence and lags of climate change. The spatial distribution results show that the place where the drought is occurring is consistent with the actual local research results [47,48]. Consequently, the SPEI is a useful indicator of climate change effects on the NDVI dynamics. Remote datasets were used in this analysis to compute changes in the NDVI, which showed a slight increasing trend (0.001/10a) for the NDVI in the NXC from 1998 to 2015, which is consistent with the results of previous studies [49,50]. For the correlations between vegetation and climate indices (e.g., SPEI), the results indicate that the correlation coefficients between the NDVI and climate factors presented characteristics of regional variation, revealing that certain climate extreme indices had stronger impacts on vegetation in the NXC. In addition to the regional deviations in climate, these observations are also a result of the complex and differing characteristics over the NXC. These findings are in accordance with those reported by Ci et al. [51,52], and may cause uncertainties in the impacting factors of vegetation. Furthermore, inappropriate land utilization as well as various ecological restoration schemes since the 1990s could have contributed to the differences in correlation slope distribution. The correlation between the NDVI and SPEI appears to be stronger in the southwest and northwest of NXC than in the central parts of the Junggar and Turpan basins.
Combined with climate change researches in NXC in recent years, the NXC is becoming warmer and wetter [48,53]. The NDVI was strongly and positively correlated with precipitation, but related weakly to temperature, implying that precipitation has a great influence on vegetation in the NXC over the long term. This is consistent with the research results of Wang et al. [52] who found that the SPEI showed a slight decline trend from 1982 to 2012, that is, weak dryness, in terms of spatial distribution, the trend of drought was mainly distributed in northeast China, loess plateau and southwest China, while the trend of wetting was obvious in northwest China, and rainfall dominated vegetation growth in north China, Especially in Xinjiang. The NDVI and SPEI were found to be negatively correlated in the central parts of the Junggar and Turpan basins, which can be linked to the severe droughts where moisture levels are incapable of supporting vegetation, or the cold climate of high-altitude mountainous basins. Recent explorations of the climate-vegetation interactions in north-western China back the conclusions of this study, which have demonstrated the dependence of vegetal development on the sufficiency of water in arid and semi-arid areas. Obvious correlations were primarily found in the northern regions of the area studied, while the north-western and western sectors mainly had a wet climate with greater vegetation cover, and the northeastern parts of Dongjiang showed evident dryness with little vegetation cover.
Due to global climate change, the vegetation ecosystems in Eurasia show a series of spatiotemporal variations that directly influence the ecological environment in the countries and regions of the Belt and Road Initiative (BRI). The task of simulating the spatial and temporal trends of these ecosystems from the perspective of global climate change has become a focus of environmental research in countries and regions involved in the BRI [54]. At the same time, in the context of global change, with the gradual promotion and implementation of the BRI, the analysis of the dynamic changes of vegetation ecosystems in Eurasia can provide scientific data and aid in various ecological and environmental studies and sustainable development planning.
The findings of this investigation are in agreement with the existing literature on the time-lag effects of vegetation responses to drought [55]. Liu et al [56] found that NDVI in Yunnan, China, and NDVI in SPEI has a lag of one year, while in lancang River basin, China, there is a lag of two year. The reason why this is inconsistent with the results of this paper is the response and lag period of NDVI to SPEI are related to the climate region, vegetation type and growth status, and soil texture. Different data sources, research period, research scope and analysis methods may cause differences in research results. It should be noted that as data of both rainfall and temperature were used to obtain the drought indices of the investigation, the independent impacts of the two factors on the NXC will require further investigation. Uncertainties in the accuracy of the SPEI also exist due to the limitations of both the density and spatial distribution of meteorological data. This paper provides a theoretical basis for further exploration of the relationship between the NDVI changes and its human factors.

5. Conclusions

This investigation examined the dynamic characteristics of drought and vegetation cover over the NXC region and evaluated the interactions between the two from 1998 to 2015. On an inter-annual scale, both NDVI and SPEI showed a fluctuating and increasing trend, and the vegetation status was slightly improved. Since climate change in recent years, the drought degree of NXC has been weakened, and the trend of warming and humidification has been strengthened, which provides favorable conditions for the ecological restoration of the region. It was determined that while humid years contributed to greater vegetation coverage in the NXC, growth was hindered in drier years. Most regions of NDVI and SPEI in NXC show a significant positive correlation, indicating that the response degree of SPEI to NDVI at each station of NXC may be related to the climatic zone, the effect of climate change on NDVI could be reflected well by SPEI, which comprehensively considers the temperature and precipitation together. Furthermore, a five-year time lag in the NDVI response to the SPEI. The research results provide an important theoretical basis for the planning, management and development of regional vegetation conservation, agriculture, forestry and animal husbandry in China. However, the impacts of human activities and climate factors on vegetation cover evolution remains to be understood, and further discussion is needed in future research. In addition, the sensitivity and response characteristics of different vegetation types, land utilization and seasonal variations of the NDVI to climate change must be further explored.

Author Contributions

All authors contributed to the design and development of this manuscript. N.L. carried out the data analysis and prepared the first draft of the manuscript; X.L. is the advisor of N.L. and contributed many ideas to the study; and B.W. and D.M. provided important advice on the concepts and structuring of the manuscript, as well as editing of the manuscript prior to submission and during revisions. All authors have read and agreed to the published version of the manuscript.

Funding

This research was funded by the National Basic Research Program of China (2013FY111800), R & D Innovative Teams of Major Scientific and Technological Projects in Jilin Province, Science and Technology Development Program of Jilin Province (Support Xinjiang) and the National Natural Science Foundation of China (no. 41701372).

Acknowledgments

We gratefully acknowledge the Resources and Environmental Science Data Center, Chinese Academy of Sciences, for the Landsat Thematic Mapper image analysis. In addition, thanks to MAO Dehua for revising the manuscript and we are very grateful to those who participated in the paper classification and field investigation for the China Cover project. We thank the anonymous reviewers for their constructive comments on our manuscript.

Conflicts of Interest

The authors declare no conflict of interest.

Appendix A

Appendix A.1. SPI and SPEI Data

The SPI was first proposed by McKee et al. [57] and is commonly applied to evaluate changes in meteorological and hydrological droughts. The software spi_sl_6.exe (https://drought.unl.edu/droughtmonitoring/SPI/SPIProgram.aspx) provided by the National Drought Mitigation Center was used to numerically evaluate the SPI. The SPEI and its corresponding software for calculation (http://digital.csic.es/handle/10261/10002) was developed by Vicente-Serrano et al. [58] to evaluate drought variations.

Appendix A.2. Potential Evapotranspiration

The Penman–Monteith (PM) method is a commonly used approach recommended by the Food and Agriculture Organization of the United Nations to determine the potential evapotranspiration (PET) [59], and is considered by the International Commission on Irrigation and Drainage and American Society of Civil Engineers as the standard method for such calculations [60]. Combining the SPEI with the PM method was revealed to increase the reliability of results in arid areas of Northwest China [61]. As such, this method is applied in this study to calculate the PET given in Equation (A1).
P E T = 0.408 Δ ( R n G ) + γ . 900 273 + T · u 2 · ( e a e d ) Δ + γ ( 1 + 0.34 · u 2 )
where Δ represents the gradient of the saturation vapor pressure curve (kPa°C−1); T represents average daily air temperature (°C); ea represents the saturation vapor pressure (kPa); Rn represents net radiation at the surface (MJ/(m2 d)); ed represents the actual atmospheric water vapor pressure (kPa); G represents all-wave ground heat flux, (MJ/(m2 d)); γ is the psychometric constant (kPa °C−1) and u2 represents the daily average wind velocity at 2 m above ground level (m s−1).

Appendix A.3. Standard Precipitation-Evapotranspiration Index

The numerical evaluation of SPEI is based on that of the original SPI. In addition, standardizes the difference between rainfall and PET to describe the extent of deviation of wet or dry conditions. The calculation procedure is detailed below:
(1) First, the difference between precipitation and monthly PET is obtained:
Dj = PjPETj
where, Pj and PETj represent the total rainfall and PET of the jth month. Respectively (mm).
(2) Next, the Di data sequence is normalized. Three parameters of the log-logistic probability distribution F(x) are used for the normalization of Di, and the SPEI values corresponding to each Di are calculated respectively.
F ( x ) = [ 1 + ( α x γ ) β ] 1
where α, β and γ represent the respective scale, shape and position parameters, obtained through equations proposed by [58].
The probability p of definite Xi k, j values are evaluated by Equation (A4):
p = 1 F ( x )
If p ≤ 0.5
w = 2 ln ( p )
S P E I = w c 0 + c 1 w + c 2 w 2 1 + d 1 w + d 2 w 2 + d 3 w 3
If p > 0.5
w = 2 ln ( 1 p )
S P E I = c 0 + c 1 w + c 2 w 2 1 + d 1 w + d 2 w 2 + d 3 w 3 w
where C0, C1, d1, d2 are 2.515517 … respectively.
SPEI values greater than 1.0 indicate increasing humidity, while values below −1.0 are representative of drier conditions. The SPEI is classified into seven categories to describe the intensity of drought (Table 1).

References

  1. Ding, Y.; Xu, J.; Wang, X.; Peng, X.; Cai, H. Spatial and temporal effects of drought on Chinese vegetation under different coverage levels. Sci. Total Environ. 2020, 716, 137166. [Google Scholar] [CrossRef]
  2. Piao, S.L.; Wang, X.H.; Ciais, P.; Zhu, B.; Wang, T.; Liu, J. Changes in satellite-derived vegetation growth trend in temperate and boreal Eurasia from 1982 to 2006. Glob. Chang. Biol. 2011, 17, 3228–3239. [Google Scholar] [CrossRef]
  3. Piao, S.L.; Cui, M.D.; Chen, A.P.; Wang, X.H.; Ciais, P.; Liu, J.; Tang, Y.H. Altitude and temperature dependence of change in the spring vegetation green-up date from 1982 to 2006 in the Qinghai-Xizang Plateau. Agric. For. Meteorol. 2011, 151, 1599–1608. [Google Scholar] [CrossRef]
  4. Liu, X.F.; Zhu, X.F.; Li, S.S.; Liu, Y.X.; Pan, Y.Z. Changes in Growing Season Vegetation and Their Associated Driving Forces in China during 2001-2012. Remote Sens. 2015, 7, 15517–15535. [Google Scholar] [CrossRef] [Green Version]
  5. Hou, W.J.; Gao, J.B.; Wu, S.H.; Dai, E.F. Interannual Variations in Growing-Season NDVI and Its Correlation with Climate Variables in the Southwestern Karst Region of China. Remote Sens. 2015, 7, 11105–11124. [Google Scholar] [CrossRef] [Green Version]
  6. Parmesan, C. Ecological and evolutionary responses to recent climate change. Annu. Rev. Ecol. Evol. Syst. 2006, 37, 637–669. [Google Scholar] [CrossRef] [Green Version]
  7. Walther, G.R.; Post, E.; Convey, P.; Menzel, A.; Parmesan, C.; Beebee, T.J.C.; Fromentin, J.M.; Hoegh-Guldberg, O.; Bairlein, F. Ecological responses to recent climate change. Nature 2002, 416, 389–395. [Google Scholar] [CrossRef]
  8. Bi, J.; Xu, L.; Samanta, A.; Zhu, Z.C.; Myneni, R. Divergent Arctic-Boreal Vegetation Changes between North America and Eurasia over the Past 30 Years. Remote Sens. 2013, 5, 2093–2112. [Google Scholar] [CrossRef] [Green Version]
  9. Jiang, L.L.; Jiapaer, G.; Bao, A.M.; Guo, H.; Ndayisaba, F. Vegetation dynamics and responses to climate change and human activities in Central Asia. Sci. Total Environ. 2017, 599, 967–980. [Google Scholar] [CrossRef]
  10. Qi, X.Z.; Jia, J.H.; Liu, H.Y.; Lin, Z.S. Relative importance of climate change and human activities for vegetation changes on China’s silk road economic belt over multiple timescales. Catena 2019, 180, 224–237. [Google Scholar] [CrossRef]
  11. Guo, B.; Zhou, Y.; Wang, S.X.; Tao, H.P. The relationship between normalized difference vegetation index (NDVI) and climate factors in the semiarid region: A case study in Yalu Tsangpo River basin of Qinghai-Tibet Plateau. J. Mt. Sci. 2014, 11, 926–940. [Google Scholar] [CrossRef]
  12. Zhu, Y.K.; Zhang, J.T.; Zhang, Y.Q.; Qin, S.G.; Shao, Y.Y.; Gao, Y. Responses of vegetation to climatic variations in the desert region of northern China. Catena 2019, 175, 27–36. [Google Scholar] [CrossRef]
  13. Wang, Z.; Huang, M.; Yan, H.; Wang, J.; Yue, X. Spatiotemporal Variation of Vegetation and Climate Impacts on It in Ghana from 1982 to 2006. J. Geo-Inf. Sci. 2015, 17, 78–85. [Google Scholar] [CrossRef]
  14. Zhu, W.; Mao, F.; Xu, Y.; Zheng, J.; Song, L. Analysis on Response of Vegetation Index to Climate Change and Its Prediction in the Three-Rivers-Source Region. Plateau Meteorol. 2019, 38, 693–704. [Google Scholar]
  15. Zhang, X.; Ge, Q.; Zheng, J. Impacts and lags of global warming on vegetation in Beijing for the last 50 years based on remotely sensed data and phonological information. Chin. J. Ecol. 2005, 24, 123–130. [Google Scholar]
  16. Liu, S.; Tian, Y.; Yin, Y.; An, N.; Dong, S. Effects of climate change on normalized difference vegetation index based on the multiple analysis of standardized precipitation evapotranspiration index methods in the Lancang River basin. Clima. Environ. Res. 2015, 20, 705–714. [Google Scholar] [CrossRef]
  17. Li, Z.; Qi, F.; Shang, G.; Sun, L.; Xia, Y. Spatial-temporal change of vegetation cover and its relationship with SPEI in Hutuo river basin. South-to-North Water Transf. Water Sci. Technol. 2018, 16, 135–143. [Google Scholar]
  18. Vicente-Serrano, S.M.; Cabello, D.; Tomas-Burguera, M.; Martin-Hernandez, N.; Begueria, S.; Azorin-Molina, C.; El Kenawy, A. Drought Variability and Land Degradation in Semiarid Regions: Assessment Using Remote Sensing Data and Drought Indices (1982–2011). Remote Sens. 2015, 7, 4391–4423. [Google Scholar] [CrossRef] [Green Version]
  19. Bushra, N.; Rohli, R.V.; Lam, N.S.N.; Zou, L.; Mostafiz, R.B.; Mihunov, V. The relationship between the Normalized Difference Vegetation Index and drought indices in the South Central United States. Nat. Hazards 2019, 96, 791–808. [Google Scholar] [CrossRef]
  20. Liu, Y.B.; Xiao, J.F.; Ju, W.M.; Xu, K.; Zhou, Y.L.; Zhao, Y.T. Recent trends in vegetation greenness in China significantly altered annual evapotranspiration and water yield. Environ. Res. Lett. 2016, 11, 14. [Google Scholar] [CrossRef]
  21. Piao, S.L.; Yin, G.D.; Tan, J.G.; Cheng, L.; Huang, M.T.; Li, Y.; Liu, R.G.; Mao, J.F.; Myneni, R.B.; Peng, S.S.; et al. Detection and attribution of vegetation greening trend in China over the last 30 years. Glob. Chang. Biol. 2015, 21, 1601–1609. [Google Scholar] [CrossRef]
  22. Zhao, Y.; Yu, Z.C.; Chen, F.H. Spatial and temporal patterns of Holocene vegetation and climate changes in arid and semi-arid China. Quat. Int. 2009, 194, 6–18. [Google Scholar] [CrossRef]
  23. Jiapaer, G.; Liang, S.L.; Yi, Q.X.; Liu, J.P. Vegetation dynamics and responses to recent climate change in Xinjiang using leaf area index as an indicator. Ecol. Indic. 2015, 58, 64–76. [Google Scholar] [CrossRef]
  24. Yin, G.; Hu, Z.Y.; Chen, X.; Tiyip, T. Vegetation dynamics and its response to climate change in Central Asia. J. Arid Land 2016, 8, 375–388. [Google Scholar] [CrossRef] [Green Version]
  25. Liu, Y.; Li, C.Z.; Liu, Z.H.; Deng, X. Assessment of spatio-temporal variations in vegetation cover in Xinjiang from 1982 to 2013 based on GIMMS-NDVI. Acta Ecol. Sin. 2016, 36, 6198–6208. [Google Scholar]
  26. Chen, X.; Luo, G.P.; Xia, J.; Zhou, K.F.; Lou, S.P.; Ye, M.Q. Ecological response to the climate change on the northern slope of the Tianshan Mountains in Xinjiang. Sci. China Ser. D-Earth Sci. 2005, 48, 765–777. [Google Scholar] [CrossRef]
  27. Xu, Y.F.; Yang, J.; Chen, Y.N. NDVI-based vegetation responses to climate change in an arid area of China. Theor. Appl. Climatol. 2016, 126, 213–222. [Google Scholar] [CrossRef]
  28. Liu, J.Y.; Zhang, Q.; Hu, Y.F. Regional differences of China’s urban expansion from late 20th to early 21st century based on remote sensing information. Chin. Geogr. Sci. 2012, 22, 1–14. [Google Scholar] [CrossRef]
  29. Liu, Y.; Li, L.H.; Chen, X.; Zhang, R.; Yang, J.M. Temporal-spatial variations and influencing factors of vegetation cover in Xinjiang from 1982 to 2013 based on GIMMS-NDVI3g. Glob. Planet. Chang. 2018, 169, 145–155. [Google Scholar] [CrossRef]
  30. Li, Z.; Zhou, T.; Zhao, X.; Huang, K.; Gao, S.; Wu, H.; Luo, H. Assessments of Drought Impacts on Vegetation in China with the Optimal Time Scales of the Climatic Drought Index. Int. J. Environ. Res. Pub. Health 2015, 12, 7615–7634. [Google Scholar] [CrossRef] [Green Version]
  31. Nourani, V.; Mehr, A.D.; Azad, N. Trend analysis of hydroclimatological variables in Urmia lake basin using hybrid wavelet Mann-Kendall and Sen tests. Environ. Earth Sci. 2018, 77, 18. [Google Scholar] [CrossRef]
  32. Gocic, M.; Trajkovic, S. Analysis of changes in meteorological variables using Mann-Kendall and Sen’s slope estimator statistical tests in Serbia. Glob. Planet. Chang. 2013, 100, 172–182. [Google Scholar] [CrossRef]
  33. Mann, H.B. Spatial-temporal variation and protection of wetland resources in Xinjiang. Econometrica 1945, 13, 245–259. [Google Scholar] [CrossRef]
  34. Fu, z.b.; Wang, Q. Definition and detection of climatic mutations. Atmos. Sci. 1992, 16, 482. [Google Scholar]
  35. Wang, H.J.; Zhang, B.Q.; Jin, X.H.; Tang, S.Y.; Liu, Y.Y.; Zhang, H. The spatio-temporal climate change and the response of runoff in the past 48a of the Zhangye region in the middle reaches of the Heihe river. J. Arid Land Res. Environ. 2010, 24, 81–88. [Google Scholar]
  36. Wei, F.Y. Progresses in Climatological Statistical Diagnosis and Prediction Methods-In Commemoration of the 50 Anniversaries of CAMS Establishment. J. Appl. Meteorol. Sci. 2006, 17, 736–742. [Google Scholar]
  37. He, J.; Li, Y.; Li, X.; Huang, J. Temporal and Spatial Characteristics of Droughts over Yunnan Province during 19612012. Mt. Res. 2016, 34, 19–27. [Google Scholar]
  38. Begueria, S.; Vicente-Serrano, S.M.; Reig, F.; Latorre, B. Standardized precipitation evapotranspiration index (SPEI) revisited: Parameter fitting, evapotranspiration models, tools, datasets and drought monitoring. Int. J. Climatol. 2014, 34, 3001–3023. [Google Scholar] [CrossRef] [Green Version]
  39. Vicente-Serrano, S.M.; Gouveia, C.; Camarero, J.J.; Begueria, S.; Trigo, R.; Lopez-Moreno, J.I.; Azorin-Molina, C.; Pasho, E.; Lorenzo-Lacruz, J.; Revuelto, J.; et al. Response of vegetation to drought time-scales across global land biomes. Proc. Natl. Acad. Sci. USA 2013, 110, 52–57. [Google Scholar] [CrossRef] [Green Version]
  40. Huang, K.C.; Yi, C.X.; Wu, D.H.; Zhou, T.; Zhao, X.; Blanford, W.J.; Wei, S.H.; Wu, H.; Ling, D.; Li, Z. Tipping point of a conifer forest ecosystem under severe drought. Environ. Res. Lett. 2015, 10, 9. [Google Scholar] [CrossRef]
  41. Chinese Academy of Meteorological Sciences. Classification of Meteorological Drought; GBT 20481-2006; China Standards Press: Beijing, China, 2006. [Google Scholar]
  42. Mafi-Gholami, D.; Zenner, E.K.; Jaafari, A.; Ward, R.D. Modeling multi-decadal mangrove leaf area index in response to drought along the semi-arid southern coasts of Iran. Sci. Total Environ. 2019, 656, 1326–1336. [Google Scholar] [CrossRef] [PubMed]
  43. Sheffield, J.; Wood, E.F. Global trends and variability in soil moisture and drought characteristics, 1950-2000, from observation-driven Simulations of the terrestrial hydrologic cycle. J. Clim. 2008, 21, 432–458. [Google Scholar] [CrossRef] [Green Version]
  44. Pu, Z.; Zhang, S.; Li, J.; Wang, S.; Zhang, J.; Apear. Climate Change in the Urumqi-Changji Region of Xinjiang in Resent 48 Years. Arid Zone Res. 2010, 27, 422–432. [Google Scholar]
  45. Zhang, Q.; Sun, P.; Li, J.; Singh, V.P.; Liu, J. Spatiotemporal properties of droughts and related impacts on agriculture in Xinjiang, China. Int. J. Climatol. 2015, 35, 1254–1266. [Google Scholar] [CrossRef]
  46. Yao, J.Q.; Zhao, Y.; Chen, Y.N.; Yu, X.J.; Zhang, R.B. Multi-scale assessments of droughts: A case study in Xinjiang, China. Sci. Total Environ. 2018, 630, 444–452. [Google Scholar] [CrossRef] [PubMed]
  47. Yu, G.R.; Zhu, X.J.; Fu, Y.L.; He, H.L.; Wang, Q.F.; Wen, X.F.; Li, X.R.; Zhang, L.M.; Zhang, L.; Su, W.; et al. Spatial patterns and climate drivers of carbon fluxes in terrestrial ecosystems of China. Glob. Chang. Biol. 2013, 19, 798–810. [Google Scholar] [CrossRef] [PubMed]
  48. Luo, N.; Batur, B.; Wu, Y. Analysis on Spatiotemporal Characteristics of Drought-Flood Based on Standard Precipitation Index in Northern Xinjiang in Recent 53 Years. Res. Soil Water Conserv. 2017, 24, 293–299. [Google Scholar]
  49. Yang, T.; Huang, F.; Li, Q.; Bai, L.; Li, L. Spatial-temporal Variation of NDVI for Growing Season and Its Relationship with Winter Snowfall in Northern Xinjiang. Remote Sens. Technol. Appl. 2017, 32, 1132–1140. [Google Scholar]
  50. Du, J.; Zhao, C.; Jiaerheng, A.; Fang, S.; Xiang, B.; Yin, J.; He, P.; Yuan, X.; Fang, G.; Shu, J. Analysis on spatio-temporal trends and drivers in monthly NDVI during recent decades in Xinjiang, China based two datasets. Trans. Chin. Soc. Agric. Eng. 2016, 32, 172–181. [Google Scholar]
  51. Ci, H.; Zhang, Q. Spatio-temporal Patterns of NDVI Variations and Possible Relations with Climate Changes in Xinjiang Province. J. Geo-Inf. Sci. 2017, 19, 662–671. [Google Scholar]
  52. Wang, Z.; Huang, Z.; Li, J.; Zhong, R.; Huang, W. Assessing impacts of meteorological drought on vegetation at catchment scale in China based on SPEI and NDVI. Trans. Chin. Soc. Agric. Eng. 2016, 32, 177–186. [Google Scholar]
  53. Luo, N.; Bake, B.; Wu, Y. Precipitation Multi-Scale Characteristics by Ensemble Empirical Mode Decomposition in Northern Xinjiang. Res. Soil Water Conserv. 2017, 24, 362–367. [Google Scholar]
  54. Fan, Z.M.; Fan, B. Shift scenarios of mean centers in vegetation ecosystems in Eurasia. Acta Ecol. Sin. 2019, 39, 5028–5039. [Google Scholar] [CrossRef]
  55. Chu, H.S.; Venevsky, S.; Wu, C.; Wang, M.H. NDVI-based vegetation dynamics and its response to climate changes at Amur-Heilongjiang River Basin from 1982 to 2015. Sci. Total Environ. 2019, 650, 2051–2062. [Google Scholar] [CrossRef] [PubMed]
  56. Liu, S.; Tian, Y.; Yin, Y.; An, N.; Dong, S. Temporal dynamics of vegetation NDVI and its response to drought conditions in Yunnan Province. Acta Ecol. Sin. 2016, 36, 4699–4707. [Google Scholar]
  57. McKee, T.B.; Doesken, N.J.; Kleist, J.; Amerkican Meteorological Society. Drought Monitoring with Multiple Time Scales; Amerkican Meteorological Society: Boston, MA, USA, 1995; pp. 233–236. [Google Scholar]
  58. Vicente-Serrano, S.M.; Begueria, S.; Lopez-Moreno, J.I. A Multiscalar Drought Index Sensitive to Global Warming: The Standardized Precipitation Evapotranspiration Index. J. Clim. 2010, 23, 1696–1718. [Google Scholar] [CrossRef] [Green Version]
  59. Allen, R.G.; Smith, M.; Pereira, L.S.; Pruitt, W.O. Proposed revision to the FAO procedure for estimating crop water requirements. In Second International Symposium on Irrigation of Horticultural Crops, Vols 1 and 2; Chartzoulakis, K.S., Angelakis, A.N., Eds.; International Society Horticultural Science: Leuven, Belgium, 1997; pp. 17–33. [Google Scholar]
  60. Miah, M.G.; Abdullah, H.M.; Jeong, C. Exploring standardized precipitation evapotranspiration index for drought assessment in Bangladesh. Environ. Monit. Assess. 2017, 189, 16. [Google Scholar] [CrossRef]
  61. Islam, A.M.T.; Shen, S.H.; Hu, Z.H.; Rahman, M.A. Drought Hazard Evaluation in Boro Paddy Cultivated Areas of Western Bangladesh at Current and Future Climate Change Conditions. Adv. Meteorol. 2017, 2017, 3514381. [Google Scholar] [CrossRef]
Figure 1. A map of the NXC showing the locations of meteorological stations and vegetation distribution.
Land 09 00090 g001
Figure 2. Interannual variation (a) and Mann–Kendall test (b) of average SPEI of NXC between 1960 and 2015. (Blue line (Green line) is UF (UB) line. Horizontal line is the level of 0.05 significance line.
Land 09 00090 g002
Figure 3. Spatial patterns of average values in the SPEI in NXC from 1960 to 2015.
Land 09 00090 g003
Figure 4. (a) Yearly average NDVI from 1998 to 2015 and (b) point analyses of trend variations; (c) Mann–Kendall test.
Land 09 00090 g004
Figure 5. (a) Yearly average NDVI values and (b) slope of annual NDVI variations in the NXC from 1998 to 2015.
Land 09 00090 g005
Figure 6. Regional differences of the correlation coefficients between the average NDVI and inter-annual variability of precipitation (a,b) and temperature (c,d).
Land 09 00090 g006
Figure 7. (a) Correlations between NDVI and SPEI; (b) significance of such correlations between 1998 and 2015 in NXC.
Land 09 00090 g007
Table 1. Categorization of meteorological drought through the SPEI.
LevelTypeDrought Severity
1SPEI ≥ 2Extremely wet
21.5 < SPEI ≤ 2Severely wet
31 < SPEI ≤ 1.5Moderately wet
4−1 < SPEI ≤ 1Near normal
5−1.0 < SPEI ≤ −0.5Mild drought
6−1.5 < SPEI ≤ −1.0Moderate drought
7−2.0 < SPEI ≤ −1.5Severe drought
8SPEI ≤ −2.0Extreme drought
Table 2. Spearman’s correlation coefficients for the NDVI, precipitation, and temperature in NXC.
1998–2015PrecipitationTemperatureNDVI
Precipitation10.469 *0.541 *
Temperature 10.127
NDVI 1
* With a significance level of 0.05.
Table 3. Spearman’s correlation coefficients for the vegetation index and SPEI of the NXC.
Vegetation IndexPeriodSpei (Zero Year Lag)Spei (One Year Lag)Spei (Three-Year Lag)Spei (Five-Year Lag)
NDVI-annual1998–20150.4718−0.2090.1060.146 *
* With a significance level of 0.05.

