Environmental Regulations, the Industrial Structure, and High-Quality Regional Economic Development: Evidence from China


1
School of Business, Hunan University of Science and Technology, Xiangtan 411201, China
2
School of Business and Creative industries, University of the West of Scotland (UWS), Paisley PA1 1DD, UK
*
Author to whom correspondence should be addressed.
Land 2020, 9(12), 517; https://doi.org/10.3390/land9120517
Submission received: 19 November 2020
/
Revised: 10 December 2020
/
Accepted: 11 December 2020
/
Published: 14 December 2020
(This article belongs to the Special Issue Socio-Economic Impacts of Carbon Sequestration on Livelihoods and Future Climate)
Abstract
:Environmental regulation is an important means of restraining enterprises and protecting the environment. Rationalization of environmental regulatory policies can promote high-quality regional economic development. The optimization and upgrading of the industrial structure has an intermediary effect on the impact of environmental regulations on the high-quality development of the regional economy. After collating and analyzing previous research, this article proposes to classify 30 Chinese provinces into regions with higher than the national average HDI (human development index) and lower than the national average HDI based on the average HDI of Chinese provinces. We explore the mediating effect of industrial structure on environmental regulation and high-quality regional economic development. The model passed the full-sample robustness test and the robustness test with GDP as the replacement variable. The empirical results show that environmental regulations of different intensities have different effects on the quality of regional economic development. The effect of environmental regulations on development quality is mainly mediated through the transformation and upgrading of the industrial structure. Enterprises need reasonable incentives from environmental regulations to transform and upgrade. The mediating effect of the industrial structure on environmental regulations is greater in regions with below-average HDI values than in regions with above-average HDI values, which shows that the industrial structure is the mechanism underlying the effect of environmental regulations on the quality of regional economic development. This result proves that adjusting environmental regulatory policies can effectively promote the upgrading of industrial structure, thereby promoting high-quality regional economic development. Based on this, the article puts forward several policy recommendations.
1. Introduction
In the report of the 19th National Congress of the Communist Party of China (CPC), General Secretary Jinping-Xi pointed out that “China’s economy has shifted from a stage of high-speed growth to a stage of high-quality development.” The traditional extensive development model has been gradually abandoned in the “new era”, and maintaining high quality is being used as the foundation of and key guiding ideology for economic development. After more than 40 years of being open, China’s economy has grown at a high pace and has entered the stage of high-quality development. The optimization and upgrading of the industrial structure is one of the main manifestations of high-quality development. Therefore, one of the goals of high-quality regional economic development is to promote the optimization and upgrading of the industrial structure. It is a key path for coordinating environmental regulations and high-quality regional economic development. While increasing the proportion of knowledge-intensive and technology-intensive industries, it is also necessary to increase the organic unity between rationality and industrial structure upgrades to promote green and low-carbon development within the economy. Environmental regulation can significantly promote economic growth, which is the claim of the famous Porter hypothesis. Environmental regulations can also hinder economic growth if they are not cost-effective. That is, environmental regulations increase the expenditure of enterprises on environmental protection and can crowd out investments in production so that the innovativeness and profitability of new technologies and new products are reduced. Tongbin-Zhang (2017) [1] combined Chinese provincial-level panel data from 1995 to 2013, and concluded that strong environmental regulations promote economic development through an “innovation compensation” effect, while weak environmental regulations are ineffective. The mechanism underlying the effect of environmental regulation on industrial restructuring involves many factors. However, there is little in the literature that provides persuasive empirical evidence based on actual conditions in China while incorporating the cost effect, the pollution refuge hypothesis, and the Porter hypothesis into a unified analytical framework.
The structure of this article is as follows: Section 1 is the introduction; Section 2 describes the literature review; Section 3 provides the theoretical mechanisms and discusses the classification of environmental regulations and the analysis of the environmental regulation mechanism; Section 4 introduces the empirical model and results and discusses the data sources, variable selection, and data processing; Section 5 presents the analysis of the results, including those from the HDI partition analysis, and the robustness test; and Section 6 presents the research summary and recommendations.
2. Literature Review
Along with scientific and technological innovations and FDI (foreign direct investment), environmental regulations can also affect the high-quality development of the regional economy through industrial restructuring. The greater the extent of industrial structure optimization and upgrading, the more positive the effect of environmental regulation on environmental quality. Environmental regulations also impact the industrial structure [2,3]. There are two possible mechanisms underlying the promotion of the optimization and upgrading of the industrial structure. First, environmental regulations can act as a backward-looking mechanism driving the upgrading of the industrial structure. The implementation of environmental regulations imposes a compulsory “deep cleaning” on industries and enterprises. Environmental regulation achieves the optimization and upgrading of the industrial structure and optimal allocation of resources through survival of the fittest, which in turn improves the high-quality development of the regional economy. Second, environmental regulations form implicit green barriers to entry.
(1) Environmental regulations
Environmental regulations are a series of related policies or measures adopted by the government to protect the environment [4]. Environmental regulation is an essential part of the formal Chinese environmental administration system. Environmental regulation is an essential part of the formal Chinese environmental administration system [5,6]. Economic growth alone cannot alleviate environmental pollution, so environmental regulation must be added. Under reasonable environmental regulations, green innovation has been improved, and the industrial development model has also changed. Currently, a large portion of the literature has explored the various relationships between environmental regulations and green technology innovation, including linear and nonlinear relationships. For example, Ling Li and Feng Tao (2012) [7] established a relationship between environmental regulation and green total factor productivity using a panel data model, trying to find the inflection point in the optimal environmental regulation strength for different industries with a goal of promoting productivity. Fuxin Jiang showed that there is a dynamic U-shaped relationship between green technological innovation and the decline in environmental pollution. As the strength of environmental regulation rises, the offset effect changes to the compensation effect. However, the above literature does not effectively distinguish between the types of environmental regulations, so it is impossible to discover the heterogeneous effects of different kinds of environmental regulations on the efficiency of green technological innovation.
(2) Economic development
Economic growth can be defined as the increase in the inflation-adjusted market value of the goods and services produced by an economy over time. High-quality development in the new era must coordinate the relationship between development pace and quality. Quality must be put first and given priority over efficiency. The key is to increase total factor productivity and replace old drivers of growth with new drivers. Pearce and Turner (1990) [8] proposed that the relationship between development and the environment gives rise to the concept of sustainable development. Papalia and Bertarelli (2013) [9] established a model based on entropy calculations and found that there was obvious convergence in the economic growth of some countries. Some scholars measured the quality of economic growth, constructed an evaluation index for the modern economic system, adopted the spatial Durbin estimation method, empirically analyzed how the modern economic system improves total factor productivity, and considered how TFP affects the quality of economic development.
Some scholars have empirically found that environmental regulation improved industrial green total factor productivity in Norway using data on industrial enterprises (Telle and Larsson, 2007) [10]. Other scholars have concluded that research and development subsidies and carbon taxes can effectively improve green economic growth through the investigation of environmental regulations and the efficiency of green innovation (Ploeg and Withagen, 2013) [11]. When carbon duty tariffs and support for carbon release reduction reach a sufficient level, they promote innovation in green energy technologies, thereby reducing environmental pollution caused by economic activities.
(3) Environmental regulation and economic growth
The relationship between environmental regulation and economic growth has always been a hot topic in economics research. New classical economic theory holds that environmental regulation can lead enterprises to internalize the social cost of their emissions. Therefore, increasing the intensity of environmental governance increases the cost of pollution control and reduces enterprise performance. Mainstream scholars, such as Porter, hold the opposite view. Such scholars believe that strict and reasonable environmental regulation can stimulate enterprises to conduct technological innovation activities and obtain compensation for product innovations. Some scholars also hold the view that the effect of environmental regulation on enterprise performance is uncertain. They believe that only appropriate and effective environmental regulation can stimulate or force enterprises to innovate. Therefore, the effect of environmental regulation on enterprise performance is uncertain.
China’s government found that we have to protect the ecological environment, and made efforts to reduce pollutant emission because it is unsustainable to obtain economic benefits that sacrifice the environment (Shuai and Fan, 2020) [12]. The environmental regulation efficiency loss of local and neighboring cities inhibits inclusive growth at both the national and regional levels (Ge, T., Qiu, W., Li, J., and Hao, X., 2020) [13]. The Inclusive Wealth Index provides important insights into long-term economic growth and human well-being (Managi, S. and Kumar, P., 2018) [14]. Other research scholars explored the determinants of inclusive growth, including technological innovation (George et al., 2012) [15], economic growth (Vellala et al., 2014) [16], resource mobilization (Oyinlola et al., 2020) [17], and trade openness (Jalles and Mello, 2019) [18]. Rajapaksa, D., Islam, M. and Managi, S. (2017) [19] analyzed the impact of natural disasters on inclusive growth, trade openness, FDI, and GDP growth rate, which are other important determinants of natural capital.
Presently, there have been many research results on the relationship between environmental regulation, economic growth, and industrial structure. Most scholars believe that traditional industries mainly achieve the purpose of upgrading the industrial structure and improving the quality of economic development by the introduction and integration of green innovative technologies and resources. However, previous literature focused more on the threshold effect of environmental regulation, and seldom incorporated environmental regulation and industrial structure into the study of high-quality economic development, ignoring the role of industrial structure upgrading. China has stringent requirements for high-quality economic development. The research on the impact of environmental regulations on the quality of regional economic development is particularly important. Therefore, this article uses data from 2006 to 2017, based on the mediating effect of industrial structure, to study the impact of environmental regulations on the high-quality development of regional economies. The article also innovatively uses HDI divisions to compare the intermediary effects of the industrial structure between regions above the human development index and regions below the human development index. This complements the important role of industrial structure in high-quality economic development. Compared with the existing literature, the main contributions of this article are as follows: (1) we explain the mechanism underlying the effect of environmental regulations on high-quality economic development from a theoretical perspective; (2) through HDI zoning, we study the differential impact of environmental regulations on the quality of regional economic development; and (3) we provide relevant policy suggestions on how to improve the quality of regional economic development and how to win the battle against pollution in the contemporary Chinese context.
3. Theoretical Mechanism
Countries around the world have been calling for the development of a low-carbon economy. In this context, Grossman and Kreuger [20] pioneered the environmental Kuznets curve (EKC) hypothesis, which focuses on the relationship between environmental quality and economic growth. The environmental Kuznets curve refers to an inverted U curve relationship between environmental quality or pollutant emission levels and per capita income. Research by the World Bank (1992) [21] concluded that the critical point of pollution emissions is a per capita income of $8000. The EKC curve is continuously verified. In the China Sustainable Development Strategy Report 2000, the Chinese government proposed that the EKC curve can be used to scientifically set the critical point of environmental pollution peaks and the length of time to reach this critical point, and form a reasonable environmental regulatory policy based on that. The following paper introduces China’s current environmental regulatory policies. Caruso, G., Di Battista., et.al (2020) [22] studied the past policy approach and offered a potential pathway for academics to work with policymakers in moving towards the realization of local growth policies. D’Adamo, et.al (2020) [23] proposed a new indicator, the socioeconomic indicator for the bioeconomy (SEIB), to measure the socioeconomic performance of bioeconomy sectors.
3.1. Classification of Environmental Regulations
Environmental regulation tools mainly include three types: command-and-control tools, market incentive tools, and voluntary participation tools [24,25].
3.1.1. Command-and-Control Environmental Regulation
In reality, the most widely used tool is command-and-control environmental regulations. It refers to the government, through legislation or formulating rules and regulations, to clarify the goals and standards of environmental regulations, and at the same time punish enterprises that violate the regulations to achieve the goal of protecting the environment [26]. The Environmental Protection Law of the People’s Republic of China promulgated by China and relevant unit regulations are all typical command-and-control tools. This type of tool is simple to operate and efficient, but the implementation cost is high. If one wants to achieve the same effect as market incentive tools, the cost is often several times higher than the latter [27]. The high cost of command-and-control tools is due to information asymmetry. The collection of corporate information, corporate supervision, and punishment requires a lot of manpower to execute, so command-and-control tools are weak in market supervision.
3.1.2. Market Incentive Environmental Regulation
Market incentive tools do not constrain the behavior of polluters through norms or regulations; instead, they use market signals to influence the behavioral decisions of enterprises [28], including the imposition of sewage charge, permit systems, and government subsidies [29]. In 1972, the OECD promulgated the “Polluter Pays Principle”. Since then, many countries have adopted this form of sewage regulation. The theory behind market incentive tools is Pigou’s [30] theorem. The rational polluter determines the amount of pollutant discharge based on the marginal pollution reduction cost equal to the pollutant tax rate, and uses the different pollutant discharge costs of the enterprise to allow polluters to allocate effective resources spontaneously, reducing the cost of information asymmetry caused by the command-and-control tool. At the same time, companies can obtain additional profits by using green technology for production. Therefore, this tool can provide incentives for green technology for pollution reduction, allowing polluters to promote pollution reduction technology and choose a more green and effective production model.
3.1.3. Voluntary Participation in Environmental Regulation
Voluntary participation tools refer to environmental protection proposals put forward by industry associations, enterprises themselves, or other subjects, and necessitate higher requirements for polluters. This category mainly includes environmental certification, environmental audits, eco-labels, environmental agreements, etc. There are four ways to implement voluntary tools based on strong environmental awareness. The first is the administrative form, which exerts pressure on the government through non-governmental environmental protection organizations to supervise the work of the government. The second is the economic form, raising private funds to finance some environmental protection projects. The third is the legal form, which promotes environmental legislation and provides environmental legal assistance to some organizations or institutions. The fourth is the way of education to popularize the importance of protecting the environment.
Command-and-control, market incentives, and voluntary participation environmental tools are the trinity of the government, market, and society to protect the ecological environment. In reality, environmental policies not only select one tool, but in order to satisfy the principles of efficiency, feasibility, and equity, two or even three types of environmental regulation tools are generally used together. The government should implement the best environmental regulation according to the actual situations [31].
China’s environmental regulation policies have gone from monetary incentives to non-monetary incentives, from emphasizing government intervention to strengthening market incentives, and the ultimate goal is actually the active participation of the public. Nowadays, in addition to the participation of enterprises and governments, the public also plays an important role in environmental regulation. With the continuous improvement of public awareness of environmental protection, environmental regulations, and policies in the form of environmental certification, environmental hearings and public participation have received increasing attention. The environment and health are linked, and individuals are more concerned about the environment than the government and enterprises. For example, the smog of Beijing in China once attracted the attention of all of the people in China. They were willing and able to force companies to improve their technology and reduce pollution. At this time, we need the proper guidance from the government, such as requiring companies to indicate whether they use high-pollution emission technology on the product packaging, whether the packaging bag is biodegradable, and so on. The modes of public participation in environmental governance are diverse. For example, from the perspective of participating subjects, there are forms based on the participation of individual citizens, participation based on non-profit organizations, and participation based on media. It is precisely the diversity of public participation that makes up for the shortcomings of monetary-based environmental regulatory policies. Such a wide range of roles can affect the various subjects, processes, and specific instruments of environmental governance. The heightened public awareness of environmental protection has been transformed into practical actions in many aspects, prompting the government and enterprises to take effective environmental protection measures to respond. Under the trinity of government, enterprises, and the public environmental regulation, the adjustment of the industrial structure is the core intermediary factor of environmental regulation that affects the high-quality economic development. Next, the specific mechanism of industrial structure will be explained in detail.
3.2. Analysis of the Mechanisms by Which Environmental Regulations Drive Industrial Upgrading
In a low-level industrial structure, resources are tilted towards the primary and secondary industries, and a capital investment model that focuses on scale, speed, and materials is implemented. This extensive economic growth model has low resource utilization efficiency and serious environmental pollution, and hinders high-quality economic development. Environmental regulations restrict the behavior of polluters, and can lead to adjustments in the industrial structure through different channels to promote high-quality economic development. Many factors affect the upgrading of the industrial structure due to environmental regulation, and there is spatial heterogeneity in these factors [32]. The higher the intensity of environmental regulation, the better the upgrading of the industrial structure relatedly, the more optimized the industrial structure, and the more positive the effect of environmental regulation [33]. This article mainly discusses three theoretical mechanisms by which environmental regulation drives the upgrading of the industrial structure.
3.2.1. Crowding Out Mechanism
Technological innovation is the largest driving force behind the upgrading of the industrial structure. The speed of industrial structure upgrades depends on the intensity and speed of technological innovation. Only continuous technological innovation can develop the industrial structure from a low level to high level, and environmental regulations force the optimization and upgrading of the industrial structure through technological progress. Environmental regulations increase the price of production factors that generate pollution, and heavily polluting companies will automatically withdraw from the market. The Porter hypothesis states that environmental regulations promote technological progress in enterprises, and polluters must seek more efficient and green production technologies in order to reduce their production costs. Increasing environmental regulatory standards has eliminated low-end production technologies, and manufacturers using low-end technologies have been crowded out of the market. Environmental regulations have increased the production costs of heavily polluting industries, while clean technology industries are minimally affected and the most concentrated in the tertiary industry. The development of the service industry drives the industrial structure upgrades, helps optimize resource allocation, and improves the quality of economic development.
3.2.2. Green Barriers to Entry
For potential entrants in an industry, investment in environmental regulation is a sunk cost on non-production factors. Eventually, this increase in necessary investment capital and investment risk forms an entry barrier in that industry. In addition, the reduction in environmental pollution increases marginally. The larger the scale of the enterprise, the greater the cost of pollution. To improve the efficiency of environmental protection, the government proposes higher environmental standards for companies that are new entrants to the industry. Potential entrants are already burdened with higher risks and higher production costs. Coupled with the cost of environmental regulations, new entrants are in an extremely disadvantaged position, which increases the barriers to entry into the industry. Environmental regulations have formed invisible barriers to entry in some industries, and these barriers are aimed at promoting green production technologies. That is, the higher the pollution intensity of an industry, the higher the invisible barriers to entry are, resulting in resources being concentrated in clean technology industries. High-polluting industries are concentrated in the secondary industry, and clean technology industries are concentrated in the tertiary industry, and so environmental regulations promote the upgrading of the industrial structure and have an impact on high-quality economic development.
3.2.3. Openness to Trade
Openness to trade refers to the ratio of domestic prices to international prices for the same product. The closer the ratio is to 1, the more open the product. The pollution sanctuary hypothesis argues that firms in countries with stricter environmental regulations and a higher cost for discharging pollution will move to other regions if they are in industries that are more pollution intensive. The transfer of polluting industries from developed countries to developing countries has led to an increase in openness to trade among products from industries with high levels of pollution intensity. To pursue high returns, companies will expand their scale and increase their emissions to encourage the government to increase the intensity of its environmental regulations. As a result, high-intensity environmental regulations force some companies out of the market, surviving companies increase the price of their products and reduce relative international competitiveness, and domestic high-polluting industries shrink. In the context of international integration, the substitution effect due to environmental regulations and the expansion effect due to international trade are mutually exclusive, which prevents developing countries from becoming pollution refuges and leads industrial structure upgrades that improve high-quality economic development.
Intense environmental regulation promotes industrial structure upgrading. Regional production models within a reasonable industrial structure tend to intensify along with rapid scientific and technological progress, high production efficiency, and an increase in the quality of production factors and the capacity for optimal combination. The upgrading of the industrial structure has reduced the scale of industries with high energy consumption and intensive pollution, and resources have been tilted towards clean technology industries, further promoting the innovative development of clean technology. The upgrading of the industrial structure is a key path through which the coordination of sustainable economic development and ecological environment protection is promoted. This continuous adjustment to the industrial structure has brought about high-quality economic development.
Based on the analysis of the mechanism of action, this article proposes the following hypotheses:
Hypothesis 1 (H1).
When the pollution refuge effect caused by environmental regulation is greater than the competition effect of the local government scale, environmental regulation policies can promote the optimization and upgrading of the industrial structure.
Hypothesis 2 (H2).
Environmental regulations force technological innovation, and high-quality economic development is promoted through advanced and rationalized industrial structure.
Hypothesis 3 (H3).
In regions with different economic development speeds, environmental regulations have different impacts on the upgrading of the industrial structure.
4. Measurement Model Construction, Data Sources, and Variable Selection
4.1. Measurement Model Construction
This article mainly focuses on the impact of environmental regulations on the high-quality development of the regional economy. To that end, the following regression model is constructed:
In the above equation, and represent the economic development quality and environmental regulation, respectively, in province i and in year t, and represents the j other explanatory variables, namely industrial structure, human capital level, trade openness, and the amount of investment in fixed assets; α is a constant, β and γ are the coefficients of each variable, and , and represent unobservable individual effects, unobservable time effects, and specific errors, respectively.
To study the mechanism underlying the effect of environmental regulation on the high-quality development of the regional economy, cross-terms are introduced, and the following regression model is constructed:
In the above equation, represents the intermediary variable industrial structure, and δ is the coefficient of that variable.
4.2. Data Sources
Based on the above theoretical analysis, this article uses panel data from 30 provinces (including municipalities directly under the central government and autonomous regions) in China from 2006 to 2015, and uses a fixed effects (FE) model to analyze them. This choice is based on two considerations. One is that the Hausman test rejects the random effects (RE) model, and the other is that unobservable factors in each province may have different effects on the quality of economic development. In China, regional endowments affect the quality of economic development. The data in this article come from the China Statistical Yearbook, China Environmental Statistics Yearbook, China Industrial Economic Statistics Yearbook, China Science and Technology Statistical Yearbook, the website of the National Bureau of Statistics of China, and the China Economic and Social Development Statistics Database from previous years. The HDI data for different regions are from the China Human Development Report Special Edition (2017), which is based on cooperation between the Development Research Center of the State Council of China and the United Nations Development Program. This paper uses the national average HDI of 0.752 as a boundary to divide the 31 provinces in China into regions with an HDI higher than the national average HDI (nine provinces) and lower than the national average HDI (22 provinces). The regions with a higher than average HDI include Beijing, Shanghai, Tianjin, Jiangsu, Zhejiang, Guangdong, Liaoning, Inner Mongolia, and Shandong. The regions with a lower than average HDI include Jilin, Chongqing, Fujian, Hubei, Shaanxi, Hunan, Shanxi, Hainan, Heilongjiang, Ningxia, Hebei, Xinjiang, Henan, Jiangxi, Guangxi, Anhui, Sichuan, Gansu, Qinghai, Guizhou, Yunnan, and Tibet (since there are too many missing data on Tibet, this study does not include Tibet). For individual missing data, the mean interpolation method is used to fill in the gap.
4.3. Variable Selection and Processing
This paper uses panel data from 30 provinces in China from 2006 to 2017, for a total of 1000 observations. The human development index (HDI), which covers life expectancy at birth, education level, and quality of life, is used to designate zones that are considered when studying the effects of environmental regulations on the regional economic development quality.
Explained variable: high-quality development in the regional economy (hqd). Baoping Ren (2018) [34] defines the quality of economic development as the effectiveness of, adequacy of, coordination in, level of innovation in, sustainability of, sharing of, and stability of economic development. Hong Zhang (2015) [35] constructed an indicator system to measure economic development based on the five dimensions of effectiveness, coordination, sharing, innovation, and sustainability. Thus, the quality of economic development needs to be judged from a multidimensional perspective. In consideration of the comparability, stability, and sustainability of the development of the regional economy, this article determines six secondary indicators from these three dimensions: the economic development level, the stability of economic development, and the sustainability of economic development. These indicators are used as proxy indicators for high-quality regional economic development. The details are shown in Table 1.
The comprehensive indicator of the economic development quality is different from the sustainable development index. The methods of evaluating the process of sustainable development in economic theory mainly include green GDP accounting [36], the monetary value accounting of natural resource depletion, the four-capital model, and the definition of strong sustainability and weak sustainability [37], etc. The International Institute for Sustainable Development (IISD) has given out the seven principles of the sustainable development indicator system: availability, comprehensibility, measurability, significance, availability, comparability, and universality of indicators [38]. The sustainable development indicator system proposed by China in 1999 is complicated to calculate. It uses 45 indexes, covering 208 indicators [39], and focuses more on humanities and society. The comprehensive indicators of the economic development quality used in this article are mainly to evaluate the current quality of economic development in China. The quality of economic development includes the increase of quantity and the improvement of quality, which is the organic unity of quantity and quality. The level of economic development is used to measure the level of output. The higher the output level, the more prosperous the region, the higher the living standard of residents, and the higher the quality of economic development accordingly. Sustainability development, GDP, natural resources, and foreign direct investment have been added to the Section 2.
- (1)
- Level of economic development (le): The article uses the logarithm of per capita GDP to measure economic development, and per capita GDP is deflated to values for the year 2000.
- (2)
- Stability of economic development (st): The stability of economic development means that the speed of economic development fluctuates within a moderate range so that resources can be fully utilized. According to the AS-AD model, if the economy grows too quickly and aggregate demand is excessively high, it will usually lead to inflation; if the economy grows too slowly and aggregate demand is insufficient, it will usually lead to unemployment. Therefore, the more stable the economic development, the higher the quality of economic development. This article uses two secondary indicators to measure stability, the CPI and the urban-registered unemployment rate.
- (3)
- Sustainability of economic development (su): The sustainability of economic development is the main factor that distinguishes the quality of economic development from the pattern of economic growth. Economic development inevitably leads to environmental pollution. If economic development cannot be sustained, it will inevitably cause serious damage to the ecological environment, and these negative consequences will, in turn, hinder the quality of economic development. This article uses three secondary indicators to measure this, which are the green coverage of completed areas, per capita public area of green land, and pollution intensity. Pollution intensity is calculated by the entropy weighting method using three indicators: per capita volume of industrial waste water discharged (su1), per capita volume of sulfur dioxide emissions by the industry (su2), and per capita emission of industrial soot and dust (su3). The following describes the specific steps followed in the entropy weighting method to calculate pollution intensity.
First, we sort the 30 provinces into 1, 2, 3… 30, that is, i = 1, 2, 3… 30, respectively. Then the per capita volume of the industrial waste water discharged of the i-th province is sui1, the per capita volume of sulfur dioxide emissions by the industry is sui2, and the per capita emission of industrial soot and dust is sui3, where j = 1, 2, 3.
The first step is to calculate the proportion of the i-th indicator value in the j-th industry [40,41]:
The third step is to calculate the entropy weight wj of the j-th indicator [43,44]:
where wj is the final weight coefficient for each indicator, and the weight coefficient obtained is substituted into . Then we can get the pollution intensity of each province.
The three emissions have different weights in different years. An area may have both high pollution and high resource intensity, or it may have both high technology and high pollution intensity. Under different environmental regulatory intensities, the innovation efficiency of pollution-intensive or technology-intensive economic zones may be different [45].
Since the above six indicators have different dimensions, this article draws on the method of Bo-Shi (2018) [46] to measure the quality of economic development. We first adopted the range standardization method to process the original data underlying each indicator into nondimensional indicator values, referred to the United Nations Human Development Index evaluation system, and finally used the DEA-SBM method to calculate the quality of regional economic development. Table 2 shows the high-quality development of the regional economy of different provinces in different years. The range of the indicator is 0-1. The closer the value is to 1, the better the quality of economic development. From the values of the quality of regional economic development given in Table 2, the quality of regional economic development of more developed provinces in China is significantly higher than that of other provinces. For example, Beijing, Zhejiang, Guangdong and other provinces and cities reached the highest value 1 in 2017. The quality of regional economic development in the central and western regions is lower than that in the eastern regions. The quality of regional economic development is poor which is limited by geographical location and resource endowments, such as Qinghai, Ningxia, Gansu and other provinces. However, in general, China has experienced ten years of development, and the quality of economic development in all provinces has been steadily improving, especially in Chongqing. These are basically consistent with the actual situation. This article uses the indicator data in Table 3 as the empirical explained variable hqd.
Explanatory variable: environmental regulation (er). There are no uniform standards in the academic community for measuring the intensity of environmental regulations. Levinson (1996) [47] measured the intensity of environmental regulations based on pollutant emissions. This article adopted the same method as Yaobin Liu (2020) [48], measuring the intensity of environmental regulations based on the logarithm of the total investment in regional industrial pollution control.
Intermediary variable: industrial structure (is). The upgrading of the industrial structure is conducive to improvements in the quality of regional economic development, but the dilemma of corporate governance can lead to the simplification of the industrial structure, thereby inhibiting improvements in the quality of economic development. Considering that a change in the proportion of the tertiary industry can reflect the optimization and upgrading of the industrial structure, this article uses the proportion of output from the tertiary industry to GDP to measure the optimization and upgrading of the industrial structure.
Other control variables: (1) Human capital (edu). With an increase in educational attainment, awareness of environmental protection should be gradually strengthened. An increase in the average number of years of education per capita will fundamentally improve the quality of workers’ human capital and simultaneously boost the effect of labor production, thus promoting the development of the regional economy. This article draws on the calculation for average years of education. Human capital is measured as the average years of education of the labor force in each province [49,50]. The formula for years of education is as follows: years of education = proportion of elementary school students × 6 + proportion of junior secondary school students × 9 + proportion of senior secondary school students (including regular senior secondary school and secondary vocational school) × 12 + proportion of university students (including college students, undergraduates, and graduate students) × 16, where the proportion of the number of students in each grade = the number of students educated in that grade/the total population in a given year. (2) Trade openness (imex). Trade openness refers to the degree to which a country or a region’s import and export trade (including trade in goods and services) is liberalized. This article uses the total number of goods in and out of warehouses by region and the total import and export of goods according to the domestic destination and source of goods to measure trade openness. (3) Amount of investment in fixed assets (fa). The amount of investment in fixed assets refers to the funds of total investment in fixed assets in the whole country by region. It represents the workload of the construction industry and the acquisition of fixed assets in currency. It is a comprehensive indicator that reflects the scale, speed, proportional relationship, and direction of the use of fixed asset investments.
To analyze the reliability of the above variables, Table 3 shows the descriptive statistical results. The mean value of the explained variable (high-quality development of the regional economy) is 0.3996, the maximum value is 1, and the minimum value is 0.0759, which indicates that the quality of economic development varies greatly among different provinces. The standard deviation of the logarithmically transformed core explanatory variable (environmental regulations) is 0.9609, the maximum value is 7.258, and the minimum value is 1.808, indicating that the intensity of environmental regulations varies greatly in different provinces. The standard deviations of the other explanatory variables are all large, indicating that different provinces have large differences in industrial structure, fixed asset investment, human capital levels, and openness to trade.
5. Analysis of Results
5.1. HDI Partition Analysis and Characteristics
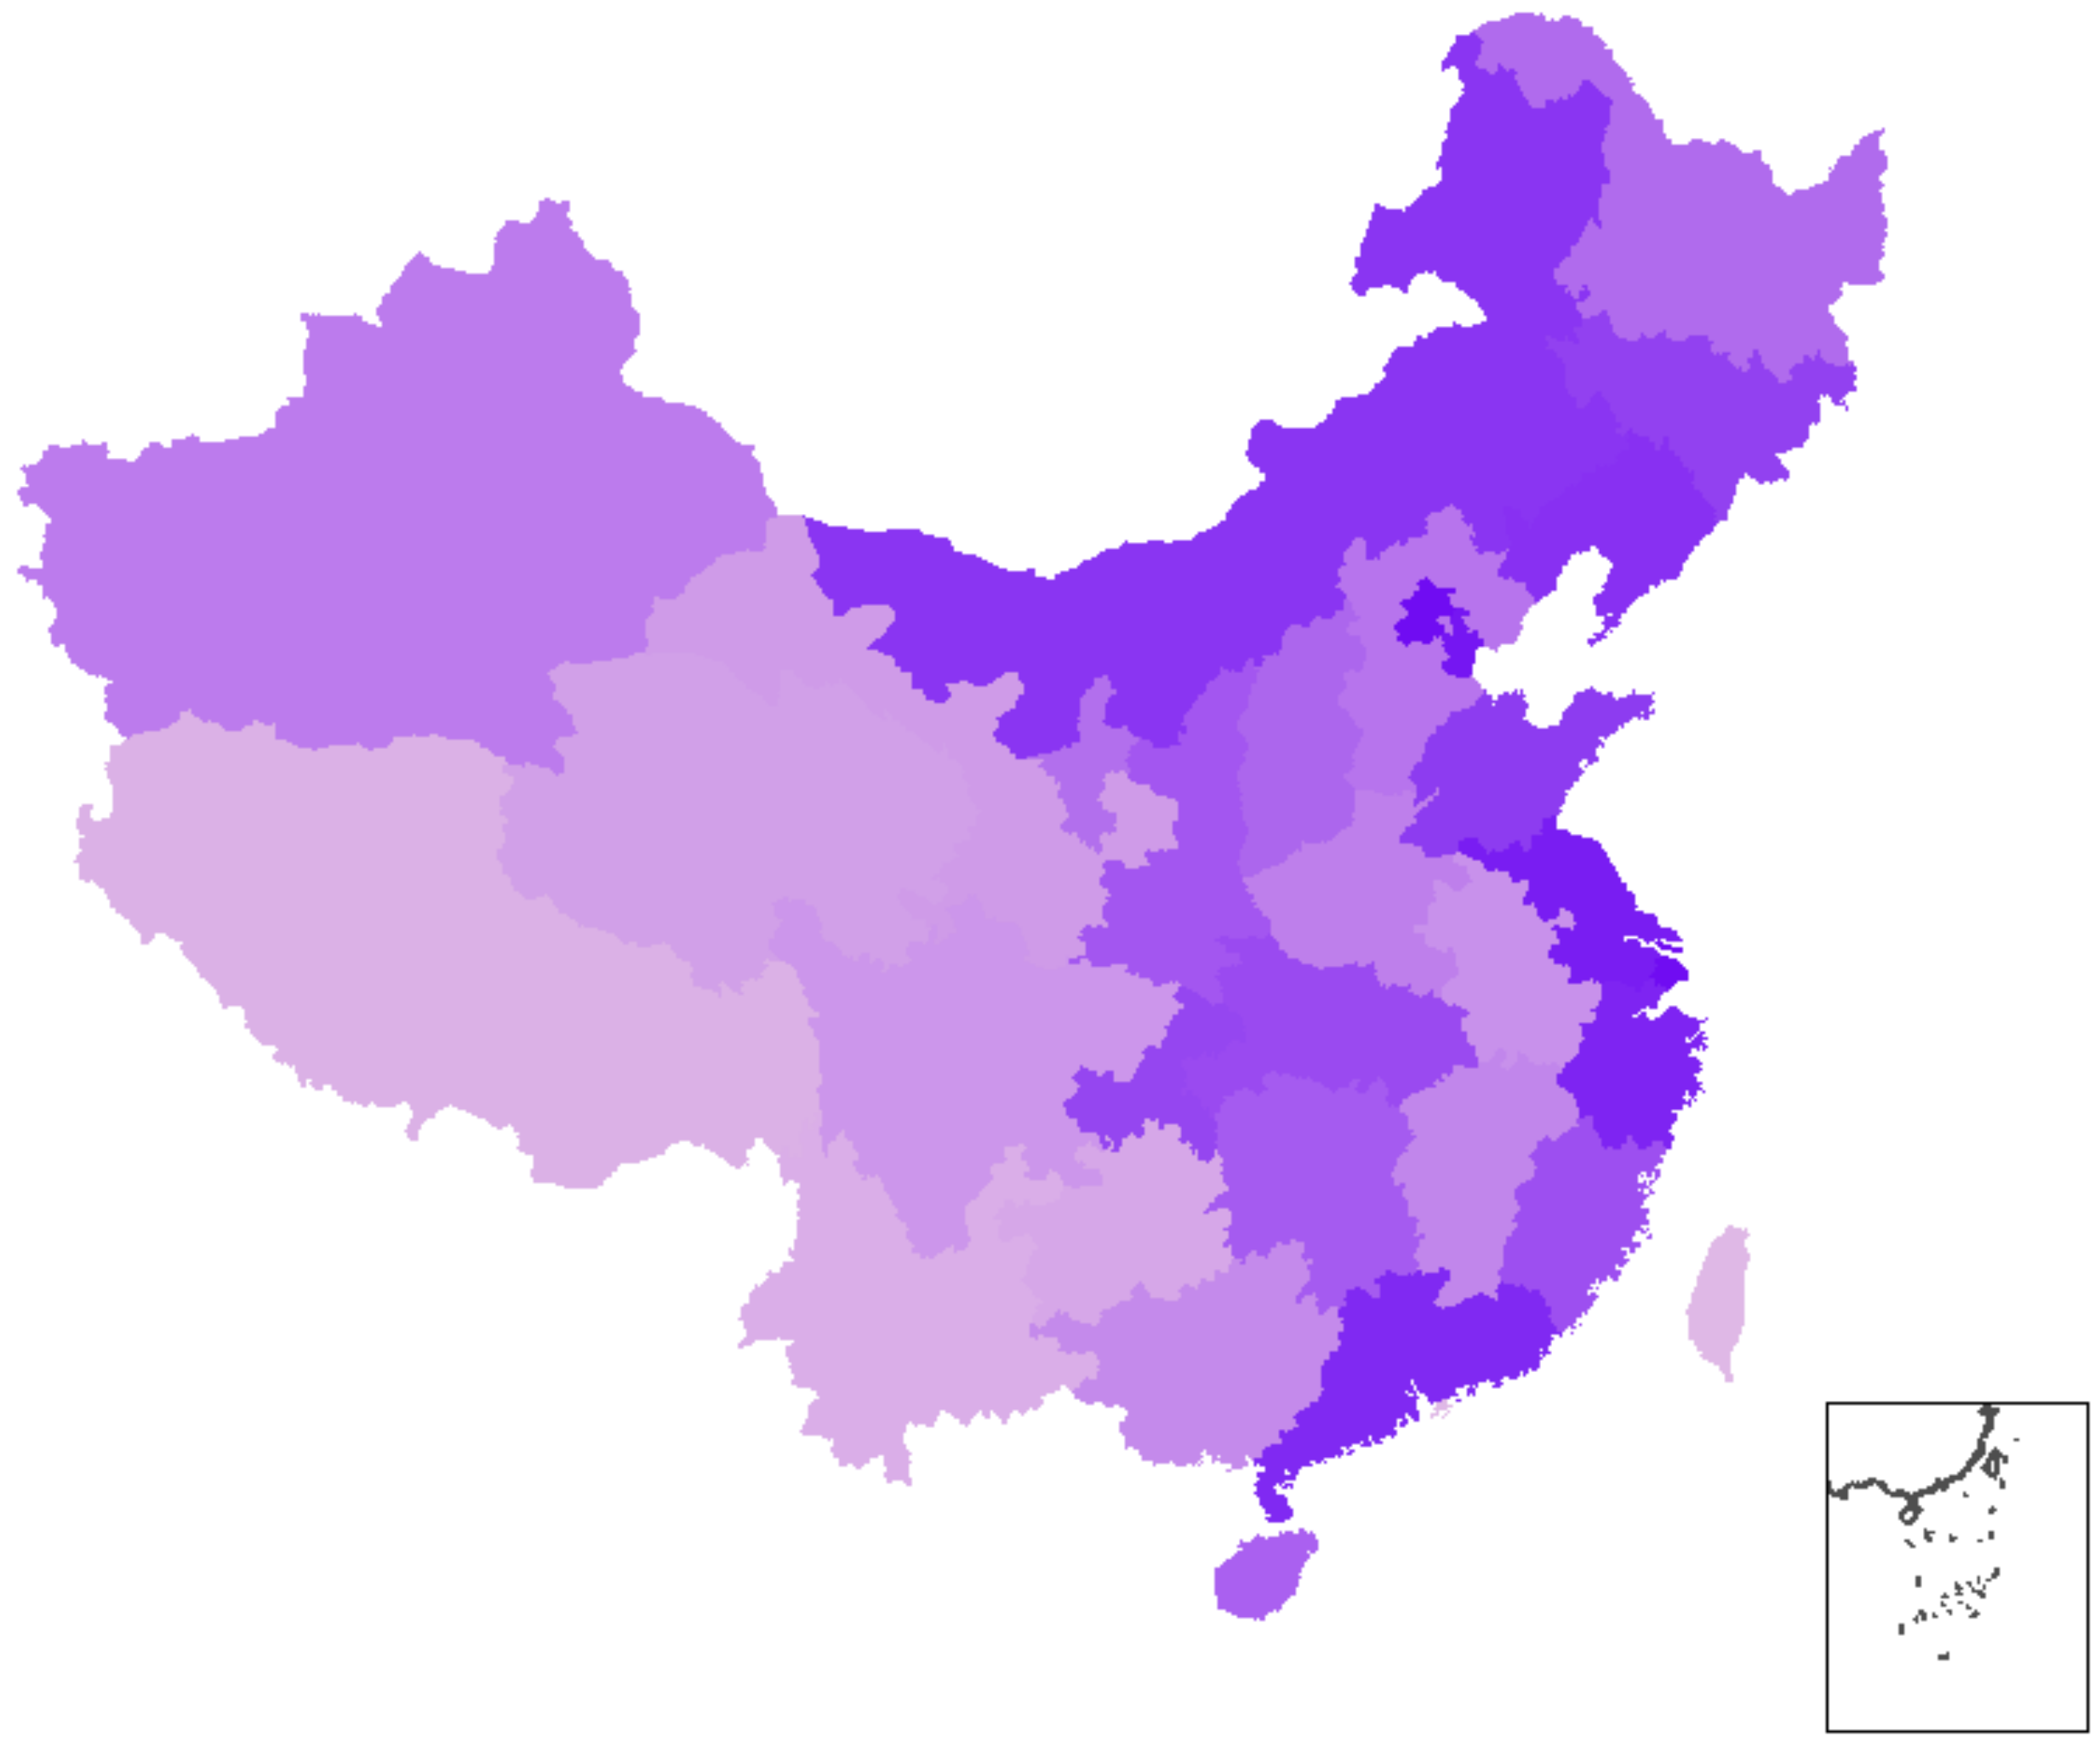
The human development index (HDI) is a comprehensive system of indicators proposed by the United Nations Development Programme (UNDP) to measure the level of economic and social development across countries. On the basis of the HDI for various regions in China in 2017, we used ArcGIS to draw a map. As shown in Figure 1, the darker the color, the greater the HDI. Figure 1 reports the 2017 HDI rankings for each region in mainland China. These HDI values are the comprehensive result of environmental regulations and economic development over a total of 12 years from 2006 to 2017. We find that environmental regulations and the quality of regional economic development are relatively high in regions with an HDI above the national average HDI, and the distribution of HDI values across above average regions is more homogeneous. This may be due to a better economic foundation in regions above the national average HDI. The competition between localities indicates a benign competition model in which the environment is first and the economy is second. Environmental protection and high-quality economic development can occur together in a win-win situation. The environmental regulations and quality of regional economic development are relatively low in regions below the national average HDI, and there are large deviations in HDI values across regions. This may be due to the relative underdevelopment in regions below the national average HDI, and there is wide variation in development between regions. The competition between localities indicates a bottom-to-bottom competition model in which the economy is first and the environment is second. For example, Hebei Province and Henan Province have economies that are mainly driven by polluting industries, which have a great impact on the environment, so the intensity of environmental regulations is also greater. On the other hand, due to its geographical features, Tibet has fewer polluting enterprises, a better ecological environment, and less investment in environmental governance, so the level of intensity of its environmental regulations is relatively low.
5.1.1. Comparison Based on the HDI Partition
Before processing the panel data, the fundamental question is whether to use a fixed effects model or a random effects model. First, we set the null hypothesis. According to the results of Hausmann’s test, all of the data reject the null hypothesis, that is, the mean, reject random effects, and accept fixed effects. In addition, the development of different regions in China is uneven. Due to the different factor endowments in different regions, including the influence of other unobservable factors, the quality of economic development varies greatly, which also shows that the fixed effects model is more suitable. Therefore, we used the fixed effects model in the empirical evidence. Table 4 shows the impact of environmental regulations on the quality of economic development based on different HDI zones. Columns 1–2 present the empirical results when the cross-term conditions are not included, and columns 3–4 present the empirical results for the impact of environmental regulations on the quality of economic development when the cross-term conditions of the industrial structure are introduced. This paper proceeds to conduct a detailed analysis of the empirical results.
From the empirical results, we will find that the same intensity of environmental regulation is more effective in regions lower than the national average HDI. Combined with the environmental Kuznets curve (EKC), this shows that the current environmental regulation intensity has not reached the critical point and needs to be further increased.
5.1.2. Analysis of the Results for Provinces with HDI Values above the National Average
The adjusted goodness-of-fit (Adj R-sq) is a correlation coefficient that reflects the degree of model fit, and deducts the influence of the number of included terms in the regression equation. From Table 4, it can be seen that the degree of fit is better in regions with higher than the national HDI, with a value of Adj R-sq close to 1. In comparison, the two models have a fair degree of fit in regions with lower than the national average HDI. The first column in Table 4 shows that environmental regulations in regions with an HDI above the national average HDI have a positive impact on the quality of regional economic development, with a coefficient of 0.0171. This shows that in provinces with a higher than average HDI, strengthening the intensity of environmental regulations can improve the quality of regional economic development and that high-quality development and environmental protection can coexist. However, this result is not statistically significant at the 10% level. This shows that when no cross-term conditions are included, the effect of environmental regulations is relatively small. This may be because the impact of environmental regulations on the quality of regional economic development is mainly exerted through intermediary factors, such as the industrial structure and foreign direct investment. The industrial structure has a positive effect on the quality of economic development, with a coefficient of 1.112, and it is significant at the 1% level. This shows that the industrial structure plays a significant role, and that optimizing and upgrading the industrial structure can greatly increase the speed of economic development. Other explanatory variables—the amount of fixed asset investment, the human capital level, and openness to trade—all have a positive impact on the quality of regional economic development. The volume of fixed asset investment is significantly positive at the 5% level, with a coefficient of 0.328, which indicates that the volume of fixed asset investment plays an important role in improving the quality of regional economic development. The level of human capital and trade openness are insignificant at the 10% level. The levels of human capital and trade openness in regions above the national average HDI have little impact on the high-quality development of the regional economy.
The third column in Table 4 shows the impact of environmental regulation in regions with HDI values above the national average on the quality of regional economic development estimated with cross-terms included. The cross-term between environmental regulations and the industrial structure has a negative effect on the quality of economic development in provinces with a higher than average HDI, with a coefficient of −0.1301. This result is not statistically significant at the 10% level. The reason may be that the intensity of environmental regulations is insufficient, which negatively impacts economic development. However, the cross-term between environmental regulations and the industrial structure has a positive impact on the quality of economic development in regions with HDI values above the national average, with a coefficient of 0.2798. This is significant at the 5% level. The reason is that environmental regulations affect the quality of economic development through the industrial structure, mainly due to the crowding-out mechanism and the growth in green barriers to entry. Environmental regulations have improved the efficiency of green innovation in industry, leading to industrial structure upgrades and improvements in the quality of economic development. Moreover, low efficiency and polluting enterprises are forced out of the industrial sector, and resources are concentrated in clean technology industries. Therefore, the higher the intensity of environmental regulation, the more obvious the positive effect of the cross-term between environmental regulation and industrial structure on economic development.
5.1.3. Analysis of the Results for Provinces with HDI Values below the National Average
The second column in Table 4 shows the empirical results of the estimation of the impact of environmental regulations on the quality of economic development in regions with an HDI below the national average, without the inclusion of the cross-terms. The results show that in regions with below average HDI values, environmental regulations have a positive impact on economic development, with a coefficient of 0.0182. This result is insignificant at the 10% level. In regions with below average HDI values, strengthening the intensity of environmental regulations does not improve the quality of regional economic development. This may be because regions with an HDI below the national average are relatively underdeveloped and there are large differences in regional development. In terms of economic development, the governments in these areas have fallen victim to the misconception of pollution first, treatment later. For the sake of economic growth, the government has sacrificed the environment, resulting in the inability of environmental protection and high-quality economic development to coexist. The amount of investment in fixed assets and the level of human capital have little effect on economic development. The industrial structure and openness to trade in regions with below average HDI values have a positive impact on economic development.
The fourth column in Table 4 shows empirical results of the estimation of the impact of environmental regulations on the quality of economic development in regions with HDI values that are below the national average, with cross-terms included. The results show that in regions with below average HDI values, environmental regulations have a negative impact on economic development, with an impact coefficient of −0.2125. This effect is greater in provinces with higher than average HDI values, and is significant at the 5% level. The coefficient on the cross-term with industrial structure is 0.5647, which is also significant at the 5% level. In addition, the cross-term has a positive impact on economic development, which is consistent with, and even greater than, the results for regions with an HDI above the national average.
5.2. Robustness Test
To confirm the reliability of the empirical results obtained above, this article conducts robustness tests both using the full sample and conducting the estimation with a substitute variable.
5.2.1. Full Sample Testing
Table 5 shows the results of the robustness test of the effect of environmental regulations on economic development quality using the full sample. The first column in Table 5 presents the results of the robustness test of the effect of environmental regulations on economic development quality without including the cross-term conditions. The second column in Table 5 presents the results of the robustness test of the effect of environmental regulations on economic development quality including the cross-term conditions. The first column in Table 5 shows that the impact of environmental regulations on the quality of economic development is not significant at the 10% level in the full sample, with a coefficient of 0.021. This shows that environmental regulation does not have a significantly positive effect on the quality of economic development, which is consistent with the empirical results for provinces with higher than average HDI values and regions with below average HDI values. Other explanatory variables, including industrial structure and trade openness, have a positive effect on the quality of economic development. The effect of the industrial structure is significantly positive at the 1% level, with a coefficient of 0.786, and that of human capital is significantly positive at the 1% level, with a coefficient of 0.0738. This is consistent with the results from the first and second columns of Table 4, which are for provinces with higher than average HDI values and provinces with below average HDI values, respectively. These results show that environmental regulation has not played a role in the governance of corporations, leading to insignificant optimization of the industrial structure. After the introduction of the cross-terms in the second column of Table 5, the full-sample empirical results show that environmental regulations have a negative impact on the quality of economic development. The impact of the cross-term with the industrial structure is positive and significant at the 1% level, which is consistent with the empirical results in the third and fourth columns in Table 4. The results listed in Table 5 are consistent with the results in Table 4, indicating that the results in Table 4 are highly robust.
5.2.2. Substitute Variable Test (GDP)
This article draws on Shiyi-Chen (2018) [51], who adopted labor productivity (GDP) to measure the quality of economic development. This provides an estimate of the effect of environmental regulations on a substitute for the explained variable. Table 6 reports the robustness test results from the estimation of the impact of environmental regulations on the quality of economic development as measured by the substitute variable. Columns 1–2 of Table 6 present the robustness test for the effect of environmental regulations on the quality of economic development when no cross-term is introduced and the estimation is conducted at the HDI zone level. Columns 3–4 of Table 6 present the robustness test results for the effect of environmental regulations on the quality of economic development when the cross-terms are introduced and the estimation is conducted at the HDI zone level.
The first column of Table 6 shows that environmental regulations in regions with above average HDI have a negative impact on the high-quality development of the regional economy, but this result is not significant at the 10% level. After introducing the cross-term with industrial structure, the results in the second column of Table 6 show that at the 5% level, the impact of environmental regulations on the quality of economic development is negative, with a coefficient of −2.3776. This is consistent with the results in Table 4, indicating that the model is robust.
The second column of Table 6 shows that environmental regulations in regions with below average HDI have a positive impact on the quality of regional economic development, but the effect is not significant. After introducing the cross-term with industrial structure, environmental regulation does have a significant impact, with a coefficient of −1.0116. In columns 3–4 of Table 6, the impact of the cross-term with industrial structure on the quality of economic development is significant and positive, with a coefficient of 4.1542 for provinces with HDI values lower than the national average and with a coefficient of 2.5427 for provinces with HDI values higher than the national average. This shows that the mechanism of technological innovation induced by environmental regulations promotes industrial upgrades, which in turn promotes high-quality regional economic development. This is consistent with the empirical results in columns 3−4 of Table 4. The results presented in Table 6 are consistent with the estimated results presented in Table 4, indicating that the results in Table 4 are highly robust.
6. Conclusions and Policy Recommendations
Based on theory and the institution of environmental regulations, this paper constructs a comprehensive index of regional economic development quality using the three dimensions of the economic development level, the stability of development, and the sustainability of development. We used panel data from 30 provinces as our research sample, classified them into regions with HDI values above the national average and regions with HDI values below the national average, and conducted a comparative study of their regional differences. We draw the following conclusions.
- (1)
- The same intensity of environmental regulations in regions with different HDI levels has different effects on the quality of economic development. The development of different provinces in China is extremely imbalanced. Limited by the influence of natural endowments and strategic positions, the economic development of the central and western regions is not as high as that of the eastern region. However, environmental regulations in provinces with above average HDI values and below average HDI values show the same trend in the quality of economic development. Moreover, the mediating effect of the industrial structure on environmental regulations is greater in areas with below average HDI values.
- (2)
- Environmental regulations in provinces with above average HDI values have a negative impact on the quality of regional economic development. The cross-term between environmental regulations and the industrial structure has a significantly positive impact on the quality of regional economic development. The mechanism underlying the effect of environmental regulations on the quality of economic development is mainly the transformation and upgrading of the industrial structure. Reasonable environmental regulations can motivate enterprises to transform and upgrade. Highly polluting enterprises are eliminated through the survival of the fittest mechanism, and social resources are transferred to clean technology industries. This promotes the transfer of resources from the primary and secondary industries to the tertiary industry, optimizes the industrial structure, and promotes high-quality economic development.
- (3)
- Environmental regulations in provinces with below average HDI values have a positive impact on the quality of regional economic development, but the effect is not significant at the 10% level. This shows that environmental regulations play a minor role in determining economic development quality. After the introduction of the cross-terms, environmental regulations and industrial structure are found to have a negative impact on the quality of regional economic development. Cross-terms between environmental regulation and industrial structure have a significantly positive impact on the quality of regional economic development. Moreover, the mediating effect of the industrial structure on environmental regulations is greater in low HDI regions than in high HDI regions. This shows that the mechanism underlying the effect of environmental regulations on high-quality economic development is the industrial structure. In addition, the current intensity of environmental regulations is insufficient, and the intensity of environmental regulations should be increased.
In the process of economic development, with the endless emergence of environmental problems, the upgrading of the industrial structure has gradually become an effective means of coordinating environmental protection and economic growth. This article discusses the intermediary role of industrial upgrading in the impact of environmental regulations on the quality of economic development, and proposes the following recommendations and policies based on this discussion.
- (1)
- Increase the intensity of environmental regulations by industry. The interaction between environmental regulation adjustment and industrial structure upgrading can promote high-quality economic development. However, the development of different industries is uneven, and the direction of industrial structure adjustment is also different. For example, the manufacturing industry needs to be adjusted from an extensive labor force development to a technology-intensive development. Therefore, policymakers are required to refine environmental regulations by industry and adopt environmental regulations that are most suitable for the development of the industry. In addition, some high-polluting industries should formulate more stringent environmental regulations and policies to help the industry cross the inflection point of the U-shaped curve as soon as possible to promote high-quality economic development by optimization and upgrading of the industrial structure.
- (2)
- Local governments need to grasp the positive effects of environmental regulations on the upgrading of industrial structure, and guide healthy competition in environmental regulations among regions. Regional development in China is uneven, especially the economic development between the eastern and western parts of the country. Local governments must take into account the actual local conditions when formulating environmental regulations and policies. Regions above the national average HDI should sum up their experience, and regions below the national average HDI should strengthen environmental regulations. The local government should adjust measures to local conditions, tilt resources to green development industries, vigorously introduce technical talents, and gradually adjust the structure of pollution-intensive industries.
- (3)
- Actively play the role of green technological innovation in promoting the upgrading of industrial structure. Talent is the foundation of innovation. The Chinese government should vigorously cultivate high-level green innovative talents, continuously invest in green innovative technologies, and accelerate the advancement and rationalization of the industrial structure.
- (4)
- Improve public awareness of environmental protection. Environmental protection is not an individual’s business. It requires the economic participation of all sectors of society, and ordinary people are also an important part of that. As consumers, we resolutely refuse to purchase goods produced by highly polluting technologies. This can fundamentally increase the enthusiasm of enterprises and enhance their environmental responsibility. At the same time, the government also encourages institutional and technological innovation and strengthens the role of enterprises as the main body and main force of technological innovation.
This article only studies the mediating effect of the industrial structure. The mechanism of environmental regulation in the high-quality development of regional economy is complex, and the path is extensive. We only studied the mediating effect of industrial structure, which has certain limitations. In addition to upgrading the industrial structure, the technology spillover effect of FDI may also affect the high-quality development of the regional economy. In the future, we can study the effects of environmental regulation on the high-quality development of the regional economy when FDI, technological innovation, and other factors are used as intermediary variables at the same time. In addition, China’s digital economy has developed rapidly in recent years. For the next research direction, we can also consider the digital economy as an explained variable or mediating variable in the study of high-quality development of the regional economy.
Author Contributions
Conceptualization, L.C. and C.H.; methodology, W.Y. and L.C.; software, K.J. and C.H.; formal analysis, W.Y. and K.J.; resources, L.C.; data curation, L.C.; writing—original draft preparation, L.C. and C.H.; writing—review and editing, L.C., C.H., W.Y. and K.J.; supervision, W.Y. and K.J.; project administration, W.Y.; funding acquisition, L.C. All authors have read and agreed to the published version of the manuscript.
Funding
This research was funded by Science and Technology Project of Jiangxi Provincial Department of Education, grant number is GJJ191661.
Acknowledgments
We would like to express our gratitude to all those who helped us during the writing of this article. Our deepest gratitude goes first and foremost to Guoan-Xiao, for his constant encouragement and guidance.
Conflicts of Interest
The authors declare no conflict of interest.
References
- Tongbin, Z.; Qi, Z.; Qingquan, F. Research on Corporate Governance Motivation and Public Participation Externalities under Government Environmental Regulation. China Popul. Resour. Environ. 2017, 27, 36–43. (In Chinese) [Google Scholar]
- Burton, D.M.; Gomez, I.A.; Love, H.A. Environmental regulation cost and industry structure changes. Land Econ. 2011, 3, 545–557. [Google Scholar] [CrossRef]
- Chong, Z.; Qin, C.; Ye, X. Environmental regulation, economic network and sustainable growth of urban agglomerations in China. Sustainability 2016, 8, 467. [Google Scholar] [CrossRef] [Green Version]
- Eiadat, Y.; Kelly, A.; Roche, F.; Eyadat, H. Green and competitive? An empirical test of the mediating role of environmental innovation strategy. J. World Bus. 2008, 43, 131–145. [Google Scholar] [CrossRef]
- Jahanshahi, A.A.; Brem, A. Antecedents of corporate environmental commitments: Te role of customers. Int. J. Environ. Res. Public Health 2018, 15, 1191. [Google Scholar] [CrossRef] [Green Version]
- Gray, W.B.; Shadbegian, R.J. Plant vintage, technology, and environmental regulation. J. Environ. Econ. Manag. 2013, 46, 384–402. [Google Scholar] [CrossRef] [Green Version]
- Ling, L.I.; Feng, T.A.O. Selection of Optimal Environmental Regulation Intensity for Chinese Manufacturing Industry—Based on the Green TFP Perspective. China Ind. Econ. 2012, 5, 70–82. (In Chinese) [Google Scholar] [CrossRef]
- Pearce, D.W.; Turner, R.K. Economics of Natural Resources and the Environment; JHU Press: Baltimore, MD, USA, 1990. [Google Scholar]
- Papalia, R.B.; Bertarelli, S. Nonlinearities in economic growth and club convergence. Empir. Econ. 2013, 44, 1171–1202. [Google Scholar] [CrossRef]
- Telle, K.; Larsson, J.D.O. Environmental regulations hamper productivity growth? How accounting for improvements of plants’ environmental performance can change the conclusion. Ecol. Econ. 2007, 61, 438–445. [Google Scholar] [CrossRef]
- Van der Ploeg, R.; Withagen, C. Green growth, green paradox and the global economic crisis. Environ. Innov. Soc. Transit. 2013, 6, 116–119. [Google Scholar] [CrossRef]
- Shuai, S.; Fan, Z. Modeling the role of environmental regulations in regional green economy efficiency of China: Empirical evidence from super efficiency. J. Environ. Manag. 2020, 261, 110227. [Google Scholar] [CrossRef] [PubMed]
- Ge, T.; Li, J.; Sha, R.; Hao, X. Environmental regulations, financial constraints and export green-sophistication: Evidence from China’s enterprises. J. Clean. Product. 2020, 251, 119671. [Google Scholar] [CrossRef]
- Managi, S.; Kumar, P. Inclusive Wealth Report 2018; Taylor & Francis: London, UK, 2018. [Google Scholar]
- George, G.; McGahan, A.M.; Prabhu, J. Innovation for inclusive growth: Towards a theoretical framework and a research agenda. J. Manag. Stud. 2012, 49, 661–683. [Google Scholar] [CrossRef]
- Vellala, P.S.; Madala, M.K.; Chhattopadhyay, U. A theoretical model for inclusive economic growth in Indian context. Int. J. Hum. Soc. Sci. 2014, 4, 229–235. [Google Scholar]
- Oyinlola, M.A.; Adedeji, A.A.; Bolarinwa, M.O.; Olabisi, N. Governance, domestic resource mobilization, and inclusive growth in sub-Saharan Africa. Econ. Anal. Pol. 2020, 65, 68–88. [Google Scholar] [CrossRef]
- Jalles, J.T.; Mello, L.D. Cross-country evidence on the determinants of inclusive growth episodes. Rev. Dev. Econ. 2019, 23, 1818–1839. [Google Scholar] [CrossRef] [Green Version]
- Rajapaksa, D.; Islam, M.; Managi, S. Natural capital depletion: The impact of natural disasters on inclusive growth. Econ. Disasters Clim. Chang. 2017, 1, 233–244. [Google Scholar] [CrossRef]
- Grossman, G.M.; Kreuger, A.B. Economic growth and the environment. Q. J. Econ. 1995, 110, 353–377. [Google Scholar] [CrossRef] [Green Version]
- World Bank. World Development Report 1992: Development and Environment; China Financial and Economic Press: Beijing, China, 1992. [Google Scholar]
- Caruso, G.; Di Battista, T.; Gattone, S.A. A Micro-level Analysis of Regional Economic Activity through a PCA Approach. In Decision Economics: Complexity of Decisions and Decisions for Complexity. DECON 2019. Advances in Intelligent Systems and Computing, 1009; Bucciarelli, E., Chen, S.H., Corchado, J., Eds.; Springer: Cham, Switzerland, 2020. [Google Scholar] [CrossRef]
- D’Adamo, I.; Falcone, P.M.; Morone, P. A New Socio-economic Indicator to Measure the Performance of Bioeconomy Sectors in Europe. Ecol. Econ. 2020, 176, 106724. [Google Scholar] [CrossRef]
- Weitzman, M.L. Prices vs. quantities. Rev. Econ. Stud. 1974, 41, 477–491. [Google Scholar] [CrossRef]
- Xie, R.; Yuan, Y.; Huang, J. Different types of environmental regulations and heterogeneous influence on “green” productivity: Evidence from China. Ecol. Econ. 2017, 132, 104–112. [Google Scholar] [CrossRef]
- Hahn, R.W. The political economy of environmental regulation: Towards a unifying framework. Public Choice 1990, 65, 21–47. [Google Scholar] [CrossRef]
- Tietenberg, T.H.; Lewis, L. Environmental and Natural Resource Economics; Routledge: London, UK; New York, NY, USA, 2018. [Google Scholar]
- Hahn, R.W. Market power and transferable property rights. Q. J. Econ. 1984, 99, 753–765. [Google Scholar] [CrossRef]
- OECD. Guidelines for the Application of Environmental Economic Instruments; China Environmental Science Press: Beijing, China, 1994; pp. 12–13. [Google Scholar]
- Pigou, A.C. The Economics of Welfare; MacMillan: London, UK, 1920. [Google Scholar]
- Stavins, R.N. Market-Based Environmental Policies. Public Policies Environ. Prot. 2007, 2, 159–173. [Google Scholar]
- Levinson, A. Environmental regulations and industry location: International and domestic evidence. Fair Trade Harmon. Prerequisites Free Trade 1996, 1, 429–457. [Google Scholar]
- Antweiler, W.; Copeland, B.R.; Taylor, M.S. Is free trade good for the environment? American Econ. Rev. 2001, 91, 877–908. [Google Scholar] [CrossRef] [Green Version]
- Baoping, R.; Fengan, W. Judgment criteria, determinants and realization methods of China’s high-quality development in the new era. Reform 2018, 4, 5–16. (In Chinese) [Google Scholar]
- Hong, Z. Research on the Quality Measurement of the Economic Development of the Yangtze River Economic Zone; China University of Geosciences: Wuhan, China, 2015. (In Chinese) [Google Scholar]
- Xiurui, X.; Gang, W.; Xiaoan, Z.; Jianguo, S.; Deyong, S. Research advances in assessment of green GDP indicator. Chinese J. Ecol. 2007, 26, 1107–1113. (In Chinese) [Google Scholar]
- Taosheng, S.; Jinbin, W. On the integration between ecology and economics based on sustainable development. Econ. Surv. 2001, 18, 13–15. (In Chinese) [Google Scholar]
- Anderson, V. Alternative Economic Indicators; Rutledge: London, UK, 1991. [Google Scholar]
- Study Group on Sustainable Development, Chinese Academy of Sciences. 1999 Report on China’s Sustainable Development Strategy; Science Press: Beijing, China, 1999. (In Chinese) [Google Scholar]
- Gorgij, A.D.; Kisi, O.; Moghaddam, A.A.; Taghipour, A. Groundwater quality ranking for drinking purposes, using the entropy method and the spatial autocorrelation index. Environ. Earth Sci. 2017, 76, 269. [Google Scholar] [CrossRef]
- Li, X.G.; Wei, X.; Huang, Q. Comprehensive entropy weight observability-controllability risk analysis and its application to water resource decision-making. Water SA 2012, 38, 573–579. [Google Scholar] [CrossRef] [Green Version]
- Dong, G.; Shen, J.; Jia, Y.; Sun, F. Comprehensive evaluation of water resource security: Case study from Luoyang City, China. Water 2018, 10, 1106. [Google Scholar] [CrossRef]
- Liu, L.; Zhou, J.; An, X.; Zhang, Y.; Yang, L. Using fuzzy theory and information entropy for water quality assessment in Three Gorges region, China. Expert Syst. Appl. 2010, 37, 2517–2521. [Google Scholar] [CrossRef]
- Amiri, V.; Rezaei, M.; Sohrabi, N. Groundwater quality assessment using entropy weighted water quality index (EWQI) in Lenjanat, Iran. Environ. Earth Sci. 2014, 72, 3479–3490. [Google Scholar] [CrossRef]
- Bartzokas, A.; Yarime, M. Technology Trends in Pollution-Intensive Industries: A Review of Sectoral Trends; No 1997-06; UNU-INTECH Discussion Paper Series; United Nations University-INTECH, USE: Tokyo, Japan, 1997. [Google Scholar]
- Shi, B.; Ren, B. Measurement and analysis of the high-quality development of China’s inter-provincial economy. Econ. Issues 2018, 4, 1–6. (In Chinese) [Google Scholar]
- Levinson, A. Environmental regulation and manufacturers’ location choices: Evidence from the census of manufactures. J. Public Econ. 1996, 62, 5–29. [Google Scholar] [CrossRef]
- Liu, Y.; Xiong, Y. The Impact of Environmental Regulation on the Quality of Regional Economic Development—Based on the Comparison of HDI Regions. Econ. Survey 2020, 37, 1–10. [Google Scholar]
- Li, T. Environmental Regulation, Service Industry Development and the Industrial Structure Adjustment in China. Econ. Manag. 2013, 35, 1–10. (In Chinese) [Google Scholar]
- Zeng, Q.; Zeng, X.; Liu, J. The Impact of Environmental Regulation Tools on Environmental Quality from the Perspective of Industrial Structure. Econ. Survey 2018, 35, 94–100. (In Chinese) [Google Scholar]
- Chen, S.; Chen, D. Haze pollution, government governance and high-quality economic development. Econ. Res. 2018, 2, 20–34. [Google Scholar]
Figure 1.
HDI ranking of Chinese provinces in 2017.

Table 1.
Selection of indicators for the high-quality development of the regional economy.
| Explained Variable | Level 1 Indicators | Level 2 Indicators | Unit | Indicator Attributes |
|---|---|---|---|---|
| High-quality development of regional economy (hqd) | Level of economic development (le) | Logarithm of GDP per capita (y1) | / | Positive index |
| Stability of economic development (st) | CPI (y2) | % | Reverse indicator | |
| Urban registered unemployment rate (y3) | % | Reverse indicator | ||
| Sustainability of economic development (su) | Green coverage rate of built-up area (y4) | % | Positive index | |
| Per capita public green area (y5) | % | Positive index | ||
| Pollution intensity (y6) | M2/person | Reverse indicator |
Table 2.
The high-quality development of regional economic in China’s provinces from 2006 to 2017.
| 2006 | 2007 | 2008 | 2010 | 2011 | 2012 | 2013 | 2014 | 2015 | 2016 | 2017 | |
|---|---|---|---|---|---|---|---|---|---|---|---|
| Beijing | 0.68 | 0.63 | 0.67 | 0.89 | 0.86 | 0.91 | 1.00 | 0.95 | 0.97 | 1.00 | 1.00 |
| Tianjin | 0.23 | 0.23 | 0.24 | 0.26 | 0.28 | 0.30 | 0.30 | 0.32 | 0.35 | 0.39 | 0.44 |
| Hebei | 0.22 | 0.24 | 0.26 | 0.32 | 0.32 | 0.33 | 0.35 | 0.37 | 0.40 | 0.44 | 0.47 |
| Shanxi | 0.20 | 0.22 | 0.25 | 0.27 | 0.31 | 0.31 | 0.32 | 0.34 | 0.37 | 0.40 | 0.49 |
| Inner Mongolia | 0.24 | 0.26 | 0.27 | 0.33 | 0.34 | 0.39 | 0.39 | 0.43 | 0.45 | 0.49 | 0.51 |
| Liaoning | 0.31 | 0.36 | 0.40 | 0.46 | 0.45 | 0.50 | 0.52 | 0.52 | 0.53 | 0.51 | 0.56 |
| Jilin | 0.26 | 0.27 | 0.29 | 0.33 | 0.33 | 0.33 | 0.33 | 0.38 | 0.39 | 0.43 | 0.44 |
| Heilongjiang | 0.29 | 1.00 | 0.37 | 0.41 | 0.41 | 0.41 | 0.42 | 0.43 | 0.44 | 0.47 | 0.49 |
| Shanghai | 0.27 | 0.28 | 0.31 | 0.57 | 0.56 | 0.59 | 0.57 | 0.57 | 0.57 | 0.61 | 0.69 |
| Jiangsu | 0.43 | 0.48 | 0.50 | 0.55 | 0.57 | 0.59 | 0.62 | 0.64 | 0.65 | 0.67 | 1.00 |
| Zhejiang | 0.23 | 0.25 | 0.27 | 0.30 | 0.38 | 0.44 | 0.46 | 0.49 | 0.51 | 0.56 | 0.58 |
| Anhui | 0.35 | 0.33 | 0.35 | 0.40 | 0.42 | 0.44 | 0.46 | 0.48 | 0.50 | 0.53 | 0.57 |
| Fujian | 0.14 | 0.14 | 0.18 | 0.23 | 0.21 | 0.29 | 0.30 | 0.32 | 0.35 | 0.41 | 0.42 |
| Jiangxi | 0.19 | 0.22 | 0.24 | 0.30 | 0.32 | 0.34 | 0.34 | 0.36 | 0.34 | 0.34 | 0.47 |
| Shandong | 0.41 | 0.43 | 0.43 | 0.47 | 0.49 | 0.53 | 0.56 | 0.57 | 0.57 | 0.59 | 0.62 |
| Henan | 0.22 | 0.24 | 0.27 | 0.28 | 0.30 | 0.34 | 0.35 | 0.38 | 0.39 | 0.50 | 0.53 |
| Hubei | 0.23 | 0.24 | 0.27 | 0.30 | 0.30 | 0.36 | 0.38 | 0.42 | 0.46 | 0.52 | 0.53 |
| Hunan | 0.19 | 0.21 | 0.23 | 0.25 | 0.26 | 0.27 | 0.29 | 0.32 | 0.35 | 0.41 | 0.46 |
| Guangdong | 0.57 | 0.62 | 0.72 | 0.82 | 0.81 | 0.81 | 0.86 | 0.86 | 0.89 | 0.98 | 1.00 |
| Guangxi | 0.23 | 0.21 | 0.21 | 0.25 | 0.32 | 0.32 | 0.37 | 0.42 | 0.47 | 0.52 | 0.58 |
| Hainan | 0.17 | 0.83 | 0.86 | 1.00 | 0.87 | 0.72 | 0.45 | 0.33 | 0.43 | 0.64 | 1.00 |
| Chongqing | 0.11 | 0.17 | 0.21 | 0.32 | 0.38 | 0.42 | 0.19 | 0.42 | 0.43 | 0.47 | 0.51 |
| Sichuan | 0.25 | 0.25 | 0.26 | 0.35 | 0.39 | 0.43 | 0.17 | 0.43 | 0.44 | 0.49 | 0.53 |
| Guizhou | 0.32 | 0.33 | 0.34 | 0.34 | 0.32 | 0.34 | 0.18 | 0.34 | 0.36 | 0.44 | 0.46 |
| Yunnan | 0.15 | 0.18 | 0.21 | 0.29 | 0.27 | 0.31 | 0.31 | 0.33 | 0.33 | 0.35 | 0.44 |
| Shanxi | 0.20 | 0.20 | 0.20 | 0.24 | 0.27 | 0.32 | 0.35 | 0.36 | 0.44 | 0.46 | 0.49 |
| Gansu | 0.16 | 0.19 | 0.21 | 0.23 | 0.23 | 0.27 | 0.30 | 0.32 | 0.34 | 0.39 | 0.41 |
| Qinghai | 0.08 | 0.08 | 0.08 | 0.08 | 0.10 | 0.10 | 0.12 | 0.13 | 0.14 | 0.15 | 0.16 |
| Ningxia | 0.14 | 0.18 | 0.20 | 0.23 | 0.25 | 0.28 | 0.30 | 0.32 | 0.32 | 0.37 | 0.39 |
| Xinjiang | 0.24 | 0.33 | 0.33 | 0.37 | 0.39 | 0.40 | 0.41 | 0.44 | 0.47 | 0.57 | 0.59 |
Data source: Calculated based on data from the China Statistical Yearbook, China Environmental Statistical Yearbook, China Environmental Yearbook, China Industrial Economic Statistical Yearbook, and China Science and Technology Statistical Yearbook. Among them, per capita GDP, CPI, urban registered unemployment rate, green coverage rate in built-up areas, and per capita public green area are derived from the yearbook, and the pollution intensity is calculated by the entropy weight method.
Table 3.
Descriptive statistical analysis.
| Variables | Sample Size | Mean | Standard Deviation | Min. Value | Max. Value |
|---|---|---|---|---|---|
| hqd | 360 | 0.3996 | 0.193 | 0.0759 | 1 |
| lner | 360 | 5.004 | 0.9609 | 1.808 | 7.258 |
| is | 360 | 0.4255 | 0.0916 | 0.286 | 0.806 |
| fa | 360 | 9.04 | 0.9555 | 5.966 | 10.919 |
| edu | 360 | 8.696 | 0.9039 | 6.6 | 11.6 |
| lnimex | 360 | 5.792 | 1.6135 | 1.504 | 9.458 |
Table 4.
Estimation results for the effect of environmental regulations on the quality of economic development based on HDI zones.
Table 4.
Estimation results for the effect of environmental regulations on the quality of economic development based on HDI zones.
| Independent Variables | Dependent Variable (hqd) | |||
|---|---|---|---|---|
| No Cross Term Introduced | No Cross Term Introduced | Introduce Cross Terms | Introduce Cross Terms | |
| Provinces with Higher than the National Average HDI | Provinces with Lower than the National Average HDI | Provinces with Higher than the National Average HDI | Provinces with Lower than the National Average HDI | |
| lner | 0.0171 (0.89) | 0.0182 (0.39) | −0.1301 ** (−2.17) | −0.2125 ** (−2.56) |
| is | 1.112 *** (5.83) | 0.4583 *** (3.56) | −0.5109 (−0.88) | −2.393 * (−1.74) |
| fa | 0.328 ** (1.98) | −0.0413 (1.36) | 0.0594 ** (1.99) | 0.053 *** (2.68) |
| edu | 0.0267 (0.51) | −0.0345 (−0.77) | 0.0182 *** (3.33) | −0.0185 (−0.48) |
| lnimex | 0.0796 (1.32) | 0.0715 *** (4.16) | 0.0859 (1.37) | 0.0616 (0.8) |
| lner×is | - | - | 0.2798 *** (2.95) | 0.5647 ** (2.14) |
| Constant Term | −1.256 *** (−6.12) | −0.3697 (−1.03) | −0.622 ** (−2.21) | 0.6063 (0.87) |
| Sample Size | 108 | 252 | 108 | 252 |
| Province | 9 | 21 | 9 | 21 |
| Method | FE | FE | FE | FE |
| Adj R-sq | 0.8754 | 0.3501 | 0.8841 | 0.3671 |
Note: *, **, and *** indicate significance levels of 10%, 5%, and 1%, respectively, with standard errors in parentheses.
Table 5.
Estimated results for the effect of environmental regulation on the quality of economic development (full sample robustness test).
Table 5.
Estimated results for the effect of environmental regulation on the quality of economic development (full sample robustness test).
| Independent Variables | Dependent Variable (hqd) | |
|---|---|---|
| No Cross-Term Introduced | Introduce Cross-Terms | |
| lner | 0.021 (0.72) | −0.1796 *** (−4.32) |
| is | 0.786 *** (5.57) | −1.594 ** (−2.52) |
| fa | 0.0164 (0.71) | 0.0546 *** (3.64) |
| edu | 0.0087 (0.26) | 0.0007 (0.02) |
| lnimex | 0.0738 *** (4.00) | 0.067 *** (3.98) |
| lner×is | - | 0.4356 *** (4.03) |
| Constant Term | −0.6911 *** (−2.74) | 0.1533 (0.4) |
| Sample Size | 360 | 360 |
| Province | 30 | 30 |
| Method | FE | FE |
Note: **, and *** indicate the significance levels of 10%, 5%, and 1%, respectively, with standard errors in parentheses.
Table 6.
Estimation results for the effect of environmental regulations on the quality of economic development (robustness test with a substitute variable).
Table 6.
Estimation results for the effect of environmental regulations on the quality of economic development (robustness test with a substitute variable).
| Independent Variables | Replace Dependent Variable (hqd) | |||
|---|---|---|---|---|
| No Cross-Term Introduced | No Cross-Term Introduced | Introduce Cross-Terms | Introduce Cross-Terms | |
| Provinces with Higher than the National Average HDI | Provinces with Lower than the National Average HDI | Provinces with Higher than the National Average HDI | Provinces with Lower than the National Average HDI | |
| lner | −1.912 (−0.86) | 2.72.4 (0.22) | −2.3776 ** (−2.24) | −1.0116 ** (−2.24) |
| is | 8.5171 ** (3.30) | 2.2220 *** (2.67) | −1.55776 (−1.19) | −1.06194 ** (−1.97) |
| fa | 1.0911 ** (2.20) | 3.484 ** (2.00) | 1.4871 *** (3.77) | 4.008 *** (2.64) |
| edu | 6.565 (1.01) | −1.854 (−0.88) | 5.311 (0.98) | −1.133 (−0.54) |
| lnimex | 7.136 (1.05) | 5.953 *** (4.39) | 8.067 (1.60) | 5.510 *** (3.83) |
| lner×is | - | - | 4.1542 * (1.88) | 2.5427 ** (2.34) |
| Constant Term | −2.19494 *** (−4.47) | 1.3546 *** (−3.19) | −1.25338 ** (−2.42) | 7.88.1 (0.04) |
| Sample Size | 108 | 252 | 108 | 252 |
| Province | 9 | 21 | 9 | 21 |
| Method | FE | FE | FE | FE |
Note: *, **, and *** indicate significance levels of 10%, 5%, and 1%, respectively, with standard errors in parentheses.
Publisher’s Note: MDPI stays neutral with regard to jurisdictional claims in published maps and institutional affiliations. |
© 2020 by the authors. Licensee MDPI, Basel, Switzerland. This article is an open access article distributed under the terms and conditions of the Creative Commons Attribution (CC BY) license (http://creativecommons.org/licenses/by/4.0/).
Share and Cite
MDPI and ACS Style
Chen, L.; Ye, W.; Huo, C.; James, K. Environmental Regulations, the Industrial Structure, and High-Quality Regional Economic Development: Evidence from China. Land 2020, 9, 517. https://doi.org/10.3390/land9120517
AMA Style
Chen L, Ye W, Huo C, James K. Environmental Regulations, the Industrial Structure, and High-Quality Regional Economic Development: Evidence from China. Land. 2020; 9(12):517. https://doi.org/10.3390/land9120517
Chicago/Turabian StyleChen, Lingming, Wenzhong Ye, Congjia Huo, and Kieran James. 2020. "Environmental Regulations, the Industrial Structure, and High-Quality Regional Economic Development: Evidence from China" Land 9, no. 12: 517. https://doi.org/10.3390/land9120517
Note that from the first issue of 2016, this journal uses article numbers instead of page numbers. See further details here.