Article

In the Search of an Assessment Method for Urban Landscape Objects (ULOs): Tangible and Intangible Values, Public Participation Geographic Information Systems (PPGIS), and Ranking Approach

by
Barbara Sowińska-Świerkosz
1,
Malwina Michalik-Śnieżek
2,*,
Dawid Soszyński
3 and
Agnieszka Kułak
3
1
Department of Hydrobiology and Ecosystems Protections, University of Life Sciences in Lublin, Dobrzańskiego 37, 20-262 Lublin, Poland
2
Department of Grassland and Landscape Shaping, University of Life Sciences in Lublin, u. Akademicka 13, 20-950 Lublin, Poland
3
Institute of Landscape Architecture, The John Paul II Catholic University of Lublin, Konstantynów 1H, 20-708 Lublin, Poland
*
Author to whom correspondence should be addressed.
Land 2020, 9(12), 502; https://doi.org/10.3390/land9120502
Submission received: 14 November 2020 / Revised: 2 December 2020 / Accepted: 4 December 2020 / Published: 8 December 2020
(This article belongs to the Section Urban Contexts and Urban-Rural Interactions)

Abstract

:
The effective assessment of urban space must link subjective and objective approaches. The main aim of the paper was to develop and test such a method of assessment in relation to one of the elements of the urban landscape called urban landscape objects (ULOs). The tested method fulfils the following requirements: (1) merges social and expert opinions, (2) analyzes diverse characteristics of urban space, (3) quantitatively presents the results of values assessments, and (4) features the simplicity of structure and ease of public understanding. The method was tested in relation to 34 ULOs located in three different functional sites within Lublin city (Poland). The result enables authors to answer three research questions: (1) How do people perceive ULOs located in different sites? (2) What kinds of tangible values possess different ULOs and how can they be expressed? (3) How can intangible and tangible values be merged? The general finding of the study showed that the Old Town features the highest ranked position in terms of all the values (mean aggregation index (A) ULOs = 0.64), together with the higher share of the most appreciated ULOs, whereas the Lagoon features the lowest ranked position (mean AULOs = 0.35), also statistically comparable with the Campus (mean AULOs = 0.45).

1. Introduction

Europe is among the world’s most urbanized regions, with approximately 73% of Europeans living in urban areas, a figure expected to increase to 80% in 2050 [1]. However, despite such a large population growth in cities, it is expected that they will provide a decent quality of life and contribute to improving people’s wellbeing. The valuation of the urban landscape as a main element in the quality of life is crucial from the point of view of spatial planning processes in cities, which should be consistent with the concept of sustainable development, especially in terms of preserving cultural landscapes, as well as directing and harmonizing its changes resulting from social, economic, and environmental processes. This valuation should simultaneously draw upon social impact assessments, by involving the community in decision-making processes [2,3].
In connection with the need to assess urban areas and their role in creating the wellbeing of urban residents and the comfort of urban space users, many authors have attempted to develop and test methods for assessing urban spaces. These methods differ mainly from the point of view of the type of assessed urban space. Some of them refer to the assessment of urban landscapes [4,5,6], while other methods are focused on assessing the urban environment [7,8]; furthermore, others investigate green urban infrastructure [9,10,11]. Differentiation can also be seen in the elements under assessment, including visual quality of the urban environment [12,13] and urban ecosystem services [14,15,16], as well as in relation to intangible ecosystem services such as cultural ecosystem services (CES) [17,18]. Regarding the similarities, most authors agree that consideration of the opinion of different stakeholders and the illusion of different driving factors and structural, functional, and social indicators are crucial for the elaboration of effective assessment methods.
To date, many publications have been provided in which the authors take up the problem of assessing urban spaces. These assessments are based on two types of approaches: (1) objective (expert), using specialists’ knowledge and experiences, as well as mathematical techniques and data, recently related mainly to the use of geographic information systems (GIS), or (2) subjective, based on the individual feelings of city dwellers. Among the various objective methods mentioned is the visual protection surface (VPS), allowing the exploration of geometrical relationships between the scope of visual protection of the city and the maximum heights of new buildings [19]. GIS analysis, on the other hand, is based on the use of landscape metrics as a tool of describing, quantifying, and monitoring the spatial configuration of urbanization at landscape levels [20,21,22], as well as the multifactor analysis of cities’ landscape quality based on the use of spatial, ecological, cultural, and visual indicators [23]. These methods are based on the use of a wide range of indicators, both qualitative and quantitative, providing the possibility of an objective presentation of various characteristics of urban space. Even these methods, however, are not wholly objective as they require the participation of an expert who will properly interpret the results.
Methods based on the subjective approach most often relate to the issue of the quality of life and visual assessment of the urban landscape. One of the first and most important methods of this type was published by Kevin Lynch in his work “The image of the city” [24]. The author analyzed the visual quality of American cities by studying their citizens’ mental image, while, in another publication, he synthesized urban quality according to five main aspects defined from citizens’ point of view: vitality, sense, fit, access, and control [25]. It should be emphasized that city image can be different in different stakeholders’ visions, such as the local community and visitors. This was proven by papers in relation to different countries [26,27,28]. Currently, the most common methods for carrying out this type of assessment are questionnaires and survey campaigns. The structure and form of questionnaires vary greatly in their different approaches to evaluation. Some use willingness-to-pay and willingness-to-accept questions [29], while others use preference questions or grades, i.e., 1–5. The increasingly common method of conducting surveys to obtain information about subjective feelings or preferences regarding space development is mapping spatial attributes [30], as well as geo-questionnaires [31]. These tools are also called public participation geographic information systems (PPGIS). If they are properly designed for lay users and selected for the problem at hand, they encourage the participation of inhabitants in the process of urban planning and help eliminate possible conflicts between particular groups of interest [32,33]. The geo-questionnaire provides information characterizing the respondents and their preferences. With the use of an interactive map, the respondent can use three types of objects, namely, point, line, and polygon, to mark the sites relevant to a given question. Moreover, the respondents can assess and determine the quality of a given place or object [33].
Describing urban landscapes in a comprehensive manner, however, requires the use of a wide range of approaches, methods, and indicators. The effective assessment of urban space must link the subjective and objective approaches; management practices must simultaneously consider the opinion and needs expressed by the general public and be supported by expert knowledge under existing institutional conditions. Using this approach, an integrated view of the urban space may be obtained as a complex ecological, cultural, social, and visual system [34]. Moreover, to have policy and management capability, a combination of social and expert opinions should feature the high applicability reflected by the simplicity of structure and ease of public understanding [35].
In this paper, the authors attempt to adopt such a method linking social and expert opinions in relation to one of the elements of urban space, called urban landscape objects (ULOs). These objects are partially understood as analogous to landmarks, defined as an external point of reference that helps orientation within a familiar or unfamiliar environment [36]. However, unlike landmarks, ULOs are treated only as objects physically located in the landscape, ignoring the features of these objects or symbols located on objects that can be treated as landmarks. In this study, ULOs are understood to be natural, seminatural, or anthropogenic objects that can be identified easily in the landscape. They represent visual, functional, and finite units which can be specified, such as a tree, rock, or fountain which can be named, such as the Blue Beach, the Main Square, or the National Museum. The assessment of ULOs is an important element in the analysis of urban spaces and is reflected in the planning of these spaces in accordance with the needs of residents and the requirements of sustainable development. The research conducted so far to assess urban landmarks most often concerned their visual aspects [37]. Taking into account their impact on the urban landscape quality, however, next to their aesthetic features, other values related to the intangible dimensions should be analyzed [34]. Such perceptual understanding of inter alia city landscape was emphasized in the “European Landscape Convention” [38] which has changed the concept of the landscape from the conventional meaning used by geographers and landscape ecologists to include the subjective dimension deriving from peoples’ perception [39]. Neglect of the this dimension can have serious implications, since, despite the adoption of an environmentally friendly and income-generating model of space management, aspects that are crucial for social coherence, such as a sense of belonging and local tradition, will not be taken into account [40]. Especially today, when the global trend in urban planning is moving toward smart city development, the illusion of intangible dimension is needed to create more effective integration of the changes within each urban community [41]. Moreover, material and nonmaterial values of city are not isolated; rather, they are intertwined and form a complex social–ecological system [29,42]. The assessment of these values should reflect not only the subjective feelings and preferences of the users of these objects, but also objective assessments that will not be affected by random assessment factors [34,43]. The merging of subjective and objective points of view would provide alternative ways of seeing the same object in different contexts [44], thus presenting an image of a city in a comprehensive manner [45].
As such, the main aim of the paper was to develop and test a method of ULO assessment which fulfils the following requirements: (1) merges social and expert opinions; (2) analyzes diverse characteristics of urban space, including aesthetic, symbolic, educational, spiritual, entertainment, enjoyment, heritage, and universal values; (3) quantitatively presents the result of value assessments enabling comparisons among different types of sites, objects, and values; (4) features the simplicity of structure and ease of public understanding.
The method, based on the integration of the objective and subjective approaches in landscape assessment, was tested in relation to Polish conditions because of a few reasons. Firstly, the state of social dialogue and the level of public participation in all parts of Poland are low. Polish law allows for participation in urban planning procedures, but not everyone wants to exercise this right. This is due to the weakness of the nongovernmental organization (NGO) sector, inadequate local planning information sources, and low activity of local communities [46,47]. In all polish cities and communes, meetings and workshops where the opinions of residents are collected are usually organized in a specific place and time; thus, not everyone can participate in them. Our method allows collecting opinions and evaluations via the Internet. Therefore, all social groups can express their opinion. The presented method was used in relation to the city of Lublin (eastern Poland, Lubelskie voivodeship), but it can also be applied to other cities in Poland and other parts of the world with similar problems of low social involvement.

2. Materials and Methods
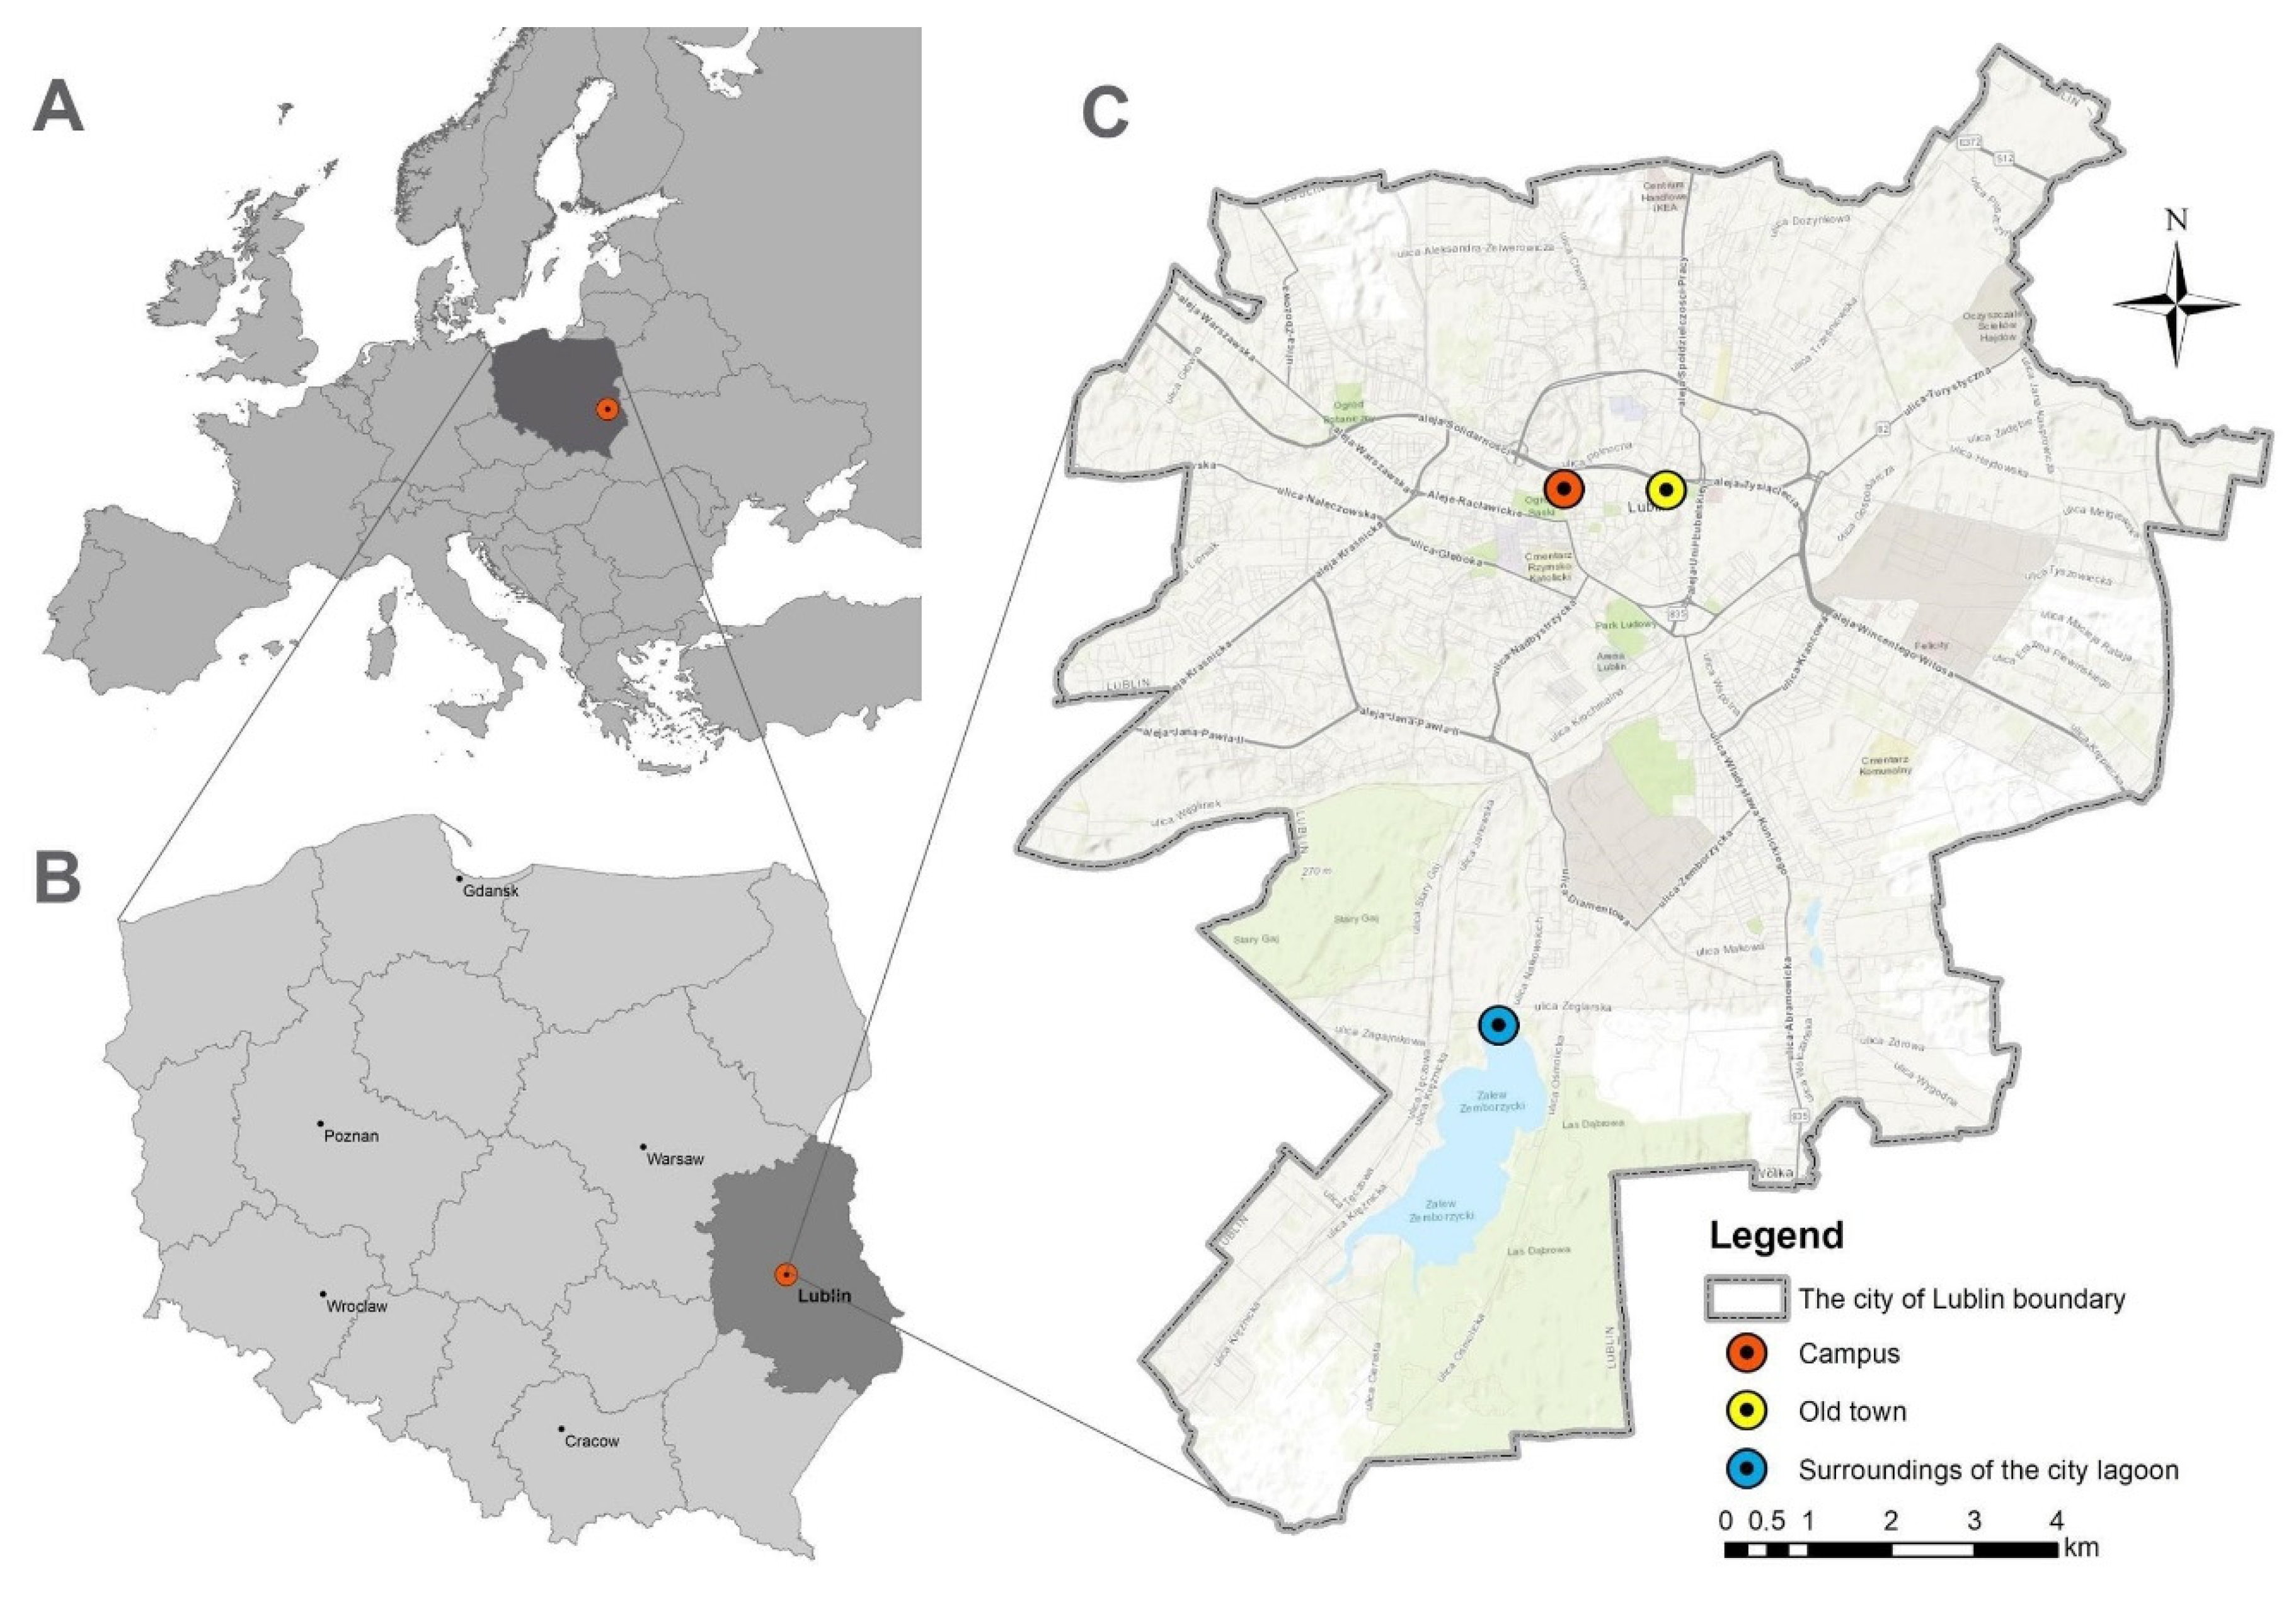
2.1. Study Site

The method was applied to three test areas located in Lublin City, eastern Poland (Lubelskie voivodeship), which significantly differed in the characteristics of their landscape (Figure 1). These areas were selected on the basis of interviews conducted with random students attending Lublin universities. In order to identify study areas, students were selected due to the academic nature of the city, in which as many as 28% of residents are students [48]. In response to a request mentioning several areas in the city that are characterized by different landscapes, students most often indicated the Old Town (65.2 ha), the Campus (171.6 ha), and the area surrounding the city’s Lagoon (1583.3 ha). The first site is characterized by the presence of historical buildings and sites, which mainly serve as restaurants, bars, and art galleries; it is typified by a high level of anthropogenic transformation and a high degree of aesthetic harmony. The second site, the Campus, is composed of buildings and sites serving various functions, such as student halls of residence, canteens, student clubs, sports fields, and a park. The city’s Lagoon is surrounded by three kinds of areas: forests and peat bogs, a recreational complex with a beach, pools, and a rope park, and an estate of detached houses. Such diversity of landscape types and terrain functions allowed us to test the reliability of the method in relation to different kinds of areas.

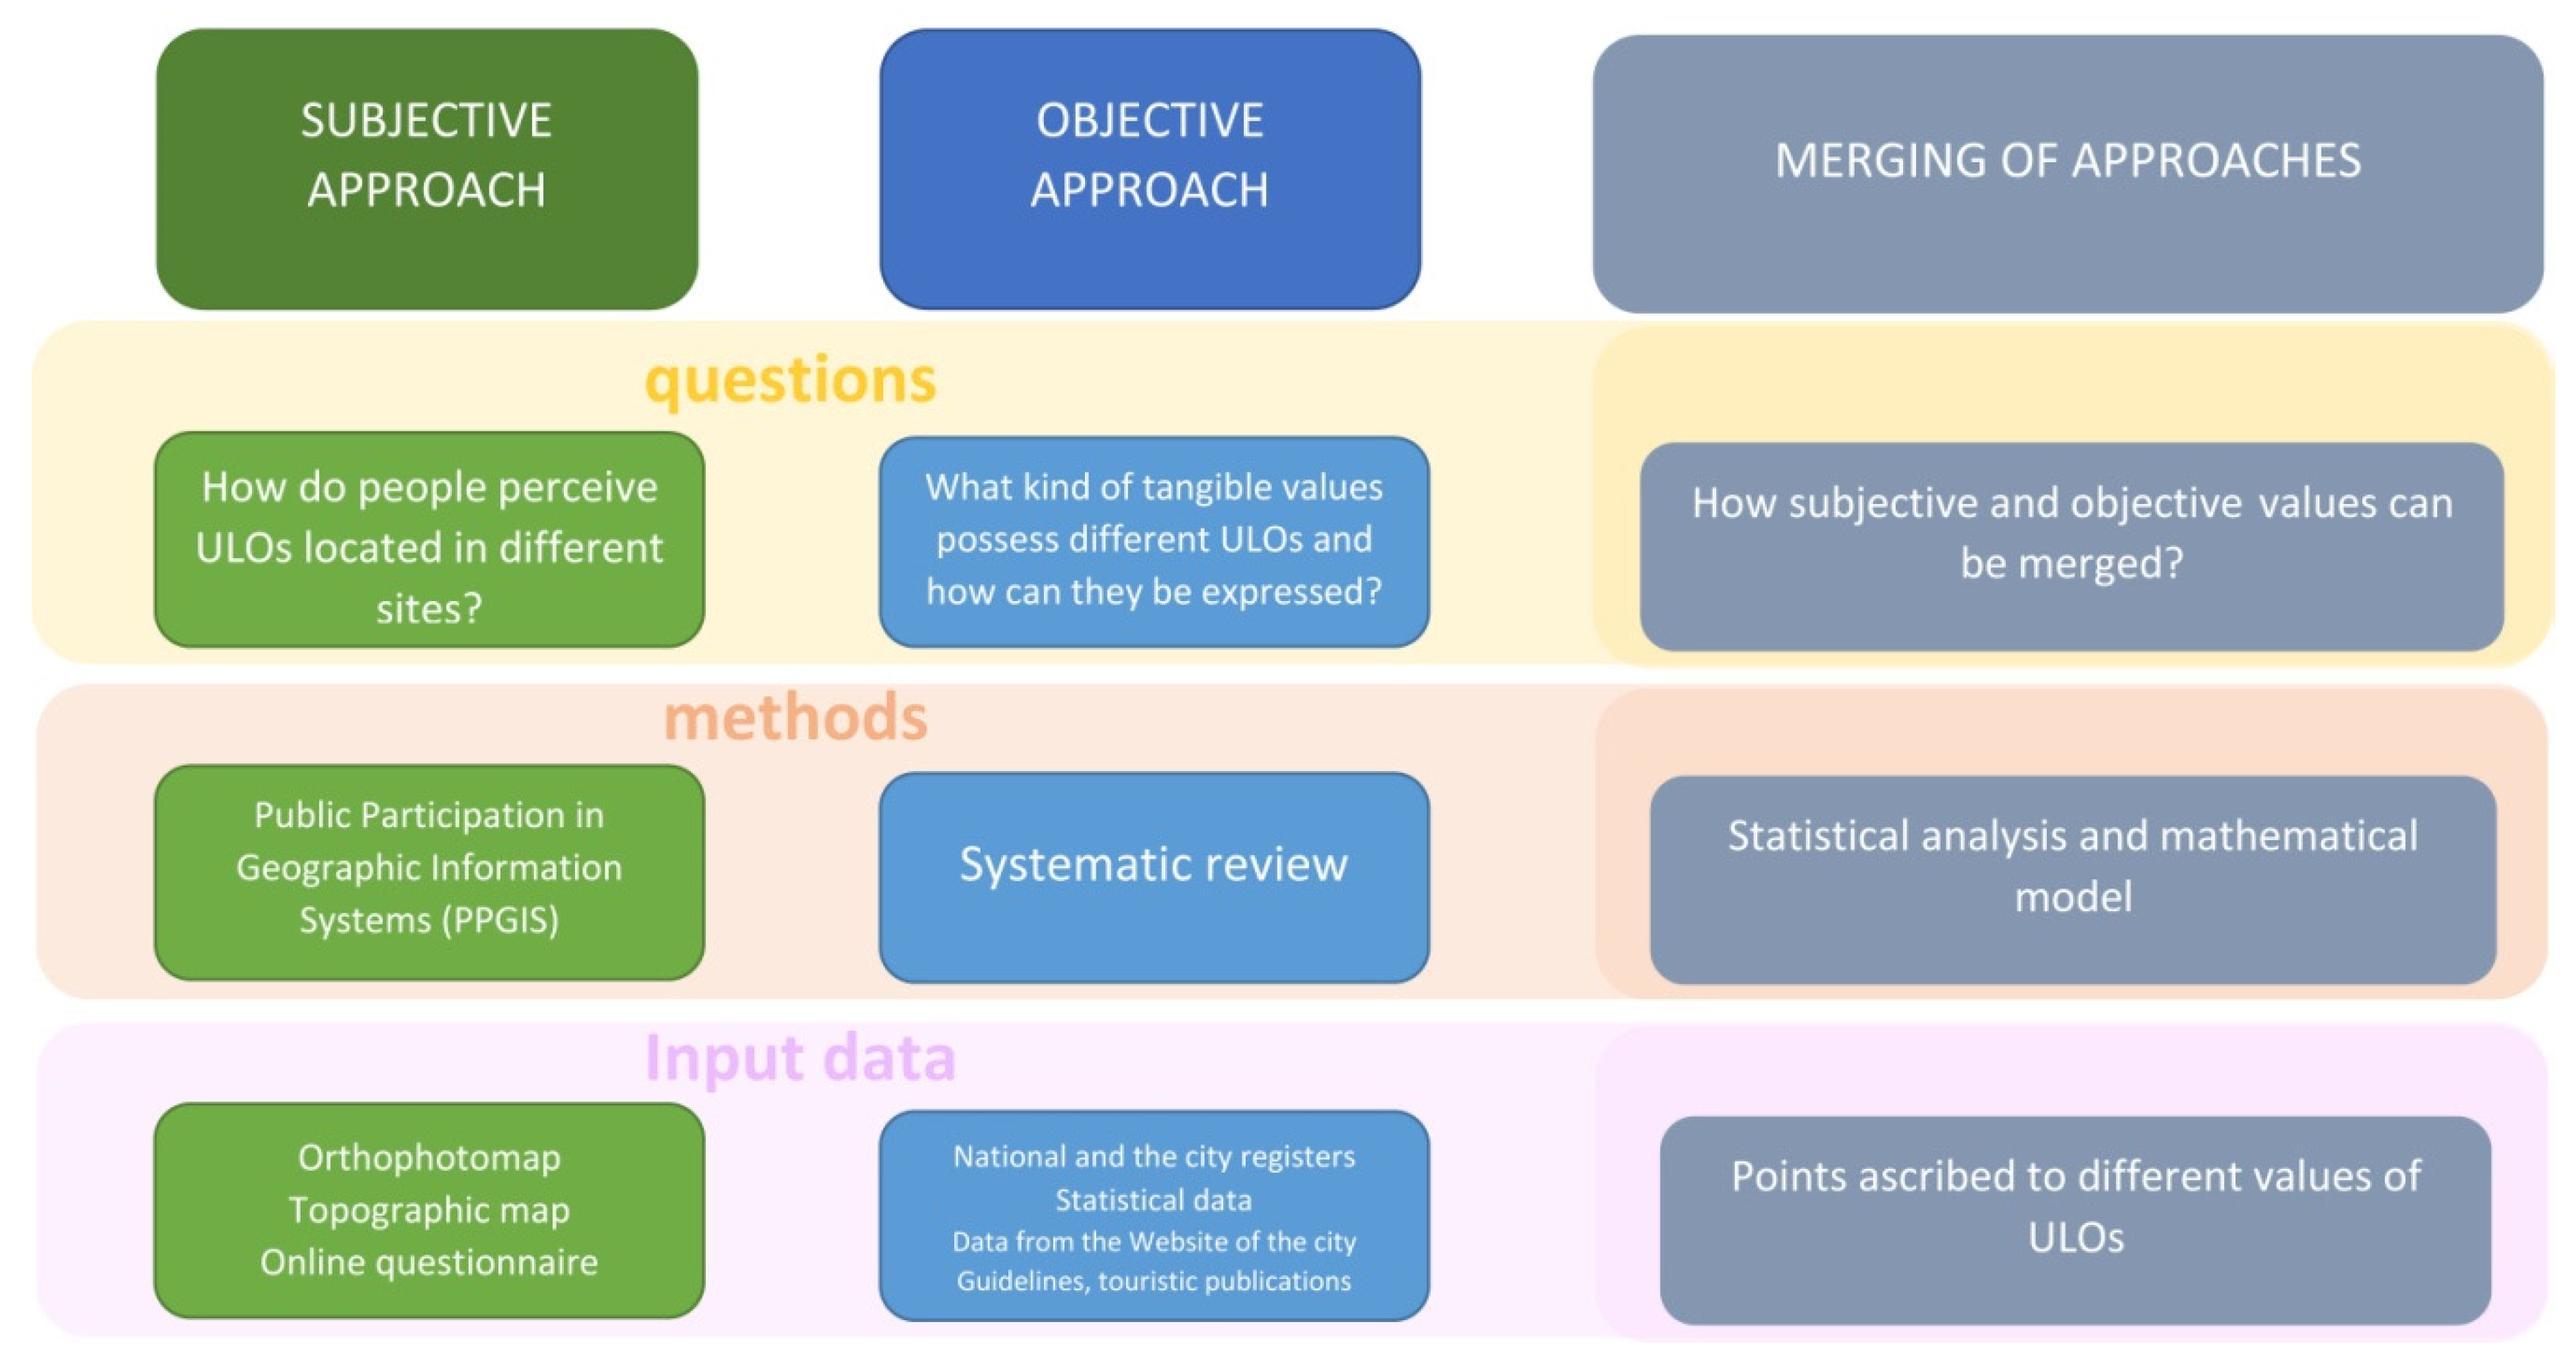
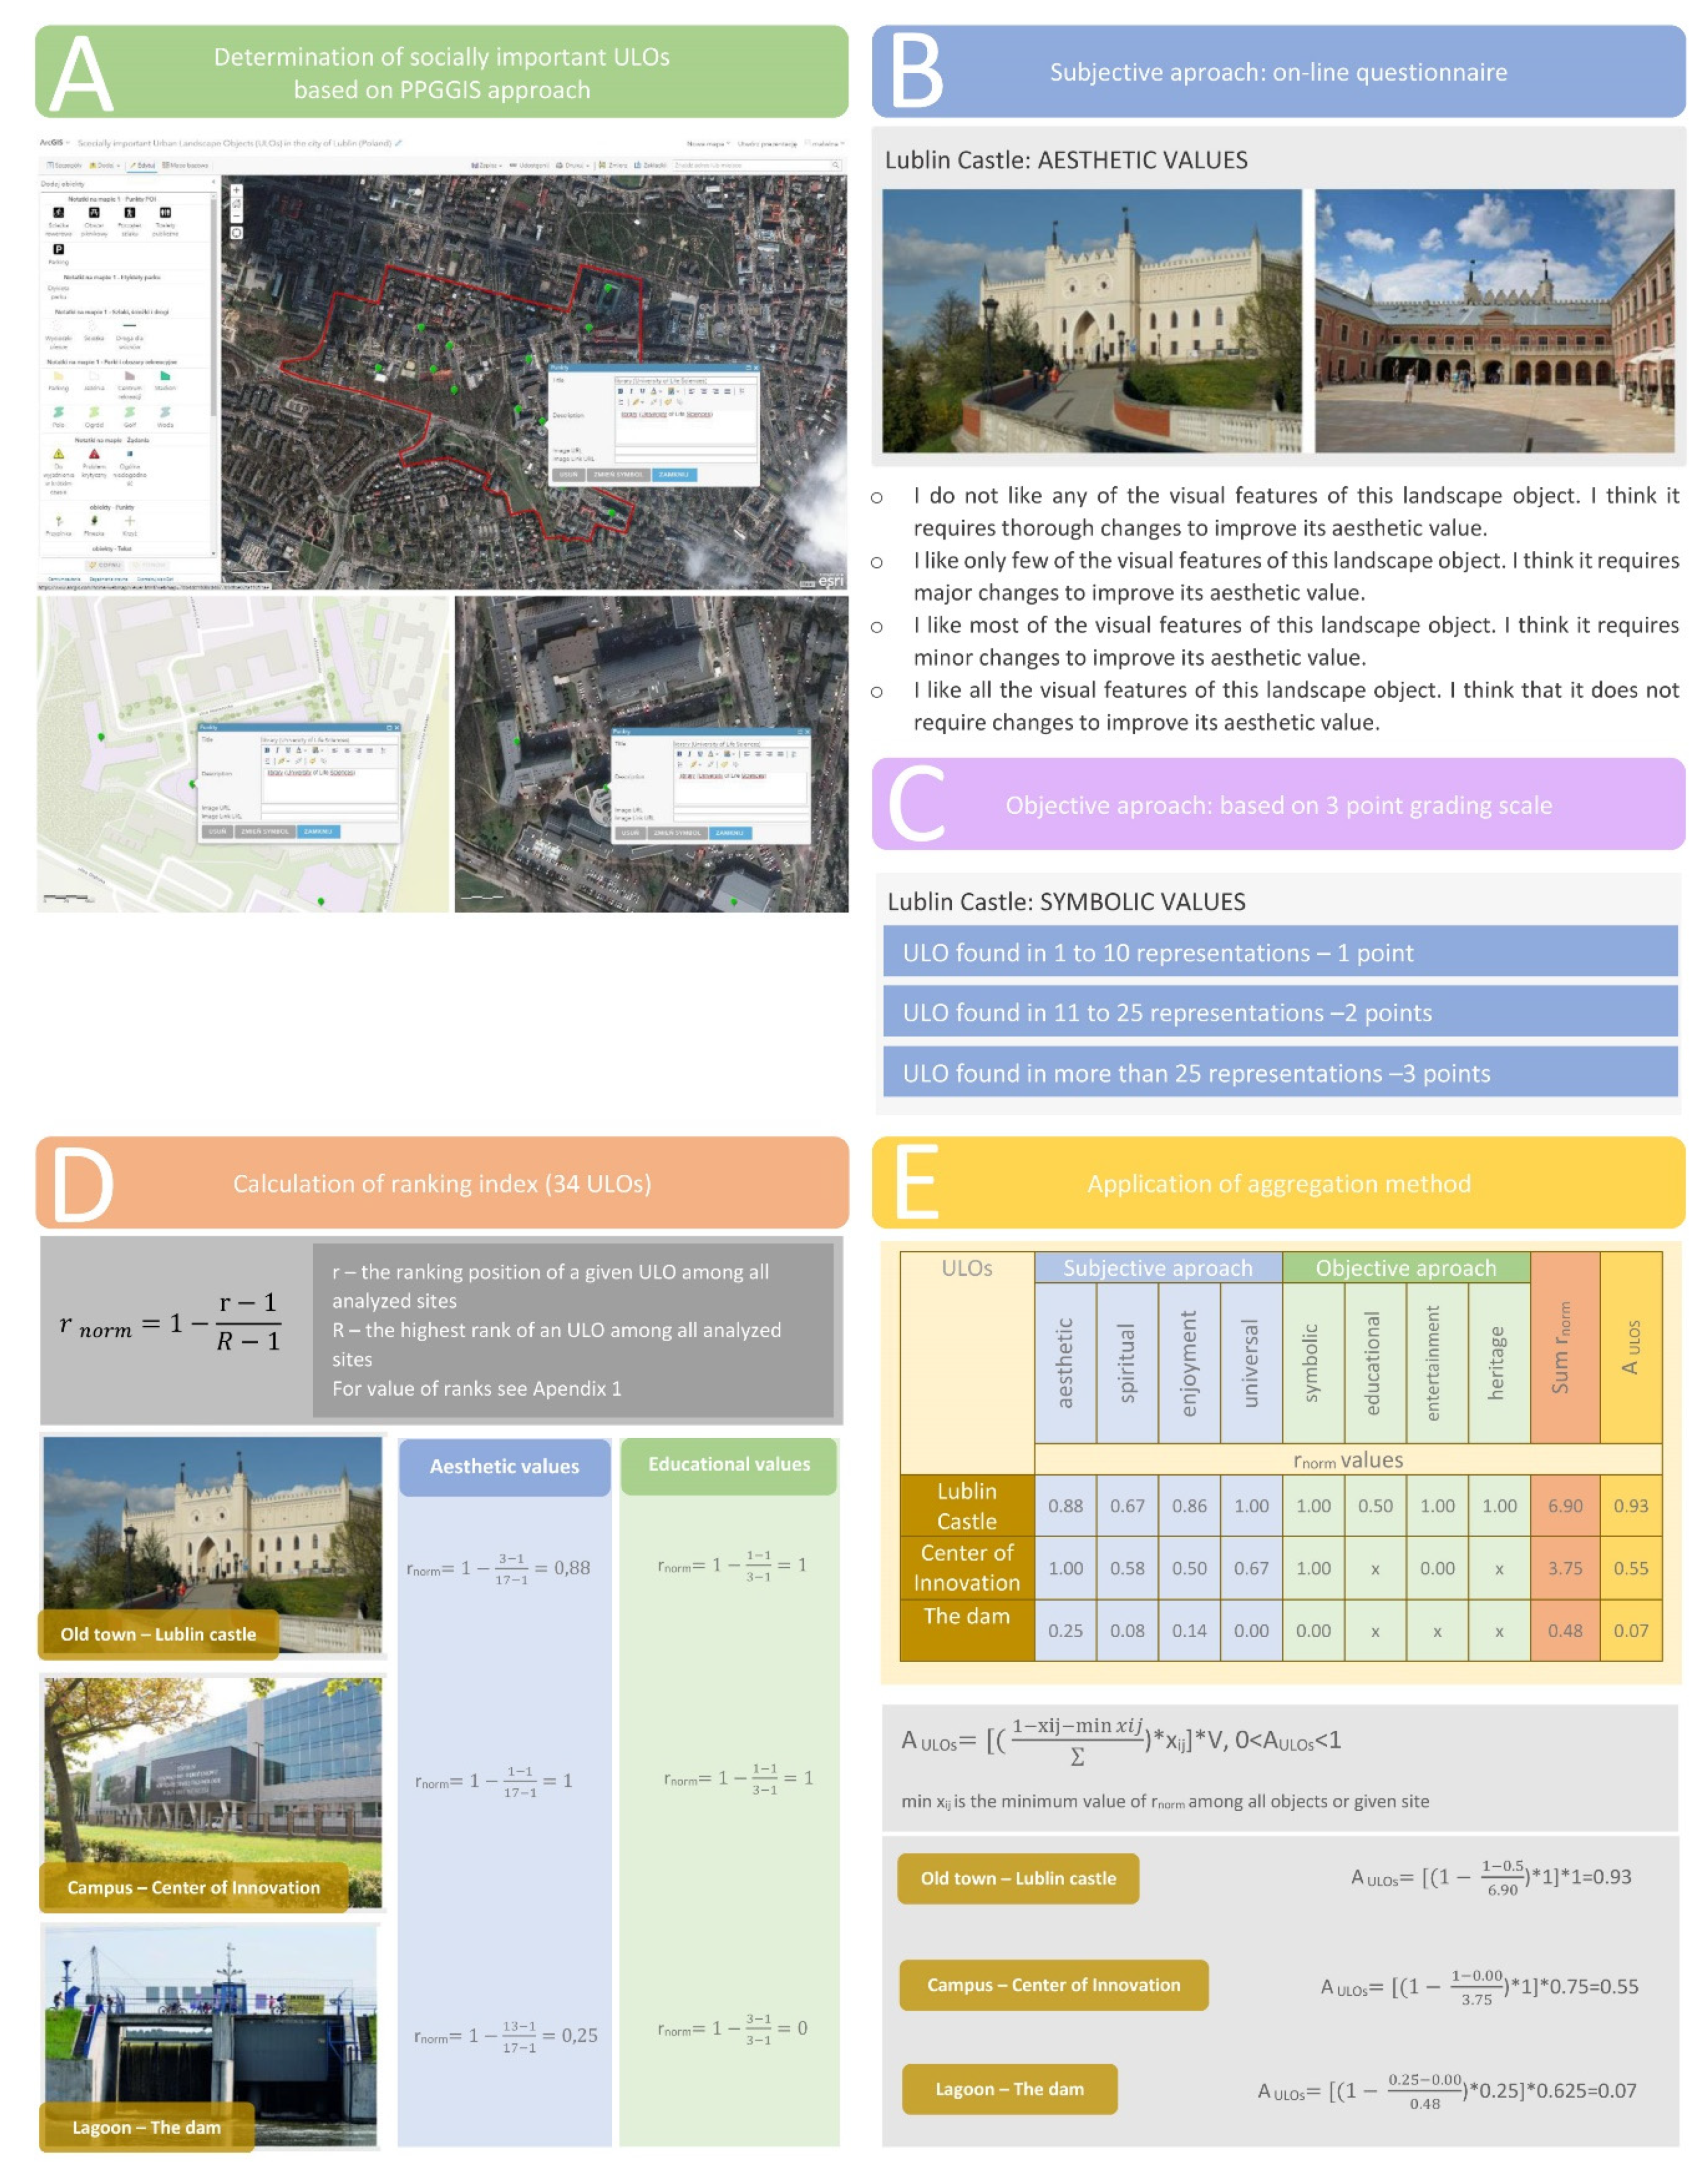
2.2. Research Procedure

The first stage of the research aimed to select ULOs recognized by the students in relation to the three test areas. A topographic map and orthophotomap of each site were displayed in ArcGIS online with the borders of the three test areas. As the respondent group was chosen, students from two Lublin Universities (University of Life Sciences in Lublin and The John Paul II Catholic University of Lublin) attended different courses of life sciences. They were asked to mark and name urban landscape objects, located in the areas defined, that they visited at least once. Students were to use the label tool and could mark and name (or only mark if they did not know the name of an ULO) as many objects and sites as they wished. Respondents were previously informed what ULOs were, according to the definition provided in the introduction. Interviews with between 10 and 20 students per session (six sessions in total) were conducted in rooms at the university during June 2019, lasting approximately 15 min. A group of 80 students in total took part in the research. Second, the total list of students’ responses was examined; those objects marked by at least 10% of the respondents were included in further stages of the analysis (i.e., 34 objects). The second stage of the research aimed to analyze different types of values possessed by ULOs on the basis of two research questions referring to the subjective and objective perspectives (Figure 2).
The basis of the assessment framework used to answer these two questions was derived from the results of a systematic review on aspects related to urban objects’ values. The review comprised two stages. Firstly, the English literature review was conducted within the Scopus database (2019) using keywords such as (cultural) ecosystem services, urban (city) assessment, urban (city) objects, and urban (city) values to detect which values are of a tangible character and can be expressed objectively. Here, the Common International Classification of Ecosystem Services (CICES) framework V5.1. for the assessment of ecosystem services was the most adequate. This classification was selected as it has been widely used as the basis of mapping landscape values across different regions and countries [49] and has strong legal and methodological basis, as it was developed out of the work on environmental accounting undertaken by the European Environment Agency (EEA). This classification divides cultural values (services) into two general groups: (1) direct, in situ, and outdoor interactions with living systems that depend on presence in the environmental setting considering as intangible values in our study, and (2) indirect, remote, often indoor interactions with living systems that do not require presence in the environmental setting considering as tangible values in our study. As ULOs can be both abiotic (buildings) and biotic (greenery, water), the following interactions and characteristic were considered in the research:
  • Characteristics (biotic) that enable active physical interactions, characteristics that enable activities promoting health, recuperation, or enjoyment, and elements (biotic) used for entertainment—assessed as enjoyment intangible values and entertainment intangible values
  • Characteristics (abiotic) that enable intellectual interactions and characteristics that enable education and training—assessed as educational intangible values
  • Characteristics or features (abiotic) that have an existence, option, or bequest value and characteristics (biotic) that are resonant in terms of culture or heritage—assessed as universal intangible values and heritage intangible values
  • Spiritual interactions (abiotic) and elements (biotic) that have sacred or religious meaning—assessed as spiritual intangible values
  • Characteristics (abiotic) that enable symbolic interactions and elements (biotic) that have symbolic meaning—assessed symbolic intangible values
  • Characteristics (abiotic) that enable active or passive experiential interactions and characteristics (biotic) that enable aesthetic experiences—assessed as aesthetic intangible values
The detailed criteria of value assessment (questionnaire structure and objective grading scale) were partially based on the results of the review of literature [50,51,52]. The final structure of the framework was derived from the local context: the availability/ lack of data for objective criteria and the characteristics of ULOs detected by respondents.
The first question dealt with the issue of the public perception of ULOs: “How do people perceive ULOs located in different sites?” Consequently, the PPGIS method was used to answer this question. As defined in the previous stage, 34 elements were included in the online questionnaire, based on the Survey 123 ArcGIS application, aimed at discovering students’ opinions on the intangible values of ULOs. The questionnaire was completed by the group of 50 students who took part in the first stage of the research and who had visited the assessed ULOs at least once. Respondents’ profiles are illustrated in Table 1. The questionnaire contained personal metrics and four questions related to each of the 34 assessed objects. Each landscape object was presented by name, location, and photograph (Figure 3B). Students expressed their preferences using a four-point scale (Table 2A) and were asked how they perceived a given landscape object as being visually attractive (aesthetic value), suitable for contemplation, meditation, or prayer (spiritual value), a source of enjoyment (enjoyment value), and worthy of preservation (universal values). We used the mean value of points given by all of the respondents to produce a final value. The physical conditions of the research setting were similar to those of the first stage.
To answer the second research question (“What kinds of tangible values are possessed by different ULOs and how can they be expressed?”), the objective grading scale was applied in relation to four value types: symbolic, educational, entertainment, and heritage. Symbolic values were based on the number of given ULO representations in commercial visual arts based on seven guides of Lublin from 1901–2014. Educational values were derived from the potential educational function of a given ULO. Entertainment values were expressed objectively by the number of cultural events taking place in a given ULO per year according to the official website of Lublin City and official websites of particular landscape elements. A protected status was selected to express heritage values. Experts (authors) ascribed grading points to each landscape element using a three-point scale (Table 2B; Figure 3C).
The third question relates to the problem of merging points on the basis of the subjective and objective approaches. As a solution, the two-stage mathematical formula was proposed. Firstly, the value ranking index (Equation (1)) of a given ULO was calculated, taking into account all analyzed ULOs and sites (Figure 3D).
  r n o r m = 1 r 1 R 1 ,
where r is the ranking position of a given object among all analyzed sites, R is the highest rank of element among all analyzed sites, rnorm = 1 indicates that a given object possesses the highest ranking position among all analyzed sites, and rnorm = 0 indicates that a given object possesses the lowest ranking position among all analyzed sites.
Next, we applied the aggregation method (Figure 3E) in reference to the ranking positions obtained for all ULOs of a given site using Equation (2), taking into account four variables: (1) the difference between the minimum and maximum ranking position, indicating whether it is a ULO of a specialized function (e.g., tourism, nature conservation, food provision), (2) the sum of the ranking positions of ULOs belonging to a given site, indicating the relative value of a site in terms of its values, (3) the value of the maximum ranking position, indicating whether a given site contains a ULO that possesses outstanding values of a given type, and (4) the V index, which takes into account the share of tangible value types which a given ULO does not possess (e.g., if a given ULO is not under legal protection, its heritage values equal 0).
A U L O = [ ( 1 x i j   m i n   x i j i = 1 r   x i j ) x i j   ] V ,   0   <   A ULO   <   1 ,
where max xij is the maximum value of rnorm among all ULOs of a given site, min xij is the minimum value of rnorm among all ULOs of a given site, V = 0.125 (1 divided by total number of value types, i.e., 8), multiplied by the number of value types which a given ULO possesses (e.g., V = 0.875 (0.0125 × 7) if a given landscape element is a provider of any seven of the eight analyzed value types), AULO = 1 indicates that a given site possesses the highest ranking position in terms of its values among all sites analyzed, and AULO = 0 indicates that a given site possesses the lowest ranking position in terms of its values among all sites analyzed.

2.3. Statistical Analysis

The results were analyzed using Statistica software. In the case of normally distributed data, one-way analysis of variance (ANOVA) was used to define the differences among different types of values ascribed to ULOs and among the three test areas. Statistical differences between means were measured using the Tukey post hoc test. When the test of normality showed that the data were not normally distributed (p < 0.00001), the Kruskal–Wallis test was applied to indicate statistical significance between value types (α = 0.05) and the Dunn post hoc test, further adjusted by the Holm FWER (Familywise Error Rate) method, was applied to indicate the values that significantly differed from the rest of the group.

3. Results

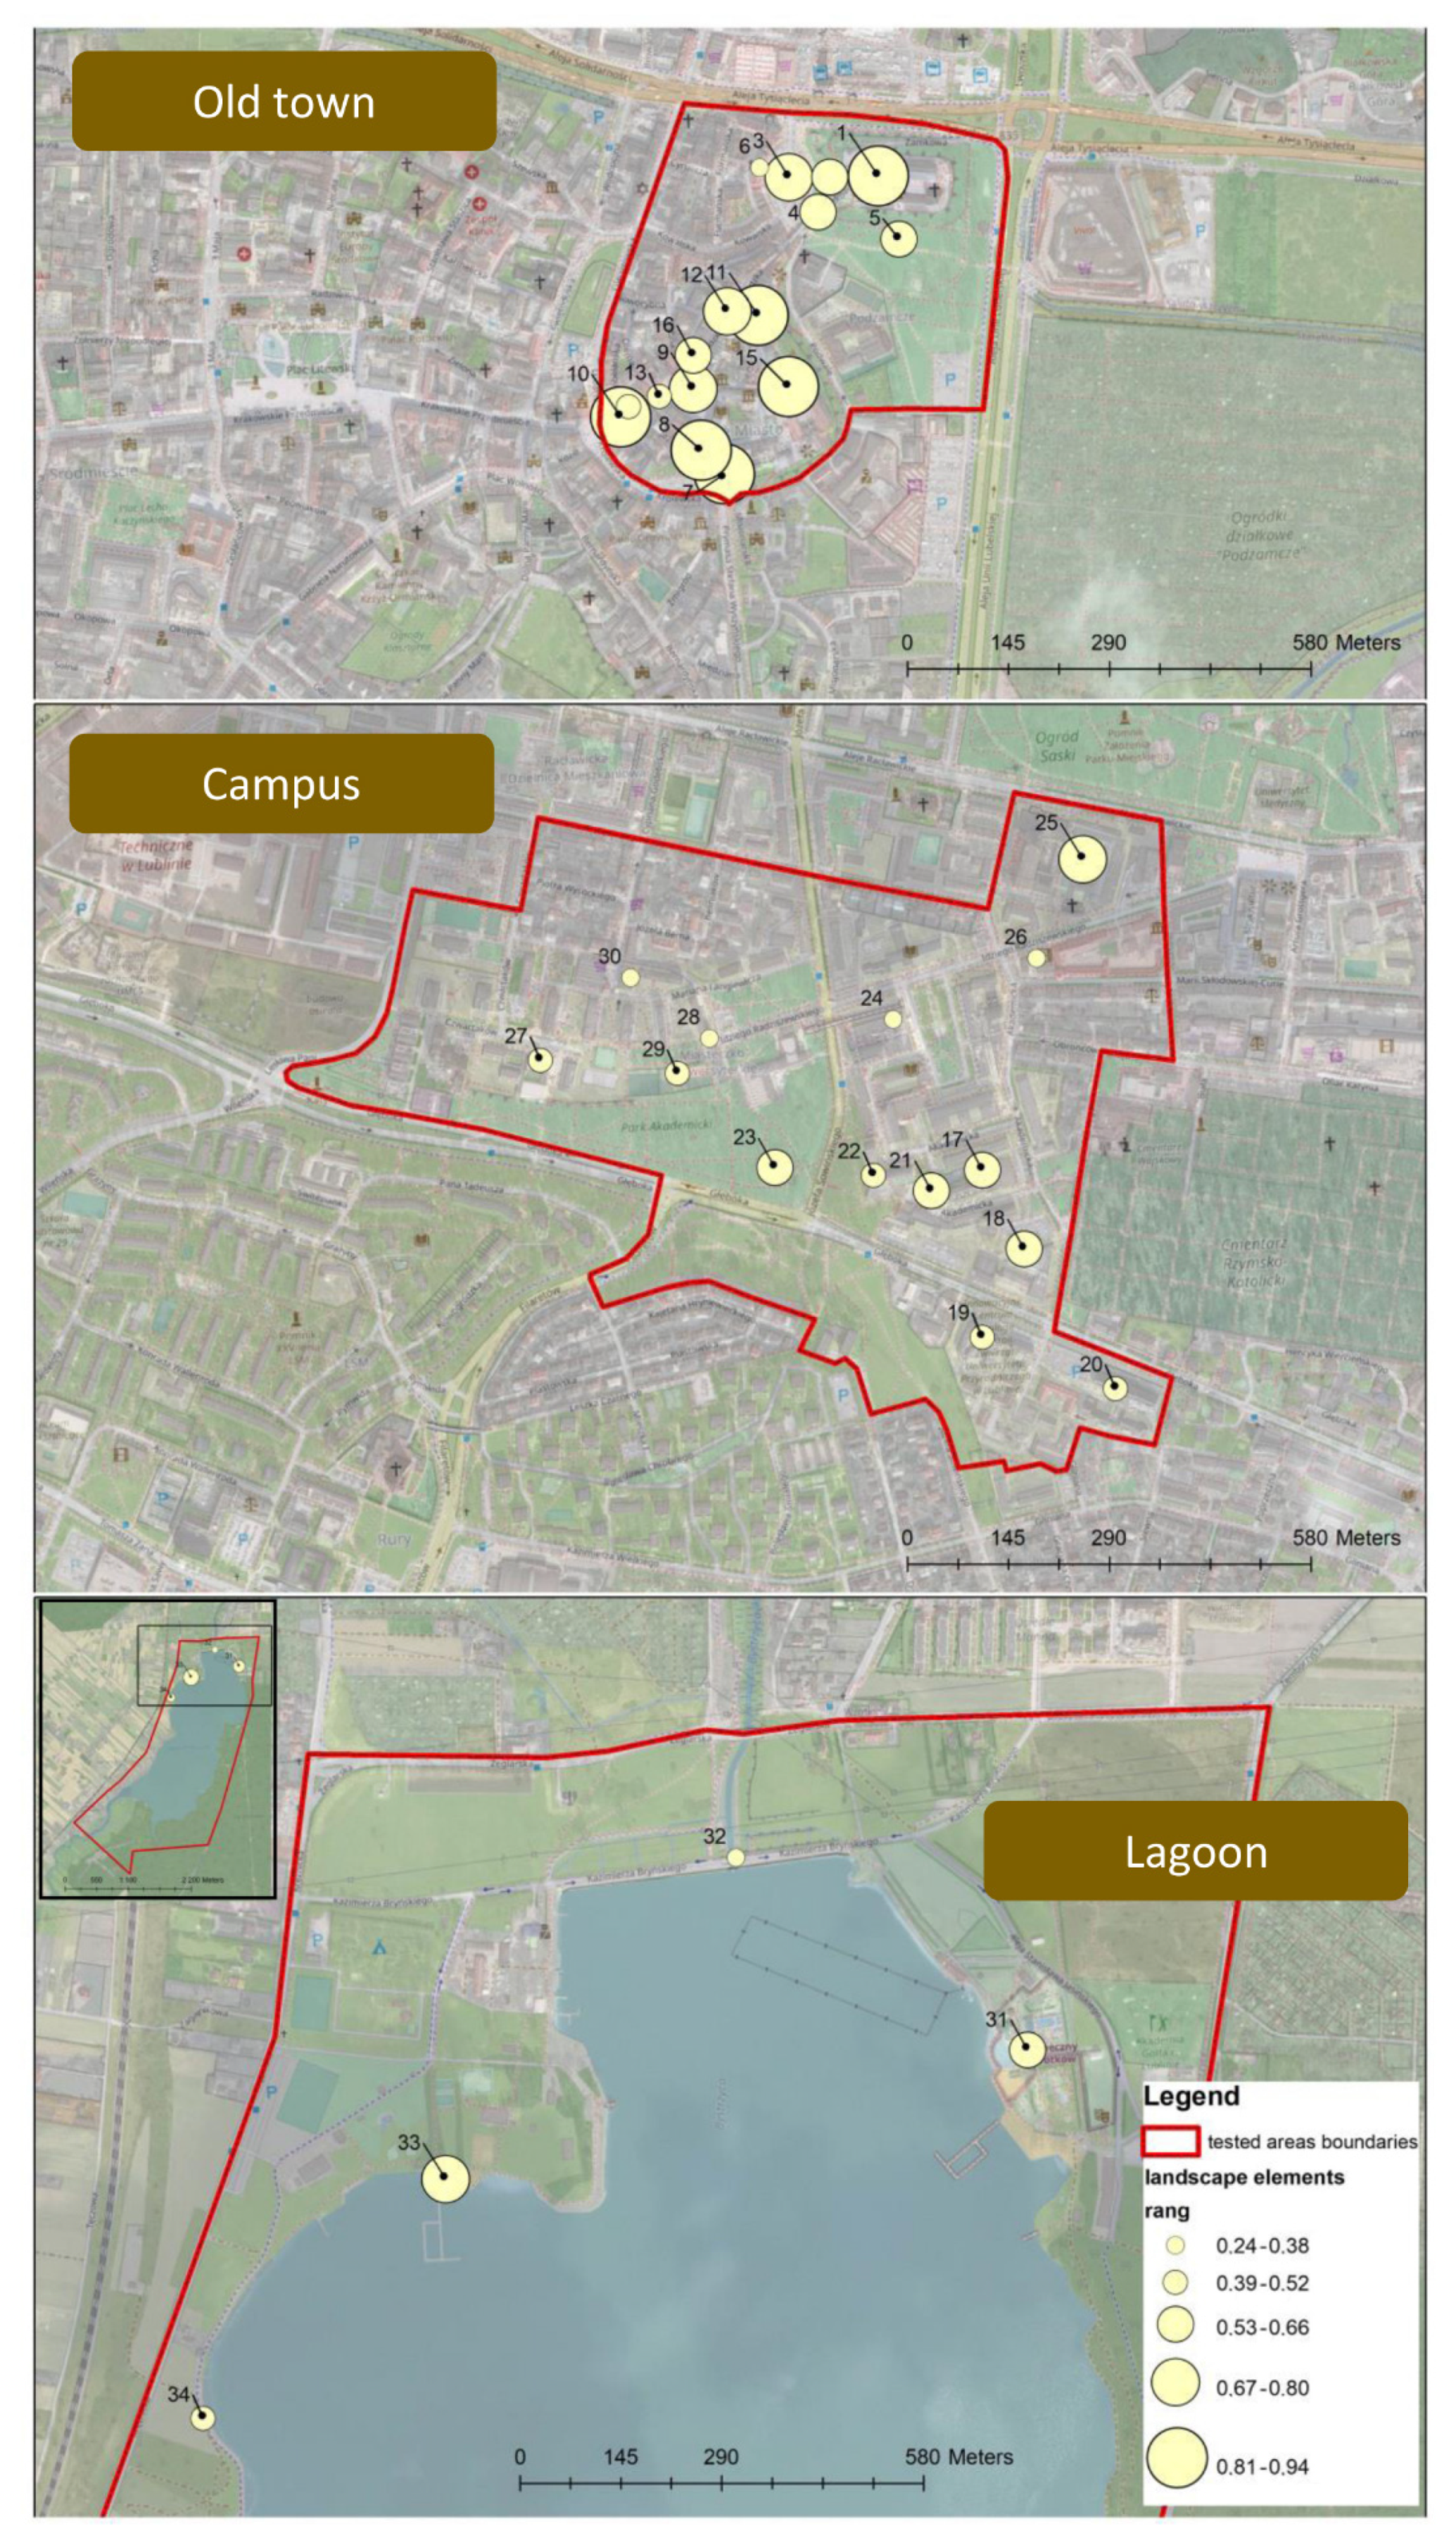
3.1. Results of PPGIS Application

In the first part of the research, using the ArcGIS online application, respondents distinguished 147 different landscape elements, including 61 located in the Old Town, 72 on the Campus, and 14 near the Lagoon. The number of objects identified ranged between five and 55 (mean: 21). Among these objects, 34 were identified by at least 10% of the respondents (Appendix A; Figure 4). Landscape objects selected in the city (16 objects) were diverse in terms of function, including monuments, churches, pubs, and restaurants, as well as objects accompanying them (e.g., stairs). The majority of the 14 locations on the Campus were university buildings. Sports facilities and the academic park were also included in the later stages of this analysis. The Lagoon was only represented by four landscape objects, all of which, except for a dam, were tourist infrastructure elements.

3.2. Results of Assessments from Students and Experts: Differences in Mean Values of Points Attributed to Each Type of Value Regardless of the Site Type

The points ascribed by students and experts to all analyzed ULOs (Appendix A) were found to be significantly higher in the case of aesthetic, entertainment, and educational values and lower in the case of heritage values (Table 3A). While analyzing only the intangible values, it was identified that the students attributed a relatively high rank to the aesthetic values, whereas the rank given to the spiritual, enjoyment, and universal categories were of lower significance (Table 3B). Among the tangible values, clear differences were seen between entertainment and other types of values (Table 3C). There were no differences, however, between points given to all four intangible and all four tangible values (p < 0.05; n = 36; t-value = 0.501; p-value = 0.308).

3.3. Results of Assessments from Students and Experts: Differences in Mean Values of Points Attributed to Each Type of Values in Relation to Each Site Type

The statistical differences among points ascribed to aesthetic, spiritual, universal, and entertainment values of ULOs located in different sites showed that the results were not significant at p < 0.05 (Table 4; Figure 5). Heritage values occurred as typical only for the landscape objects located in the Old Town (p < 0.0001). Additionally, the latter areas possessed significantly higher enjoyment (p = 0.022) and symbolic (p = 0.005) values. On the other hand, the Campus featured significantly higher educational values (p = 0.023).

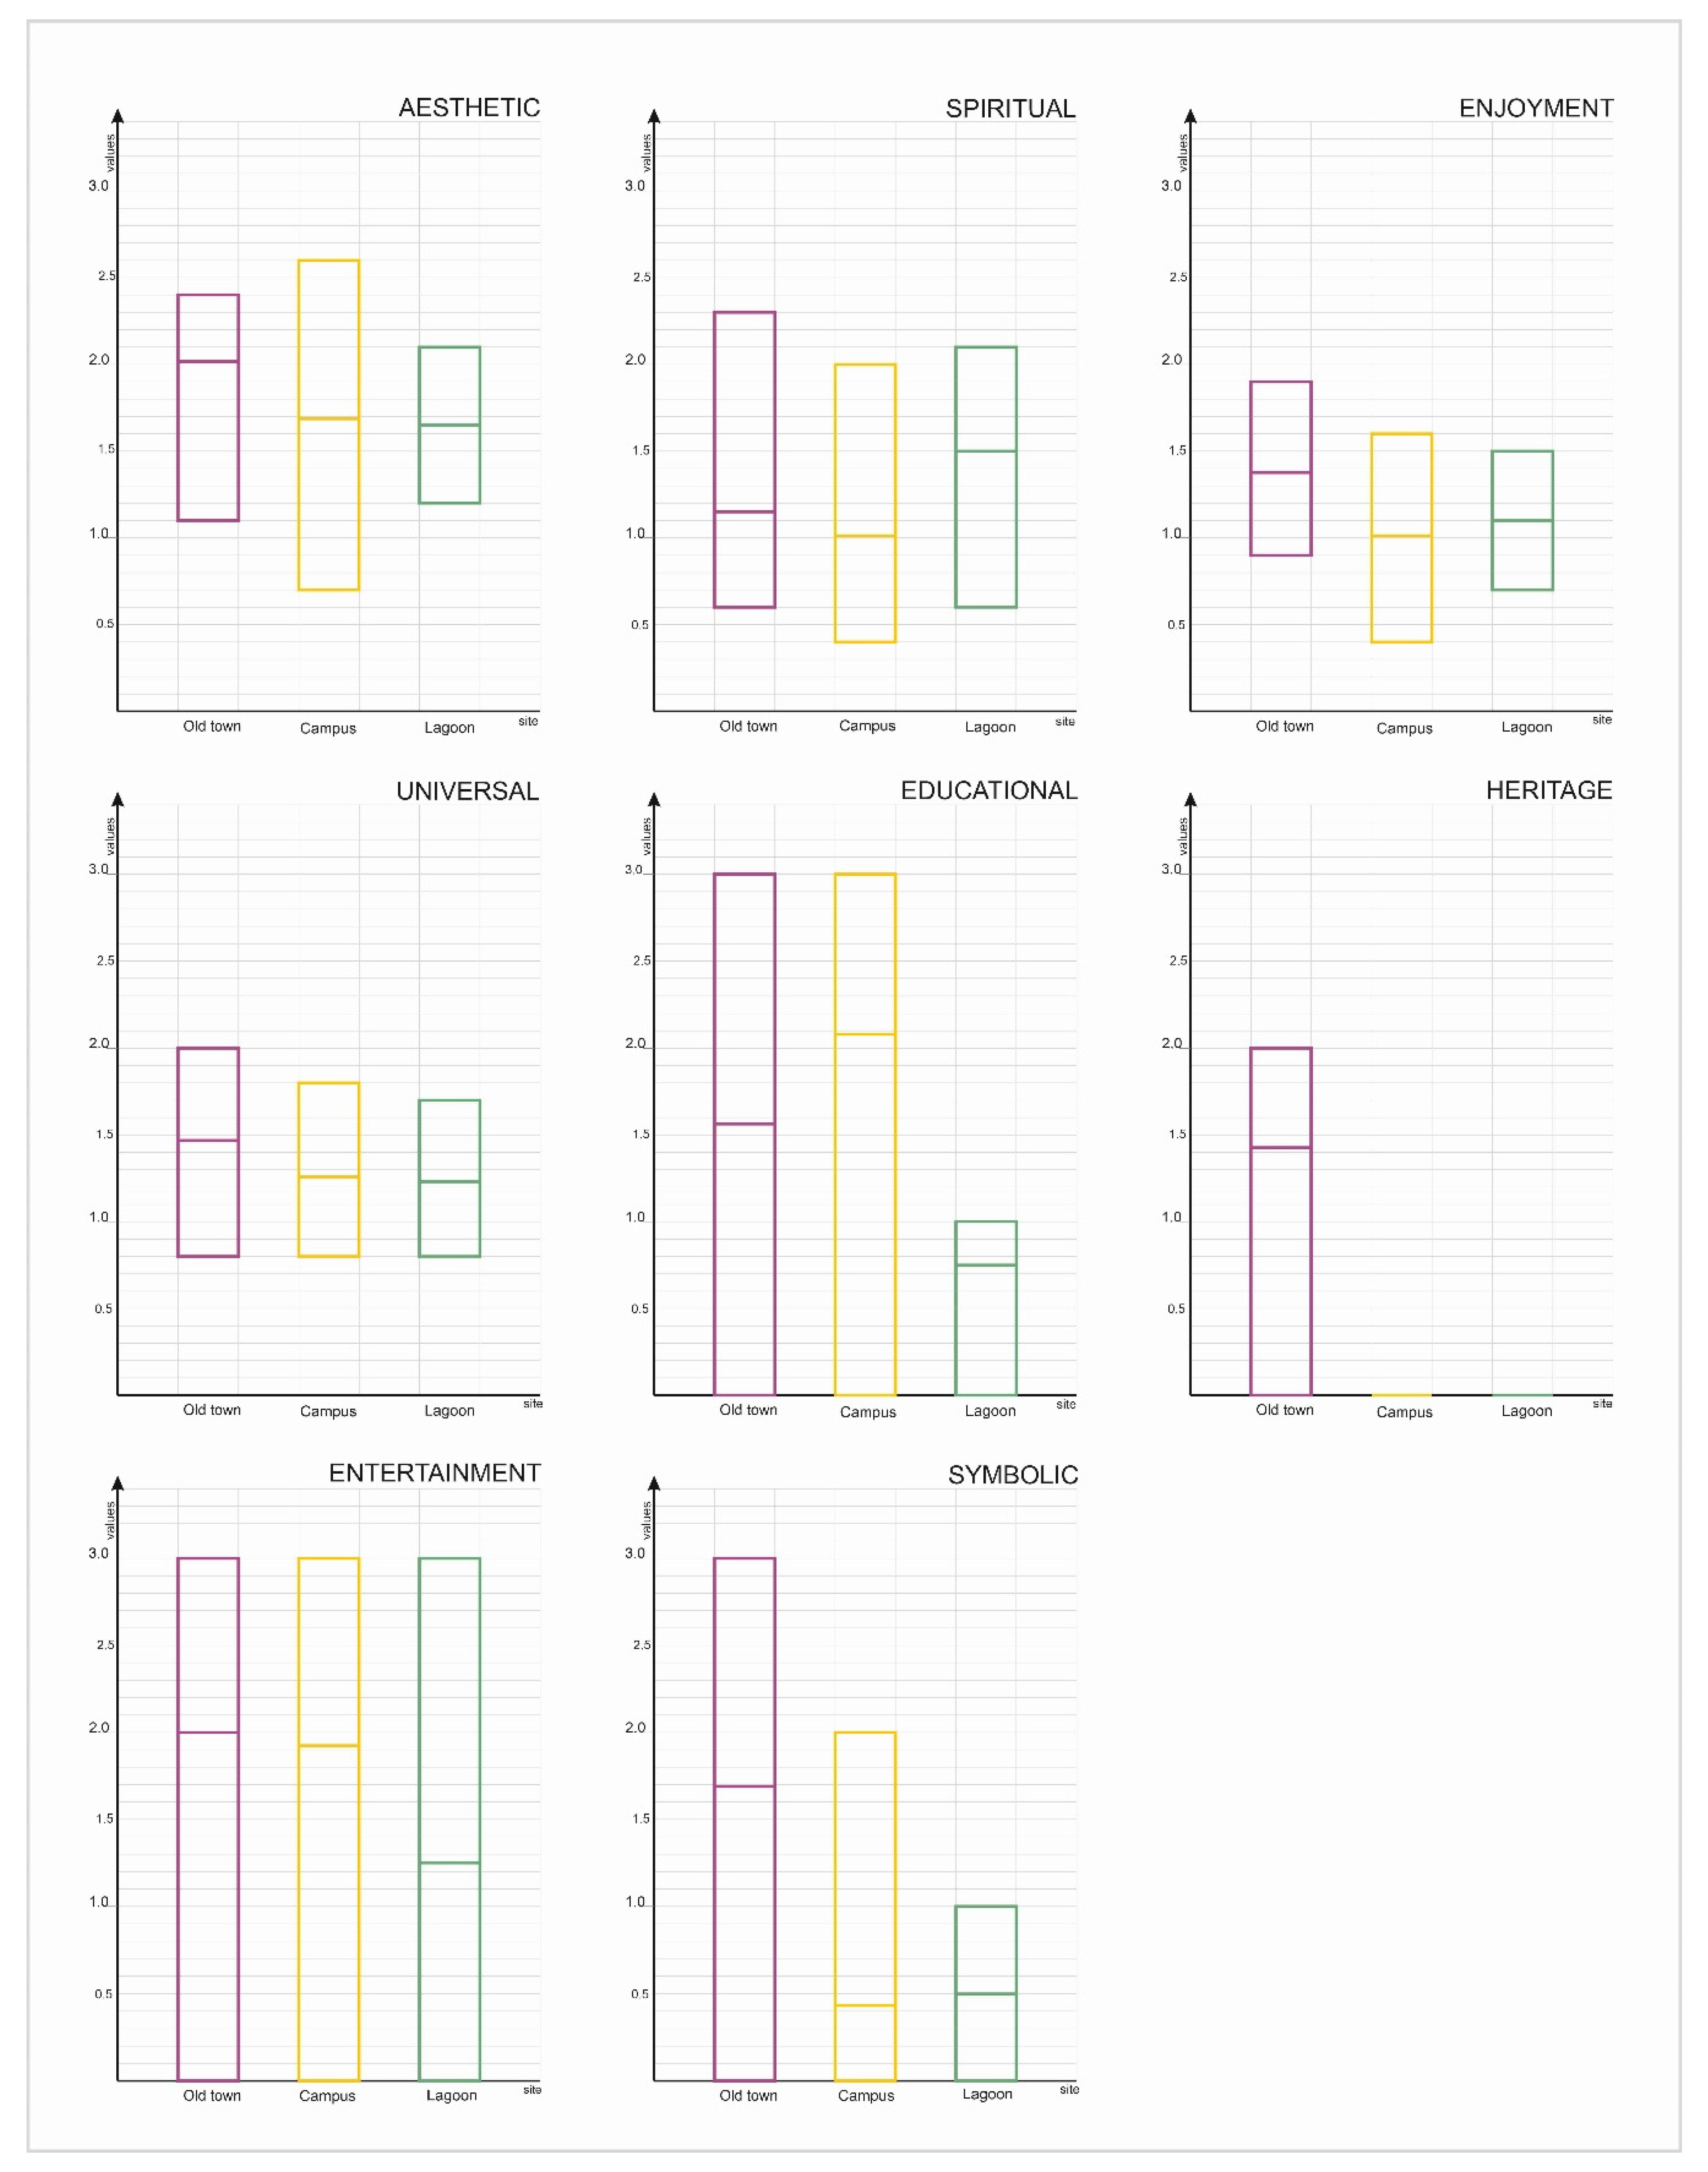
3.4. Results of Assessments from Students and Experts: Differences in Mean Values of Points Attributed to Values of ULOs Located in Each of the Three Sites Analyzed

When analyzing each site separately, the Old Town (p < 0.05; n = 64; t-value = 1.185; p-value = 0.119) and Campus (p < 0.05; n = 56; t-value = 0.746; p-value = 0.229) featured no statistically significant differences between the points ascribed to intangible and tangible values. The points ascribed to intangible values at the Lagoon, on the other hand, were statistically higher than tangible ones (p <0.05; n = 16; t-value = 2.938; p-value = 0.003). When analyzing each value type within sites, the differences among the mean values attributed to ULOs were statistically significant in the case of all three sites (Table 5 and Table 6). The Old Town featured higher aesthetic and entertainment values than spiritual ones (p = 0.040 and p = 0.048, respectively), and the Lagoon possessed higher aesthetic than heritage values (p = 0.011) (Table 6). The Campus stood out, with its educational and aesthetic values being higher than most other value types (Table 7), whereas its heritage values were lower than its other values (except symbolic).

3.5. Results of Aggregation Procedures: Differences in AULO (Agregation Index of Urban Landscape Objects) Values in Relation to Each of the Three Sites Analyzed

By applying ranking and aggregation procedures, we revealed that significant differences between AULOs existed among each of the three sites analyzed (p = 0.036) (Table 8). The Old Town featured the highest total values (mean AULO = 0.64) comparable with other sites (p = 0.063), and the Lagoon featured the lowest total values (mean AULO = 0.35), also comparable with the campus (p = 0.434). Moreover, we found that, among all of the ULOs analyzed, the most highly rated were those located in the Old Town: Lublin Castle, the Dominican Church, and Archcathedral (AULOs = 0.93, 0.92, and 0.92, respectively), followed by the Fara Square (AULO = 0.92) and Trinity Tower (AULO = 0.89) (Appendix A). This area, however, also featured the element with the second lowest AULO value, an ice cream shop near the castle (0.10). While analyzing the Campus, the highest AULO value was obtained for the main building of the Catholic University of Lublin (0.77) and, surprisingly, the lowest was obtained the Main building of the Marie Curie-Skłodowska University (0.20). Of the Lagoon landscape elements, the Marina together with the bicycle path was ranked the highest (0.45) and the dam was ranked the lowest (0.07). As a result, The Old Town included objects of diverse values (SD = 0.259), whereas those landscape objects located within the Lagoon (SD = 0.161) and Campus (SD = 0.182) had similar levels of values.

4. Discussion

4.1. Differences among the Three Sites Analyzed

The general finding of the study showed that the Old Town featured the highest ranked position in terms of values, together with the higher share of the most appreciated ULOs (Table 9). This finding is not surprising as this area is multifunctional and has the longest history of human use, resulting in the existence of historic buildings of high visual values. Other studies on managing historic cities also showed that city centers feature unique social and universal values [54,55]. For example, in a study conducted by Atanur et al. [56], it was discovered that visitors prefer the aesthetics of historic buildings, and these preferences are not dependent on gender, origin, or age. Presumably, the low values ascribed to the Lagoon resulted from the limited acquaintance of students with this site, which is located on the periphery of the area. Respondents provided few indications of landscape elements in this area and ascribed low rating positions to them. Only aesthetic values were appreciated. Furthermore, the implementation of the objective grading scale showed that the Lagoon possessed limited values. Among the study landscape objects located on the Campus, the most highly appreciated were educational and aesthetic values. The latter were generally ranked higher by the respondents than other intangible classes, regardless of the site type. This conclusion is consistent with the results of other papers [50,57], as scientific research generally shows that city visitors treat ULOs not in terms of their objective landscape properties, but in terms of their meaning and values. Therefore, in the assessment, they paid great attention to aesthetic values.
It must also be emphasized that the study results showed that the site with the highest level of anthropogenic transformation—the Old Town—possessed the highest values. By contrast, the most natural area—the Lagoon—featured the lowest values. Initially, the authors tried to explain this using the theory that a stronger sense of belonging to a given place leads to higher values attributed to it [58]. According to this statement, the Campus example, however, should possess the highest or at least similar intangible values to the Old Town, as respondents use the university infrastructure in their everyday life and, thus, their personal experience and connection to those objects should be strong. Another possible explanation relates to the multifunctional character of the Old Town. This site provides more services and more diverse sensations than other areas. As a result, its potential values are higher. This statement is consistent with the fact that people feel better being in the city center, because of access to commercial and cultural facilities whose aesthetics are usually high and fashionable. It is also worth mentioning the research of Keles et al. [59], who showed that the visual landscape quality assessment of historic city centers is dependent on the popularity of objects located in a given area.

4.2. Advantages and Disadvantages of the Adopted Method

The method we applied allowed us to (1) merge social and expert opinions on ULOs, (2) analyze diverse characteristics of urban space including tangible and intangible characteristics, (3) quantitatively present the result of values assessments enabling comparisons among different aspects, and (4) map both objective and subjective values of ULOs on the same scale (see Figure 5). Such an approach, based on both expert (universal grading scale) and social (PPGIS) opinions, could support urban landscape planning by providing an effective tool with which to obtain data featuring a high simplicity of structure (map) and that aids public understanding. To obtain a more comprehensive understanding, however, it would be necessary to collect the opinions of diverse social groups, not only those of students as in this pilot project, which was aimed at the introduction and testing of the method and not at the comprehensive analysis of values ascribed by different actor groups. We are aware of the fact that the consideration of the opinions and perceptions of multiple users and beneficiaries is crucial as such an approach would likely mitigate conflicts in land use [60]. Furthermore, as stated, many studies [34,61] of different stakeholders’ perceptions sometimes give more insight into the value concept than purely quantitative or monetary analysis.
We consider the biggest advantage of the method to be the presentation of the intangible characteristics of ULOs in a clear objective form, through the application of mathematical models reflecting the rank of a given element regarding its values. This is particularly important as, thanks to the adopted approach, tangible and intangible values can be expressed and presented graphically on the same scale. Our approach also allowed such elements to be ranked, as well as sites. The necessity of searching for methods that rate intangible values alongside tangible ones linked to a physical process was emphasized by other researchers [23,62]. The identification of sites generating the most or fewest benefits (using their ranking positions) is important from a managerial point of view [63,64], as places that were previously overlooked or treated marginally might turn out to possess many values when considered at the local level [65] and would then require different planning and management actions (e.g., protection or additional investment).
Another advantage of the proposed procedure derives from its high flexibility, meaning that it has potential to be applied in relation to different sites, regions, and countries. Such an approach is consistent with the European Landscape Convention [38], which emphasizes that all the research on landscape quality should be conducted in reference to areas of different types. Its application, however, may be affected by the differences among landscape types and operational units. For example, types of ULOs may vary among countries and cities. Some objects may not possess educational or spiritual values but be of great importance due to their impact on biodiversity or health services. It was partially shown by the conducted study that the framework used lacks the illusion of ecological values deriving from the existence of biologically active areas within the city structures. This underestimation was particularly seen in the case of the Lagoon possessing high ecological values which were not included in the assessment criteria. Moreover, PPGIS as used in the presented study may not be a traditionally used tool for collecting spatial information or may be practically infeasible. This is why it is an approach based on the merging of subjective and objective opinions and the aggregation method, which can be implemented in relation to different sites, regions, and countries. The ranking assessment criteria based on the four-point scale adopted in the assessment of tangible and intangible values of ULOs should be verified and adjusted to local environmental, social, and policy conditions.
Indeed, if ULO value assessments are to serve as a universal tool for spatial policy, their identification needs to be easy and fast. The use of a universal grading scale in reference to some of the value types significantly reduces labor intensity. The process of rank determination based on sociological studies, however, is time-consuming. Performing the social valorization via the Internet or sending questionnaires by mail can cause many difficulties [66]. It would be burdensome to find respondents who recently visited a given site; however, intangible values cannot be assessed without experiencing them directly [60,65]. As there is no method of sociological research that is simultaneously easy, fast, and effective, the application of PPGIS seems to be one of the most adequate solutions mitigating many of the problems dealing with traditional approaches [32,33]. In contrast to methods based solely on survey campaigns or geo-questionnaires, which are part of PPGIS [29,31], it objectively expresses both tangible and intangible values of ULOs using the same scale. It also gives the opportunity to reflect objective ratings on the map.
Regarding the future outlook, the conducted pilot study indicated further examination in reference to two aspects. First of all, future questionnaires on intangible features of ULOs should be directed to diverse groups of stakeholders. The city image can be different in different stakeholders’ visions, such as the local community and visitors. This was proven by papers on Polish case studies [27,28], as well as in relation to other countries [26]. Taking into account the local condition, firstly, opinions of the following groups should be included in the model: employees of the city council, representatives of NGOs, ecologists, long-term residents, and tourists. Secondly, the evaluation framework should be amplified to include a new layer on ecological values. These values may be reflected in an objective manner via the assessment of the percentage share of the biologically active areas within each site or via the assessment of the studies’ ecological quality. The latter can be executed on the basis of the application of landscape metrics [67] or composite indices such as the indicator of ecological landscape quality [68] or index of landscape disharmony [69], proven to reflect landscape quality in relation to Polish environmental conditions. The subjective dimension of ecological values may be expressed twofold. First of all, by taking the opinion of ecologists in the first stage of the study, they probably would indicate ULOs of high ecological values, unknown to other groups of respondents. Secondly, ecologists’ subjective assessment of the intangible values would give more scores to environmental values, which may be underestimated by other groups.

5. Conclusions

The applied method fulfilled all the requirement set out at the beginning of the study as it allowed us to (1) merge social and expert opinions on ULOs, (2) analyze diverse characteristics of urban space including tangible and intangible characteristics, (3) quantitatively present the results of value assessments enabling comparisons among different aspects, and (4) map both objective and subjective values of ULOs on the same scale. Additionally, the example test area enabled the authors to answer the three following research questions being the basis of the study development:
How do people perceive ULOs located in different sites? Respondents highly appreciated the Old Town and the Campus as they used ULOs located in these areas in their everyday life. Their personal experience and connection to those objects was stronger and more easily expressed. Respondents had only limited acquaintance with the Lagoon as they provided few indications of landscape elements in this area and ascribed low rating positions to them. This likely resulted from the peripheral localization of the Lagoon and the homogeneous characteristics of elements located within this site.
What kinds of tangible values are possessed by different ULOs and how can they be expressed? The results showed that the analyzed ULOs, depending on the site type, possessed outstanding heritage values, high entertainment, and high symbolic values (the Old Town), high educational values (Campus), and no outstanding values (the Lagoon). These values could be expressed on the basis of the objective grading scale, which was itself based on unequivocal and open data, available on official databases. As a result, the results of the assessment would be the same regardless of the evaluator.
How can intangible and tangible values be merged? The aggregation procedures based on the application of mathematical models allowed the authors to objectively express both tangible and intangible values of ULOs using the same scale and on a map. Such a form of presentation is of high relevance to decision-makers and is easily understood by the general public. In urban planning, spatial presentation is a basis for making decisions in reference to the real location of such areas.
To summarize, the proposed method has the potential to be implemented in the practice of urban landscape planning at the city level, providing the illusion of opinions from diverse actor groups and supplementing the method with criteria from ecological value assessments.

Author Contributions

Conceptualization, B.S.-Ś. and M.M.-Ś.; methodology, B.S.-Ś.; software, B.S.-Ś. and M.M.-Ś.; validation, B.S.-Ś.; formal analysis, B.S.-Ś.; investigation, B.S.-Ś., M.M.-Ś. and D.S.; resources, B.S.-Ś., M.M.-Ś., and A.K.; data curation, B.S.-Ś. and M.M.-Ś.; writing—original draft preparation, B.S.-Ś. and M.M.-Ś.; writing—review and editing, M.M.-Ś. and A.K.; visualization, M.M.-Ś.; supervision, B.S.-Ś.; project administration, M.M.-Ś.; funding acquisition, B.S.-Ś. and M.M.-Ś. All authors have read and agreed to the published version of the manuscript.

Funding

The research was funded by the Ministry of Science and Higher Education (Poland) for the dissemination of science (766/P-DUN/2019).

Conflicts of Interest

The authors declare no conflict of interest.

Appendix A

Table A1. The mean grading points ascribed to analyzed ULOs and the results of the ranking and aggregation procedures.
AreaNumerical SymbolUrban Landscape ElementsSubjective ApproachObjective ApproachAULEs
AestheticSpiritualEnjoymentUniversalSymbolicEducationalEntertainmentHeritage
The Old Town1Lublin Castle2.41.41.72.033320.93
2Stairs leading to the castle1.91.11.51.511220.56
3Castle Square1.80.91.41.422300.73
4Castle bridge2.21.21.71.721000.48
5Parkland next to the Old Town (Błonia)1.71.41.41.410300.61
6Ice cream shops near the castle1.10.60.90.810010.10
7Archcathedral2.42.31.51.832320.92
8Trinity Tower2.11.01.11.733220.89
9Crown Tribunal1.90.80.91.322320.81
10Cracow Gate2.31.01.81.933120.82
11Fara Square2.11.41.91.922320.91
12Pub “U Szewca”2.10.81.31.211320.64
13Restaurant “Czarcia łapa”1.90.81.01.101110.27
14Restaurant “Stół I wół”2.00.71.21.001110.31
15Dominican Church2.32.31.41.832320.92
16Pub “U Świętego Michała”2.10.71.31.001120.40
Campus17The building of “AGRO”2.01.21.01.313300.66
18Swimming pool2.00.81.41.612300.64
19The new building of veterinary department2.40.90.61.003100.44
20Centre of innovation and implementation2.61.21.21.603100.55
21Library2.12.01.41.803200.57
22Building of rector’s office1.40.81.01.213000.42
23University Park1.71.41.61.601100.44
24Main building of Marie Curie-Skłodowska University1.00.70.40.813100.20
25Main building of the University2.51.71.01.523300.77
26Cinema “Bajka”0.90.60.71.001300.27
27The University sport center1.40.80.91.202300.54
28Students’ dormitory of UMCS1.20.80.80.902000.21
29Tennis courts1.80.91.21.300300.47
30Night club “Pause”0.70.40.90.800300.14
Lagoon31Aqua park “Słoneczny Wrotków”1.61.21.01.000300.42
32The dam1.20.60.70.801000.07
33The marina1.71.51.21.711100.45
34Bicycle path2.11.41.51.411100.45

References

  1. United Nations, Transforming our World: The 2030 Agenda for Sustainable Development. Available online: sustainabledevelopment.un.org (accessed on 2 May 2020).
  2. Sarinen, R. Social Impact Assessment in Urban Planning. In The Sustainable City III; Marchettini, N., Ed.; WIT Press: Southampton, UK, 2004; Volume 72. [Google Scholar] [CrossRef]
  3. Khorassani, S.M.; Ferrari, A.M.; Pini, M.; Blundo, D.S.; Muiña, F.E.G.; García, J.F. Environmental and social impact assessment of cultural heritage restoration and its application to the Uncastillo Fortress. Int. J. Life Cycle Assess. 2019, 24, 1297–1318. [Google Scholar] [CrossRef]
  4. Tveit, M.S.; Ode, S.A. Landscape Assessment in Metropolitan Areas—Developing a Visual Indicator-Based Approach. SPOOL 2014, 1, 301–316. Available online: https://journals.open.tudelft.nl/spool/article/view/641 (accessed on 2 June 2020). [CrossRef]
  5. Gavrilidisa, A.A.; Ciocăneaa, C.M.; Nițăa, M.R.; Onosea, D.A.; Năstase, I.I. Urban Landscape Quality Index—planning tool for evaluating urban landscapes and improving the quality of life. Procedia Environ. Sci. 2016, 32, 155–167. [Google Scholar] [CrossRef] [Green Version]
  6. Collado, C.V.; Gomez-Pardo, G.S. Urban landscape assessment. In City and Territory in the Globalization Age, Proceedings of the 24th ISUF International Conference, Valencia, Spain, 27–29 September 2017; Book of Papers; Editorial Universitat Politècnica de València: Valencia, Spain, 2018; pp. 1501–1511. [Google Scholar] [CrossRef] [Green Version]
  7. Delsante, I. Urban environment quality assessment using a methodology and set of indicators for medium-density neighbourhoods: A comparative case study of Lodi and Genoa. Ambiente Construido 2016, 16, 3. [Google Scholar] [CrossRef] [Green Version]
  8. Mirabella, N.; Allacker, K. The Environmental Footprint of Cities: Insights in the Steps forward to a New Methodological Approach. Procedia Environ. Sci. 2018, 38, 635–642. [Google Scholar] [CrossRef]
  9. Wickham, J.D.; Riitters, K.H.; Wade, T.G.; Vog, P. A national assessment of green infrastructure and change for the contiguous United States using morphological image processing. Landsc. Urban Plan. 2010, 94, 3–4, 15, 186–195. [Google Scholar] [CrossRef]
  10. Demuzerea, M.; Orrubc, K.; Heidrichd, O.; Olazabalej, E.; Genelettif, D.; Orrugh, H.; Bhavei, A.G.; Mittali, N.; Feliue, E.; Faehnlejk, M. Mitigating and adapting to climate change: Multi-functional and multi-scale assessment of green urban infrastructure. J. Environ. Manag. 2014, 146, 15, 107–115. [Google Scholar] [CrossRef]
  11. Kim, G.; Miller, P.A.; Nowak, D.J. Assessing urban vacant land ecosystem services: Urban vacant land as green infrastructure in the City of Roanoke, Virginia. Urban For. Urban Green. 2015, 14, 519–526. [Google Scholar] [CrossRef]
  12. He, J.; Tsou, J.Y.; Xue, Y.; Chow, B. A Visual Landscape Assessment Approach for High-density Urban Development. Comput. Aided Archit. Des. Futures 2005, 125–134. [Google Scholar]
  13. Keshtkaran, R.; Habibi, A.; Sharif, H.R. Aesthetic Preferences for Visual Quality of Urban Landscape in Derak High-Rise Buildings (Shiraz). J. Sustain. Dev. 2017, 10, 94. [Google Scholar] [CrossRef]
  14. Gómez-Baggethun, E.; Gren, Å.; Barton, D.; Langemeyer, J.; McPhearson, T.; O’Farrell, P.; Andersson, E.; Hamstead, Z.; Kremer, P. Urban Ecosystem Services. In Urbanization, Biodiversity and Ecosystem Services: Challenges and Opportunities; Springer: Dordrecht, The Netherlands, 2013; Chapter 11; pp. 175–251. [Google Scholar] [CrossRef] [Green Version]
  15. Gómez-Baggethun, E.; Barton, D.N. Classifying and valuing ecosystem services for urban planning. Ecol. Econ. 2013, 86, 235–245. [Google Scholar] [CrossRef]
  16. Sieber, J.; Pons, M. Assessment of Urban Ecosystem Services using Ecosystem Services Reviews and GIS-based Tools. Procedia Eng. 2015, 115, 53–60. [Google Scholar] [CrossRef] [Green Version]
  17. Dou, Y.; Zhen, L.; De Groot, R.; Du, B.; Yu, X. Assessing the importance of cultural ecosystem services in urban areas of Beijing municipality. Ecosyst. Serv. 2017, 24, 79–90. [Google Scholar] [CrossRef]
  18. Riechers, M.; Strack, M.; Barkmann, J.; Tscharntke, T. Cultural Ecosystem Services Provided by Urban Green Change along an Urban-Periurban Gradient. Sustainability 2019, 11, 645. [Google Scholar] [CrossRef] [Green Version]
  19. Czyńska, K.; Rubinowicz, P. Visual protection surface method: Cityscape values in context of tall buildings. In Proceedings of the Conference: 10th Space Syntax Symposium (SSS10), London, UK, 13–17 July 2015; University College London: London, UK, 2015; Available online: http://project2tall.zut.edu.pl/wp-content/uploads/2016/05/2015_SSS10_Proceedings_142.pdf (accessed on 20 August 2020).
  20. Fan, C.; Myint, S. A comparison of spatial autocorrelation indices and landscape metrics in measuring urban landscape fragmentation. Landsc. Urban Plan. 2014, 121, 117–128. [Google Scholar] [CrossRef]
  21. Borana, S.L.; Yadav, S.K. Urban Landscape Assessment Using Spatial Metrics: A Temporal Analysis of Jodhpur City. Int. J. Adv. Res. Comput. Sci. Manag. Stud. 2017, 5, 58–64. [Google Scholar]
  22. Ramachandra, T.V.; Bharath, H.A.; Sreekantha, S. Spatial Metrics based Landscape Structure and Dynamics Assessment for an emerging Indian Megalopolis. (Ijarai) Int. J. Adv. Res. Artif. Intell. 2012, 1, 48–57. [Google Scholar]
  23. Sowińska-Świerkosz, B.; Michalik-Śnieżek, M. The Mehodology of Landscape Quality (LQ) Indicators Analysis Based on Remote Sensing Data: Polish National Parks Case Study. Sustainability 2020, 12, 2810. [Google Scholar] [CrossRef] [Green Version]
  24. Lynch, K. The Image the City; The MIT Press: Cambridge, MA, USA, 1960; ISBN 0-262-62001-4. [Google Scholar]
  25. Lynch, K. Good City Form; The MIT Press: Cambridge, MA, USA, 1984. [Google Scholar]
  26. Dastgerdi, A.S.; De Luca, G. Joining Historic Cities to the Global World: Feasibility or Fantasy? Sustainability 2019, 11, 2662. [Google Scholar] [CrossRef] [Green Version]
  27. Osóch, B.; Czaplińska, A. City image based on mental maps—The case study of Szczecin (Poland). Misc. Geogr. 2019, 23, 111–119. [Google Scholar] [CrossRef] [Green Version]
  28. Huang, J.; Obracht-Prondzynska, H.; Kamrowska-Zaluska, D.; Sun, Y.; Li, L. The image of the City on social media: A comparative study using “Big Data” and “Small Data” methods in the Tri-City Region in Poland. Landsc. Urban Plan. 2020, 206, 26. [Google Scholar] [CrossRef]
  29. Wang, E.; Kang, N.; Yu, Y. Valuing Urban Landscape Using Subjective Well-Being Data: Empirical Evidence from Dalian, China. Sustainability 2017, 10, 36. [Google Scholar] [CrossRef] [Green Version]
  30. Brown, G. Mapping landscape values and development preferences: A method for tourism and residential development planning. Int. J. Tour. Res. 2006, 8, 101–113. [Google Scholar] [CrossRef]
  31. Bąkowska-Waldmann, E.; Kaczmarek, T. The Use of Geo-Questionnaire in Spatial Planning: Experience from Poland. Int. J. E Plan. Res. 2019, 8, 45–67. [Google Scholar] [CrossRef]
  32. Sieber, R. Public Participation Geographic Information Systems: A Literature Review and Framework. Ann. Assoc. Am. Geogr. 2006, 96, 491–507. [Google Scholar] [CrossRef]
  33. Jankowski, P.; Czepkiewicz, M.; Młodkowski, M.; Zwoliński, Z. Geo-questionnaire: A Method and Tool for Public Preference Elicitation in Land Use Planning. Trans. Gis 2015. [Google Scholar] [CrossRef]
  34. Sowińska-Świerkosz, B.; Chmielewski, T.J. A new approach to the identification of Landscape Quality Objectives (LQOs) as a set of indicators. J. Environ. Manag. 2016, 184, 596–608. [Google Scholar] [CrossRef]
  35. Sowińska-Świerkosz, B. Review of cultural heritage indicators: Types, categorisation schemes and their usefulness in landscape quality assessment. Ecol. Indic. 2017, 81, 526–542. [Google Scholar] [CrossRef]
  36. Heth, C.D.; Cornell, E.H.; Alberts, D.M. Differential Use of Landmarks by 8- and 12-Year-Old Children during Route Reversal Navigation. J. Environ. Psychol. 1997, 17, 199–213. [Google Scholar] [CrossRef]
  37. Elyas, V.M.; Ibrahim, R. People’s evaluation towards media façade as new urban landmarks at night. Int. J. Archit. Res. ArchNet IJAR 2016, 10, 257–273. [Google Scholar]
  38. ELC European Landscape Convention, Florence, Italy, 20 October 2000. Available online: https://rm.coe.int/16802f1409 (accessed on 14 July 2020).
  39. Plieninger, T.; Dijks, S.; Oteros-Rozas, E.; Bielingd, C. Assessing mapping and quantifying cultural ecosystem services at community level. Land Use Policy 2013, 33, 118–129. [Google Scholar] [CrossRef] [Green Version]
  40. Mitsche, N.; Vogt, F.; Knox, D.; Cooper, I.; Lombardi, P.; Ciaffi, D. Intangibles—enhancing access to cities’ cultural heritage through interpretation. Int. J. Cult. Tour. Hosp. Res. 2013, 7, 68–77. [Google Scholar] [CrossRef] [Green Version]
  41. Siountri, K.; Vergados, D.D. Smart cultural heritage in digital cities. J. Saustainable Dev. Cult. Tradit. SDCT J. 2019. [Google Scholar] [CrossRef]
  42. Kalaycı Önaç, A.; Birişçi, T. Transformation of urban landscape value perception over time: A Delphi technique application. Environ. Monit Assess. 2019, 191, 741. [Google Scholar] [CrossRef]
  43. Gungor, S.; Polat, A.T. Relationship between visual quality and landscape characteristics in urban parks (Article). J. Environ. Prot. Ecol. 2018, 19, 939–948. [Google Scholar]
  44. Hems, A. Introduction: Beyond the graveyard—Extending audiences, enhancing understanding. In Heritage Interpretation; Hems, A., Blockley, M., Eds.; English Heritage: Swindon, UK; Routledge, UK, 2006. [Google Scholar]
  45. Wills-Herrera, E.; Islam, G.; Hamilton, M. Subjective Well-Being in Cities: A Multidimensional Concept of Individual, Social and Cultural Variables. Appl. Res. Qual. Life 2009, 4, 201–221. [Google Scholar] [CrossRef]
  46. Jasiecki, K. Social participation problems in Poland and the way they influence public policy. Studia z Polityki Publicznej Public Policy Stud. 2015, 3, 101–119. [Google Scholar] [CrossRef]
  47. Feltynowski, M. Public Participation in Spatial Planning in Poland as an Element of Evidence Based Urban Planning—Case Study of Lodz. J. Eur. Econ. 2015, 14, 280–289. [Google Scholar]
  48. Data and Stats of Lublin city. Available online: https://lublin.eu/mieszkancy/partycypacja/lublin-dla-wszystkich/lublin-miedzykulturowy/dane-i-statystyki/ (accessed on 2 February 2019).
  49. Haines-Young, R.; Potschin-Young, M. Revision of the Common International Classification for Ecosystem Services (CICES V5.1): A Policy Brief. One Ecosyst. 2018, 3, e27108. [Google Scholar] [CrossRef]
  50. Skřivanová, Z.; Kalivoda, O. Perception and assessment of landscape aesthetic values in the Czech Republic—A literature review. J. Landsc. Stud. 2010, 3, 211–220. [Google Scholar]
  51. Oladeji, S.O.; Agbelusi, E.A.; Ajiboye, A.S. Assessment of Aesthetic Valeus of Old Oyo National Park. Am. J. Tour. Manag. 2012, 1, 69–77. [Google Scholar] [CrossRef] [Green Version]
  52. Subiza-Péreza, M.; Vozmediano, L.; San Juana, C. Green and blue settings as providers of mental health ecosystem services: Comparing urban beaches and parks and building a predictive model of psychological restoration. Landsc. Urban Plan. 2020, 204. [Google Scholar] [CrossRef]
  53. Getz, D. Event Management and Event Tourism, 2nd ed.; Cognizant: New York, NY, USA, 2005; pp. 152–188. [Google Scholar]
  54. Rodwell, D. Managing Historic Cities. The Management Plans for the Bath and Edinburgh World Heritage Sites. J. Archit. Conserv. 2006, 12, 41–62. [Google Scholar] [CrossRef]
  55. Cody, J.; Siravo, F. Historic Cities: Issues in Urban Conservation; The Getty Conservation Institute: Los Angeles, CA, USA, 2019; pp. 1–632. [Google Scholar]
  56. Atanur, G.; Ozdi, T.; Polat, S. Measuring Social Performance in Historical City Centers for Sustainable Urban Landscapes: A Case Study of Bursa Unesco Heritage Site. Conference Paper. European Council of Landscape Architecture Schools/Creation Reaction. London. 2017. Available online: https://www.researchgate.net/publication/320555939_MEASURING_SOCIAL_PERFORMANCE_IN_HISTORICAL_CITY_CENTERS_FOR_SUSTAINABLE_URBAN_LANDSCAPES_A_CASE_STUDY_OF_BURSA_UNESCO_HERITAGE_SITE (accessed on 21 May 2019).
  57. Jorgensen, B.S.; Stedman, R.C. Sense of place as an attitude: Lakeshore owners attitudes toward their properties. J. Environ. Psychol. 2001, 21, 233–248. [Google Scholar] [CrossRef]
  58. Wartmann, F.M.; Purves, R.S. Investigating sense of place as a cultural ecosystem service in different landscapes through the lens of language. Landsc. Urban Plan. 2018, 175, 169–183. [Google Scholar] [CrossRef]
  59. Keles, E.; Atik, D.; Bayrak, G. Visual Landscape Quality Assessment in Historical Cultural Landscape Areas. Eur. J. Sustain. Dev. 2018, 7, 287–300. [Google Scholar] [CrossRef] [Green Version]
  60. De Vreese, R.; Leys, M.; Fontaine, C.M.; Dendoncker, N. Social mapping of perceived ecosystem services supply—The role of social landscape metrics and social hotspots for integrated ecosystem services assessment landscape planning and management. Ecol. Indic. 2016, 66, 517–533. [Google Scholar] [CrossRef]
  61. Riechers, M.; Barkmann, J.; Tscharntke, T. Perceptions of cultural ecosystem services from urban green. Ecosyst. Serv. 2016, 17, 33–39. [Google Scholar] [CrossRef]
  62. Vejre, H.; Jensen, F.S.; Thorsen, B.J. Demonstrating the importance of intangible ecosystem services from peri-urban landscapes. Ecol. Complex. 2010, 7, 338–348. [Google Scholar] [CrossRef]
  63. Egoh, B.; Reyers, B.; Rouget, M.; Richardson, D.M.; Le Maitre, D.C.; van Jaarsveld, A.S. Mapping ecosystem services for planning and management. Agric. Ecosyst. Environ. 2008, 127, 135–140. [Google Scholar] [CrossRef]
  64. Palomo, I.; Martín-López, B.; López-Santiago, C.; Montes, C. Participatory scenario planning for protected areas management under the ecosystem services framework: The Doňana social-ecological system in Southwestern Spain. Ecol. Soc. 2011, 16, 1–23. [Google Scholar] [CrossRef] [Green Version]
  65. Palomo, I.; Martin-López, B.; Alcorlo, P.; Montes, C. Limitations of Protected Areas Zoning in Mediterranean Cultural Landscapes under the Ecosystem Services Approach. Ecosystems 2014, 17, 1202–1215. [Google Scholar] [CrossRef]
  66. Sowińska-Świerkosz, B.; Chmielewski, T.J. Comparative assessment of public opinion on the landscape quality of two biosphere reserves in Europe. Environ. Manag. 2014, 54, 531–556. [Google Scholar] [CrossRef] [PubMed] [Green Version]
  67. Uuemaa, E.; Antrop, M.; Roosaare, J.; Marja, R.; Mander, U. Landscape Metrics and Indices: An Overview of Their Use in Landscape Research. Living Rev. Landscape Res. 2009, 3, 1–28. [Google Scholar] [CrossRef]
  68. Sowińska-Świerkosz, B.; Michalik-Śnieżek, M. Landscape indicators as a tool of assessing landscape quality. E3S Web Conf. 2020, 171, 02011. [Google Scholar] [CrossRef]
  69. Sowińska-Świerkosz, B. Index of Landscape Disharmony (ILDH) as a new tool combining the aesthetic and ecological approach to landscape assessment. Ecol. Indic. 2016, 70, 166–180. [Google Scholar] [CrossRef]
Figure 1. Location of study areas within: (A) Europe; (B) Poland; (C) Lublin city border.
Land 09 00502 g001
Figure 2. Methodological framework based on three research questions.
Land 09 00502 g002
Figure 3. Methodological framework illustrated by the examples of three analyzed ULOs located in different sites: Lublin castle (Old town), Center of Innovation (Campus), and the dam (Lagoon).
Land 09 00502 g003
Figure 4. Results of ULO mapping, taking into account ranking positions and hotspots. Ordinal numbers of rated objects are marked on the maps. The size of the symbol results from the ranks of the objects that were calculated according to Equation (2).
Land 09 00502 g004
Figure 5. Maximum, minimum, and mean values given to each of the three sites analyzed.
Land 09 00502 g005
Table 1. Profile of the respondents (students who express their preferences on intangible values of urban landscape objects (ULOs)).
Age20–23 years old100%
GenderFemale73%
Male27%
OriginVillage55%
Small-size city (up to 10,000 inhabitants)8%
Medium-size city (10,000–50,000 inhabitants)16%
Large-size city (more than 50,000 inhabitants)21%
Period of stay in Lublin I do not stay in/commute to Lublin everyday20%
1–5 years53%
More than 5 years27%
Table 2. Ranking assessment criteria: a four-point scale adopted in the assessment of tangible and intangible values of ULOs. PPGIS, public participation geographic information systems; UNESCO, United Nations Educational, Scientific and Cultural Organization.
A. Questionnaire Implemented to Assess the Intangible Values of ULOs: Subjective Approach Based on PPGIS MethodB. Ranking Scale Adopted to Analysis Tangible Values of ULOs: Objective Approach Based on Systematic Review
Aesthetic ValuesSymbolic Values
Respondents’ opinion on the aesthetic values of a landscape object.
0—None of this landscape’s objects are visually attractive to me. I think that these elements need fundamental changes aimed at improving their aesthetic values.
1—Only a few of the features of this landscape’s object are visually attractive to me. I think that these elements need major changes aimed at improving their aesthetic values.
2—The overwhelming majority of this landscape’s object features are visually attractive to me. I think that these elements need only cosmetic changes aimed at improving their aesthetic values.
3—All of this landscape’s objects are visually attractive to me. I think that these elements need no changes aimed at improving their aesthetic values.
Grading scale adopted by experts:
0—an object was not included in representations
1—an object found in 1 to 10 representations
2—an object found in 11 to 25 representations
3—an object found in more than 25 representations
according to the 7 guides of Lublin from years 1901–2014
Spiritual ValuesEducational Values
Respondents’ opinion on the sacred and religious services provided by a landscape object.
0—In my opinion, this place is unsuitable for contemplation, meditation, or prayer. I have never done it here, and I am not going to do this.
1—In my opinion, this might be an adequate place to contemplate, meditate, or pray. I have never done this here, but I could try to do it.
2—In my opinion, this place is adequate to contemplate, meditate, or pray. I sometimes did/do this in this place or, if I would like to contemplate, meditate, or pray, I would willingly choose this place.
3—In my opinion, this is a very good place to contemplate, meditate or pray. I did/do this in this place many times or, if I would like to contemplate, meditate, or pray, I will first choose this place.
Grading scale adopted by experts:
0—landscape object of no educational function
1—landscape object of the potential educational function (no educational infrastructure, but you can learn something just by observing)
2—landscape object of secondary educational function (having information boards, construction plans, historical descriptions, etc.)
3—landscape object of major education function (e.g., museum, regional room)
Enjoyment ValuesEntertainment Values
Respondents opinion on the existing services provided by a landscape object.
0—I do not enjoy this landscape object.
1—I rather enjoy this landscape object. I could go there from time to time.
2—I enjoy this landscape object. I would like to go there often.
3—I enjoy this landscape object. I would like to go there as often as possible.
Grading scale adopted by experts:
0—landscape object that is not a place of any cultural events
1—landscape object being the place of 1 or 2 cultural events per year *
2—landscape object being the place of 3 to 5 cultural events per year *
3—landscape object being the place of more than 5 cultural events per year *
* according to the official website of the Lublin City and official websites of particular landscape object
according to Getz typology of planned events [53]
Universal ValuesHeritage Values
Respondents opinion on the willingness to make efforts to preserve a landscape object.
0—I think that this landscape object does not necessarily have to be preserved.
1—I think this landscape object should be preserved, but I am not ready to pay for it or devote my spare time.
2—I could pay less than 20 PLN (5 EUR) and/or devote less than 1 h to preserve this landscape object.
3—I could pay more than 20 PLN (5 EUR) and/or devote more than 1 h to preserve this landscape object.
Grading scale adopted by experts:
0—landscape object that is not legally protected
1—landscape object in municipal register *
2—landscape object in the registry of monuments **
3—landscape object being the part of a UNESCO World Heritage site **
* according to the registry of Lublin community. ** according to the registry of The National Heritage Board of Poland.
Table 3. Results of Kruskal–Wallis (K–W) test together with Dunn post hoc test further adjusted by the Holm (H) FWER method (levels: value type to ULOs in all sites).
Values’ Typesp-Value *Values’ Typesp-Value *Values’ Typesp-Value *
A.
All values’ types
K–W test: n = 272; d.f. = 7; H = 51.78; p < 0.00001
B.
Intangible values
K–W test: n = 136; d.f. = 3; H = 39.91; p < 0.00001
C.
Tangible values
K–W test: n = 136; d.f. = 3; H = 24.58; p = 0.00002
Aesthetic vs. spiritual/enjoyment/heritage/symbolic<0.0001Aesthetic vs. spiritual/enjoyment/universal<0.0001Entertainment vs. educational0.521
Entertainment vs. spiritual0.015Universal vs. spiritual0.041Entertainment vs. heritage<0.0001
Entertainment vs. enjoyment0.155Universal vs. enjoyment0.348Entertainment vs. symbolic0.011
Entertainment vs. heritage<0.0001- Entertainment vs. heritage0.001
Entertainment vs. symbolic0.014- Educational vs. symbolic0.055
Educational vs. heritage0.001- Symbolic vs. heritage0.362
Educational vs. enjoyment0.669- -
Educational vs. spiritual0.099- -
Educational vs. heritage0.06- -
Educational vs. symbolic0.0944- -
Universe vs. heritage0.602- -
* p-Value mean post hoc test value.
Table 4. Results of the Kruskal–Wallis test (p < 0.05, n = 34; d.f. = 2) together with Dunn post hoc test further adjusted by the Holm FWER method (levels: value types to ULOs among different sites); n.s., not significant; s., significant.
Kruskal–Wallis Chi-Squared Statisticp-ValueSignificanceSitesp-Value
Aesthetic3.9430.139n.s.--
Spiritual0.9050.636n.s.--
Enjoyment7.6450.022s.Old town vs. Campus0.019
Old town vs. Lagoon0.393
Universal3.1380.208n.s.--
Educational7.0500.023s.Campus vs. Old town0.213
Campus vs. Lagoon0.022
Old town vs. Lagoon0.123
Heritage22.055<0.0001s.Old town vs. Campus/Lagoon<0.0001
Entertainment1.2720.529n.s.--
Symbolic10.4180.005s.Old town vs. Campus0.006
Old town vs. Lagoon0.142
Campus vs. Lagoon0.826
Table 5. ANOVA for factor groups (levels: value types in each site—Old Town, Lagoon).
The Old TownLagoon
n = 128; α = 0.05; Fcrit = 2.103;
F7,120 = 2.42; p = 0.023
n = 32; α = 0.05; Fcrit = 2.514;
F7,24 =3.124; p = 0.017
MeanMedianMeanMedian
Aesthetic2.022.101.651.65
Spiritual1.151.001.181.30
Enjoyment1.381.401.101.10
Universal1.471.451.231.20
Educational1.561.500.751.00
Heritage1.442.000.000.00
Entertainment2.002.501.251.00
Symbolic1.692.000.500.50
Table 6. Results of the Tukey post hoc test (levels: value types in each site—Old Town, Lagoon).
The Old TownLagoon
LevelsQ Statisticp-ValueLevelsQ Statisticp-Value
Aesthetic vs. spiritual4.47380.040Aesthetic vs. heritage 5.6370.011
Entertainment vs. spiritual 4.37720.048---
Table 7. Results of the Kruskal–Wallis test together with Dunn post hoc test further adjusted by the Holm FWER method (levels: value types in each site—Campus).
Values’ Typesp-Value
n = 112; d.f. = 7; H = 55.198; p < 0.0001
Aesthetic vs. spiritual0.474
Aesthetic vs. entertainment0.675
Aesthetic vs. heritage<0.001
Aesthetic vs. symbolic0.003
Educational vs. spiritual0.196
Educational vs. enjoyment0.323
Educational vs. entertainment/symbolic/heritage<0.001
Spiritual vs. heritage0.045
Spiritual vs. entertainment0.493
Universal vs. heritage0.0006
Universal vs. entertainment0.691
Universal vs. symbolic0.805
Entertainment vs. symbolic0.004
Entertainment vs. heritage0.023
Table 8. Results of the Kruskal–Wallis together with Dunn post hoc test further adjusted by the Holm FWER method (levels: Agregation index of ULOs (AULOs) among sites).
Values’ Typesp-Value
n = 34; d.f. = 2; H = 6.617; p = 0.036
Old town vs. Campus/Lagoon0.063
Campus vs. Lagoon0.434
Table 9. Summary of results on differences among the social perception, expert assessment, and total values of analyzed sites.
The Old TownCampusLagoonAll Sites
Social perceptionGood acquaintance of the site; high aesthetic and enjoyment valuesGood acquaintance of the site; high aesthetic valuesLimited acquaintance of the siteAesthetic values were the most appreciated
Expert assessmentOutstanding heritage values; high entertainment and symbolic valuesHigh educational valuesLow heritage valuesHigh entertainment and educational values
Intangible vs. tangible valuesNo differencesNo differencesIntangible values are more significantNo differences
Total values (AULOs)HighMediumLow-
ULO of the highest values Land 09 00502 i001
Lublin Castle
Land 09 00502 i002
Main building of the John Paul II Catholic University of Lublin
Land 09 00502 i003
The bicycle path
Lublin Castle
ULO of the lowest values Land 09 00502 i004
Ice cream shops near the castle
Land 09 00502 i005
Main building of Marie Curie-Sklodowska University
Land 09 00502 i006
The dam
The dam
Publisher’s Note: MDPI stays neutral with regard to jurisdictional claims in published maps and institutional affiliations.

