Estimating the Impact of Urban Planning Concepts on Reducing the Urban Sprawl of Ulaanbaatar City Using Certain Spatial Indicators


Abstract
1. Introduction
- To study the current situation of Ulaanbaatar City’s uncontrolled sprawl starting in 1990 and identify its coverage and define current urban form;
- To analyze the impacts of different urban development concepts applied in Ulaanbaatar City’s master plan on the urban form in relation to urban sprawl by using spatial indicators; and
- To estimate the impact of each urban development concepts by comparing and integrating using certain spatial indicators on reducing the urban sprawl of Ulaanbaatar city.
2. Methods and Data
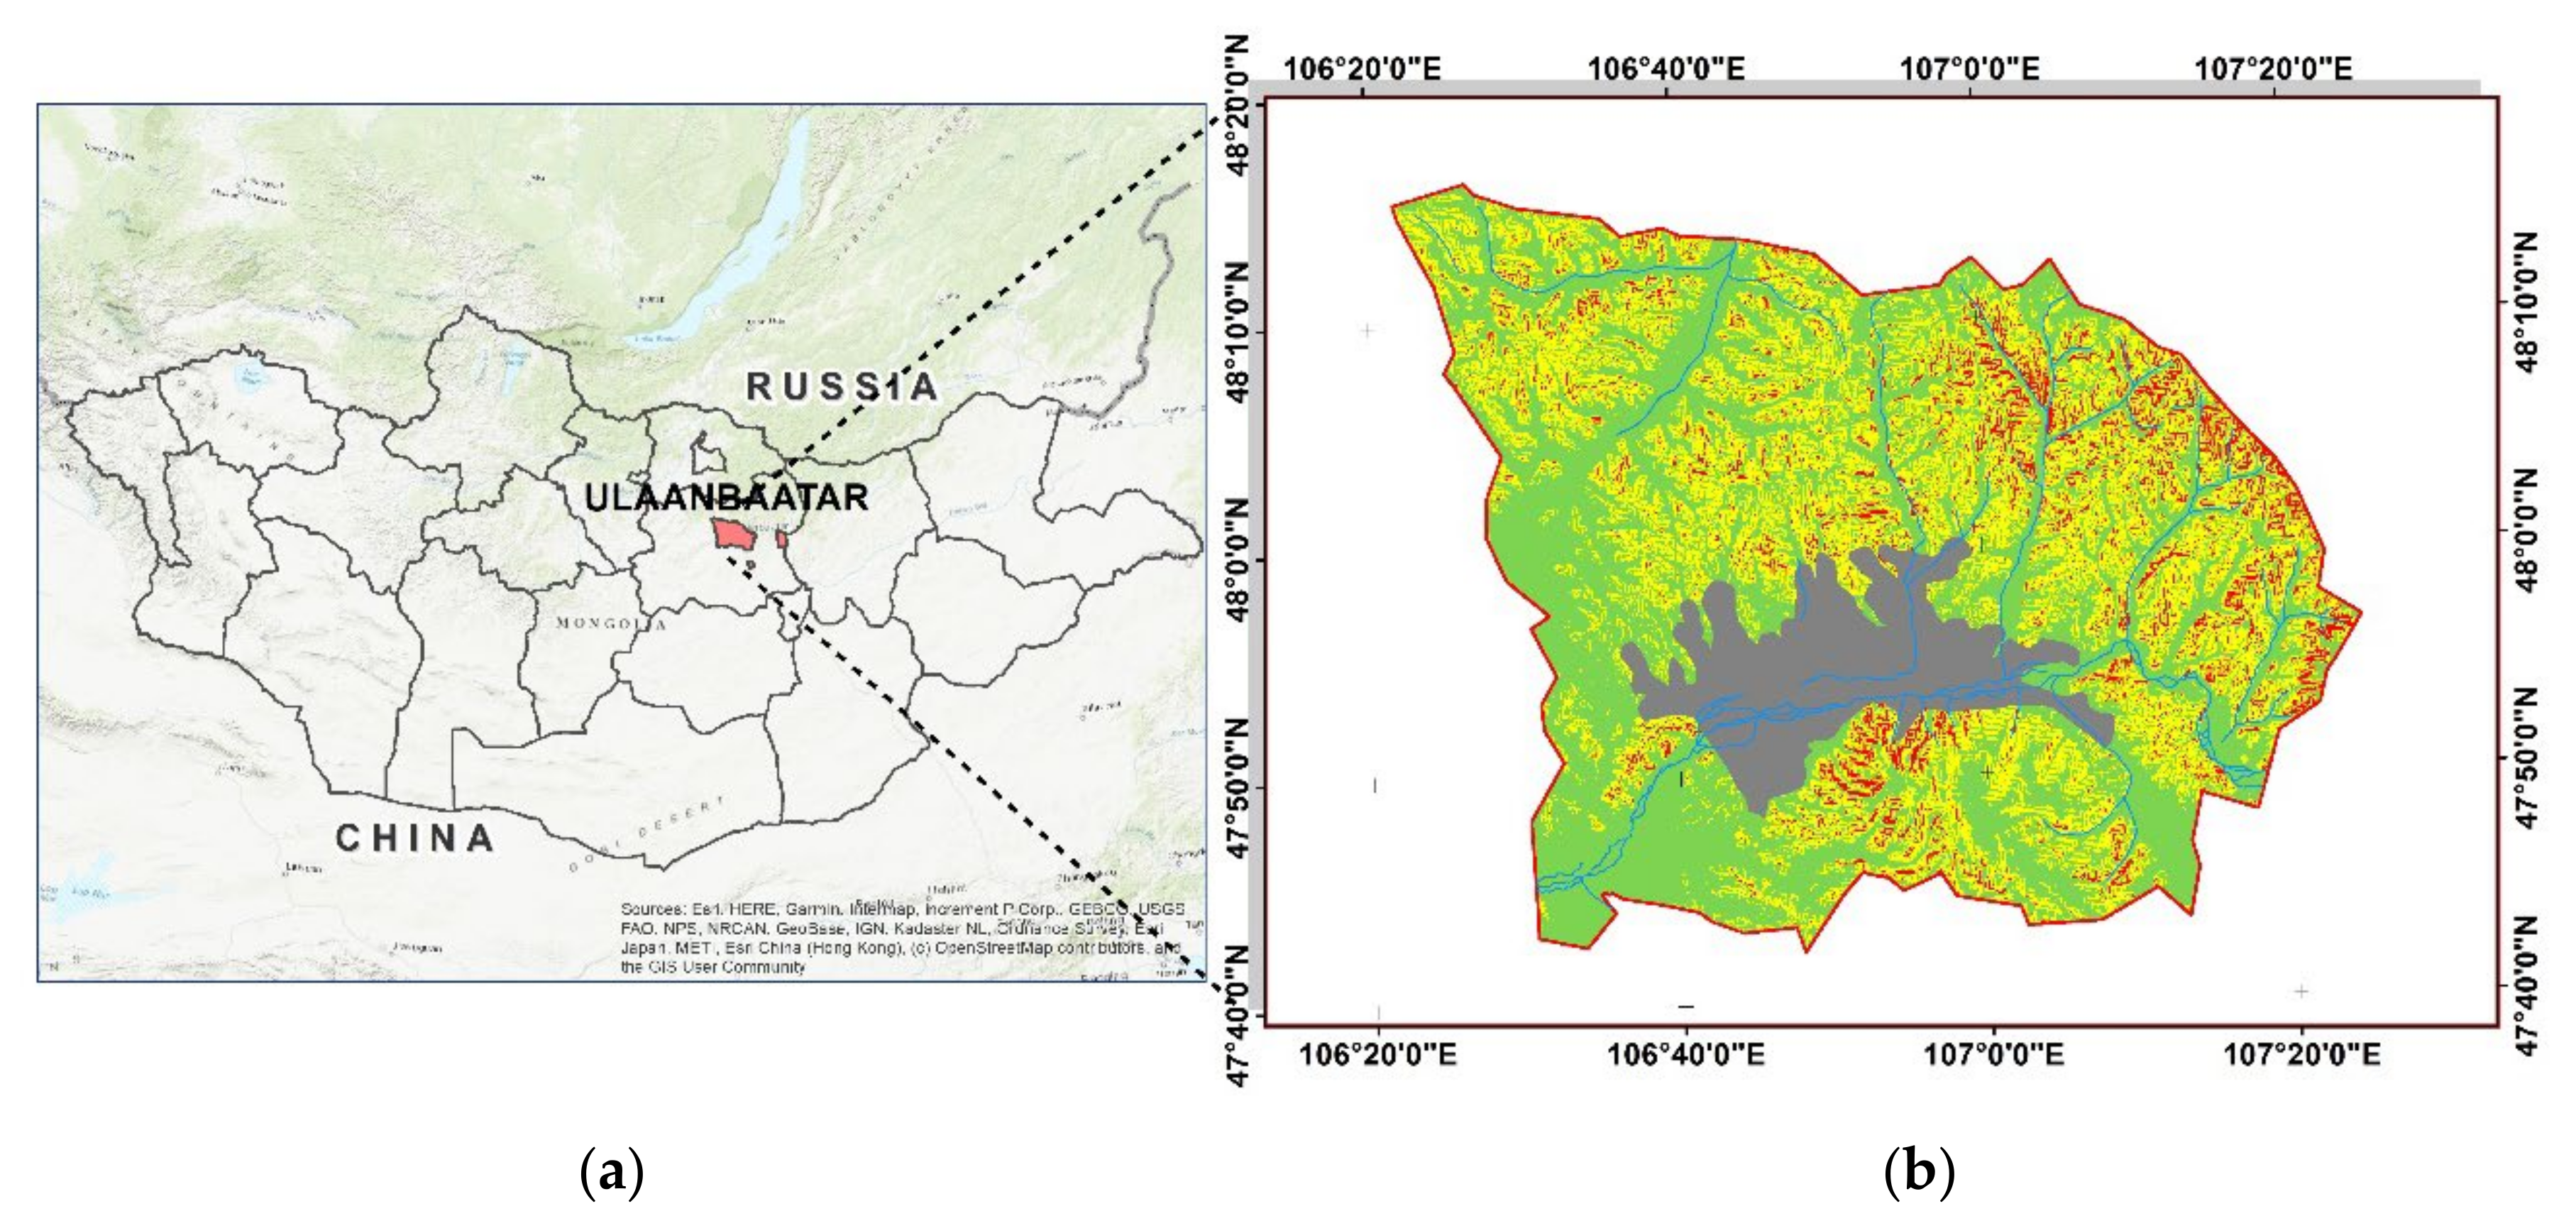
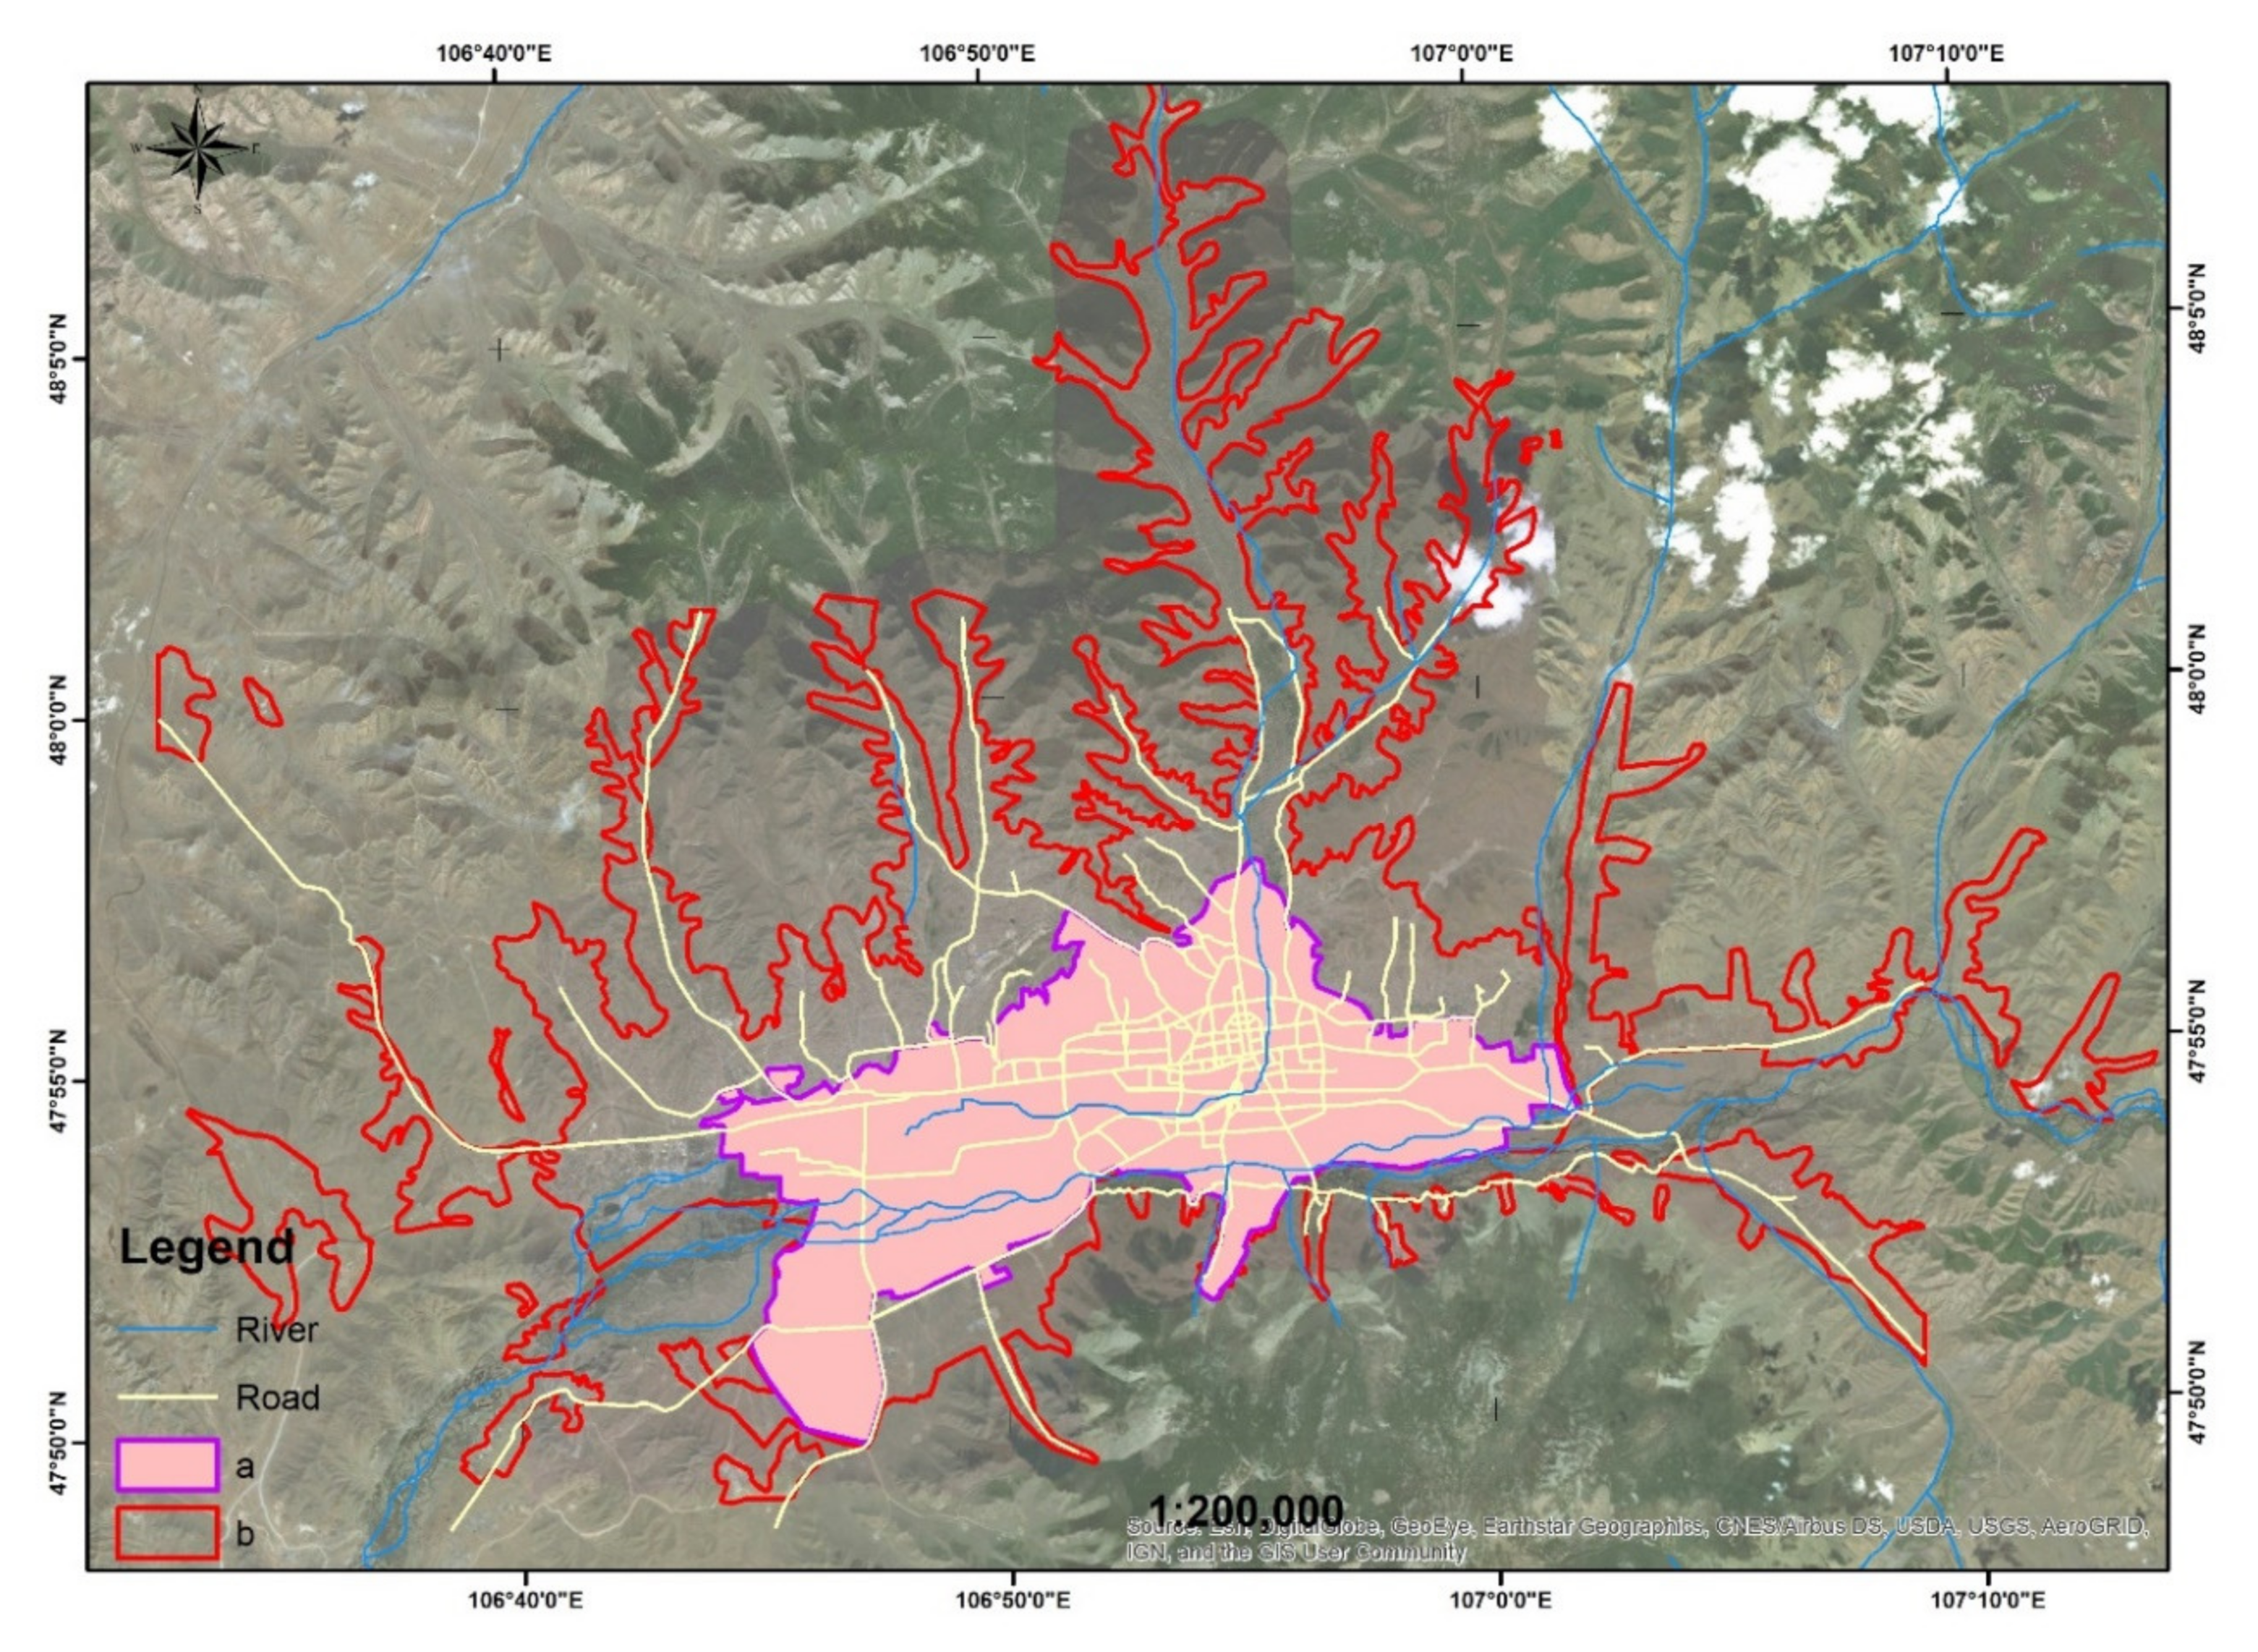
2.1. Study Area
- -
- The slope of the land, with an incline of less than 15°;
- -
- Not in an area exposed to permafrost;
- -
- Outside of forest and river protection zones;
- -
- Not in the National park area;
- -
- Not in croplands;
- -
- Not swampy;
- -
- Not in the zone prone to the risks of flooding or rockfall on the mountain slope;
- -
- Not in an area under engineering limitations or restrictions [11].
2.2. Data Sources and Processing
2.3. Research Methods
2.3.1. Measuring Land-Use Efficiency
- d—population density;
- P—population size;
- A—area of urban land use.
- FAR—floor area ratio;
- Ai—site area of urban land use;
- t—total floor area;
- SL—unit area size.
- BCR—building coverage ratio;
- F—building area;
- A—area of urban land use.
2.3.2. Measuring Change in Land-Use Form
- D—fractal dimension;
- P—external perimeter of urban land-use area;
- A—area of urban land use.
- F—Feret’s diameter;
- i,d—land-use end coordinates.
- C—compactness of urban land-use area;
- P—total land-use perimeter;
- A—area of urban land use.
3. Results
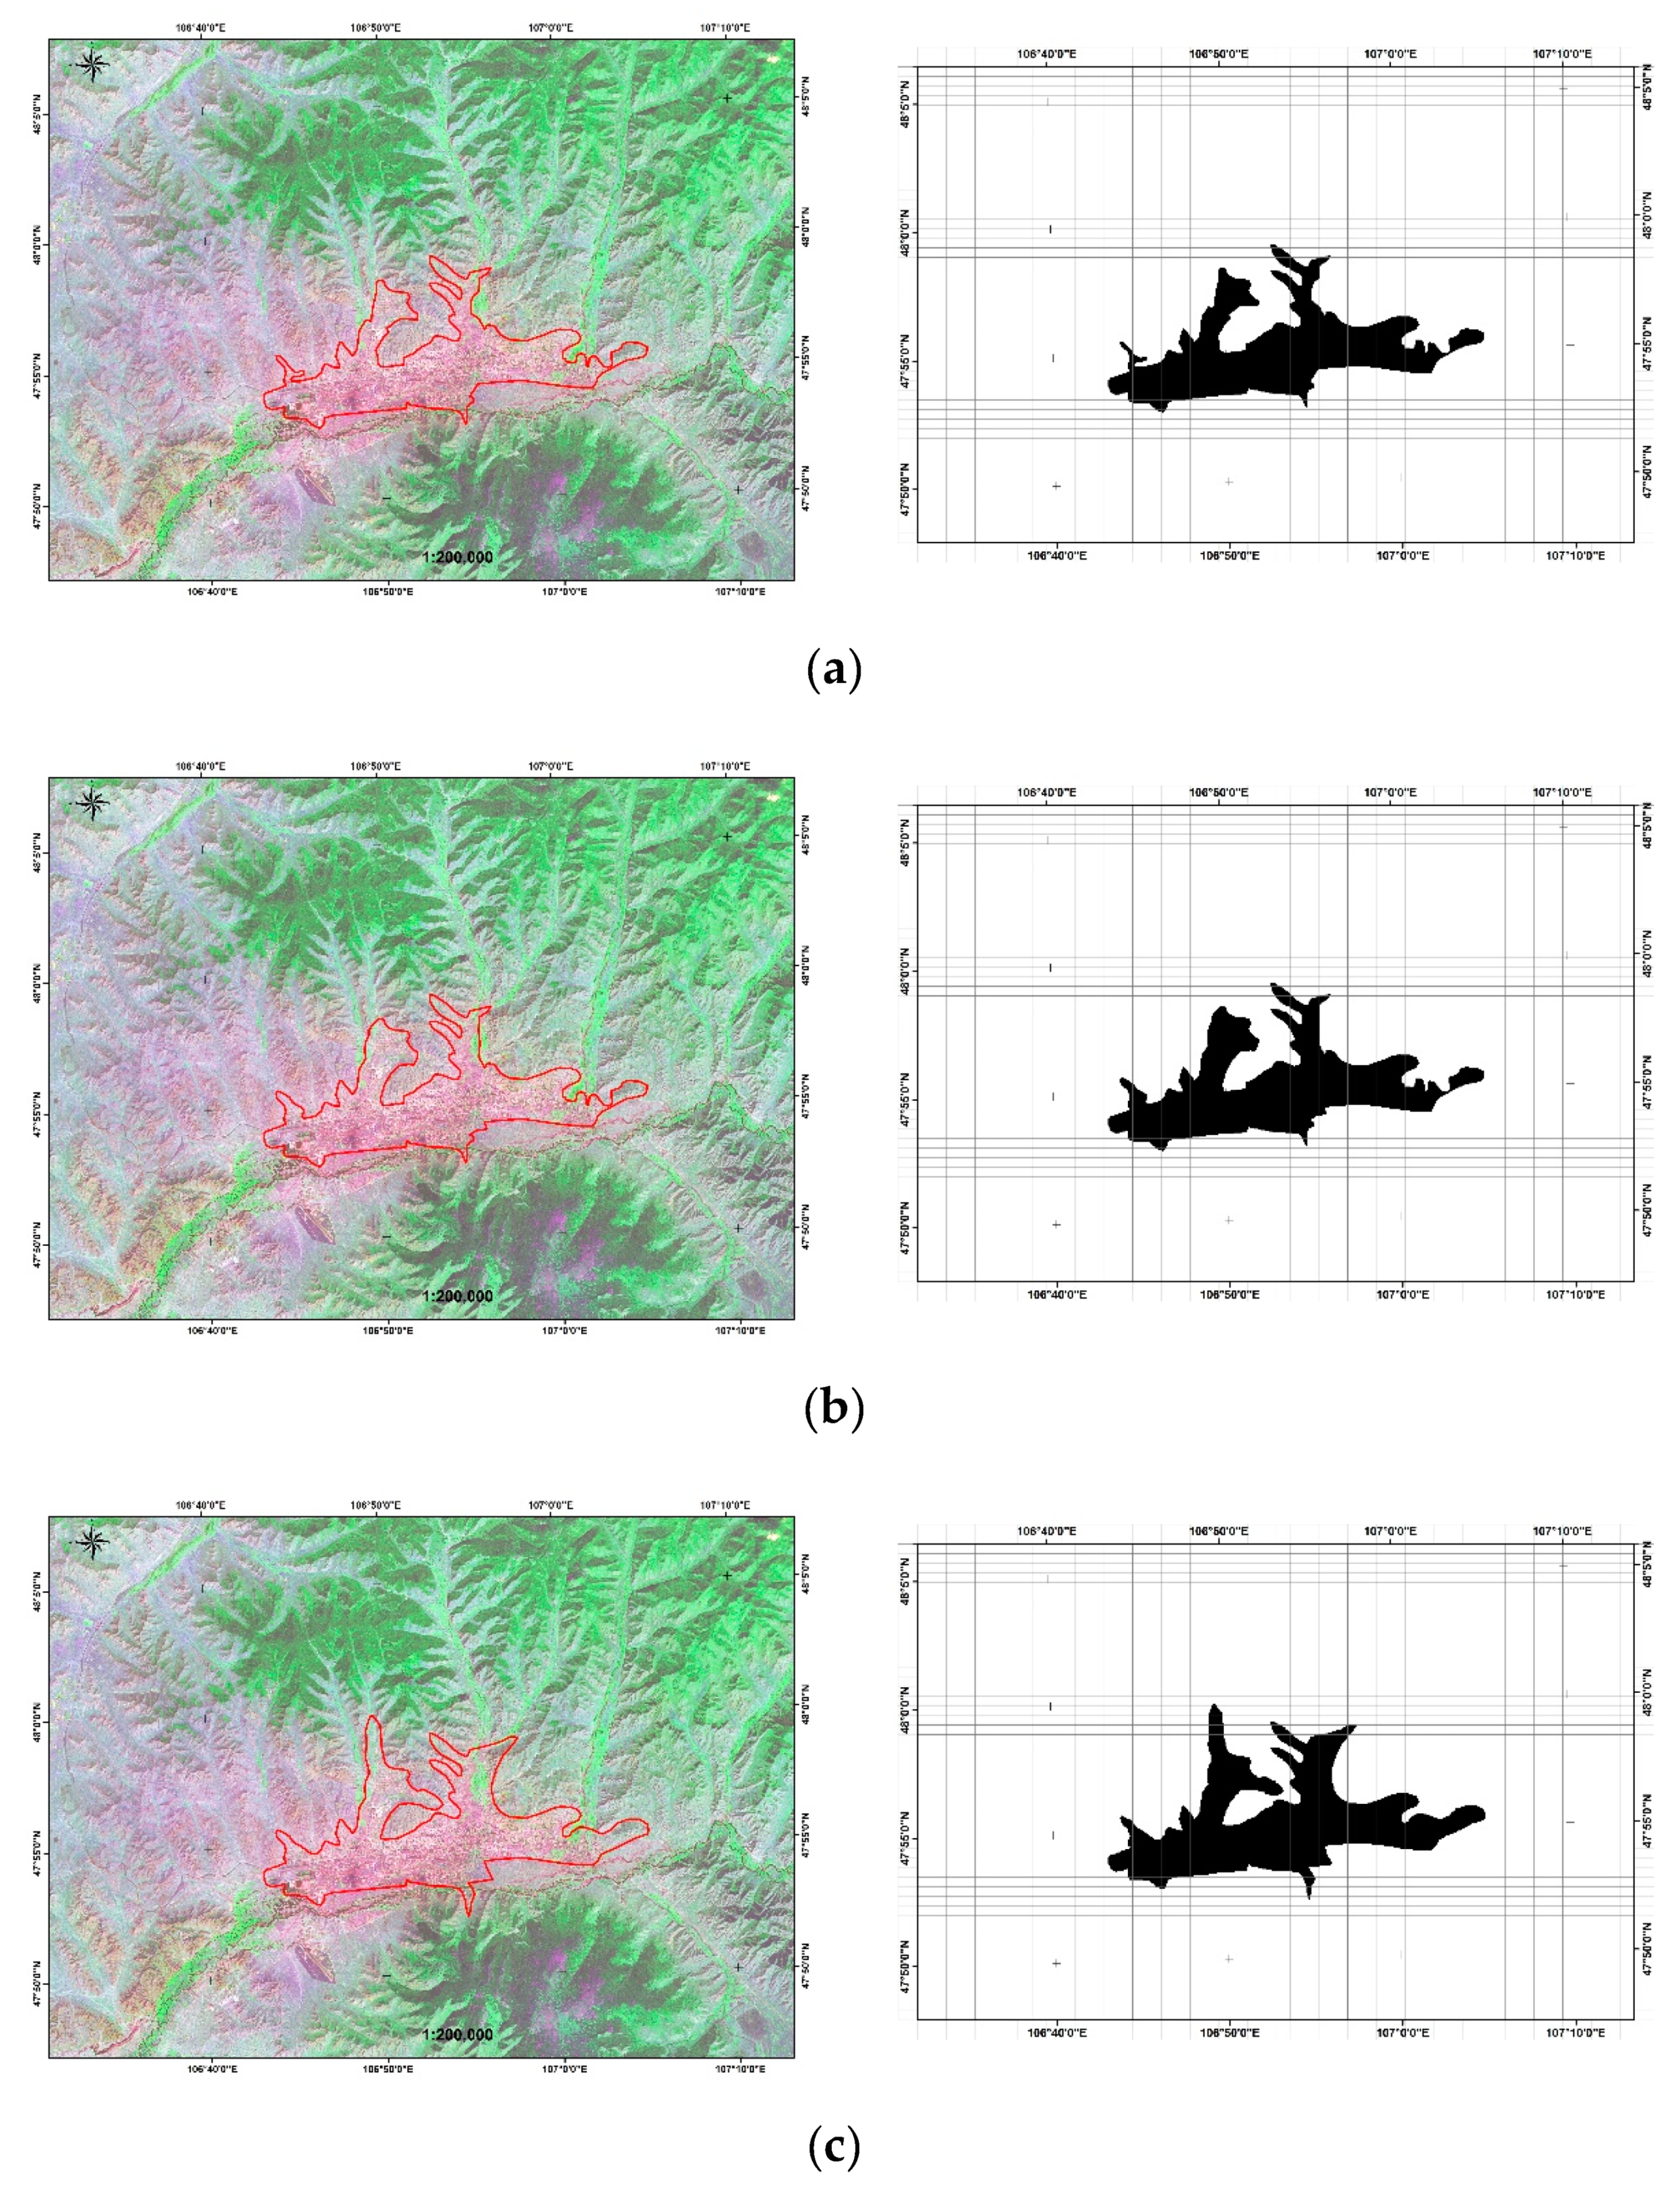
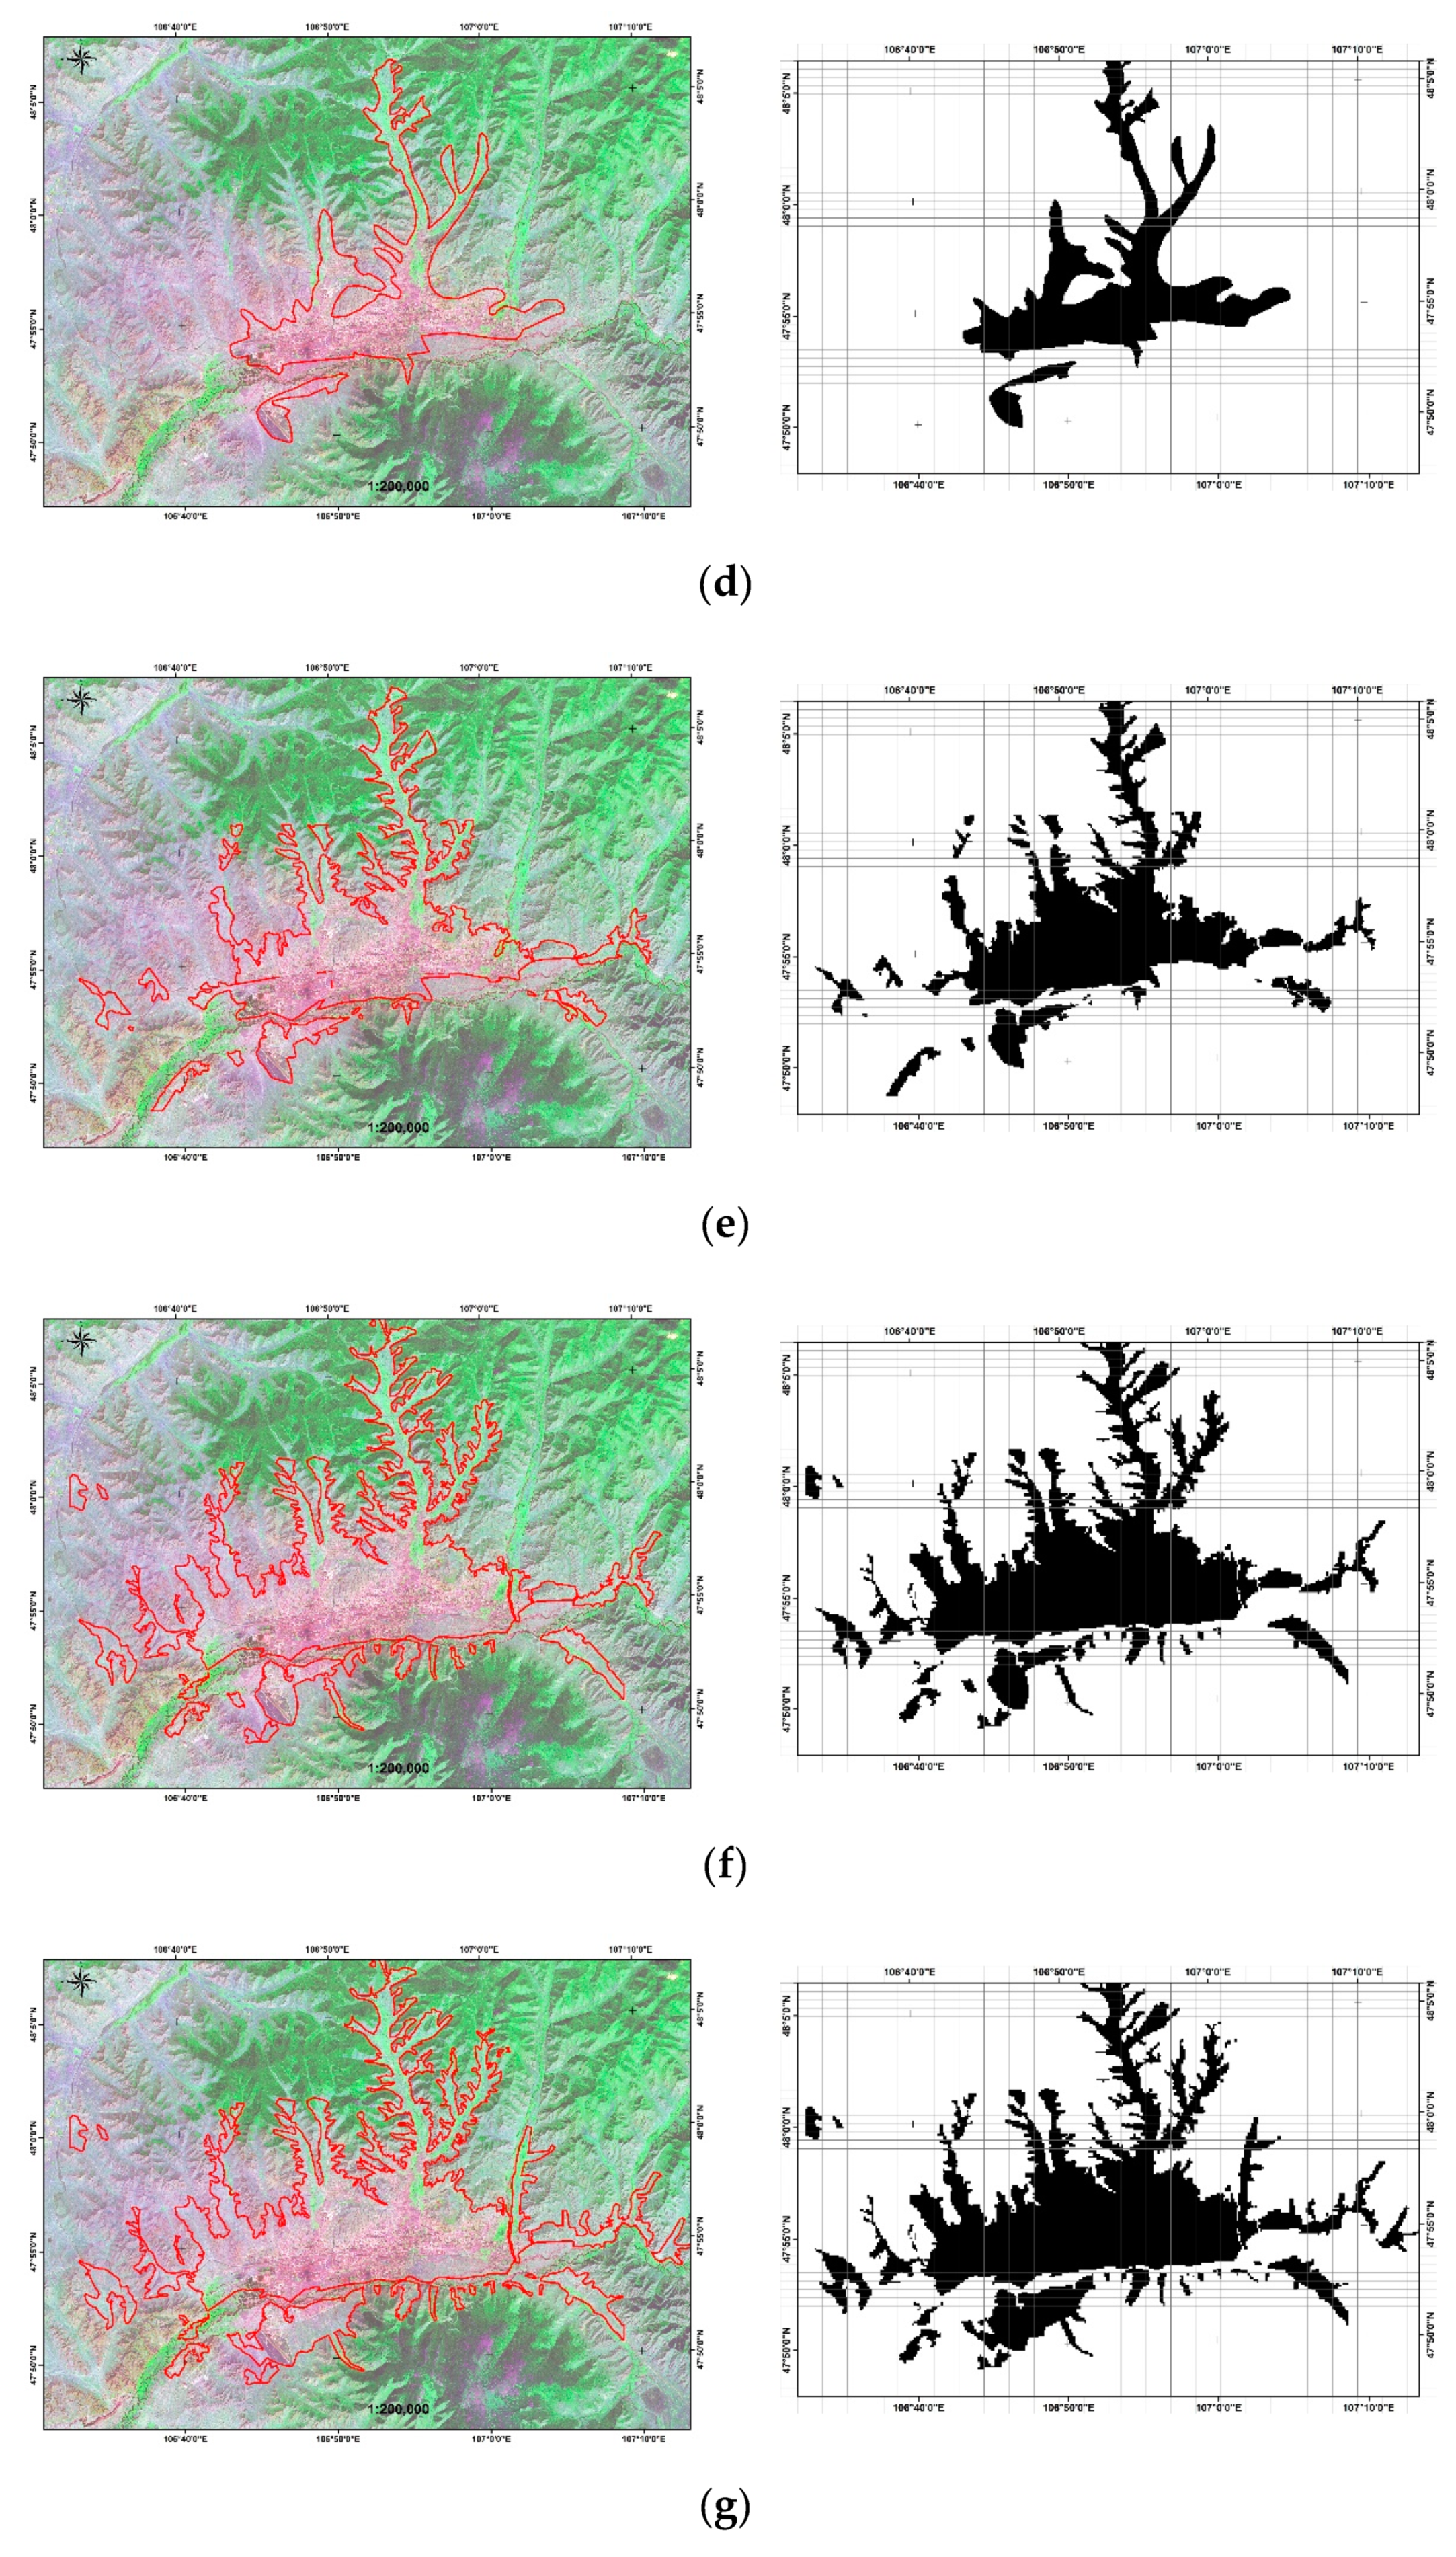
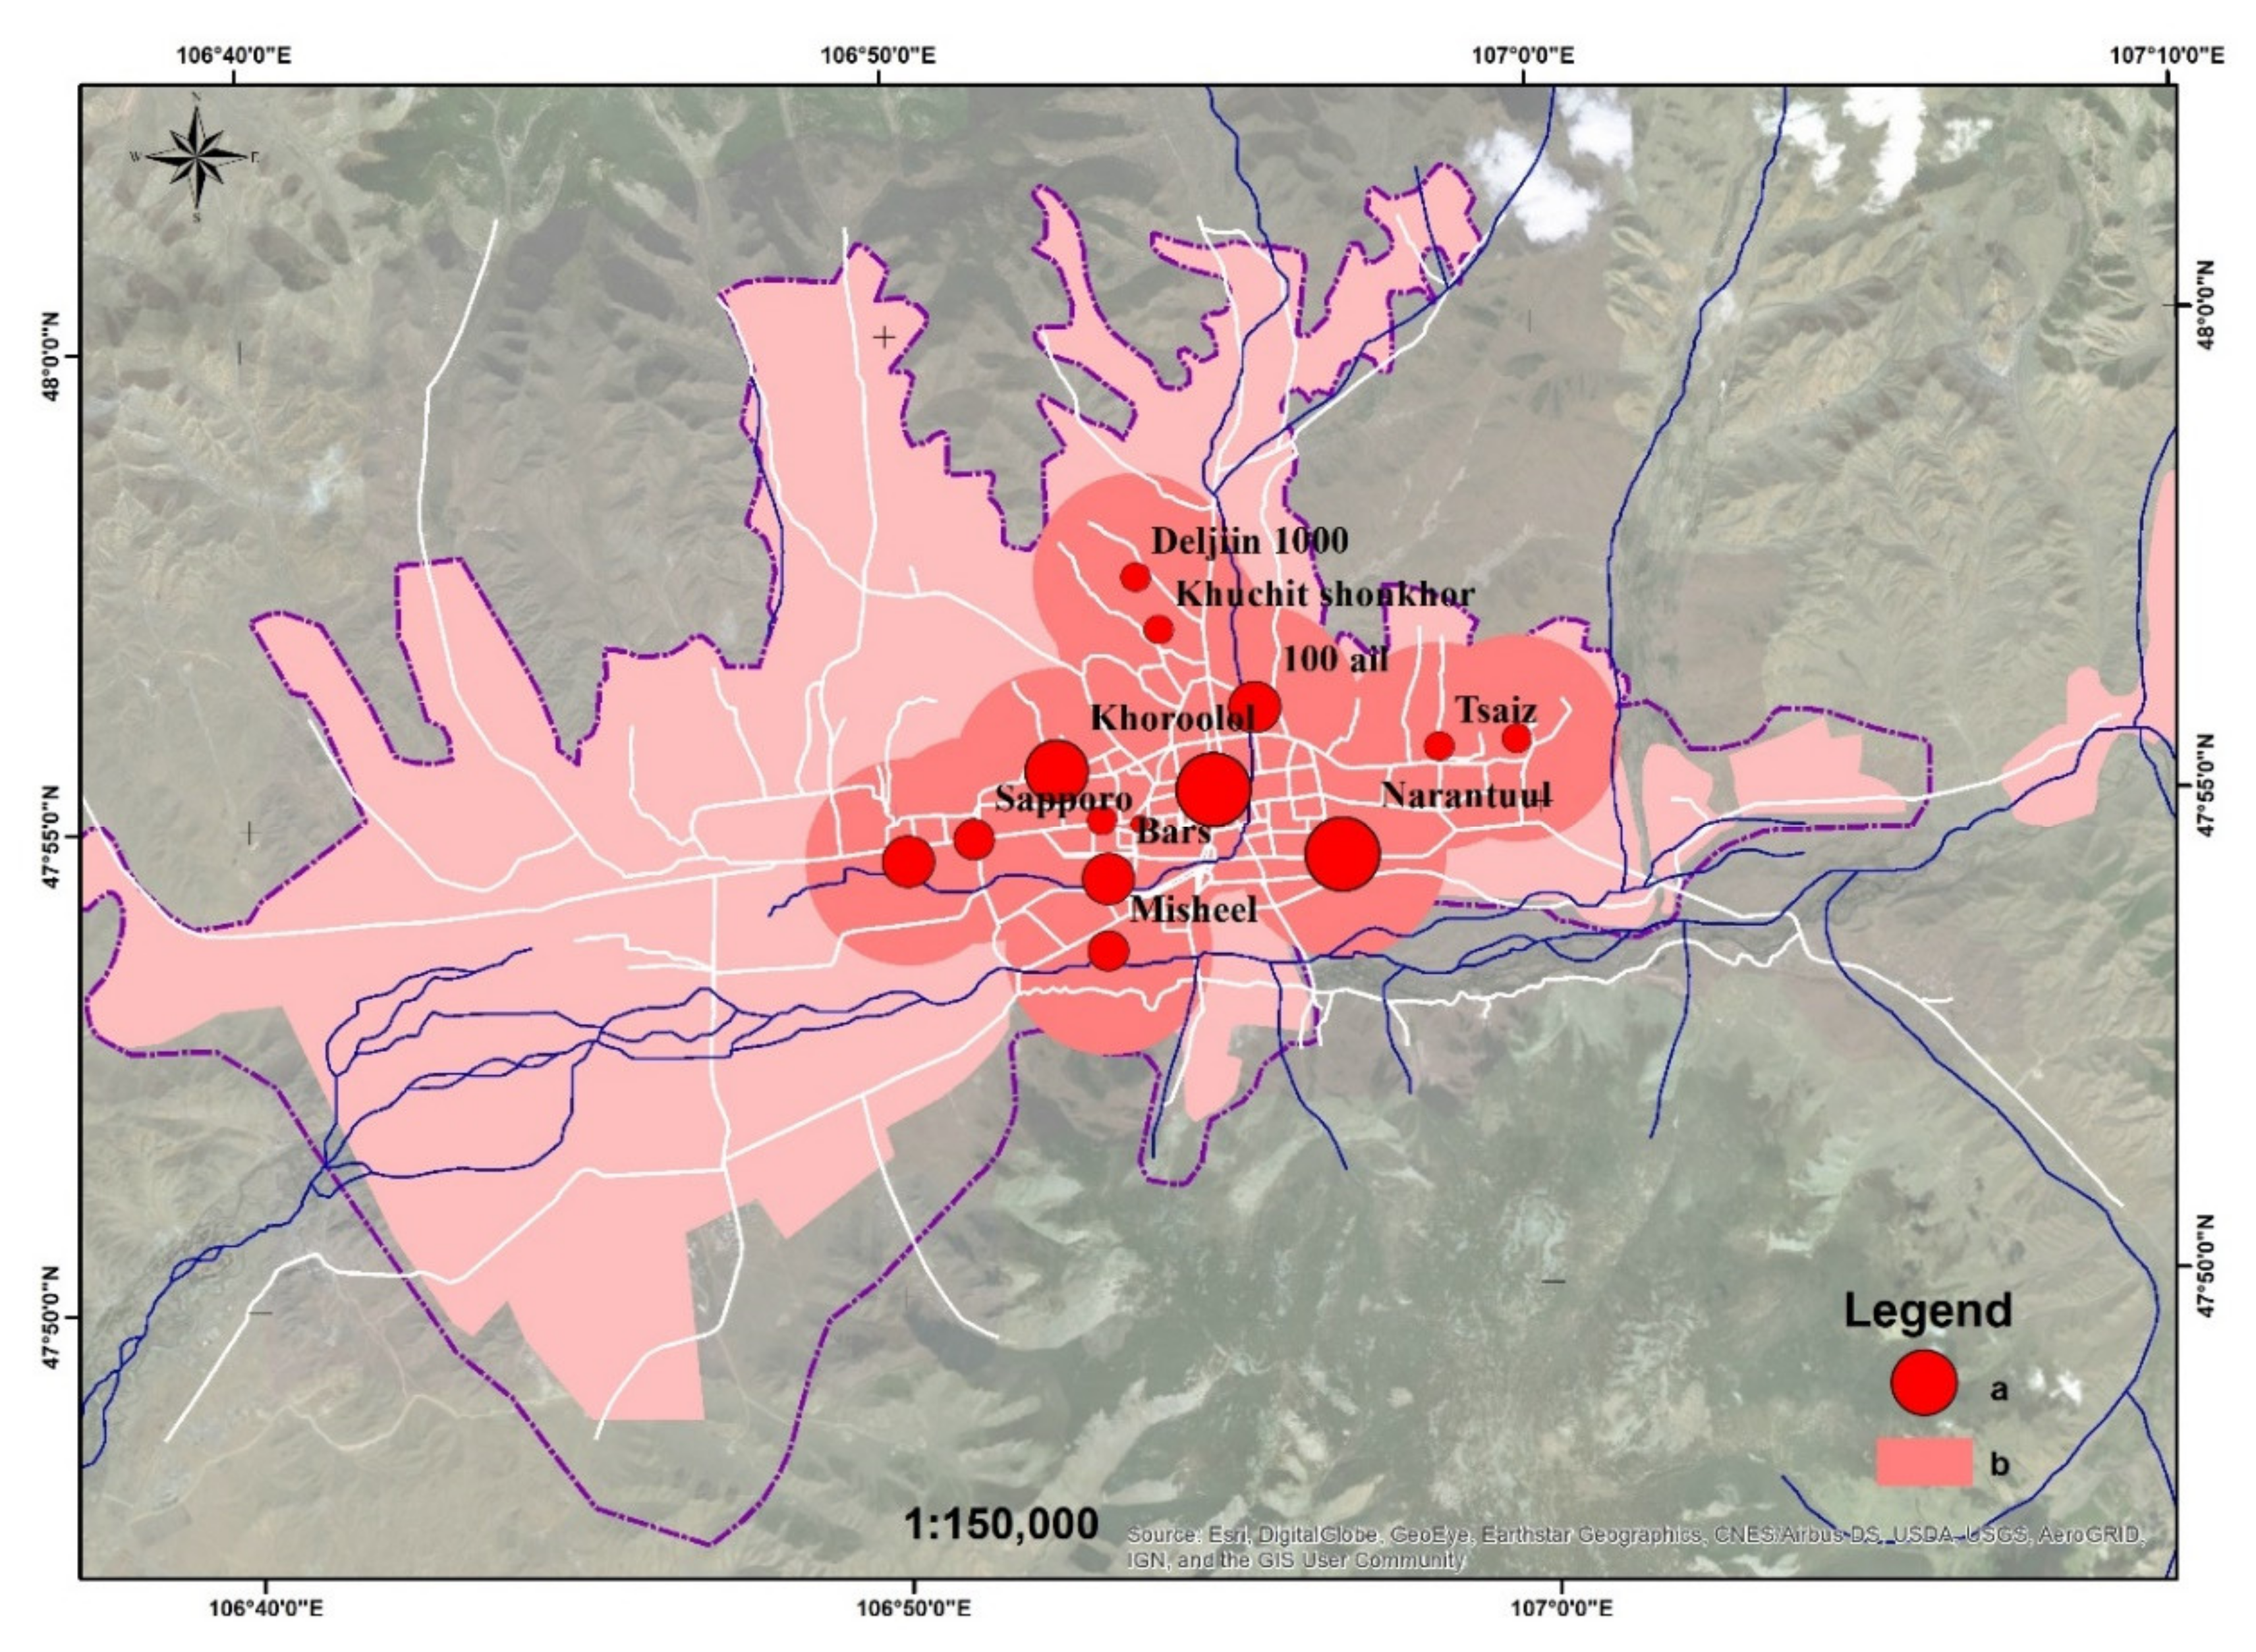
3.1. Spatial Analysis of Urban Sprawl of Ulaanbaatar City
3.2. Comparison of Urban Planning Concepts
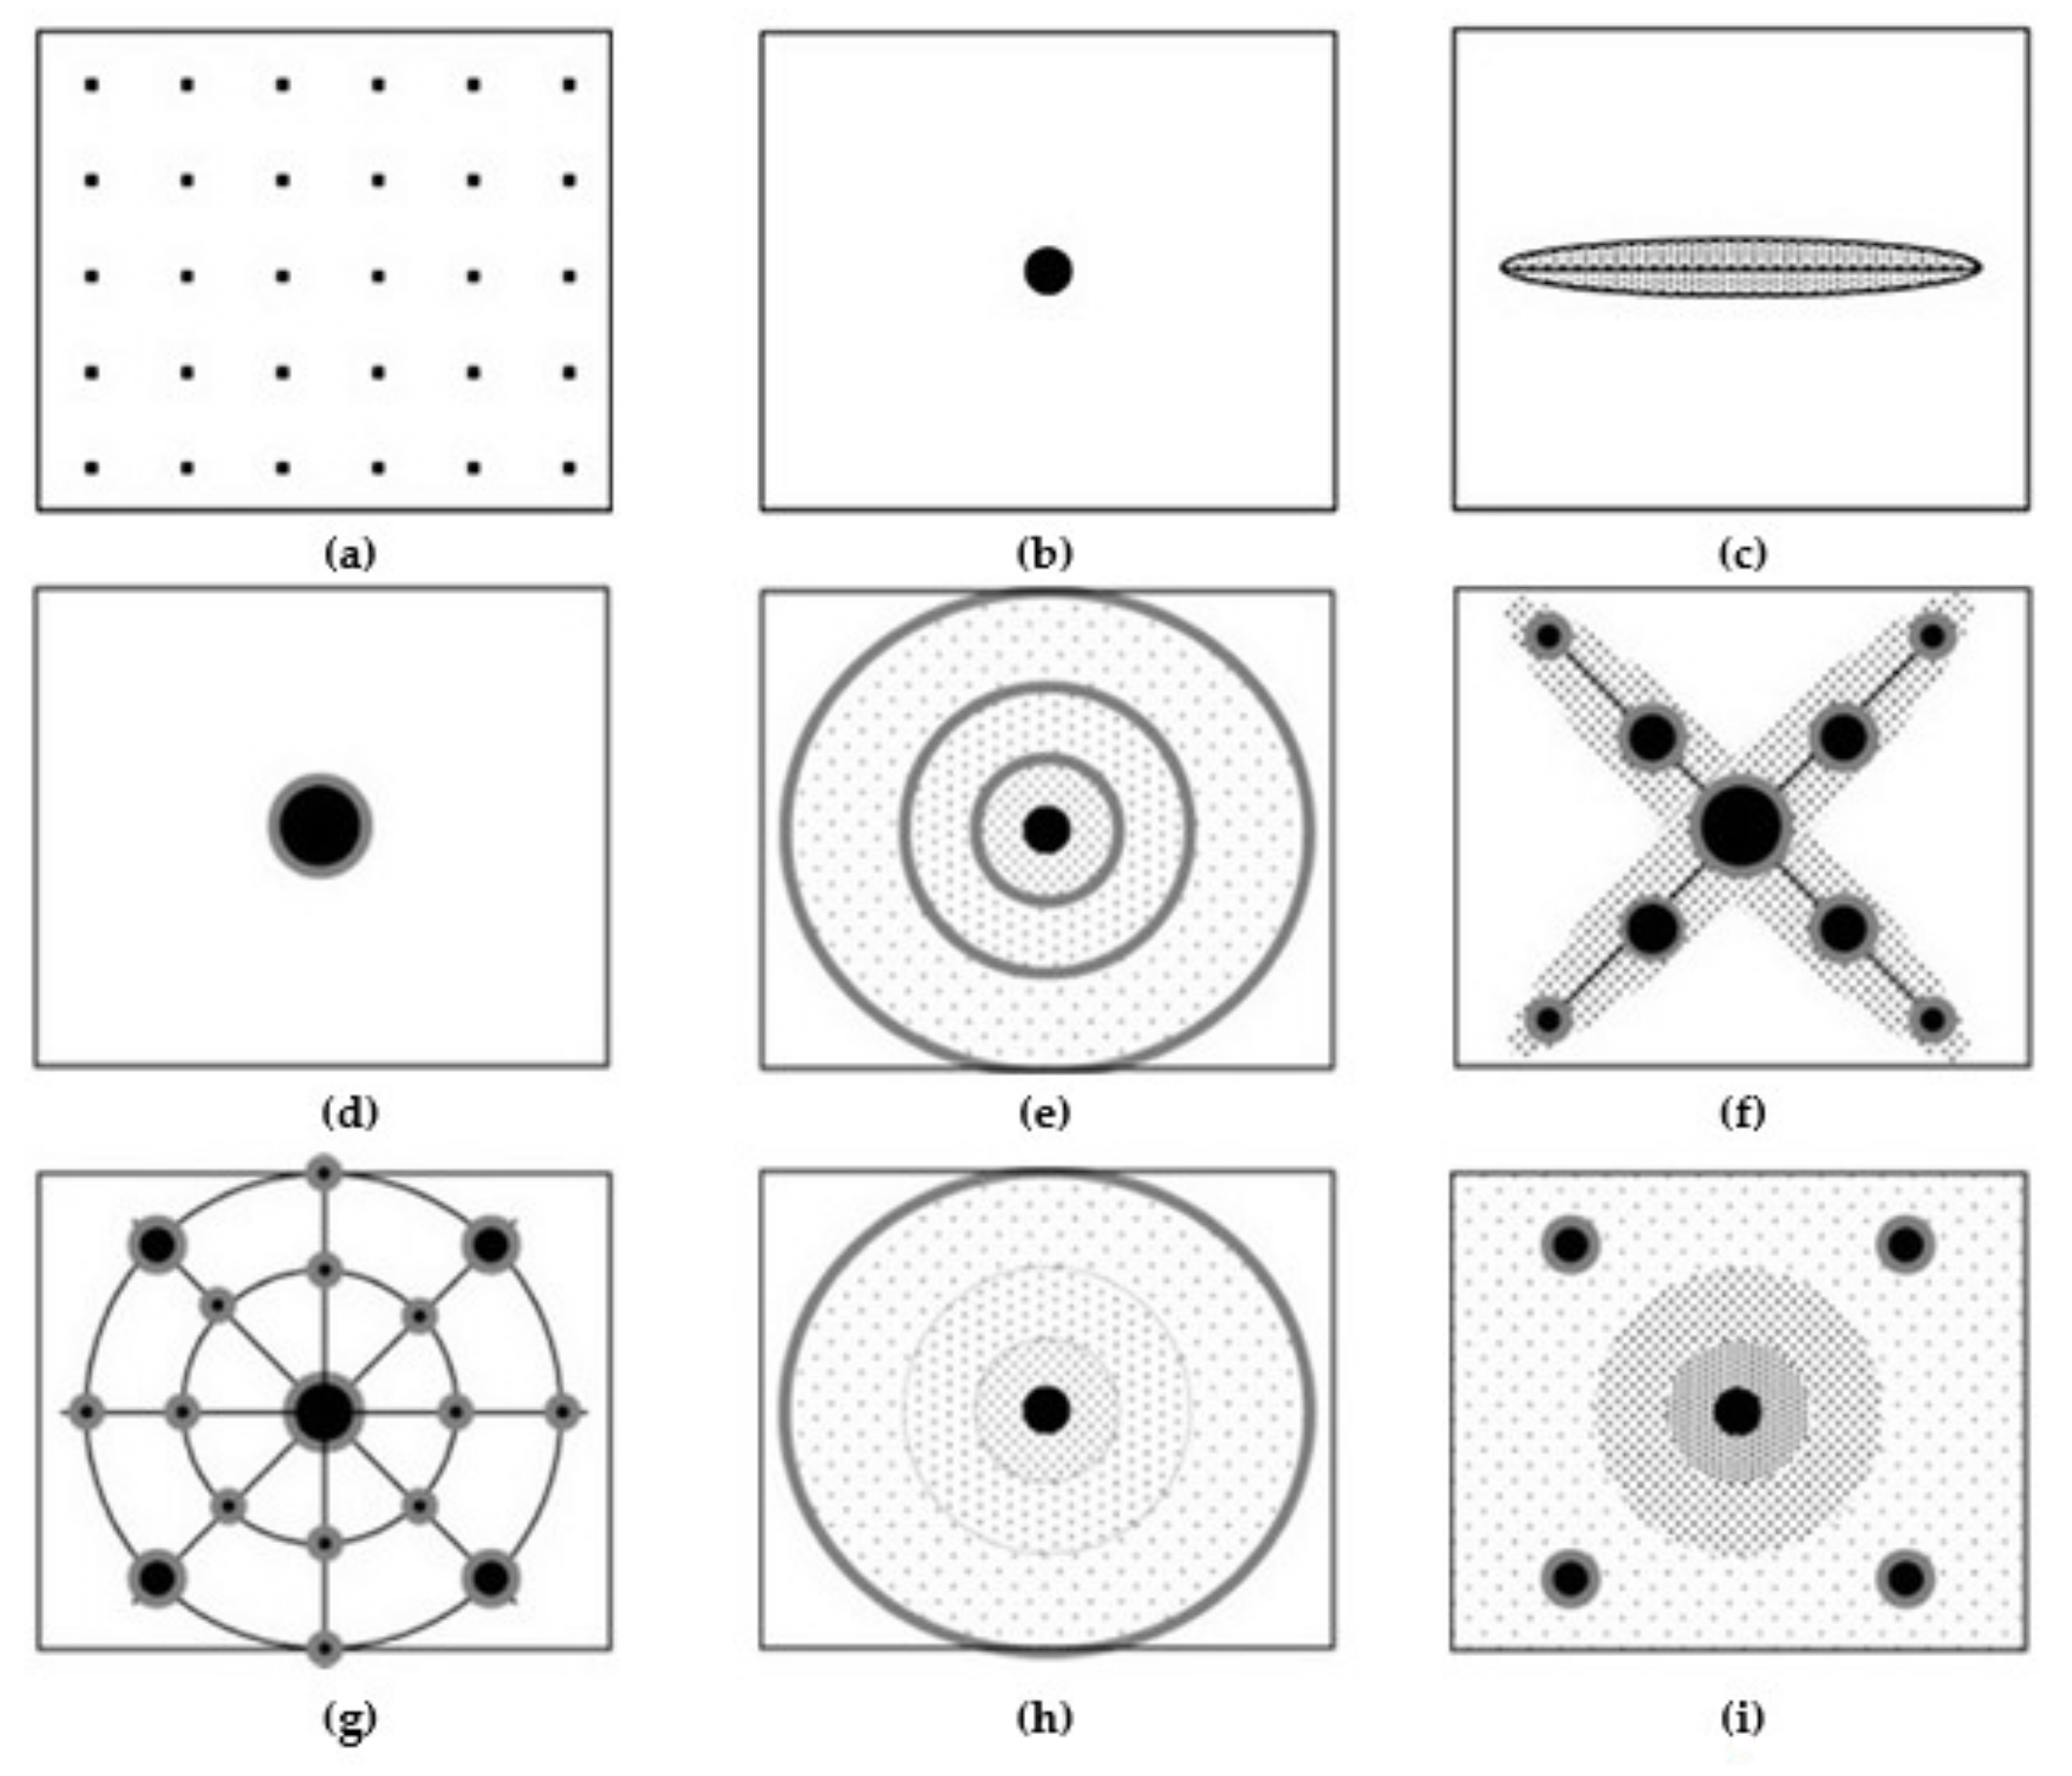
3.2.1. Analysis Using the Monocentric Concept in Ulaanbaatar City
Land-Use Efficiency Analysis
Land-Use Form Analysis
3.2.2. Analysis Using the Polycentric Concept in Ulaanbaatar City
Land-Use Efficiency Analysis
Land-Use Form Analysis
3.2.3. Analysis of the Compact City Concept in Ulaanbaatar City
Land-Use Efficiency Analysis
Land-Use Form Analysis
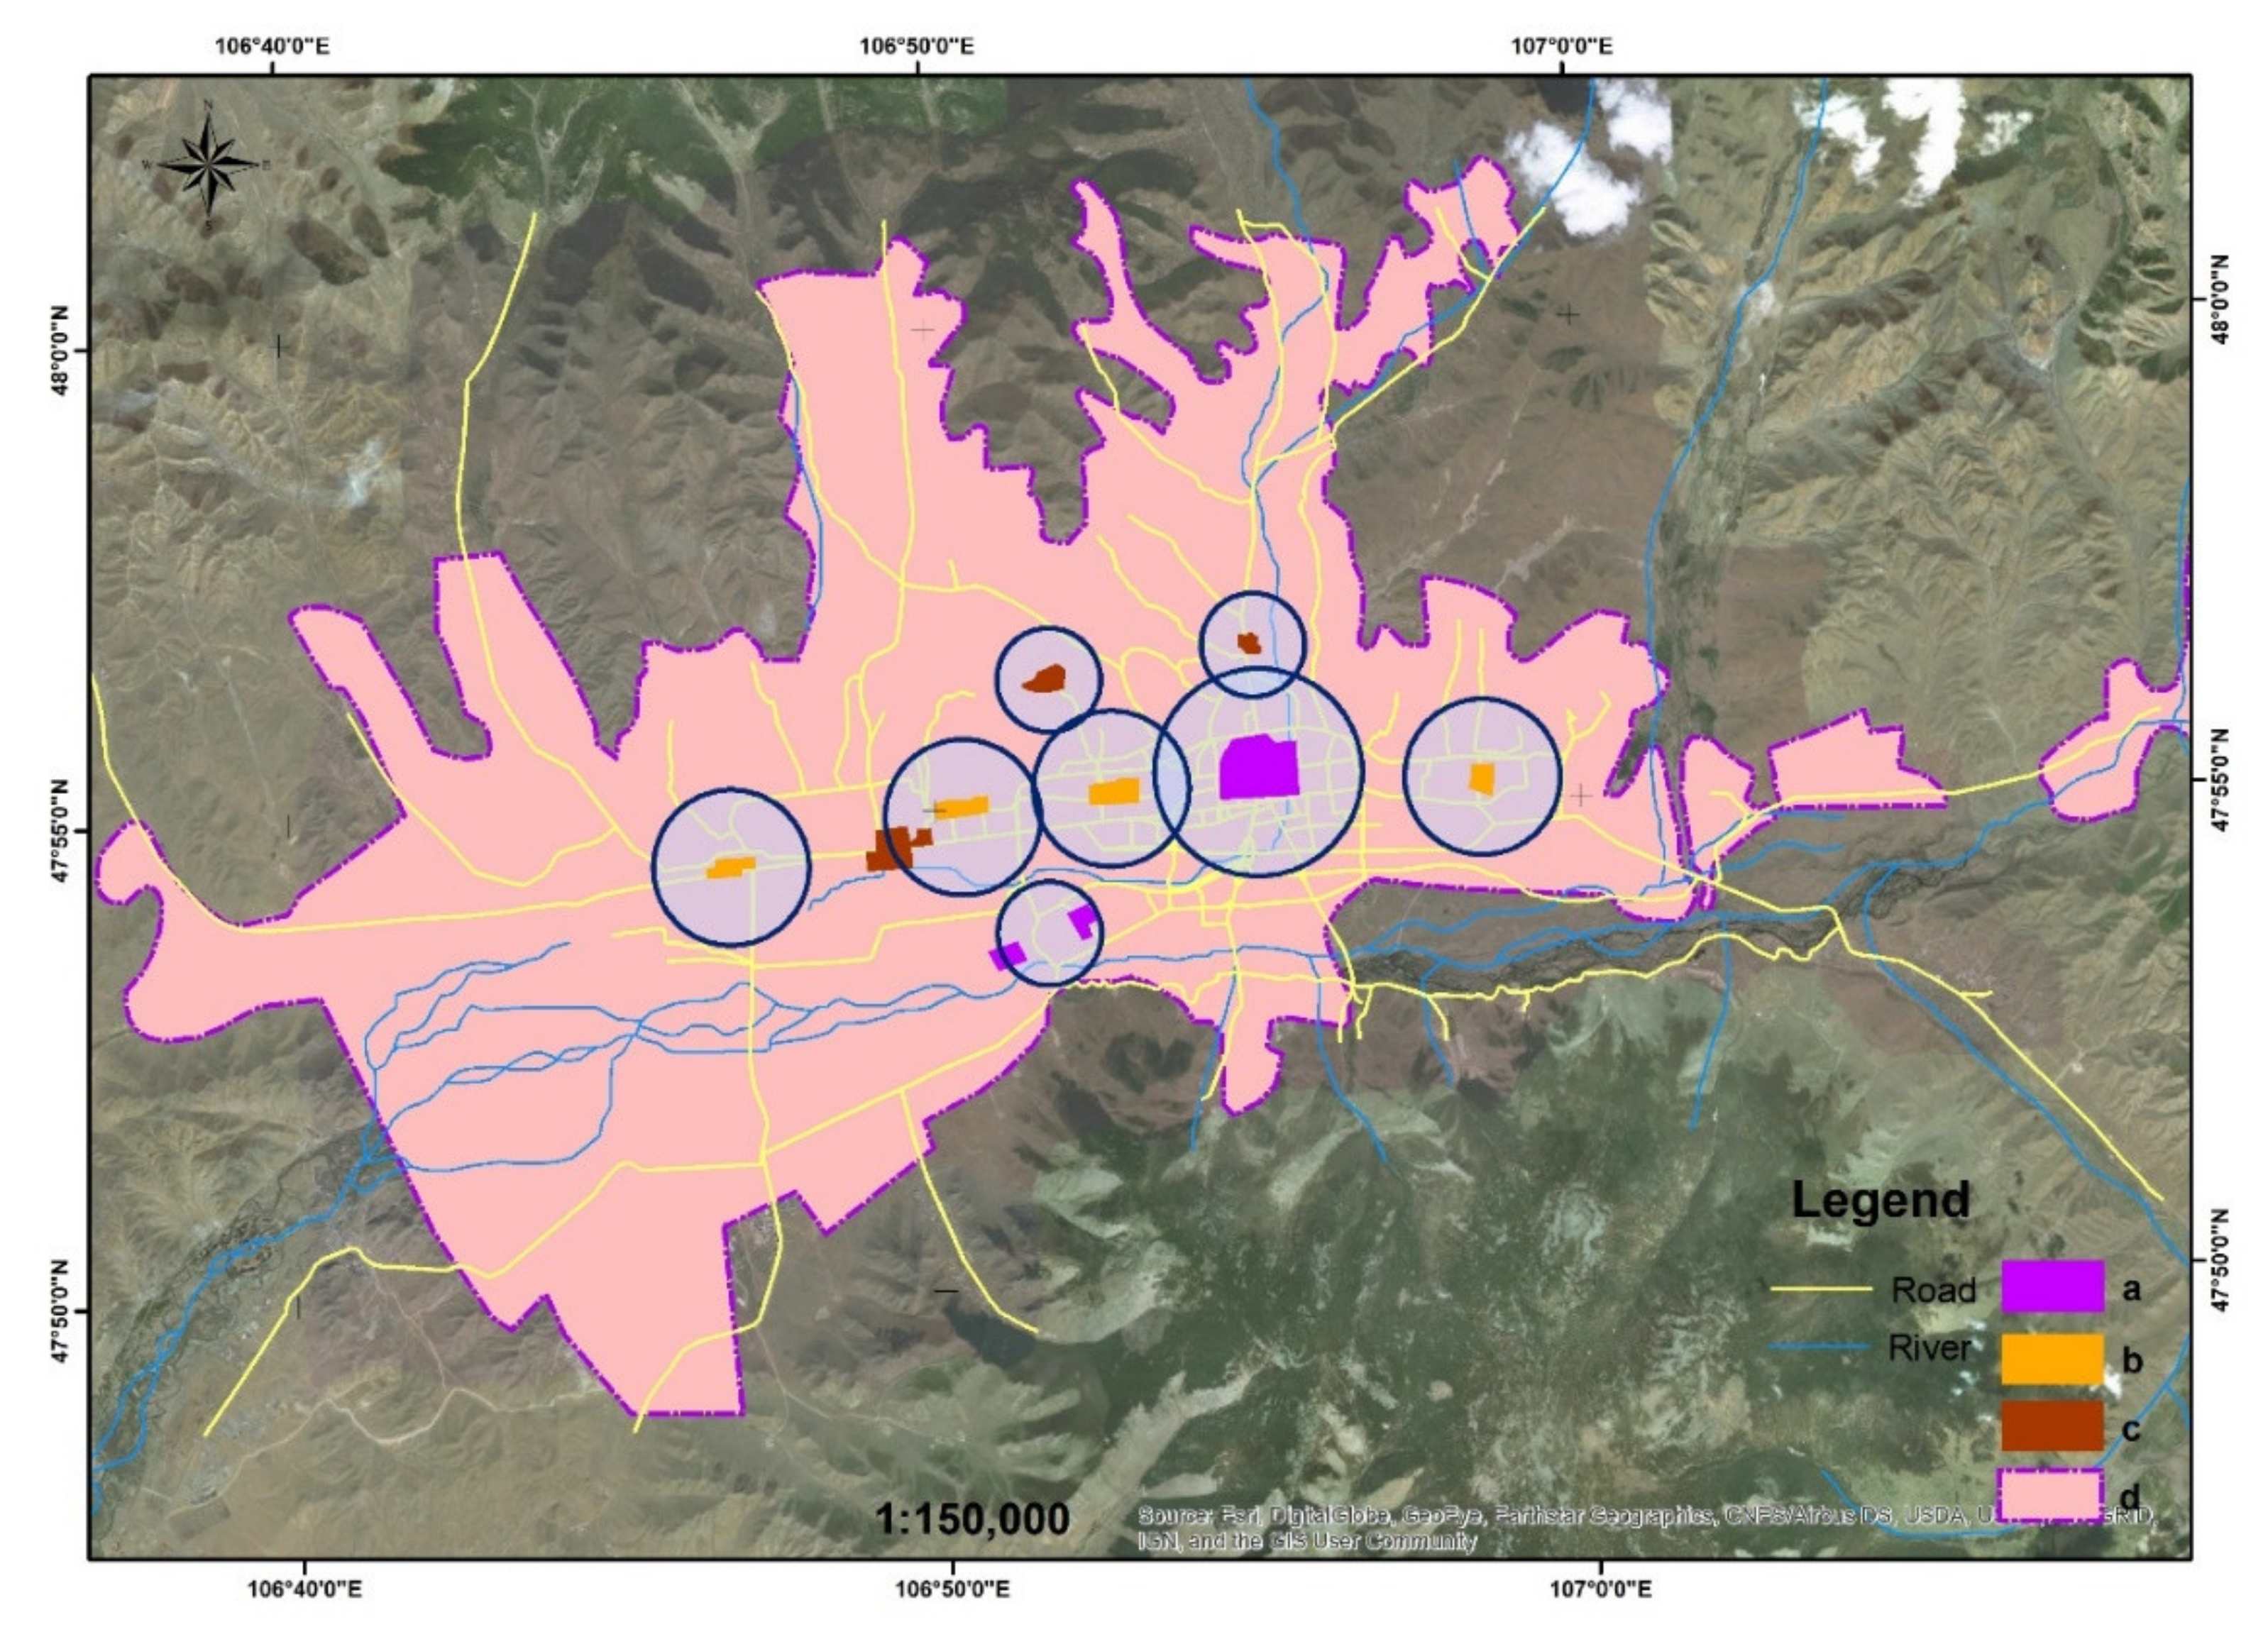
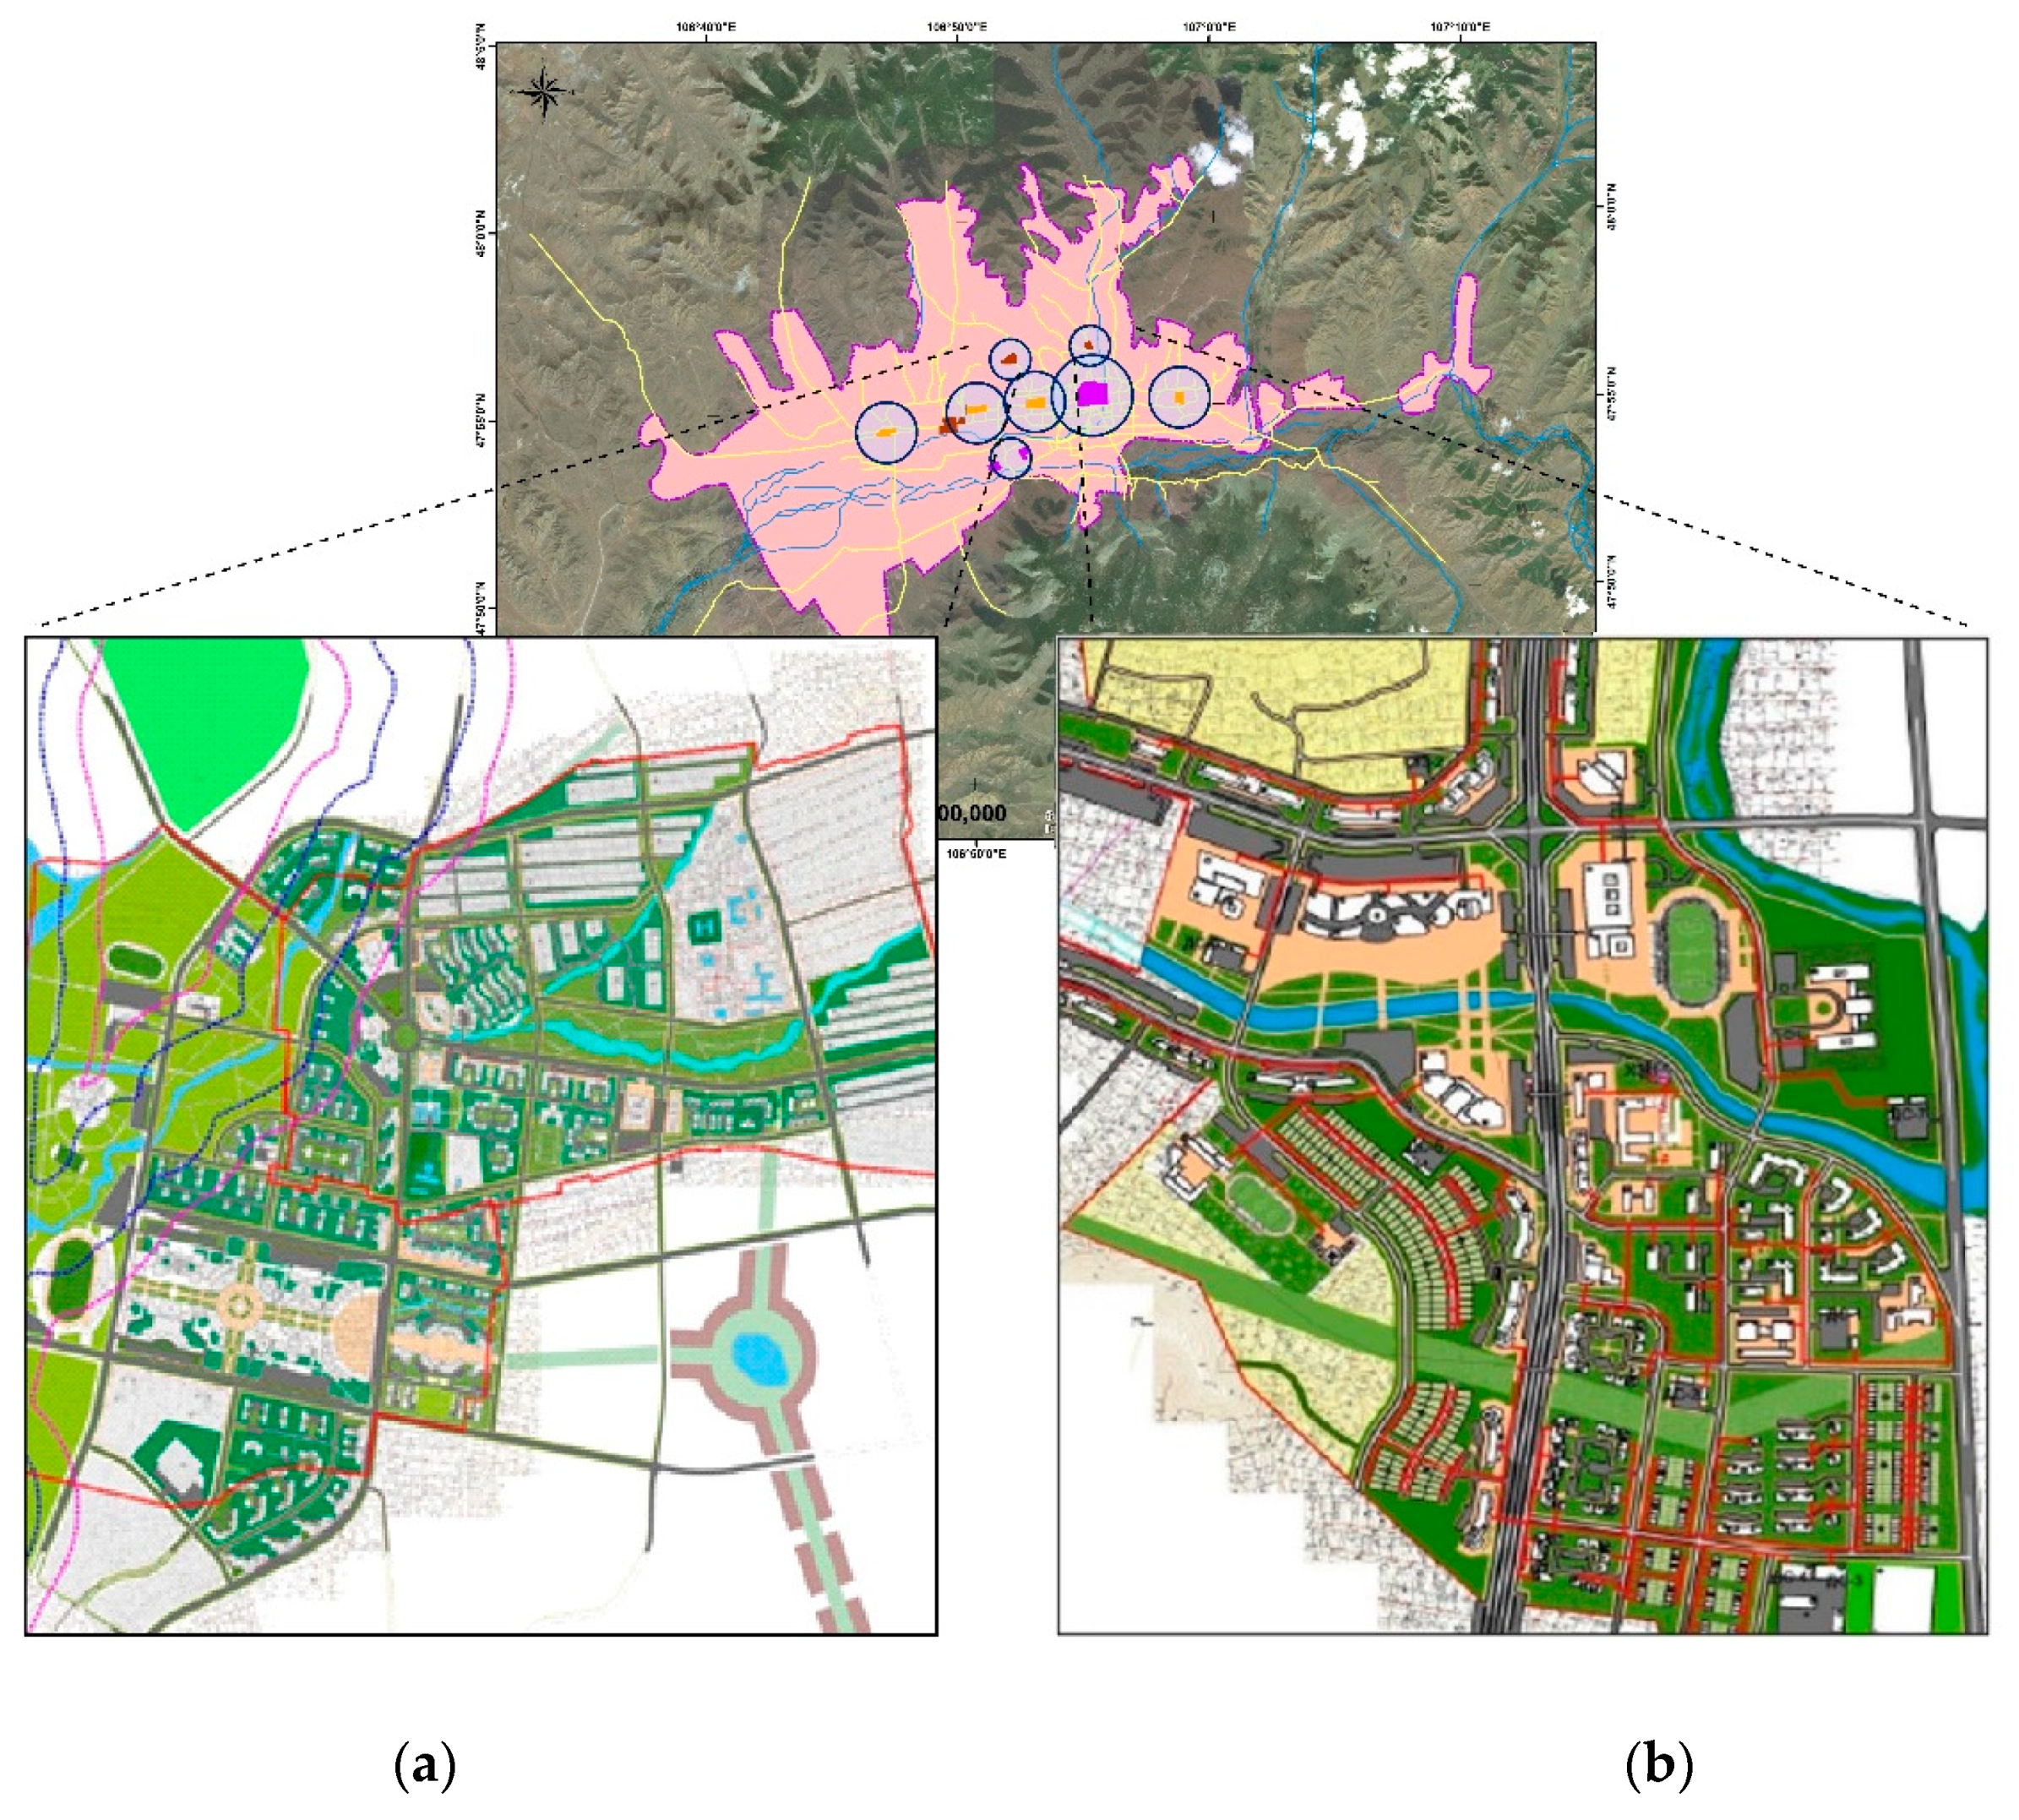
3.3. Comparison of Urban Planning Concepts
3.3.1. Land-Use Form Analysis
3.3.2. Land-Use Efficiency Analysis
4. Discussion
5. Conclusions
Author Contributions
Funding
Conflicts of Interest
References
- Abdullahi, S.; Pradhan, B. Urban Compactness Assessment. Spatial Modeling and Assessment of Urban Form; Springer International Publishing AG: Cham, Switzerland, 2017; pp. 93–137. [Google Scholar]
- Paramita, B. The land-use of Bandung, its density, overcrowded area and public facility toward a compact city. Mater. Sci. Eng. 2016, 128, 12034. [Google Scholar] [CrossRef]
- Jucu, I.S. The spatial polarization of small-sized towns in Timiş County of Romania. In Proceedings of the 15th International Multidisciplinary Scientific GeoConference SGEM, Albena, Bulgary, 18–24 June 2015; Volume 3, pp. 729–736. [Google Scholar]
- Paddison, R.; Hutton, T. Cities and Economic Change, Kindle ed.; SAGE Publications: London, UK, 2015. [Google Scholar]
- Myagmartseren, P.; Tsegmid, B.; Indra, M.; Sugar, M. The Fractal Geometry of Urban Land use: The Case of Ulaanbaatar City, Mongolia. Land 2018, 7, 67. [Google Scholar] [CrossRef]
- Myagmartseren, P.; Buyandelger, M.; Brandt, S.A. Implications of a Spatial Multicriteria Decision Analysis for Urban Development in Ulaanbaatar, Mongolia. Math. Probl. Eng. 2017, 2017 , 2819795. [Google Scholar] [CrossRef]
- Dewan, A.M.; Yamaguchi, Y. Using remote sensing and GIS to detect and monitor land use and land cover change in Dhaka Metropolitan of Bangladesh during 1960–2005. Environ. Monit. Assess. 2009, 150, 237–249. [Google Scholar] [CrossRef] [PubMed]
- Dong, Y.; Forster, B.; Ticehurst, C. Radar backscatter analysis for urban environments. Int. J. Remote Sens. 1997, 18, 1351–1364. [Google Scholar] [CrossRef]
- Narantsatsralt, J. Fundamental Problems of Land Use Management in the New Socialeconomical Condition, a Case of Ulaanbaatar. Ph.D. Thesis, National University of Mongolia, Ulaanbaatar, Mongolia, 1998; pp. 34–68. [Google Scholar]
- Tsahiur, S.; Narangerel, G.; Ganbat, L.; Byambasuren, L.; Chinbat, B.; Otgonbayar, S.; Tsedendamba, L.; Janchivdorj, L.; Lkhagvasuren, G.; Tserenbaljid, B.; et al. Urban Master Plan of Ulaanbaatar City; Report; Urban Planning Institut of Ulaanbaatar: Ulaanbaatar, Mongolia, 2013; pp. 15–28.
- Myagmartseren, P.; Chinbat, B.; Gantulga, G. Master Land use Plan of Ulaanbaatar City; Governor Office of Capital City: Ulaanbaatar, Mongolia, 2012.
- Yu, B.; Liu, H.; Wu, J.; Hu, Y.; Zhang, L. Automated derivation of urban building density information using airborne LiDAR data and object-based method. Landsc. Urban Plan. 2010, 98, 210–219. [Google Scholar] [CrossRef]
- Pan, X.Z.; Zhao, Q.G.; Chen, J.; Liang, Y.; Sun, B. Analyzing the Variation of Building Density Using High Spatial Resolution Satellite Images: The Example of Shanghai City. Sensors 2008, 8, 2541–2550. [Google Scholar] [CrossRef] [PubMed]
- Wei, C.; Shenglu, Z.; Shaohua, W. Measuring Smart Land Use in Urban-Rural Regions of China: A Case Study of Pukou, Nanjing City. Growth Chang. 2017, 49, 189–202. [Google Scholar] [CrossRef]
- Chen, L.D.; Fu, B.J. Analysis of impact of human activity on landscape structure in Yellow River Delta: A case study of Dong Ying region. Acta Ecol. Sin. 1996, 16, 337–344. [Google Scholar]
- Xiao, D.N.; Li, X.Y.; Song, D.M. Landscape changes and ecological reconstruction in Minqin Huqu oasis. Acta Ecol. Sin. 2005, 25, 2478–2483. [Google Scholar]
- Addison, P.S. Fractals and Chaos: An Illustrated Course; Institute of Physics Publishing: Bristol, UK, 1997. [Google Scholar]
- Peitgen, H.O.; Jürgens, H.; Saupe, D. Chaos and Fractals; Springer International Publishing AG: Cham, Switzerland, 2004; pp. 192–209. [Google Scholar]
- Mandelbrot, B. The Fractal Geometry of Nature; Freeman: San Francisco, CA, USA, 1983. [Google Scholar]
- Terzi, F.; Kaya, H.S. Dynamic spatial analysis of urban sprawl through fractal geometry: The case of Istanbul. Environ. Plan. B 2011, 38, 175–190. [Google Scholar] [CrossRef]
- Taylor, R.; Newell, B.; Spehar, B.; Clifford, C. Fractals: A Resonance between Art and Nature. In Mathematics and Culture; Springer International Publishing AG: Cham, Switzerland, 2005; pp. 53–63. [Google Scholar]
- Torrens, P.M.; Alberti, M. Measuring Sprawl; Paper 27; Centre for Advanced Spatial Analysis: London, UK, 2000. [Google Scholar]
- Kaye, B.H. A Random Walk through Fractal Dimensions; VCH Publishers: New York, NY, USA, 1989. [Google Scholar]
- Batty, M.; Longley, P.A. The Fractal Simulation of Urban Structure. Environ. Plan. A 1986, 18, 1143–1179. [Google Scholar] [CrossRef]
- Fan, W.; Shi, Y.; Liu, Y. Application of GIS in quantifying the urban form: A case study of Shanghai. J. Digit. Content Technol. Appl. 2012, 6, 344–353. [Google Scholar]
- Ritter, C.; Heyde, M.; Schwarz, U.D.; Rademann, K. Controlled translational manipulation of small latex spheres by dynamic force microscopy. Langmuir 2002, 18, 7798–7803. [Google Scholar] [CrossRef]
- Richardson, L.F. A note: Measuring compactness as a requirement of legislative apportionment. Midwest. J. Political Sci. 1961, 5, 70–74. [Google Scholar]
- Sun, J.; Huang, Z.; Southworth, J.; Qie, Y. Mapping fractality during the process of deforestation in an Amazon tri-national frontier. Remote Sens. Lett. 2013, 4, 589–598. [Google Scholar] [CrossRef]
- Alonso, W. Location and Land Use; Harvard University Press: Cambridge, MA, USA, 1964. [Google Scholar]
- Mori, T. Monocentric versus polycentric models in urban economics. In The New Palgrave Dictionary of Economics, 2nd ed.; Durlauf, S.N., Blume, L.E., Eds.; Palgrave Macmillan: London, UK, 2008. [Google Scholar] [CrossRef]
- Fujita, M.; Ogawa, H. Multiple equilibria and structural transition of non-monocentric urban configurations. Reg. Sci. Urban Econ. 1982, 12, 161–196. [Google Scholar] [CrossRef]
- Çalışkan, O. Urban Compactness: A Study of Ankara Urban Form. Master’s Thesis, Middle East Technical University, Ankara, Turkey, 2004. [Google Scholar]
- Dantzig, G.B.; Satty, T.L. Compact City: A Plan for a Livable Urban Environment; W.H. Freeman: San Francisco, CA, USA, 1974. [Google Scholar]
- Kaji, H.; Kanegae, H.; Ishibashi, K.; Hara, N. Compact city and developing countries—Is Compact City Approach Appropriate as an Urban Development Policy for Cities in Developing Countries? In Proceedings of the Open Meeting of the Global Environmental Change Research Community, Montreal, QC, Canada, 16–18 October 2003. [Google Scholar]
- Doebele, W.A. Land Readjustment: A Different Approach to Financing Urbanization; Lexington Books: Boston, MA, USA, 1982. [Google Scholar]
- Dunkerley, H.B. Urban Land Policy: Issues and Opportunities; The World Bank: Washington, DC, USA, 1983. [Google Scholar]
- Kitay, G.M. Land Acquisition in Developing Countries: Policies and Procedures of the Public Sector; Lincoln Institute of Land Policy: Boston, MA, USA, 1985. [Google Scholar]
- Yomralioglu, T. Determination of Land Parcel Values in Land Reallocation using GIS. In Proceedings of the International Congress on Agrarian Reform and Rural Development, Ankara, Turkey, 22–27 September 1992; pp. 403–411. [Google Scholar]
- Yomralioglu, T. A Nominal Asset Value-Based Approach for Land Readjustment and Its Implementation Using Geographical Information System. Ph.D. Thesis, University of Newcastle, Newcastle upon Tyne, UK, 1992. [Google Scholar]
- Gilbert, A.; Gugler, J. Cities, Poverty and Development: Urbanization in the Third World; Oxford University Press: New York, NY, USA, 1992. [Google Scholar]
- Bathrellos, G.D.; Skilodimou, H.D. Land Use Planning for Natural Hazards. Land 2019, 8, 128. [Google Scholar] [CrossRef]
- Skilodimou, H.D.; Bathrellos, G.D.; Koskeridou, E.; Soukis, K.; Rozos, D. Physical and Anthropogenic Factors Related to Landslide Activity in the Northern Peloponnese, Greece. Land 2018, 7, 85. [Google Scholar] [CrossRef]
- Lozano-Gracia, N.; Young, C.; Lall, S.V.; Vishwanath, T. Leveraging Land to Enable Urban Transformation; World Bank Policy Research Working Paper, No. 6312; The World Bank Sustainable Development Network Urban and Disaster Risk Management Department: Washington, DC, USA, 2013. [Google Scholar]


| Frequency | Source * | Time Period | Method of Creation |
|---|---|---|---|
| Urban settlement in 1990 | Landsat 5 path/row of 131-027 | 10 September 1990 | Supervised classification |
| Urban settlement in 1995 | Landsat 5 path/row of 131-027 | 7 August 1995 | Supervised classification |
| Urban settlement in 2000 | Landsat 5 path/row of 131-027 | 1 August 2000 | Supervised classification |
| Urban settlement in 2005 | Landsat 5 path/row of 131-027 | 14 May 2005 | Supervised classification |
| Urban settlement in 2010 | Quickbird NW corner Lat = 48.02, SE corner Lat = 47.73, NW corner Long = 106.53, SE corner Long = 107.32 | 20 May 2010 | Digitizing/ georeferencing |
| Urban settlement in 2015 | World View-2 NW corner lat: 48.01, SE corner lat: 47.09, NW corner long: 106.61, SE corner long: 106.72 | 14 September 2015 | Digitizing/ georeferencing |
| Urban settlement in 2020 | Sentinel 2 T48UXU | 7 February 2020 | Digitizing/ georeferencing |
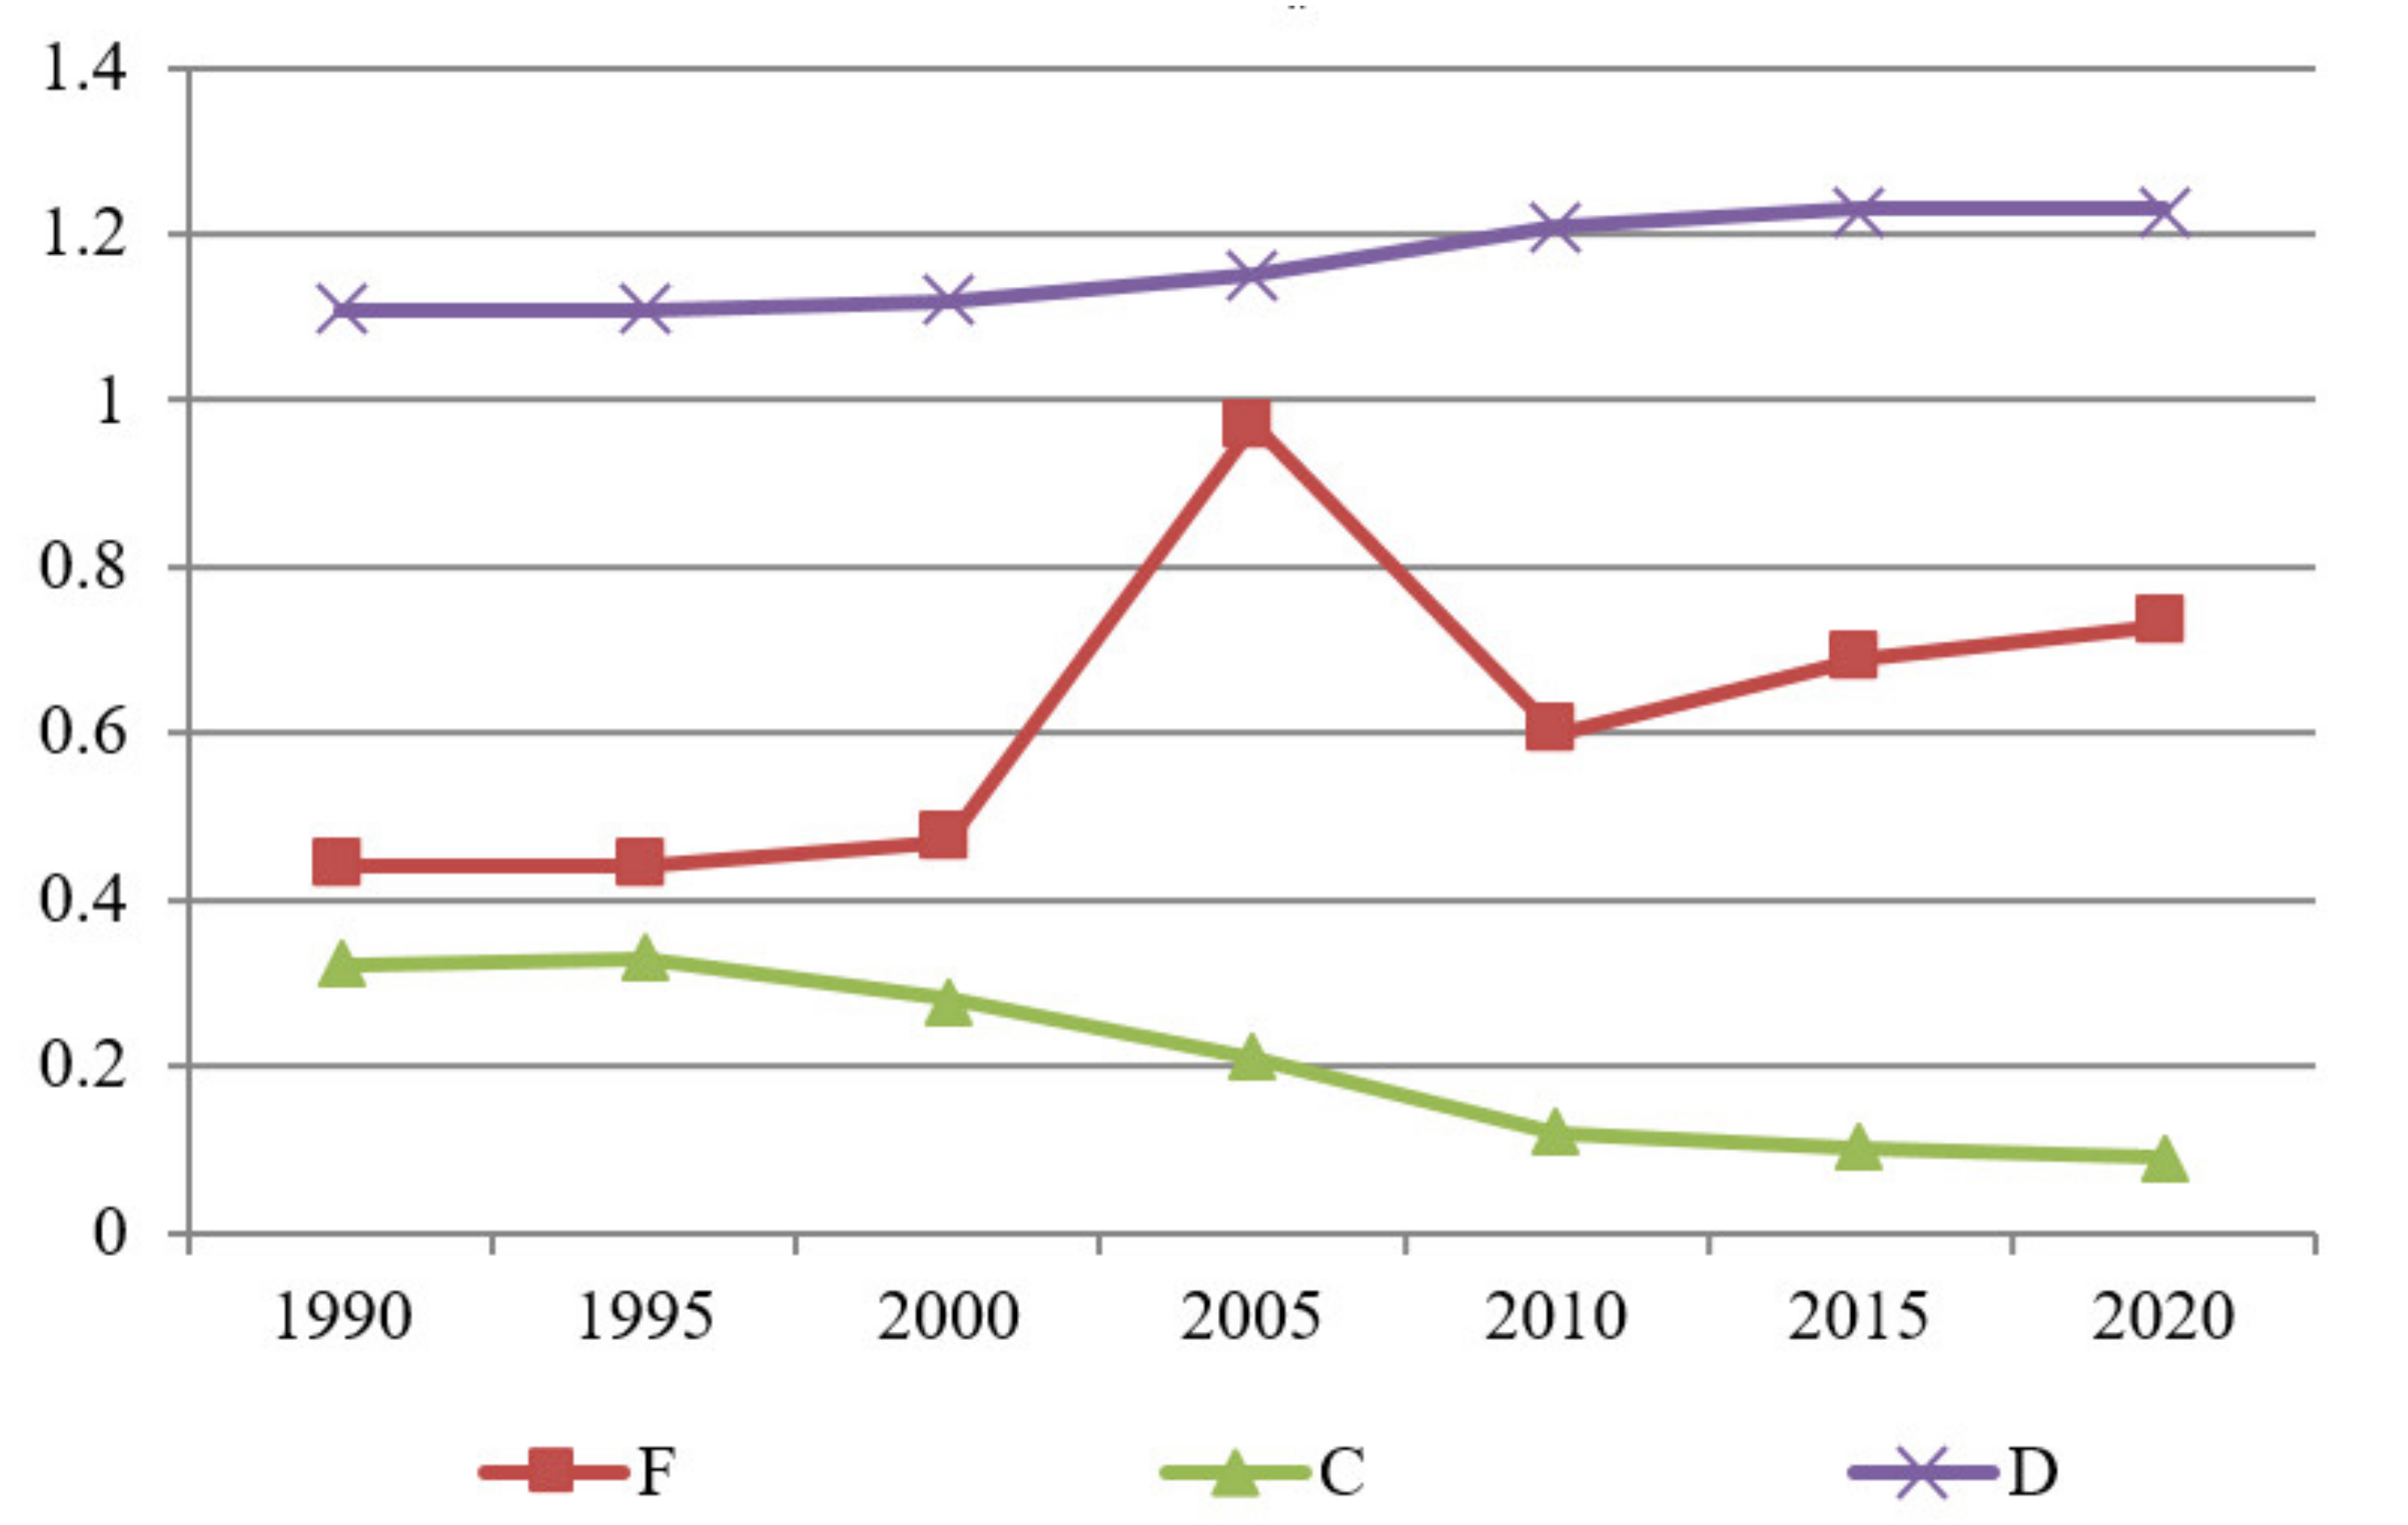
| Year | Area/ha/ | Perimeter | Feret’s Diameter /Max/ | Feret’s Diameter /Min/ | Feret’s Diameter (F) | Compactness (C) | Fractal Dimension (D) |
|---|---|---|---|---|---|---|---|
| 1990 | 10,370 | 112,600 | 27,321 | 12,183 | 0.44 | 0.32 | 1.11 |
| 1995 | 11,270 | 115,300 | 27,606 | 12,184 | 0.44 | 0.33 | 1.11 |
| 2000 | 15,141 | 155,927 | 25,955 | 12,155 | 0.47 | 0.28 | 1.12 |
| 2005 | 17,326 | 220,076 | 27,270 | 26,390 | 0.97 | 0.21 | 1.15 |
| 2010 | 26,541 | 483,850 | 45,880 | 27,580 | 0.60 | 0.12 | 1.21 |
| 2015 | 36,025 | 697,519 | 48,370 | 33,140 | 0.69 | 0.1 | 1.23 |
| 2020 | 39,235 | 772,190 | 50,321 | 36,932 | 0.73 | 0.09 | 1.23 |
| No. | Indicator | Unit of Measurement | Before the Project |
|---|---|---|---|
| 1 | Building coverage ratio | % | 33.7 |
| 2 | Population density | People per ha | 65.6 |
| 2 | Floor area ratio | Unit | 1.6 |
| Term | Area/ha/ | Perimeter | Feret’s Diameter /Max/ | Feret’s Diameter /Min/ | Feret’s Diameter (F) | Compactness (C) | Fractal Dimension (D) |
|---|---|---|---|---|---|---|---|
| MC | 26541 | 483850 | 45,880 | 27,580 | 0.60 | 0.12 | 1.21 |
| No | Indicator | Unit of Measurement | Before the Project |
|---|---|---|---|
| 1 | Building coverage ratio | % | 43.7 |
| 2 | Population density | People per ha | 50 |
| 2 | Floor area ratio | Unit | 1.8 |
| Term | Area/ha/ | Perimeter | Feret’s Diameter /Max/ | Feret’s Diameter /Min/ | Feret’s Diameter (F) | Compactness (C) | Fractal Dimension (D) |
|---|---|---|---|---|---|---|---|
| PC | 39235 | 772190 | 50,321 | 36,932 | 0.73 | 0.09 | 1.23 |
| No | Indicator | Unit of Measurement | Before the Project |
|---|---|---|---|
| 1 | Building coverage ratio | % | 57.8 |
| 2 | Population density | People per ha | 316 |
| 2 | Floor area ratio | Unit | 4.9 |
| No | Area | Average Population Density/ before/People/ha | Average Population Density/After/People/ha | Area Size /ha/ | Population/Now/ | Population/ after the Project/ | Difference |
|---|---|---|---|---|---|---|---|
| 1 | Land readjustment area | 65.6 | 316 | 4604.87 | 302,079 | 1,455,139 | 1,153,060 |
| Term | Area/ha/ | Perimeter | Feret’s Diameter /max/ | Feret’s Diameter /min/ | Feret’s Diameter (F) | Compactness (C) | Fractal Dimension (D) |
|---|---|---|---|---|---|---|---|
| CC | 12,479 | 97,837 | 22,300 | 13,600 | 0.61 | 0.40 | 1.08 |
| Term | Area /ha/ | Perimeter | Feret’s Diameter/Max/ | Feret’s Diameter/Min/ | Feret’s Diameter (F) | Compactness (C) | Fractal Dimension (D) | Building Coverage Ratio (BCR) | Floor Area Ratio (FAR) | Population Density (r) |
|---|---|---|---|---|---|---|---|---|---|---|
| MC | 26,541 | 483,850 | 45,880 | 27,580 | 0.60 | 0.12 | 1.21 | 33.7 | 1.6 | 65.6 |
| PC | 39,235 | 772,190 | 50,321 | 36,932 | 0.73 | 0.09 | 1.23 | 43.7 | 1.8 | 50 |
| CC | 12,479 | 97,837 | 22,300 | 13,600 | 0.61 | 0.40 | 1.08 | 57.8 | 4.7 | 316 |
Publisher’s Note: MDPI stays neutral with regard to jurisdictional claims in published maps and institutional affiliations. |
© 2020 by the authors. Licensee MDPI, Basel, Switzerland. This article is an open access article distributed under the terms and conditions of the Creative Commons Attribution (CC BY) license (http://creativecommons.org/licenses/by/4.0/).
Share and Cite
Batsuuri, B.; Fürst, C.; Myagmarsuren, B. Estimating the Impact of Urban Planning Concepts on Reducing the Urban Sprawl of Ulaanbaatar City Using Certain Spatial Indicators. Land 2020, 9, 495. https://doi.org/10.3390/land9120495
Batsuuri B, Fürst C, Myagmarsuren B. Estimating the Impact of Urban Planning Concepts on Reducing the Urban Sprawl of Ulaanbaatar City Using Certain Spatial Indicators. Land. 2020; 9(12):495. https://doi.org/10.3390/land9120495
Chicago/Turabian StyleBatsuuri, Bolormaa, Christine Fürst, and Buyandelger Myagmarsuren. 2020. "Estimating the Impact of Urban Planning Concepts on Reducing the Urban Sprawl of Ulaanbaatar City Using Certain Spatial Indicators" Land 9, no. 12: 495. https://doi.org/10.3390/land9120495
APA StyleBatsuuri, B., Fürst, C., & Myagmarsuren, B. (2020). Estimating the Impact of Urban Planning Concepts on Reducing the Urban Sprawl of Ulaanbaatar City Using Certain Spatial Indicators. Land, 9(12), 495. https://doi.org/10.3390/land9120495