Urbanization Chaos of Suburban Small Cities in Poland: ‘Tetris Development’


Abstract
1. Introduction
2. Distinctiveness of Urbanization Processes in Poland
2.1. Historical and Legislative Background
2.2. Contemporary Problems of Urban Development in Poland Generating Spatial Chaos
3. Materials and Methods
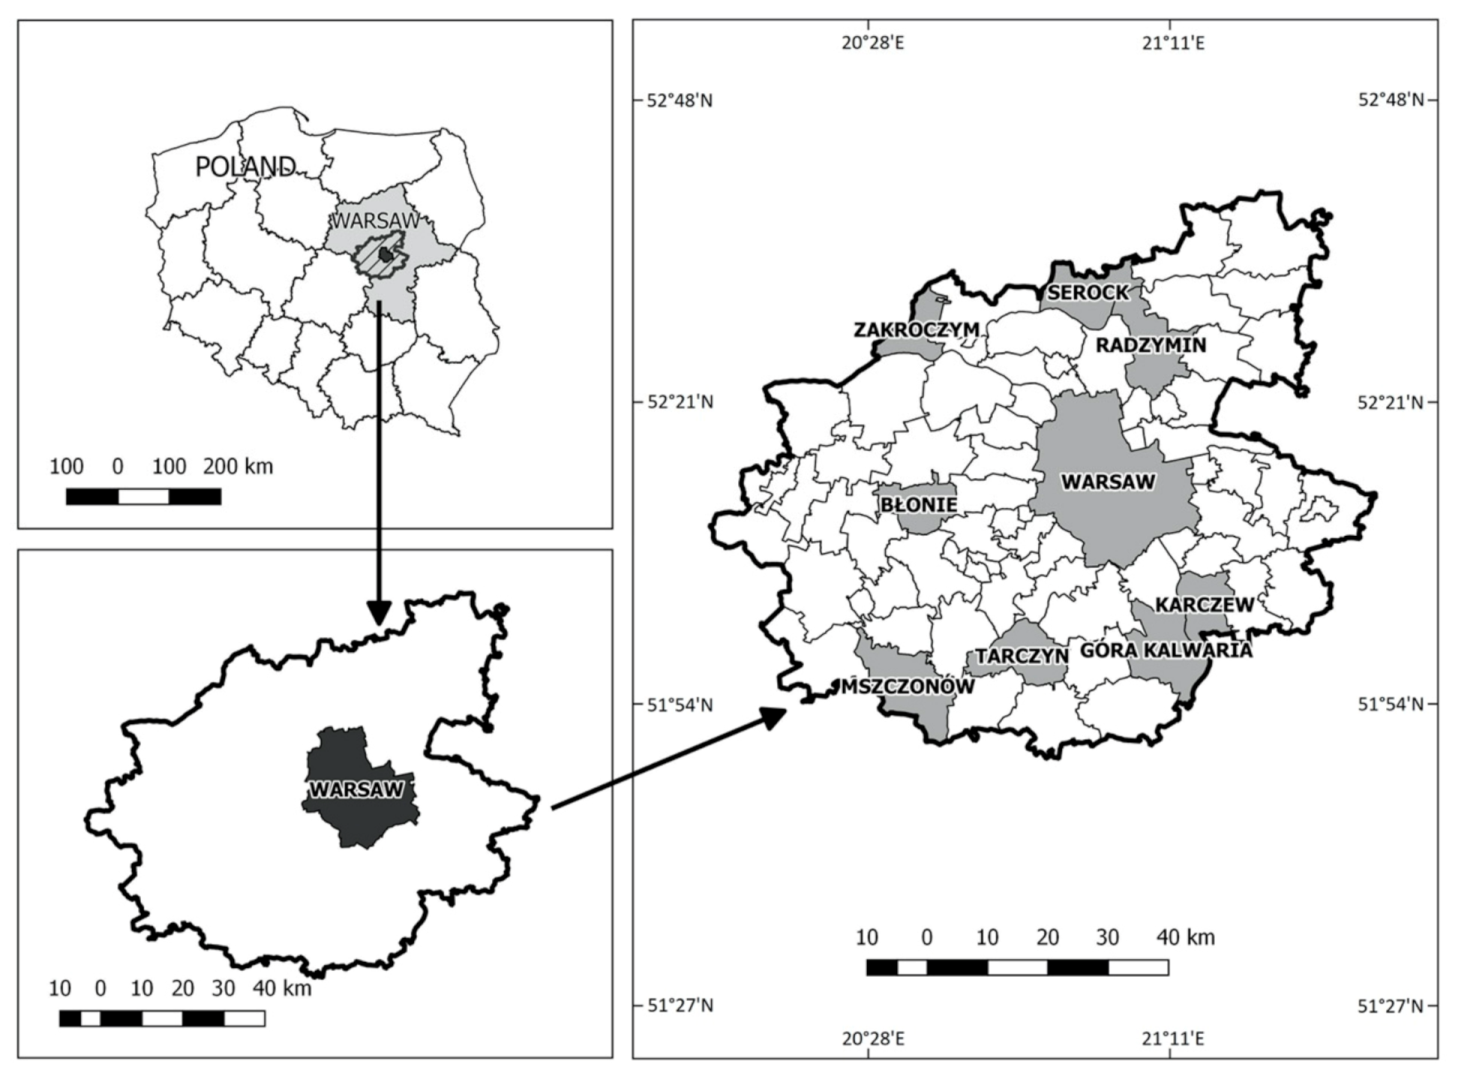
3.1. Study Area
3.2. Methods of Obtaining Data
- urban and spatial dysfunctions: lack of grid street plans, poor parameters of roads and plots, lack of harmony of spatial structures,
- low economic efficiency: considerable distances between places of residence, work and services,
- extensive development: low population density in built-up areas, low intensity of development, especially in the suburban zones of cities,
- reversal of the traditional urban planning model (the highest intensity in the center, decreasing as the distance from the center increases): the intensity of development in the center, as a result of leaving ‘urban voids’, is lower than the intensity of development of plots in the suburban zones where multifamily or terraced developments are built.
- theoretical method, based on literature review, in order to set the criteria for sustainable cities, good to live in cities and to identify good practices, as well as corrective measures,
- analytical method, which used retrospective studies of development of selected cities.
- (a)
- Analysis and interpretation of archival cartographic documents and aerial photographs of the studied cities in the years 1939, 1946, 1961, 1978, 1992, 2018, based on the authors’ own calculations of the surface of urbanized areas in specific periods, which were made using the ArcGIS ESRI and AutoCad software.
- (b)
- Analysis of changes in the demographic structure in different studied periods, based on archival statistical yearbooks and websites of the Central Statistical Office of Poland: Local Data Bank and Poland in Numbers.
- (c)
- Comparative analysis of the increases in the surface of urbanized areas based on own calculations (Stage I.a) correlated with the changes in population size (increase/decrease) in the studied years. The authors’ own comparative analyses, comparing the existing urbanized areas with the areas designated for development in the studies of conditions and directions of spatial development of municipalities.
- (d)
- Own calculations of population density in urbanized areas and population density within the administrative boundaries of cities since 1939. Own calculations of the surface of urbanized areas and changes in the population size. To this end, the BDOT10k topographical database and Kernel Density Estimation were used.
- (a)
- Analysis of the stages of spatial development (since 1939) of the most representative city, made on the basis of own calculations and interpretation of cartographic documents.
- (b)
- Comparative analysis of the ownership structure of the studied cities in view of the ‘Tetris development’ defining criteria.
- (c)
- Determination of the development intensity for selected, characteristic plots developed in different in the studied periods of the cities’ development, plot area, the total area of development, and the number of floors. To this end, the BDOT10k topographical database, Kernel Density Estimation and the geoportal.gov.pl site were used.
4. Results
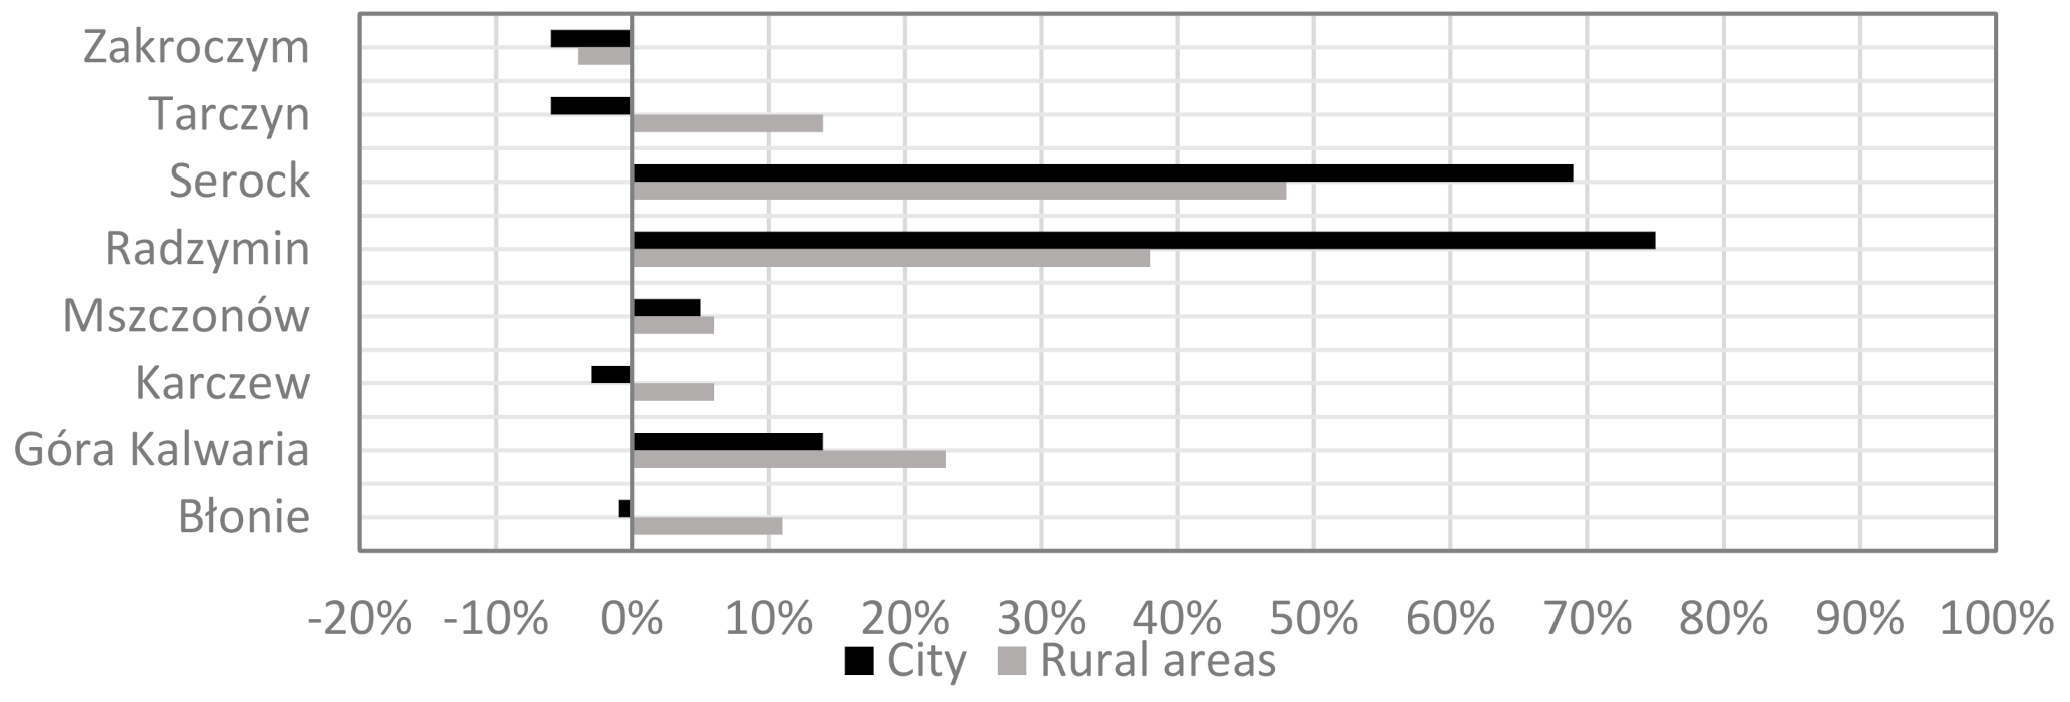
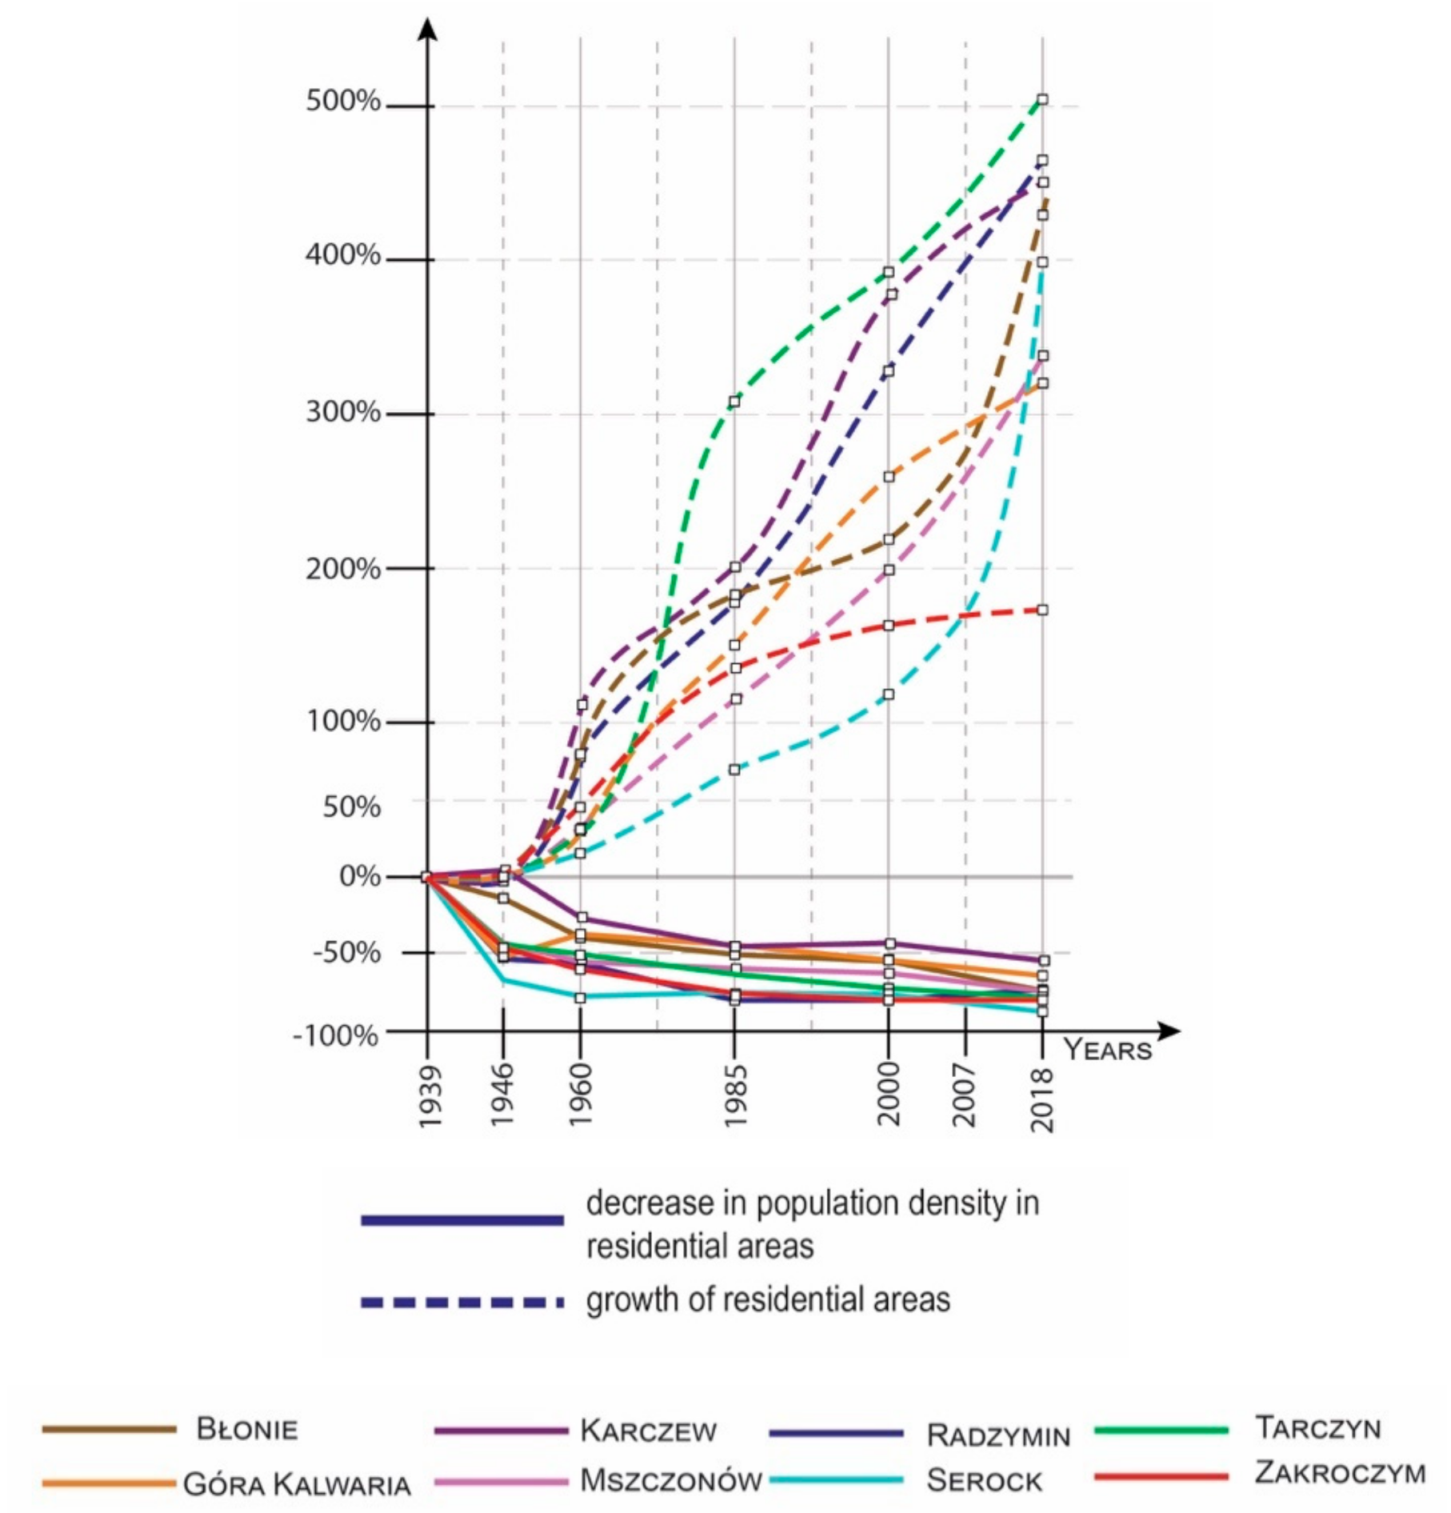
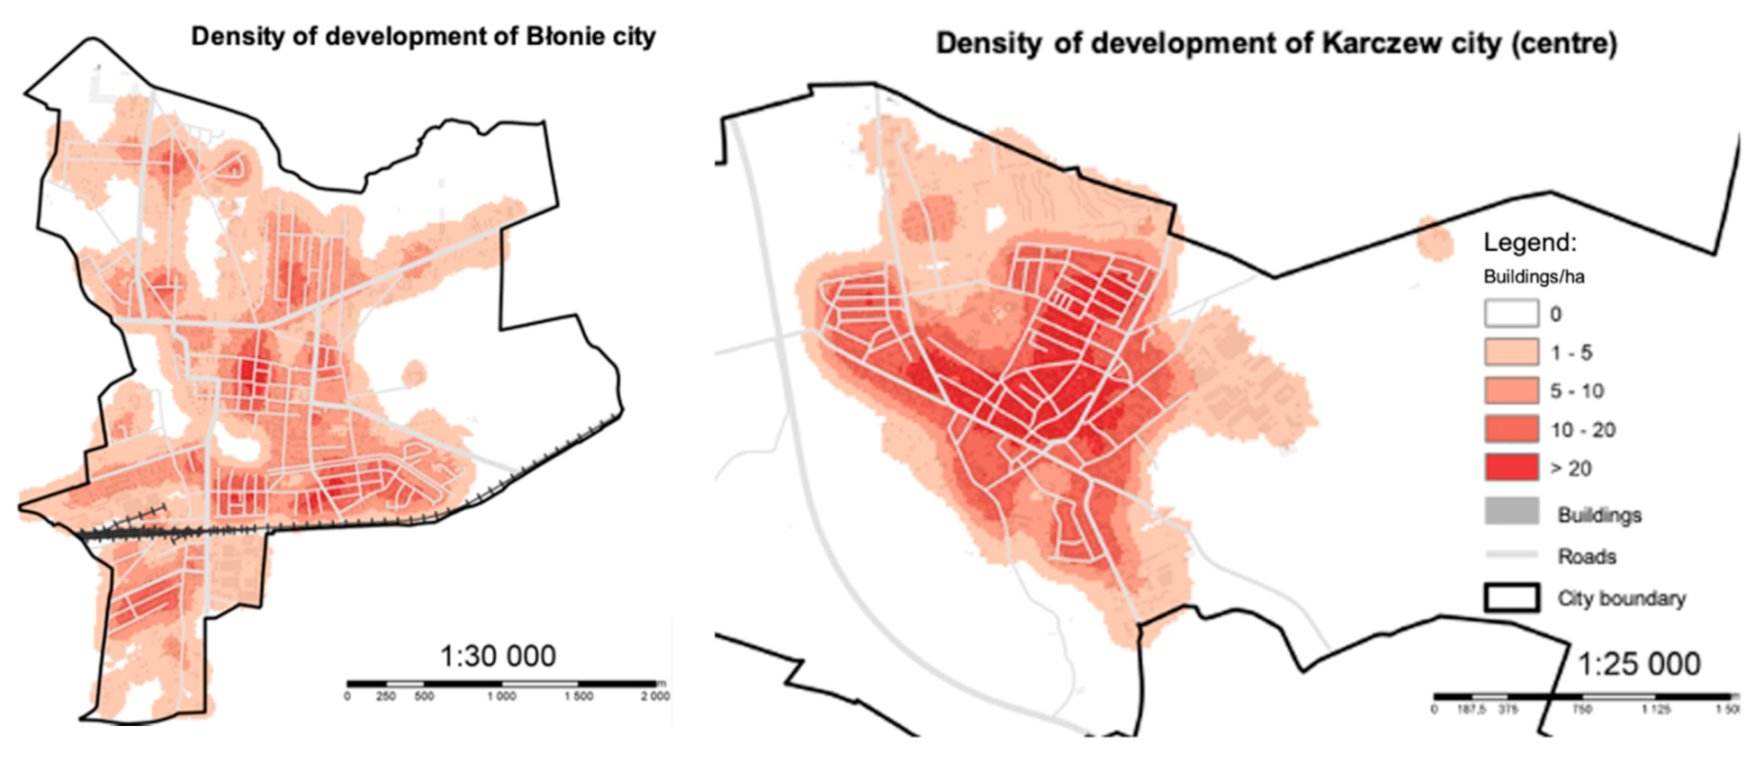
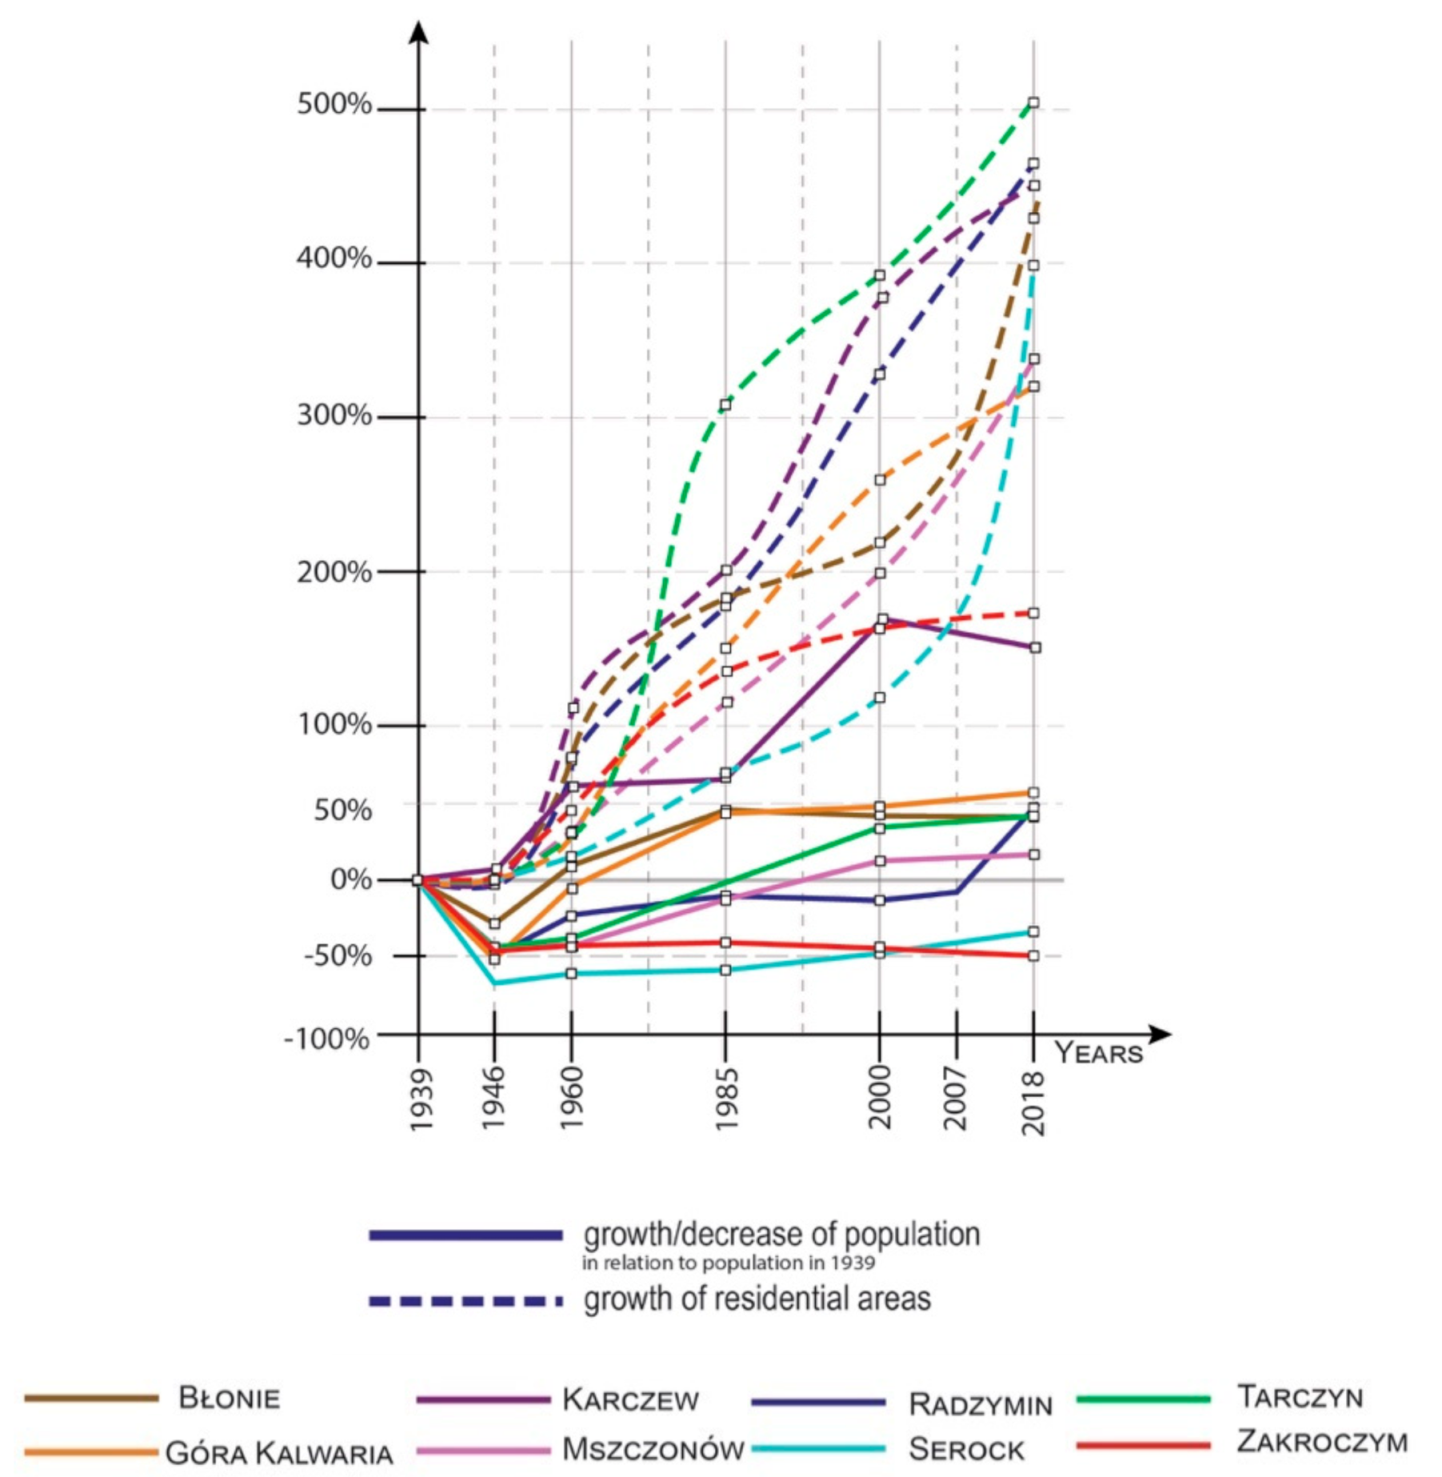
4.1. Decline in Population Density
4.2. Territorial Dispersion of Cities
- Until about 1985, the increase in built-up areas consisted of urban infill development within the historic center and on its outskirts (development took shape of multifamily and single-family housing estates corresponding to grid street plans and often initiated a new direction in urbanization) and the increase in built-up areas was connected with a new workplace, often near a new railway stop.
- From around 1985 to 2000, the process of building development along the outgoing roads from the center towards the surrounding villages could be observed (as early as before 1939, in all cities, there were also agricultural homesteads along the outgoing roads, and then single-family houses were built in their vicinity).
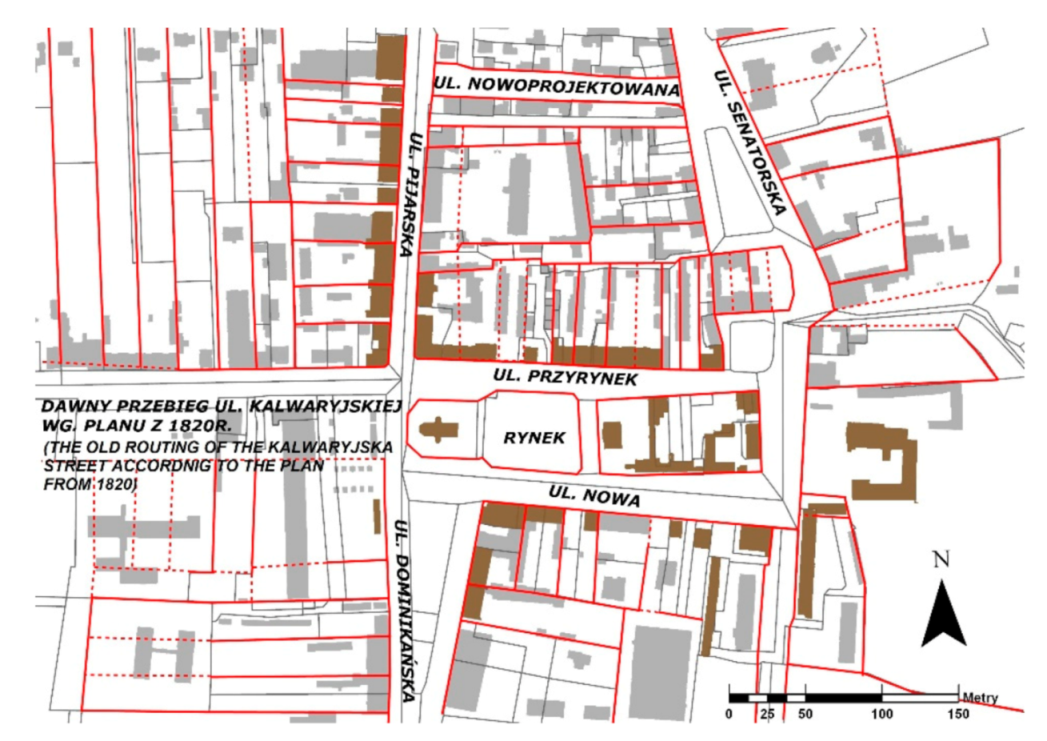
- From the mid-1990s to the present day, the process of building new housing units on agricultural areas, the so-called strip-of-farmland-based urban planning, could be observed. Comb-like layouts of cities, unrelated to the historic center and located at a distance of approx. 2–4 km, are delineated. The process of building residential development projects right near the city borders, unrelated to the historic center, could also be observed.
4.3. Territorial Dispersion of Cities and Spatial Planning Documents
5. Discussion and Conclusions
- Historical background and lack of legal guidelines shaping the development of Polish towns and cities at the turn of the 19th and 20th century.
- The principles of socialist economy associated urban development with territorial expansion, and the land had no economic value.
- The imperfect planning laws during the Polish People’s Republic made the distances between buildings equal for cities and villages. This has resulted in a situation, especially in small and medium-sized cities, where a detached single-family house has become the main element of the urban development structure.
- Poor spatial planning after the political transformation resulted in the local governments allocating—in their planning studies—considerably more land for building development than was actually needed; and the system of spatial planning—which was (supposed) to act as guardian of spatial order at a municipal level—turned out to be too weak of a tool.
- Abuse of property rights after the political transformation (as a reaction to the lack of respect for property rights during the Polish People’s Republic) and marginalization of the so-called public interest, in the name of economic gain, has left the urban landscape without protection.
- Lack of cultural heritage education and absence of good aesthetic standards among investors, educated during the Polish People’s Republic, resulted in the emergence of buildings in disharmony with the environment, where the main criteria are the economic gain and the maximum usability of the building.
- restrict the possibility of nonrural population settling in rural areas, redirecting potential residents to the urbanized areas of small towns; that would enable the population of these urban centers to grow and would make the upgrade of service and technical infrastructure economically viable), limit the spread of built-up areas to the city limits;
- delimit a zone of building concentration and the maximum possible development range, so that the urbanized area has a wide range of services accessible within a walking distance and ensure—through strong planning guidelines (introduction of urban standards to spatial planning)—the creation of rational spatial structures of newly urbanized areas.
- (1)
- Planning instruments linking mandatory planning (the study and the local development plan) to planned operations, including:
- designation of zones and areas (e.g., zone of agreed investment activities, zone with established municipal pre-emption right, heritage protection zones) which, thanks to relevant provisions in local plans, enable e.g., expropriation procedures or procedures for consolidation and division of real property into building plots,
- creating operational plans for tasks that must be undertaken in the coming years by municipal governments,
- creating guidelines for the so-called urban planning standards defining the criteria (road width, accessibility of services) that should be met by a property development company or a landowner for new areas to be allocated for residential use,
- increasing the role of studies of conditions and directions of spatial development of municipalities,
- verifying the population absorptive capacity estimates that are made for the purpose of drawing up the study of the conditions and directions of spatial development of the commune by the provincial governor (voivode) during the study’s adoption procedure,
- drawing up of programs for specific activities (e.g., land management, heritage conservation, technical infrastructure, revitalization and rehabilitation),
- introducing to the local spatial development plans new provisions imposing, when planning new investment areas, the construction of public roads with the appropriate widths to create coherent grid street plans,
- complete abolition of the decisions on land development conditions and public purpose investments.
- (2)
- ‘Support’ tools, including:
- financial tools (including repair and renovation reserves for owners, lower rents, tax credits, betterment levies, property and investment taxes),
- organizational and legal tools (e.g., the acquisition of decommissioned industrial plants by the municipality, the right of pre-emption of land, the establishment of mixed development zones, exemptions from tenders, land consolidation, and monitoring of the situation in order for the municipality to react quickly),
- instruments of ‘coercion’ (e.g., limitation of ownership right for public purposes, democratic public consultation procedure),
- financial and legal assistance to municipalities for compensation payments to landowners during the implementation of local development plans in the event of a change of function from residential to agricultural one.
Author Contributions
Funding
Conflicts of Interest
References
- Ludność na świecie. Available online: http://populationof.net/ (accessed on 4 September 2020).
- Wolny, A.; Źróbek, R. The interdependence between suburban enclaves and the road network in the development process: A case study in Poland. Geogr. Pol. 2017, 90, 41–57. [Google Scholar] [CrossRef]
- Borkowski, P.; Burnewicz, J.; Koźlak, A.; Pawłowska, B.; Ważna, A. Transport a organizacja przestrzeni w życiu społeczno-gospodarczym. In Costs of Spatial Chaos: Part 2: Studies on Spatial Chaos; Kowalewski, A., Markowski, T., Śleszyński, P., Eds.; Committee for Spatial Economy and Regional Planning Polish Academy of Sciences: Warsaw, Poland, 2018; Volume 182, pp. 81–113. [Google Scholar]
- Smutek, J. Change of municipal finances due to suburbanization as a development challenge on the example of Poland. Bull. Geogr. Soc. Econ. Ser. 2017, 37, 139–149. [Google Scholar] [CrossRef]
- Paszkowski, Z. Ideal City in a European Perspective and Its Links with Contemporary Urban Planning; Society of Authors and Publishers of Scientific Works Universitas: Cracow, Poland, 2012. [Google Scholar]
- Degórska, B. Spatial growth of urbanised land within the Warsaw Metropolitan Area in the first decade of the 21st century. Geogr. Pol. 2012, 85, 77–95. [Google Scholar] [CrossRef]
- Budzyński, T.; Jaroszewicz, J.; Krupowicz, W.; Majewska, A.; Sajnóg, N. A method for identification of future suburbanisation areas. Geodetski Vestnik 2018, 62, 472–485. [Google Scholar] [CrossRef]
- Restrepo Cadavid, P.; Cineas, G.; Quintero, L.E.; Zhukova, S. Cities in Eastern Europe and Central Asia: A Story of Urban Growth and Decline; Report No. AUS12288; The World Bank: Washington, DC, USA, 2017; Available online: http://documents1.worldbank.org/curated/en/319131510892209158/pdf/AUS12288-REVISED-PUBLIC-ECABRIEFALLWEB.pdf (accessed on 30 October 2020).
- Yiran GA, B.; Ablo, A.D.; Asem, F.E.; Owusu, G. Urban Sprawl in sub-Saharan Africa: A review of the literature in selected countries. Ghana J. Geogr. 2020, 12, 1–28. [Google Scholar] [CrossRef]
- Ewing, R.; Hamidi, S. Compactness versus Sprawl: A Review of Recent Evidence from the United States. J. Plan. Lit. 2015, 30, 413–432. [Google Scholar] [CrossRef]
- EEA—European Environment Agency. Urban Sprawl in Europe. EEA Report No. 11/2016. Available online: https://www.eea.europa.eu/publications/urban-sprawl-in-europe (accessed on 4 September 2020).
- Śleszyński, P.; Kowalewski, A.; Markowski, T.; Legutko-Kobus, P.; Nowak, M. The Contemporary Economic Costs of Spatial Chaos: Evidence from Poland. Land 2020, 9, 214. [Google Scholar] [CrossRef]
- Jaeger, J.A.G.; Schwick, C. Improving the measurement of urban sprawl: Weighted Urban Proliferation (WUP) and its application to Switzerland. Ecol. Indic. 2014, 38, 294–308. [Google Scholar] [CrossRef]
- Hennig, E.I.; Schwickb, C.; Soukupc, T.; Orlitovác, E.; Kienastb, F.; Jaegera, J.A.G. Multi-scale analysis of urban sprawl in Europe: Towards a European de-sprawling strategy. Land Use Policy 2015, 49, 483–498. [Google Scholar] [CrossRef]
- Hlaváček, P.; Kopáček, M.; Horáčková, L. Impact of Suburbanisation on Sustainable Development of Settlements in Suburban Spaces: Smart and New Solutions. Sustainability 2019, 11, 7182. [Google Scholar] [CrossRef]
- Artmann, M.; Inostroza, L.; Fan, P. Urban sprawl, compact urban development and green cities. How much do we know, how much do we agree? Ecol. Indic. 2019, 96, 3–9. [Google Scholar] [CrossRef]
- European Environment Agency (EEA). Land Take in Europe. Available online: https://www.eea.europa.eu/data-and-maps/indicators/land-take-3/assessment (accessed on 4 September 2020).
- Bernhardt, E.S.; Palmer, M.A. Restoring streams in an urbanizing world. Freshw. Biol. 2007, 52, 738–751. [Google Scholar] [CrossRef]
- da Encarnação Paiva, A.C.; Nascimento, N.; Rodriguez, D.A.; Tomasella, J.; Carriello, F.; Rezende, F.S. Urban expansion and its impact on water security: The case of the Paraíba do Sul River Basin, São Paulo, Brazil. Sci. Total Environ. 2020, 720, 137509. [Google Scholar] [CrossRef] [PubMed]
- Kabisch, N.; Strohbach, M.; Haase, D.; Kronenberg, J. Urban green space availability in European cities. Ecol. Indic. 2016, 70, 586–596. [Google Scholar] [CrossRef]
- Bart, I. Urban sprawl and climate change: A statistical exploration of cause and effect, with policy options for the EU. Land Use Policy 2010, 27, 283–292. [Google Scholar] [CrossRef]
- Borelli, S.; Chen, Y.; Conigliaro, M.; Salbitano, F. Green infrastructure: A new paradigm for developing cities. In Proceedings of the World Forestry Congress Conference Paper, Durban, South Africa, 7–11 September 2015. [Google Scholar] [CrossRef]
- Ochoa, C.Y.; Jiménez, D.F.; Olmo, R.M. Green Infrastructure Planning in Metropolitan Regions to Improve the Connectivity of Agricultural Landscapes and Food Security. Land 2020, 9, 414. [Google Scholar] [CrossRef]
- Gavrilidis, A.A.; Nita, M.R.; Onose, A.D.; Badiu, D.L.; Nastase, I.I. Methodological framework for urban sprawl control through sustainable planning of urban green infrastructure. Ecol. Indic. 2019, 96, 67–78. [Google Scholar] [CrossRef]
- Di Marino, M.; Tiitu, M.; Lapintie, K.; Viinikka, A.; Kopperoinen, L. Land use policy integrating green infrastructure and ecosystem services in land use planning. Results from two Finnish case studies. Land Use Policy 2019, 82, 643–656. [Google Scholar] [CrossRef]
- European Commission, Directorate General for Regional Policy. Cities of Tomorrow: Challenges, Visions, Ways Forward; European Union: Brussels, Belgium, 2011. [Google Scholar] [CrossRef]
- Ahlfedlt, G.; Pietrostefani, E. The Effects of Compact Urban Form: A Qualitative and Quantitative Evidence Review; Coalition for Urban Transitions: London, UK; Washington, DC, USA, 2017; Available online: http://newclimateeconomy.report/workingpapers/wp-content/uploads/sites/5/2017/09/NCE2017_OECD_CompactUrbanGrowth.pdf (accessed on 30 October 2020).
- Gehl, J. Miasta dla Ludzi; RAM: Cracow, Poland, 2014. [Google Scholar]
- Sobczyk, J. Historia Planowania i Budowy Miast; Wydawnictwo Uniwersytetu Opolskiego: Opole, Poland, 2012. [Google Scholar]
- Yigitcanlar, T.; Kamruzzaman, M. Does smart city policy lead to sustainability of cities? Land Use Policy 2018, 73, 49–58. [Google Scholar] [CrossRef]
- Carvalho, L. Smart cities from scratch? A socio-technical perspective. Camb. J. Reg. Econ. Soc. 2015, 8, 43–60. [Google Scholar] [CrossRef]
- Caragliu, A.; Del Bo, C.; Nijkamp, P. Smart Cities in Europe. J. Urban Technol. 2011, 18, 65–82. [Google Scholar] [CrossRef]
- Gonzalez, E.L.; Chinelli, C.K.; Azevedo Guedes, A.L.; Vazquez, E.G.; Hammad, A.W.; Haddad, A.N.; Pereira Soares, C.A. Smart and Sustainable Cities: The Main Guidelines of City Statute for Increasing the Intelligence of Brazilian Cities. Sustainability 2020, 12, 1025. [Google Scholar] [CrossRef]
- van den Besselaar, P.; Koizumi, S. Digital Cities III. Information technologies for social capital: Cross-cultural perspectives. In Proceedings of the Third International Digital Cities Workshop, Amsterdam, The Netherlands, 18–19 September 2003. [Google Scholar]
- Czałczyńska-Podolska, M.; Rzeszotarska-Pałka, M. Spaces that heal and integrate as inspiration for a new look on the modern city. Space Form 2016, 28, 165–180. [Google Scholar] [CrossRef]
- Mayer, H.; Knox, P.L. Slow Cities: Sustainable Places in a Fast World. J. Urban Aff. 2006, 28, 321–334. [Google Scholar] [CrossRef]
- Konecka-Szydłowska, B. Zróżnicowanie polskiej sieci miast Cittaslow w aspekcie społeczno-gospodarczym. In Alternatywne Modele Rozwoju Miast. Sieć Miast Cittaslow; Strzelecka, E., Ed.; Politechnika Łódzka: Łódź, Poland, 2017; pp. 61–73. Available online: https://www.researchgate.net/publication/341219740_Zroznicowanie_polskiej_sieci_miast_Cittaslow_w_aspekcie_spoleczno-gospodarczym (accessed on 15 September 2020).
- Dunham-Jones, E.; Williamson, J. Retrofitting Suburbia: Urban Design Solutions for Redesigning Suburbs; John Wiley & Sons: Hoboken, NJ, USA, 2008. [Google Scholar]
- Mantey, D.; Pokojski, W. New Indicators of Spatial Chaos in the Context of the Need for Retrofitting Suburbs. Land 2020, 9, 276. [Google Scholar] [CrossRef]
- Spórna, T. The suburbanisation process in a depopulation context in the Katowice conurbation, Poland. Environ. Socio Econ. Stud. 2018, 6, 57–72. [Google Scholar] [CrossRef]
- Kovács, Z.; Farkas, Z.J.; Egedy, T.; Kondor, A.C.; Szabó, B.; Lennert, J.; Baka, D.; Kohán, B. Urban sprawl and land conversion in post-socialist cities: The case of metropolitan Budapest. Cities 2019, 92, 71–81. [Google Scholar] [CrossRef]
- Slaev, A.D.; Nedović-Budić, Z.; Krunić, N.; Petrić, J.; Daskalova, D. Suburbanization and sprawl in post-socialist Belgrade and Sofia. Eur. Plan. Stud. 2018, 26, 1389–1412. [Google Scholar] [CrossRef]
- Majewska, A. Przekształcenia Małych Miast w Polsce na Przykładzie Specyfiki Miast Mazowieckich w Strefie Podmiejskiej Warszawy; Oficyna Wydawnicza Politechniki Warszawskiej: Warsaw, Poland, 2020. [Google Scholar]
- Chmielewski, J.M. Teoria Urbanistyki w Projektowaniu i Planowaniu Miast, 3rd ed.; Oficyna Wydawnicza Politechniki Warszawskiej: Warsaw, Poland, 2010. [Google Scholar]
- Gzell, S. Suburbanizacja a projektowe strategie urbanistyczne. In Miasto zwarte. Problem Terenów Granicznych; Gzell, S., Wośko-Czeranowska, A., Majewska, A., Świeżewska, K., Eds.; Akapit-DTP: Warsaw, Poland, 2011; pp. 5–20. Available online: http://docplayer.pl/13046612-Miasto-zwarte-problem-terenow-granicznych.html (accessed on 15 September 2020).
- Kalinowski, W. Rozwój miast w Polsce. In Zabytki Architektury i Urbanistyki w Polsce: Odbudowa i Konserwacja. Miasta Historyczne; Zin, W., Ed.; Wydawnictwo Arkady: Warsaw, Poland, 1986. [Google Scholar]
- Nowakowski, M.; Bańkowska, B. Sto lat Planowania Przestrzeni Polskich Miast (1910−2010); Oficyna Naukowa Elżbieta Nowakowska-Sołtan: Warsaw, Poland, 2013. [Google Scholar]
- Szymkiewicz, G. Komentarz do Prawa Budowlanego; Warszawskie Koło Architektów: Warsaw, Poland, 1938; Volume 14, p. 3. [Google Scholar]
- Feltynowski, M. Polityka Przestrzenna Obszarów Wiejskich. W Kierunku Wielofunkcyjnego Rozwoju; CeDeWu: Warsaw, Poland, 2009. [Google Scholar]
- Nowak, M. Planowanie i Zagospodarowanie Przestrzenne. Komentarz do Ustawy i Przepisów Powiązanych; Wydawnictwo C.H. Beck: Warsaw, Poland, 2020. [Google Scholar]
- Chmielewski, J.M. Teoretyczne przesłanki budowania systemu planowania przestrzennego na poziomie lokalnym. In Współczesne Uwarunkowania Gospodarowania Przestrzenią—Szanse i Zagrożenia dla Zrównoważonego Rozwoju. Planowanie Przestrzenne; Maciejewska, A., Ed.; Oficyna Wydawnicza Politechniki Warszawskiej: Warsaw, Poland, 2014; Volume 3, pp. 33–54. [Google Scholar]
- Śleszyński, P. Społeczno-ekonomiczne skutki chaosu przestrzennego dla osadnictwa i struktury funkcjonalnej terenów. In Koszty Chaosu Przestrzennego: Cz. 2. Studia nad Chaosem Przestrzennym; Kowalewski, A., Markowski, T., Śleszyński, P., Eds.; Committee for Spatial Economy and Regional Planning Polish Academy of Sciences: Warsaw, Poland, 2018; Volume 182, pp. 29–80. [Google Scholar]
- GUS (Central Statistical Office of Poland). Prognoza Ludności na Lata 2014–2050 (Opracowana 2014 r.). Available online: https://stat.gov.pl/obszary-tematyczne/ludnosc/prognoza-ludnosci/prognoza-ludnosci-na-lata-2014-2050-opracowana-2014-r-,1,5.html (accessed on 4 September 2020).
- Solarek, K. Dezurbanizacja południowej strefy podmiejskiej Warszawy. Charakterystyka procesu, główne założenia. In Problem Suburbanizacji; No. 7; Lorens, P., Ed.; Biblioteka Urbanisty: Warsaw, Poland, 2005; pp. 63–70. [Google Scholar]
- Sławiński, T.; Denis, M. Rozlewanie się zabudowy w świetle zmian ustawodawstwa z 1994 i 2003 roku. In Planowanie Przestrzenne w Polsce po Wprowadzeniu Ustroju Samorządowego. Diagnoza Stanu i Nowe Propozycje; Instytut Gospodarki Przestrzennej i Mieszkalnictwa: Warsaw, Poland, 2008; pp. 365–429. [Google Scholar]
- Masztalski, R.P. Przeobrażenia Struktury Przestrzennej Małych Miast Dolnego Śląska po 1945 Roku; Oficyna Wydawnicza Politechniki Wrocławskiej: Wrocław, Poland, 2005. [Google Scholar]
- Paprzyca, K. Harmonizowanie Rozwoju Urbanistycznego Terenów Miejskich—Wybrane Zagadnienia; Politechnika Krakowska im. Tadeusza Kościuszki: Cracow, Poland, 2012. [Google Scholar]
- Sparmann, A. Die Kunst der Versöhnung—Wie sie Gelingt. Rettet die Oberschicht. GEO Magazin, 2016; Volume 1, 120–123. [Google Scholar]
- Solarek, K. Struktura Przestrzenna Strefy Podmiejskiej Warszawy. Determinanty Współczesnych Przekształceń; Zeszyt Architektura 13; Oficyna Wydawnicza Politechniki Warszawskiej: Warsaw, Poland, 2013. [Google Scholar]
- Hardin, P.J.; Jackson, M.W.; Otterstrom, S.M. Mapping, measuring, and modeling urban growth. In Geo-Spatial Technologies in Urban Environments, 2nd ed.; Jensen, R.R., Gatrell, J.D., McLean, D., Eds.; Springer: Berlin/Heidelberg, Germany, 2007; pp. 141–176. [Google Scholar]
- Tsai, Y. Quantifying urban form: Compactness versus ‘sprawl’. Urban Stud. 2005, 42, 141–161. [Google Scholar] [CrossRef]
- Galster, G.; Hanson, R.; Wolman, H.; Coleman, S.; Freihage, J. Wrestling sprawl to the ground: Defining and measuring an elusive concept. Hous. Policy Debate 2001, 12, 681–717. [Google Scholar] [CrossRef]
- Angel, S.; Parent, J.; Civco, D. Urban sprawl metrics: An analysis of global urban expansion using GIS. In Proceedings of the ASPRS 2007 Annual Conference, Tampa, FL, USA, 7–11 May 2007; Available online: https://www.asprs.org/wp-content/uploads/2011/01/0003.pdf (accessed on 30 October 2020).
- Jiang, F.; Liu, S.; Yuan, H.; Zhang, Q. Measuring urban sprawl in Beijing with geo-spatial indices. J. Geogr. Sci. 2007, 17, 469–478. [Google Scholar] [CrossRef]
- Torrens, P.M. A toolkit for measuring sprawl. Appl. Spat. Anal. Policy 2008, 1, 5–36. [Google Scholar] [CrossRef]
- Batisani, N.; Yarnal, B. Urban expansion in Centre County, Pennsylvania: Spatial dynamics and landscape transformations. Appl. Geogr. 2009, 29, 235–249. [Google Scholar] [CrossRef]
- Feranec, J.; Jaffrain, G.; Soukup, T.; Hazeu, G. Determining changes and flows in European landscapes 1990–2000 using CORINE land cover data. Appl. Geogr. 2009, 30, 19–35. [Google Scholar] [CrossRef]
- Ji, W.; Ma, J.; Twibell, R.W.; Underhill, K. Characterizing urban sprawl using multi-stage remote sensing images and landscape metrics. Comput. Environ. Urban Syst. 2006, 30, 861–879. [Google Scholar] [CrossRef]
- Bhatta, B. Analysis of urban growth pattern using remote sensing and GIS: A case study of Kolkata, India. Int. J. Remote Sens. 2009, 30, 4733–4746. [Google Scholar] [CrossRef]
- Bhatta, B.; Saraswati, S.; Bandyopadhyay, D. Urban sprawl measurement from remote sensing data. Appl. Geogr. 2010, 30, 731–740. [Google Scholar] [CrossRef]
- Nazarnia, N.; Harding, C.; Jaeger, J.A.G. How suitable is entropy as a measure of urban sprawl? Landsc. Urban Plan. 2019, 184, 32–43. [Google Scholar] [CrossRef]
- Belliot, M. Habitat Forme Urbaines. Densités Comparées et Tendences D’évolution en France; Fédération Nationale de Agences d’Urbanisme: Paris, France, 2006; Available online: http://www.fnau.org/wp-content/uploads/2016/03/HabitatFormesUrbaines.pdf (accessed on 15 September 2020).
- Bordes-Pagés, E. Referentiel de Densites et de Formes Urbaines; IAURIF: Paris, France, 1995; Available online: https://www.iau-idf.fr/fileadmin/NewEtudes/Etude_762/Densites_Referentiel.pdf (accessed on 15 September 2020).
- Pafka, E. Multi-scalar urban densities: From the metropolitan to the street level. Urban Des. Int. 2020. [Google Scholar] [CrossRef]
- Angel, S.; Sheppard, S.; Civco, D. The Dynamics of Global Urban Expansion; World Bank, Transport and Urban Development Department: Washington, DC, USA, 2005. [Google Scholar]
- Wackernagel, M.; Kitzes, J.; Moran, D.; Goldfinger, S.; Thomas, M. The Ecological Footprint of cities and regions: Comparing resource availability with resource demand. Environ. Urban 2006, 18, 103–112. [Google Scholar] [CrossRef]
- Pelégrin-Genel, E.; Pelégrin, F. Ambiances, Densités Urbaines et Developpement Durable; Editions PC: Paris, France, 2008. [Google Scholar]
- Gottdiener, M.; Budd, L. Key Concepts in Urban Studies; SAGE Publications Ltd.: London, UK, 2005. [Google Scholar] [CrossRef]
- Newman, P.; Kenworthy, J.R. Gasoline Consumption and Cities—A Comparison of U.S. Cities with a Global Survey. J. Am. Plan. Assoc. 1989, 55, 24–37. [Google Scholar] [CrossRef]
- Satterthwaite, D. The Key Issues and the Works. In The Earthscan Reader in Sustainable Cities; Satterthwaite, D., Ed.; Earthscan Publications: London, UK, 1999; pp. 3–21. [Google Scholar]
- Śleszyński, P.; Markowski, T.; Kowalewski, A. Wprowadzenie synteza. In Uwarunkowania, Skutki i Propozycje Naprawy Chaosu Przestrzennego: Cz. 3, Studia nad Chaosem Przestrzennym; Kowalewski, A., Markowski, T., Śleszyński, P., Eds.; Committee for Spatial Economy and Regional Planning Polish Academy of Sciences: Warsaw, Poland, 2018; Volume 182, pp. 13–28. [Google Scholar]
- Central Statistical Office of Poland (GUS). Statistical Yearbook of Cities and Statistics of Cities and Estates 1945–1965; Central Statistical Office of Poland (GUS): Warsaw, Poland, 1980. [Google Scholar]
- Geoportal. Polish Spatial Information Database. Available online: https://mapy.geoportal.gov.pl/imap/Imgp_2.html?gpmap=gp0 (accessed on 4 September 2020).
- Krzysztofik, S. Space management at the local level in view Of the conditions and planning theory on the example of medium-sized cities in the Łódź region. Archit. Civ. Eng. Environ. 2016, 9, 13–20. Available online: https://www.exeley.com/exeley/journals/architecture_civil_engineering_environment/9/3/pdf/10.21307_aace-2016-032.pdf (accessed on 3 November 2020). [CrossRef]
- Kowalewski, A.; Markowski, T.; Śleszyński, P. (Eds.) Studia nad Chaosem Przestrzennym: Cz. 1. Chaos Przestrzenny i Prawo. Uwarunkowania, Procesy, Skutki, Rekomendacje, Cz. 2. Koszty Chaosu Przestrzennego, Cz. 3. Synteza. Uwarunkowania, Skutki i Propozycje Naprawy Chaosu Przestrzennego; Committee for Spatial Economy and Regional Planning Polish Academy of Sciences: Warsaw, Poland, 2018; Volume 182. [Google Scholar]
- Van Assen, S.; Van Den Boomen, T.; Broekman, M.; Van Eyck, G. Urban Challenges, Resilient Solutions: Design Thinking for the Future of Urban Regions; Valiz: Amsterdam, The Netherlands, 2017. [Google Scholar]
- Ziobrowski, Z. Instrumenty i narzędzia operacyjne. In Odnowa Miast: Rewitalizacja, Rehabilitacja, Restrukturyzacja; Ziobrowski, Z., Ed.; Instytut Gospodarki Przestrzennej i Komunalnej, Oddział w Krakowie: Cracow, Poland, 2000. [Google Scholar]
- Skalski, K. Programy rewitalizacji w Polsce. Bilans, analiza porównawcza, perspektywy. In Projekty i Programy Rewitalizacji w Latach 2000–2006. Studium Przypadków; Skalski, K., Ed.; Stowarzyszenie Forum Rewitalizacji: Cracow, Poland, 2006; pp. 10–35. [Google Scholar]


| Years/ha | 2002 | 2004 | 2006 | 2008 | 2010 | 2012 | 2014 | 2016 | 2018 | Increase |
|---|---|---|---|---|---|---|---|---|---|---|
| POLAND | 235,992 | 212,506 | 245,247 | 256,578 | 278,479 | 296,600 | 315,578 | 333,296 | 348,555 | 47.70% |
| LOWER SILESIAN (DOLNOŚLĄSKIE) | 29,530 | 16,428 | 18,961 | 19,064 | 19,928 | 20,496 | 21,057 | 22,432 | 23,242 | −21.29% |
| KUJAWSKO-POMORSKIE | 9028 | 12,843 | 14,246 | 14,942 | 15,862 | 16,778 | 17,775 | 20,764 | 21,206 | 134.89% |
| LUBELSKIE | 11,625 | 10,092 | 7427 | 7910 | 8633 | 9490 | 10,264 | 10,962 | 11,307 | −2.74% |
| LUBUSKIE | 10,317 | 7723 | 7916 | 7922 | 8271 | 8591 | 9093 | 9431 | 10,002 | −3.05% |
| ŁÓDZKIE | 13,613 | 16,605 | 17,420 | 17,300 | 18,410 | 19,044 | 20,170 | 21,479 | 22,840 | 67.78% |
| MAŁOPOLSKIE | 11,982 | 14,919 | 12,653 | 14,214 | 16,999 | 19,663 | 22,389 | 24,557 | 26,366 | 120.05% |
| MAZOWIECKIE | 25,883 | 28,115 | 35,547 | 37,715 | 42,902 | 45,702 | 50,102 | 52,697 | 54,251 | 109.60% |
| OPOLSKIE | 6672 | 5029 | 8033 | 8828 | 9319 | 9753 | 10,374 | 10,513 | 10,733 | 60.87% |
| PODKARPACKIE | 32,543 | 7191 | 8555 | 9622 | 10,826 | 12,415 | 13,554 | 15,073 | 15,922 | −51.07% |
| PODLASKIE | 15,293 | 7082 | 7352 | 7107 | 7374 | 7645 | 7967 | 8144 | 8441 | −44.80% |
| POMORSKIE | 12,732 | 12,642 | 16,718 | 16,184 | 17,782 | 18,859 | 19,739 | 20,768 | 21,737 | 70.73% |
| ŚLĄSKIE (SILESIAN) | 23,633 | 31,618 | 38,909 | 40,613 | 43,544 | 46,174 | 47,818 | 49,706 | 51,015 | 115.86% |
| ŚWIĘTOKRZYSKIE | 3943 | 4050 | 6879 | 7275 | 7567 | 8022 | 8775 | 9062 | 9375 | 137.76% |
| WARMIŃSKO-MAZURSKIE | 9438 | 10,283 | 11,131 | 11,420 | 12,016 | 12,478 | 13,175 | 14,157 | 14,477 | 53.39% |
| WIELKOPOLSKIE | 10,802 | 19,133 | 23,447 | 26,015 | 28,112 | 29,666 | 31,215 | 32,911 | 34,530 | 219.66% |
| ZACHODNIOPOMORSKIE | 8959 | 8752 | 10,054 | 10,447 | 10,935 | 11,824 | 12,111 | 10,640 | 13,111 | 46.34% |
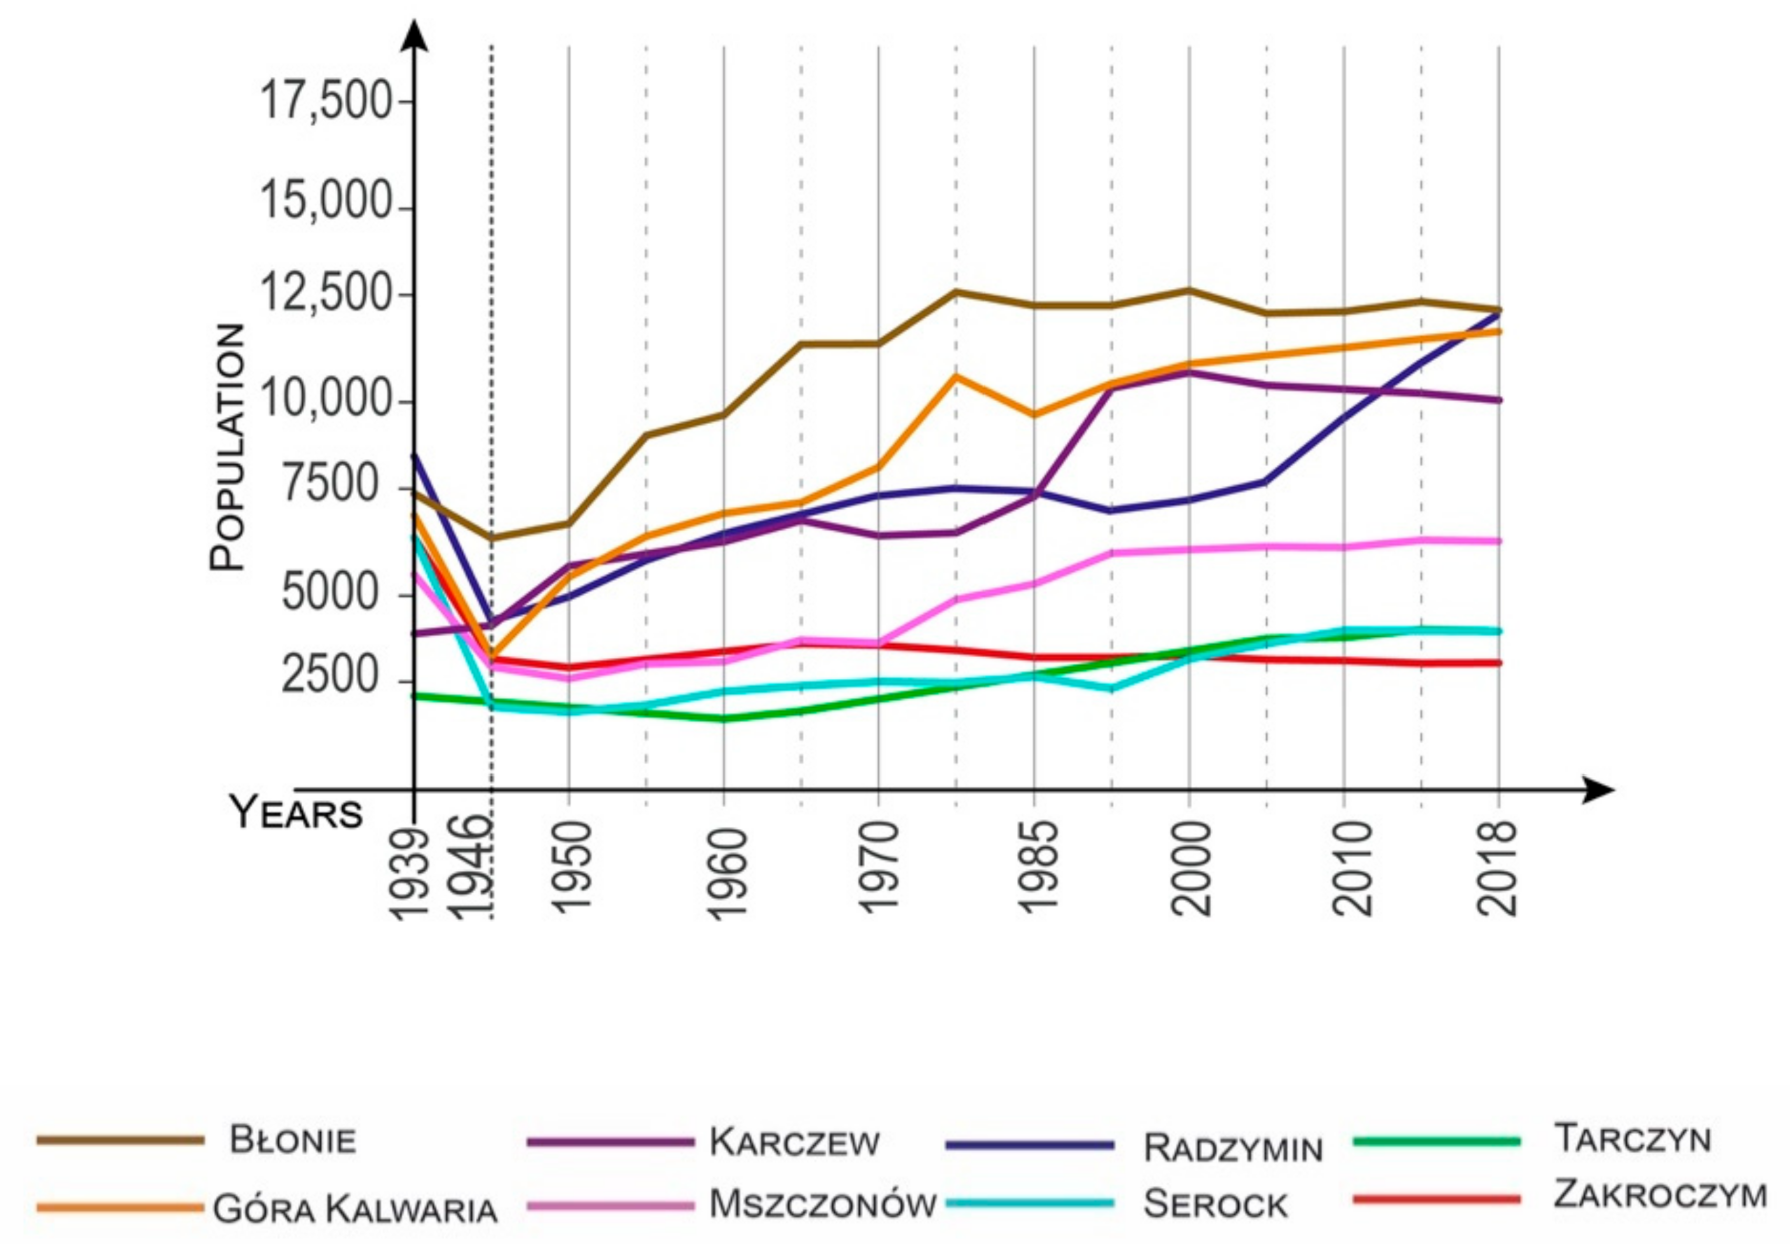
| Years/the Number of Residents | 1939 | 1946 | 1961 | 1978 | 1992 | 2018 |
|---|---|---|---|---|---|---|
| Błonie | 8800 | 6410 | 9674 | 12,850 | 12,500 | 12,392 |
| Góra Kalwaria | 7400 | 3687 | 7151 | 10,681 | 11,010 | 11,848 |
| Karczew | 3950 | 4158 | 6327 | 6560 | 10,300 | 9960 |
| Mszczonów | 5550 | 3161 | 3297 | 4891 | 6100 | 6433 |
| Radzymin | 8600 | 4360 | 6670 | 7770 | 7200 | 12,600 |
| Serock | 6500 | 2123 | 2527 | 2754 | 3362 | 4353 |
| Tarczyn | 2900 | 1640 | 1810 | - | 3904 | 4105 |
| Zakroczym | 6114 | 3358 | 3560 | 3588 | 3443 | 3211 |
| Studied Cities | * | Units | 1939–1946 | 1946–1960 | 1960–1985 | 1985–2000 | 2000–2018 |
|---|---|---|---|---|---|---|---|
| Błonie | A | Persons per ha | 142/104 | 87 | 71 | 65 | 38 |
| B | % | −27 | −39 | −18 | −9 | −42 | |
| C | % | −27 | −39 | −50 | −54 | −73 | |
| D | Persons per ha | 10/7 | 11 | 14 | 14 | 14 | |
| Góra Kalwaria | A | Persons per ha | 127/63 | 81 | 73 | 61 | 48 |
| B | % | −51 | +28 | −10.5 | −17 | −20 | |
| C | % | −51 | −36 | −43 | −53 | −62 | |
| D | Persons per ha | 5.4/2.7 | 5.2 | 7.8 | 8.1 | 8.7 | |
| Karczew | A | Persons per ha | 119/126 | 88 | 65 | 68 | 55 |
| B | % | +6 | −30 | −26 | +5 | +19 | |
| C | % | 1 | −26 | −45 | −43 | −54 | |
| D | Persons per ha | 1.4 | 2.2 | 2.3 | 3.8 | 3.5 | |
| Mszczonów | A | Persons per ha | 152/86 | 68 | 62 | 56 | 40 |
| B | % | −43 | −21 | −9 | −13 | −29 | |
| C | % | −66 | −84 | −90 | −96 | −112 | |
| D | Persons per ha | 6.5/3.7 | +3.9 | +5.7 | +7.2 | +7.5 | |
| Radzymin | A | Persons per ha | 118/60 | 52 | 38 | 24 | 31 |
| B | % | −51 | −56 | −27 | −37 | +4 | |
| C | % | −51 | −56 | −80 | −80 | −73 | |
| D | Persons per ha | 3.7/1.9 | 2.9 | 3.3 | 3.2 | 5.4 | |
| Serock | A | Persons per ha | 143/47 | 33 | 36 | 34 | 19 |
| B | % | −67 | −30 | +9 | −6 | −44 | |
| C | % | −67 | −77 | −75 | −76 | −87 | |
| D | Persons per ha | 4.8/1.6 | 2.2 | 2.1 | 2.5 | 3.2 | |
| Tarczyn | A | Persons per ha | 136/77 | 65.6 | - | 37 | 32 |
| B | % | −43.5 | −14.8 | - | −43 | −15 | |
| C | % | −43.5 | −51.8 | - | −73 | −77 | |
| D | Persons per ha | 5.6/3.1 | 3.5 | - | 7,5 | 7.9 | |
| Zakroczym | A | Persons per ha | 114/62 | 46 | 29 | 24 | 22 |
| B | % | −46 | −27 | −37 | −17 | −8 | |
| C | % | −46 | −60 | −75 | −79 | −81 | |
| D | Persons per ha | 3.1/1.7 | 1.8 | 1.8 | 1.7 | 1.6 |
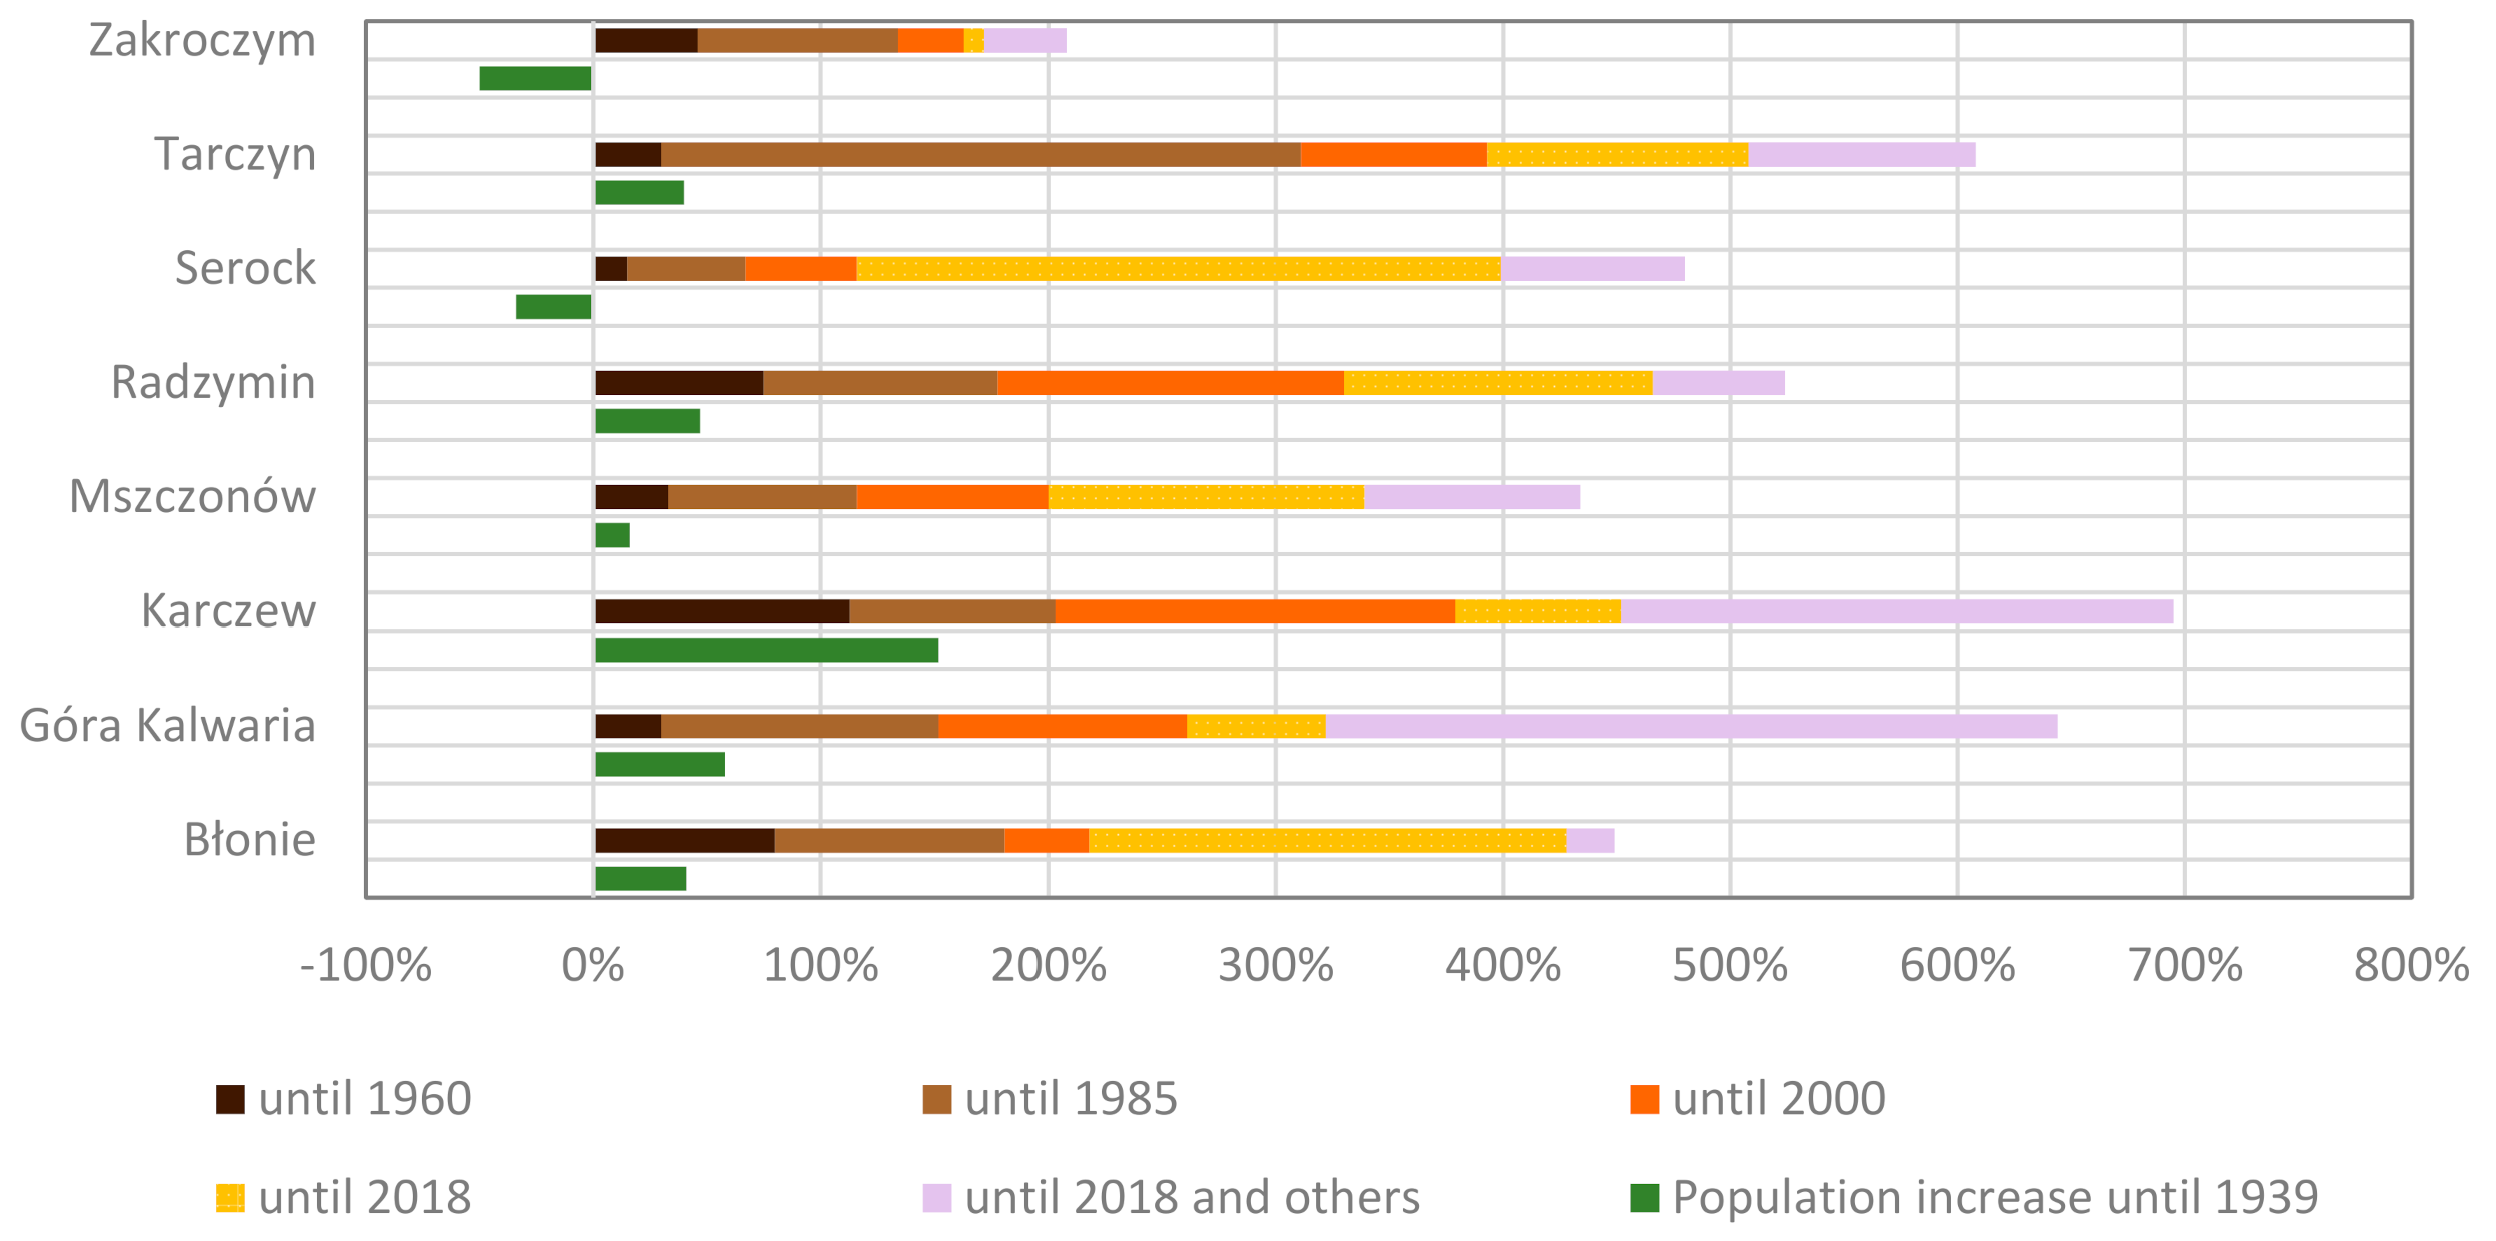
| Studied Cities | Urbanized Areas in ha | Population Growth/Decline Compared to 1939 | Increase in Urbanized Areas Compared to 1939 | Increase in Residential Areas Compared to 1939 | ||||
|---|---|---|---|---|---|---|---|---|
| 1939 | 2018 | Persons | % | ha | % | ha | % | |
| Błonie | 72 | 394 | +3592 | +41 | +322 | +450 | +266 | +430 |
| Góra Kalwaria | 68 | 358 | +838 | +58 | +291 | +429 | +187 | +322 |
| Karczew | 34 | 271 | +6010 | +152 | +237 | +696 | +150 | +452 |
| Mszczonów | 38 | 247 | +883 | +16 | +209 | +544 | +124 | +339 |
| Radzymin | 78 | 487 | +4050 | +47 | +409 | +524 | +340 | +466 |
| Serock | 46 | 264 | −2235 | −34 | +182 | +480 | +182 | +399 |
| Tarczyn | 22 | 159 | +1205 | +42 | +146 | +608 | +108 | +508 |
| Zakroczym | 59 | 182 | −2903 | −48 | +123 | +208 | +93 | +174 |
| 1939 Development of Historic City Center | Years 1960–1990 Multi-Family Housing Development | Years 1960–1990 Single-Family Housing Development | After 1990 Intensive Multi-Family and Single-Family Housing Development | After 1990 Single-Family Housing Development | |
|---|---|---|---|---|---|
| Błonie |  |  |  | None—multi-family buildings complement the urban tissue of the center. No new residential developments. |  |
| I = 1.02 | I = 1.27 | I = 0.37 | I = 0.21 | ||
| Góra Kalwaria |  |  |  |  |  |
| I = 0.75 | I = 1.07 | I = 0.25 | I = 1.15 | I = 0.14 | |
| Karczew |  |  |  |  | No dispersed development along historical strip-of-farmland-based divisions. |
| I = 0.10 | I = 1.34 | I = 0.31 | I = 0.35 | ||
| Mszczonów |  |  |  |  |  |
| I = 0.75 | I = 1.18 | I = 0.31 | I = 0.67 | I = 0.18 | |
| Radzymin |  |  |  |  |  |
| I = 1.03 | I = 1.04 | I = 0.37 | I = 0.55 | I = 0.13 | |
| Serock |  |  |  |  |  |
| I = 0.62 | I = 0.56 | I = 0.29 | I = 0.67 | I = 0.15 | |
| Tarczyn |  |  |  |  |  |
| I = 038 | I = 0.96 | I = 0.35 | I = 0.95 | I = 0.1 (0.3) | |
| Zakroczym |  |  |  | No new multi-family and terraced developments |  |
| I = 0.37 | I = 0.43 | I = 0.18 | I = 0.21 (0.36) |
| 1 | 2 | 3 | 4 | 5 | 6 | 7 | 8 | |
|---|---|---|---|---|---|---|---|---|
| Błonie | 912 | 392 | 126 | 786 | 394 | 31.5 | 24.8 | 98% |
| Góra Kalwaria | 1367 | 336 | 655 | 712 | 376 | 33.1 | 23.4 | 99% |
| Karczew | 2812 | 265 | 2041 | 771 | 506 | 36.9 | 28.5 | 186% |
| Mszczonów | 856 | 270 | 103 | 753 | 483 | 26.0 | 19.6 | 204% |
| Radzymin | 2349 | 601 | 1187 | 1162 | 561 | 26.0 | 30.2 | 140% |
| Serock | 1343 | 240 | 316 | 787 | 547 | 16.5 | 13.0 | 198% |
| Tarczyn | 523 | 154 | 20 | 503 | 349 | 25.8 | 13.0 | 216% |
| Zakroczym | 1997 | 184 | 829 | 1168 | 984 | 17.6 | 19.9 | 520% |
Publisher’s Note: MDPI stays neutral with regard to jurisdictional claims in published maps and institutional affiliations. |
© 2020 by the authors. Licensee MDPI, Basel, Switzerland. This article is an open access article distributed under the terms and conditions of the Creative Commons Attribution (CC BY) license (http://creativecommons.org/licenses/by/4.0/).
Share and Cite
Majewska, A.; Denis, M.; Krupowicz, W. Urbanization Chaos of Suburban Small Cities in Poland: ‘Tetris Development’. Land 2020, 9, 461. https://doi.org/10.3390/land9110461
Majewska A, Denis M, Krupowicz W. Urbanization Chaos of Suburban Small Cities in Poland: ‘Tetris Development’. Land. 2020; 9(11):461. https://doi.org/10.3390/land9110461
Chicago/Turabian StyleMajewska, Anna, Małgorzata Denis, and Wioleta Krupowicz. 2020. "Urbanization Chaos of Suburban Small Cities in Poland: ‘Tetris Development’" Land 9, no. 11: 461. https://doi.org/10.3390/land9110461
APA StyleMajewska, A., Denis, M., & Krupowicz, W. (2020). Urbanization Chaos of Suburban Small Cities in Poland: ‘Tetris Development’. Land, 9(11), 461. https://doi.org/10.3390/land9110461