Article

Evaluation of Cultivated Land Use Efficiency with Environmental Constraints in the Dongting Lake Eco-Economic Zone of Hunan Province, China

College of Public Administration, Huazhong University of Science and Technology, Wuhan 430074, China
*
Author to whom correspondence should be addressed.
Land 2020, 9(11), 440; https://doi.org/10.3390/land9110440
Submission received: 5 October 2020 / Revised: 6 November 2020 / Accepted: 6 November 2020 / Published: 10 November 2020
(This article belongs to the Section Land Socio-Economic and Political Issues)

Abstract

:
The rapid urban and industrial development in China has put pressure on the limited cultivated land resources. In ecologically fragile areas, such as the Dongting Lake Eco-economic Zone, land pollution and waste emissions from agricultural production cause irreversible damage to cultivated land. Thus, a method to assess the sustainability of cultivated land use efficiency (CLUE) is explored. Using the panel data of 25 districts in the province from 2007 to 2017, this study incorporates agricultural non-point source pollution and carbon emissions into undesirable outputs of cultivated land. The SBM(Slack-based Measure)-undesirable model was applied to measure the spatiotemporal characteristics of CLUE under environmental constraints. This study finds that CLUE with environmental constraints is significantly lower than CLUE without environmental constraints, and the degree of the impacts of the constraints differs among regions. Second, from 2007 to 2017, the average CLUE of the province showed a downward trend in each year; this is due to the side effects of redundant inputs and undesired outputs. Third, in 2017, the CLUE of the Dongting Lake Eco-economic Zone was high in the west and low in the east, and the redundant inputs of CLUE were livestock, fertilizer, and pesticide. The study concludes by recommending some policies.

1. Introduction

Cultivated land resources are the basis of human survival and development, and they guarantee global food and ecological security. Many countries have enacted laws and policies to ensure effective use and protection of cultivated land [1,2,3]. However, the rapid urbanization seriously threats cultivated land preservation in developing countries [4]. For instance, the amount of cultivated land per capita in the world has declined from 0.41 hectares in 1960 to 0.21 hectares in 2019 [5]. Meanwhile, urban expansion has brought ecological consequences such as landscape changes and environmental degradation, especially with respect to the pollution of soil resources [6]. Hawkesford (2014) indicated that the effect of urbanization on production factors in rural regions became increasingly evident, especially the input and output of cultivated land utilization caused by regional ecological environment deterioration [7]. Due to the locust invasion disaster and the COVID-19 pandemic in 2020, the global food crisis has become a critical issue. These issues put more pressure on the protection of natural resources and ecosystem globally and further deviate from sustainable development. One of the greatest challenges associated with these issues is the contradiction of land use in food production, socio-economic development, and ecological maintenance. Thus, using cultivated land resources efficiently and reasonably has become the focus of and a challenge to sustainable development worldwide [8,9].
China is the world’s largest developing country, and it only uses 7.5% of the world’s land area to feed 22% of the world’s population. The Chinese government has enacted several protection policies for the limited cultivated land resources [10], but the reduction in and pollution of cultivated land affect land use efficiency. According to the National Land Improvement Plan (2016–2020), due to ecological deforestation, restructuring, construction, and other reasons, the area of cultivated land is expected to decrease by more than 4666.7 km2 during the “13th Five-Year Plan (2016–2020)” period. In addition, cultivated land pollution due to excessive use of pesticides, chemical fertilizers, and other chemical products is common [11,12]. In 2014, China’s comprehensive national soil pollution survey showed that nearly one-fifth of China’s cultivated land has been polluted to varying degrees, and the highly polluted areas are mainly the agriculturally developed areas [
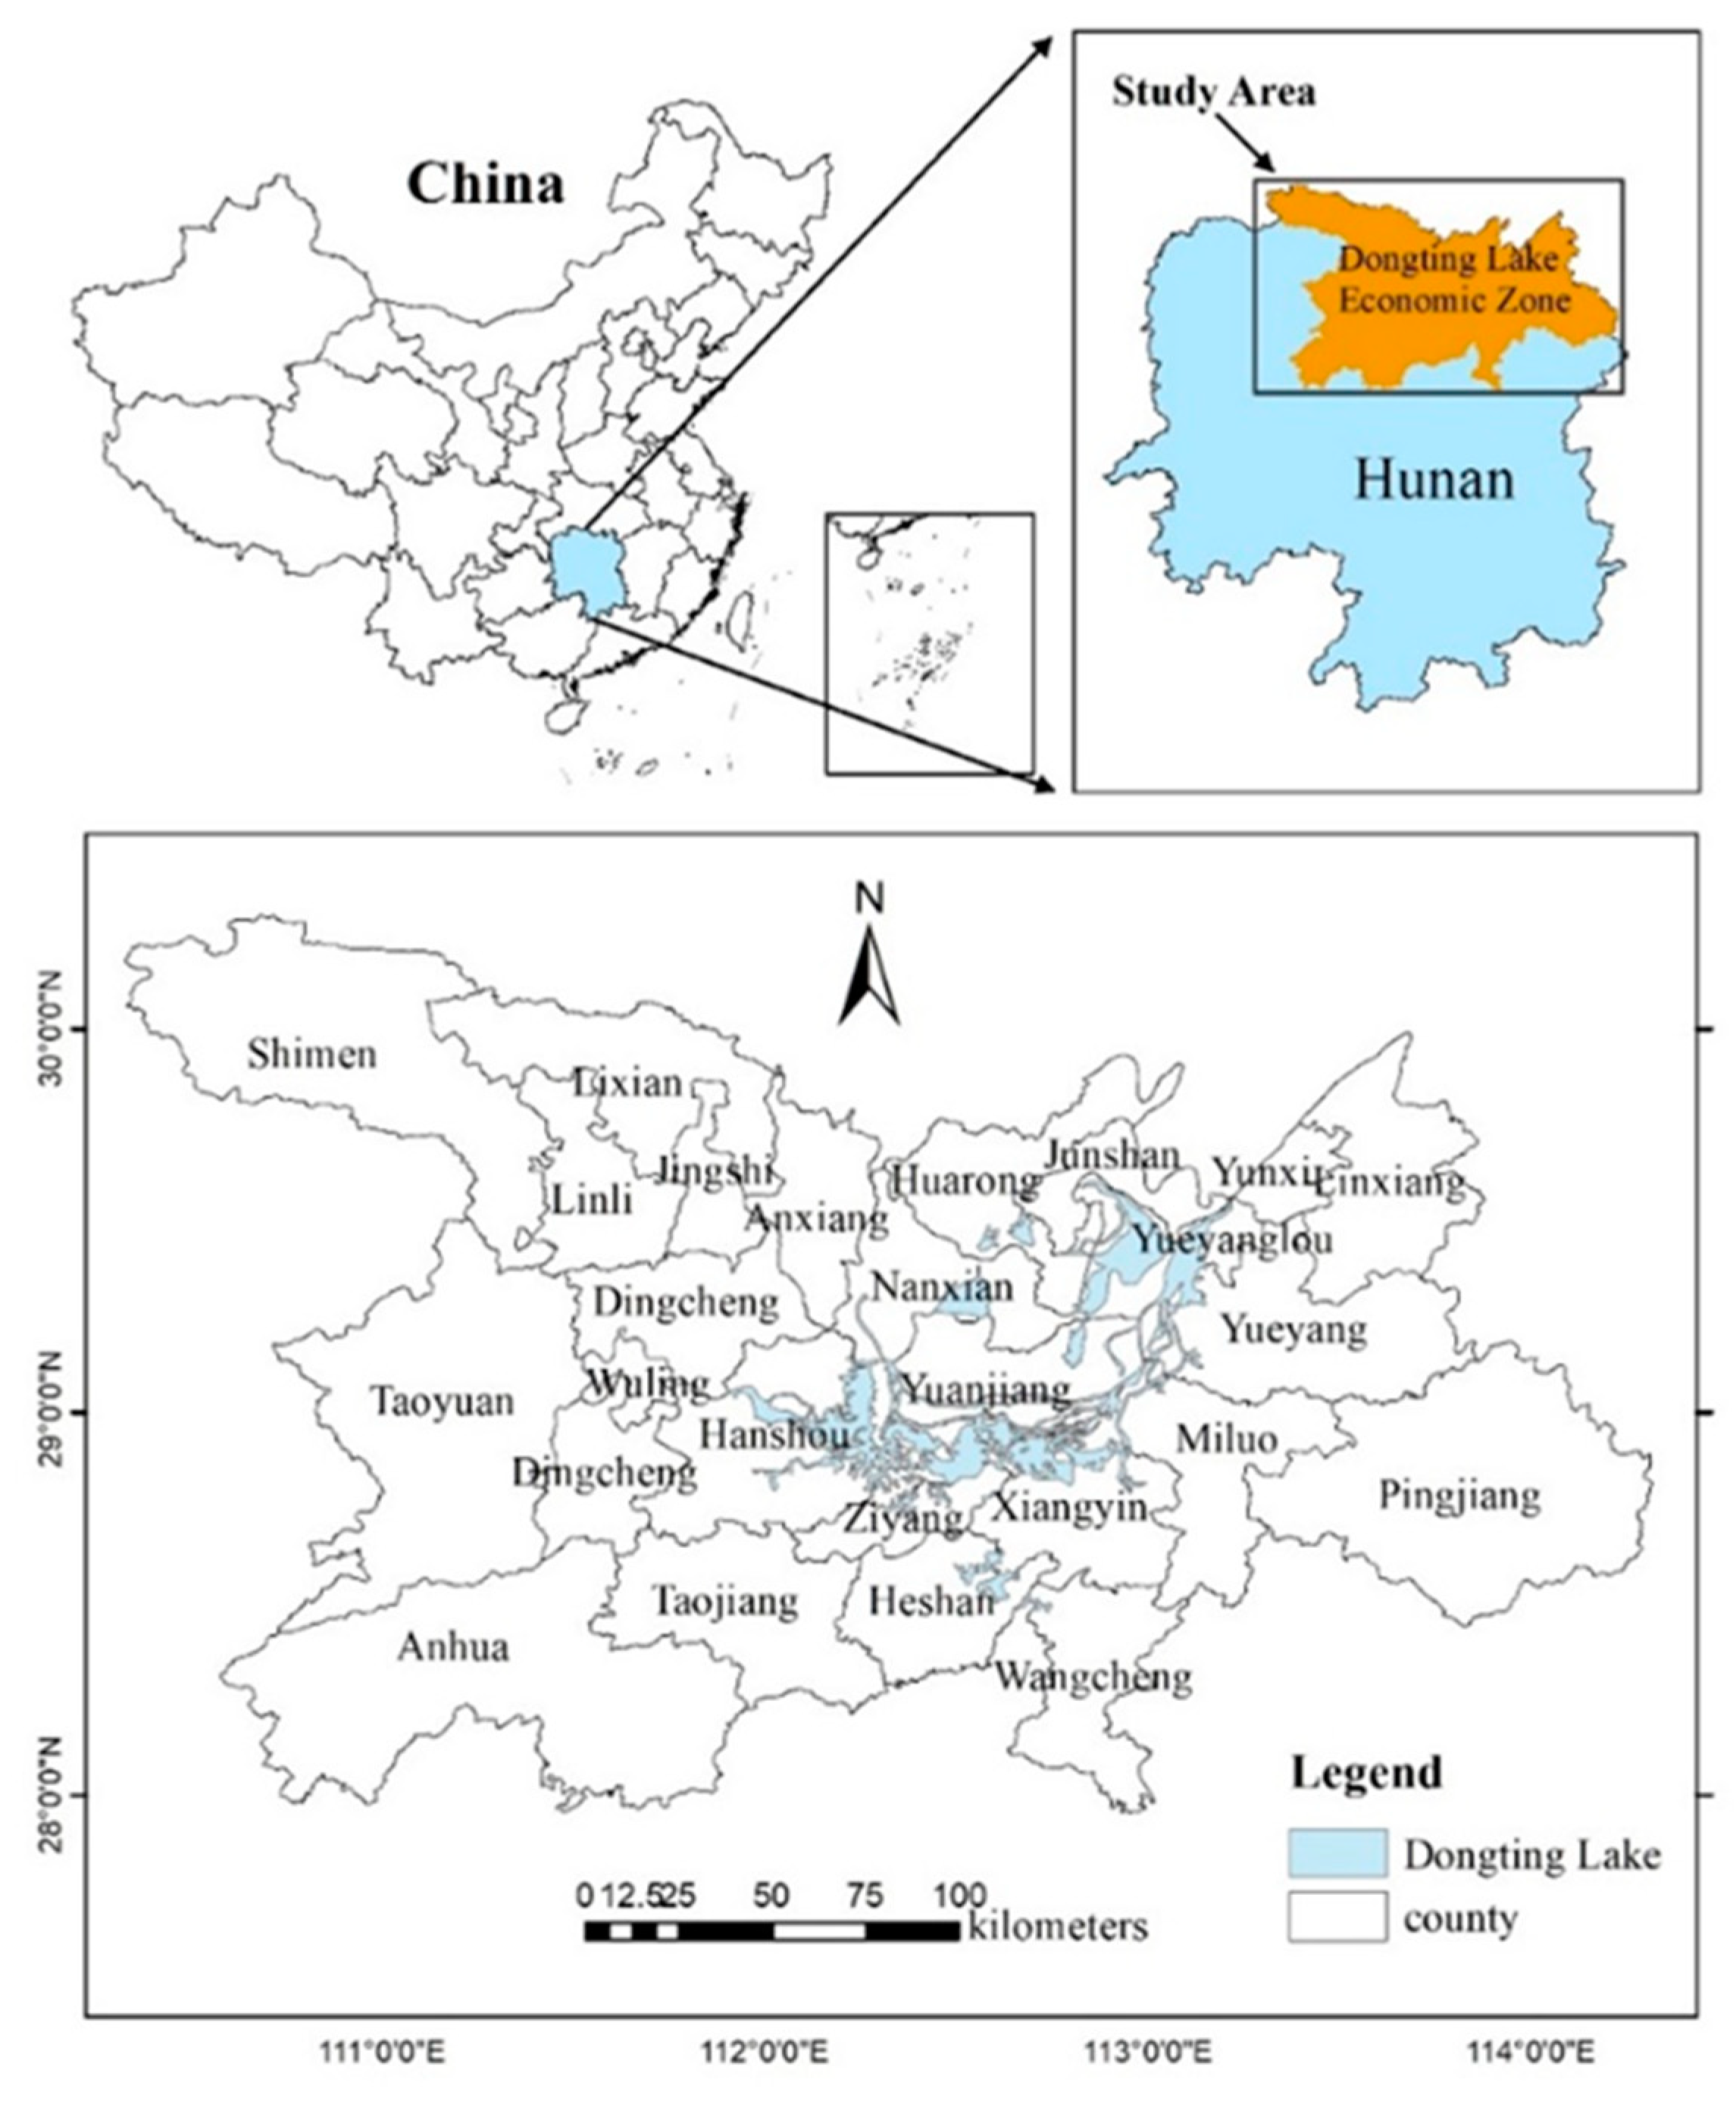
13]. The Dongting Lake Eco-economic Zone, located in the middle reaches of the Yangtze River, has been a significant production base for grain and agricultural products since ancient times. However, excessive chemical products have caused a series of ecological problems in the cultivated land areas, such as land quality degradation and a decline in soil fertility.
Land use efficiency (LUE) is a representative concept following the sustainable development paradigm [14]. Therefore, it is urgent to evaluate and improve cultivated land use efficiency (CLUE) and prevent land pollution [10]. Scholars have conducted many studies on evaluation index system and model of land use efficiency. Based on a literature review, the analysis regarding LUE was basically measured by a single indicator such as the per-capita built-up area [5,15] or land use ratio (specific output) [16,17,18,19]. With the advancement in research, people have realized that the composition of a land system is very complex, and it is essential to consider multiple inputs and outputs. Since the DEA (Data Envelopment Analysis) model can be used to process multiple inputs and outputs simultaneously and prevent model-setting errors, this method is widely used to evaluate land use efficiency [20,21]. For example, Chen et al. (2016) used the DEA model to analyze the changes in built-up land efficiency in 336 cities of China [22]. Moutinho et al. (2017) took the output–oriented DEA model to estimate the efficiency of 26 different European countries over 2001 and 2012 by comparing their performance [23]. Furthermore, the Malmquist productivity index proposed by Färe et al. (1994) has been widely used to describe the dynamic changes in land use efficiency [24]. Hong et al. (2017) used the Malmquist productivity index to investigate the dynamic evolution of land use efficiency in rural areas from a scale change perspective [25]. Xie et al. (2019) estimated the dynamic performance of the total-factor green use efficiency of industrial land, using a global non-radical distance function and the non-radical Malmquist performance [26].
The key objective of the aforementioned research was to increase output while reducing input by measuring LUE. However, it ignored the fact that several agricultural inputs are hazardous to the sustainable utilization of land resources during the production process. Researchers in the field of environmental science believe that the optimal strategy of effective land use is to optimize the distribution of resources while reducing the environmental impacts of harmful inputs [3,23,27]. They proposed a new framework in assessing the ecological efficiency, named green efficiency or environmental efficiency [28,29]. For instance, Korhonen et al. (2004) measured the efficiency of 24 power plants in a European country to demonstrate how DEA is applied to eco-efficiency evaluation [30]. Kuosmanen and Kortelainen (2005) integrated the environmental impact assessment in industrial ecology and the frontier approach into a unified framework [31].
Slack variables cannot be solved with the traditional DEA model, whereas the slack-based measure (SBM) model proposed by Tone (2001) can be used to solve this problem effectively [32]. SBM was extended to the SBM-undesirable model to assess efficiency under the premise of environmental pollution or other undesirable outputs, which is more suitable for input–output oriented measurements of CLUE [13,33]. However, it is barely used in the field of LUE assessment. Previous studies ignored environmental constraint impacts on CLUE, which might skew the results and lead to a vicious cycle of soil pollution. Besides, few studies compare the traditional DEA and SBM-undesirable model to verify the degree of hazardous impacts. Moreover, researchers have different opinions on constructing an index system, and only a few studies have examined environmental pollution or other undesirable outputs; this might affect the reliability and accuracy of the results. Additionally, industries were considered on a nationwide or provincial scale in the existing literature; studies that have examined specific ecological economic zones are rare. Research on the driving forces of CLUE is mainly conducted with efficiency decomposition or external factor regression, whereas a few studies focused on factor allocation, looking for internal reasons for efficiency redundancy or loss.
Therefore, this study analyzes the spatial–temporal change characteristics and reasons for CLUE in the Dongting Lake Eco-economic Zone from 2007 to 2017. First, we selected 25 districts of the Dongting Lake Eco-economic Zone and used the CCR (Charner, A.; Cooper, W.W.; Rhodes, E.) [20] and SBM-undesirable models to measure and compare CLUE to identify the effect of environmental constraints. Then, we analyzed the spatial–temporal change characteristics of CLUE with environmental constraints and reasons. Finally, the inefficient input–output redundancy was analyzed, and policies were suggested for sustainable agriculture development.

2. Data and Methodology

2.1. Study Area

The study area, the Dongting Lake Eco-economic Zone in Hunan Province, is approximately 4.6 × 10⁴ km2, which can be divided into four regions and 25 districts (Figure 1): Changsha region (one district), Yueyang region (nine districts), Changde region (nine districts), and Yiyang region (six districts). The population of the research area occupies about 1/3 of Hunan Province, and its economic income is approximately one-quarter of the provincial income. Regarding agricultural resources, cultivated land and agricultural produce in the Dongting Lake Eco-economic Zone are 20% and 35%, respectively, that of Hunan Province. However, due to climate change, human activities, and other factors, the problems of shrinking lakes and ecological degradation have become increasingly prominent. In the past decade, large amounts of pesticides and fertilizers were applied in the lake area, and chemical oxygen demand and ammonia nitrogen emissions from agricultural sources have increased. Therefore, it is urgent to coordinate economic development and environmental protection.

2.2. SBM-Undesirable Model

To examine the effects of non-point source pollution and carbon emissions on CLUE, we considered two scenarios, without and with environmental constraints. The traditional CLUE without environmental constraints was measured with the input-oriented CCR model under the traditional DEA method, whereas CLUE with environmental constraints was calculated with the SBM-undesirable model. The efficiency gap (the result of the SBM-undesirable model minus the result of the CCR model) of the two models reflects the degree to which the level of environmental pollution affects CLUE. Tone (2001) proposed the SBM model that considers slack variables and the SBM-undesirable model that considers undesired outputs [32]. The basic principle is to treat each district as a decision-making unit (DMU), assuming that n DMUs contain the input vectors and two output vectors representing the expected output and undesired output. It is expressed as x R m , y e R a , y n R b , where m, a, and b represent the input element of the DMU, desirable output and undesirable output, respectively. The matrices X , Y e and Y n are defined as x = [ x 1 , x 2 , , x n ] R m × n , y e = [ y 1 e , y 2 e , , y n e ] R a × n , y n = [ y 1 n , y 2 n , , y n n ] R b × n , assuming X , Y e , Y n are greater than zero. The production possibility set is defined based on the input angle and the constant return of scale (CRS): p = { ( x , y e , y n | x X λ , y e Y e λ , y n Y n λ , λ 0 ) } . The model is as shown in Equation (1):
ρ = min 1 1 m i = 1 m D i x i 0 1 + 1 a + b ( r = 1 a D r e y r 0 e + h = 1 b D h n y h 0 n ) s . t .   x 0 = X λ + D , y 0 e = Y e λ D e , y 0 n = Y n λ D n D 0 , D e 0 , D n 0 , λ 0
where D , D e , and D n are the slack variables, representing excessive input, insufficient desirable output, and excessive undesirable output, respectively; ρ* is the CLUE of the DMU, and the range of the value is 0~1. When ρ * = 1 , D , D e , and D n are all zero, which indicates that the evaluation unit is completely valid (efficient DMU); otherwise, it indicates a loss of efficiency.

2.3. Indicator Selection and Data Source

When selecting the indicators, the input generally has three elements, which are land, capital, and labor, whereas the output is expressed in terms of economic value or grain production. However, the existing studies focused only on the expected output and ignored the hazardous output, such as carbon emissions and agricultural pollution [34,35,36]. To address this issue, Cecchini et al. (2018) discussed carbon mitigation by providing efficiency performance measures in the presence of the joint production of milk and GHC (greenhouse gas) emissions [37]. The SBM model proposed by Tone (2001) can be used to solve the bias or inaccuracy of the traditional DEA model effectively [32], and after he extended the model to include undesirable outputs (SBM-undesirable model), it has often been used in studies to measure environmental efficiency or eco-efficiency [37,38,39]. Based on Lu’s (2018) research, the total volume of household waste water discharged, industrial waste gas emissions, and industrial solid wastes generated are treated as indicators of undesirable output, and the regional differences in the CLUE of the 31 provinces in China were estimated with SBM-undesirable and Gini coefficient decomposition models [40]. Under the goal of promoting the sustainable development of agriculture, considering only the favorable output is not conducive to accurately evaluate CLUE. Incorporating negative output into the efficiency assessment framework will enable a comprehensive assessment of the capacity of land use [41].
The existing research results of CLUE show that the inputs and outputs are generally considered comprehensively [13]; the indicator system is shown in Table 1.
The input mainly includes three elements, which are land, capital, and labor. Land input: some scholars use the area of the agricultural land to represent land input, but the regional differences do not reflect the actual cultivated land input, so in this study, the total sown area of the crops is used to represent land input. Labor input: due to the lack of data on crop farming practitioners in the “Hunan Rural Statistical Yearbook”(2008–2018), the value of this variable is separated from that of generalized agricultural (comprising agricultural, forestry, animal husbandry, and fishery) practitioners, using the ratio of the output of crop farming to the output of generalized agricultural. Capital input: this covers a wide range of production materials, including chemical fertilizer, pesticide, agricultural film, mechanical power, draught animals, as well as water resources, and they are represented by the application of (purified) chemical fertilizer, application of pesticide, application of agricultural plastic film, total machinery power applied in crop farming, amount of large livestock, and effective irrigation area, respectively. The total crop-farming machinery power is separated from the total agricultural machinery power, and the method of calculation is the same as that of the crop farming practitioners. The outputs include both desirable and undesirable outputs. Economic production is mainly used to represent the desirable output. It is described as the total production value of crop farming to maintain a unified statistical caliber. All prices were converted using 2007 as the base year to eliminate the impact of changes in price. The undesirable output includes total carbon emissions and total non-point source pollution. The accounting method is as follows. The main sources of carbon emissions are agricultural tillage, agricultural machinery usage, and direct or indirect application of irrigation, fertilizers, pesticides, and agricultural film. The total amount of carbon emissions is calculated as follows:
E =   E i =   T i δ i
where T i   and δ i   represent the value for each source of carbon emission and the coefficient of carbon emission, respectively. The emission coefficients of each source of carbon emission are presented in Table 2. Agricultural non-point source pollution is mainly caused by excessive use of chemical fertilizers, pesticides, and agricultural film. In this study, the total amount of agricultural non-point source pollution comprises the amount of loss of nitrogen and phosphorus in chemical fertilizers, the amount of the ineffective use of pesticides, and the residual amount of agricultural film. The calculation of the correlation coefficient is based on the literature and the “First National Pollution Survey: Fertilizer Loss, Pesticide Loss, and Film Residue Coefficient Manual” while considering the regional difference (Table 3). The basic data used in this study are from the “Hunan Statistical Yearbook” (2008–2018) and “Hunan Rural Statistical Yearbook” (2008–2018).

3. Results and Analysis

3.1. Environmental Restrictions on CLUE

We relied on the DEA-SOLVER PRO5.0 platform to calculate the CLUE of the 25 districts in the Dongting Lake Eco-economic Zone from 2007 to 2017. The results are shown in Table 4 (due to limited space, only the results of CLUE for four years are listed). Due to environmental constraints, the average CLUE in the Dongting Lake Eco-economic Zone from 2007 to 2017 was 0.662, which means that the current actual output level is 66.2% of the ideal output level. If the potential of existing production factors is fully realized, the output level can be increased by approximately 33.8%. The results of the SBM-undesirable model in all districts are less than or equal to the results of the CCR model. The average CLUE with undesired outputs in 2007, 2011, 2014, and 2017 is 0.753, 0.716, 0.628, and 0.595, respectively, The average CLUE without the undesired output in 2007, 2011, 2014, and 2017 is 0.949, 0.896, 0.848 and 0.827, respectively. Adding undesirable output indicators, such as non-point source pollution and carbon emissions, reduces CLUE significantly. Thus, evaluating the traditional CLUE without environmental constraints distorts the results.
To analyze the impact of environmental restraints, we have presented the efficiency score calculated with the CCR and SBM-undesirable models, the average efficiency gap of CLUE from 2007 to 2017, in descending order as follows: Yueyang (0.299) > Yiyang (0.294) > Changde (0.097). At the district level, except for Junshan, the efficiency gap of other districts in the Yueyang Region exceeds 0.3, among which Yunxi (0.444) and Miluo (0.417) have the largest efficiency gap. Moreover, the efficiency gap of 87.5% of Yueyang and 50% of Yiyang districts is greater than 0.3, whereas the reduction rate of the undesired output is higher than the growth rate of the desired output. Regarding undesirable agricultural pollution output, Wangcheng, Linli, Taoyuan, and Jinshi can achieve the optimal allocation of resources, both inputs and outputs.

3.2. Temporal Characteristics of CLUE with Environmental Constraints

From 2007 to 2017, the average CLUE with environmental constraints of the Dongting Lake Eco-economic Zone ranged from 0.753 to 0.595. From 2007 to 2011, the CLUE in Changde and Yueyang fluctuated, and after reaching its peak in 2011, the efficiency value declined gradually. Yiyang’s efficiency peaked in 2013 and then declined gradually. The annual average CLUE in each region during the study period is ranked in descending order as follows: Changde (0.862) > Yueyang (0.568) > Yiyang (0.448). Wangcheng, Yueyanglou, Lintong, Taoyuan, and Jinshi were efficient frontiers (efficiency score=1) of all DMUs during the 10 years. Except for Hanshou and Shimen, the efficiency scores of all districts increased slightly, but those of other districts decreased to different degrees.

3.3. Spatial Differentiation of CLUE with Environmental Constraints

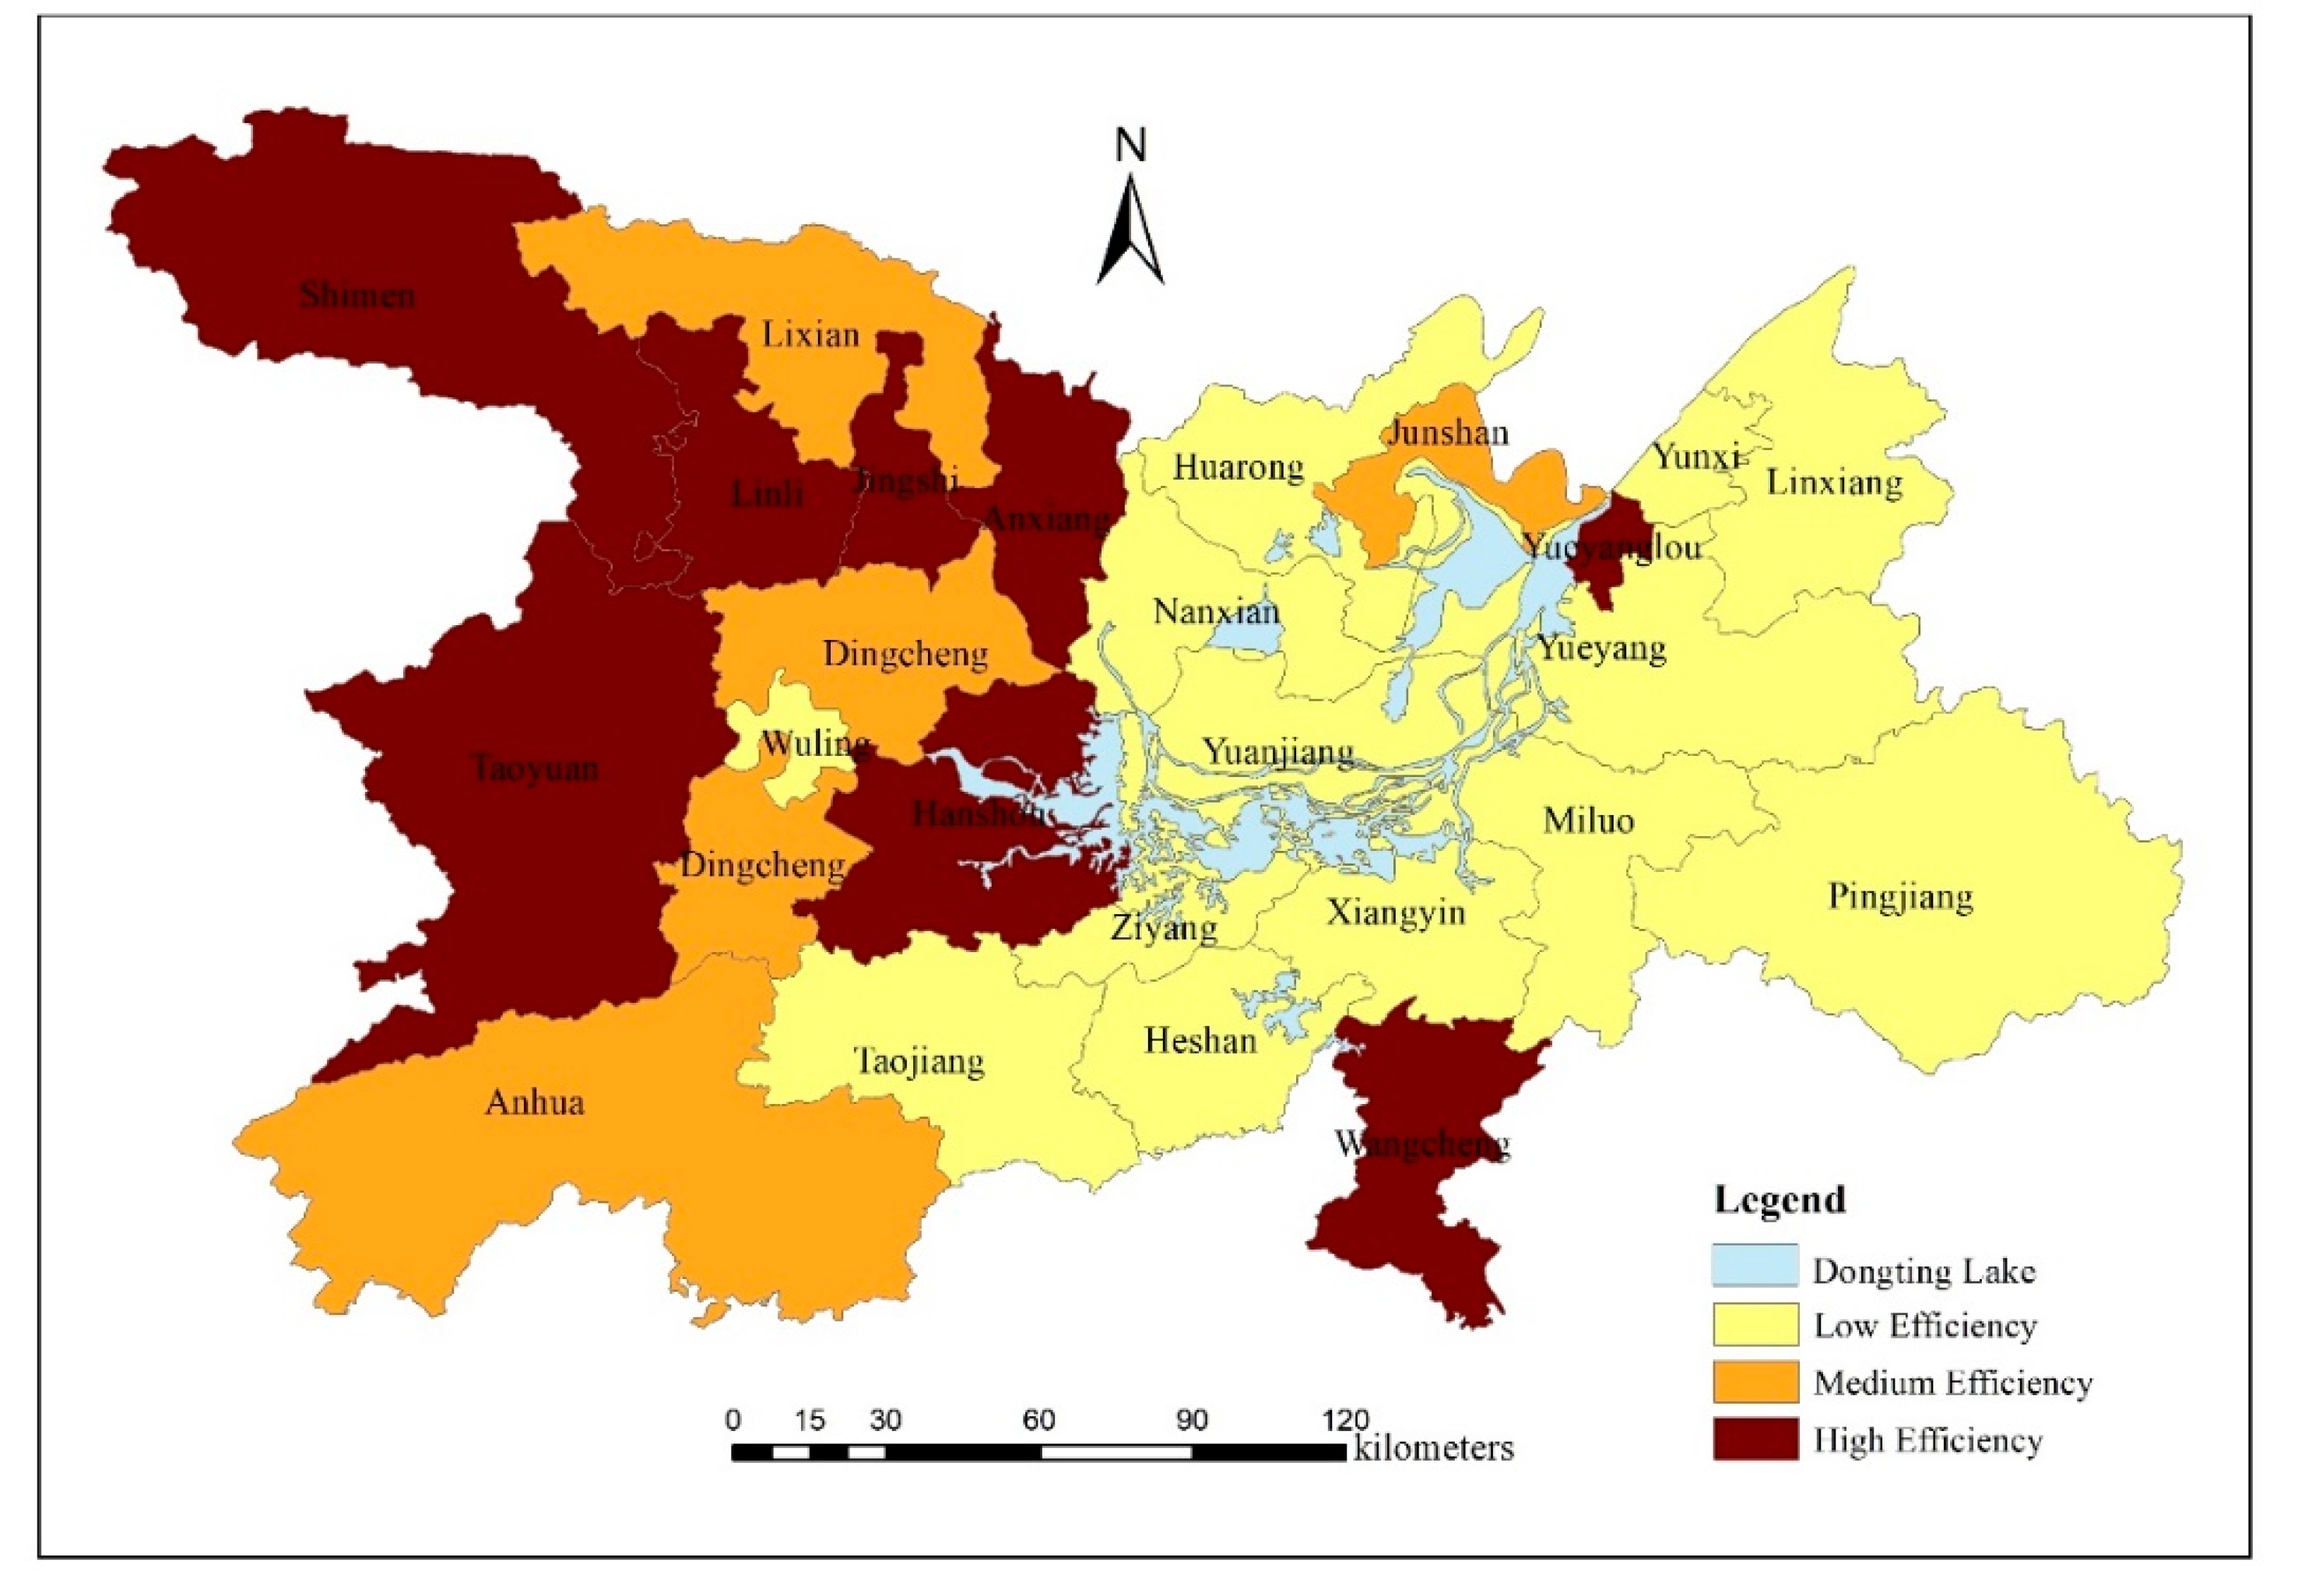
Based on relevant literature, each district’s CLUE was divided into three levels: high-efficiency (0.7–1.0), medium-efficiency (0.5–0.7), and low-efficiency (0–0.5). The spatial distribution of CLUE with environmental constraints in 2017 was plotted with ARCGIS 10.2 visualization (Figure 2). The figure shows that the CLUE of the Dongting Lake Eco-economic Zone is depicted as high in the west and low in the east. There are eight main highly efficient DMUs that are mainly concentrated in Changde, and the rest are scattered in Wangcheng and Yueyanglou, whereas four DMUs with medium efficiency are located in Lixian, Dingcheng, Junshan, and Anhua. There are 12 low-efficiency DMUs, accounting for approximately half of the total research area.
Changde region has the highest CLUE. There are six highly efficient districts where their efficiency reached the optimal level (with an efficiency score of 1). That means the agricultural resources are saved as much as possible, with the lowest agricultural pollution. The efficiency scores of districts in the Yueyang and Yiyang regions vary from each other, and most of them are low-efficiency DMUs. This indicates that improvement should be made to coordinate development by adjusting the agricultural input level or by reducing undesirable agricultural pollution emissions to achieve optimal efficiency.

3.4. Reasons Analysis

According to the SBM-undesirable model, when the CLUE does not reach a relatively effective state (efficiency value <1), it may be due to excessive input, insufficient desirable output, or excessive undesirable output. The corresponding redundancy ratio can be obtained by dividing each redundancy amount, D , D e , and D n , by its corresponding input indicators, desirable output indicators, and undesirable output indicators, respectively. Based on that, the redundancy of input and undesirable output is calculated while keeping the desirable output unchanged ( D e =0), and then the reasons for the reduction of CLUE with environmental constraints can be identified, leading to each improvement direction.
From 2007 to 2017, the CLUE of Dongting Lake Eco-economic Zone decreased; this can be observed from the indicators of the redundancy rate presented in Table 5. First, the side effects of input redundancy on CLUE increased every year, and the inefficiencies due to the redundancy of livestock, fertilizer, and machinery inputs became more and more obvious, which increased by 32.62%, 18.28%, and 16.11%, respectively from 2007 to 2017. In general, the most obvious redundant inputs affecting the CLUE were livestock, fertilizers, and pesticides, and their average redundancy rates were 43.90%, 33.19%, and 31.90%, respectively, from 2007 to 2017, which indicates excessive investments in the overall agricultural production process and a low conversion rate of chemical fertilizers and pesticides in the Dongting Lake Eco-economic Zone. Second, the side effects of cultivated land use due to undesirable output redundancy increased every year. The increase in the output redundancy rate of carbon emissions and non-point source pollution reached 14.52% and 12.95%, respectively, and the average redundancy was 23.26% and 32.48%, respectively. Excessive non-point source pollution was the most important factor affecting the improvement of CLUE, and the impact of carbon emissions on CLUE became more obvious.

3.5. Redundancy of Input and Undesirable Output

The results for 2017 can be used to analyze the redundancy from two aspects of input and undesirable output to improve the efficiencies of DMUs with environmental constraints (Table 6 and Table 7).
(1) From the Perspective of Input Indicators
Redundancy in livestock, fertilizer, and pesticide inputs commonly affects CLUE. The livestock input is the most redundant of all the indicators, with an average of 54.56%. Chemical fertilizer is the second most redundant input, with an average redundancy of 39.34%. Residual fertilizer products flow into fields and penetrate into the groundwater, which not only causes a decline in the quality of cultivated land and affects agricultural outputs but also seriously endangers drinking water for humans and animals. Pesticides are the third most influential factor, with an average redundancy of 36.81%. Pesticides and chemical fertilizers are major components of undesirable outputs of agricultural production; pesticide ingredients are harmful and difficult to degrade in the soil.
There are regional differences in the effects of irrigation, labor, agricultural film, and land and machinery inputs on CLUE. Regarding irrigation, in some districts, such as Linxiang and Taojiang, the redundancy of the effective irrigation area is higher than 60%, whereas the redundancy in Wuling is only 12.73%; however, in most districts, it is about 50%, which is due to the abundant water resources and the lack of attention to the development of water-saving agriculture in studies. Regarding redundancy in labor input, it varies significantly among the regions, with a redundancy rate of 73.23% in Anhua, followed by 72.28% in Pingjiang. Both regions are poor districts in Hunan Province, which shows that the region’s economic level is closely related to local labor employment. The flat terrain around the Dongting Lake Eco-economic Zone and its climate condition are suitable for agricultural production. Its cultivation and reclamation potential are small, and the multiple crop index is high. However, the land input redundancy in Taojiang and Linxiang is higher than 50%, indicating that its land use potential has not been fully utilized, resulting in extensive use of cultivated land. The redundant land input in other districts is mostly 30–40%. Regarding, agricultural film input, the redundancy in Xiangyin is the lowest, only 4.49%. Pingjiang (89.95%), Huarong (85.90%), and Yunxi (85.48%) have higher redundancy. The redundancy of planting machinery investment is relatively minimal, with an average of 24.23%, but the regional differences are high, for example, the redundancy in Yiyang (except for Nanxian) exceeds 44%, whereas that in Ziyang is 70.13%. In general, the Dongting Lake Eco-economic Zone relied on agricultural machinery cooperatives to realize comprehensive agricultural mechanization in the early years. Moreover, the subsidy policy of agricultural machinery led to an enthusiasm for agricultural machinery production.
(2) From the Perspective of the Undesirable Output
Most of the low-efficiency DMUs in 2017 (efficiency value <0.5) have a high amount of non-point source pollution, which means that there is extensive use of pesticides, fertilizers, and agricultural films in the production process, and undesirable output increases, causing second-hand farmland pollution and resulting in inefficient use of cultivated land. The agricultural carbon emission redundancy of the Dongting Lake Eco-economic Zone is as high as 28.30%; the carbon emission redundancy of Yiyang is significantly higher than that of the other regions, and it is as high as 53.2% and 53.2% in Ziyang and Taojiang, respectively.

4. Discussion

Due to the complex relationship between inputs and outputs in the cultivated land utilization process, the limited availability of data, and the quantification of indicators, the existing research does not have absolute standards and a unified measurement framework. Moreover, due to the defects of the DEA model, the efficiency value cannot be used for a time series comparison, and it is only significant when ranking is performed in the same period. Due to the differences in the conditions of natural and socio-economic resources between regions, CLUE is affected by both internal productive factor allocation and other external factors. This study analyzes only the cause of land use efficiency loss from the perspective of productive factor allocation. In addition, due to the limited sample size, this study does not examine the spatial correlation.
Results show that most districts indicate modest levels of CLUE and the scores decline, consistent with other studies [27,42], e.g., Bonfiglio et al. (2017) assessed the radial eco-efficiency of arable farm in the Le Marche region (Italy) in the period of 2011–2014, it is confirmed that most arable farms exhibit a modest level of eco-efficiency and are characterized by specific eco-inefficiency in relation to the use of fertilizers and pesticides [27]. Moutinho et al. (2017) estimated the economic and environmental efficiency in 26 different European countries from 2001 to 2012 using DEA. Their results show the eco-efficiency scores decreased when comparing 2009–2012 with those of the previous 2005–2008 period. This decrease resulted from lower domestic material consumption and an increase in resource productivity [23]. Besides, CLUE with environmental constraints is generally lower than the traditional value of CLUE [37,43] which indicates that CLUE could be increased by reducing the use of harmful components contained in fertilizers (nitrogen and phosphorus) and other toxicity associated with the pesticides. However, farmers may only value more economic benefits; it is difficult for them to understand the urgent need for organic farming. The research process of this study and its main policy implications for managing the situation are as follows.
First, although the CLUE is significantly reduced when there are environmental constraints in several DMUs, it is possible to achieve an optimal input–output arrangement. The DMUs with higher CLUE should focus on coordinating agricultural production and the ecological environment. Ecological agriculture is based on traditional agriculture; DMUs with lower CLUE should change their extensive agricultural management models, reduce pollution emissions, and develop ecological agriculture. Measures, such as promoting the application of biological pesticides and organic fertilizers, formulating fertilizers based on regular soil tests, and advocating the use of environmentally friendly chemical supplies to minimize the hazardous impacts on the ecological environment, should be taken to control carbon emissions and the generation of agricultural pollution. The government should construct a comprehensive monitoring system, design a feasible ecological compensation mechanism, and call for the full participation of local residents, for example, the residents should be required to report illegal sewage discharge or other behaviors that are harmful to the ecological balance.
Second, the overall level of CLUE in the Dongting Lake Eco-economic Zone shows that Changde is high and relatively balanced, whereas the efficiency gap between districts in Yueyang and Yiyang is high. To address the uneven distribution of CLUE in the Dongting Lake Eco-economic Zone, the government should integrate various resources among regions and exert the effect of coordinated governance. The government should break the barriers of regional governance by setting cross-regional or cross-sectoral governance and supervision authority, which will help to reduce the agricultural efficiency gap in adjacent areas. The government should also set realistic agricultural development goals and evaluation mechanisms, such as quantitatively assessing the performance of cross-regional governance and building carbon or other emission trading platforms.
Finally, regarding the input–output redundancy, it is necessary to accelerate agricultural industrialization, establish new types of agricultural management entities, and accelerate rural land transfer based on local conditions. A similar policy has been shown by the Kazakhstan government to show a positive effect [44]. Additionally, vigorously supporting the upgrading and transformation of leading eco-agricultural enterprises in the lake area will establish a mechanism for farmers to connect and continuously improve tourism, for example, to make full use of the ecological resources in the Dongting Lake Eco-economic Zone to create a unique industry that integrates tourism, leisure, and ecological agriculture in the area, thus increasing local agricultural production and income.

5. Conclusions

Under the premise of the environmental constraints of carbon emissions and non-point source pollution, this study uses the SBM-undesirable model and considers undesired outputs to evaluate the CLUE of 25 districts in the Dongting Lake Eco-economic Zone from 2007 to 2017. The results show that the CLUE with environmental constraints is significantly lower than the CLUE without environmental constraints, indicating that it has high sustainable land use potential to be improved. Moreover, the CLUE with environmental constraints shows an overall gradual decline, and its spatial pattern varies greatly among research areas. Based on the comparative analysis of the CLUE with undesirable outputs, this study suggests that land use management needs to formulate rational policy strategies that serve to (1) coordinate the balance of agricultural production and pollution emissions, (2) break through the barriers of regional governance, and (3) upgrade resource allocation and avoid input–output redundancy.
Although the research has only focused on the Dongting Lake Eco-Economic Zone in China, the cultivated land use efficiency and farmland pollution and waste emission problems show that similar results can arise in many other regions around the world, particularly in developing countries. Assessing CLUE containing undesirable outputs will contribute to the identification of redundancy of ineffective DMUs and the development of more efficient management solutions by understanding the connotation of CLUE, developing an evaluation index system, and evaluating the CLUE based on productivity factor inputs, desirable outputs, and undesirable outputs. Given the findings from this research, the government should focus on coordinating agricultural production and the ecological environment. Besides, the research idea and method can be used for reference in other fields, such as manufacturing and construction, and it is also feasible for management departments or governors to assess project performance.

Author Contributions

Y.C. and S.L. conceived and designed this research; S.L. collected and analyzed the data, Y.C., S.L. and L.C. drafted the manuscript. All authors have read and agreed to the published version of the manuscript.

Funding

This research was funded by the National Natural Science Foundation of China (Grant No. 71603089), The Ministry of Education of Humanities and Social Science project (Grant No. 16YJA790009), Fundamental Research Funds for the Central Universities (Grant Nos. 2019WKYXQN033 and 2019kfyXJJS025), and Peking University-Lincoln Institute Centre for Urban Development and Land Policy Research Fellowship for 2020-2021 (FS01-20201101-CL).

Acknowledgments

The authors would like to thank the editor and anonymous reviewers for their time and effort to review and improve this work.

Conflicts of Interest

The authors declare no conflict of interest.

References

  1. Lambin, E.F.; Gibbs, H.K.; Ferreira, L.; Grau, R.; Mayaux, P.; Meyfroidt, P.; Morton, D.C.; Rudel, T.K.; Gasparri, I.; Munger, J. Estimating the world’s potentially available cropland using a bottom-up approach. Global Environmental Change. Glob. Environ. Change 2013, 23, 892–901. [Google Scholar] [CrossRef]
  2. Su, M.; Guo, R.; Hong, W. Institutional transition and implementation path for cultivated land protection in highly urbanized regions: A case study of Shenzhen, China. Land Use Policy 2019, 81, 493–501. [Google Scholar] [CrossRef]
  3. Lichtenberg, E.; Ding, C. Assessing farmland protection policy in China. Land Use Policy 2008, 25, 59–68. [Google Scholar] [CrossRef]
  4. Linnér, H.; Messing, I. Agricultural land needs protection. Acta Agric. Scand. Sect. B-Plant Soil Sci. 2012, 62, 706–710. [Google Scholar] [CrossRef]
  5. Masini, E.; Tomao, A.; Barbati, A.; Corona, P.; Serra, P.; Salvati, L. Urban Growth, Land-use Efficiency and Local Socioeconomic Context: A Comparative Analysis of 417 Metropolitan Regions in Europe. Environ. Manag. 2018, 63, 322–337. [Google Scholar] [CrossRef] [PubMed]
  6. Salvati, L. Monitoring high-quality soil consumption driven by urban pressure in a growing city (Rome, Italy). Cities 2013, 31, 349–356. [Google Scholar] [CrossRef]
  7. Hawkesford, M.J. Reducing the reliance on nitrogen fertilizer for wheat production. J. Cereal Sci. 2014, 59, 276–283. [Google Scholar] [CrossRef] [Green Version]
  8. Liu, Y.; Wang, J.; Long, H. Analysis of arable land loss and its impact on rural sustainability in Southern Jiangsu Province of China. J. Environ. Manag. 2010, 91, 646–653. [Google Scholar] [CrossRef] [PubMed]
  9. Van Vliet, J.; De Groot, H.L.; Rietveld, P.; Verburg, P.H. Manifestations and underlying drivers of agricultural land use change in Europe. Landsc. Urban Plan. 2015, 133, 24–36. [Google Scholar] [CrossRef] [Green Version]
  10. Kuang, B.; Lu, X.; Zhou, M.; Chen, D. Provincial cultivated land use efficiency in China: Empirical analysis based on the SBM-DEA model with carbon emissions considered. Technol. Forecast. Soc. Chang. 2020, 151, 119874. [Google Scholar] [CrossRef]
  11. Huang, J.; Xia, J.; Yu, Y.; Zhang, N. Composite eco-efficiency indicators for China based on data envelopment analysis. Ecol. Indic. 2018, 85, 674–697. [Google Scholar] [CrossRef]
  12. Song, M.; Wang, S.; Liu, Q. Environmental efficiency evaluation considering the maximization of desirable outputs and its application. Math. Comput. Model. 2013, 58, 1110–1116. [Google Scholar] [CrossRef]
  13. Xie, H.; Zhang, Y.; Choi, Y. Measuring the Cultivated Land Use Efficiency of the Main Grain-Producing Areas in China under the Constraints of Carbon Emissions and Agricultural Nonpoint Source Pollution. Sustainability 2018, 10, 1932. [Google Scholar] [CrossRef] [Green Version]
  14. Liu, J.; Jin, X.; Xu, W.; Gu, Z.; Yang, X.; Ren, J.; Fan, Y.; Zhou, Y. A new framework of land use efficiency for the coordination among food, economy and ecology in regional development. Sci. Total. Environ. 2020, 710, 135670. [Google Scholar] [CrossRef]
  15. Barbosa, J.A.S.D.; Bragança, L.; Mateus, R. Assessment of Land Use Efficiency Using BSA Tools: Development of a New Index. J. Urban Plan. Dev. 2015, 141, 04014020. [Google Scholar] [CrossRef]
  16. Wang, Y.J.; Ou, X.; Deng, C.; Li, Y.-S. Temporal-Spatial Variations and Regional Disparities in Land-Use Efficiency, and the Response to Demographic Transition. Sustainability 2019, 11, 4756. [Google Scholar] [CrossRef] [Green Version]
  17. Kendall, M.G. The Geographical Distribution of Crop Productivity in England. J. R. Stat. Soc. 1939, 102, 21. [Google Scholar] [CrossRef]
  18. Van Zanten, H.H.E.; Mollenhorst, H.; Klootwijk, C.W.; Van Middelaar, C.E.; De Boer, I.J.M. Global food supply: Land use efficiency of livestock systems. Int. J. Life Cycle Assess. 2015, 21, 747–758. [Google Scholar] [CrossRef] [Green Version]
  19. Zhang, J.; Zhang, D.; Huang, L.; Wen, H.; Zhao, G.; Zhan, D. Spatial distribution and influential factors of industrial land productivity in China’s rapid urbanization. J. Clean. Prod. 2019, 234, 1287–1295. [Google Scholar] [CrossRef]
  20. Charnes, A.; Cooper, W.W.; Rhodes, E. Measuring the efficiency of decision making units. Eur. J. Oper. Res. 1978, 2, 429–444. [Google Scholar] [CrossRef]
  21. Zhu, X.; Zhang, P.; Wei, Y.; Li, Y.; Zhao, H. Measuring the efficiency and driving factors of urban land use based on the DEA method and the PLS-SEM model—A case study of 35 large and medium-sized cities in China. Sustain. Cities Soc. 2019, 50, 101646. [Google Scholar] [CrossRef]
  22. Chen, Y.; Chen, Z.; Xu, G.; Tian, Z. Built-up land efficiency in urban China: Insights from the General Land Use Plan (2006–2020). Habitat Int. 2016, 51, 31–38. [Google Scholar] [CrossRef]
  23. Moutinho, V.; Madaleno, M.; Robaina, M. The economic and environmental efficiency assessment in EU cross-country: Evidence from DEA and quantile regression approach. Ecol. Indic. 2017, 78, 85–97. [Google Scholar] [CrossRef]
  24. Färe, R.; Grosskopf, S.; Norris, M.; Zhang, Z. Productivity Growth, Technical Progress, and Efficiency Change in Industrialized Countries. Am. Econ. Rev. 1994, 84, 66–83. [Google Scholar]
  25. Hong, H.; Xie, D.; Liao, H.; Tu, B.; Yang, J. Land Use Efficiency and Total Factor Productivity—Distribution Dynamic Evolution of Rural Living Space in Chongqing, China. Sustainability 2017, 9, 444. [Google Scholar] [CrossRef] [Green Version]
  26. Xie, H.; Chen, Q.; Lu, F.; Wang, W.; Yao, G.; Yu, J. Spatial-temporal disparities and influencing factors of total-factor green use efficiency of industrial land in China. J. Clean. Prod. 2019, 207, 1047–1058. [Google Scholar] [CrossRef]
  27. Bonfiglio, A.; Arzeni, A.; Bodini, A. Assessing eco-efficiency of arable farms in rural areas. Agric. Syst. 2017, 151, 114–125. [Google Scholar] [CrossRef]
  28. Picazo-Tadeo, A.J.; Prior, D. Environmental externalities and efficiency measurement. J. Environ. Manag. 2009, 90, 3332–3339. [Google Scholar] [CrossRef]
  29. Picazo-Tadeo, A.J.; Gómez-Limón, J.A.; Reig-Martínez, E. Assessing farming eco-efficiency: A Data Envelopment Analysis approach. J. Environ. Manag. 2011, 92, 1154–1164. [Google Scholar] [CrossRef]
  30. Korhonen, P.J.; Luptacik, M. Eco-efficiency analysis of power plants: An extension of data envelopment analysis. Eur. J. Oper. Res. 2004, 154, 437–446. [Google Scholar] [CrossRef]
  31. Kuosmanen, T.; Kortelainen, M. Measuring Eco-efficiency of Production with Data Envelopment Analysis. J. Ind. Ecol. 2005, 9, 59–72. [Google Scholar] [CrossRef]
  32. Tone, K. A slacks-based measure of efficiency in data envelopment analysis. Eur. J. Oper. Res. 2001, 130, 498–509. [Google Scholar] [CrossRef] [Green Version]
  33. Chen, Y.; Xu, W.; Zhou, Q.; Zhou, Z. Total Factor Energy Efficiency, Carbon Emission Efficiency, and Technology Gap: Evidence from Sub-Industries of Anhui Province in China. Sustainability 2020, 12, 1402. [Google Scholar] [CrossRef] [Green Version]
  34. Liang, Z.; Chiu, Y.-H.; Li, X.; Guo, Q.; Yun, Y. Study on the Effect of Environmental Regulation on the Green Total Factor Productivity of Logistics Industry from the Perspective of Low Carbon. Sustainability 2019, 12, 175. [Google Scholar] [CrossRef] [Green Version]
  35. Tao, X.; Wang, P.; Zhu, B. Provincial green economic efficiency of China: A non-separable input–output SBM approach. Appl. Energy 2016, 171, 58–66. [Google Scholar] [CrossRef]
  36. Xie, H.; Chen, Q.; Wang, W.; He, Y. Analyzing the green efficiency of arable land use in China. Technol. Forecast. Soc. Chang. 2018, 133, 15–28. [Google Scholar] [CrossRef]
  37. Cecchini, L.; Venanzi, S.; Pierri, A.; Chiorri, M. Environmental efficiency analysis and estimation of CO2 abatement costs in dairy cattle farms in Umbria (Italy): A SBM-DEA model with undesirable output. J. Clean. Prod. 2018, 197, 895–907. [Google Scholar] [CrossRef]
  38. Liu, T.; Li, J.; Chen, J.; Yang, S. Urban Ecological Efficiency and Its Influencing Factors—A Case Study in Henan Province, China. Sustainability 2019, 11, 5048. [Google Scholar] [CrossRef] [Green Version]
  39. Zhou, C.; Shi, C.; Wang, S.; Zhang, G. Estimation of eco-efficiency and its influencing factors in Guangdong province based on Super-SBM and panel regression models. Ecol. Indic. 2018, 86, 67–80. [Google Scholar] [CrossRef]
  40. Lu, X.; Kuang, B.; Li, J. Regional difference decomposition and policy implications of China’s urban land use efficiency under the environmental restriction. Habitat Int. 2018, 77, 32–39. [Google Scholar] [CrossRef]
  41. Huang, J.; Yang, X.; Cheng, G.; Wang, S. A comprehensive eco-efficiency model and dynamics of regional eco-efficiency in China. J. Clean. Prod. 2014, 67, 228–238. [Google Scholar] [CrossRef]
  42. Gadanakis, Y.; Bennett, R.; Park, J.; Areal, F.J. Evaluating the Sustainable Intensification of arable farms. J. Environ. Manag. 2015, 150, 288–298. [Google Scholar] [CrossRef] [Green Version]
  43. Wang, Y.; Yang, J.; Liang, J.; Qiang, Y.; Fang, S.; Gao, M.; Fan, X.; Yang, G.; Zhang, B.; Feng, Y. Analysis of the environmental behavior of farmers for non-point source pollution control and management in a water source protection area in China. Sci. Total. Environ. 2018, 633, 1126–1135. [Google Scholar] [CrossRef]
  44. Yerseitova, A.; Issakova, S.; Jakisheva, L.; Nauryzbekova, A.; Moldasheva, A. Efficiency of using agricultural land in Kazakhstan. Entrep. Sustain. Issues 2018, 6, 558–576. [Google Scholar] [CrossRef] [Green Version]
Figure 1. Study area.
Land 09 00440 g001
Figure 2. Spatial distribution of cultivated land use efficiency environmental constraints in 2017.
Land 09 00440 g002
Table 1. Index system of cultivated land use efficiency.
IndexIndicatorsVariables
InputLand inputTotal sown area of the crops (103 hm2)
Labor inputCrop farming practitioners (104 people)
Capital inputApplication of (purified) chemical fertilizer (104 t)
Application of pesticide (104 t)
Application of agricultural plastic film (104 t)
Total machinery power applied in crop farming (104 kw∙h)
Amount of livestock
Effective irrigation area (103 hm2)
OutputDesirable outputTotal production value of crop farming (104 Yuan)
Undesirable outputTotal carbon emissions (104 t)
Total agricultural non-point source pollution (104 t)
Table 2. The coefficient of carbon emission of major sources of carbon in cultivated land use.
Source of CarbonCoefficient of Carbon EmissionSource of CarbonCoefficient of Carbon Emission
Fertilizer0.8956 kg/kgAgricultural machinery0.18 kg/kw
Pesticide4.9341 kg/kgFarmland tillage312.6 kg/km2
Agricultural film5.18 kg/kgAgricultural irrigation20.476 kg/km2
Table 3. The type of pollution and amount of agricultural non-point source.
Pollution TypeAmount of Pollution
nitrogen(Nitrogen content of compound fertilizer and application rate of nitrogen fertilizer) × Pollution intensity
phosphorus(Phosphorus content of compound fertilizer and application rate of phosphate fertilizer) × Pollution intensity × 43.66%
pesticideUse of pesticides × Invalid coefficient
Agricultural filmAgricultural film use × Residual coefficient
Table 4. Evaluation results of cultivated land use efficiency in major years.
RegionDistrict2007201120142017Average (2007–2017)
CCRSBM-UCCRSBM-UCCRSBM-UCCRSBM-UCCRSBM-U
ChangshaWangcheng1111111111
YueyangYueyanglou1111111111
Yunxi0.9660.5950.8880.4600.8400.3910.7520.3880.8730.429
Junshan1111110.9330.5020.9940.955
Yueyang0.9550.5990.8360.4780.7350.4000.6250.3760.7830.443
Huarong0.9270.5940.8350.4200.7380.3360.6520.3070.7780.386
Xiangyin0.9890.7860.9330.6110.9090.5350.8510.4750.9210.599
Pingjiang0.8360.4070.7100.3790.5820.3030.6400.2950.6960.338
Miluo10.688110.9210.3760.8810.3690.9750.558
Linxiang0.9120.4870.8110.4310.6940.3550.6390.3450.7820.401
Average0.9540.6840.8900.6420.8240.5220.7750.4510.8670.568
ChangdeWuling11110.9400.4010.8730.3840.8710.607
Dingcheng0.9760.787110.9860.7940.9080.6500.9560.783
Anxiang111111110.9930.951
Hanshou0.9020.7541111110.9670.889
Lixian0.9330.7920.8340.5260.8010.4300.8330.5030.8460.551
Linli1111111111
Taoyuan1111111111
Shimen0.9620.7581111110.9970.978
Jingshi1111111111
Average0.9750.8990.9820.9470.9700.8470.9570.8370.9590.862
YiyangZiyang0.8150.4570.7770.3380.5340.2690.4680.2420.6260.307
Heshan0.8620.6000.7560.4300.6110.3730.5650.3800.6640.417
Nanxian0.9450.6700.8030.4480.6820.3890.8830.3990.8120.487
Taojiang0.8930.5760.7300.4630.6530.4070.6430.3670.7260.443
Anhua0.9300.5870.7940.5020.8640.5390.8680.5190.8610.540
Yuanjiang0.9140.6780.7040.4150.6980.3990.6730.3780.7620.492
Average0.8930.5940.7610.4330.6740.3960.6830.3810.7420.448
Total average0.9490.7530.8960.7160.8480.6280.8270.5950.8750.662
Note: (1) CCR represents the value of CLUE without environmental constraints. (2) SBM-U represents the value of CLUE with environmental constraints. (3) Wangcheng is the only DMU in Changsha, so the DMU in Changsha cannot be compared.
Table 5. Redundancy rate of each input–output indicator of cultivated land use efficiency from 2007 to 2017.
YearLaborLandCapitalUndesirable Output
PractitionerSown AreaFertilizerPlastic FilmPesticideMachinery PowerEffective Irrigation LivestockCarbon EmissionNon-Point Source Pollution
200712.50%13.47%21.06%23.60%26.79%8.12%26.69%21.94%13.77%23.01%
200815.63%18.26%25.28%21.44%25.09%7.55%17.20%31.28%18.24%26.26%
200921.32%25.44%34.73%29.09%34.79%16.17%29.08%47.08%25.52%35.23%
201023.22%24.71%36.11%30.29%31.48%18.24%27.48%50.05%24.77%36.14%
201117.90%20.27%29.80%25.05%24.66%13.37%11.55%39.98%20.09%29.87%
201220.38%23.70%33.87%30.85%29.97%19.24%9.25%45.93%23.39%33.60%
201319.54%22.04%32.80%24.38%33.25%17.68%26.07%42.73%22.17%32.25%
201424.07%26.08%36.59%24.70%35.79%21.94%30.99%49.40%26.22%34.89%
201525.95%25.35%35.94%25.20%36.71%20.34%30.44%48.19%25.51%33.33%
201628.84%27.67%39.61%25.69%35.57%23.36%33.00%51.75%27.82%36.70%
201728.45%28.08%39.34%27.54%36.81%24.23%34.71%54.56%28.30%35.96%
Increase15.95%14.60%18.28%3.95%10.01%16.11%8.02%32.62%14.52%12.95%
average21.62%23.19%33.19%26.16%31.90%17.30%25.13%43.90%23.26%32.48%
Table 6. Top three input–output factors affecting the cultivated land use efficiency.
RegionDMU2007201120142017
ChangshaWangcheng////////////
YueyangYueyanglou////////////
YunxiPFPFPFLSNPSLSPFNPSLSPFNPS
Junshan/////////LSFNPS
YueyangxianIPFNPSLSNPSFLSFNPSLSFNPS
HuarongPFNPSFPFLSPPFLSPLSPNPS
XiangyinPIMLSPFPLSILSPI
PingjiangPFLSIPFIPLSPFLLSPFL
MiluoLSPPF///LSPPFLSPNPS
LinxiangIFNPSLSFNPSLSIFLSIF
ChangdeWuling//////LSPFLSPF
DingchengICPF///ICFIPF
Anxiang////////////
HanshouPFL/////////
LixianPINPSLSFNPSLSFILSFI
Linli////////////
Taoyuan////////////
ShimenLIL/////////
Jingshi////////////
YiyangZiyangPFFNPSPFPFPFNPSPFNPS
HeshanPFNPSPFPFPFILSPI
NanxianNPSFPNPSFLSFNPSPFLSNPS
TaojiangILSMLSFNPSLSFLLSFI
AnhuaLSLILSILLSLMLSLM
YuanjiangFNPSLSLSFNPSLSFPLSFP
Note: PF: plastic film, P: pesticide, F: fertilizer, LS: livestock, NPS: non-point source pollution, I: irrigation, M: machinery power, L: Practitioner, C: carbon emission.
Table 7. Redundancy of inputs and outputs of cultivated land use efficiency in 2017.
RegionDMULaborLandCapitalUndesirable Output
PractitionerSown AreaFertilizerPlastic FilmPesticideMachinery PowerEffective Irrigation LivestockCarbon EmissionNon-Point Source Pollution
ChangshaWangcheng0.00%0.00%0.00%0.00%0.00%0.00%0.00%0.00%0.00%0.00%
YueyangYueyanglou0.00%0.00%0.00%0.00%0.00%0.00%0.00%0.00%0.00%0.00%
Yunxi26.34%24.78%67.05%85.48%51.59%18.80%55.43%86.65%25.81%68.81%
Junshan18.46%31.63%54.66%33.72%32.98%1.68%56.17%90.05%32.38%46.48%
Yueyangxian40.63%48.19%63.50%53.52%33.12%32.89%56.17%89.55%48.38%60.31%
Huarong34.84%39.47%69.02%85.90%77.70%40.81%56.30%82.79%39.94%70.19%
Xiangyin27.47%30.42%43.54%4.49%74.74%42.72%49.44%88.24%30.94%31.08%
Pingjiang72.28%36.04%50.87%89.95%57.96%48.90%50.82%97.02%36.42%65.36%
Miluo11.90%35.49%57.68%72.22%81.09%24.88%54.52%92.65%36.02%64.81%
Linxiang36.13%51.48%61.74%48.29%37.92%58.25%67.92%87.55%51.96%55.91%
ChangdeWuling56.70%43.17%67.67%43.39%71.70%39.95%12.73%77.42%42.79%61.31%
Dingcheng13.30%39.27%39.79%0.00%40.59%0.00%45.17%0.00%39.44%38.64%
Anxiang0.00%0.00%0.00%0.00%0.00%0.00%0.00%0.00%0.00%0.00%
Hanshou0.00%0.00%0.00%0.00%0.00%0.00%0.00%0.00%0.00%0.00%
Lixian31.45%33.94%56.43%0.00%48.97%17.11%52.59%77.53%34.54%44.77%
Linli0.00%0.00%0.00%0.00%0.00%0.00%0.00%0.00%0.00%0.00%
Taoyuan0.00%0.00%0.00%0.00%0.00%0.00%0.00%0.00%0.00%0.00%
Shimen0.00%0.00%0.00%0.00%0.00%0.00%0.00%0.00%0.00%0.00%
Jingshi0.00%0.00%0.00%0.00%0.00%0.00%0.00%0.00%0.00%0.00%
YiyangZiyang64.08%53.18%76.81%72.40%81.33%70.13%53.69%72.95%53.20%74.24%
Heshan52.89%45.07%51.18%41.56%62.04%50.54%59.68%71.82%45.46%34.76%
Nanxian44.81%41.08%71.88%30.87%65.40%14.87%54.58%69.74%41.44%68.45%
Taojiang60.74%52.99%64.53%6.28%38.14%52.89%61.55%95.68%53.20%47.25%
Anhua73.23%46.25%22.63%0.00%6.01%47.12%38.85%94.25%46.11%8.22%
Yuanjiang45.90%49.47%64.46%20.47%58.88%44.13%42.25%90.14%49.35%58.45%
Total 28.45%28.08%39.34%27.54%36.81%24.23%34.71%54.56%28.30%35.96%
Publisher’s Note: MDPI stays neutral with regard to jurisdictional claims in published maps and institutional affiliations.

