Article

Effect of Vegetation Removal on Soil Erosion and Bank Stability in Agricultural Drainage Ditches

1
Department of Soil and Environment, Swedish University of Agricultural Sciences, PO Box 7014, SE-750 07 Uppsala, Sweden
2
Hydraulics Laboratory, San Simon University, Cochabamba Av. Petrolera 4½, Cochabamba, Bolivia
*
Author to whom correspondence should be addressed.
Land 2020, 9(11), 441; https://doi.org/10.3390/land9110441
Submission received: 1 October 2020 / Revised: 5 November 2020 / Accepted: 9 November 2020 / Published: 11 November 2020

Abstract

:
Maintenance of agricultural drainage ditches can be difficult to optimize if farmers have no guidelines on where to target their maintenance efforts. A main concern is whether ditch banks will experience soil erosion or mass movement (failure). In order to help identify sites that are more likely to experience soil erosion and/or mass movement, soil susceptibility to detachment was assessed in this study using a cohesive strength meter (CSM) and measurements of shear strength in unsaturated direct shear tests. The results showed that soil roots play an important role in stabilizing ditch banks against mass movement and in reducing the rate of soil detachment. A positive stabilizing effect was detected by CSM and confirmed by shear strength measurements. The conclusion is that native vegetation should be maintained on ditch banks, instead of being removed during maintenance work as is currently the case.

1. Introduction

Humans clear away natural vegetation and cultivate crops, in the process creating periodically non-vegetated areas that are prone to soil erosion [1,2,3]. Globally, an estimated 1094 million ha of land are affected by water erosion, of which 751 million ha are severely affected [4,5]. Soil erosion is a current threat to the security of food production, as around 80% of global agricultural land is affected by moderate to severe erosion [6] and as the rate of erosion greatly exceeds the rate of soil formation [7]. Global demand for food has thus resulted in agriculture becoming an intense activity causing soil and water pollution, soil losses by erosion, and biodiversity loss [8]. In order to reduce the adverse effects of soil erosion and maintain the fertility of agricultural land, proper management is needed. Land drainage, or combined irrigation and drainage, is an important measure to maintain or improve yield per unit of farmed land [9]. The drainage structures constructed to achieve proper drainage of agricultural land include open ditches that are responsible for collecting surface and subsurface water, thus acting as erosion and flood control [8]. Ditches are therefore vital for the sustainable functioning of agricultural land [10].
Agricultural ditches degrade over time by the action of multiple processes, including rain, overland flow, bank erosion, and mass movement [10]. In order to identify appropriate strategies to maintain agricultural ditch function, ditch degradation status needs to be assessed. Approaches such as Minnesota Agricultural Ditch Research Assessment (MADRAS) allow visual assessment of the status of drainage ditches [11], but there is currently no method for assessing the likelihood of occurrence of the processes causing drainage ditch deterioration. Among these processes, soil mass movement and soil erosion affecting ditch banks are considered the most important. Previous work has shown that, at catchment level, the sediment contribution from bank-derived material is greater than previously thought [12]. In an agricultural context, keeping drainage ditches properly functional means ensuring good hydraulic capacity. The hydraulic capacity of a ditch is strongly affected by soil erosion and bank instability, since the soil displaced from the banks will eventually be deposited in the main channel. Furthermore, soil removal from the banks as a consequence of erosion and mass movement modifies ditch geometry. A drainage ditch with modified geometry can display changes in its hydraulic behavior/performance that could potentially promote unintended instances of erosion/deposition either downstream or upstream. Therefore, knowledge of where erosion is more likely to occur and where ditch banks are more likely to become unstable is important when deciding where maintenance work should be targeted.
An important aspect of maintenance work on agricultural drainage ditches is that it usually involves channel cross-section modification (mainly by widening the cross-section and changing the slope of the channel banks) and removal of vegetation that might have grown in the channel and on the banks. Removal of vegetation from the channels is necessary to avoid obstructions to flow, but might have negative effects by leaving the banks less protected or more unstable. It is widely accepted that vegetation roots have an overall positive effect on soil stability [13,14,15,16]. For instance, it has been shown that vegetation roots increase the shear strength of soils with high moisture content [14] and, depending on the root configuration in a channel, increase bank stability to mass movement [17]. However, this increased stability of agricultural drainage ditches has not been assessed to date. Further, vegetation on the banks not only increases the shear strength of the soil, but is also likely to reduce the forces caused by water flow in the ditch [18], decreasing its erosive force. This is particularly important because different drainage maintenance procedures affect the dynamics of vegetation present in the drainage ditch [19]. Thus, depending on how vegetation establishes, different stabilizing effects will occur. In addition, changes in water content in the soil have an impact on the resistance to erosion, as demonstrated previously for agricultural watersheds [20], but not specifically for agricultural drainage ditch banks. Thus, the practice of vegetation removal could possibly worsen or at least support active erosion and bank instabilities. To assess the impact of vegetation on the stability of ditch banks and their resistance to erosion, this study examined the effects of vegetation roots on ditch soil resistance to detachment, measured with a cohesive strength meter (CSM), and soil shear strength, measured with unsaturated direct shear tests. The effect of moisture condition on soil particle resistance to detachment under two soil moisture conditions was also assessed with the CSM. Finally, to assess the combined effect of bank slope modification and vegetation configuration, the factor of safety (FoS) for ditch banks with and without vegetation, with three different slopes and three root depths, was estimated following slope stability analysis using the finite element method.

2. Materials and Methods
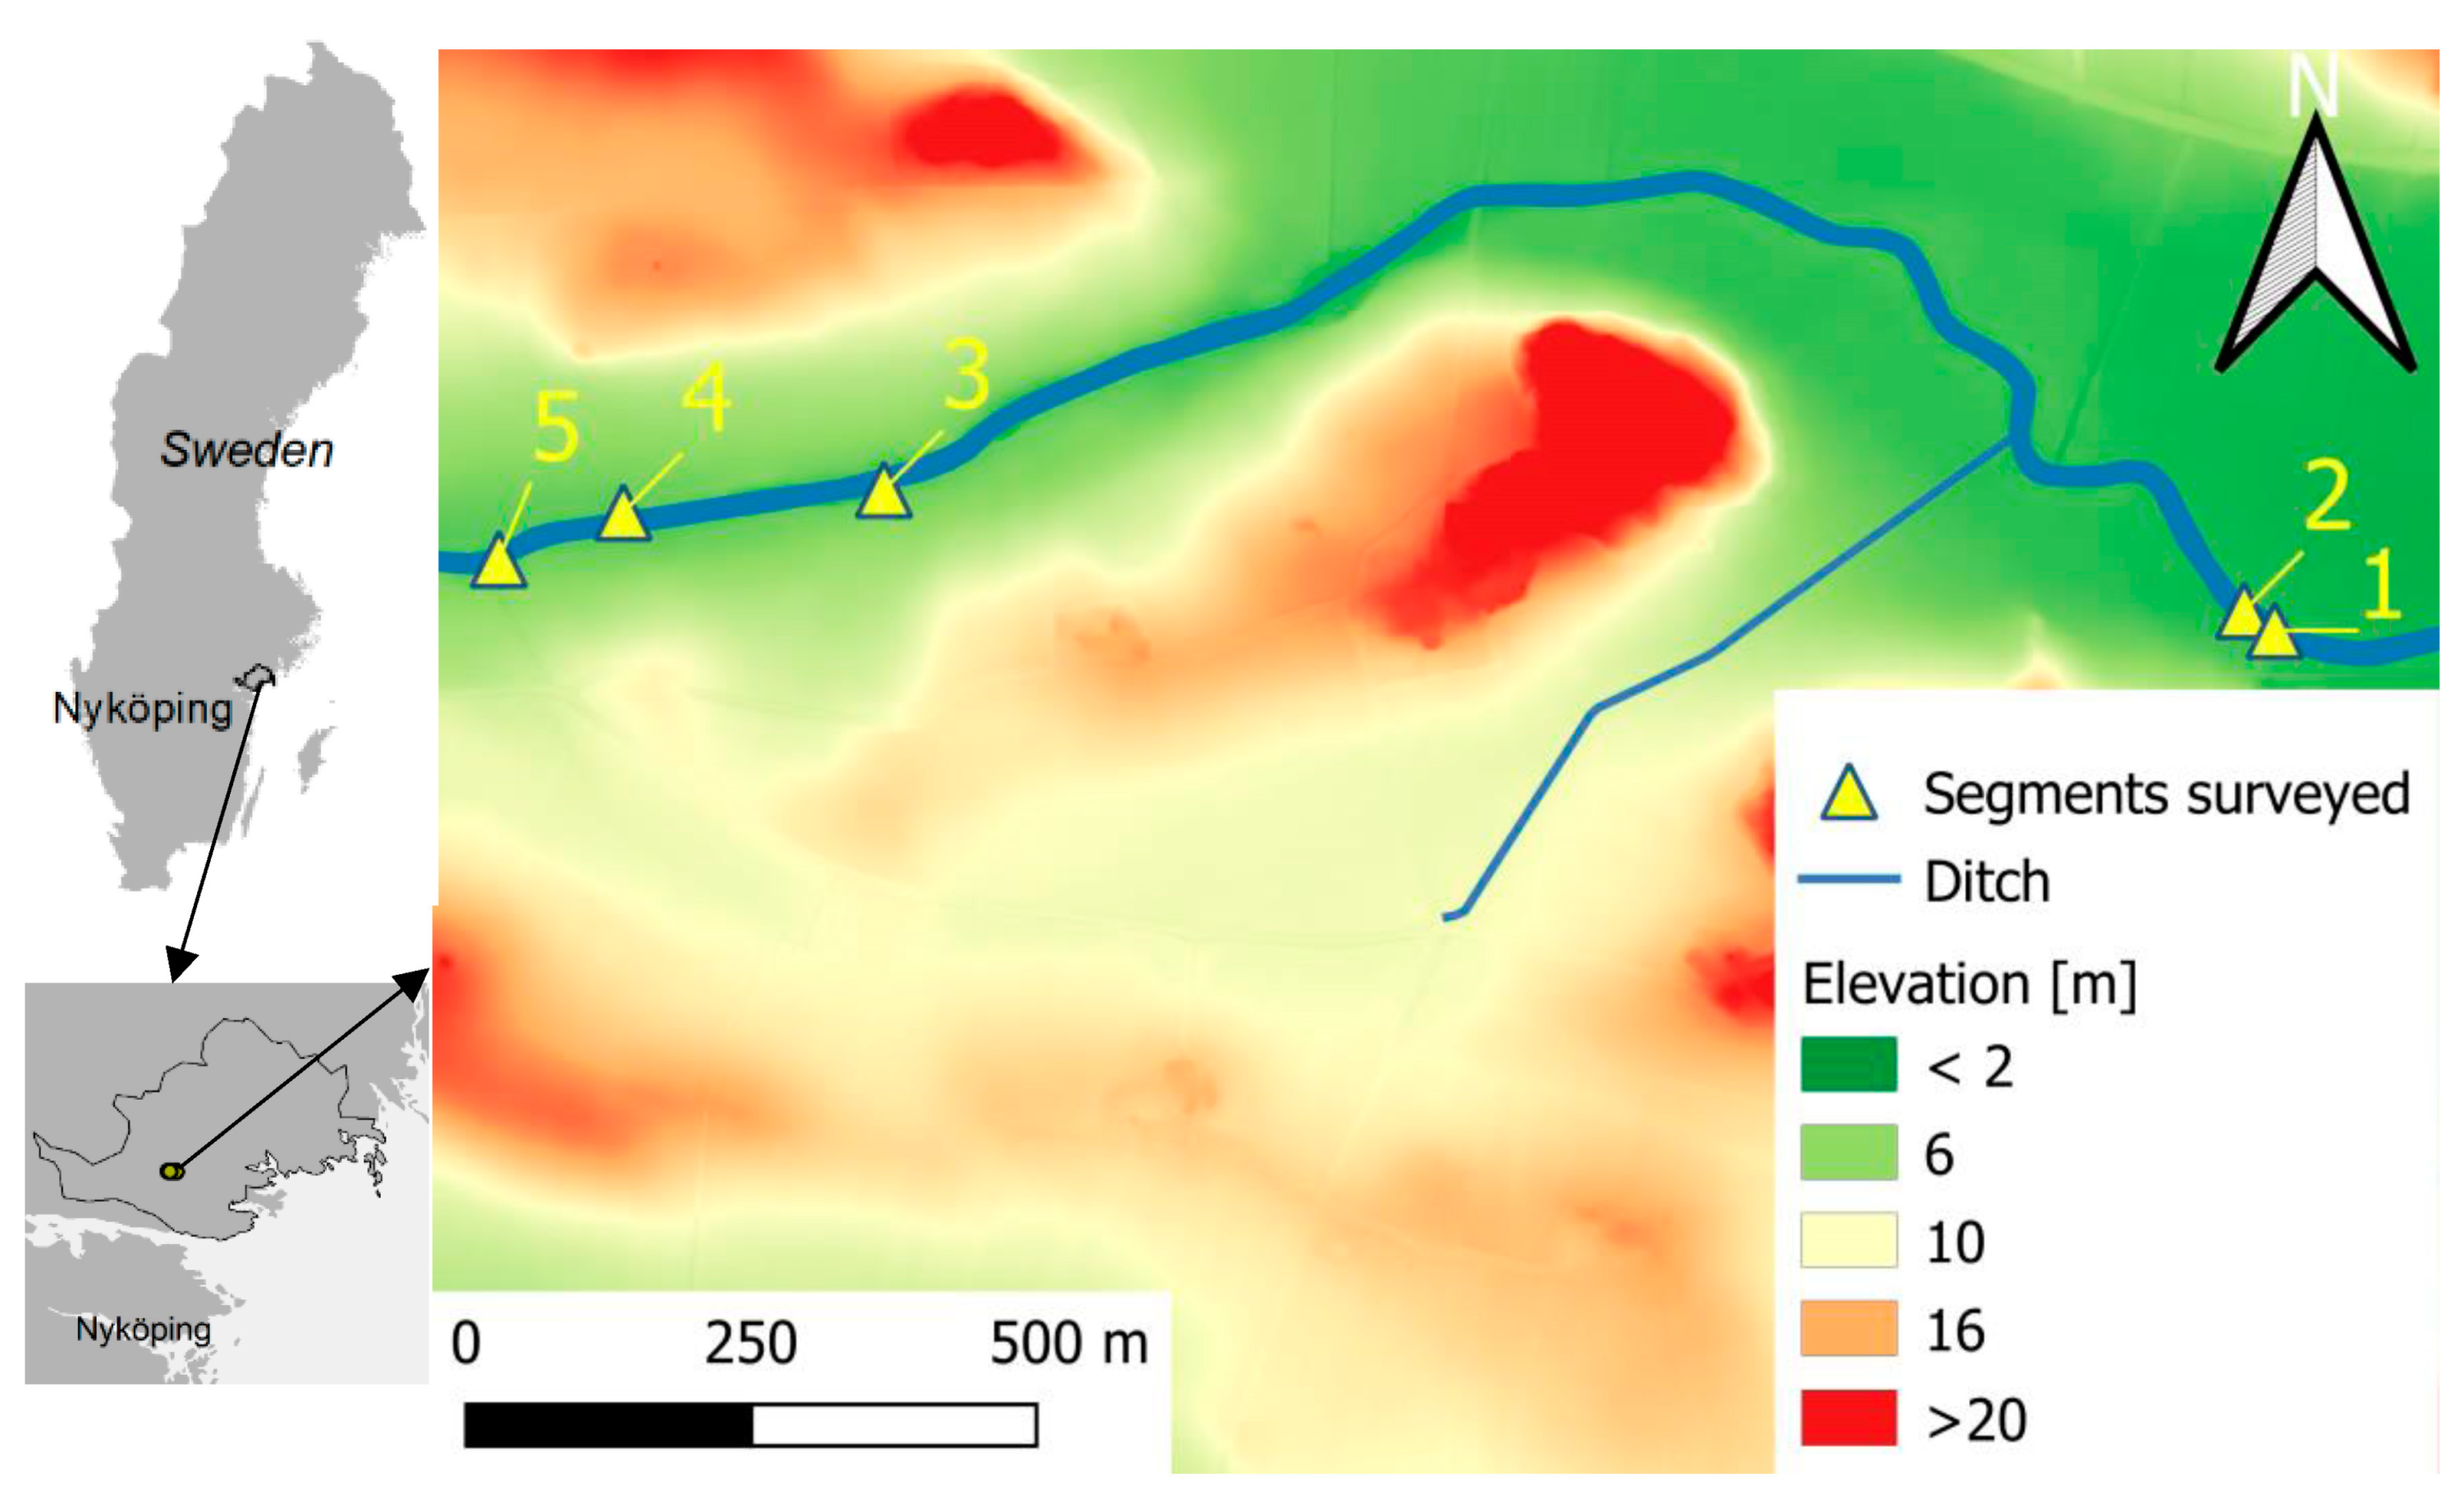
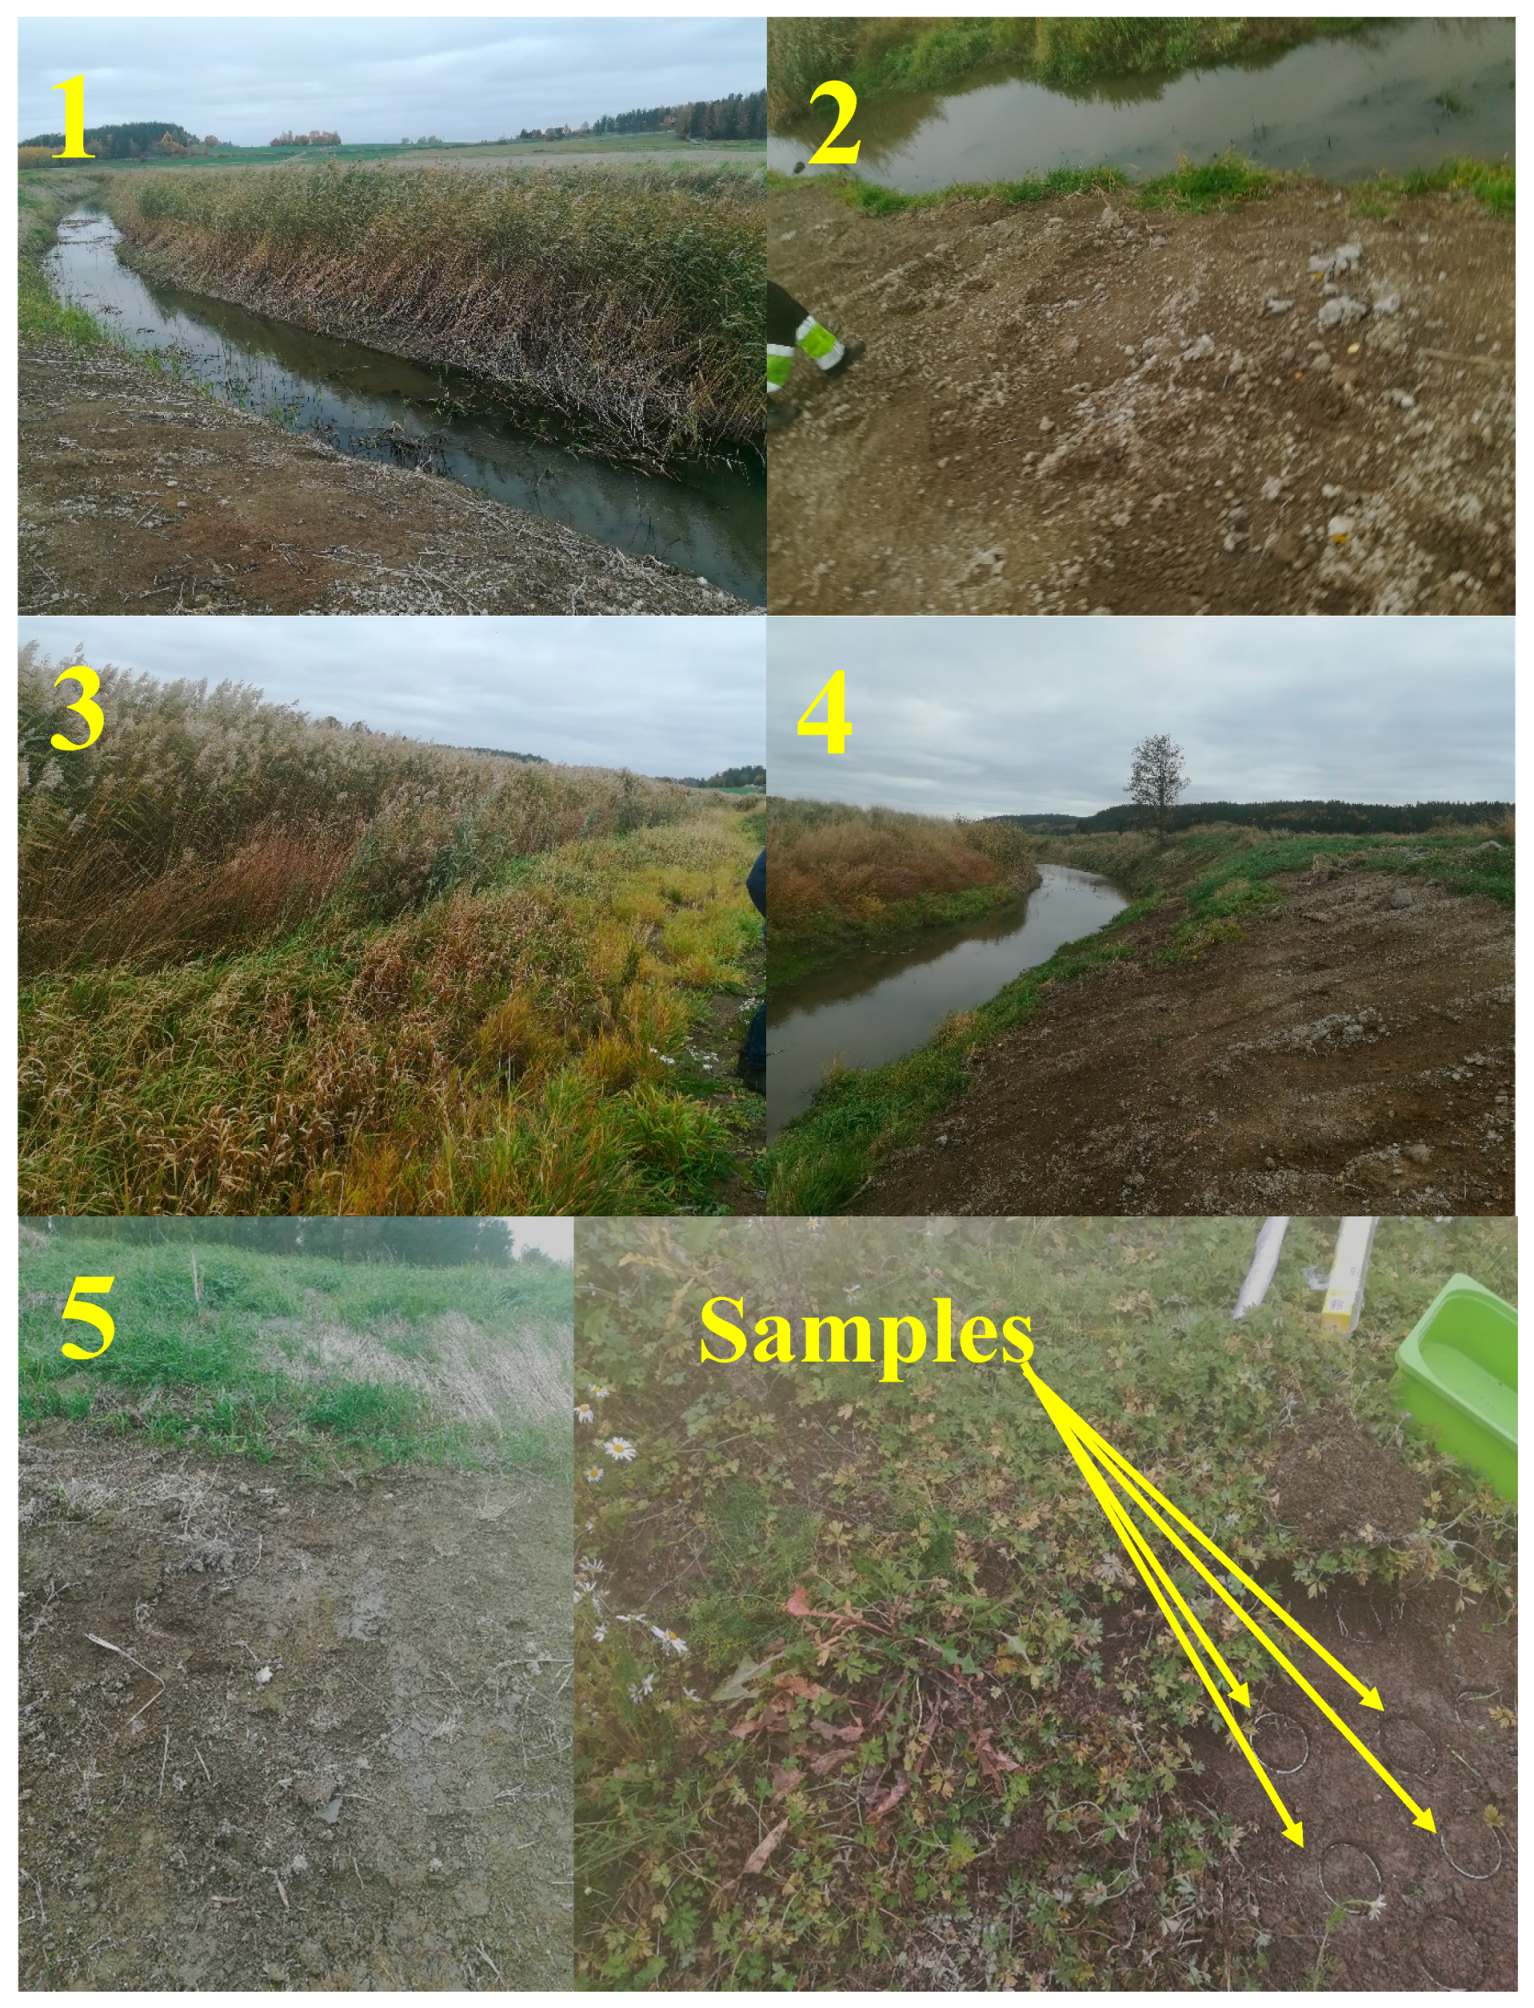
2.1. Field Site

Field studies were carried out in an agricultural drainage ditch located just east from Jönaker, in Södermanland County near Nyköping city, Sweden (see Figure 1 and Figure 2). The drainage ditch, named Kilaån, was originally a natural watercourse, but was straightened to meet certain critical dimensions for depth and width around 1979 [21]. Kilaån flows through three wetlands, Hannsjön, Erkan, and Svanviken, which were formerly small lakes that were drained to expose agricultural land. The ditch is inside Kilaån catchment area (432 km2), which extends through the valley from Kolmården forest to western Nyköping. Land use around Kilaån mainly comprises agriculture and forestry. The agricultural ditch is in a flat area with mean elevation 20 m above sea level and mean yearly temperature of 5.6 °C, with a cold period (November–March) with temperatures below 0 °C and a warm period (June–August) with temperatures above 10 °C. Yearly precipitation is 545 mm [22]. Various segments of the drainage ditch showed signs of mass movement at the time of the study. The landowner revealed that some segments had experienced actual mass movement after past maintenance work that involved changing the ditch cross-section so that the banks were steeper and completely without vegetation. Considering the maintenance work done and the information provided by the landowner, five ditch segments, each 10–15 m long, were selected for investigation. Two of these segments (segments 1 and 3) had not had their cross-section modified and had well-established vegetation, while three (2, 4, and 5) had had their vegetation removed and/or their cross-section modified. Thus, segments 1 and 3 had a greater presence of plant roots, assessed visually on-site, while segments 2, 4, and 5 had little or no vegetation and sparse or no roots in ditch bank soil. In addition, segments 1 and 3 showed no signs of recent mass movement activity, whereas segment 2 had some soil at the toe of the bank, which was considered an indication of mass movement. In segments 2 and 5, some small blocks of soil had fallen into the channel, but any past evidence of bank instability had been removed during recent maintenance work in which the bank was cleared and flattened.

2.2. Sample Preparation

Within each of the five selected segments, six undisturbed samples (cores 7.2 cm diameter and 5 cm height) were taken for testing with the CSM and 12 undisturbed samples (7.5 cm diameter and 2 cm height) were taken for direct shear testing. An additional three disturbed samples (around 100 g) were taken from each segment for texture analysis. Thus, 21 samples per segment were extracted, or 105 samples in total.
The samples were taken from the bank surfaces of the ditch at an approximate depth of 5–15 cm and at an approximate distance of 1 m from the top of the ditch bank. Three of the six samples for the CSM tests and all 12 samples for the direct shear tests were water-saturated and then drained to a drainage equilibrium pressure of 5 kPa, to standardize the moisture content prior to running the tests. The remaining three CSM samples were tested under water-saturated conditions. This was done to compare saturated conditions (i.e., the conditions to which the lower portion of the ditch bank is subjected) with average field conditions to which the upper portion of the ditch bank is subjected (i.e., drainage equilibrium pressure of 5 kPa).
The three samples for texture analysis were air-dried and sieved through a 2 mm sieve. Organic matter was then removed by boiling the soil in a solution of water, hydrochloric acid (HCl), and hydrogen peroxide (H2O2).
Analyzing and testing the 105 samples (21 per segment) involved seven months of full-time work in the laboratory.

2.3. Texture Analysis

Soil texture was measured with a particle size analyzer from ©Horiba, model LA-950, which derives particle size from the forward diffraction of a laser beam and uses Mie scattering theory to calculate the size and number of particles in the sample [24,25]. The sample is placed in a sample holder in the device, which feeds the analyzer with small representative samples for texture analysis. The equipment can measure particle sizes between 10 nm and 3 mm. This method provides a high degree of repeatability, greatly reduces testing times, and requires only small soil samples [25,26].

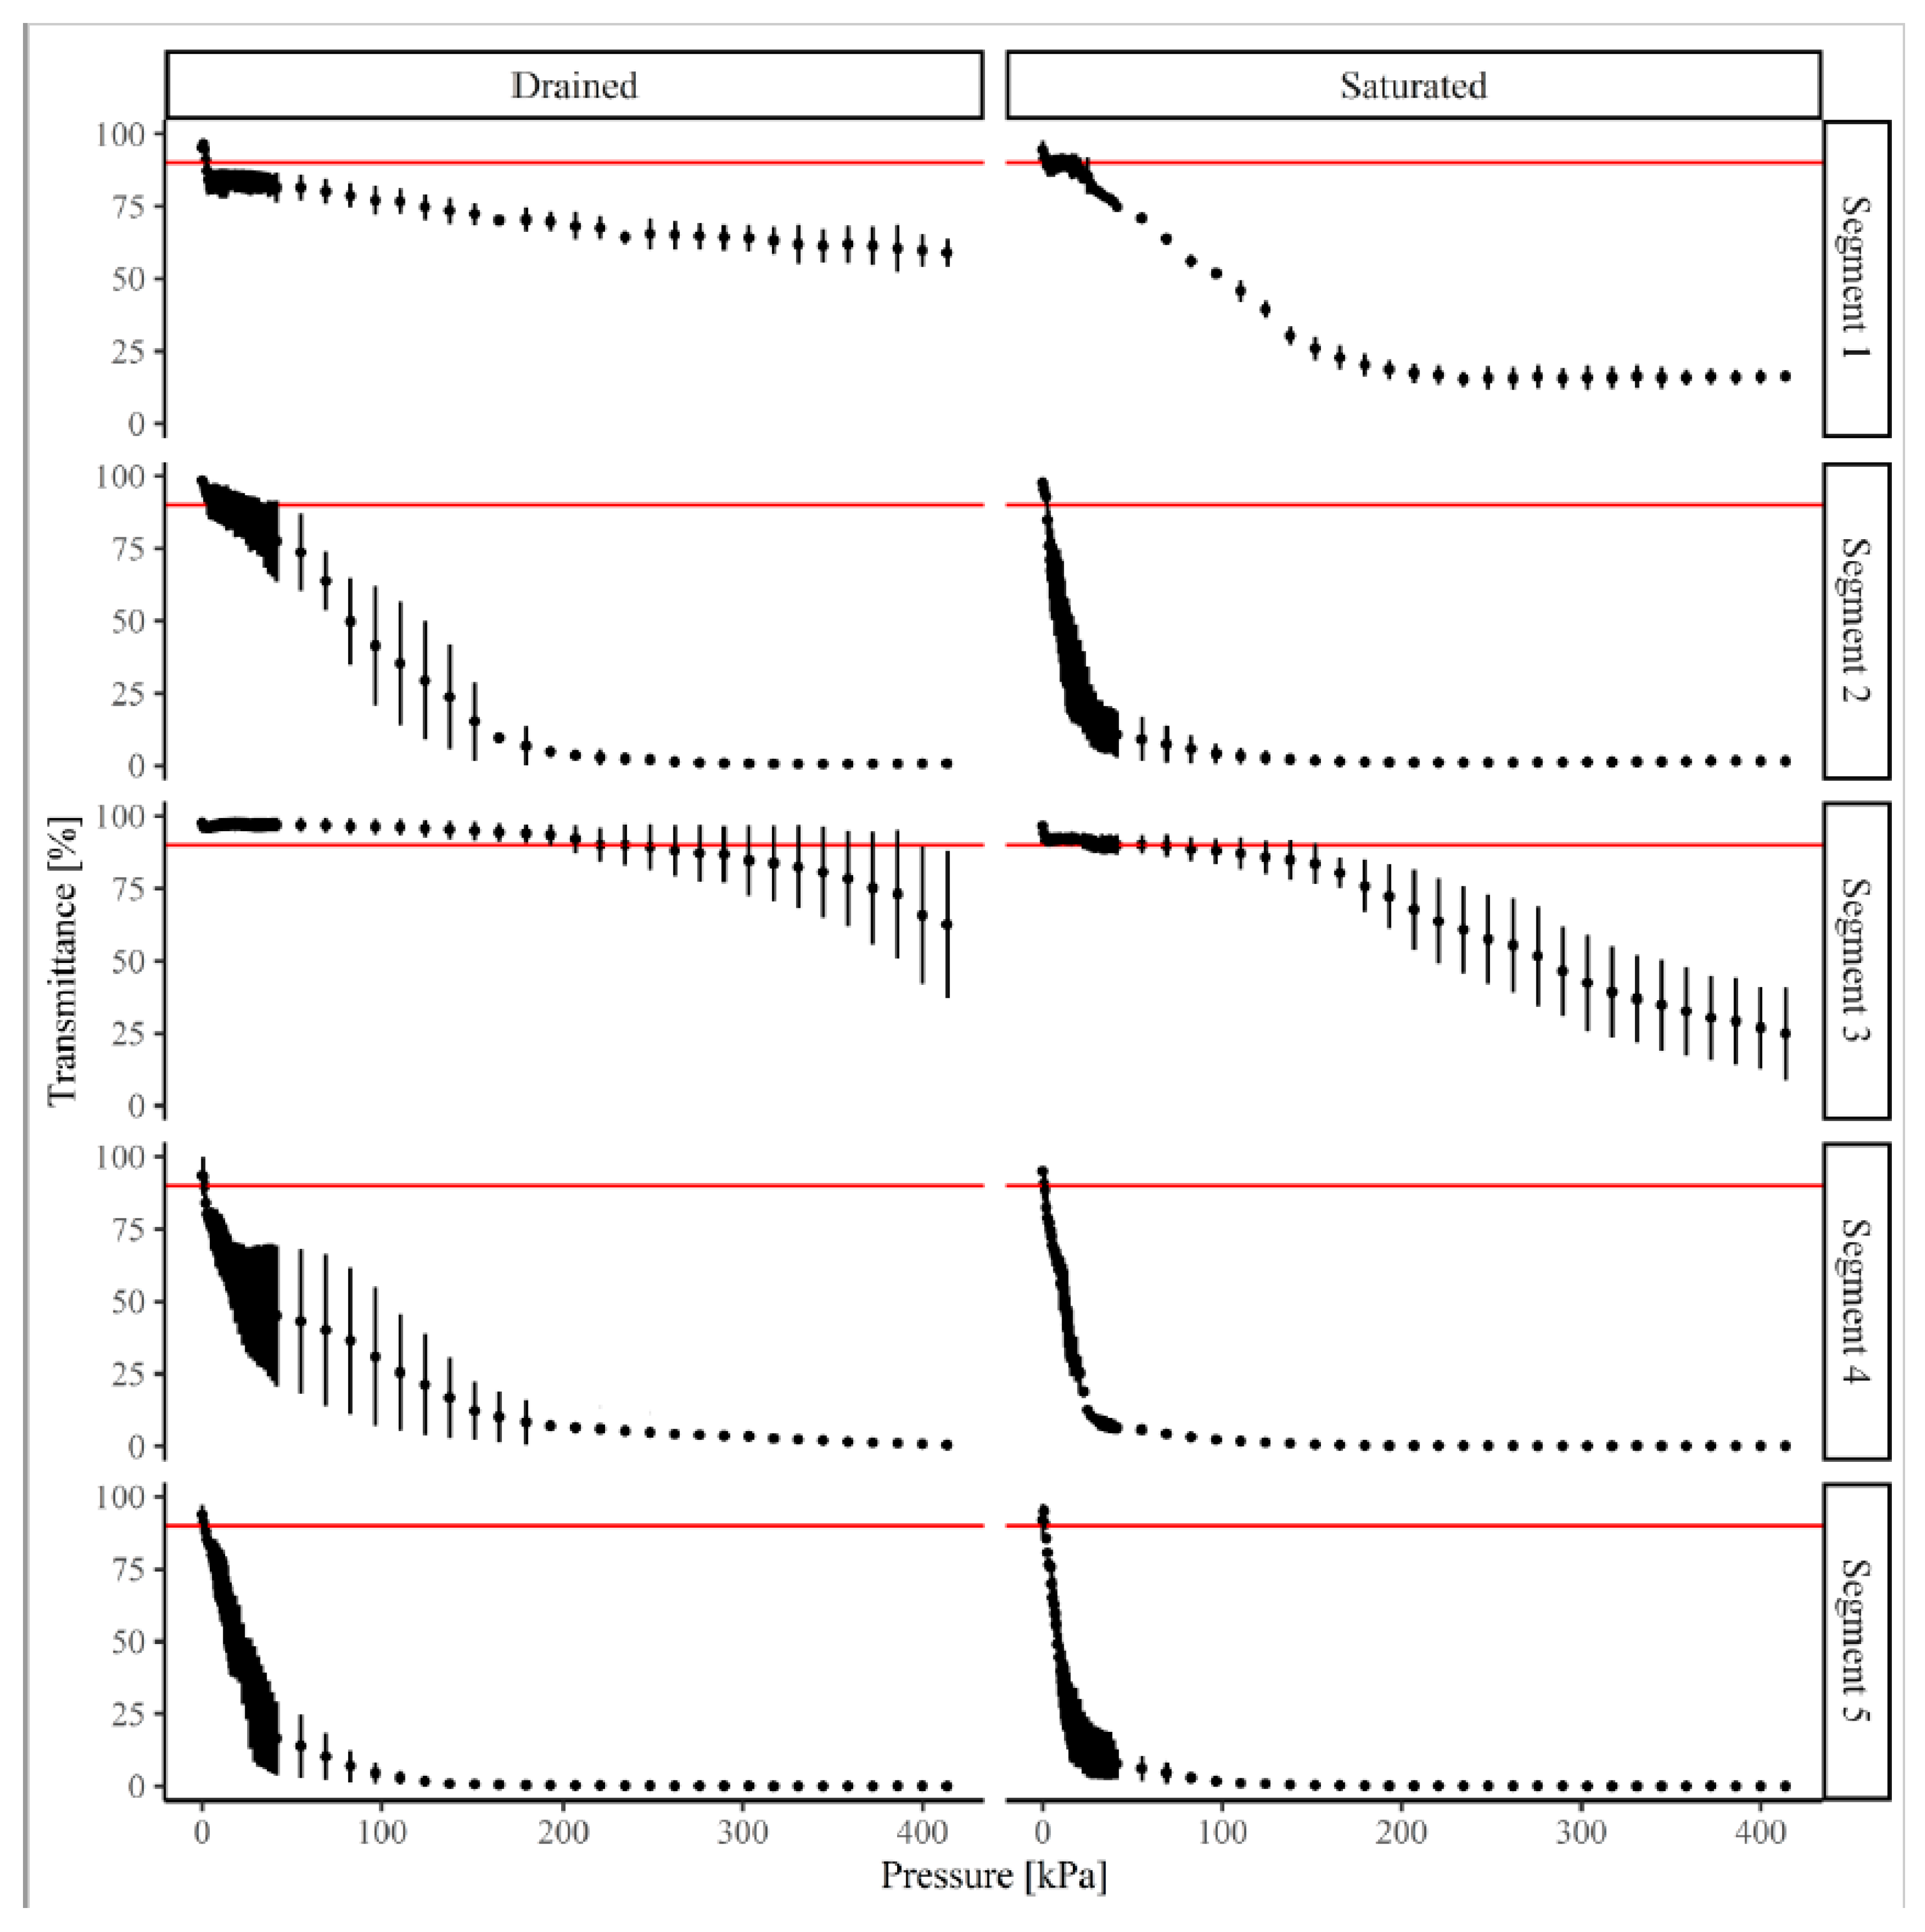
2.4. Cohesive Strength Meter (CSM)

The CSM, developed by © Partrac, allows estimation of the critical shear stress for erosion. The device directs a water jet at the sample surface in short pulses. The internal CSM pressure (Pi) used to fire each water jet is increased for every pulse, and soil detachment caused by the jet is tracked by the reduction in light transmittance across the test chamber [27]. Using readings of pressure versus light transmittance, it is possible to identify the point at which erosion starts, which has been defined as the point at which the transmittance value falls below 90% (representing a 10% reduction in light transmittance). The corresponding pressure is considered the point of incipient scour. Vardy et al. [28] suggested expressing this pressure (internal CSM pressure, Pi) as equivalent pressure at the soil surface (Psurface), since this makes it possible to compare the results obtained with different CSM instruments. Accordingly, a relationship between Pi and equivalent pressure at the soil surface (Psurface) was obtained by measuring the pressures with a pressure sensor plate [10]:
Psurface = 0.005Pi
where Psurface and Pi are in Pa.
Although values of Psurface obtained with Equation (1) do not account for the fact that the surface hit by the jet varies in time, it is considered a better approximation than the raw Pi values. Using Equation (1), the internal CSM pressure at the onset of erosion, Pi_cr, can be converted to equivalent pressure at the surface. The value of Psurface at the onset of erosion, Psurface_cr, can be used to obtain τcrit, the critical shear stress for erosion [29]:
τcrit = 0.0013Psurface_cr + 0.047
Equation (2) is valid for the pressure range 40 Pa < Psurface < 90 Pa. The critical shear stress for erosion is then used to compare different soils.
Different CSM routines are available [27], where each routine defines: (i) the duration of the water jets, (ii) the intervals and total duration of the measurement of light transmittance, and (iii) the pressure increment steps for the water jets. In this study, the routine selected was Fine 1 (see Table 1), because it permits use of the full range of pressures exerted by the CSM.

2.5. Unsaturated Direct Shear Test

Soil shear strength is commonly determined under saturated conditions. However, saturated conditions seldom exist in the field, and thus the test does not represent the most common state of the soil [26]. More commonly, the soil is in some intermediate state, which in this study was a state of near saturation. Therefore, near-saturated direct shear tests were carried out on undisturbed soil samples with varying root density. These shear tests were carried out at a single suction level of 5 kPa (0.5 m water column) and at four normal stresses: 20, 60, 100, and 140 kPa. Each level was tested three times, at a shearing speed of 0.01 mm/min. A suction level of 5 kPa was chosen, as it was the closest to saturated conditions that could be achieved with the unsaturated direct shear test equipment.
The effect of roots on shear strength can be accounted for as the increment in cohesion of the soil [17]:
cT = c’ + cr,
where cT is total cohesion, c’ is effective cohesion, and cr is root cohesion. Therefore, in tests performed on samples with varying root density, higher cohesion can be expected in samples with higher root density.
To confirm that added cohesion improves the stability of ditch banks, slope stability analysis was carried out using a finite element analysis code called slope64, following the approach presented by [17], to assess the effect of soil roots on bank stability. Finite element analysis using slope64 iteratively redistributes excess stress to neighboring points after the stress exceeds the soil strength at each Gauss point considered. This redistribution continues until the failure criterion is reached and equilibrium is established at all points considered within the mesh [17]. Finally, a factor of safety (FoS) is derived, as the number by which the strength parameters have to be divided in order to reach a critical state of failure [17,30]. The theoretical basis for the code is described in detail elsewhere [30,31].
From the unsaturated direct shear tests, the shear strength parameters cohesion and angle of friction were derived. The Mohr–Coulomb equation for soil shear strength was used:
τ = cT + (σn − μ) tan ϕ’,
where τ is shear strength of the soil, cT is total cohesion (see Equation (3)), σn is normal stress, μ is pore water pressure, and ϕ’ is friction angle. The geometry of the ditch bank used in the present analysis is shown in Figure 3.
The geometry diagram in Figure 3 shows two ditch bank scenarios, one with the bank slope vegetated (top panel) and one with the vegetation removed (bottom panel). The latter resembles vegetation removal from the bank surface during maintenance work. The slope of the bank was expressed as a ratio 1:s (vertical elevation/horizontal distance), where s (Figure 3) was kept as a variable, to reflect the effect that flattening of the bank might have on bank stability. Three values for the slope of the bank (s) were considered, 0.25, 0.5, and 1.0 m. The root depth zone (h in Figure 3) was set to 0.1 and 0.6 m.

2.6. Plant Roots in the Soil

In order to account for the effect of roots in the soil, the weight of roots present in the samples used for shear testing was determined. After the samples were sheared, the soil was rinsed off with water as carefully as possible, and the roots were collected in small pre-weighed vessels. The roots were then air-dried, and the dry weight of roots was obtained. Using the weight of roots and the volume of the samples, root density was calculated and used to compare soil from the different ditch segments.

2.7. Estimation of Water-Induced Shear Stresses

Water flowing in the ditch will induce shear stresses on the bed of the channel and on the surfaces of the ditch banks. In order to compare the estimated critical shear stress for erosion with the hydraulic shear stresses, the average bed shear caused by the flowing water in the ditch was calculated. A basic estimate of the bed shear stress caused by flowing water was obtained using the following expression [32]:
τb = γwyS,
where τb is the bed shear stress, γw is the specific weight of water, y is the water depth, and S is the slope of the ditch.
Water flow data for the sub-catchment of Kilaån (ID 4897) encompassing the segments studied were obtained from Sweden’s Meteorological and Hydrological Institute (SMHI) [33]. The year-average water discharge is shown in Figure 4. According to the available data for 2014–2019, the average flow was 2.5 m3/s.
In addition to water discharges, Manning’s equation was used to estimate the water depth necessary to estimate the shear stress with Equation (5):
V = n−1R2/3S1/2,
where V is water velocity, n is Manning’s coefficient, R is the hydraulic radius, and S is the slope of the gradient line, which in this case was taken as having the same value of the ditch slope.
In order to use Equation (5) to estimate the water depth from the elevation data provided by Lantmäteriet [23], the average slope of the ditch was estimated to be 0.0043 m/m, and the cross-section considered was trapezoidal (the same as for the slope stability analysis in Section 2.5). A base length of 6 m and bank slopes of 1:0.25, 1:0.5, and 1:1 were considered, taking into consideration the original 1979 [21] design for nearby segments. Two values of Manning’s coefficient were used, a value of 0.027 for the maintained segments, which corresponded to that for an excavated or dredged channel, straight and uniform, with short grass and few weeds [34], and a value of 0.05 for the unmaintained segments, which corresponded to that for a non-dredged channel with vegetated banks, with a clean base and brush on the sides [34].
It has been suggested [32] that, for trapezoidal channels, 75% of the bed shear stress, τb, as estimated with Equation (4), acts on the channel banks:
τbank = 0.75γwyS,
Therefore, this value was used for comparisons with the critical shear stress for erosion values obtained with the CSM.

3. Results and Discussion

Based on soil texture analysis, the soil was classified as silty clay loam [35] for all five ditch segments studied. The results of soil particle size analysis are shown in Table 2.
The CSM test results are shown in Figure 5, where light transmittance values are plotted against Pi. The curves in the diagram show how scour progresses as more soil is detached and put into suspension with increasing Pi.
The shape of the curves in Figure 5, with the exception of segment 1 (drained condition) and segment 3 (drained and saturated condition), is similar to that reported previously [25,26], with no straight line at the beginning of the curve, i.e., at low pressures. This might be an indication that the surface soil was loose and easily removed by the lower range of pressures applied.
From the curves in Figure 5, the critical pressure for initiation of scour, Pi_cr, was estimated as the pressure at which the light transmittance value is below 90% [27]. For this purpose, horizontal red lines were added at 90% light transmittance. The average Pi_cr values are shown in Table 3.
The “drained” and “saturated” conditions in Table 3 refer to the expected conditions in the field (see Section 2.2). The lower portion of the ditch bank is under saturated conditions, and the upper part of the ditch bank is under unsaturated conditions. For the average flow of 2.5 m3/s, the different slopes (1:0.25, 1:0.5, and 1:1), and the selected Manning’s coefficient values (n = 0.027 and 0.05) (see Section 2.7), the water depth in the channel varied from 0.35 to 0.53 m. The soil below this depth is likely to be saturated and the soil above it is likely to be under unsaturated conditions. These two conditions were imposed on the samples before testing with the CSM (Section 2.2). Based on the estimates of Pi_cr, there was no difference between saturated and drained conditions (p > 0.1 in all cases). However, the estimated Pi_cr in segment 3, under saturated and drained conditions, was different from that in the other segments (p < 0.05). The estimated Pi_cr was similar for segments 1, 2, 4, and 5 under both saturated and drained conditions.
From Table 3, it can be seen that Pi_cr in ditch segments 2, 3, and 5 was higher for drained conditions than for saturated conditions. For ditch segments 1 and 4, both conditions showed the same Pi_cr. The average transmittance values are included to show that the pressures measured corresponded to points with average transmittance values below 90%.
Psurface_cr calculated using Equation (1) is also shown in Table 3. For ditch segments 2, 3, and 5, the values of Psurface_cr were higher for drained than for saturated conditions. For segments 1 and 4, the values of Psurface_cr for drained and saturated conditions were similar.
Using the calculated values of Psurface_cr, the critical shear stress for erosion (τcrit) was calculated using Equation (2) and is shown in Table 3. The value of Psurface_cr for segment 2 under drained conditions was in the range of validity of Equation (2). The values of Psurface_cr for segments 1, 2, 4, and 5 under drained and saturated conditions were below the range of validity of Equation (2), while the values of Psurface_cr for segment 3 were above the range. Thus, the estimates of critical shear stress for erosion (τcrit) should be viewed with caution.
The results of the unsaturated direct shear tests are shown in Figure 6, where plots of shear stress versus normal stresses are shown for each segment. The results revealed that shear resistance was higher in ditch segments 1 and 3 than in segments 2, 4, and 5.
Shear strength parameters were obtained from the regression lines added to Figure 6 for each segment, where the intercept of the regression line with the vertical axis (shear stress) is the total cohesion and the slope of the regression line is the angle of friction (see Equation (4)). The resulting parameters are shown in Table 4. It was found that the cohesion values for segments 1 and 3 were different from the cohesion values for segments 2, 3, and 5 (p < 0.1), whereas the values of the angle of friction were similar for all segments. Ditch segments 1 and 3 had higher total cohesion than segments 2, 3, and 5.
The root densities in soil samples from all ditch segments are shown in Table 4. The average root densities were higher for ditch segments 1 and 3 than for segments 2, 4, and 5. However, it is important to note that, although as much care as possible was taken while gently washing the roots from the soil, some very fine roots might have been washed out along with the soil and water. In addition, although care was taken to trim the samples to the same volume, during the process some small stones or some very coarse roots created small holes in the samples, causing the volume to vary between samples. With these considerations, the estimated root densities in Table 4 are only a rough indication, rather than precise density measurements.
Considering that the soil in all ditch segments studied was in the same textural class (silty clay loam) and taking root density as the only difference, the results were divided into two groups: vegetated (segments 1 and 3) and non-vegetated (segments 2, 4, and 5). The values of cohesion and angle of friction in Table 4 were averaged accordingly, and the results are shown in Table 5.
Using the parameters in Table 5 and the geometry scenarios shown in Figure 3, stability analysis was performed, and FoS values were obtained. For the stability analysis, a specific weight of soil of 20 kN/m3 was used. The results of the stability analysis are shown in Table 6, where values below 1 indicate unstable surface and values above 1 stable surface.
The results showed that a simple flattening of the surface, i.e., going from a slope of 1:0.25 to 1:0.5, increased the stability of the surface, converting an unstable scenario (FoS = 0.9 without any vegetation) into a marginally stable situation (FoS = 1.12 without any vegetation) (Table 6). The vegetation that is almost always present in the areas surrounding drainage ditches increased the stability of ditch surfaces slightly further (e.g., for a root depth of 0.1 m and 1:0.5 slope, FoS increased from 1.12 to 1.14) (Table 6). Presence of vegetation on the bank surface added to the effect of surface flattening, considerably increasing the stability of the bank (e.g., for a root depth of 0.1 m, on increasing the slope from 1:0.25 to 1:0.5 (flattening) and with vegetation present on the bank surface, the scenario went from a unstable case of FoS = 0.9 to stable at FoS = 1.34 (49% increment)). The overall stabilizing effect of the added cohesion by roots in the soil agrees with results published in the literature, particularly as regards bank stabilization [17,36]. In addition, the results showed that a change in slope from 1:0.25 to 1:1 (a reduction in slope angle) and promoting the presence of vegetation on the bank surface (non-maintained segment) changed the scenario from an unstable case of FoS = 0.9 to stable at FoS = 2.05. This highlights the problematic nature of ditch management, which must balance the need to maintain ditch capacity for flow against the need to keep ditch banks stable, while minimizing the maintenance costs.
Table 7 compares the estimated shear stresses caused by flowing water obtained for the different slopes and Manning’s coefficient values with the range of critical shear stress (τcrit) values obtained with the CSM for the different segments and different moisture conditions (see Table 3). The critical shear stresses obtained using Equation (7) varied slightly with the slope magnitude, with the lowest τbank values obtained for the 1:1 slope and the highest values for the 1:0.25 slope (Table 7).
The estimated hydraulic shear stresses acting on the banks were higher than the estimated critical shear stress for erosion for the non-vegetated (maintained) and vegetated segments (Table 7). However, the non-maintained segment 3 had an estimated critical shear stress that was close to the acting shear stress caused by moving water (16.1 Pa). This suggests that the presence of vegetation is likely to protect the soil against erosion, which generally agrees with findings elsewhere [37,38]. Finally, the values for hydraulic shear stress were based on year-average flow (2.5 m3/s), and are likely to increase during the period of high flow. In such conditions, vegetated segments would be better prepared to resist the increased hydraulic shear stresses than bare soil.

4. Conclusions

Cohesive strength meter tests showed that ditch bank soils from which the vegetation had not been removed, and which thus had a higher density of roots, had higher resistance to detachment. Measurements of the shear resistance of soil in ditches with and without the vegetation removed showed that the presence of roots increased soil shear resistance. Simplified slope stability analysis showed that a combination of reducing the slope of the bank and promoting development of vegetation on the bank surface stabilized the ditch bank, in some cases transforming an unstable situation into a stable situation. This creates a conflict as regards remediation needs because reducing the slope of the channel will use more agricultural land, likely increasing the cost of maintenance, but will increase the stability of the ditch surfaces to mass movement, which is more costly to rectify.
Maintaining vegetation on drainage ditches was shown to be beneficial for protecting the banks against soil erosion. Again, this creates challenges in choice of management practice, as different interventions will result in different patterns of vegetation being present in ditches throughout the seasons. The most favorable management approach would be to allow vegetation to establish before high flow occurs in the ditches, in order to protect ditch bank surfaces from the increased hydraulic shear stresses that accompany high flow and high discharge, and reduce the risk of erosion.

Author Contributions

Data curation, A.J.; conceptualization, D.A. and A.J.; methodology, D.A., I.W. and A.J.; resources, I.W. and A.J.; software, D.A.; validation, D.A., I.W. and A.J.; formal analysis, D.A. and A.J.; investigation, D.A.; writing—original draft preparation, D.A.; writing—review and editing, A.J. and I.W.; supervision, A.J. All authors have read and agreed to the published version of the manuscript.

Funding

This research was funded by the Swedish International Development Cooperation Agency (SIDA), SIDA contribution number 75000554 and 75000554-09.

Acknowledgments

The authors would like to thank Mary McAfee for valuable suggestions and English corrections.

Conflicts of Interest

The authors declare no conflict of interest. The funders had no role in the design of the study; in the collection, analyses, or interpretation of data; in the writing of the manuscript; or in the decision to publish the results.

References

  1. Dotterweich, M. The history of human-induced soil erosion: Geomorphic legacies, early descriptions and research, and the development of soil conservation-A global synopsis. Geomorphology 2013, 201, 1–34. [Google Scholar] [CrossRef]
  2. Montgomery, D.R. Soil erosion and agricultural sustainability. Proc. Natl. Acad. Sci. USA 2007, 104, 13268–13272. [Google Scholar] [CrossRef] [PubMed] [Green Version]
  3. Szilassi, P.; Jordan, G.; van Rompaey, A.; Csillag, G. Impacts of historical land use changes on erosion and agricultural soil properties in the Kali Basin at Lake Balaton, Hungary. Catena 2006, 68, 96–108. [Google Scholar] [CrossRef]
  4. Lal, R. Soil erosion and the global carbon budget. Environ. Int. 2003, 29, 437–450. [Google Scholar] [CrossRef]
  5. Lal, R. Soil degradation by erosion. Land Degrad. Dev. 2001, 12, 519–539. [Google Scholar] [CrossRef]
  6. Pimentel, D.; Burgess, M. Soil Erosion Threatens Food Production. Agriculture 2013, 3, 443–463. [Google Scholar] [CrossRef] [Green Version]
  7. Pimentel, D.; Allen, J.; Beers, A.; Guinand, L.; Linder, R.; McLaughlin, P.; Meer, B.; Musonda, D.; Perdue, D.; Poisson, S.; et al. World Agriculture and Soil Erosion. BioScience 1987, 37, 277–283. [Google Scholar] [CrossRef]
  8. Dollinger, J.; Dagès, C.; Bailly, J.-S.; Lagacherie, P.; Voltz, M. Managing ditches for agroecological engineering of landscape. A review. Agron. Sustain. Dev. 2015, 35, 999–1020. [Google Scholar] [CrossRef] [Green Version]
  9. Bos, M.; Boers, T.M. Land drainage: Why and how. Drain. Princ. Appl. 2006, 3, 23–32. [Google Scholar]
  10. Avilés, D. Soil Erosion and Mass Movement in Agricultural Drainage Ditches. Ph.D. Thesis, Swedish University of Agricultural Sciences, Uppsala, Sweden, 2020. [Google Scholar]
  11. Magner, J.A.; Hansen, B.J.; Anderson, C.; Wilson, B.N.; Nieber, J.L. Minnesota agricultural ditch reach assessment for stability (MADRAS): A decision support tool. In Proceedings of the 9th International Drainage Symposium Held Jointly with CIGR and CSBE/SCGAB Proceedings, Québec City Convention Centre, Quebec City, QC, Canada, 13–16 June 2010. [Google Scholar]
  12. Bull, L.J. Magnitude and variation in the contribution of bank erosion to the suspended sediment load of the River Severn, UK. Earth Surf. Process. Landf. 1997, 22, 1109–1123. [Google Scholar] [CrossRef]
  13. Bordoni, M.; Meisina, C.; Vercesi, A.; Bischetti, G.B.; Chiaradia, E.A.; Vergani, C.; Chersich, S.; Valentino, R.; Bittelli, M.; Comolli, R.; et al. Quantifying the contribution of grapevine roots to soil mechanical reinforcement in an area susceptible to shallow landslides. Soil Tillage Res. 2016, 163, 195–206. [Google Scholar] [CrossRef]
  14. Fan, C.C.; Su, C.F. Role of roots in the shear strength of root-reinforced soils with high moisture content. Ecol. Eng. 2008, 33, 157–166. [Google Scholar] [CrossRef]
  15. Li, Y.; Wang, Y.; Ma, C.; Zhang, H.; Wang, Y.; Song, S.; Zhu, J. Influence of the spatial layout of plant roots on slope stability. Ecol. Eng. 2016, 91, 477–486. [Google Scholar] [CrossRef]
  16. Comino, E.; Marengo, P.; Rolli, V. Root reinforcement effect of different grass species: A comparison between experimental and models results. Soil Tillage Res. 2010, 110, 60–68. [Google Scholar] [CrossRef]
  17. Chok, Y.; Jaksa, M.; Kaggwa, W.; Griffiths, D. Assessing the influence of root reinforcement on slope stability by finite elements. Int. J. Geo Eng. 2015, 6, 1–13. [Google Scholar] [CrossRef] [Green Version]
  18. Curran, J.C.; Hession, W.C. Vegetative impacts on hydraulics and sediment processes across the fluvial system. J. Hydrol. 2013, 505, 364–376. [Google Scholar] [CrossRef]
  19. Levavasseur, F. Time-varying impacts of different management regimes on vegetation cover in agricultural ditches. Agric. Water Manag. 2014, 140, 14–19. [Google Scholar] [CrossRef] [Green Version]
  20. Singh, H.V.; Thompson, A.M. Effect of antecedent soil moisture content on soil critical shear stress in agricultural watersheds. Geoderma 2016, 262, 165–173. [Google Scholar] [CrossRef]
  21. Lantbruksnämnden i Södermanlands län Kilaån: Förslag till rensningsplan för Kilaåns regleringsföretag av år 1919–1920, ritningsnummer 23:48. 1979.
  22. SMHI. Dataserier Med Normalvärden för Perioden 1961–1990. Available online: http://www.smhi.se/data/meteorologi/dataserier-med-normalvarden-1.7354 (accessed on 23 October 2020).
  23. Lantmäteriet. Vi Känner Till Varenda Plats I Sverige. Available online: https://www.lantmateriet.se/ (accessed on 29 October 2020).
  24. Eshel, G.; Levy, G.J.; Mingelgrin, U.; Singer, M.J. Critical evaluation of the use of laser diffraction for particle-size distribution analysis. Soil Sci. Soc. Am. J. 2004, 68, 736–743. [Google Scholar] [CrossRef]
  25. Avilés, D.; Berglund, K.; Wesström, I.; Joel, A. Effect of liming products on soil detachment resistance, measured with a cohesive strength meter. Acta Agric. Scand. Sect. B Soil Plant Sci. 2020, 70, 48–55. [Google Scholar] [CrossRef]
  26. Avilés, D.; Wesström, I.; Joel, A. Status assessment of agricultural drainage ditches. Trans. ASABE 2018, 61, 263–271. [Google Scholar] [CrossRef] [Green Version]
  27. Tolhurst, T.J.; Black, K.S.; Shayler, S.A.; Mather, S.; Black, I.; Baker, K.; Paterson, D.M. Measuring the in situ erosion shear stress of intertidal sediments with the cohesive strength meter (CSM). Estuar. Coast. Shelf Sci. 1999, 49, 281–294. [Google Scholar] [CrossRef]
  28. Vardy, S.; Saunders, J.E.; Tolhurst, T.J.; Davies, P.A.; Paterson, D.M. Calibration of the high-pressure cohesive strength meter (CSM). Cont. Shelf Res. 2007, 27, 1190–1199. [Google Scholar] [CrossRef]
  29. Grabowski, R.C.; Droppo, I.G.; Wharton, G. Estimation of critical shear stress from cohesive strength meterderived erosion thresholds. Limnol. Oceanogr. Methods 2010, 8, 678–685. [Google Scholar]
  30. Griffiths, D.; Lane, P. Slope stability analysis by finite elements. Geotechnique 1999, 49, 387–403. [Google Scholar] [CrossRef]
  31. Smith, I.M.; Griffiths, D.V.; Margetts, L. Programming the Finite Element Method, 5th ed.; John Wiley & Sons: The Atrium, UK; Southern Gate, UK; Chichester, UK; West Sussex, UK, 2013. [Google Scholar]
  32. Lane, E.W. Design of stable channels. Trans. Am. Soc. Civ. Eng. 1955, 120, 1234–1260. [Google Scholar]
  33. SMHI. Om Data i Vattenwebb. Available online: https://www.smhi.se/data/hydrologi/vattenwebb/om-data-i-vattenwebb (accessed on 29 October 2020).
  34. U.S. Army Corps of Engineers Table 3-1 Manning’s “n” values. In HEC-RAS River Analysis System Hydraulic Reference Manual. Version 5.0; Hydrologic Engineering Center Davis: Davis, CA, USA, 2016; pp. 3–14, 3–16.
  35. NRCS Soils. Soil Texture Calculator. Available online: https://www.nrcs.usda.gov/wps/portal/nrcs/detail/soils/survey/?cid=nrcs142p2_054167 (accessed on 23 October 2020).
  36. Pollen, N. Temporal and spatial variability in root reinforcement of streambanks: Accounting for soil shear strength and moisture. Catena 2007, 69, 197–205. [Google Scholar] [CrossRef]
  37. Baets, S.D.; Poesen, J.; Gyssels, G.; Knapen, A. Effects of grass roots on the erodibility of topsoils during concentrated flow. Geomorphology 2006, 76, 54–67. [Google Scholar] [CrossRef]
  38. Pollen-Bankhead, N.; Simon, A.; Thomas, R.E. The Reinforcement of Soil by Roots: Recent Advances and Directions for Future Research. Treatise Geomorphol. 2013, 12, 107–124. [Google Scholar]
Figure 1. Location of the study site in Sweden and of ditch segments examined in this study. Each point (1–5) represents the approximate mid-point of each of the five 10–15 m long segments investigated. Elevation data from ©Lantmäteriet [23].
Land 09 00441 g001
Figure 2. (Images 1–5) The five ditch segments surveyed. Segments 1 and 3 seemed to be stable and were vegetated, whereas segments 2, 4, and 5 had had their vegetation removed and/or cross-section modified during recent maintenance work. (Bottom right) Soil sampling locations on the ditch bank.
Land 09 00441 g002
Figure 3. Geometry of the bank slope used in slope stability analysis, where h refers to the depth of the soil with high root density and s is the slope (drawing not to scale).
Land 09 00441 g003
Figure 4. Year-average water discharge for Kilaån ditch. Data from Sweden’s Meteorological and Hydrological Institute (SMHI) [33].
Land 09 00441 g004
Figure 5. Light transmittance values as a function of internal CSM pressure (Pi). The vertical lines in the graphs indicate standard deviation and the dots are average light transmittance values (n = 3). The red lines at 90% transmittance represent the threshold for initiation of erosion.
Land 09 00441 g005
Figure 6. Shear strength of soil in ditch segments 1–5 obtained from the unsaturated direct shear tests. The vertical lines in the graphs indicate standard deviation, and the dots are average shear stress values (n = 3).
Land 09 00441 g006
Table 1. Specification of the Fine 1 cohesive strength meter (CSM) routine (Partrac, 2011).
DescriptionFine 1
Jet duration (s)1.0
Data logged for (s)3.0
Data logged every (s)0.1
Starting pressure * (kPa)0.7
Pressure increment (kPa)0.7
Up to (kPa)16.5
Then from (kPa)18.6
Increasing by (kPa)2.1
Up to (kPa)41.4
Then from (kPa)55.1
Increasing by (kPa)13.7
Up to (kPa)413.7
* All pressures refer to Pi, the pressure used to fire each water jet.
Table 2. Soil texture fractions (per cent by weight) determined using an ultrasonic particle analyzer. The values are mean ± standard deviation (n = 3).
SegmentFine ClayCoarse ClaySiltSand
(<0.2 µm)(0.2–2 µm)(2–20 µm)(20–2000 µm)
14.4 ± 0.122.2 ± 0.361.2 ± 0.812.2 ± 0.5
26.3 ± 0.421.2 ± 1.663.2 ± 1.69.3 ± 0.7
35.2 ± 0.922.2 ± 0.364.2 ± 1.88.4 ± 2.9
44.1 ± 0.321.7 ± 0.863.4 ± 2.610.8 ± 1.5
56.4 ± 2.625.2 ± 1.553.3 ± 5.215.1 ± 1.5
Table 3. Average (n = 3) cohesive strength meter (CSM) pressures for initiation of scour (Pi_cr), average (n = 3) transmission values (T), equivalent pressure at the surface (Psurface_cr), and estimated critical shear stress for erosion (τcrit) obtained from Equation (2) for ditch segments 1–5.
Pi_cr (kPa)T (%)Psurface_cr (Pa)τcrit (Pa)
SegmentDrainedSaturatedDrainedSaturatedDrainedSaturatedDrainedSaturated
12.752.7587.38913.6913.690.220.22
210.342.7589.984.954.4913.690.760.22
3248.2135.1689.389.91236.08175.0916.112.32
41.381.3889.988.66.876.870.140.14
52.071.3885.689.810.36.870.180.14
Table 4. Shear strength parameters and root densities obtained for ditch segments 1–5.
SegmentTotal Cohesion, cT (kPa)Slope/ϕ’Root Density (kg/m3)Vegetation Status
111.50.74/36.5°17.4 ± 3.4Present
23.30.71/35.4°2.5 * ± 1.3Removed
317.20.73/36.1°12 ±2.2Present
43.70.61/31.4°2.2 * ± 1.0Removed
53.20.69/34.6°1.8 ± 0.9Removed
Root density values are averages ± standard deviation (n = 12). * An outlier was removed prior to calculation of the mean and standard deviation.
Table 5. Average values of strength parameters used for slope stability analysis.
Soil StatusTotal Cohesion (cT) (kPa)Angle of Friction (ϕ’)
Vegetated14.336.3°
Non-vegetated3.433.8°
Table 6. Values of factor of safety (FoS) for the three ditch bank slopes and two depths of root region considered.
FoS
Scenario *Depth of Root Region (h) [m]1:0.25Slope (V:H)
1:0.5
1:1
Entire cross-section with soil with low root density-0.901.121.56
Top of the slope with soil with high root density0.10.931.141.60
Top and slope with soil with high root density1.121.341.63
Top of the slope with soil with high root density0.61.171.411.88
Top and slope with soil with high root density 1.731.842.05
* For the geometry of scenarios 1 and 2, see Figure 3.
Table 7. Range of critical shear stress for erosion, τcrit, obtained with the cohesive strength meter (CSM) and estimated range of the hydraulic shear stresses acting on the banks, τbank, obtained using Equation (7).
Segment Statusτcrit (Pa)τbank (Pa)
Non-vegetated (segments 2, 4, 5)0.14–2.2211.1–11.4
Vegetated (segments 1 and 3)0.22–16.1116.1–16.7
Publisher’s Note: MDPI stays neutral with regard to jurisdictional claims in published maps and institutional affiliations.

