Re-Evaluating the Climate Factor in Agricultural Land Assessment in a Changing Climate—Saskatchewan, Canada

Abstract
1. Introduction
2. Materials and Methods
2.1. Soil Data
2.2. Weather Data
2.3. Crop Yield Data
2.4. Relationship of Wheat Yield to Climate
2.5. Climate Projections of Precipitation and Temperature Variables
3. Results
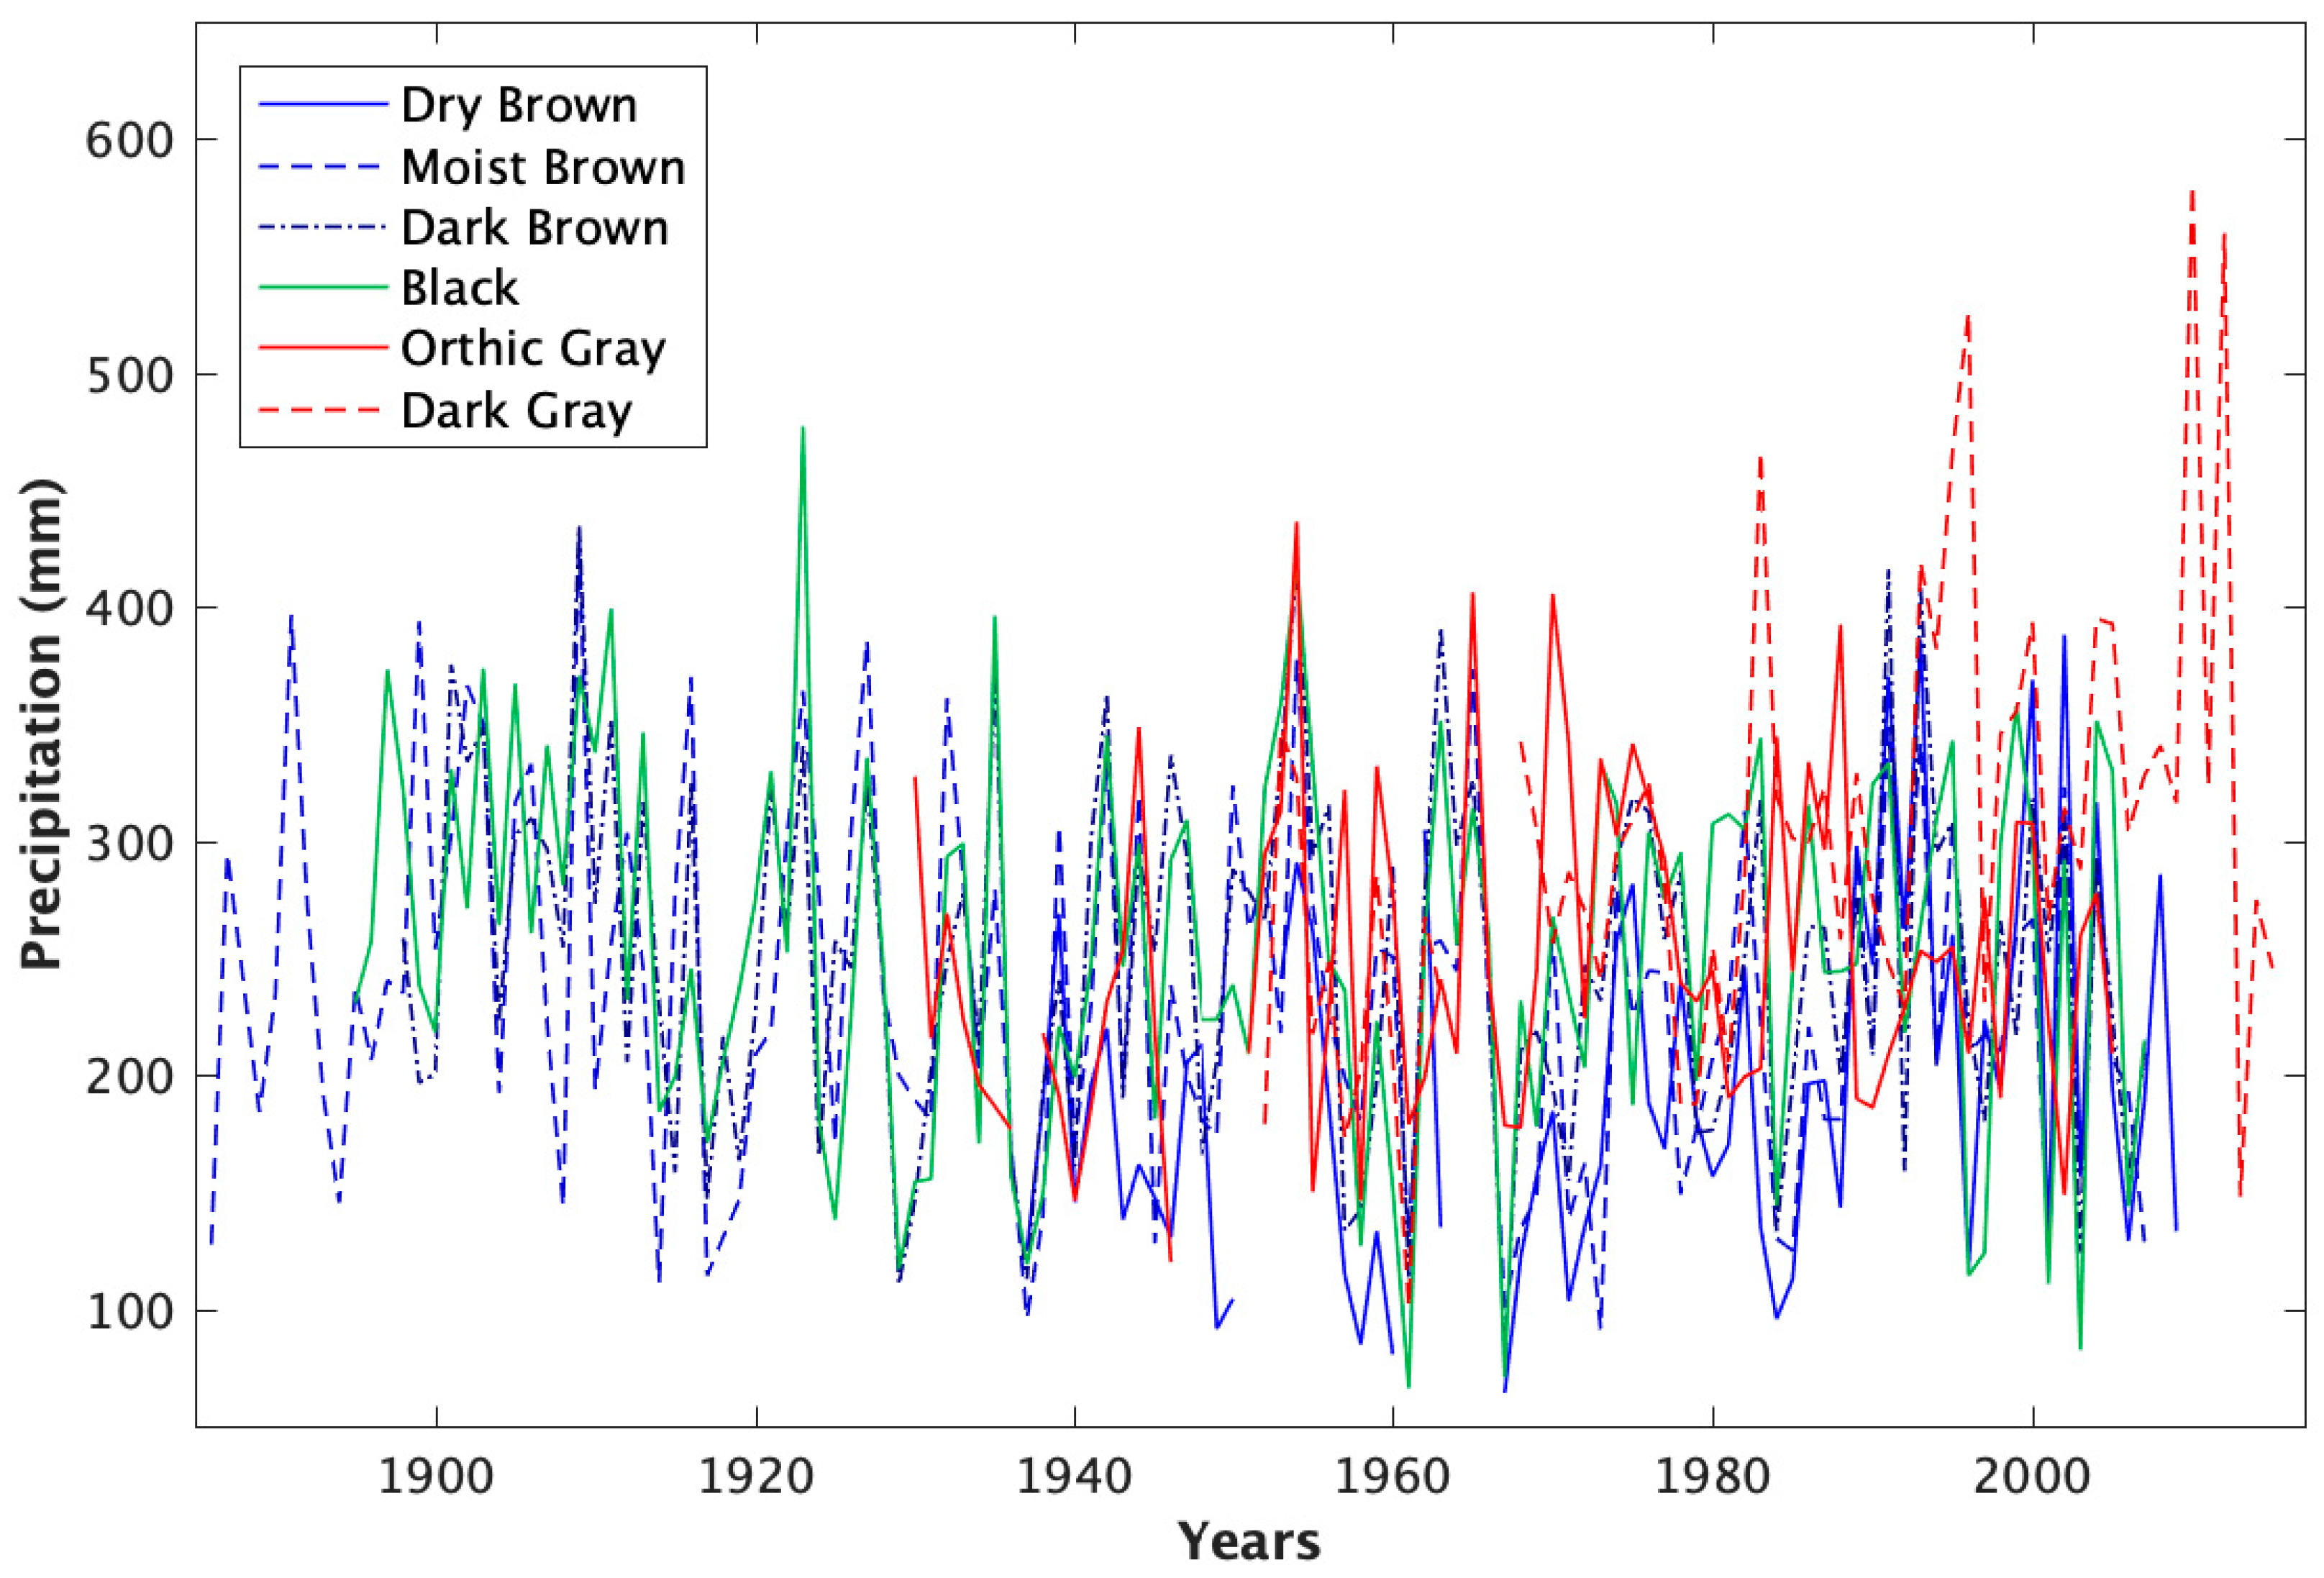
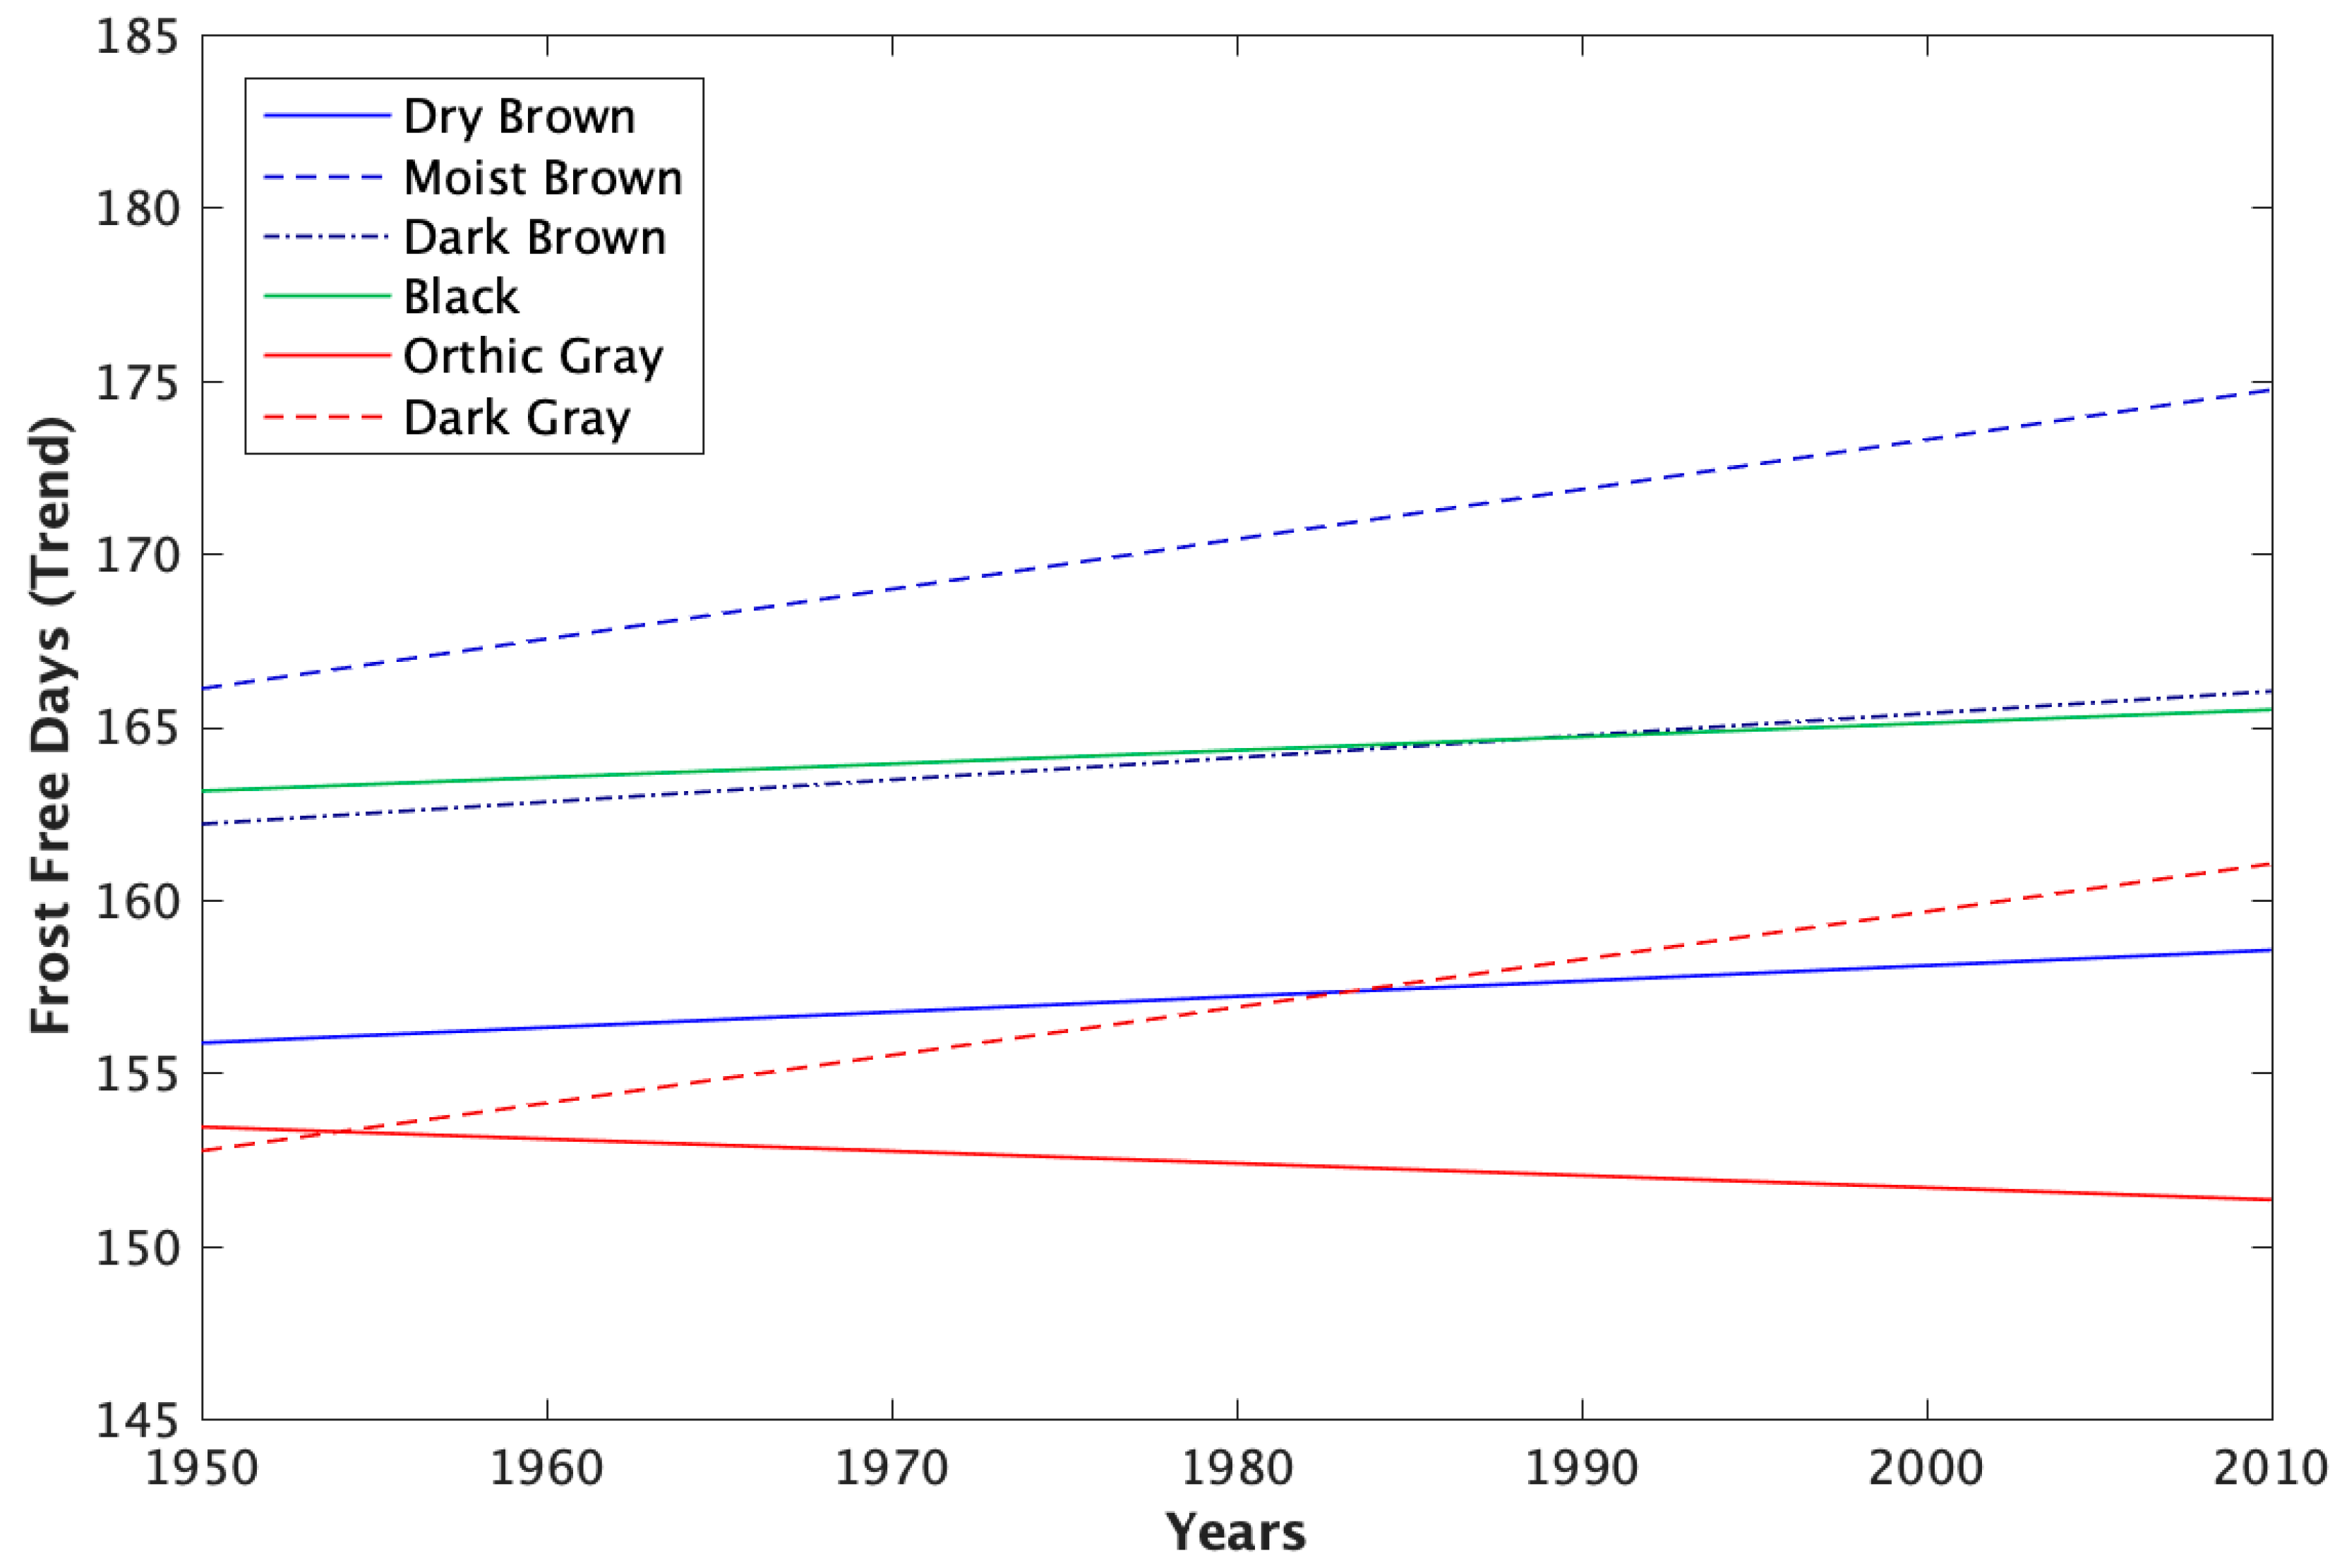
3.1. Climate Data
3.2. Wheat Yield
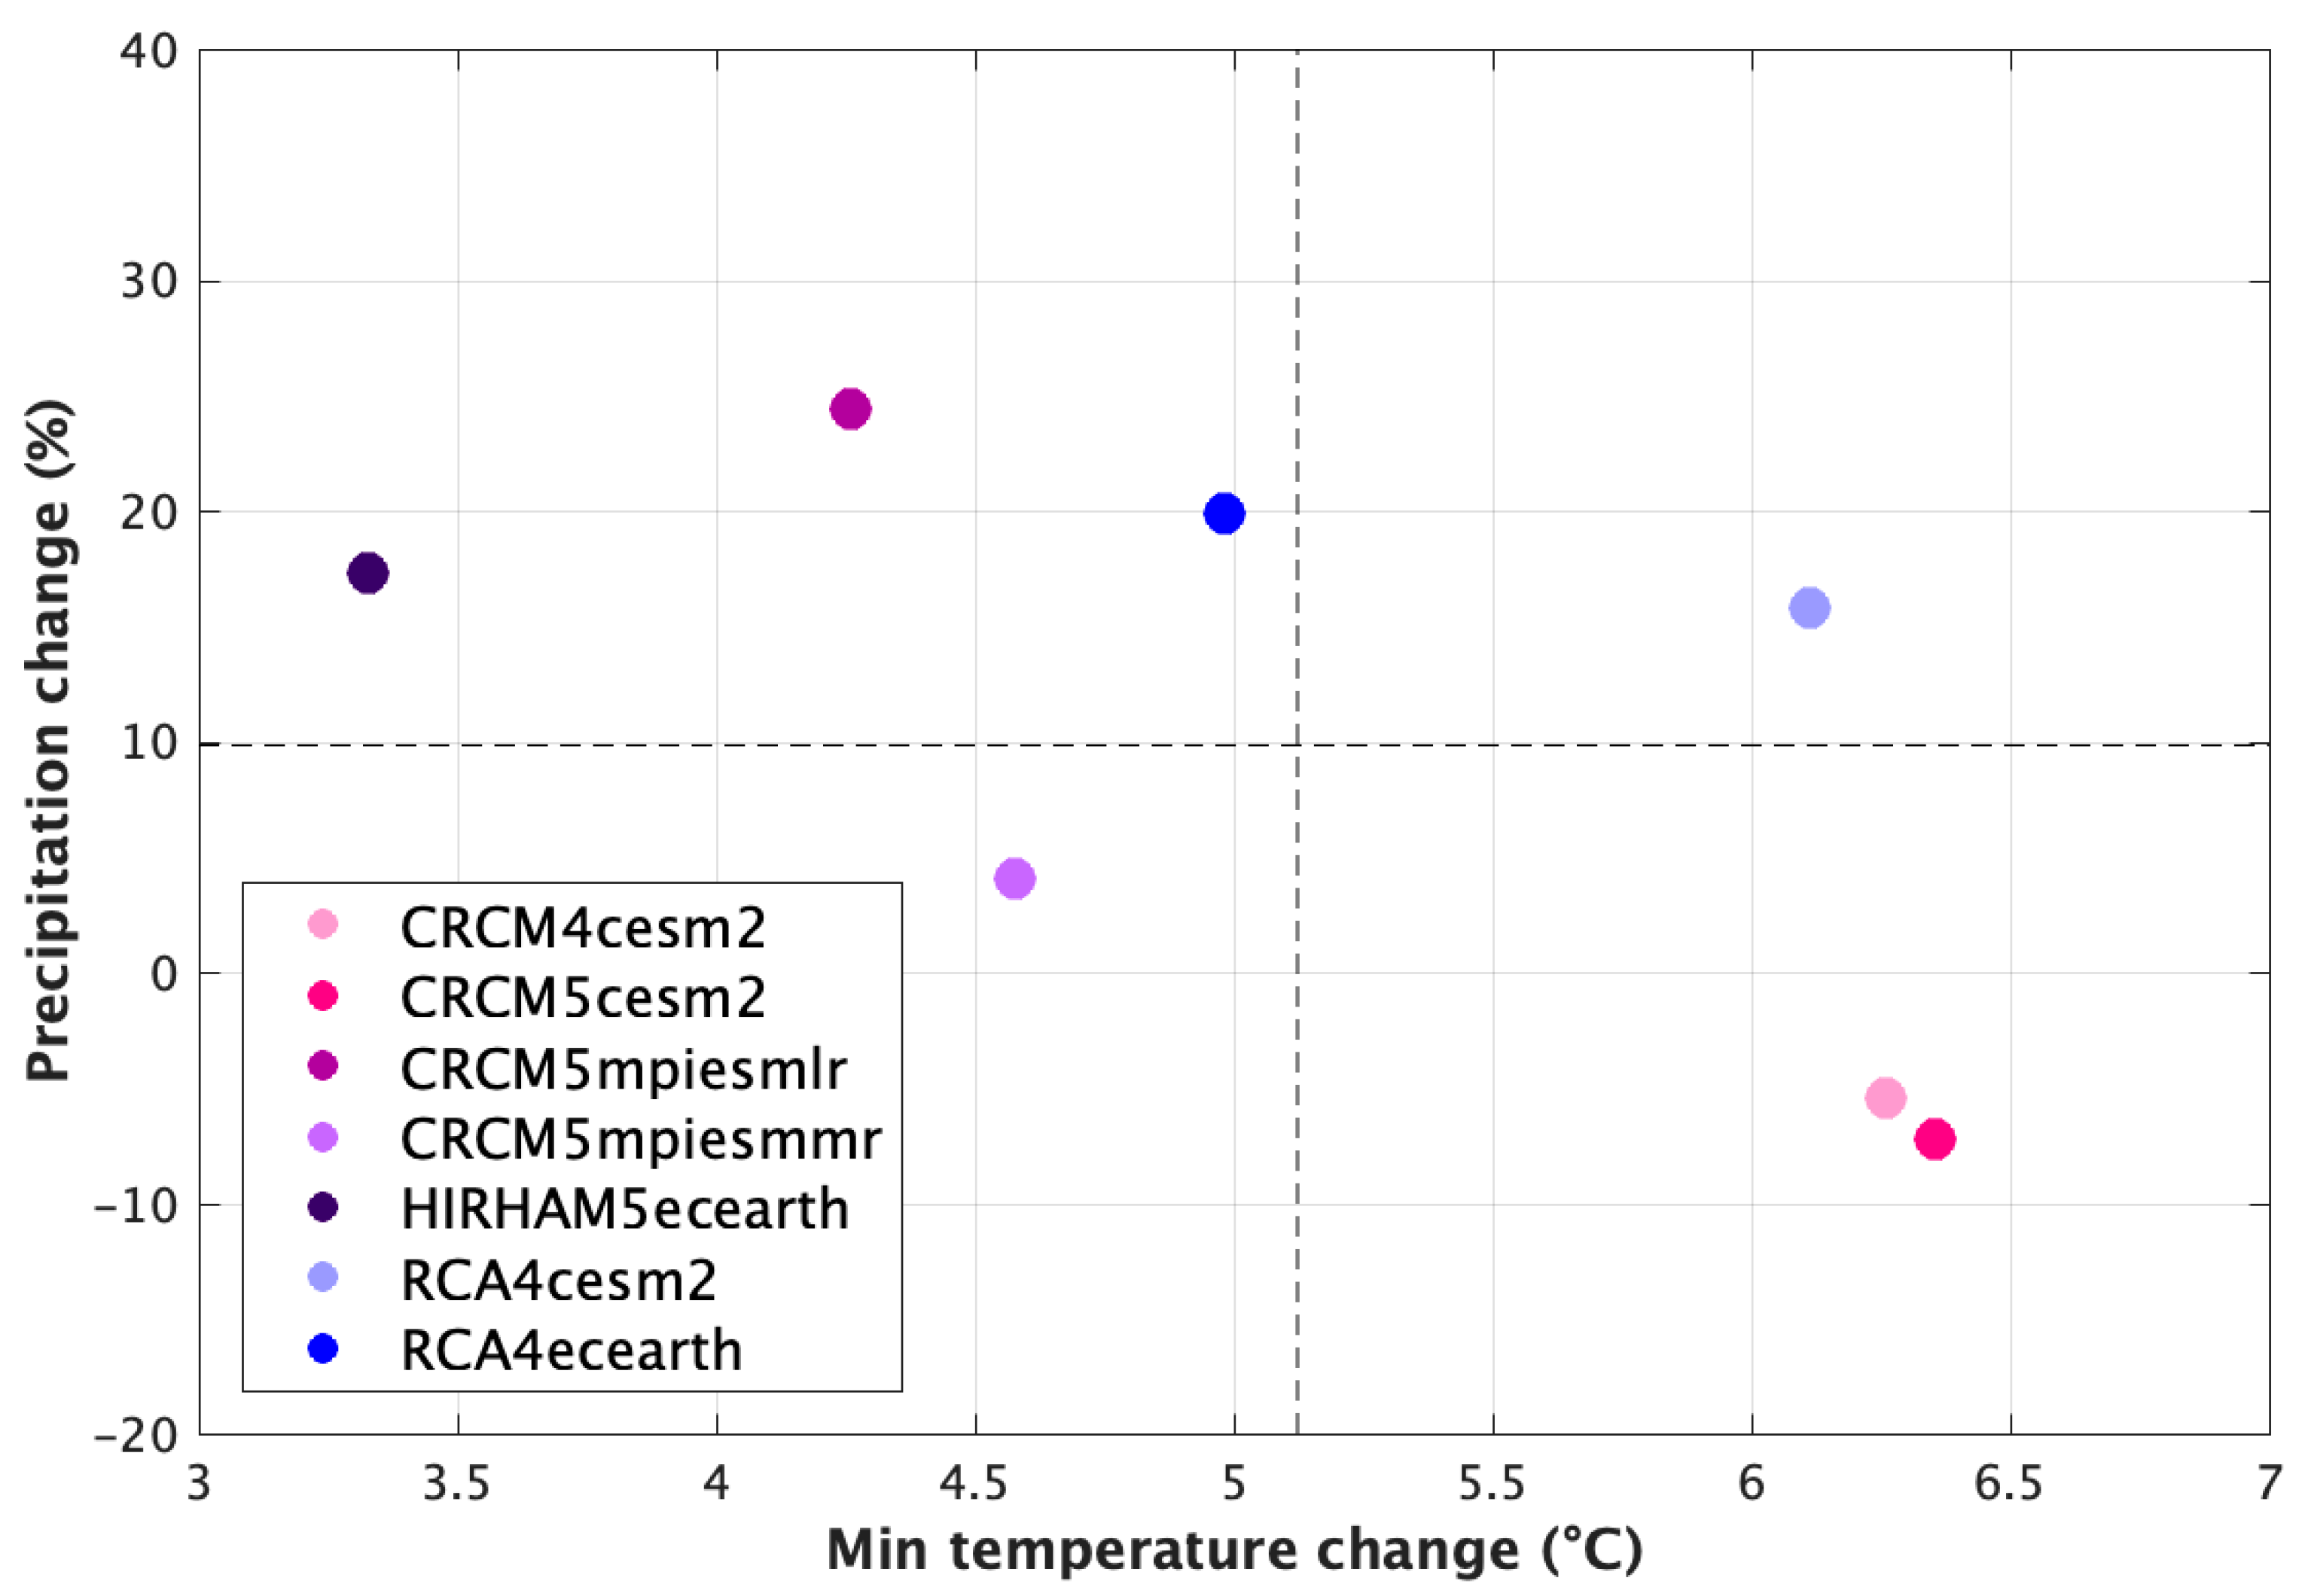
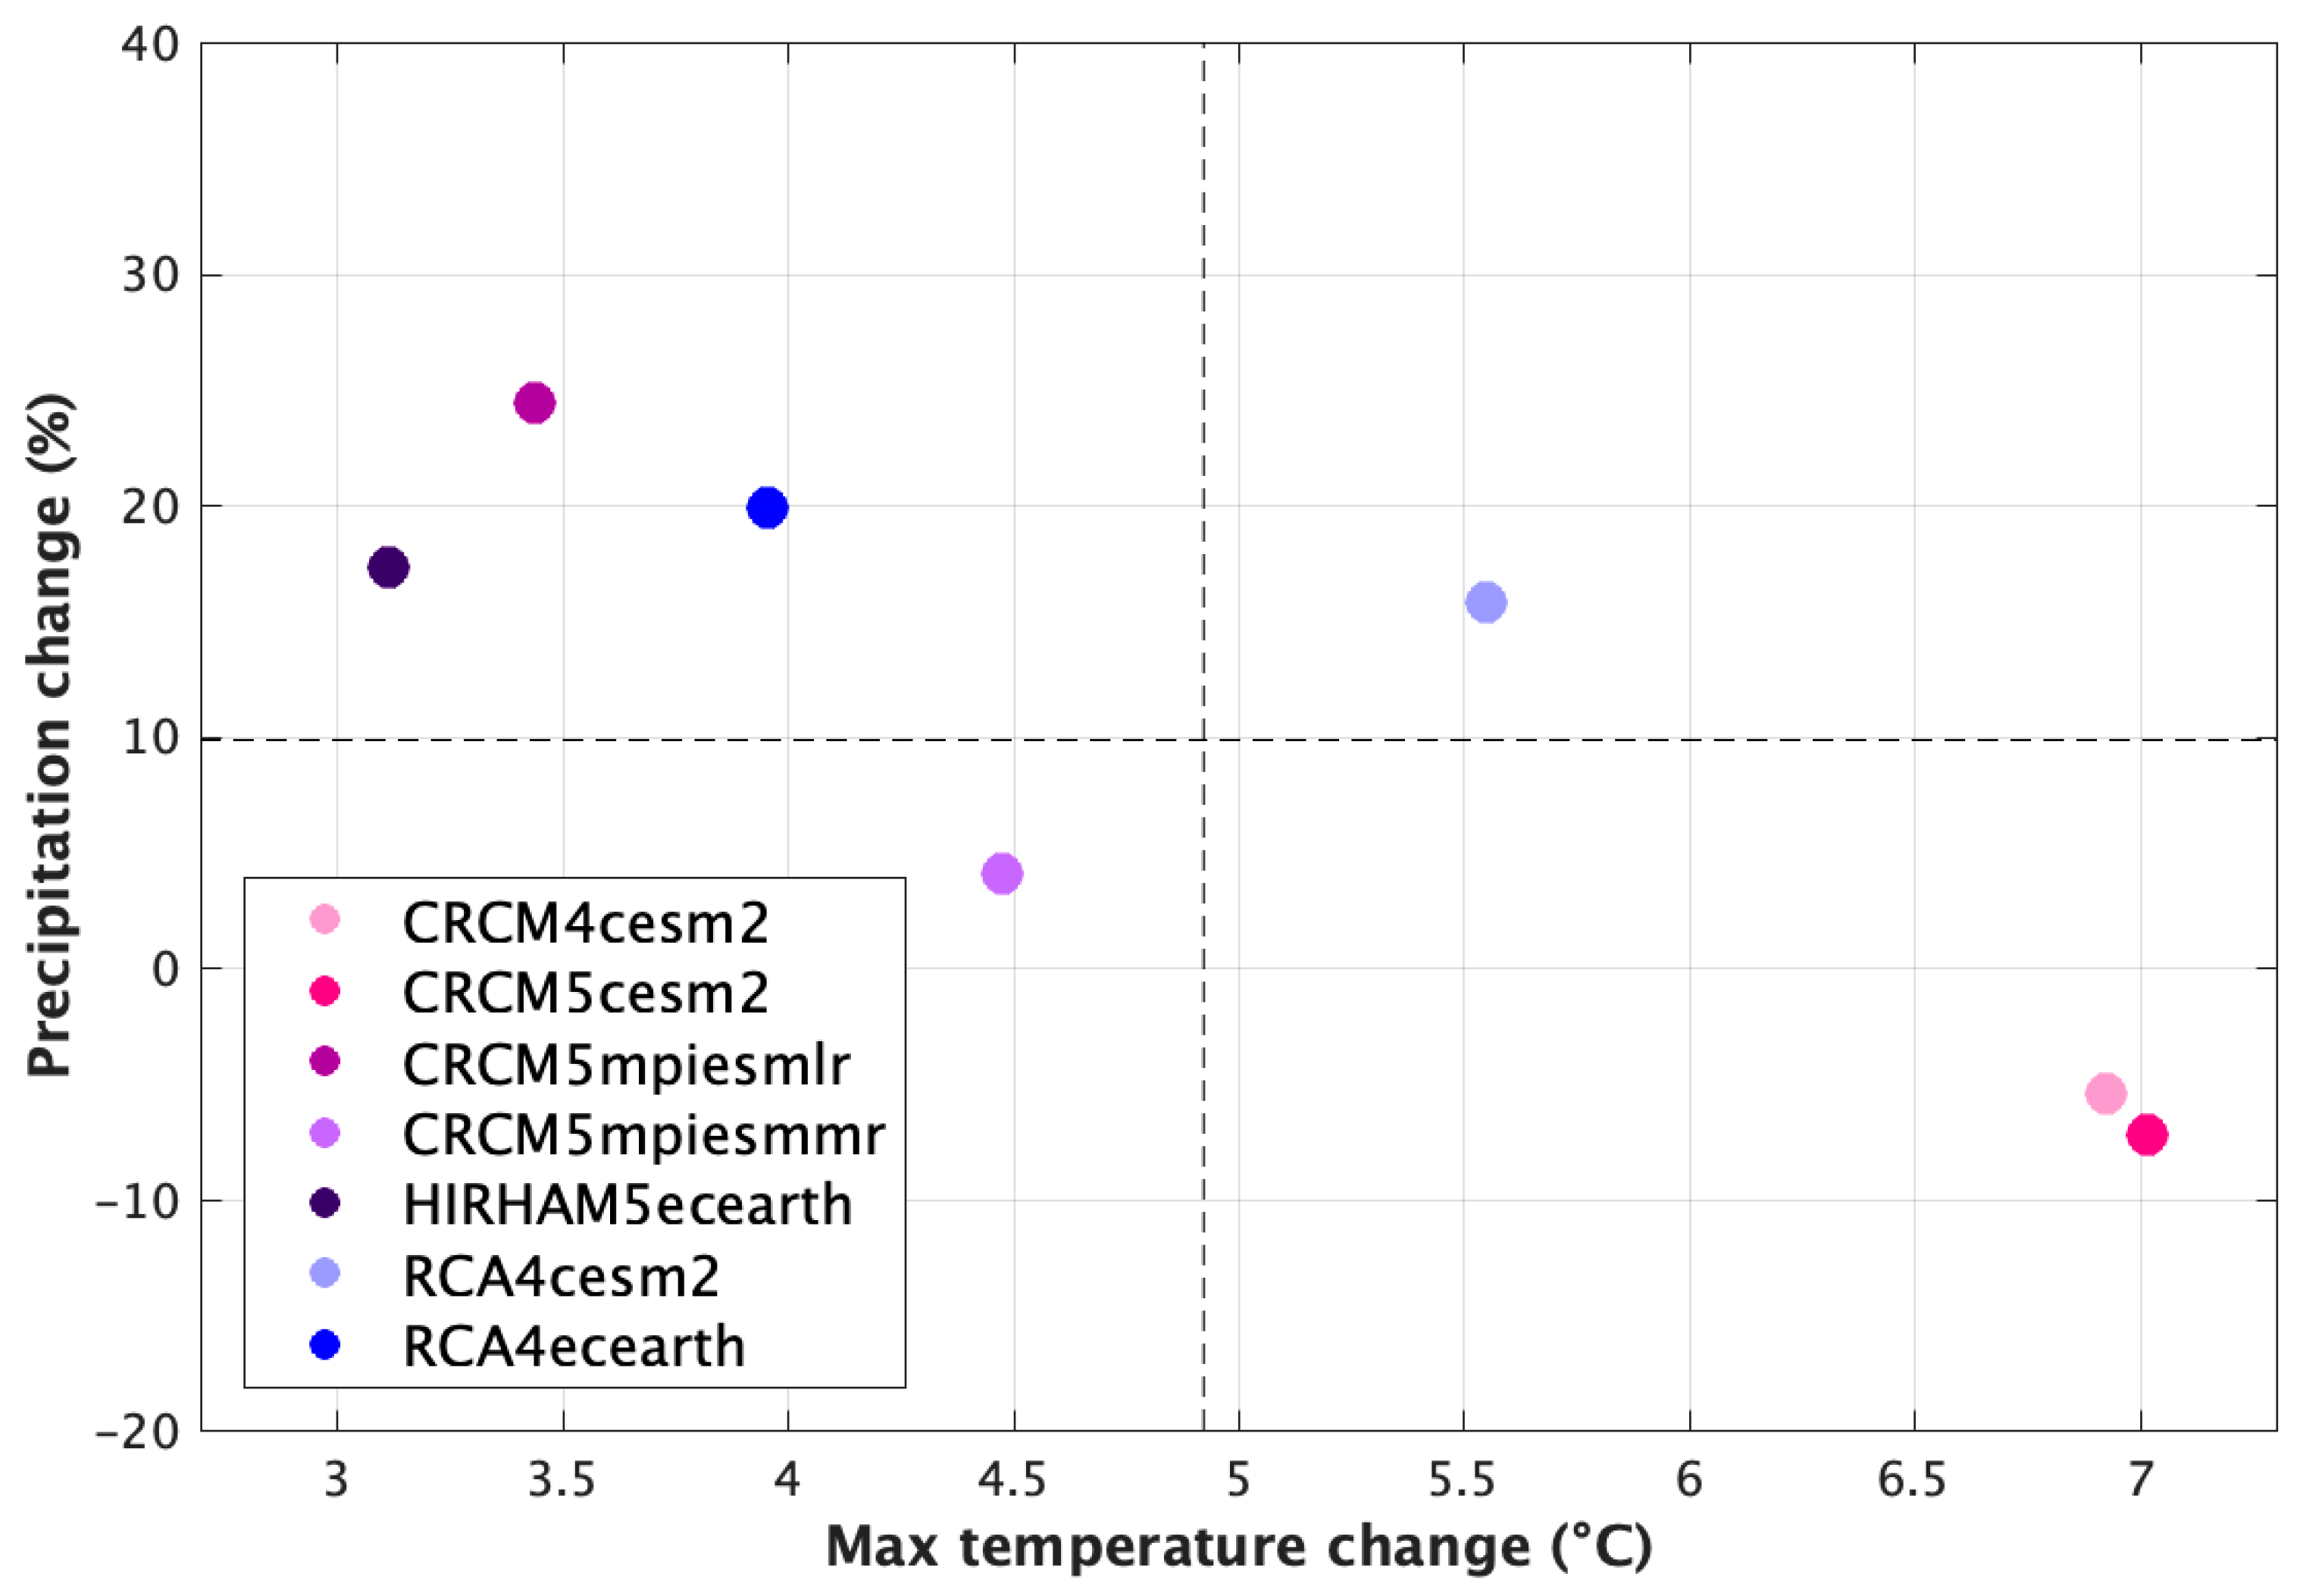
3.3. Climate Projections
4. Discussion
5. Conclusions
Author Contributions
Funding
Acknowledgments
Conflicts of Interest
References
- Statistics Canada. Total Area of Farms and Use of Farm Land, Historical Data. 2016. Available online: https://www150.statcan.gc.ca/t1/tbl1/en/tv.action?pid=3210015301&pickMembers%5B0%5D=1.9&pickMembers%5B1%5D=3.2 (accessed on 15 January 2019).
- Saskatchewan Trade & Export Partnership. State of Trade Report. 2017. Available online: https://www.sasktrade.com/public/uploads/Exporter%20Resources/Saskatchewan%20State%20of%20Trade%202017.pdf (accessed on 15 January 2019).
- Wheaton, E.; Kulshreshtha, S. Agriculture. In The New Normal: The Canadian Prairies in a Changing Climate; Sauchyn, D.J., Diaz, H., Kulshreshtha, S., Eds.; CPRC Press: Regina, SK, Canada, 2010; Chapter 7. [Google Scholar]
- Bradshaw, B.; Dolan, H.; Smit, B. Farm-Level Adaptation to Climatic Variability and Change: Crop Diversification in the Canadian Prairies. Clim. Chang. 2004, 67, 119–141. [Google Scholar] [CrossRef]
- Campbell, I.D.; Durant, D.G.; Hunter, K.L.; Hyatt, K.D. Food Production. In Canada in a Changing Climate: Sector Perspectives on Impacts and Adaptation; Warren, F.J., Lemmen, D.S., Eds.; Government of Canada: Ottawa, ON, Canada, 2014; pp. 99–134. [Google Scholar]
- Chipanshi, A.; Zhang, Y.; Kouadio, L.; Newlands, N.; Davidson, A.; Hill, H.; Warren, R.; Qian, B.; Daneshfar, B.; Bedard, F.; et al. Evaluation of the Integrated Canadian Crop Yield Forecaster (ICCYF) model for in-season prediction of crop yield across the Canadian agricultural landscape. Agric. For. Meteorol. 2015, 206, 137–150. [Google Scholar] [CrossRef]
- Poudel, S. Economic Impacts of Climate Change and Weather Extremes on Canadian Prairie Mixed Farms. Ph.D. Thesis, Department of Bio-Resource Policy, University of Saskatchewan, Saskatoon, SK, Canada, January 2016. [Google Scholar]
- Qian, B.; Gameda, S.; Zhang, X.; De Jong, R. Changing growing season observed in Canada. Clim. Chang. 2012, 112, 339–353. [Google Scholar] [CrossRef]
- Bonsal, B.; Cuell, C.; Wheaton, E.; Sauchyn, D.; Barrow, E. An assessment of historical and projected future hydro-climatic variability and extremes over southern watersheds in the Canadian Prairies. Int. J. Climatol. 2017, 37, 3934–3948. [Google Scholar] [CrossRef]
- Wheaton, E.; Sauchyn, D.; Bonsal, B. Future Possible Droughts. In Vulnerability and Adaptation to Drought: The Canadian Prairies and South America; Diaz, H., Hurlbert, M., Warren, J., Eds.; University of Calgary Press: Calgary, AB, Canada, 2016; Chapter 3; 387p. [Google Scholar]
- Herrington, R.; Johnson, B.; Hunter, F. Responding to Global Climate Change in the Prairies. In Canada Country Study: Climate Impacts and Adaptations; Environment Canada: Ottawa, ON, Canada, 1997; Volume 3, 270p. [Google Scholar]
- Kharin, V.V.; Zwiers, F.W.; Zhang, X.; Hegerl, G.C. Changes in Temperature and Precipitation Extremes in the IPCC ensemble of Global Couple Model Simulations. J. Clim. 2007, 20, 1419–1444. [Google Scholar] [CrossRef]
- Weber, M.; Hauer, G. A Regional Analysis of Climate Change Impacts on Canadian Agriculture. Can. Public Pol. 2003, 29, 163–180. [Google Scholar] [CrossRef]
- Qian, B.; De Jong, R.; Warren, R.; Chipanshi, A.; Hill, H. Statistical spring wheat yield forecasting for the Canadian Prairie Provinces. Agric. For. Meteorol. 2009, 149, 1022–1031. [Google Scholar] [CrossRef]
- Saskatchewan Assessment Management Agency (SAMA). Methods of Assessment. 2018. Available online: https://www.sama.sk.ca/property-owner-services/understanding-assessment/methods-assessment (accessed on 20 December 2018).
- Sauchyn, D. Prairie Climate Trends and Variability. In The New Normal: The Canadian Prairies in a Changing Climate; Sauchyn, D.J., Diaz, H., Kulshreshtha, S., Eds.; CPRC Press: Regina, SK, Canada, 2010; Chapter 3. [Google Scholar]
- Sauchyn, D.J.; Xongchao, Y. Evaluation of the Climatic Factor in Rural Land Assessment; Final Report to the Saskatchewan Assessment and Management Agency; Report; University of Regina: Saskatchewan, SK, Canada, 1990; p. 91. [Google Scholar]
- Lobel, D.B.; Schlenker, W.; Costa-Roberts, J. Climate trends and global crop production since 1980. Science 2011, 333, 616–620. [Google Scholar] [CrossRef]
- Kutcher, H.R.; Warland, J.S.; Brandt, S.A. Temperature and precipitation effects on canola yields in Saskatchewan, Canada. Agric. For. Meteorol. 2010, 150, 160–165. [Google Scholar] [CrossRef]
- Lobell, D.B.; Burke, M.B. On the use of statistical models to predict crop yield responses to climate change. Agric. For. Meteorol. 2010, 150, 1443–1452. [Google Scholar] [CrossRef]
- Mkhabela, M.S.; Bullock, P.; Raj, S.; Wang, S.; Yang, Y. Crop yield forecasting on the Canadian Prairies using MODIS NDVI data. Agric. For. Meteorol. 2011, 151, 385–393. [Google Scholar] [CrossRef]
- He, Y.; Wei, Y.; DePauw, R.; Qian, B.; Lemke, R.; Singh, A.; Cuthbert, R.; McConkey, B.; Wang, H. Spring wheat yield in the semiarid Canadian prairies: Effects of precipitation timing and soil texture over recent 30 years. Field Crop Res. 2013, 149, 329–337. [Google Scholar] [CrossRef]
- Robertson, S.M.; Jeffrey, S.R.; Unterschultz, J.R.; Boxall, P.C. Estimating yield response to temperature and identifying critical temperatures for annual crops in the Canadian prairie region. Can. J. Plant Sci. 2013, 93, 1237–1247. [Google Scholar] [CrossRef]
- Meng, T.; Carew, R.; Florkowski, W.J.; Klepacka, A.M. Analyzing Temperature and Precipitation Influences on Yield Distributions of Canola and Spring Wheat in Saskatchewan. Bull. Am. Meteorol. 2017, 56, 897–913. [Google Scholar] [CrossRef]
- Adjusted and Homogenized Canadian Climate Data (AHCCD). 2017. Available online: http://ec.gc.ca/dccha-ahccd/default.asp?lang=En&n=B1F8423 (accessed on 5 November 2018).
- McKenney, D.W.; Hutchinson, M.F.; Papadopol, P.; Lawrence, K.; Pedlar, J.; Campbell, K.; Milewska, W.; Hopkinson, R.F.; Price, D.; Owen, T. Customized spatial climate models for North America. Bull. Am. Meteorol. 2011, 92, 1611–1622. [Google Scholar] [CrossRef]
- Newlands, N.K.; Davidson, A.; Howard, A.; Hill, H. Validation and inter-comparison of three methodologies for interpolating daily precipitation and temperature across Canada. Environmetrics 2011, 22, 205–223. [Google Scholar] [CrossRef]
- Quiring, S.M.; Papakryiakou, T.N. An evaluation of agricultural drought indices for the Canadian Prairies. Agric. For. Meteorol. 2003, 118, 49–62. [Google Scholar] [CrossRef]
- Campbell, C.A.; Selles, F.; Zentner, R.P.; McConkey, B.G.; Brandt, S.A.; McKenzie, R.C. Regression model for predicting yield of hard red spring wheat grown on stubble in the semiarid prairie. Can. J. Plant Sci. 1997, 77, 43–52. [Google Scholar] [CrossRef]
- Von Storch, H.; Zwiers, F.W. Statistical Analysis in Climate Research; Cambridge University Press: Cambridge, UK, 1999; 484p. [Google Scholar]
- Burn, D.H.; Hesch, N.M. A Comparison of Trends in Potential and Pan Evaporation for the Canadian Prairies. Can. Water Resour. J. 2006, 31, 173–184. [Google Scholar] [CrossRef]
- Gameda, S.; Qian, B.; Campbell, C.A.; Desjardins, R.L. Climatic trends associated with summer fallow in the Canadian Prairies. Agric. For. Meteorol. 2007, 142, 170–185. [Google Scholar] [CrossRef]
- Barrow, E.; Sauchyn, D. Uncertainty in climate projections and time of emergence of climate signals in western Canada. Int. J. Climatol. in press.
- Intergovernmental Panel on Climate Change (IPCC). Climate Change 2013: The Physical Science Basis. Contribution of Working Group I to the Fifth Assessment Report of the Intergovernmental Panel on Climate Change. 2013. Available online: https://www.ipcc.ch/report/ar5/wg1/ (accessed on 15 November 2018).


| Station Name | Latitude (°N) | Longitude (°W) | Length of Record | Soil Zone |
|---|---|---|---|---|
| Val Marie | 49.37 | −107.85 | 1937–2010 | Dry Brown |
| Swift Current | 50.27 | −107.73 | 1885–2017 | Moist Brown |
| Regina | 50.43 | −104.67 | 1898–2017 | Dark Brown |
| Indian Head | 50.55 | −103.65 | 1889–2017 | Black |
| Loon Lake | 54.02 | −109.13 | 1930–2017 | Orthic Gray |
| Pelly | 52.08 | −101.87 | 1951–2016 | Dark Gray |
| Temperature (°C) |
| Average monthly temperature a Average spring (March, April, May) temperature |
| Average summer (June, July, August) temperature |
| Average maximum temperature (spring & summer) Average minimum temperature (spring & summer) |
| Precipitation (mm) |
| Total monthly precipitation b |
| Total spring (March, April, May) precipitation Total summer (June, July, August) precipitation |
| Soil Zone | RM # | Regression Equation * | Average Yield (t/ha) | Predicted Yield (t/ha) | R2 | RMSE | SSE | F-Stat | p-Value |
|---|---|---|---|---|---|---|---|---|---|
| Dry Brown | 17 | y = −0.621 + 0.007 (spr_pr) + 0.005 (sum_pr) | 1.352 | 1.355 | 0.74 | 0.36 | 4.52 | 49.70 | 5.94 × 10⁻¹¹ |
| Moist Brown | 46 | y = 3.875 + 0.008 (may_pr) + 0.004 (sum_pr) − 0.102 (sum_tmax) | 1.436 | 1.445 | 0.68 | 0.41 | 5.76 | 24.26 | 1.41 × 10⁻⁸ |
| Dark Brown | 100 | y = 2.884 − 0.112 (jul_t) + 0.004 (jun_pr) + 0.005 (spr_pr) | 1.717 | 1.724 | 0.62 | 0.39 | 5.29 | 18.50 | 2.73 × 10⁻⁷ |
| Black | 469 | y = 6.016 + 0.006 (sum_pr) − 0.156 (sum_tmax) | 2.286 | 2.309 | 0.57 | 0.53 | 9.95 | 23.26 | 3.76 × 10⁻⁷ |
| Orthic Gray | 499 | y = 6.335 + 0.005 (sum_pr) − 0.174 (sum_tmax) | 2.136 | 2.160 | 0.55 | 0.55 | 10.75 | 21.20 | 9.30 × 10⁻⁷ |
| Dark Gray | 501 | y = 8.580 − 0.229 (sum_tmax) + 0.172 (spr_tmin) | 2.318 | 2.337 | 0.49 | 0.59 | 12.05 | 16.94 | 7.14 × 10⁻⁶ |
| Time Period | Climate Variable * | Dry Brown | Moist Brown | Dark Brown | Black | Orthic Gray | Dark Gray | Arable Agricultural Zone |
|---|---|---|---|---|---|---|---|---|
| Annual | Tmean | 0.1 | 0.0 | 0.0 | 0.2 | 0.3 | 0.2 | 0.2 |
| Tmax | −1.2 | −1.3 | −1.5 | −1.5 | −1.2 | −1.3 | −1.3 | |
| Tmin | 0.7 | 0.9 | 1.1 | 1.2 | 1.4 | 1.3 | 1.5 | |
| Total P | 235 | 275 | 300 | 273 | 177 | 203 | 225 | |
| PETmean | −2.05 | −2.44 | −2.54 | −2.30 | −1.53 | −1.76 | −1.94 | |
| PETmax | −6.05 | −7.06 | −7.24 | −7.24 | −5.97 | −6.53 | −6.29 | |
| PETmin | −0.18 | −0.15 | −0.15 | −0.14 | −0.13 | −0.12 | −0.13 | |
| GDD ** | 2.7 | 8.5 | 5.5 | 5.2 | −1.0 | 3.8 | 5.6 | |
| FFD ** | 2.7 | 8.6 | 3.8 | 2.3 | −2.1 | 8.3 | 8.1 | |
| Growing Season | Tmean | −0.8 | −1.1 | −1.3 | −1.1 | −0.5 | −0.6 | −0.8 |
| Tmax | −2.1 | −2.6 | −3.2 | −3.5 | −2.6 | −2.9 | −2.8 | |
| Tmin | 0.9 | 1.0 | 0.9 | 1.4 | 1.3 | 1.2 | 1.2 | |
| Total P | 165 | 192 | 211 | 206 | 142 | 162 | 169 | |
| PETmean | −4.17 | −5.14 | −5.68 | −5.22 | −3.11 | −3.72 | −4.25 | |
| PETmax | −10.51 | −12.57 | −14.28 | −14.02 | −9.81 | −11.30 | −11.59 | |
| PETmin | −0.23 | −0.20 | −0.24 | −0.26 | −0.18 | −0.20 | −0.21 | |
| Winter | Tmean | 0.1 | 0.3 | 0.6 | 0.5 | 0.6 | 0.5 | 0.7 |
| Tmax | −2.4 | −2.1 | −1.1 | −0.7 | −0.3 | −0.3 | −0.9 | |
| Tmin | 0.6 | 1.3 | 1.9 | 1.7 | 2.3 | 1.9 | 2.4 | |
| Total P | 8.0 | 20.0 | 23.0 | 14.0 | −6.0 | −1.0 | 7.0 | |
| PETmean | −0.65 | −0.46 | −0.17 | −0.10 | −0.03 | −0.05 | −0.16 | |
| PETmax | −5.28 | −4.07 | −2.07 | −1.33 | −0.68 | −0.75 | −1.77 | |
| PETmin | −0.10 | 0.04 | 0.07 | 0.04 | 0.01 | −0.01 | 0.02 |
© 2019 by the authors. Licensee MDPI, Basel, Switzerland. This article is an open access article distributed under the terms and conditions of the Creative Commons Attribution (CC BY) license (http://creativecommons.org/licenses/by/4.0/).
Share and Cite
Kerr, S.A.; Andreichuk, Y.; Sauchyn, D.J. Re-Evaluating the Climate Factor in Agricultural Land Assessment in a Changing Climate—Saskatchewan, Canada. Land 2019, 8, 49. https://doi.org/10.3390/land8030049
Kerr SA, Andreichuk Y, Sauchyn DJ. Re-Evaluating the Climate Factor in Agricultural Land Assessment in a Changing Climate—Saskatchewan, Canada. Land. 2019; 8(3):49. https://doi.org/10.3390/land8030049
Chicago/Turabian StyleKerr, Samantha A., Yuliya Andreichuk, and David J. Sauchyn. 2019. "Re-Evaluating the Climate Factor in Agricultural Land Assessment in a Changing Climate—Saskatchewan, Canada" Land 8, no. 3: 49. https://doi.org/10.3390/land8030049
APA StyleKerr, S. A., Andreichuk, Y., & Sauchyn, D. J. (2019). Re-Evaluating the Climate Factor in Agricultural Land Assessment in a Changing Climate—Saskatchewan, Canada. Land, 8(3), 49. https://doi.org/10.3390/land8030049