Abstract
This research summarizes land use and city expansion, as well as the dynamics of urbanization, over recent years in Ulaanbaatar city, Mongolia. The study applies fractal geometry to describe land uses in Ulaanbaatar city using a mathematical procedure and geographic information system (GIS) urban analysis, and measures urban sprawl using an index relation of area and perimeter. Land-use parcels’ shape, area perimeter relations, sprawl statement and geometry of city structure are considered. The research presents the growth of Ulaanbaatar city in two time series, 2000 and 2010. The main findings stated here are that Ulaanbaatar is growing in an unsystematic and fractal way, even though the geometrical growth has not been strictly planned and has a most irregular shape of urban sprawl.
1. Introduction
The general scope of this paper is to measure the urban shape, discover compactness in practice based on urban morphology parameters, and prove the fractal geometry of land uses in Ulaanbaatar city using mathematical procedure and GIS urban analysis. The research presents the growth of Ulaanbaatar city in two time series, 2000 and 2010. These time series show the trend of Ulaanbaatar city change as a case and present a method of combining urban metrics measurement via GIS. This is achieved through fulfilling the following objectives: (i) to study the variety of urban fractal measurements through a literature review; (ii) to identify fractal dimensions of each land use of the case city; (iii) to explore appropriate metrics suitable for the case city, the character of urban compactness, and their relations to fractal geometry.
The concepts from fractal can be employed to optimize the spatial structure of cities in future city planning []. Information on existing urban structure, the course of land-use change and fractal dimensions of land use are essential for urban planning and management and provide “crucial clues” for future development [,].
Urban forms and urban land uses are dissimilar and present various structures in reality and in wide-scale maps compare to generalized cartographic visions. Geometrically, this needs to be presented in fractal terms. Simple extent is insufficient in a proper study of urban expansion, intra-structure of land uses, urban edge change, morphology and boundaries of areas. Euclidean geometry performs object analysis in integers with means: points = 0D, lines = 1D, area = 2D, and space = 3D dimension. Nevertheless, natural objects have fractal dimensions such as Koch’s curve (curve and spin) and all urban extents have 1D, 2D and 3D dimensions in regards to the space they cover [].
Pioneering work was presented by Mandelbrot in 1967 and since then fractal geometry has been widely used in urban geography. The most descriptive ground-breaking works related to fractal urban geometry, after Mandelbrot’s work on fractal theory and spatial structures, we should highlight are: Mandelbrot, 1983; Batty and Longley 1986; Goodchild and Mark 1987; Frankhauser 1988. The most significant publications contributed to an exploration of the fractal geometry, spatial relations of area–perimeter and the fractal boundary of urban forms in urban geography concluded that built-up area expansion brings about a multi-scale spatial organization [,,,,,,,,].
The origin of the word ‘fractal’ is came from ‘frangere’, where meaning is ‘to break’, or create irregular fragments []. Euclidean geometry defines only the integer dimensions of 0, 1, 2, etc., then fractal geometry is a generalization of it, whereas fractional dimensions are allowed [].
The “fractal” is an object with geometric nature, has irregularity, scale-dependence and self-similarity []. The basic property of all fractal structures is their dimension. Although there is no exact definition of fractals, the publicly accepted one is as Pastzo quoted from Mandelbrot, “A fractal is by definition a set for which the Hausdorff-Besicovitch dimension strictly exceeds the topological dimension” [].
There are many arguments that fractal shapes cost less for travel, urban development and greening, and the edge of urban area seems to be fractal [,,].
Fractal geometry could describe the spatial allocation of urban surfaces and the irregular shape of the urban edge []. Eventually, in reality a city does not exactly perform the geometry of a circle with the specific rings of the von Thunen diagram, but relies on long-term change of geometry concentrated in clusters at different scales as a fractal irregular spatial pattern.
The ‘self-similarity’, ‘compass’, and ‘box-counting’ dimensions are defined to determine the fractal dimension []. There are several methods to measure fractal dimension of an object such as: ‘divider’, ‘Hausdorff’, ‘correlation’, ‘information dimension’, ‘point wise dimension’, ‘Lyapunov dimension’, and ‘dilation dimension’ [,] and the ‘box-counting dimension’ is well used in the scientific community [].
The fractal geometry of urban land use is analyzed by Batty and Longley [] in the city of Swindon, south-central England. The main types of land parcels (residential, commercial-industrial, educational, transport and open space) to link fractality to the morphology of urban land use are used in their research []. Longley and Batty [] describe the fractal dimension of urban structure and calculate the formula for “D”, average chord length “”, length of perimeter “L(r)”.
Thomas et al. [] explore density of built-up surfaces in the periphery of Brussels and fractal dimensions of intra urban diversity are computed for a set of 26 windows; they present a fractal dimension’s statistical relation to variables such as rent, household income, distance to central business district (CBD), etc. Terzi and Kaya [] analyzed the urban sprawl of Istanbul through fractal geometry using an index relating density and proximity and its relation to the fractal. Morency and Chapleau [] apply fractal geometry to the characterization of urban-related states in the greater Montreal area, whereas two methods are used in order to estimate the fractal dimensions of the urban states: the box counting method and the mass-radius method computed within a GIS environment.
2. Materials and Methods
2.1. Study Area
To achieve the aim of the research, Ulaanbaatar, the capital city of Mongolia, and its land-use parcels are used as an example (Figure 1). Ulaanbaatar has been growing significantly since the mid-twentieth century and has been considered the country’s main urbanized area since then. While Ulaanbaatar is a small city compared to many other Asian capitals, it stands out as an increasingly sprawling capital, making the city itself chaotic and unstructured. As a center of economy, the leading and biggest urban area, Ulaanbaatar, is one of the most relevant cases for urban fractal study.
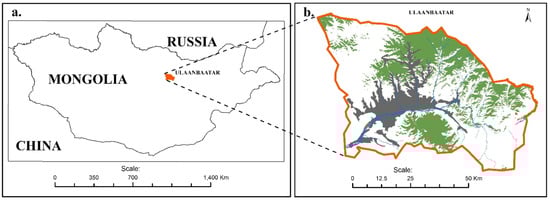
Figure 1.
Map over the study area. (a) Location of Ulaanbaatar; (b) map with forest, river and urban areas (grey = built-up area; green = forest; blue = river).
Today, 1.8 million residents live in the Ulaanbaatar region out of 3 million total population. The area of Ulaanbaatar is 4740 sq·km and the total area of Mongolia is 1.57 million sq·km. Just half a century ago in 1956, the city’s population was 118,000 [].
The sudden rate of growth of the urban area in 1990–2000 could be also explained by the start of market economy, democratic political system, and urban land privatization free to Mongolian citizens.
Mongolia is a post-communist country, and similar to many other countries (such as the post-socialist states), planning practitioners have been used to plan their cities without any involvement of citizens, making the planning process very straightforward, fast, and without any interruptions in the initial project periods. To the best of our knowledge, no scientific studies have been reported on physical planning in Mongolia in which the fractal dimension and compactness index are used. Together with the fact that most land-use studies are carried out without urban fractal analysis, and such studies for Mongolia do not even exist, this justifies the need, for example, to illustrate the advantages and opportunities these tools provide. The planning process can then benefit from a technical point of view, as well as from an understanding of the underlying problems in a scientific sense [].
2.2. Data Source and Spatial Analysis Method of GIS
Urban and regional planning has always been associated with the integrated analysis of spatial structures and patterns, often handled as maps. Since the 1970s, GIS have emerged, providing new or previously barely applicable techniques for handling and analyzing spatial data and for the practical implementation of approaches such as the compactness and fractal dimension analysis in planning contexts. One of the biggest challenges local governments and communities faces today is to find a sustainable plan without degrading or wasting scarce land resources. GIS provides many tools for handling all issues related to land resource management. One of the key characteristics of the GIS technology is that it is capable of handling and combining different types of data very efficiently []. GIS spatial analysis is the most important part of urban fractal geometry which gives basic parameters and shape information.
Urban shapes, sprawl and area-perimeter indices are identified based on GIS map layers, extracted from a series of cadastral map and time series of land-use planning data from National Land Information Database and Landsat TM imagery over the period from 2000 to 2010. Statistical data of the population and economic activities of Ulaanbaatar are applied to related metrics. Urban expansion addressed from the perspective of geometry had been calculated comparing two terms, 2000 and 2010. The result of the study were urban external shape parameters illustrated as a thematic urban land-use change map and segregated land-use map revealing structural deviations of land uses.
For this study, Landsat 7 ETM data (acquired in September 2010 and downloaded from http://earthexplorer.usgs.gov/) was available at 30 m horizontal resolution and supervised classification was performed to extract the built-up area layer. A total of 7 classes were generated; many classes representing similar features were subsequently merged e.g., vegetation, barren land, shrub classes combined into open space class. In our study parkland, garden, bush and public forest, vacant area, grass strip, square, riparian area are classed as open space in terms of urban land units [].
Other resulting classes such as forest (except intra-urban area forest classes counted as green space or gardens and merged into the open space class), agriculture, and water were not further used. After the supervised classification and several image manipulations, the city’s built-up area (in our study context named urban foot print) was separated from other categories of satellite imagery. However, 30 m resolution of Landsat dataset seemed to have no advantage for detailed classification of urban land uses: residential or industrial. Scientists have developed a variety of multidisciplinary methodology to classify the built-up area, but our goal was not to propose an new urban classification approach or to put forward present methods of remote-sensing classification. Therefore, we have chosen to use previously processed on-site land-use survey data from institutions for a more precise delineation of built of area.
The following table provides an overview of the different GIS layers used as base data for this study and subsequent layers added and reclassified as built-up area (Landsat image class) into 3 classes: residential, industrial and mixed use. All data processing was done with ESRI ArcGIS (with 3D and Spatial Analyst extensions) and ERDAS Imagine 8.1 and further details on how these data were created are presented in Table 1.

Table 1.
Data sources used to create the various information layers for the land-use classes of built-up area.
Land-use zoning and land-use classification data were acquired as vector data in September 2010 from the Land Administration Department of the capital city at a scale of 1:25,000. The Agency of Land Affairs, Geodesy and Cartography provided digital data on cadastral mapping (not only showing principal tax information but also data on land-use types, building type and height etc.) with a 1:2000 scale of topographic survey. Using the cadastral map attribute data with parcel land-use purposes, we segregated and re-classed the built-up area into residential, industrial and mixed use.
The “urban sprawl” phenomenon is associated with low density, spatial isolation, land fragmentation, and a scattered location of urban uses within territories []. The residential land areas were further divided by two categories: residential (area with up to two stories: middle and high-rise buildings) and sprawl residential/slum area (low-rise area with detached “ger” tents surrounded by fences or with handmade dwellings). Urban areas impossible for delineation to single land-use type where one land unit varied between industrial, residential and open spaces counted as mixed use. Since datasets had various topographic scales, further GIS layers were generalized from corresponding Landsat 30 m raster cell size images or vector maps.
2.3. Estimation of Fractal Geometry of Urban Land Use
There are number of methods for estimating fractal dimension and the ‘box-counting dimension’ is used in this research []. The box-counting method calculates the number of grid cells required to cover an object entirely. In practice, regular grids should be applied over an object and the number of occupied cells counted. The logarithm of N(r) means the number of occupied cells, versus the logarithm of size of one cell 1/r, and this gives a “Richardson–Mandelbrot plot” [], a line whose gradient corresponds to the box dimension D [,]. If the trend is linear, an observed object should be counted to be fractal []. The box-counting method is used for data—subset X of the map in r scale. The box-counting dimension of a subset X of the map is defined by counting the number of unit boxes which intersects X: for any r > 0, let N(r) denote the minimum number of n-dimensional cells of linear scale r (side length) needed to cover X [,].
Then X has dimension D if N(r) with constant c satisfies the power law Formula (1):
then X will with dimension D in Formula (2):
Using this principle, we employ the most general Formula (3) for the calculation of each land-use fractal dimension [,]:
where D is fractal dimension, P is the external perimeter of urban land-use area, and A is the area of urban land use.
To compute the perimeter of each land-use object, first, we need to count each chord length of the object. We used the calculation form according to Longley and Batty [] and found chord length using the standard triangle Equality (4), where chord has pair of (, ) and () coordinates.
Then, after finding each chord length, the perimeter L at scale r is summed [] in form (5) and using the L(r) the area of the land-use A is computed:
The Feret’s diameter in fine-particle science developed by Kaye [] which is in our case the maximum distance between a pair of coordinates [] or maximum distances covering each land use is given as (6):
In 1822 for the first time Ritter proposed to measure a shape’s compactness using a simple ratio of the perimeter (P) to the area (A) of the shape: (P/A) []. Since then, many alternatives and modified forms of geometry have been proposed and the most commonly accepted is the ‘circularity ratio’ 4A/P2 by Miller [] and the compactness ratio by Richardson for a compactness measurement [].
The compactness ratio is calculated by:
where C is compactness of urban land-use area, P is the perimeter of land use, and A is the area of land use []. Higher compactness index or increase of change trend presents higher urban concentration and dense land development [].
3. Results
3.1. Urban Land-Use Changes and Expansion
Results indicate that urban expansion in 10 years was at a high rate. With respect to land use, the city has undergone a dramatic urbanization trend during the last decade (the urban land-use distribution of Ulaanbaatar city is presented in Table 2) [].
Table 2.
Urban land-use change dynamic (data from Purevtseren et al. [] and Myagmartseren et al. [,]).
Myagmartseren et al. argued that most area expansions are due to urban sprawl growth caused by unregulated massive rural to urban population migration. In the residential zone ger area, which covers about 32% of all territory of the city (Table 1), urban expansion has accelerated so far so it adversely impacts green belt areas, wetlands, water buffer zones, open space and public land conservation and green developments [].
3.2. Compactness Ratio and Fractal Dimension
Compactness ratio is the key index in the urban geography for research on urban spatial expansion/sprawl. Therefore, changes of urban compactness will illustrate the trend of urban spatial expansion mode: ‘when the city develops quickly, the compactness ratio will decrease; when the city is at the stage of internal-filling and reconstruction, the compactness ratio will increase’ []. As Fan quoted from Chu, changes of urban compactness ratio are closely related to the urban spatial expansion mode: when the city develops quickly, the compactness ratio will decrease; when the city is at the stage of internal-filling and reconstruction, the compactness ratio will increase []. With a mean compactness ratio of Ulaanbaatar city declining in 2000–2010 (Table 1), in fractal theories the present city is young and still beginning its development with a need to start reconstruction and readjustment plans for land improvement. Rural migrants and natural disaster refugees/poor people start to possess urban fringes, trespass public land, grab land in green belt and pre-urban agriculture zone. This nomadic undesirable land possession is becoming a main reason for urban sprawl/ger area increases [].
The fractal dimension usually describes the complexity and the fragmentation of a patch by a perimeter-area proportion. Fractal dimension values range between 1 and 2. Low values are derived when a patch has a compact rectangular form with a relatively small perimeter relative to the area. If the patches are more complex and fragmented, the perimeter increases and yields a higher fractal dimension []. Formula (3) can be easily computable directly within GIS, thus ArcGIS was used to obtain fractal dimension values. Both the area and its fractal dimension of Ulaanbaatar city grow over time. Perimeter and its fractal dimension seem to display a trend (Table 3).
Table 3.
Urban compactness metrics based on land-use mapping.
3.3. Fractal Geometry of Urban Land Use
Urban land uses are identified based on GIS map layers, extracted from a series of cadastral map and time series land-use planning data from the National Land Information Database and Landsat TM imagery over the period from 2000 to 2010. The main land uses classified are: sprawl-residential, residential-middle and high rise, industrial, open space and mixed use. Figure 2 presents the urban land-use map for this study. Calculated parameters, analyzed by combining urban external shape/urban expansion for two terms, 2000 and 2010, are illustrated as thematic urban change/and structure changes of land use.
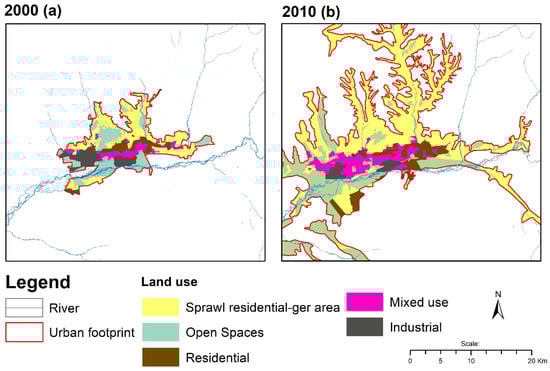
Figure 2.
Land-use map of Ulaanbaatar, in (a) 2000 and (b) 2010.
The land-use maps of both time series are processed using ‘ArcGIS’ software and the particular land-use parcels are extracted in polygon feature using data management and ‘Xtools pro’ tools. Spatial changes occurred in the north and south-west part of the Ulaanbaatar city vicinity where urban sprawl appeared after the boom of rural to urban migration caused by economic crisis, natural disaster and land privatization. The appearance of a large envelop of sprawl occupation in the north may be due to empty spaces with gentle slopes, existing roads and electricity and an urban shape like an octopus tentacle and were largely constrained by the narrow valleys and the localization of previous infrastructure [].
The ‘ger area’/residential sprawl are semi-detached nomadic tents with enclosed fences which have mostly adversely possessed all vacant land, and after visualization of these the main land-use change of Ulaanbaatar could be concluded.
Longley and Batty [] demonstrated the land-use map where all land parcels in each class were drawn separately and are not arranged in any particular order which represents land-use differences. They argued that map will apparently show separate land use characteristics. We adopted the map of Longley and Batty [] in the case of Ulaanbaatar where two-time series land-use changes were compared (Figure 3, Table 4).
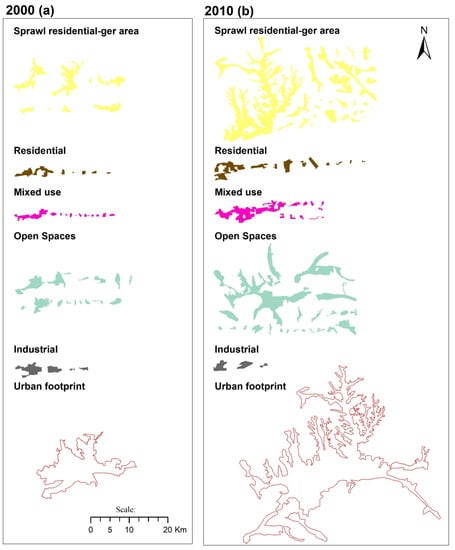
Figure 3.
Parcels separated into individual land-use classes, Ulaanbaatar in (a) 2000 and (b) 2010.
Table 4.
Attributes of land-use parcels.
Segregated land uses clearly demonstrate areal increase or decline of each land uses over the 10-year period. This visually shows spatial changes, the increase of the sprawl of the ger area, open space, a controversial decrease of industrial use, and a city core shift from single residential or single industry to mixed uses: residential, service, light industry mixture (Figure 3, Table 4 and Table 5). The rapid increases of the compactness ratio between 2000 and 2010 could be interpreted as an unregulated process of informal settlement in the form of sprawl, structured around the city edges, and made the city footprint about 3 times larger. In 2004, informal settlements were legally given permission by government to intensify land privatization and improve social infrastructure, to halt an accelerated adverse possession and land grabbing.
Table 5.
Characteristics of urban land use.
Some characteristics of the separate land uses are presented in Table 4. There is considerable variation in the time series and proof of incompactness, and it is clear that self development without incentives of planning regulation can shift a city away from a compact and well structured shape to chaos through adverse possession and create problems of traffic jam, environmental pollution, crime and lack of land locations. Sprawl in this table indicates the urban area expansion or unplanned ger area increase (Ger area—residential area with Mongolian traditional tent surrounded with fences). Mixed land use includes residential, office, commercial and light industrial land use. Public streets and squares are considered as open space.
The number of parcels and parcel points for each land use are given in Table 2, and for each year’s land use involve the common points which are double the counting points of common boundaries of the particular land uses with the rest of the land-use neighbors []. The total number of the parcels and area has increased two, three times in 10 years; except for industrial land use, most land uses specially urban sprawl ger area increased and, as a result, open spaces expanded. In 2000, there were 2153 common points out of total 2964 points and thus city land uses were compact and well structured. After 10 years in 2010, the half of total points referred to common points, particularly open spaces and sprawl areas’ common points, decreased due to areal expansion, leap frog and strip development.
Variables, shown in Table 3, give some indication of the position of land uses and if compared with Figure 2 within the city; most of the mixed use and industrial use are enclosed within the city itself, not on its edge, while residential sprawl ger area and open space land use are mainly on the city edge. Thus, mixed use and industrial spatial change are transferred to other neighbor urban land uses or shifted to neighboring classes at the same time as residential use and open space spatially occupied the periphery area of the city (Figure 3).
On the other hand, the sum of the chords’ lengths and the perimeter of all land uses in 2000 and 2010 years ranges from 155,927 to 762,116, and these numbers increased in each land-use class except industrial use, indicating development reasonably independent of land-use types [] and changes of land uses. In Table 3, the perimeter length of all land use and the Feret’s diameter representing the maximum spanning distance are found amongst the parcels of any given land use, and as defined in Equation (6) has direct relationship. It is clear from this and from Figure 4 that there is some considerable variation among land-use parcels with respect to size and perimeter.
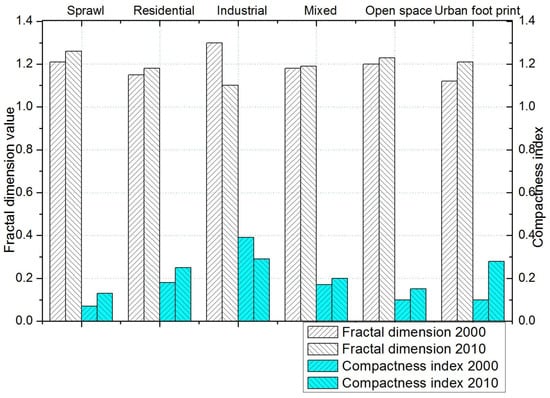
Figure 4.
Change of fractal dimensions of urban form and sprawl index for Ulaanbaatar in 2000 and 2010.
The calculated urban shape compactness index and fractal dimension are illustrated in Figure 4. The presentation in the figure illustrates the decrease in compactness index and the slight increase in fractal dimensions, which suggests that shape expansion, leap frog and strip development fill the open spaces or occupy their periphery.
4. Discussion
The study offers a good opportunity to use remotely-sensed data and processed information via GIS in an urban sprawl study. New technology provides new tools for effective urban geography research. The applied methodology of sprawl identification has provided suitable results and maps, which can be used as an important input for urban development planning. Since the beginning of the 1990s, the Mongolian planning society started to use remotely sensed data and GIS digital data layers as a base of land management, while conventional map digitizing techniques have been common in urban land-use planning practice []. No scientific studies have been reported in Mongolia where compactness and fractal dimension are used. Most spatial studies and plans carried out by specialists are just done within physical planning, not knowing the existence of relevant urban form analysis. These facts justify the need for examples demonstrating the advantage and benefits of an urban shape study.
A number of scholars have invented or modified many particular metrics to measure urban sprawl, depending on the quantifying goal and points of view about sprawl vs. a compact city. Sprawl metrics are a common method, however, they mostly used basic measurement and the trend shows scholars starting to research the internal structure of a city and its dynamics.
This research brings to the reader basics of urban land use geometry and its potential application for urban geography, and has cited many basic papers and fundamental fractal mathematics, including compactness and fractal dimension formulas. Among basic fractal analysis approaches, there are many spatial mathematical apparatuses to calculate urban shapes and characteristics which are not presented in this paper. However, compactness and fractal dimension and urban land-use parcel characteristics are satisfactory for this case and objectives. For further study, there is a need for the application of different methods jointly and in comparable ways.
Fan et al. made the same study in Shanghai and concluded the fractal dimension was comparatively low (maximum D = 1.4) and urban external shape was stable due to good planning strategy in the city because blind and unplanned large-scale development had not appeared []. Ulaanbaatar city’s 2000–2010 fractal dimension change was not remarkable (D∆t = 0.09) and slightly increased. This suggests that in 2000 the city’s built-up area boundary already had been in irregular shape, historically city expansion performed along the narrow river valleys as a result of specific geographical locations: mountainous terrain barrier, steep slope, and lack of plain areas. However, a slight increase of fractal dimension reveals that the city is in expansion and a more complex and asymmetrical urban foot print appeared over 10 years. In other words, the fractal dimension analysis was not particularly impressive for historically asymmetrical-linearly developed Ulaanbaatar city, where expansion along the river valleys has to increase the area-perimeter relationship in any case.
In fact, the compactness ratio and Feret’s diameter replicate the spatial expansion mode [] and the urban development stage of the city according to urban planning rules [] handled by the municipality. The Feret’s diameter, area and perimeter of the urban foot print increased approximately one quarter between 2000 and 2010.
The compactness ratio decreased two times comparably in 10 years, demonstrating Ulaanbaatar city’s rapid sprawl growth and this suggests that in the period of observation pre-urban areas were occupied intensively after the implementation of land privatization, market economy development and rural migration without inter-filling and reconstruction activity [,].
There are not any significant readjustment plans and low-density slum district reconstruction for Ulaanbaatar city, and therefore urban expansion is the only possible way to exploit land. At the local level, an enforcement measures for the urban land-use planning should be carried out according to the urban sprawl metrics. In Japan, planning regulations apply an entire urban area through “line drawing system” divided into two categories: Urbanization Promotion Areas and Urbanization Control Area. Within urbanization control area all kind of urban development activity is prohibited. The line drawing system prevents urban sprawl and illegal expansion into pre-urban area []. Such an enforcement measure is one of the ways Ulaanbaatar can resist urban expansion. According to our previous study, around 1.1 million inhabitants resided in mid- and high-rise residential zones and 217 thousand inhabitant live in the low-rise residential “ger” area. This means 85% of citizens live in 33.2% of total urban area and rest of areas occupied by only 15% of population. This reflects the fact that the current compactness ratio and low density population of Ulaanbaatar have to readjust through reconstruction of slum districts and prevent future expansion by the “line drawing system”. Most of the current sprawl-residential ger area has to be transformed to the urbanization control area to halt the illegal occupation of pre-urban agricultural areas.
Correspondingly, we should consider rural to urban migrations. Myagmartseren et al. [] observed that: “one key factor for such rapid urbanization is probably due to the nomadic life style of Mongolian people; that is, it is not more difficult to put up a traditional ‘ger’ tent in the outskirts of a city than it is to put it up anywhere else”. For that reason, at a national level rural area sustainable development should be considered in parallel to capital city readjustment urban planning.
5. Conclusions
The compactness ratio and fractal dimension index are broadly accepted applications of urban study particularly for urban sprawl and are the most significant method used for this research. The urban shape of Ulaanbaatar is relatively non-compact and leap frog and strip development are the main reason for this. The general shape/morphology of Ulaanbaatar belongs to the ‘octopus tentacles’ shape. The fractal dimension of Ulaanbaatar has been slightly increasing and the parameter characteristics of the territorial boundary are relatively complex and irregular, which suggests that blank spaces, segregation, fragmentations and unplanned large-scale land expansion exists.
Two time series 2000 and 2010 chronological development were carried out to represent urban land use fractal geometry. The total number of parcels and area increased in 2–3 times in 10 years and except industrial land use, most land uses especially urban sprawl/ger area increased and due to it open spaces expanded. The segregated land uses clearly present areal increase or decline for each land use over the 10-year period. Spatial changes after calculation give an understanding of the increase of sprawl of the ger area, open spaces; controversially, there was a decrease of industrial use, and city core shift from single residential or single industry to mixed uses. Particularity of the rapid decrease of the compactness ratio between 2000 and 2010 could be interpreted as an unregulated process of informal settlement in the form of sprawl structured around city the edges, making the city footprint about 3 times larger. Within the city structure, most of the mixed and industrial uses are enclosed within the city itself, not on its edge, while residential sprawl ger area and open space land use are mainly on the city edge. Thus, mixed use and industrial spatial change will be transferred to other neighboring urban land uses or shifted to neighboring classes at the same time as residential and open spaces spatially occupy the peripheral area.
Author Contributions
M.P. and M.S. conceived and designed the study; M.I. collected and analyzed the data; B.T. contributed materials and took part in analysis; M.P. wrote the paper, M.S. took part in paper writing.
Funding
This research was supported by professor’s base research budget of NUM-SAS.
Acknowledgments
Our sincere gratitude to the Land Administration Department of Capital City, Agency of Land Affairs, Geodesy and Cartography, colleagues of the National University of Mongolia, and Lanres Company for the provision of digitized data and research materials. The authors would like to thank two anonymous reviewers for their constructive comments and suggestions on this article.
Conflicts of Interest
The authors declare no conflict of interest.
References
- Chen, Y. A New Model of Urban Population Density Indicating Latent Fractal Structure. Int. J. Urban Sustain. Dev. 2010, 1, 89–110. [Google Scholar] [CrossRef]
- Myagmartseren, P.; Myagmarjav, I.; Otgongerel, B. Urban Compactness Measurement of the Ulaanbaatar City. Geogr. Issues 2015, 14, 51–59. [Google Scholar]
- Zhan, Q.; Wang, J.; Gong, P.; Shi, P. Urban built-up land change detection with roads density and spectral information from multi-temporal Landsat TM data. Int. J. Remote Sens. 2002, 23, 3057–3078. [Google Scholar] [CrossRef]
- Triantakonstantis, D.P. Urban Growth Prediction Modelling Using Fractals and Theory of Chaos. Open J. Civ. Eng. 2012, 2, 81–86. [Google Scholar] [CrossRef]
- Batty, M.; Longley, P.A. The Fractal Simulation of Urban Structure. Environ. Plan. A Econ. Space 1986, 18, 1143–1179. [Google Scholar] [CrossRef]
- Batty, M.; Xie, X. Self-Organized Criticality and Urban Development. Discret. Dyn. Nat. Soc. 1999, 3, 109–124. [Google Scholar] [CrossRef]
- Batty, M. Exploring isovist fields: Space and shape in architectural and urban morphology. Environ. Plan. B Plan. Des. 2001, 28, 1231–1250. [Google Scholar] [CrossRef]
- Benguigui, L.; Czamanski, D.; Marinov, M.; Portugali, Y. When and Where Is a City Fractal. Environ. Plan. B Plan. Des. 2000, 27, 507–519. [Google Scholar] [CrossRef]
- Chen, Y.G.; Zhou, Y.X. Scaling laws and indications of self-organized criticality in urban systems. Chaos Solitons Fractals 2008, 35, 85–98. [Google Scholar] [CrossRef]
- Fotheringham, A.S.; Batty, M.; Longley, P.A. Diffusion-Limited Aggregation and the Fractal Nature of Urban Growth. Pap. Reg. Sci. Assoc. 1989, 67, 55–69. [Google Scholar] [CrossRef]
- Shen, G. Fractal Dimension and Fractal Growth of Urbanized Areas. Int. J. Geogr. Inf. Sci. 2002, 16, 437–519. [Google Scholar] [CrossRef]
- Tannier, C.; Thomas, I.; Vuidel, G.; Frankhauser, P. Fractal Approach to Identifying Urban Boundaries. Geogr. Anal. 2011, 43, 211–227. [Google Scholar] [CrossRef]
- Thomas, I.; Frankhauser, P.; Biernacki, C. The Morphology of Built-Up Landscapes in Wallonia (Belgium): A Classification Using Fractal Indices. Landsc. Urban Plan. 2008, 84, 99–115. [Google Scholar] [CrossRef]
- Hastings, H.M.; Sugihara, G. Fractals: A User’s Guide for the Natural Sciences; Oxford University Press: Oxford, UK, 1994. [Google Scholar]
- Terzi, F.; Kaya, H.S. Analyzing Urban Sprawl Patterns through Fractal Geometry: The Case of Istanbul Metropolitan Area; Paper 144; Centre for Advanced Spatial Analysis: London, UK, 2008. [Google Scholar]
- Pastzo, V.; Marek, L.; Tucek, P.; Janoska, Z. Perspectives of fractal geometry in GIS analysis. GIS Ostrav. 2011, 1, 232–236. [Google Scholar]
- De Keersmaecker, M.-L.; Frankhauser, P.; Thomas, I. Using fractal dimensions for characterizing intra-urban diversity: The example of Brussels. Geogr. Anal. 2003, 35, 3103–3128. [Google Scholar] [CrossRef]
- Frankhauser, P. Fractal Aspects of Urban Systems. Sonderforschungsbereich 1988, 230, 67–76. [Google Scholar]
- Theiler, J. Estimating fractal dimension. J. Opt. Soc. Am. A 1990, 7, 1055–1073. [Google Scholar] [CrossRef]
- Mandelbrot, B. The Fractal Geometry of Nature; Freeman: San Francisco, CA, USA, 1983. [Google Scholar]
- Addison, P.S. Fractals and Chaos: An Illustrated Course; Institute of Physics Publishing: Bristol, UK, 1997. [Google Scholar]
- Thomas, I.; Frankhauser, P.; Keersmaecker, M.L.D. Fractal dimension versus density of built-up surfaces in the periphery of Brussels. Pap. Reg. Sci. 2007, 86, 287–308. [Google Scholar] [CrossRef]
- Morency, C.; Chapleau, R. Fractal geometry for the characterisation of urban-related states: Greater Montreal Case. Harmon. Fractal Image Anal. 2003, 30–34. Available online: www.fch.vut.cz/lectures/imagesci/download_ejournal/09_C.Morency.pdf (accessed on 17 April 2018).
- Myagmartseren, P.; Myagmarjav, I.; Erdenejargal, B. Land Use Changes in Urban Areas of Mongolia. In Proceedings of the IX International Conference Environment and Sustainable Development in Mongolian Plateau and Surrounding Regions, Ulan-Ude, Russia, 20–22 August 2013; Buryat State University: Ulan Ude, Russia, 2013; Volume 2, pp. 18–21. [Google Scholar]
- Myagmartseren, P.; Myagmarsuren Buyandelger, M.; Brandt, S.A. Implications of a Spatial Multicriteria Decision Analysis for Urban Development in Ulaanbaatar, Mongolia. Math. Probl. Eng. 2017, 2017, 2819795. [Google Scholar] [CrossRef]
- Victorian Department of Planning and Community Development; Open Space Planners Network in Victoria. Open Space Planning and Design Guide; Park and Leisure Australia: Norwood, Australia, 2013. [Google Scholar]
- Myagmartseren, P.; Mayagmarjav, I.; Otgongerel, B. Multi-Criteria Decision Analysis for Cropland Suitability Survey. J. Geogr. Rev. Mong. 2014, 10, 1301–1336. [Google Scholar]
- Ge, M.; Lin, Q. Realizing the Box-counting Method for Calculating Fractal Dimension of Urban Form Based on Remote Sensing Image. Geo-Spat. Inf. Sci. 2009, 12, 2652–2670. [Google Scholar] [CrossRef]
- Torrens, P.M.; Alberti, M. Measuring Sprawl, Paper 27; Centre for Advanced Spatial Analysis: London, UK, 2000. [Google Scholar]
- Kaye, B.H. A Random Walk through Fractal Dimensions; VCH Publishers: New York, NY, USA, 1989. [Google Scholar]
- Frolov, Y.S. Measuring shape of geographical phenomena—History of issues. Sov. Geogr. Rev. Transl. 1975, 16, 676–687. [Google Scholar]
- Herold, M.; Scepan, J.; Clarke, K. The use of remote sensing and landscape metrics to describe structures and changes in urban land uses. Environ. Plan. A 2002, 34, 1443–1458. [Google Scholar] [CrossRef]
- Chu, J. Study on Quantitative Analysis of Urban Spatial Form; Southeast University Press: Nanjing, China, 2007. [Google Scholar]
- Purevtseren, G.; Myagmartseren, P.; Jigjidsuren, S. Master Land Use Plan of Ulaanbaatar City; Governor Office of Capital City: Ulaanbaatar, Mongolia, 2001. [Google Scholar]
- Fan, W.; Shi, Y.; Liu, Y. Application of GIS in quantifying the urban form: A case study of Shanghai. J. Digit. Content Technol. Appl. 2012, 6, 3443–3453. [Google Scholar]
- Falconer, K.J. Fractal Geometry: Mathematical Foundations and Applications; John Wiley & Sons: New York, NY, USA, 1999. [Google Scholar]
- Akashi, T. Urban Land Use Planning System in Japan, 2nd ed.; JAICA: Tokyo, Japan, 2007; pp. 4–5. [Google Scholar]
© 2018 by the authors. Licensee MDPI, Basel, Switzerland. This article is an open access article distributed under the terms and conditions of the Creative Commons Attribution (CC BY) license (http://creativecommons.org/licenses/by/4.0/).