Article

Satellite Monitoring of Vegetation Response to Precipitation and Dust Storm Outbreaks in Gobi Desert Regions

1
The Graduate School of Sciences, Chiba University, Chiba 263-8522, Japan
2
College of Agriculture, Food and Environment Sciences, Rakuno Gakuen University, Ebetsu 069-8501, Japan
3
Field Researchers Corporation Co., Ltd., Sapporo, Hokkaido 060-0007, Japan
4
Graduate School of Environmental Studies, Nagoya University, Nagoya 464-8601, Japan
5
School of Geography University of Oxford, South Parks Road, Oxford OX1 3QY, UK
*
Author to whom correspondence should be addressed.
Submission received: 12 December 2017 / Revised: 25 January 2018 / Accepted: 27 January 2018 / Published: 1 February 2018
(This article belongs to the Special Issue Arid Land Systems: Sciences and Societies)

Abstract

:
Recently, droughts have become widespread in the Northern Hemisphere, including in Mongolia. The ground surface condition, particularly vegetation coverage, affects the occurrence of dust storms. The main sources of dust storms in the Asian region are the Taklimakan and Mongolian Gobi desert regions. In these regions, precipitation is one of the most important factors for growth of plants especially in arid and semi-arid land. The purpose of this study is to clarify the relationship between precipitation and vegetation cover dynamics over 29 years in the Gobi region. We compared the patterns between precipitation and Normalized Difference Vegetation Index (NDVI) for a period of 29 years. The precipitation and vegetation datasets were examined to investigate the trends during 1985–2013. Cross correlation analysis between the precipitation and the NDVI anomalies was performed. Data analysis showed that the variations of NDVI anomalies in the east region correspond well with the precipitation anomalies during this period. However, in the southwest region of the Gobi region, the NDVI had decreased regardless of the precipitation amount, especially since 2010. This result showed that vegetation in this region was more degraded than in the other areas.

1. Introduction

Located in Central Asia, the Gobi includes a great desert and semi-arid region that stretches across huge portions of both Mongolia and China. The characteristic vegetation constitutes mixtures of grasslands, shrubs, saltwort and thorny trees. The Mongolian Gobi is a source for the formation of dust storms that sweep across East Asia [1]. Dust storms frequently occur in arid and semi-arid regions and may have contributed to the desertification observed in recent decades as well as the accelerated occurrence of more arid conditions over the drylands of Asia [2]. In the arid regions of continental East Asia, dust storms frequently occur in spring [3,4]. Vegetation coverage is one of the most important factors for the reduction of dust storm occurrence [5,6,7]. In these regions, the summer season is the highest season of vegetation activity. Previous studies showed that not only spring vegetation plays an important role in reducing dust storm frequencies but the previous summer vegetation in these arid and semi-arid regions also plays a role. For example, Kurosaki et al. [8] proposed a hypothesis in which dead leaves of grasses in spring, which are residue from the preceding summer’s vegetation, were the main factor suppressing dust events. In a more recent study, Nandiatsetseg and Shinoda [9] also pointed out that standing dead grasses had the most significant impact on spring dust outbreaks. In addition, it is known that spring dust storm frequency in China appears to be more correlated with NDVI from the prior summer than that in March to May of the same year [10]. The land surface memory in the Mongolian grasslands was investigated [11]. They showed that soil moisture and vegetation anomalies determined by summer precipitation were maintained during winter, affecting dust occurrence in the following spring. Furthermore, perennial plants such as shrub, dominant in arid and semi-arid Gobi region, may remain alive as NDVI memory and retain as a memory of belowground biomass anomalies under the snow cover and in the frozen soil [12]. They also pointed out that the belowground biomass anomalies appeared to affect the aboveground anomalies at the initial vegetation growth during the spring as detected by NDVI [12]. This shows that perennial plants can easily affect vegetation coverage.
Water is the main limiting factor for vegetation growth over southern Mongolia [13]. However, both observation and modelling studies have indicated that an aridity trend is occurring and will occur most significantly in the semi-arid regions with droughts becoming more widespread in the Northern Hemisphere, including Asia, and particularly in Mongolia e.g., [14,15,16,17]. Furthermore, Huang et al., 2016 [18] point out that the warming trends over drylands, particularly in arid regions, are twice as great as those over humid regions. In this study, we used time series satellite vegetation measurements from the National Oceanic and Atmospheric Administration (NOAA) Advanced Very High Resolution Radiometer (AVHRR) sensor to examine the variability and trends of land surface conditions in the Gobi region as represented by vegetation index data from 1985 to 2013.

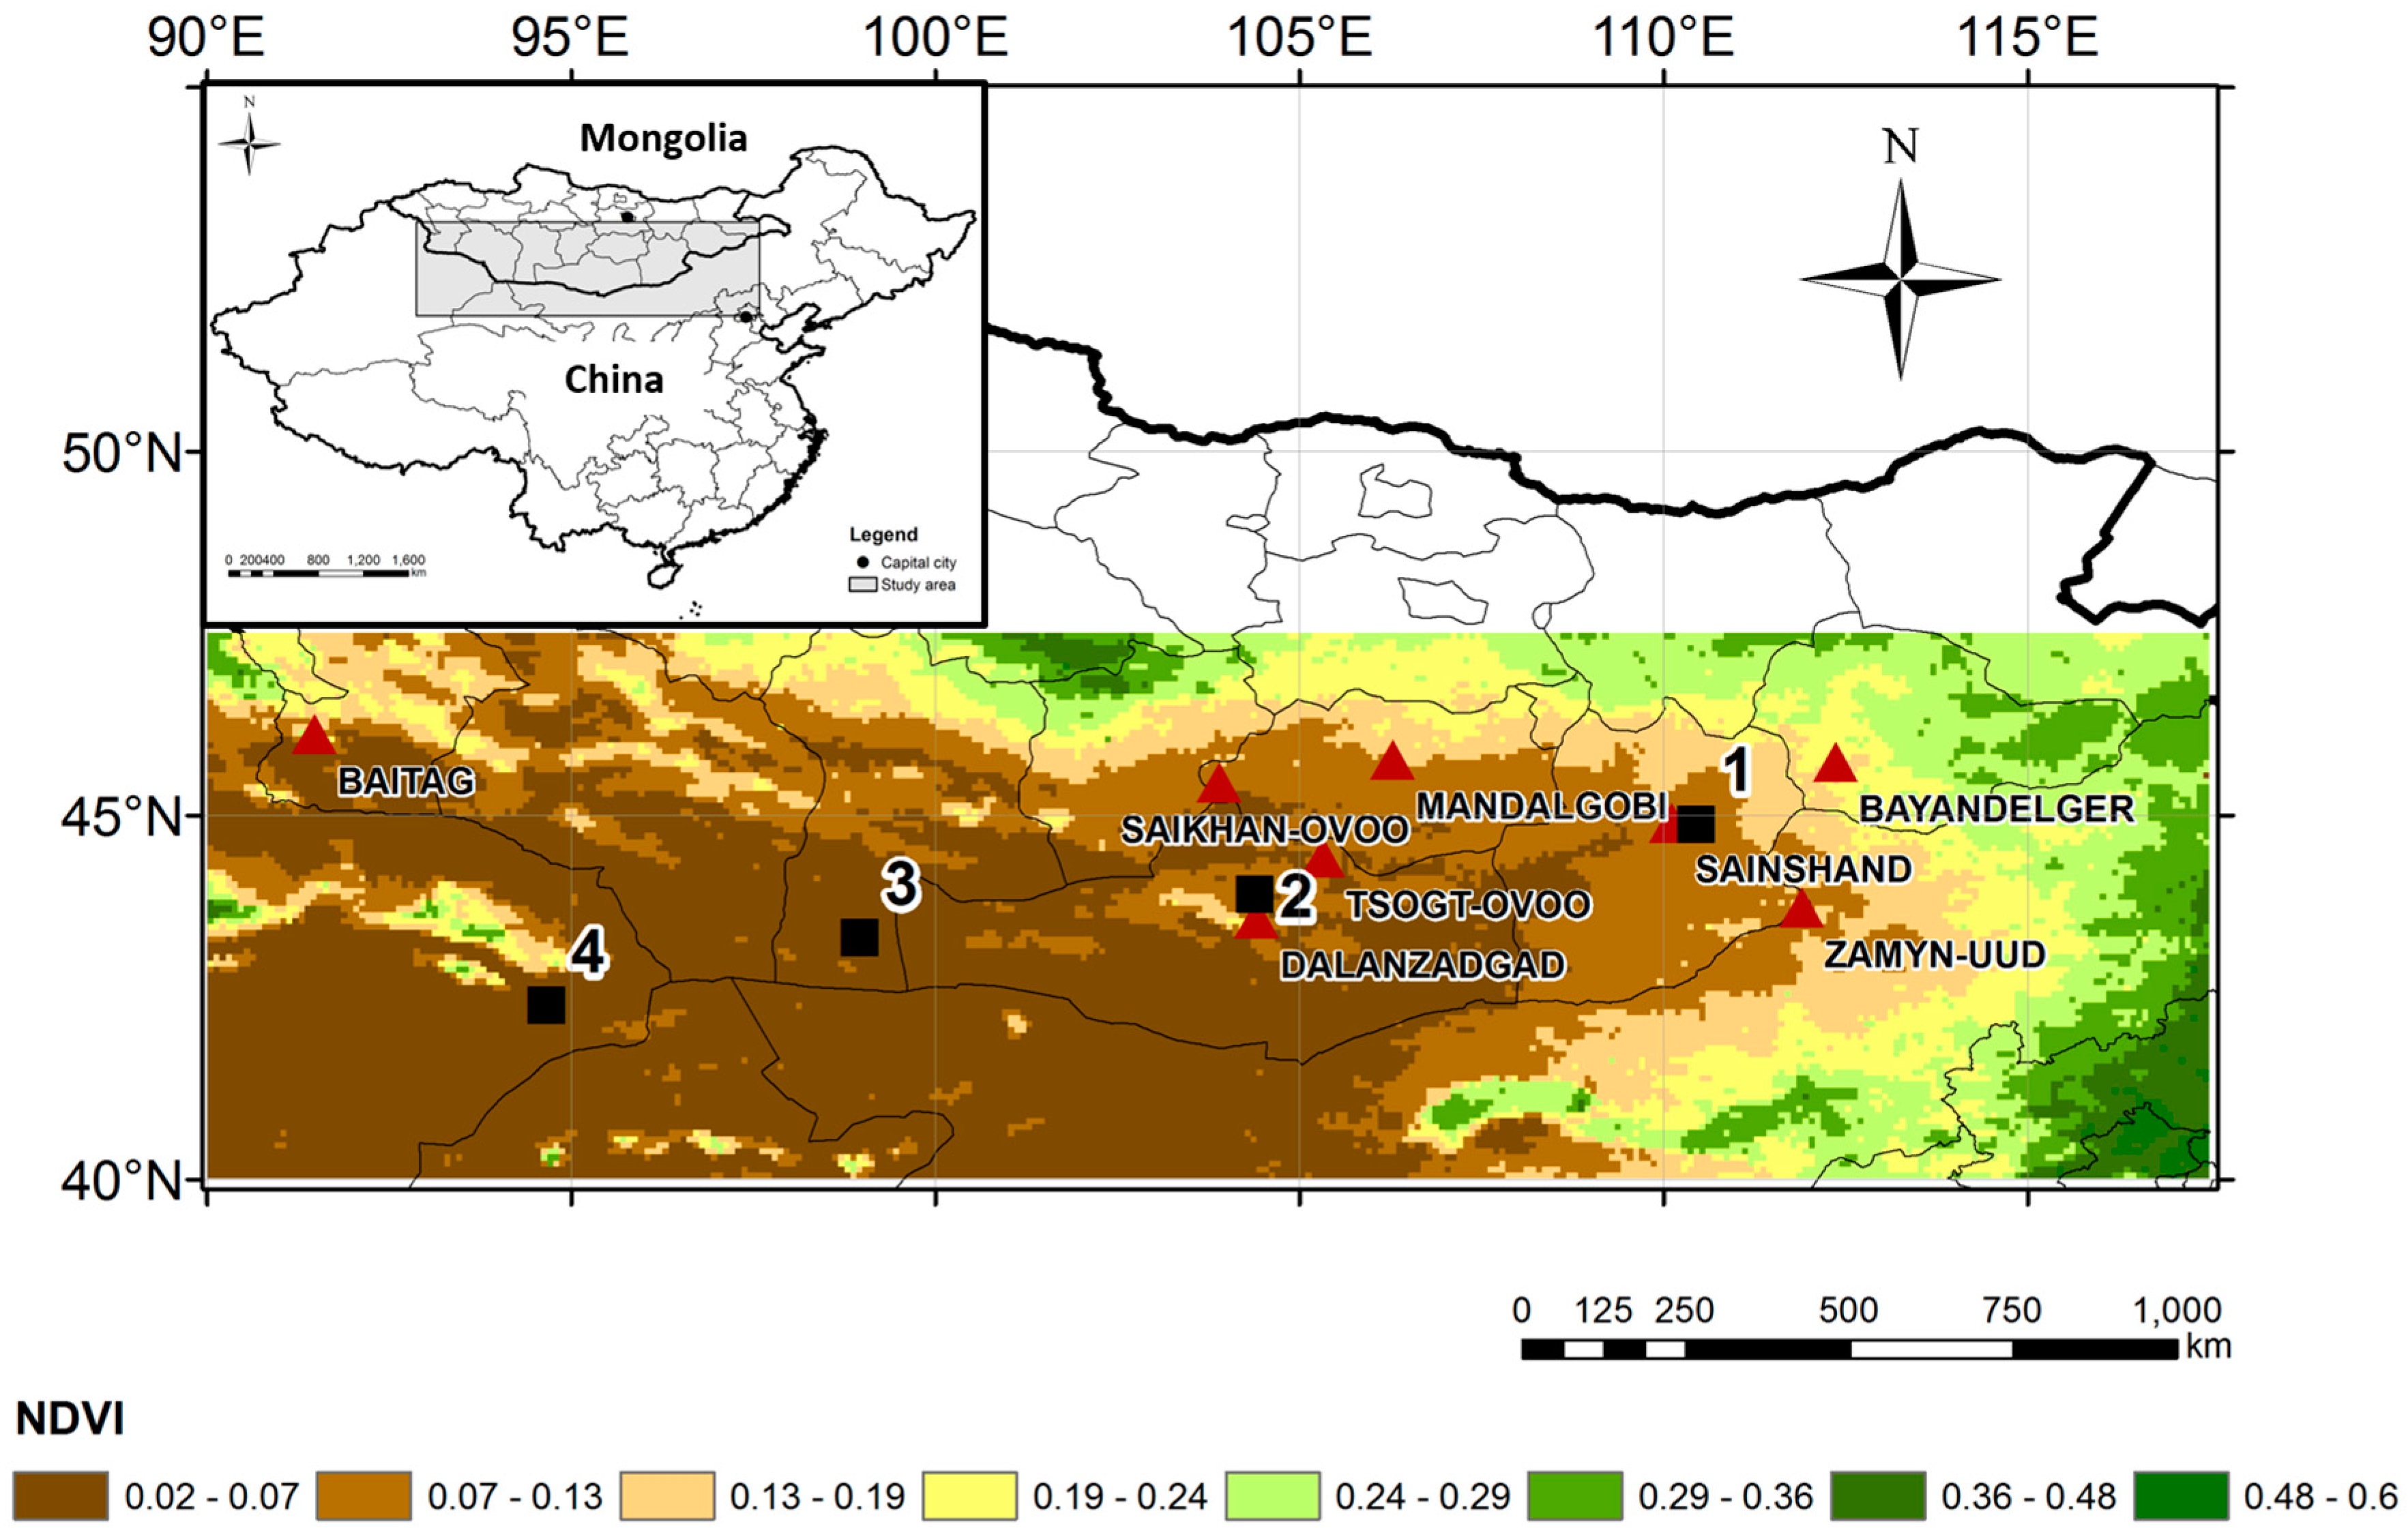
2. Materials and Methods

2.1. Data of Analysis

2.1.1. NDVI Data

In this study, we use the Normalized Difference Vegetation Index (NDVI) to estimate vegetation variation. NDVI is given by
NDVI = NIR RED NIR + RED
where, RED and NIR are the surface reflectance bands in the 550–700 nm (visible) and 730–1000 nm (infrared) regions of the electromagnetic spectrum, respectively. The NDVI3g data set used in this study is derived from measurements made by the AVHRR sensor aboard NOAA polar orbiting satellite series (NOAA-7, 9, 11, 14, 16). The NDVI3g data set is provided by the GIMMS group at NASA’s Goddard Space Flight Center, as described by Tucker et al. [19] and cover the period from 1981 to 2013, with a spatial resolution of 8 km by 8 km. The NDVI data were generated from processed 15-day NDVI composites using the maximum value compositing procedure to minimize effects of cloud contamination, varying solar zenith angles and surface topography [20]. For this study, we subset the Gobi region covering the geographical domain 90° E–117.5° E and 40° N–47.5° N, from the continental data set for the period from January 1985 to December 2013 (Figure 1). Figure 1 shows the map of the NDVI average of all data for the study period from 1985 to 2013.

2.1.2. Precipitation Data

The Global Precipitation Climatology Project (GPCP) data was derived from a joint analysis of satellite data, and gauge data [21]. This precipitation data has daily and monthly data. Daily data has (1° × 1°) spatial resolution acquired between October 1996 and May 2015. Monthly data has (2.5° × 2.5°) spatial resolution acquired between January 1979 and May 2015. Since previous applications of NDVI in the Gobi region were focused mainly on the rainy season, NDVI patterns during the Growing Season (GS) were analyzed. In addition, we used daily precipitation data obtained from WMO synoptic data from 2001 to 2010. This data was used to evaluate the relationship with the number of dust storm days and NDVI using single regression analysis.

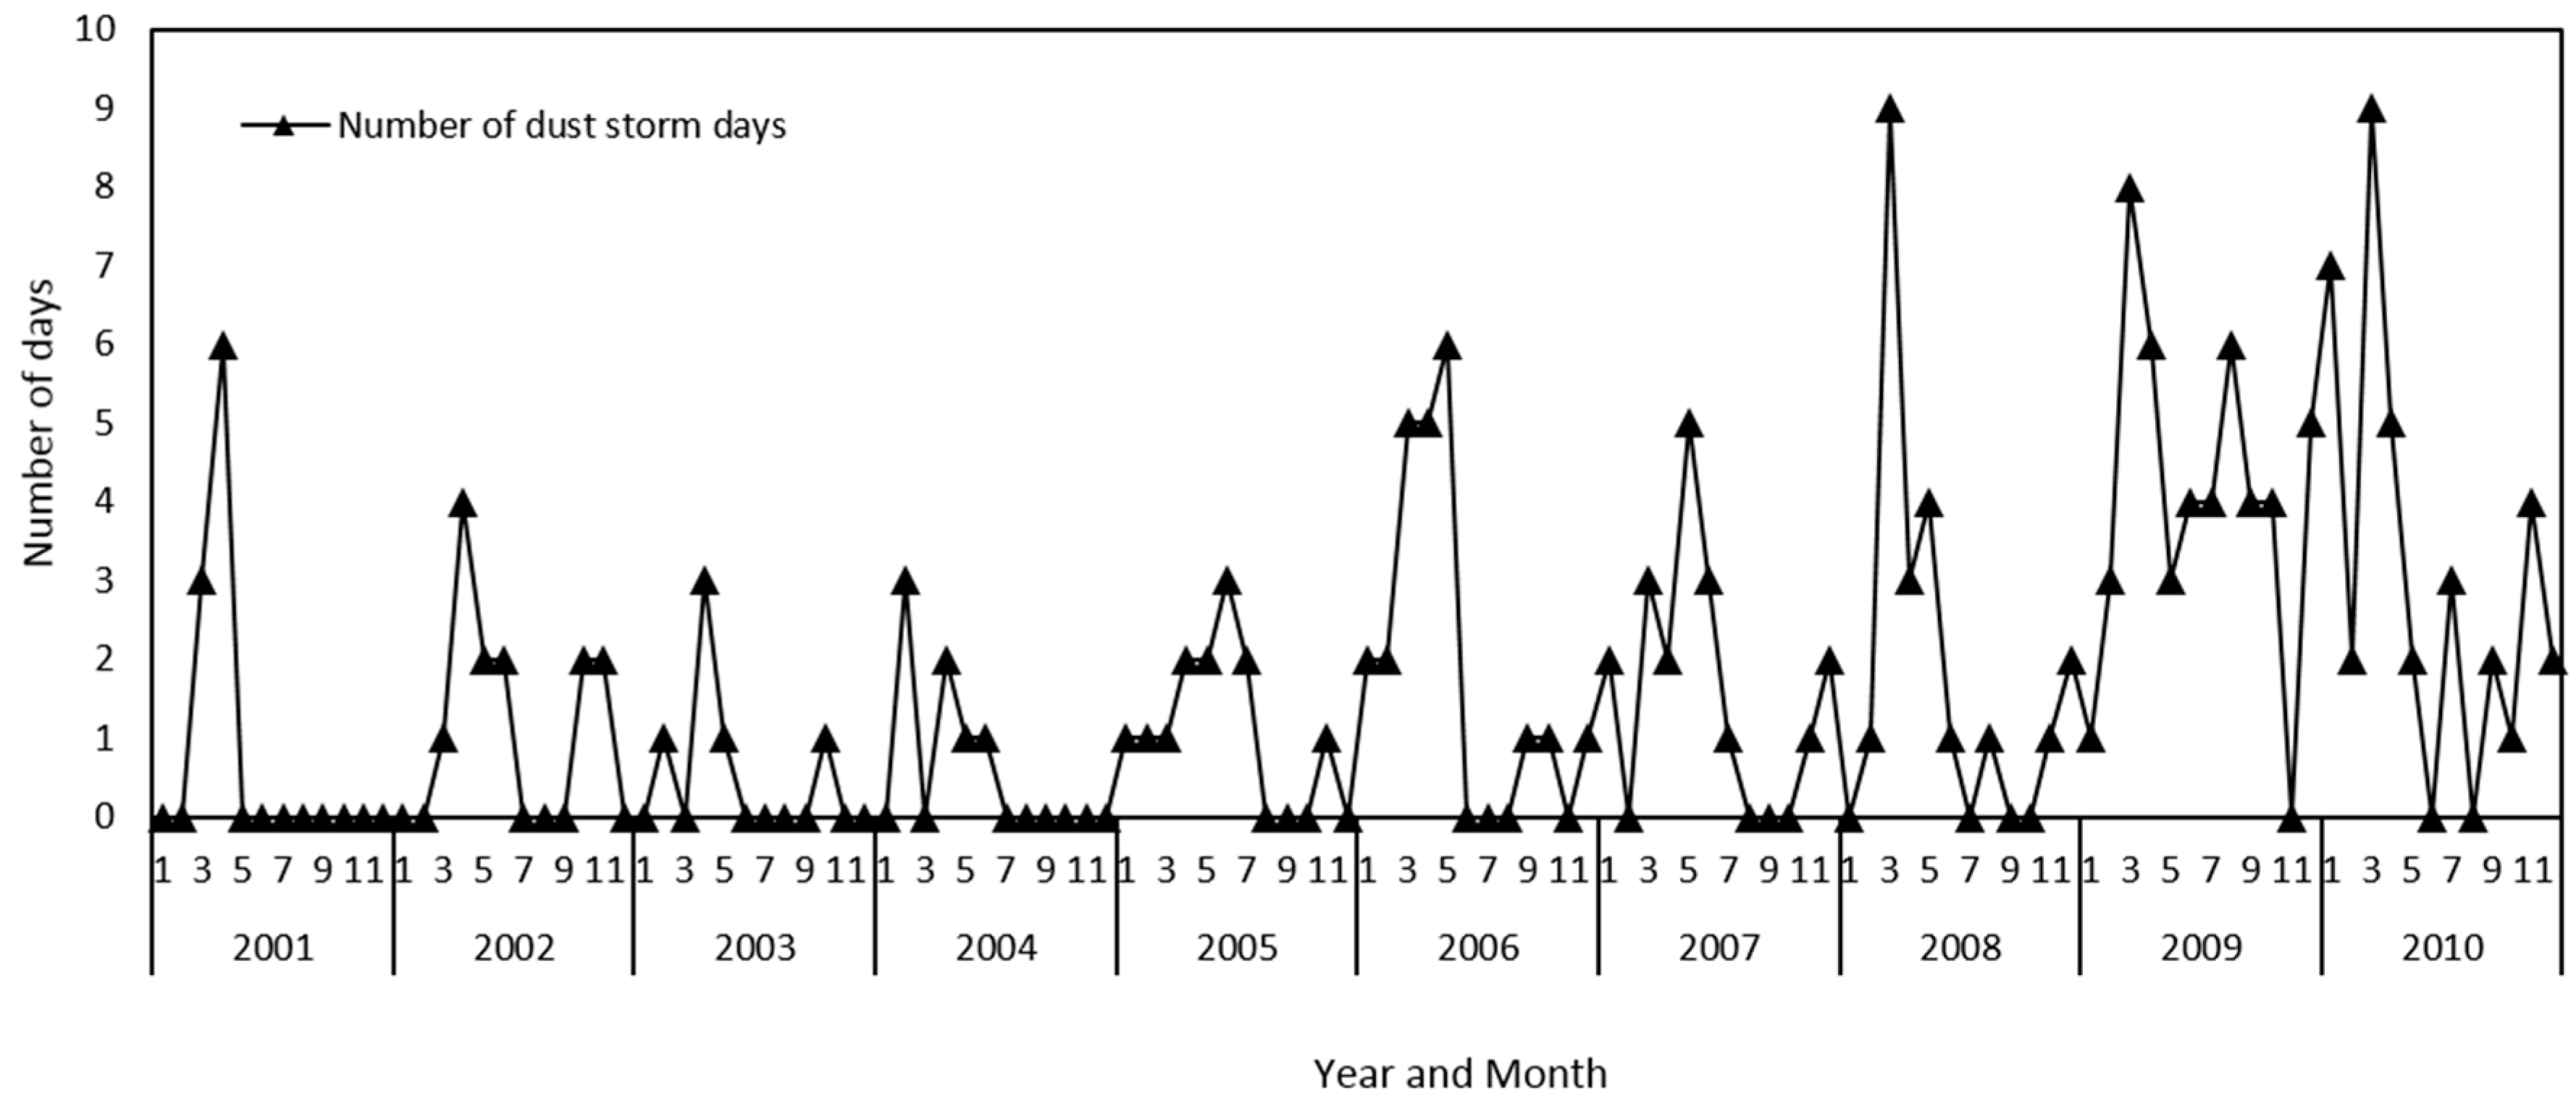
2.1.3. Dust Storm Monitoring Data

The WMO SYNOP surface weather data was used as the number of dust storm days. This data is daily data and recorded as 1 when dust storms are observed visually in a day. The data used in this study was obtained from 8 stations (Figure 1). The available period of this data is between 2001 and 2010.

2.2. Methods

We examined the spatiotemporal and seasonal variations, as well as the anomaly patterns for the monthly time series from 1985 to 2013. The growing season was defined by examining the long-term mean patterns of both precipitation and NDVI as shown in Figure 2a,b. Respectively, and with reference to long-term patterns of annual average precipitation distribution [22]. The months of May through September were selected to represent the average start and end of the Growing Season, referred to here as GS using Figure 2. These figures were created from the results of calculating the monthly average of precipitation and NDVI during the study period. This shows the long-term mean for this region. Interannual variability in the NDVI pattern was examined by calculating yearly GS anomalies as follows;
NDVI σ = [ ( ( NDVI α ) / ( NDVI μ ) 1 ) × 100 ]
where NDVIσ are the respective GS percent anomalies, NDVIα are individual seasonal GS means and NDVIμ is the long-term GS mean. We also examined the precipitation anomalies during GS using the same method as that used for NDVI anomalies. Then we used the cumulative values of precipitation during GS. In addition, we performed cross correlation analysis between the cumulative precipitation and averaged NDVI for 15 days by averaging pixels in (1° × 1°) and verified the results of comparison with both trends. Cross-correlation is a generalization of the correlation measure as it takes into account the lag of NDVI relative to precipitation. Here, 1 time lag shows that there is 15 days lag between NDVI and precipitation. Cross-correlation is particularly important to assess the causal relationship between two signals in time. The analysis period is determined by the period of daily precipitation data from 1996 to 2013. Furthermore, we performed a single regression analysis to confirm the relationship between vegetation in GS with the number of days in which dust storms occurred during the following spring and also precipitation in GS at each of the 8 stations.

3. Results

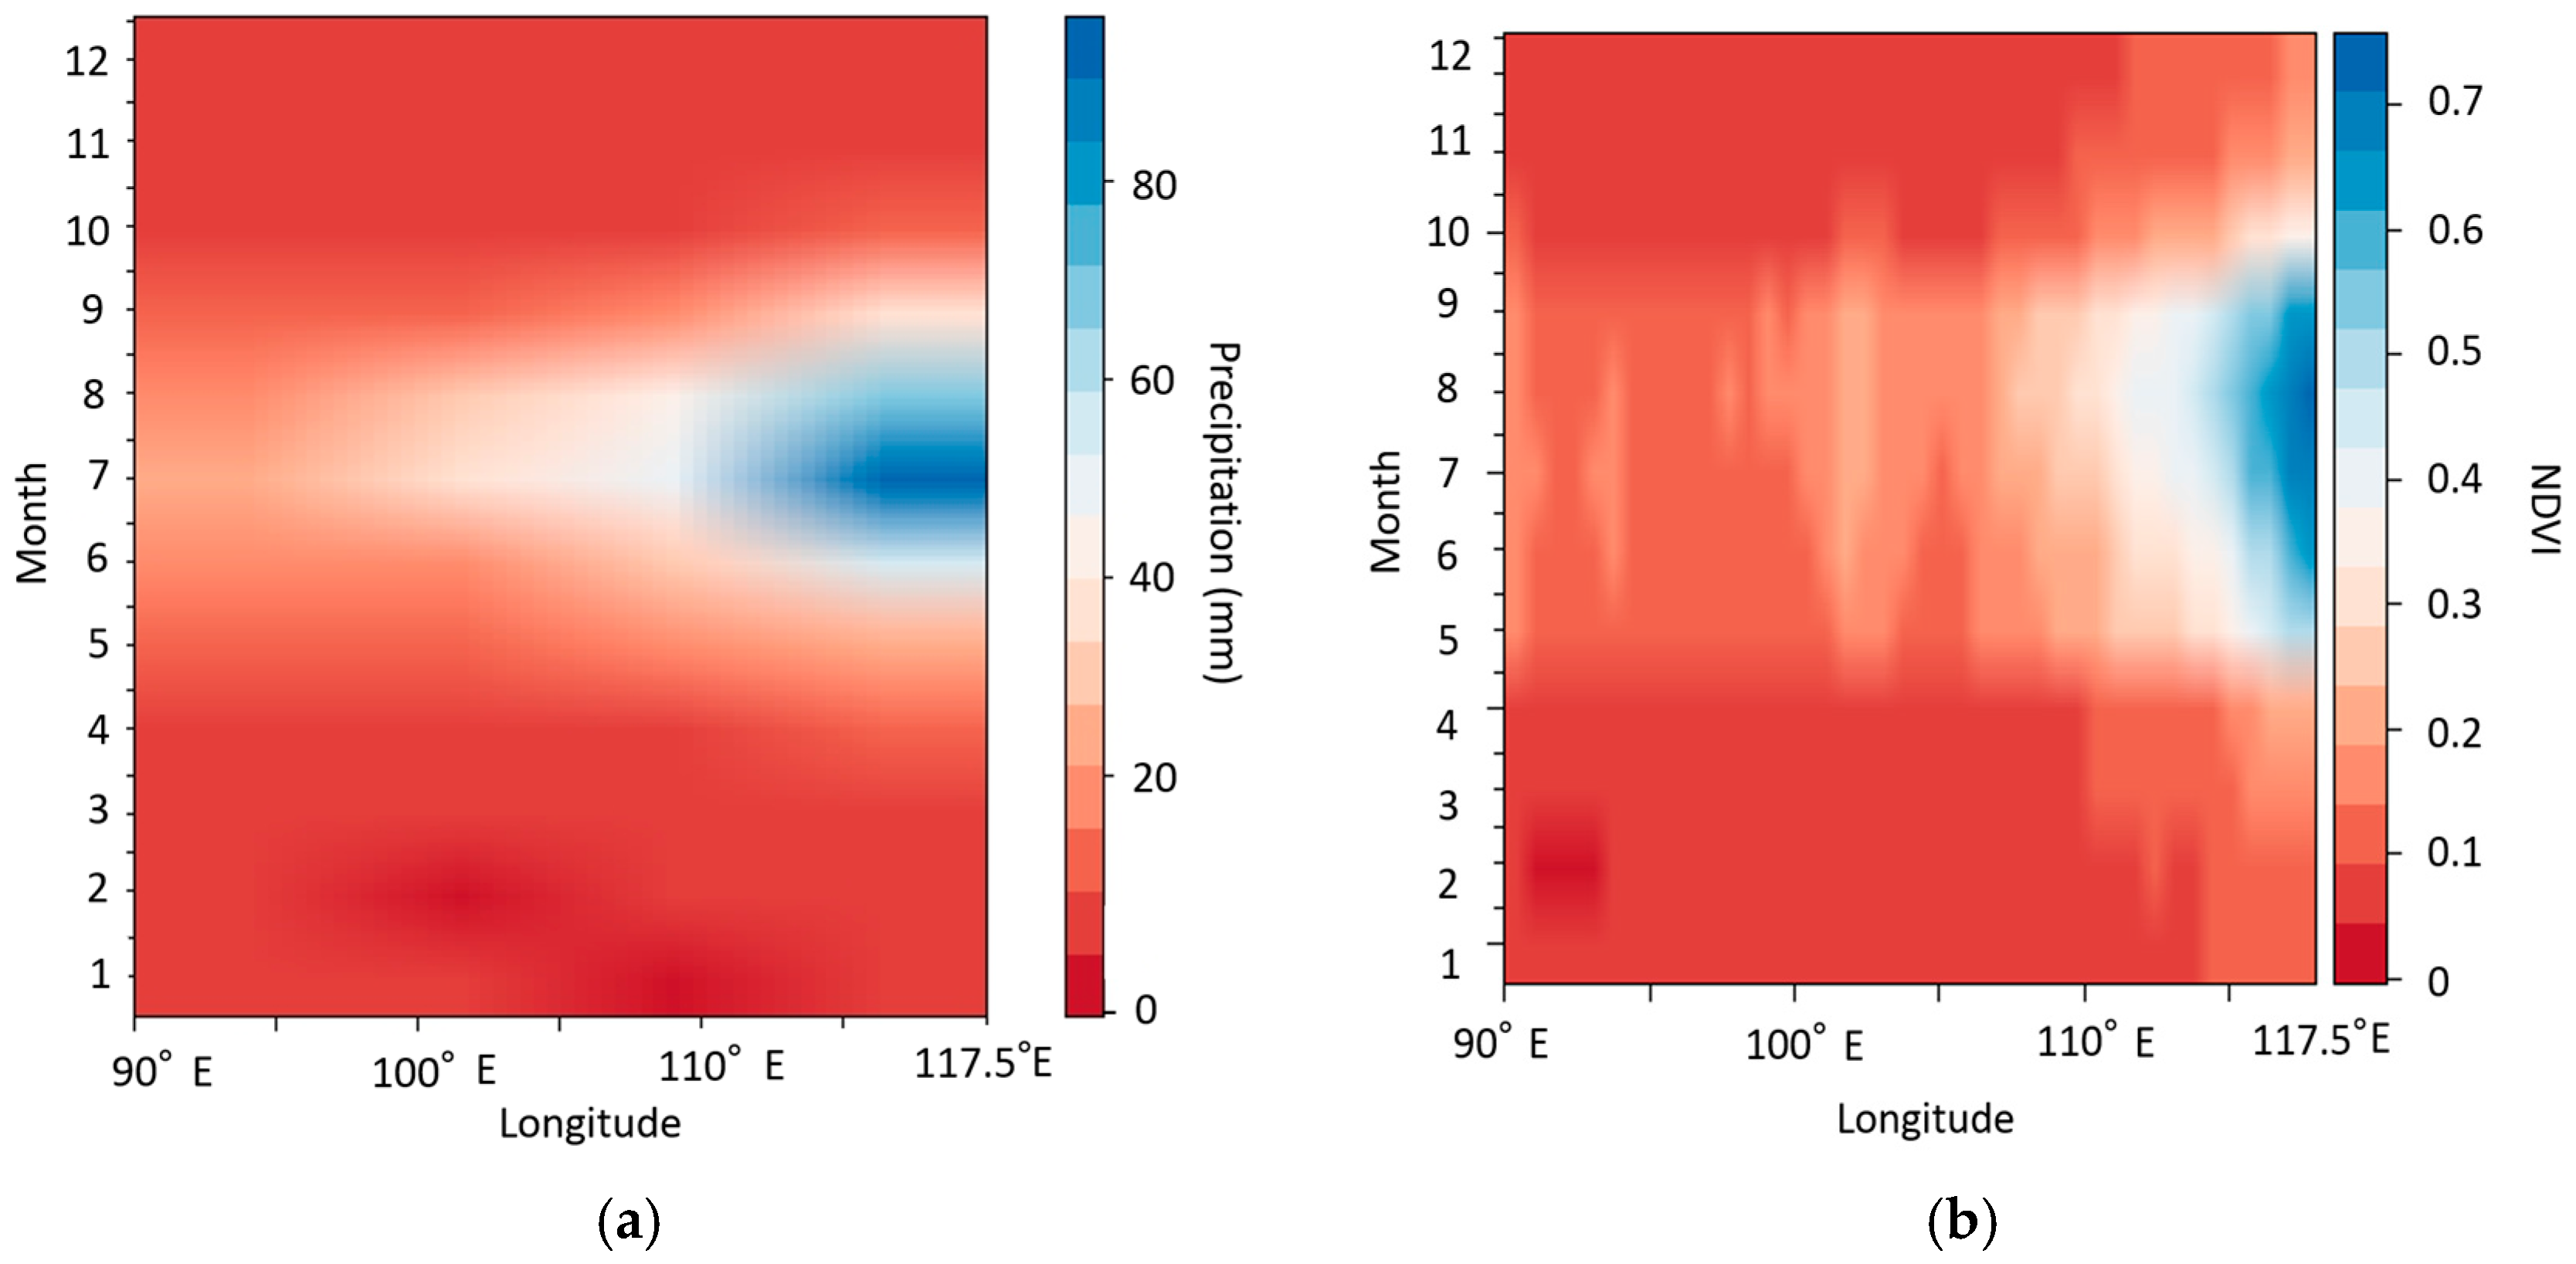
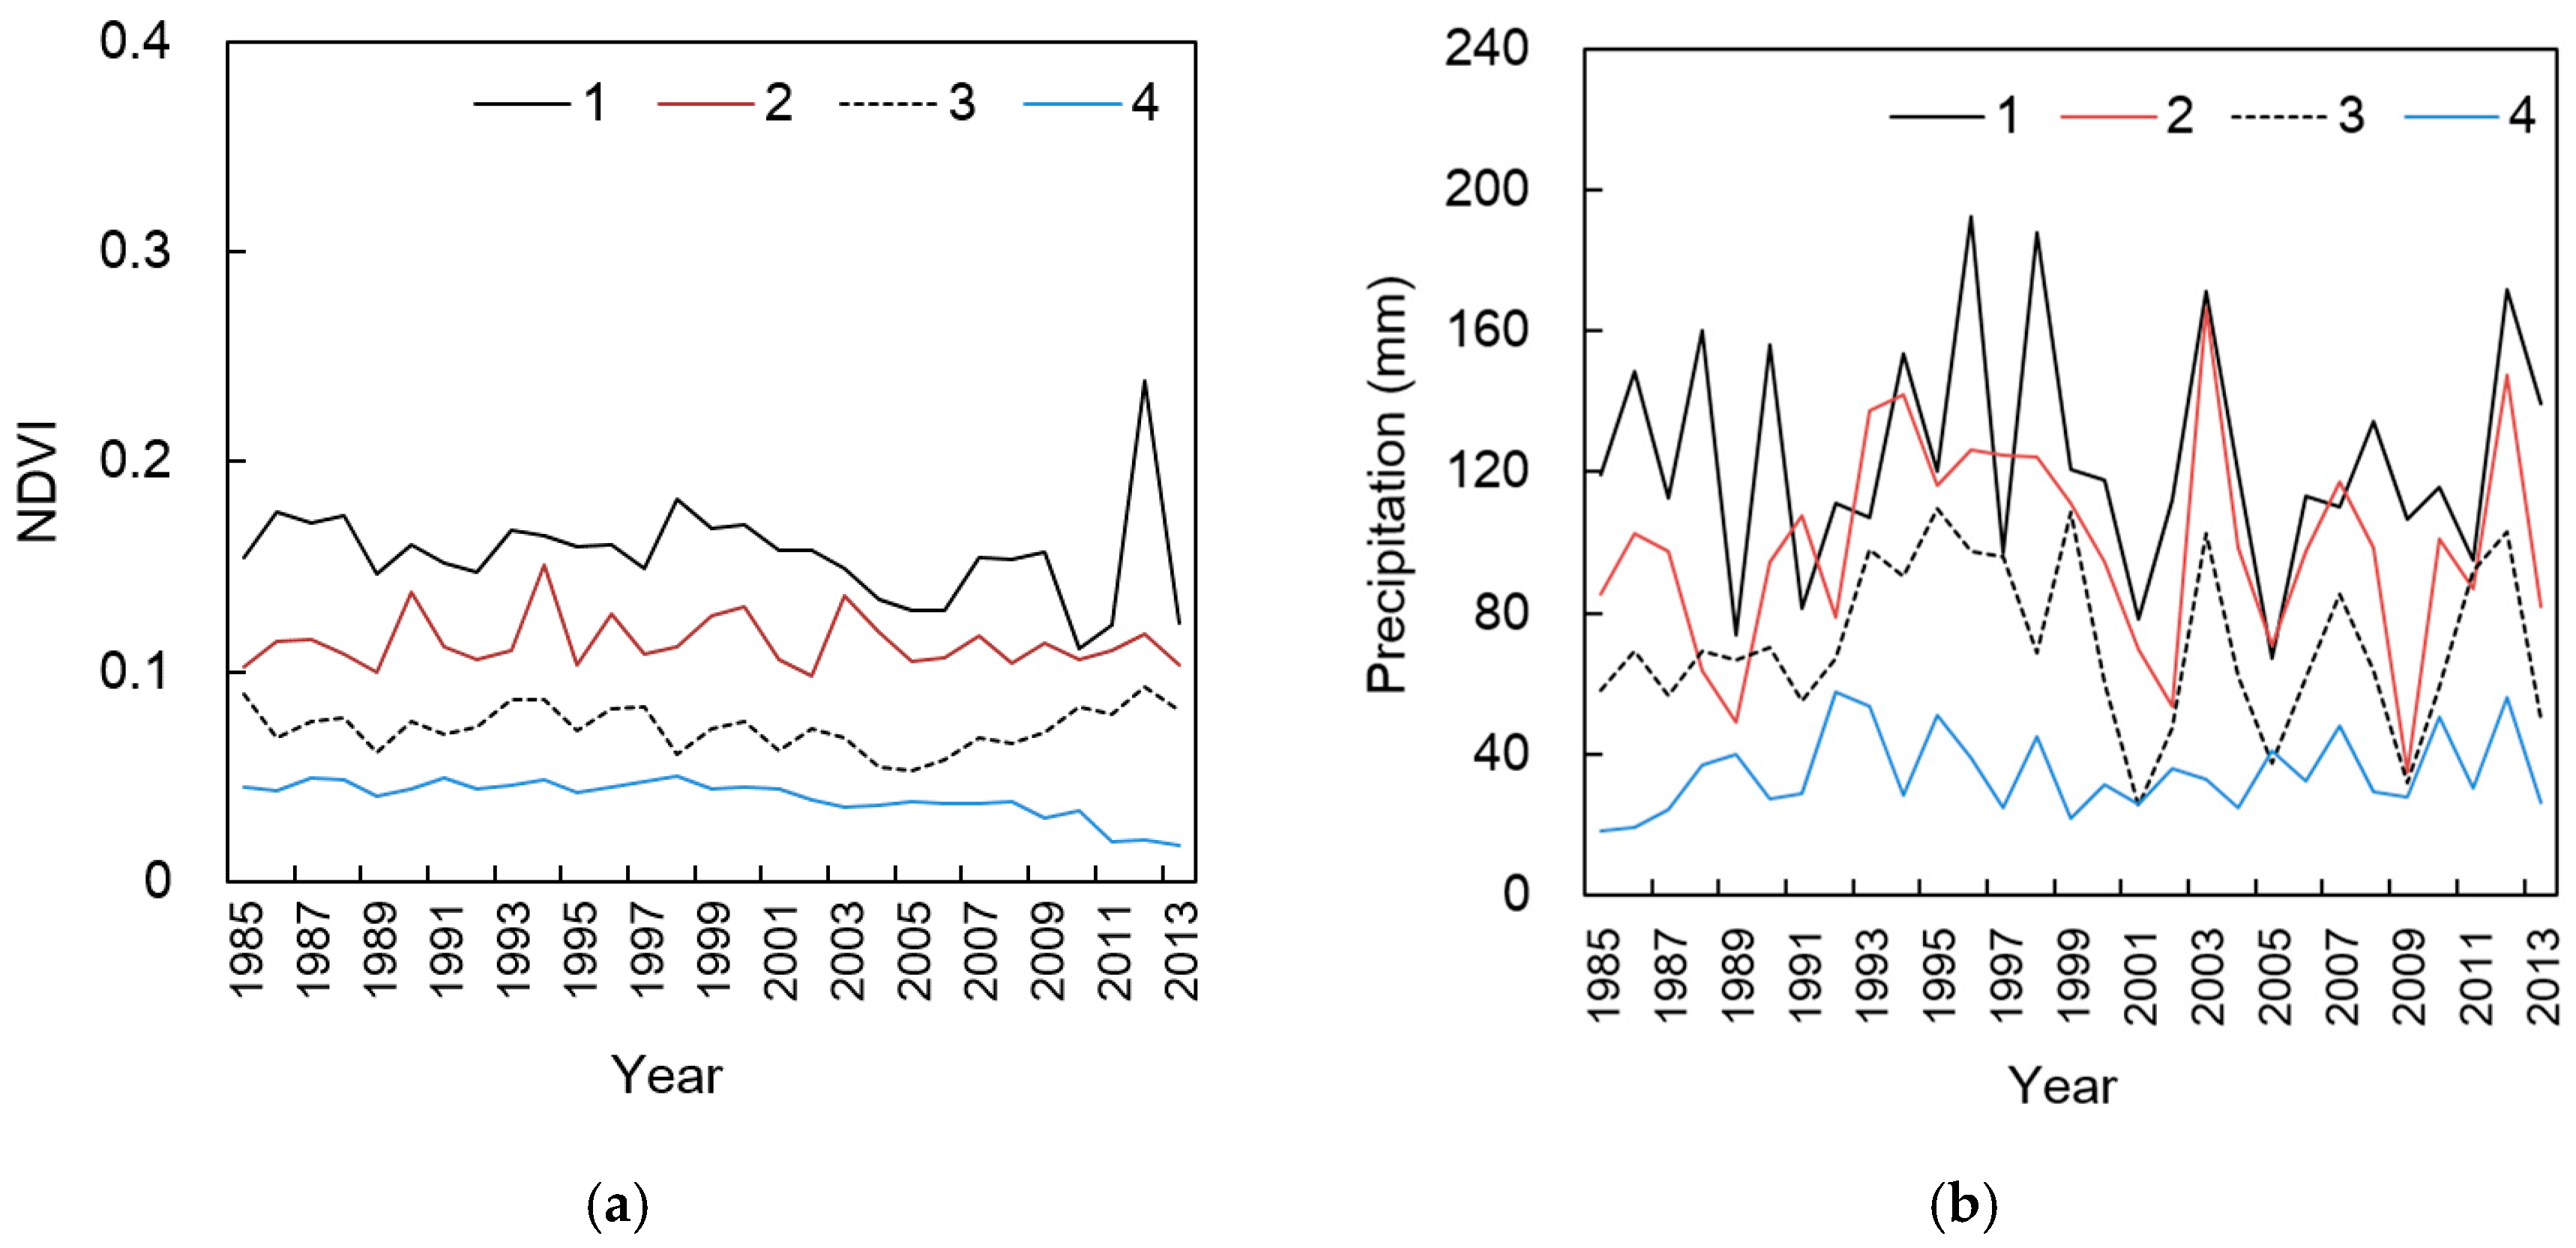
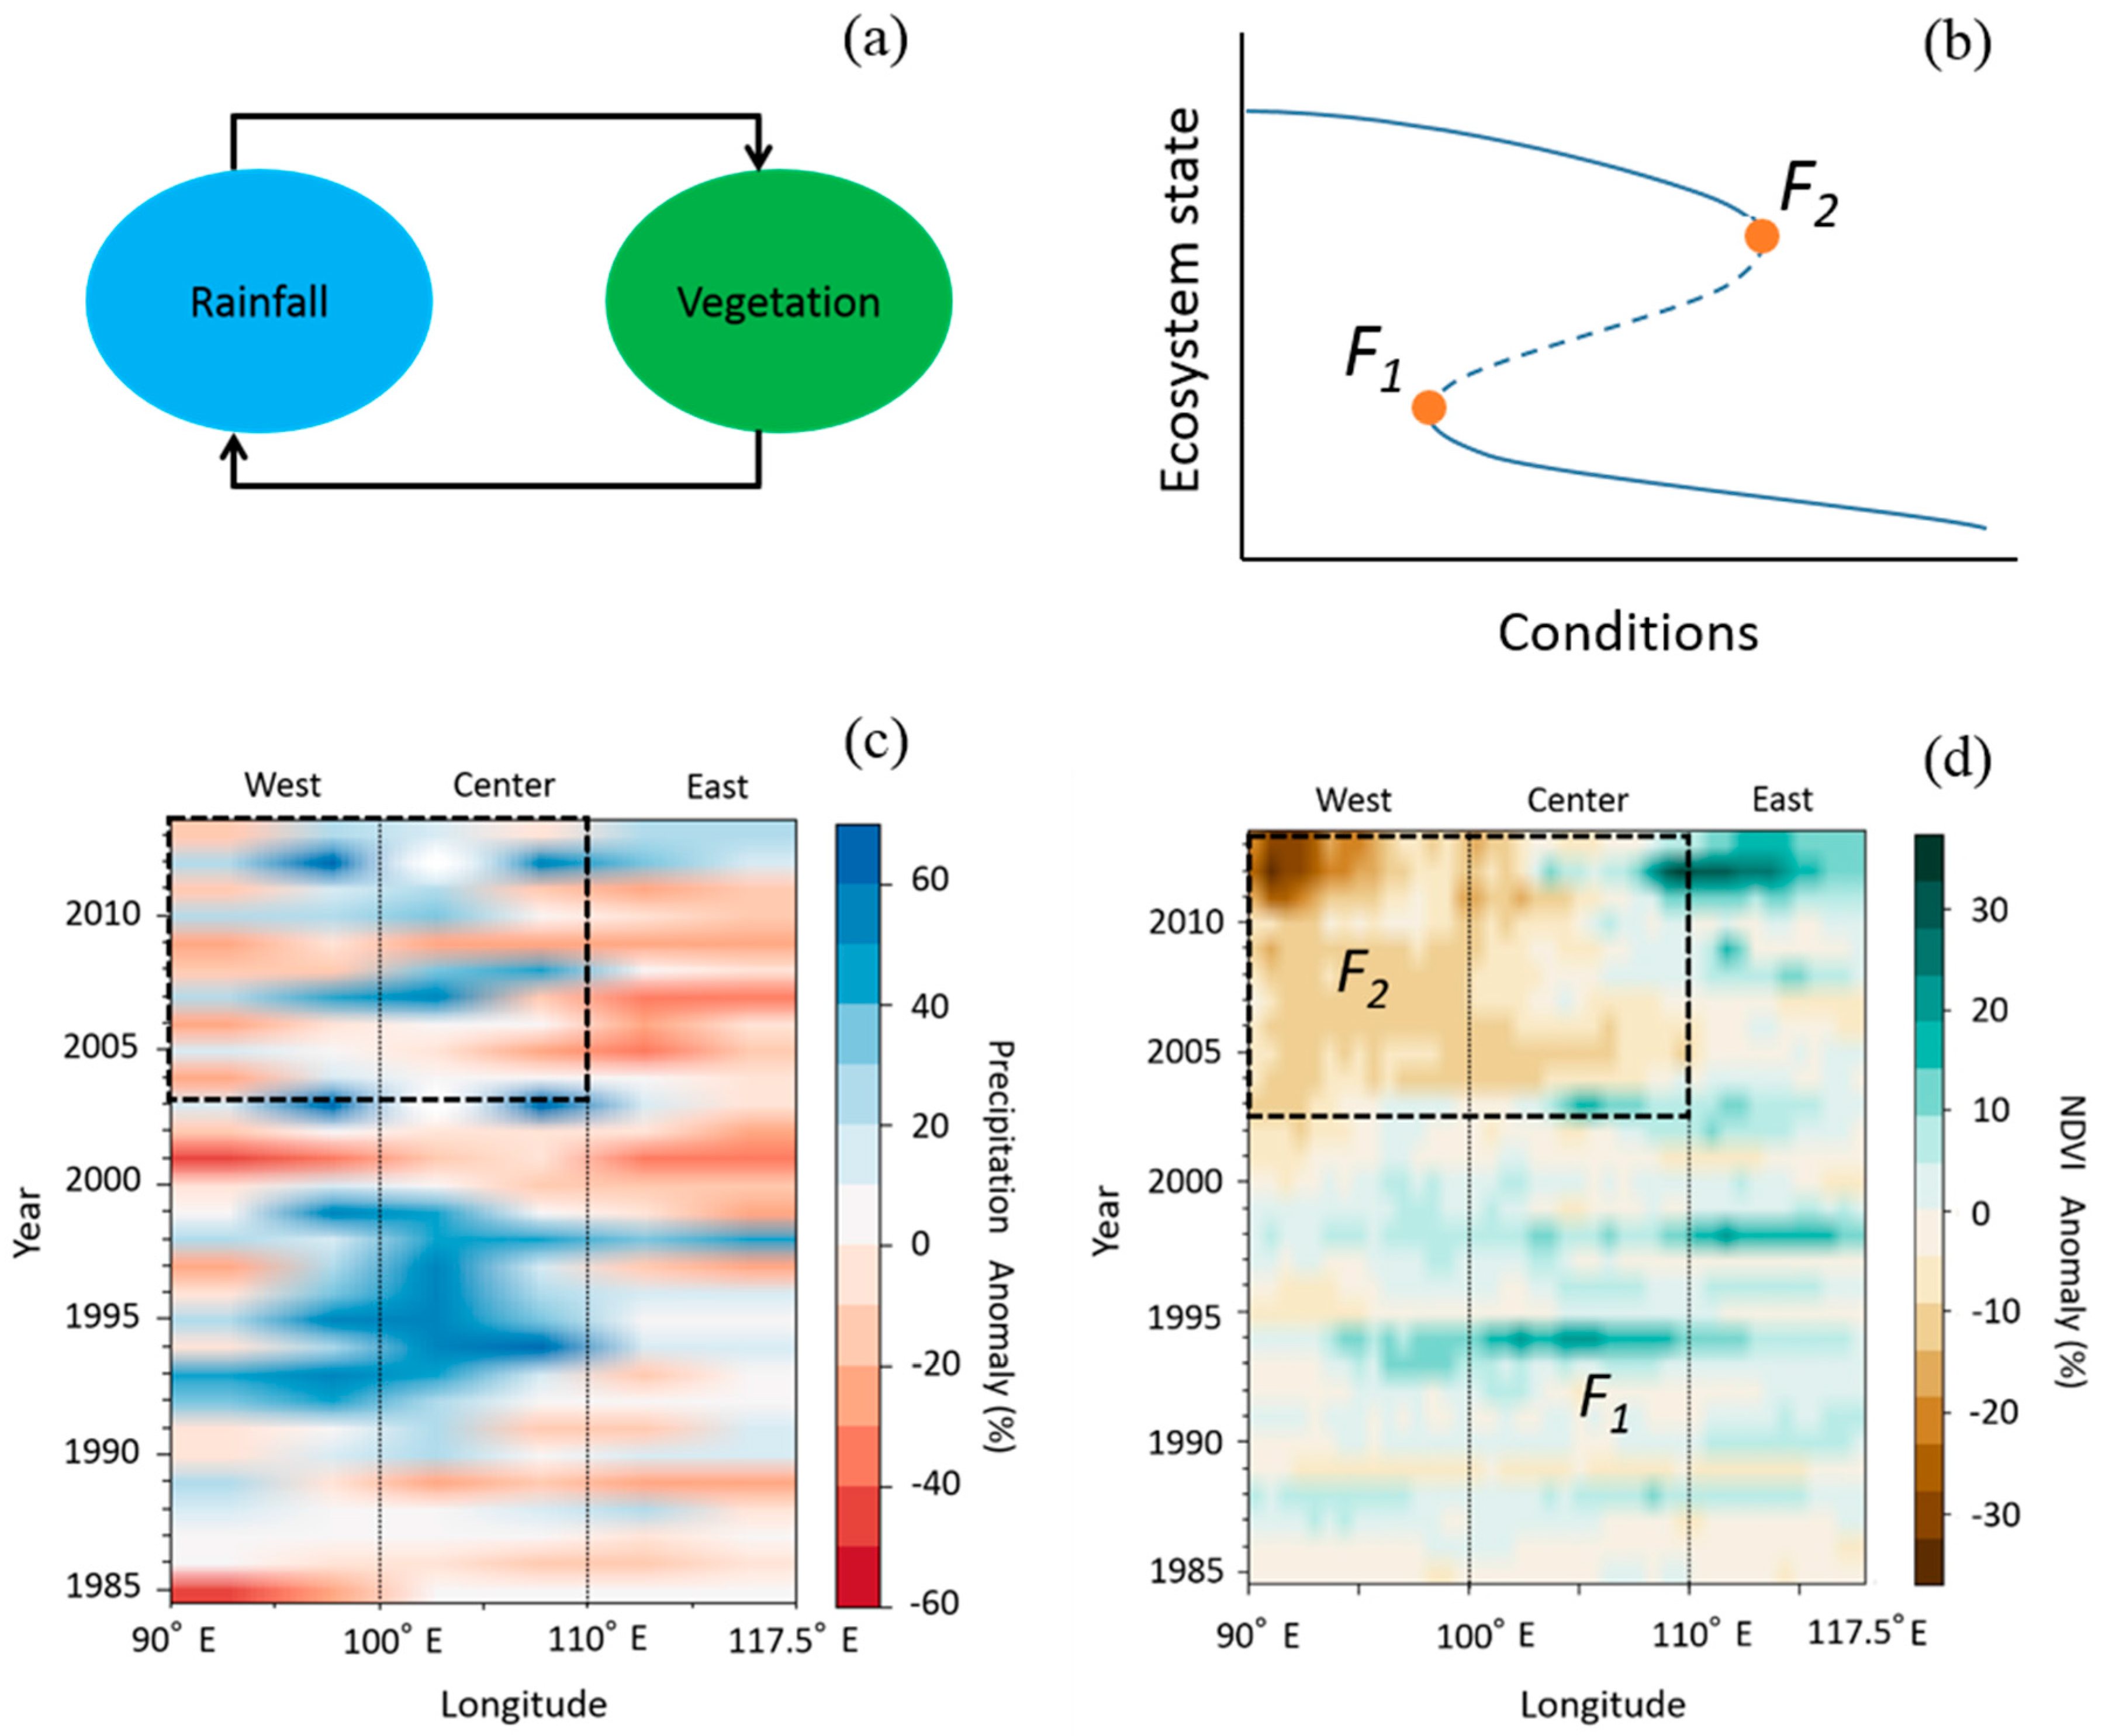
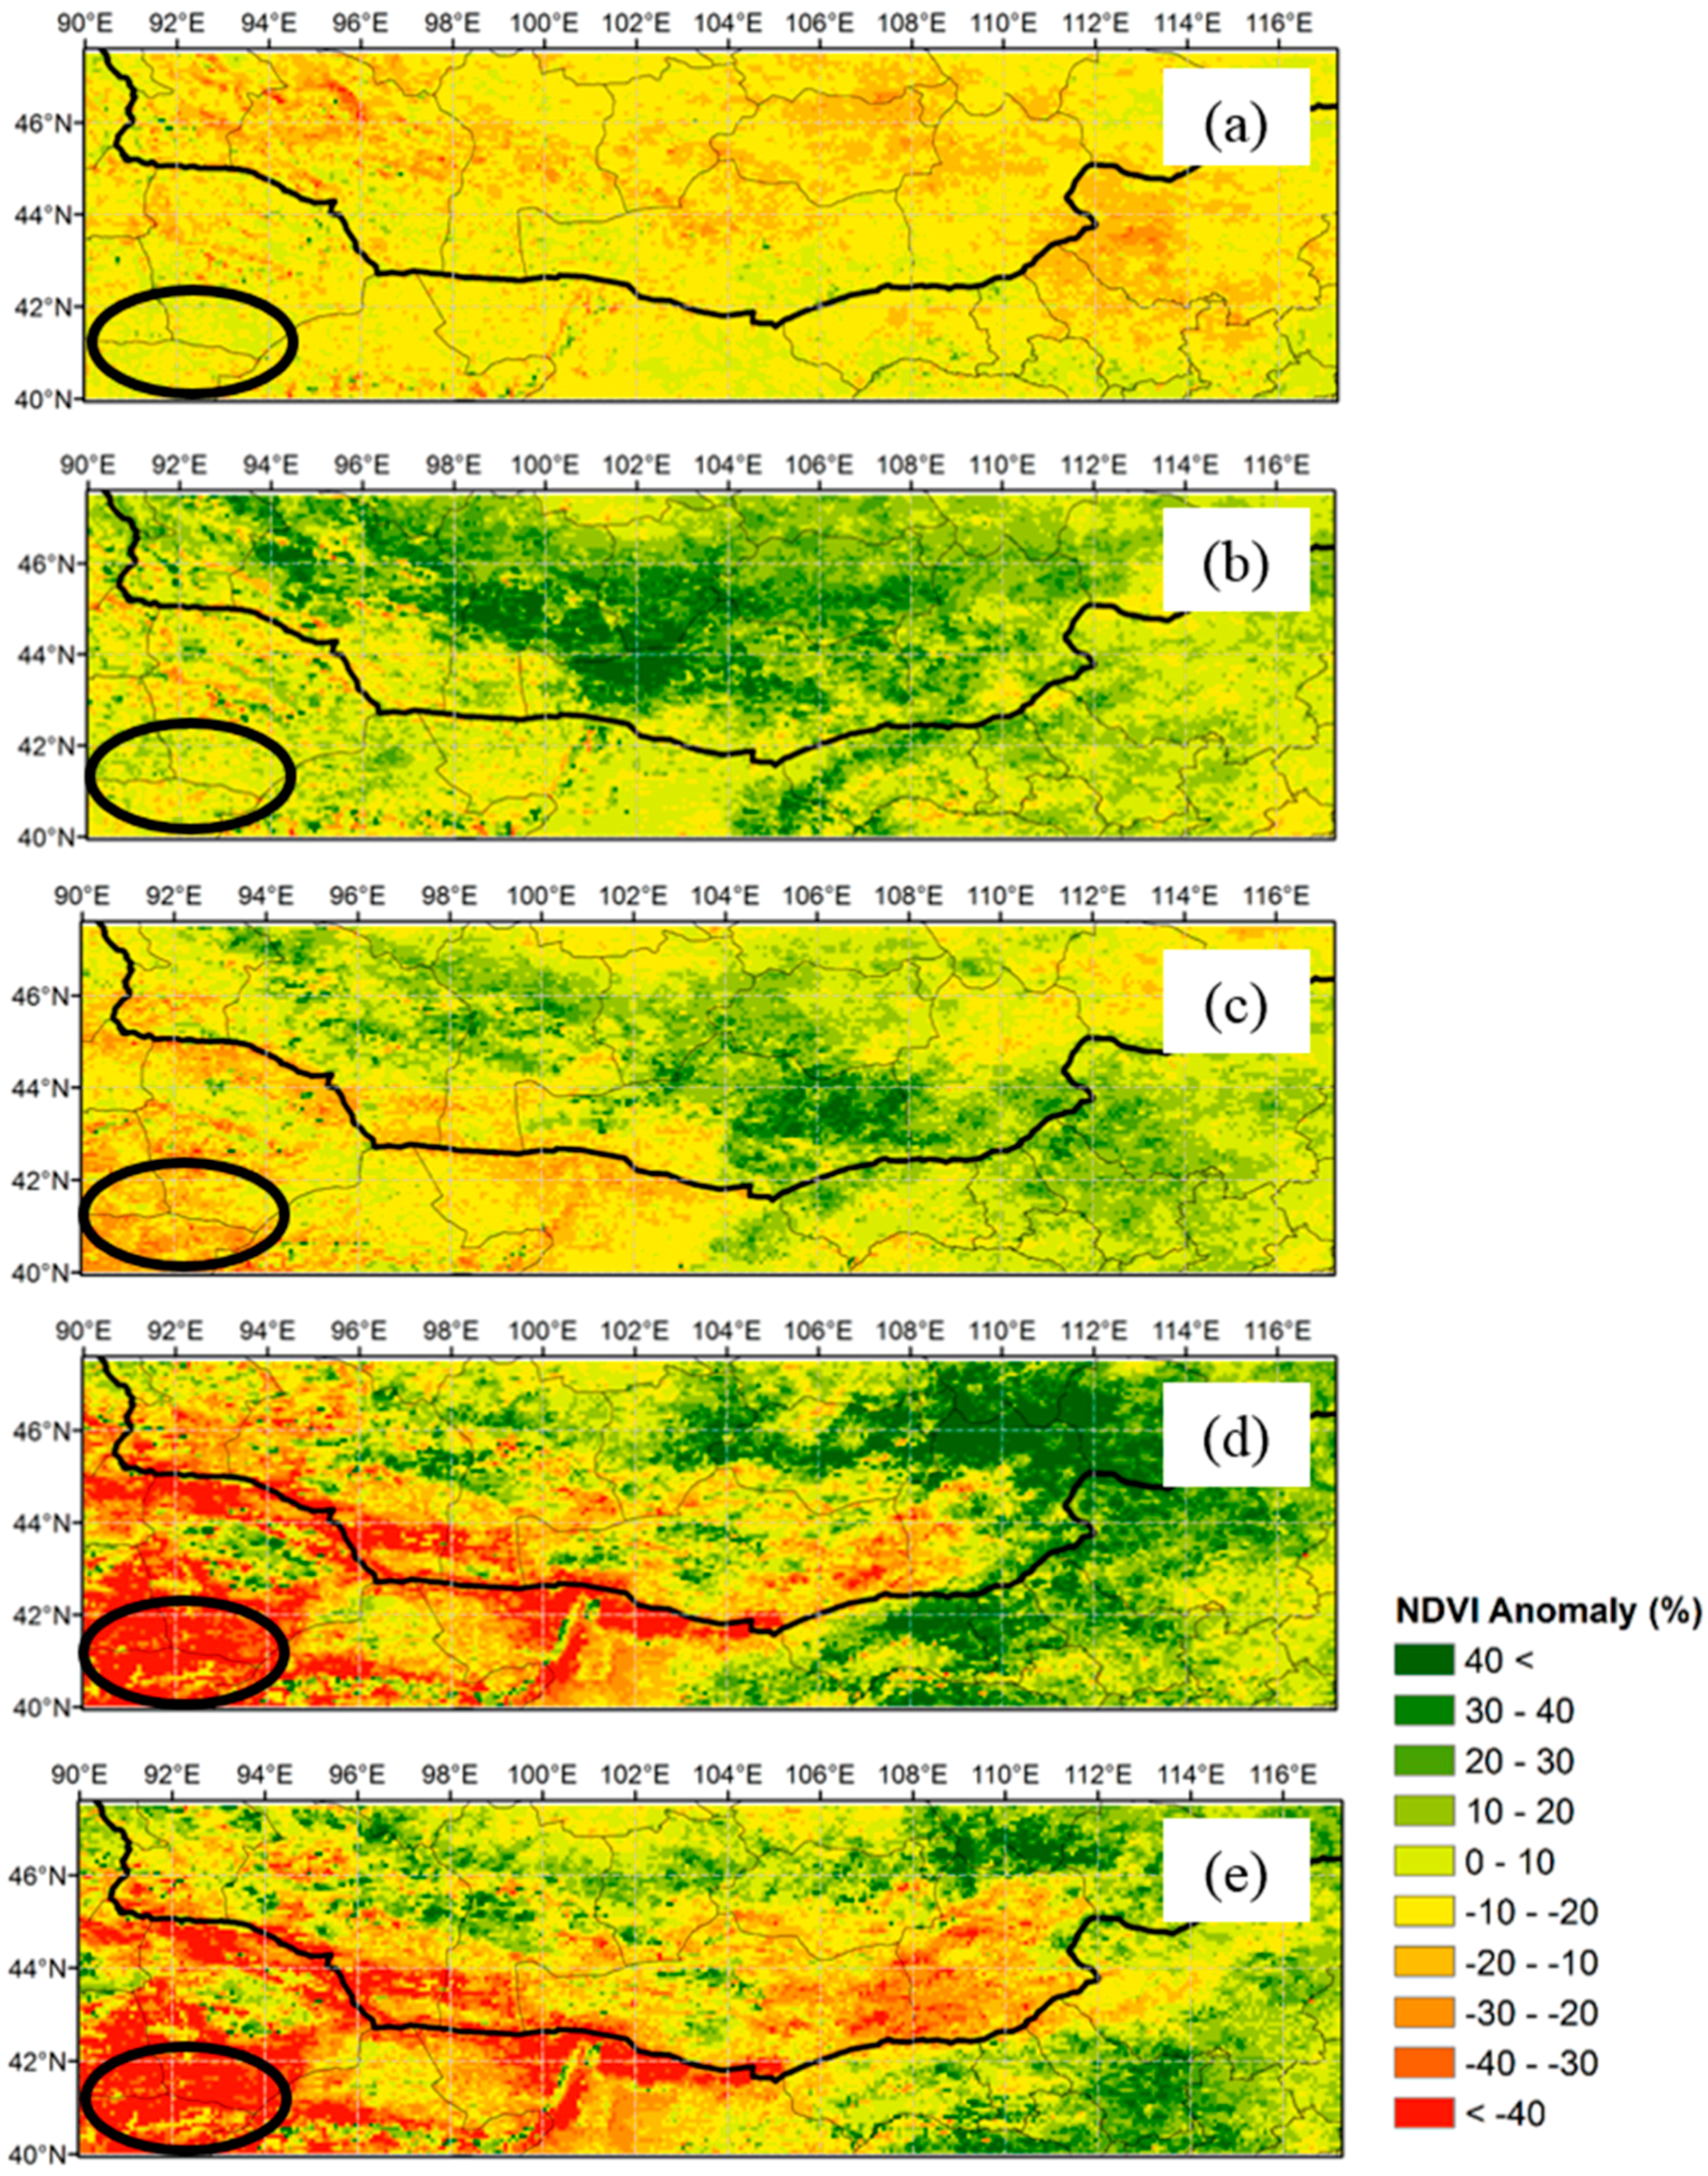
3.1. Spatial Patterns and Trends for Vegetation Response to Precipitation

The time series anomaly for the region are depicted by the Hovmoller diagram for the period from January 1985 to December 2013 (Figure 3a,b). It was considered that variation in vegetation arises due to a difference in distribution of climatological conventional precipitation in the monsoon season. The amount of precipitation, which is supplied by monsoons from the Pacific and Indian Oceans [23], differs greatly between east and west. Following Figure 2 and Figure 3, vegetation in the eastern region (from 110° E to 117.5° E), which had higher conventional precipitation, had a higher response to the precipitation than the other regions. In the eastern region, relatively low amounts of precipitation had been reported between 1999 and 2011. However, vegetation anomaly responds to a little increased precipitation such as 2003 and 2008. In contrast, in the central part of the study area (100° E from 110° E), a high response of vegetation to higher precipitation was observed such as in 1994, 1995 and 2003, but there was not high response to precipitation after 2005. The western region beginning from 100° E to 90° E showed a low response of vegetation to precipitation as compared to the east and central parts starting from 1985 due to the lower amount of conventional precipitation. However, there was no response of vegetation to precipitation especially since 2005. Fluctuations in precipitation anomaly with the whole region have increased especially since 2000. During the period 1985–1992, precipitation anomalies show almost normal precipitation conditions ranging between −20% and 10%. And during the period 1993–1999, precipitation anomalies show above normal precipitation conditions with positive anomalies ranging between 30% and 70% in the central region and part of western region. However, the period 2000–2013 increases a pattern of below normal precipitation conditions. In this period, the extreme negative value was less than 40% below normal. According to Figure 3, from 1985 to 2000, the NDVI patterns almost agreed with precipitation patterns. NDVI in the eastern region had kept this pattern after 2000 as well. Contrary to this, a part of the center region and whole western region had a negative trend especially from 2010 and did not recover in the following years with greater values of precipitation. It is assumed that this area had become desertified. This region includes Xinjiang, which is very sensitive to climate change [24].
Time series of NDVI and precipitation for selected locations across the Gobi region for the period from 1985 to 2013 are shown in Figure 4. The data presented here are averaged NDVI values and cumulative precipitation for GS at each point. Sites 1 and 2 showed no change in trends of NDVI through the time series. On the other hand, site 3 showed a positive trend from 2003, and site 4 showed a negative trend from around 2009. There was a big difference in variation in NDVI values for sites 1 to 4. Sites 1 and 2 had a relatively large variation of NDVI year to year following precipitation variation. Conversely, sites 3 and 4 had a small variation. Site 4 especially shows a declining trend since 2010.

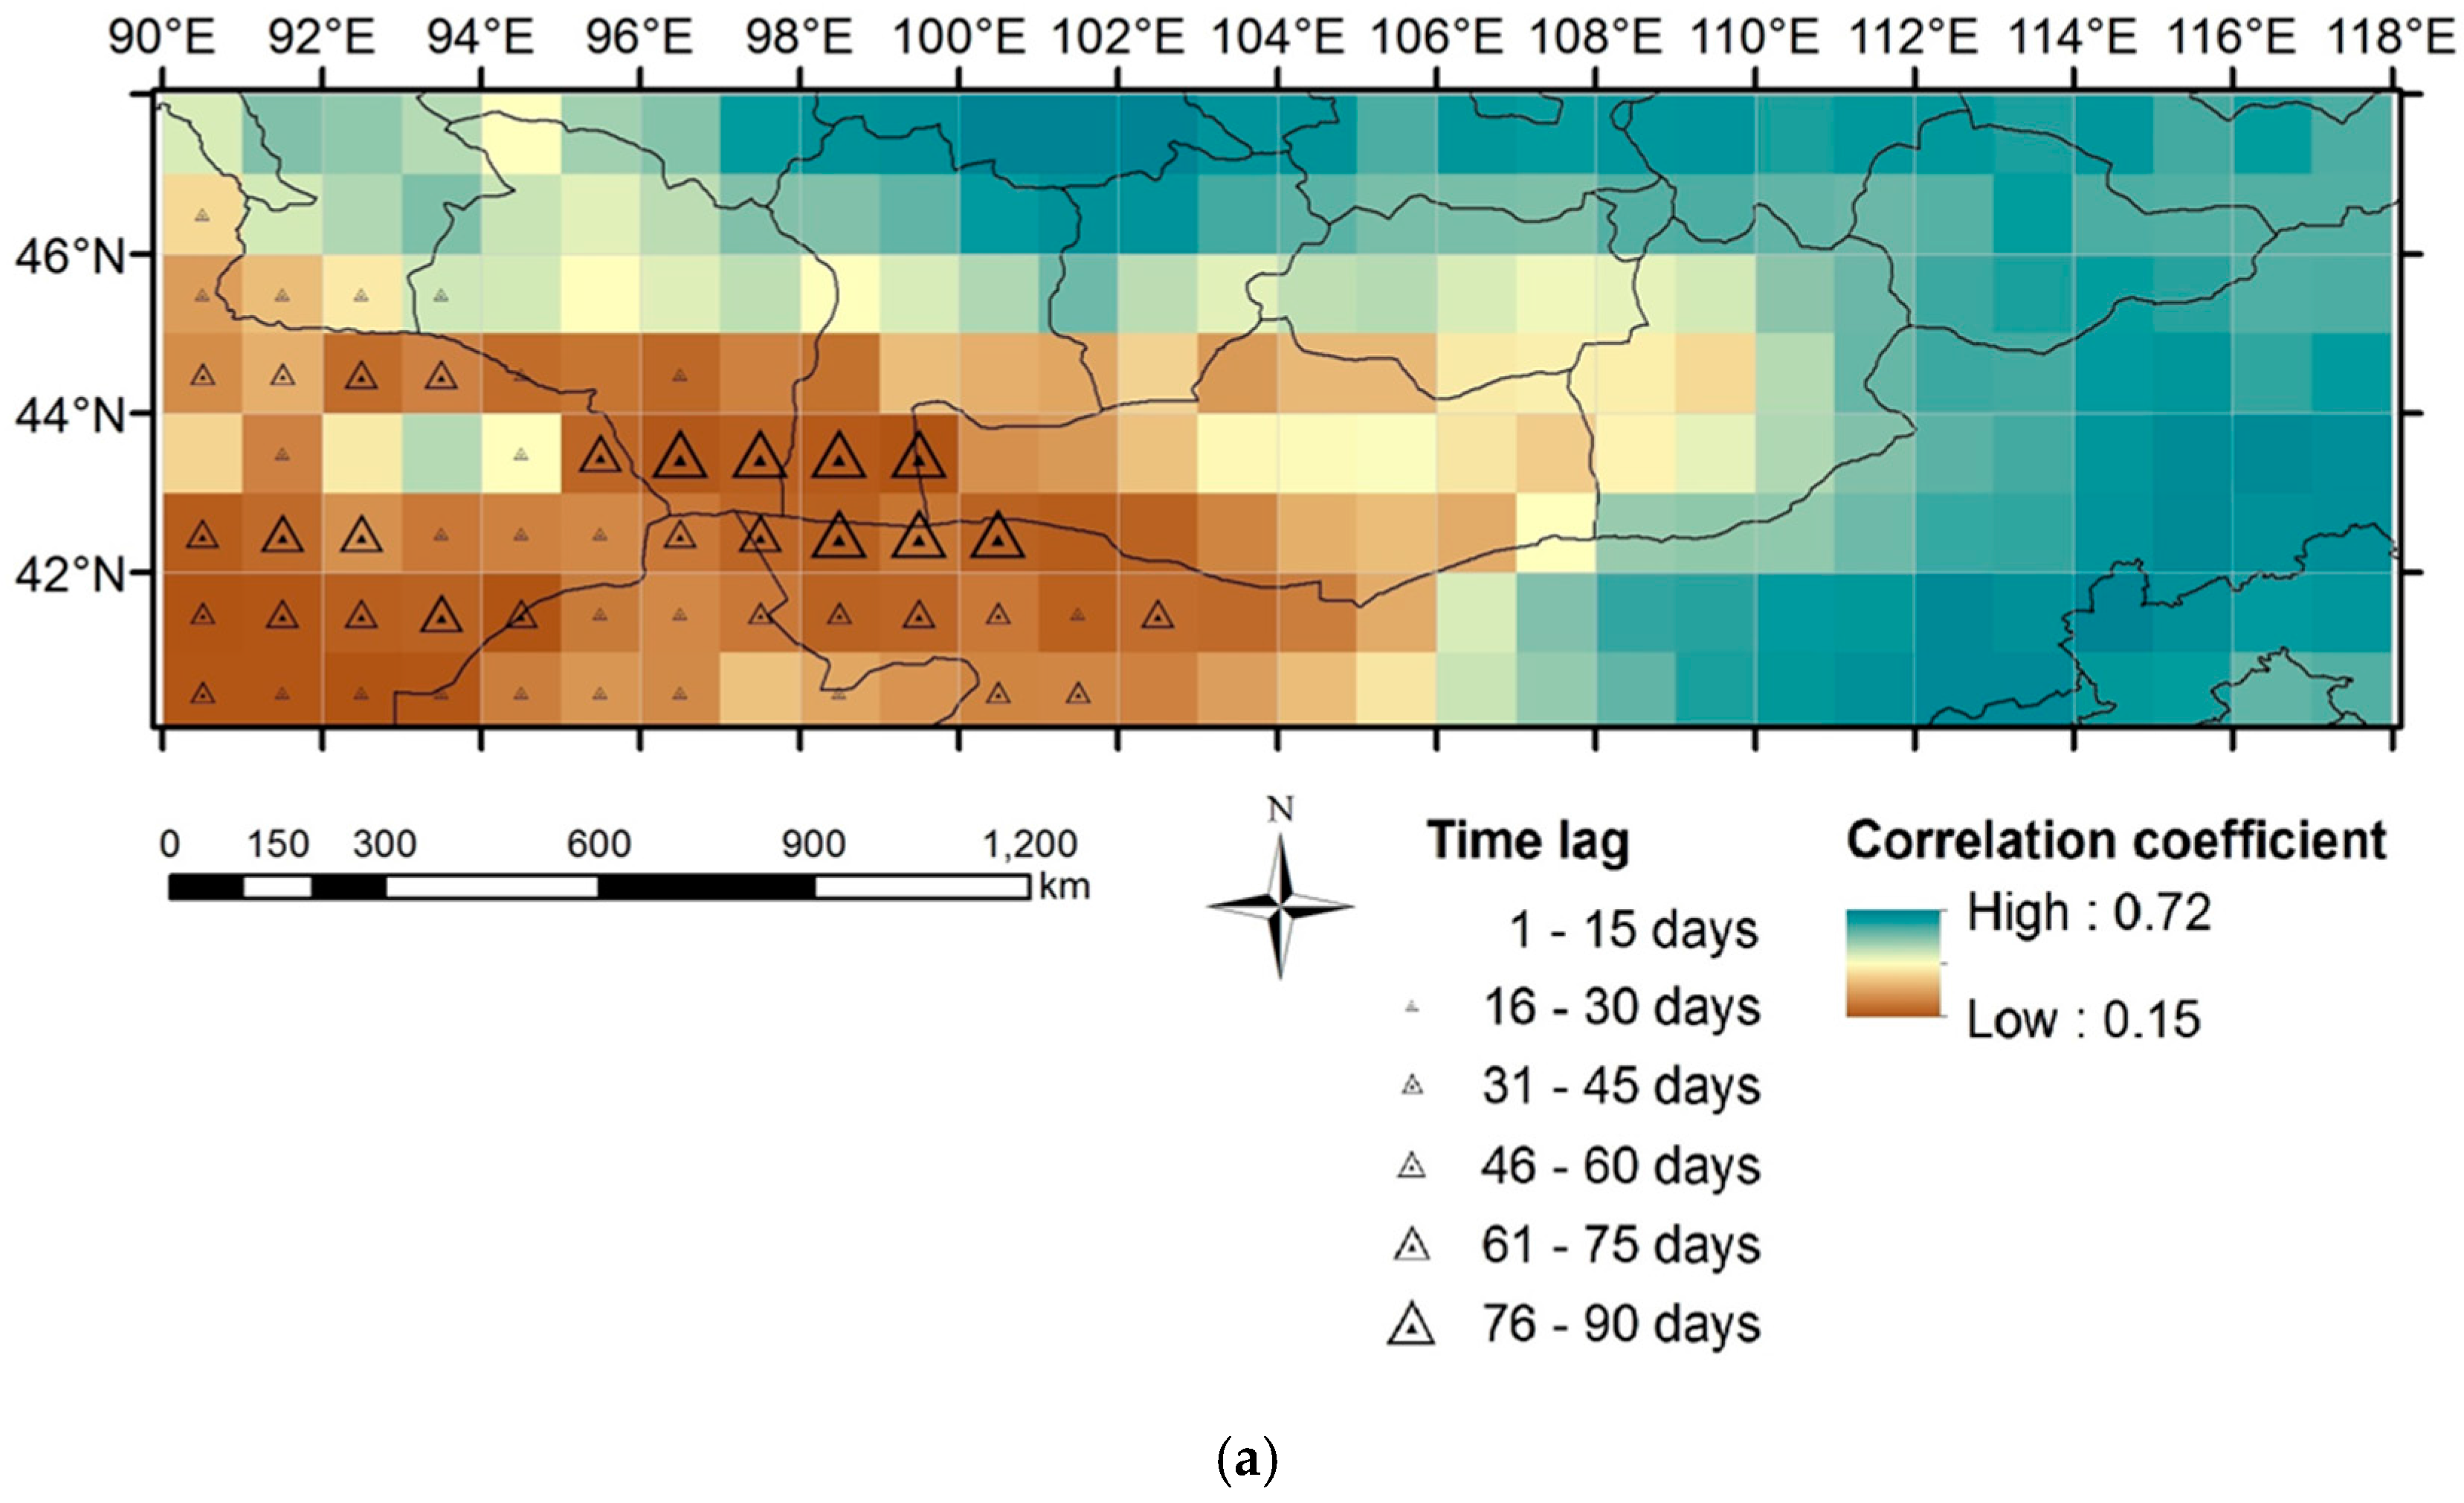
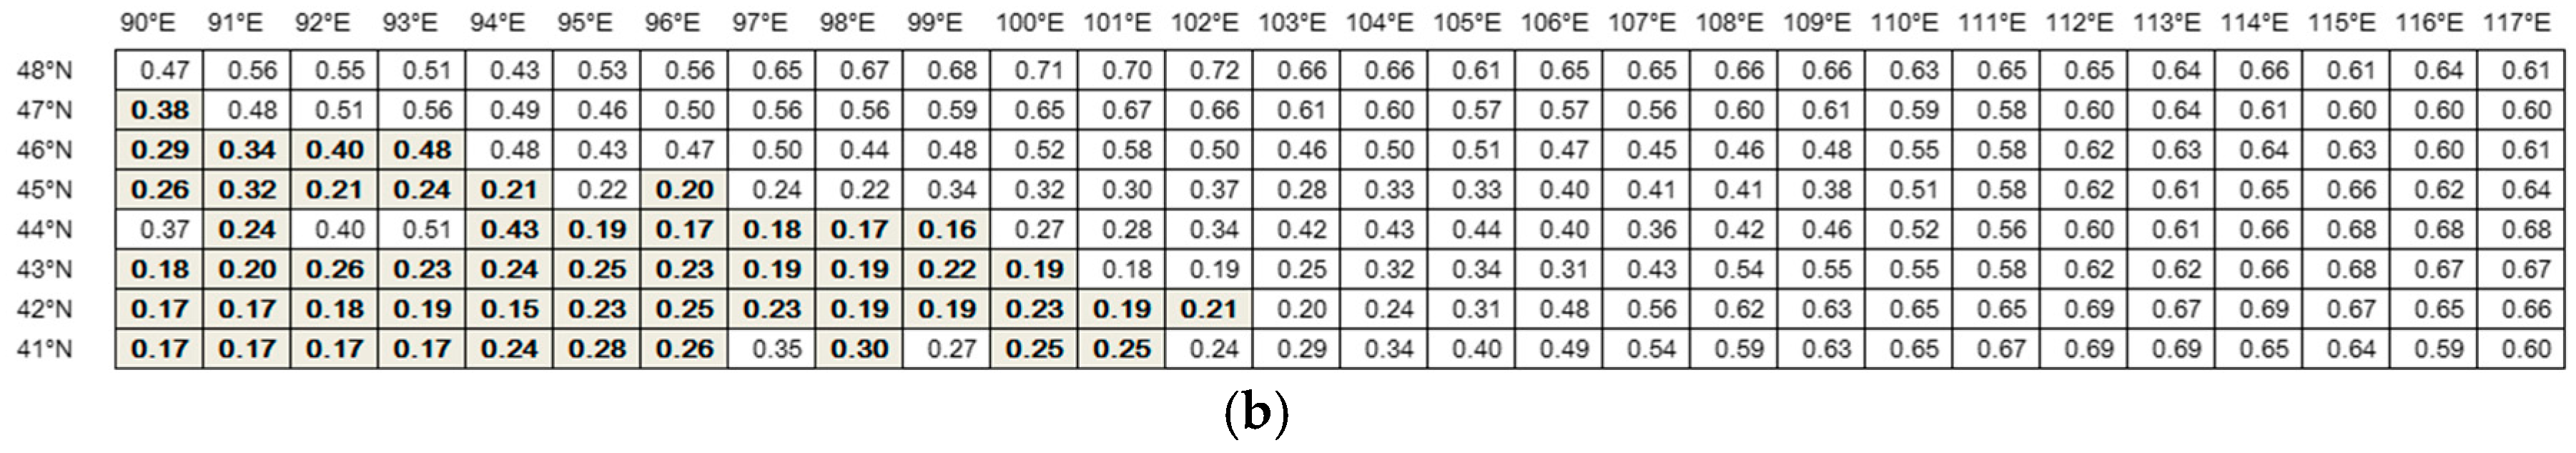
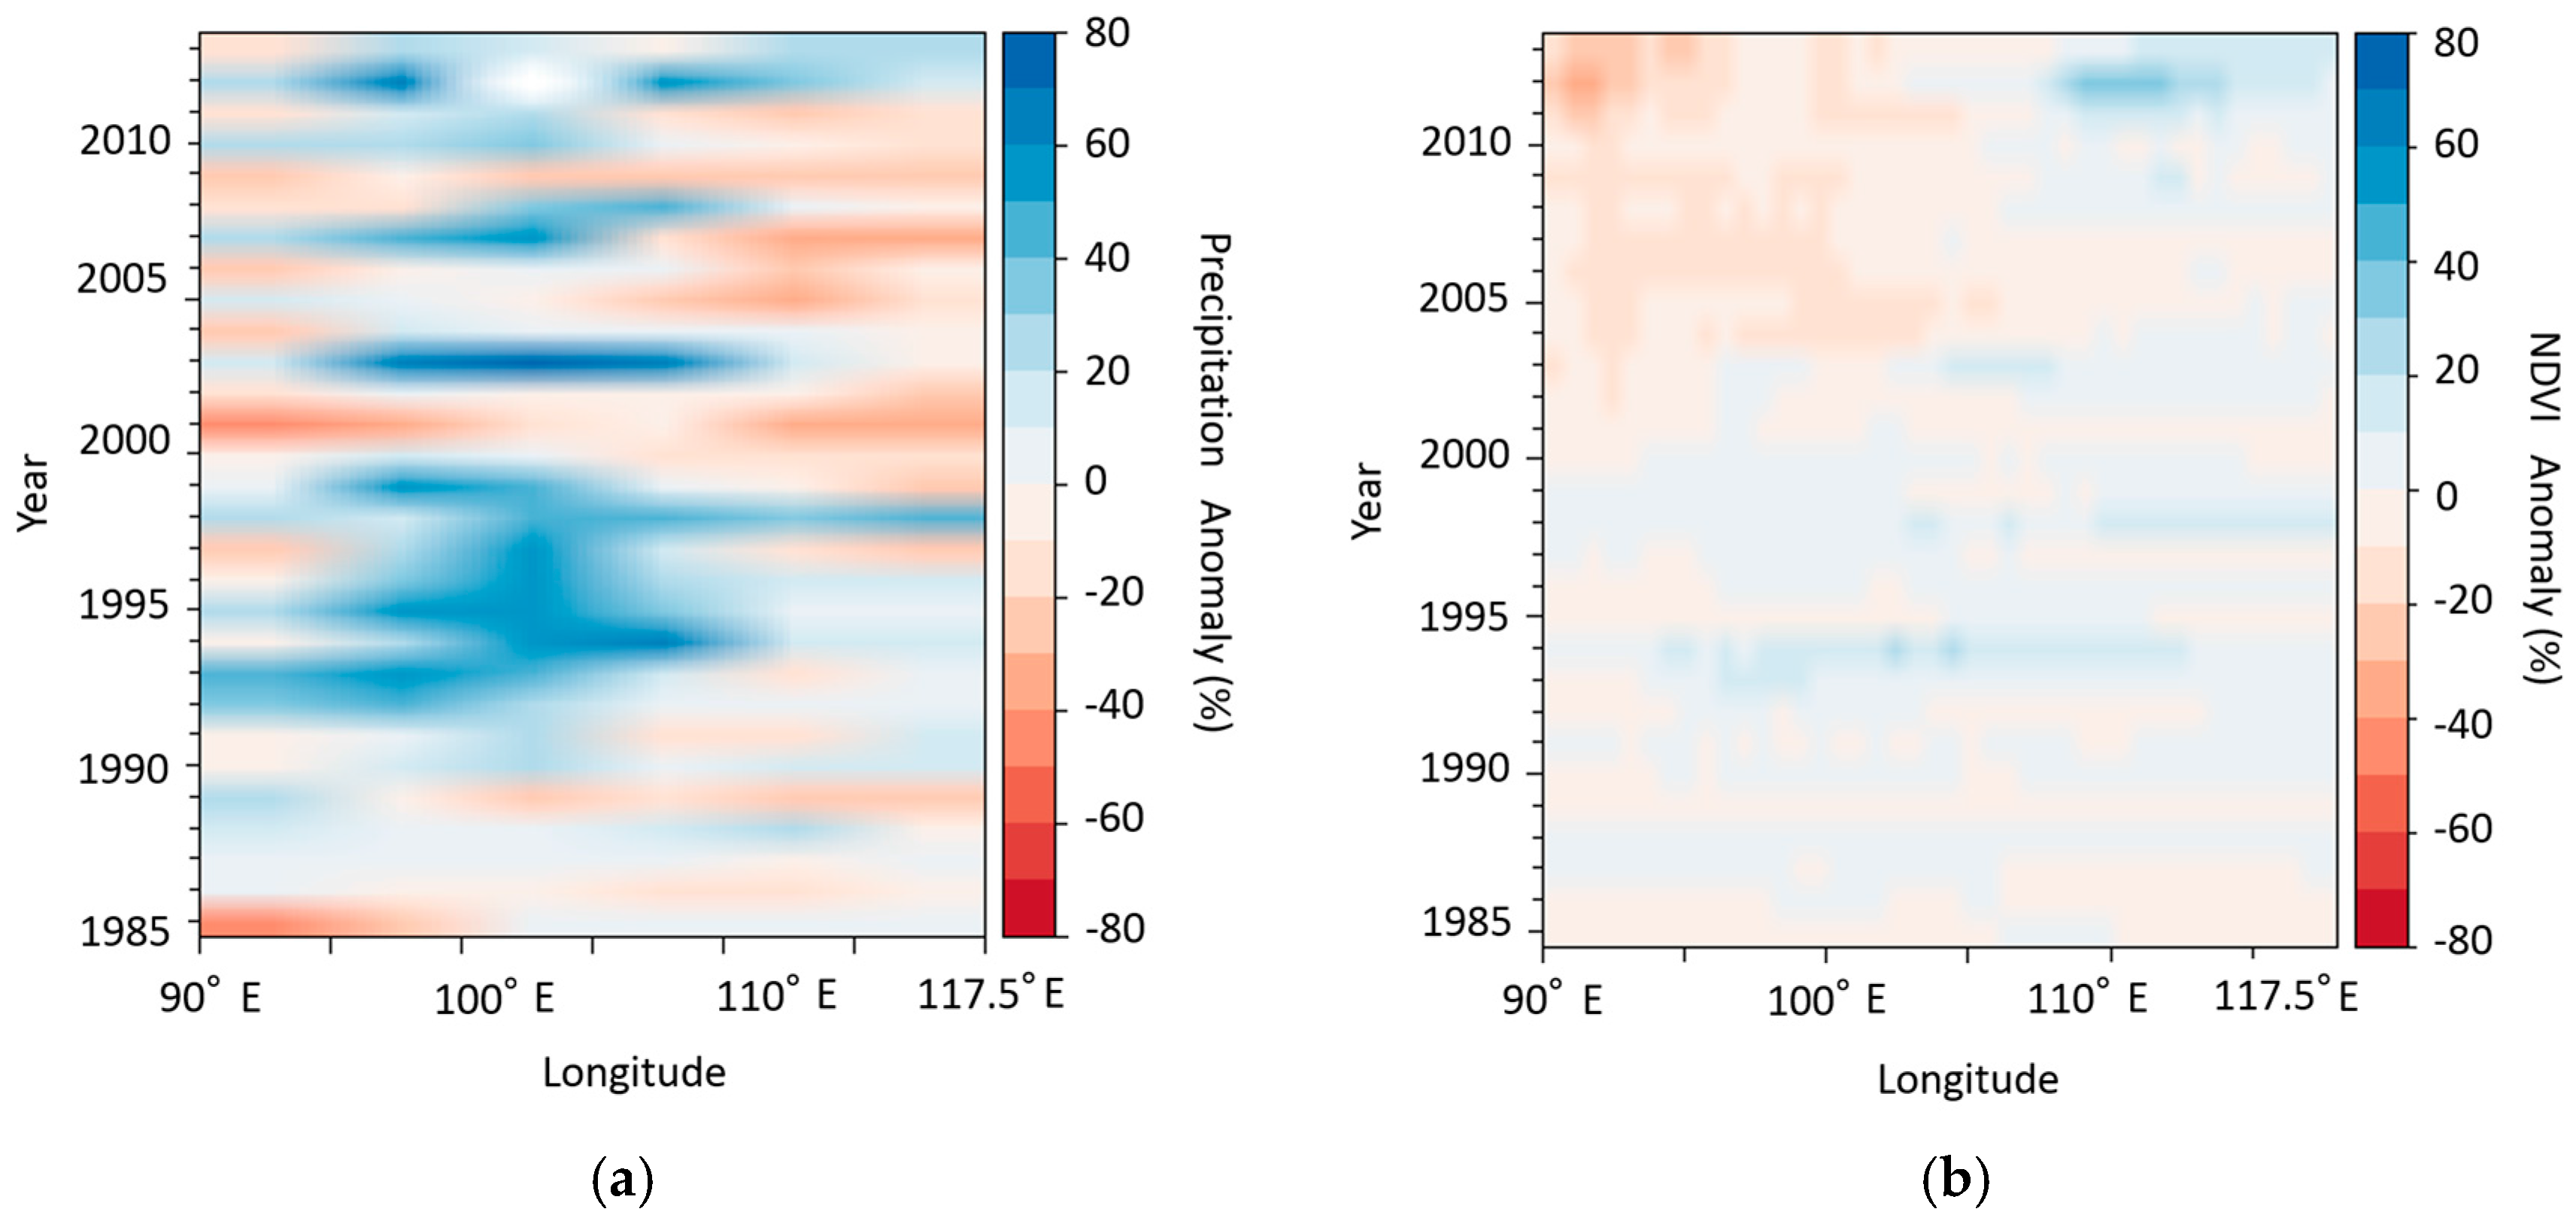
3.2. Cross Correlation Analysis

The results of the cross-correlation analysis across the Gobi region for the period 1996 to 2013 are shown in Figure 5a. All number are correlation coefficient (r) and the values of probability p showed these are significant (p < 0.05). The distribution of correlation coefficient is shown in Figure 5b. In the eastern region, there was a relatively high trend of correlation coefficient. By contrast, the time lag was larger and the correlation coefficient was very low in the western region, especially in the southwest area. The time lag was almost 0. It showed that the vegetation responded to precipitation within 15 days after precipitation events. The positive relationship between NDVI and precipitation during GS in the Saikhan-ovoo site is shown as an example (Figure 6). The highest correlation coefficient value was 0.72 (R2 = 0.52, p < 0.05) at time lag 0 locations. The vegetation had decreasing trends, but we postulate that it would recover in most locations during seasons with sufficient precipitation.

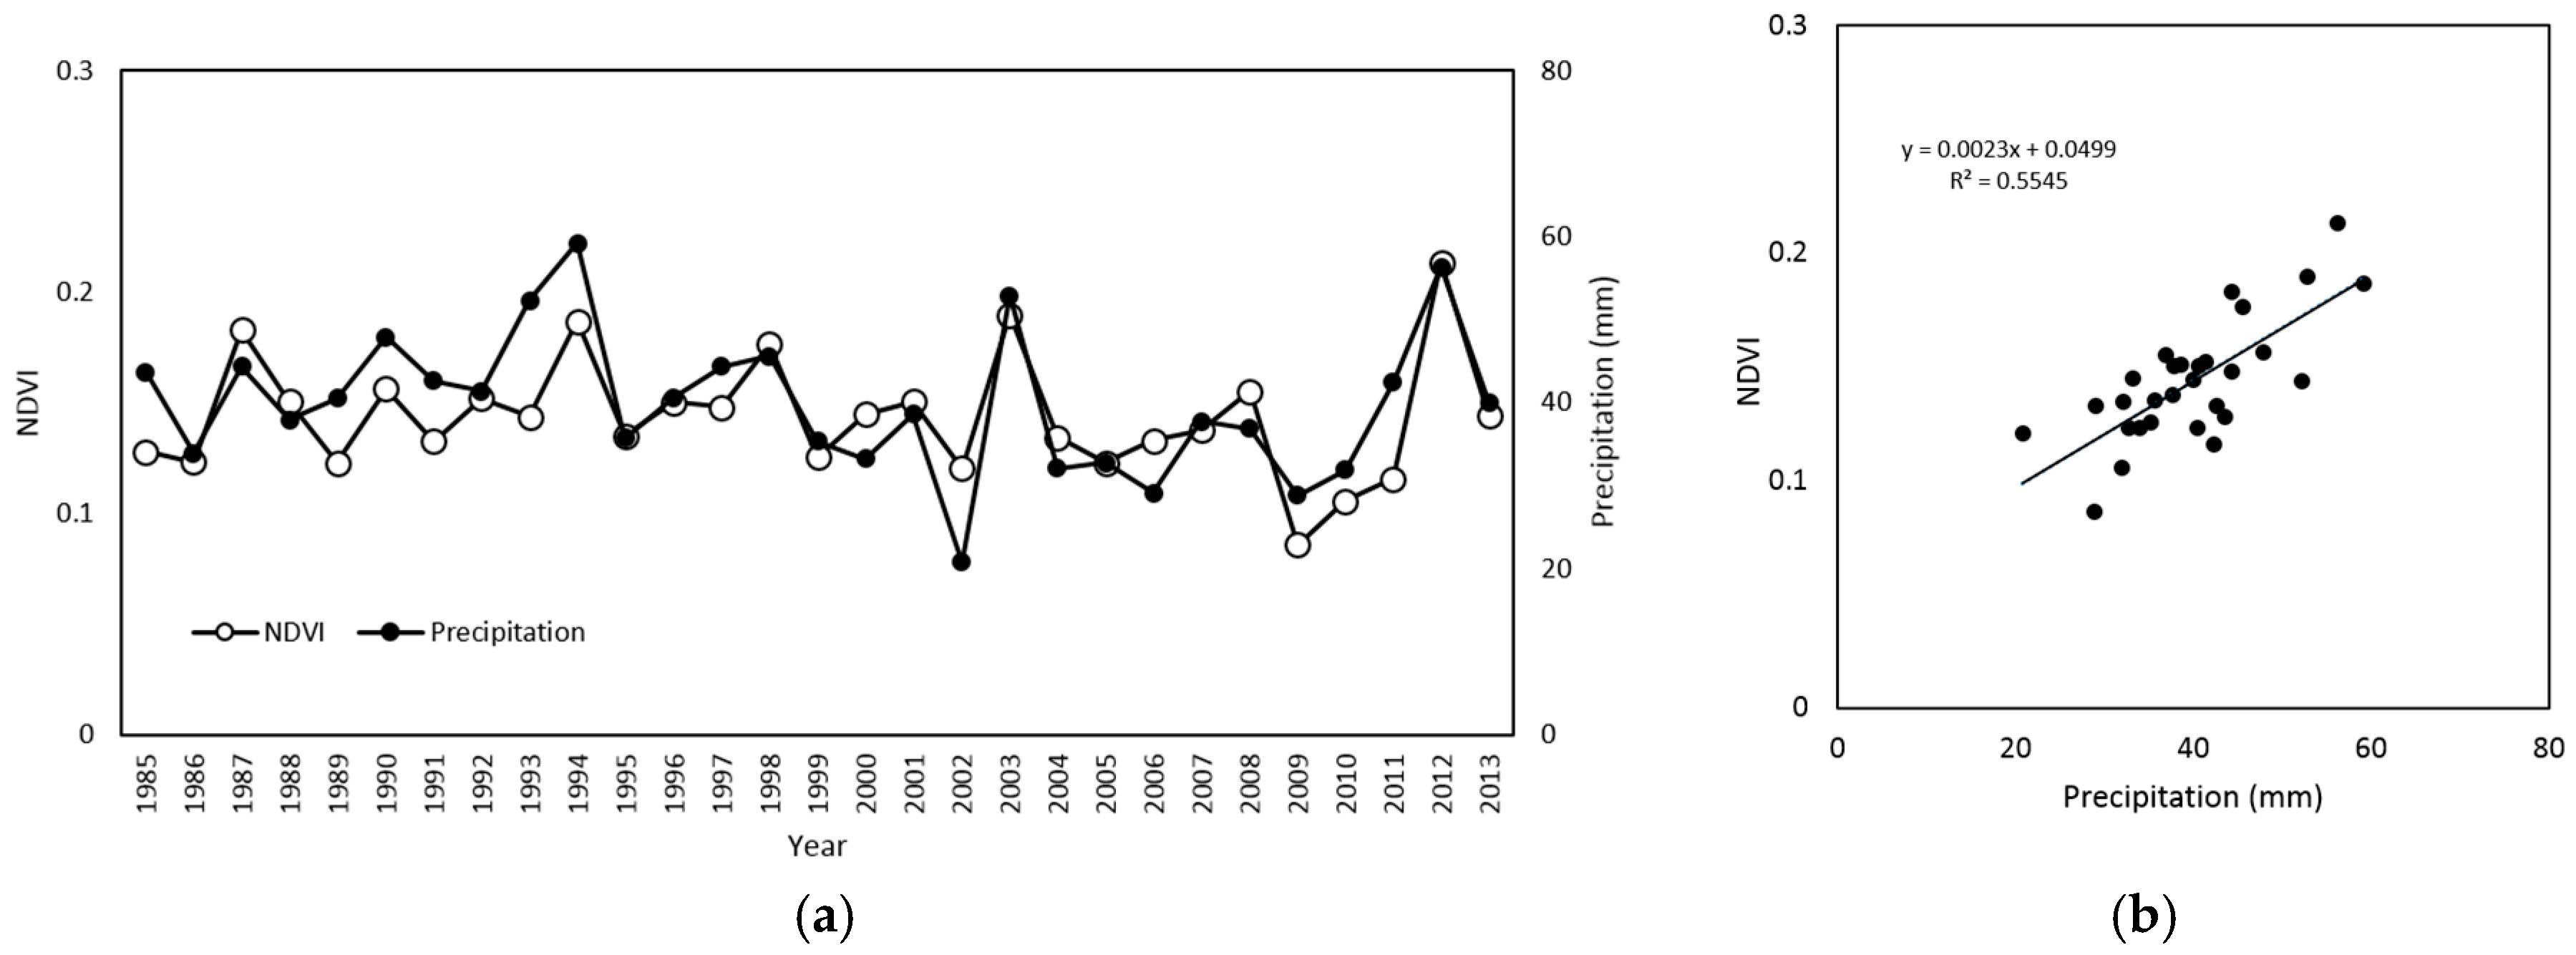
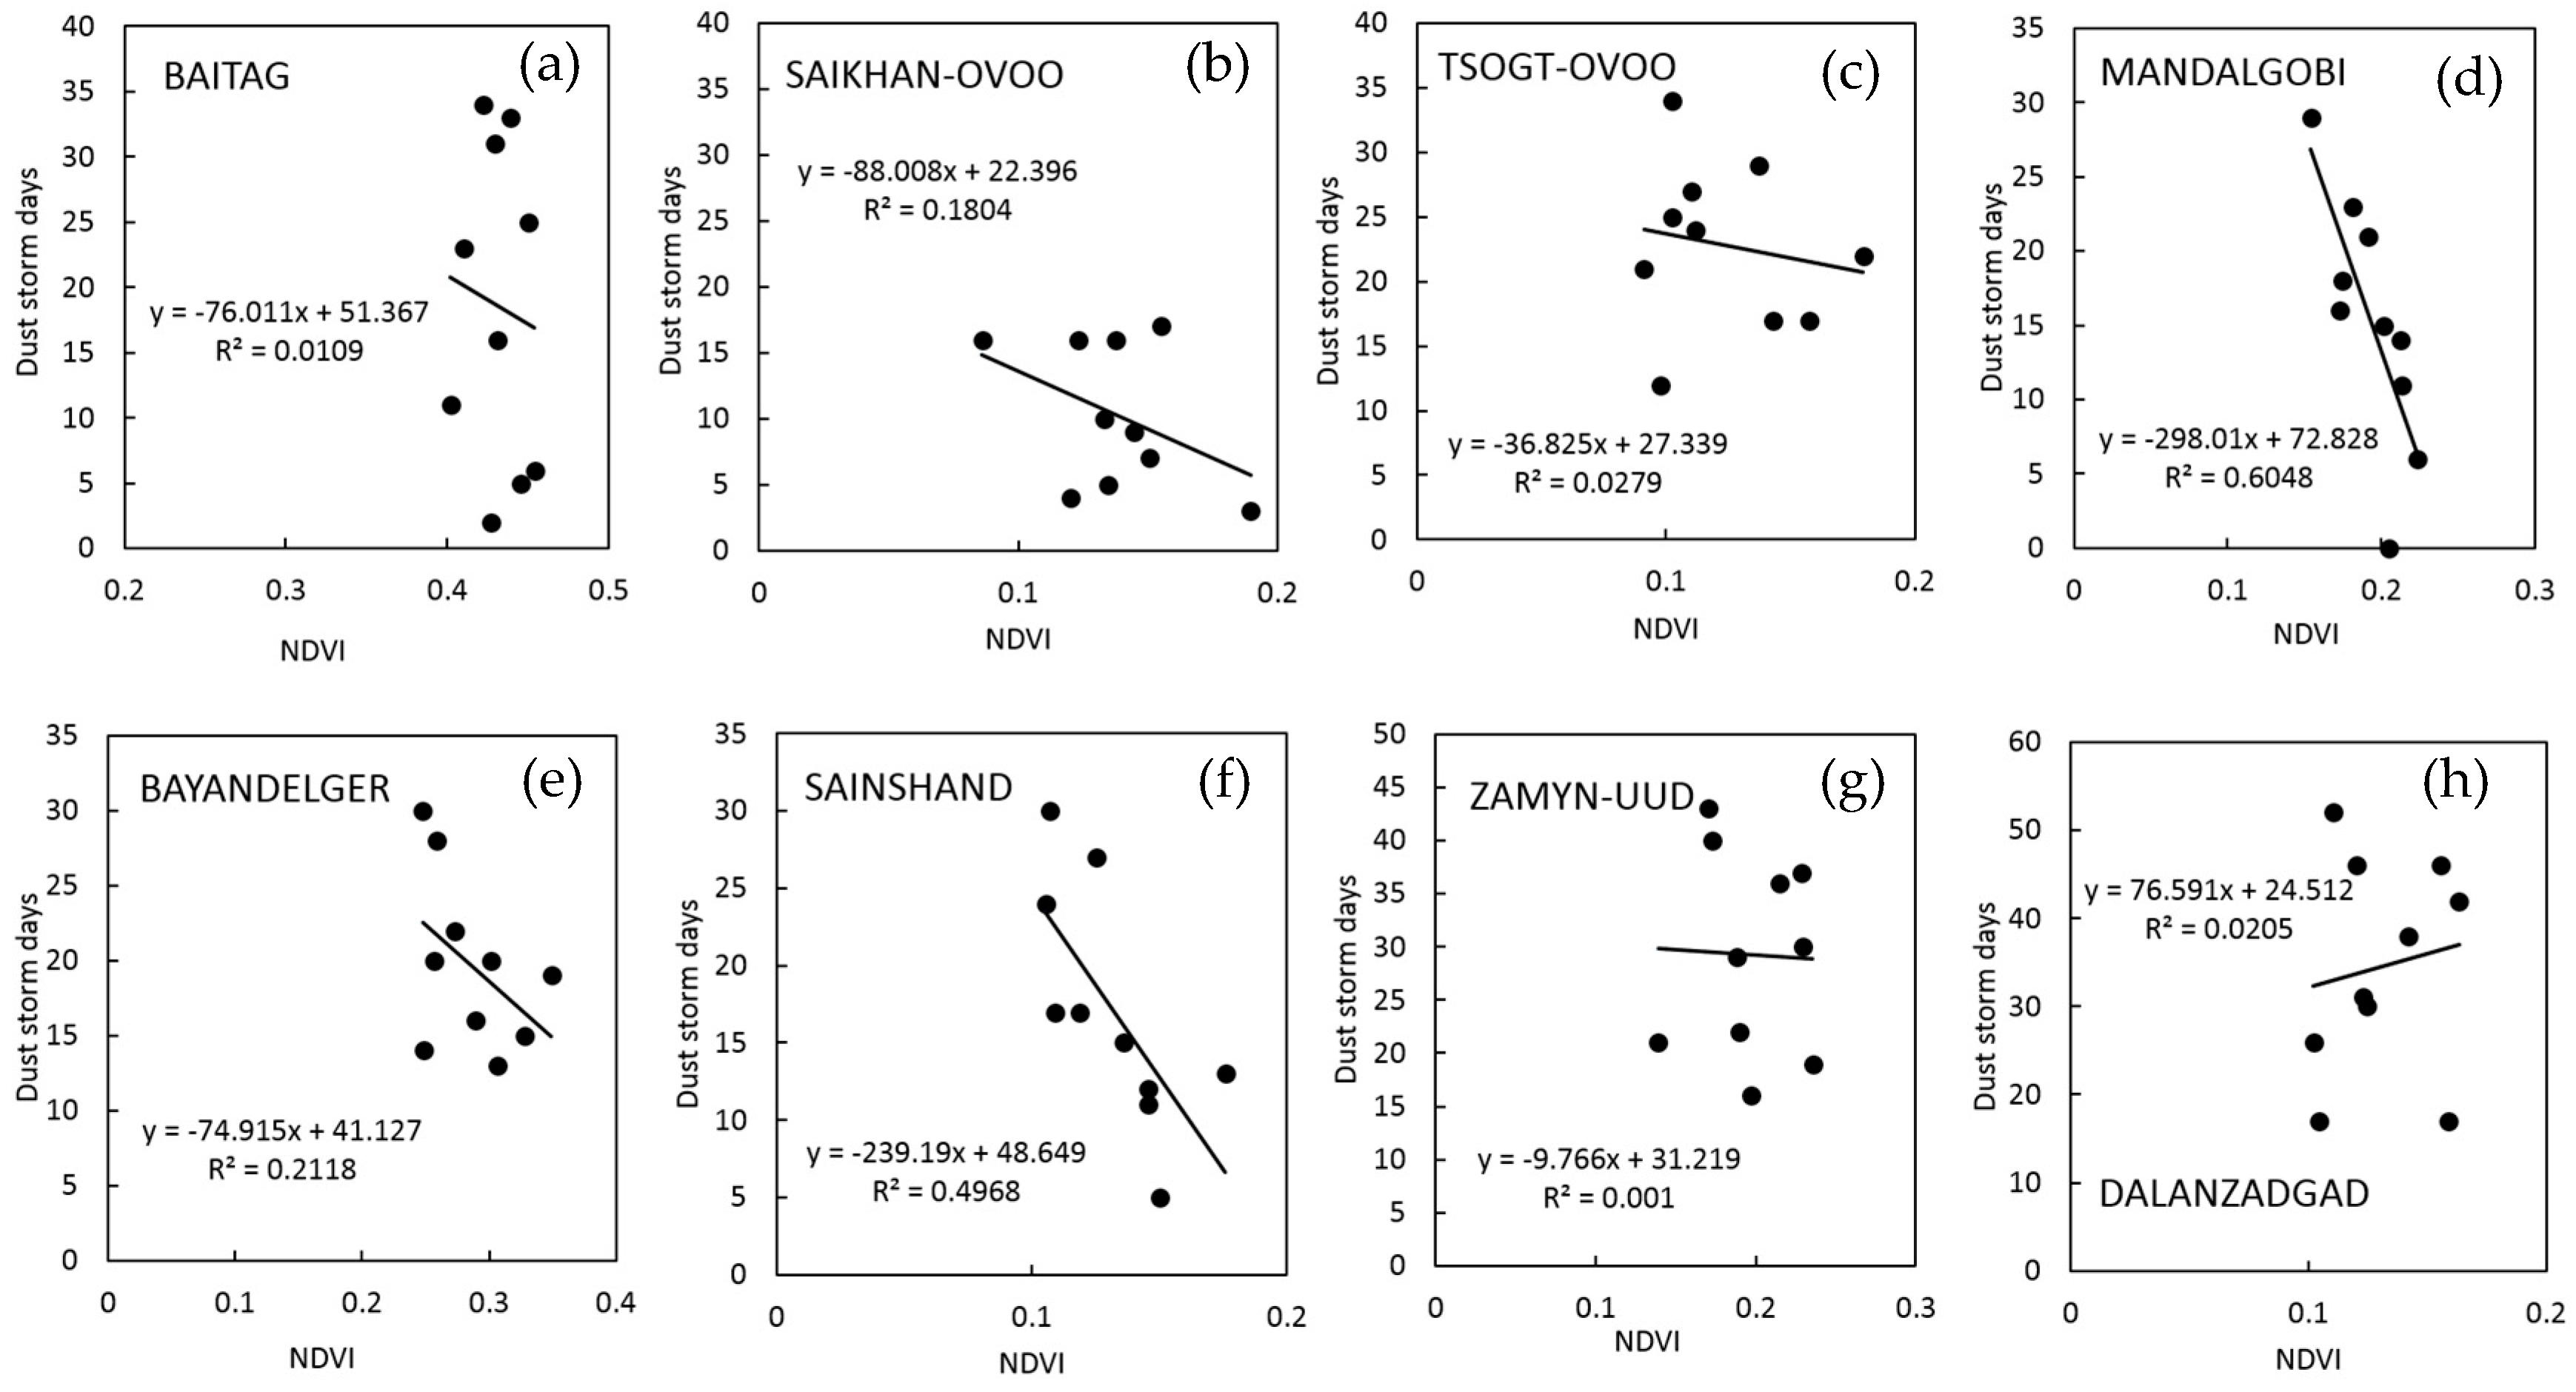
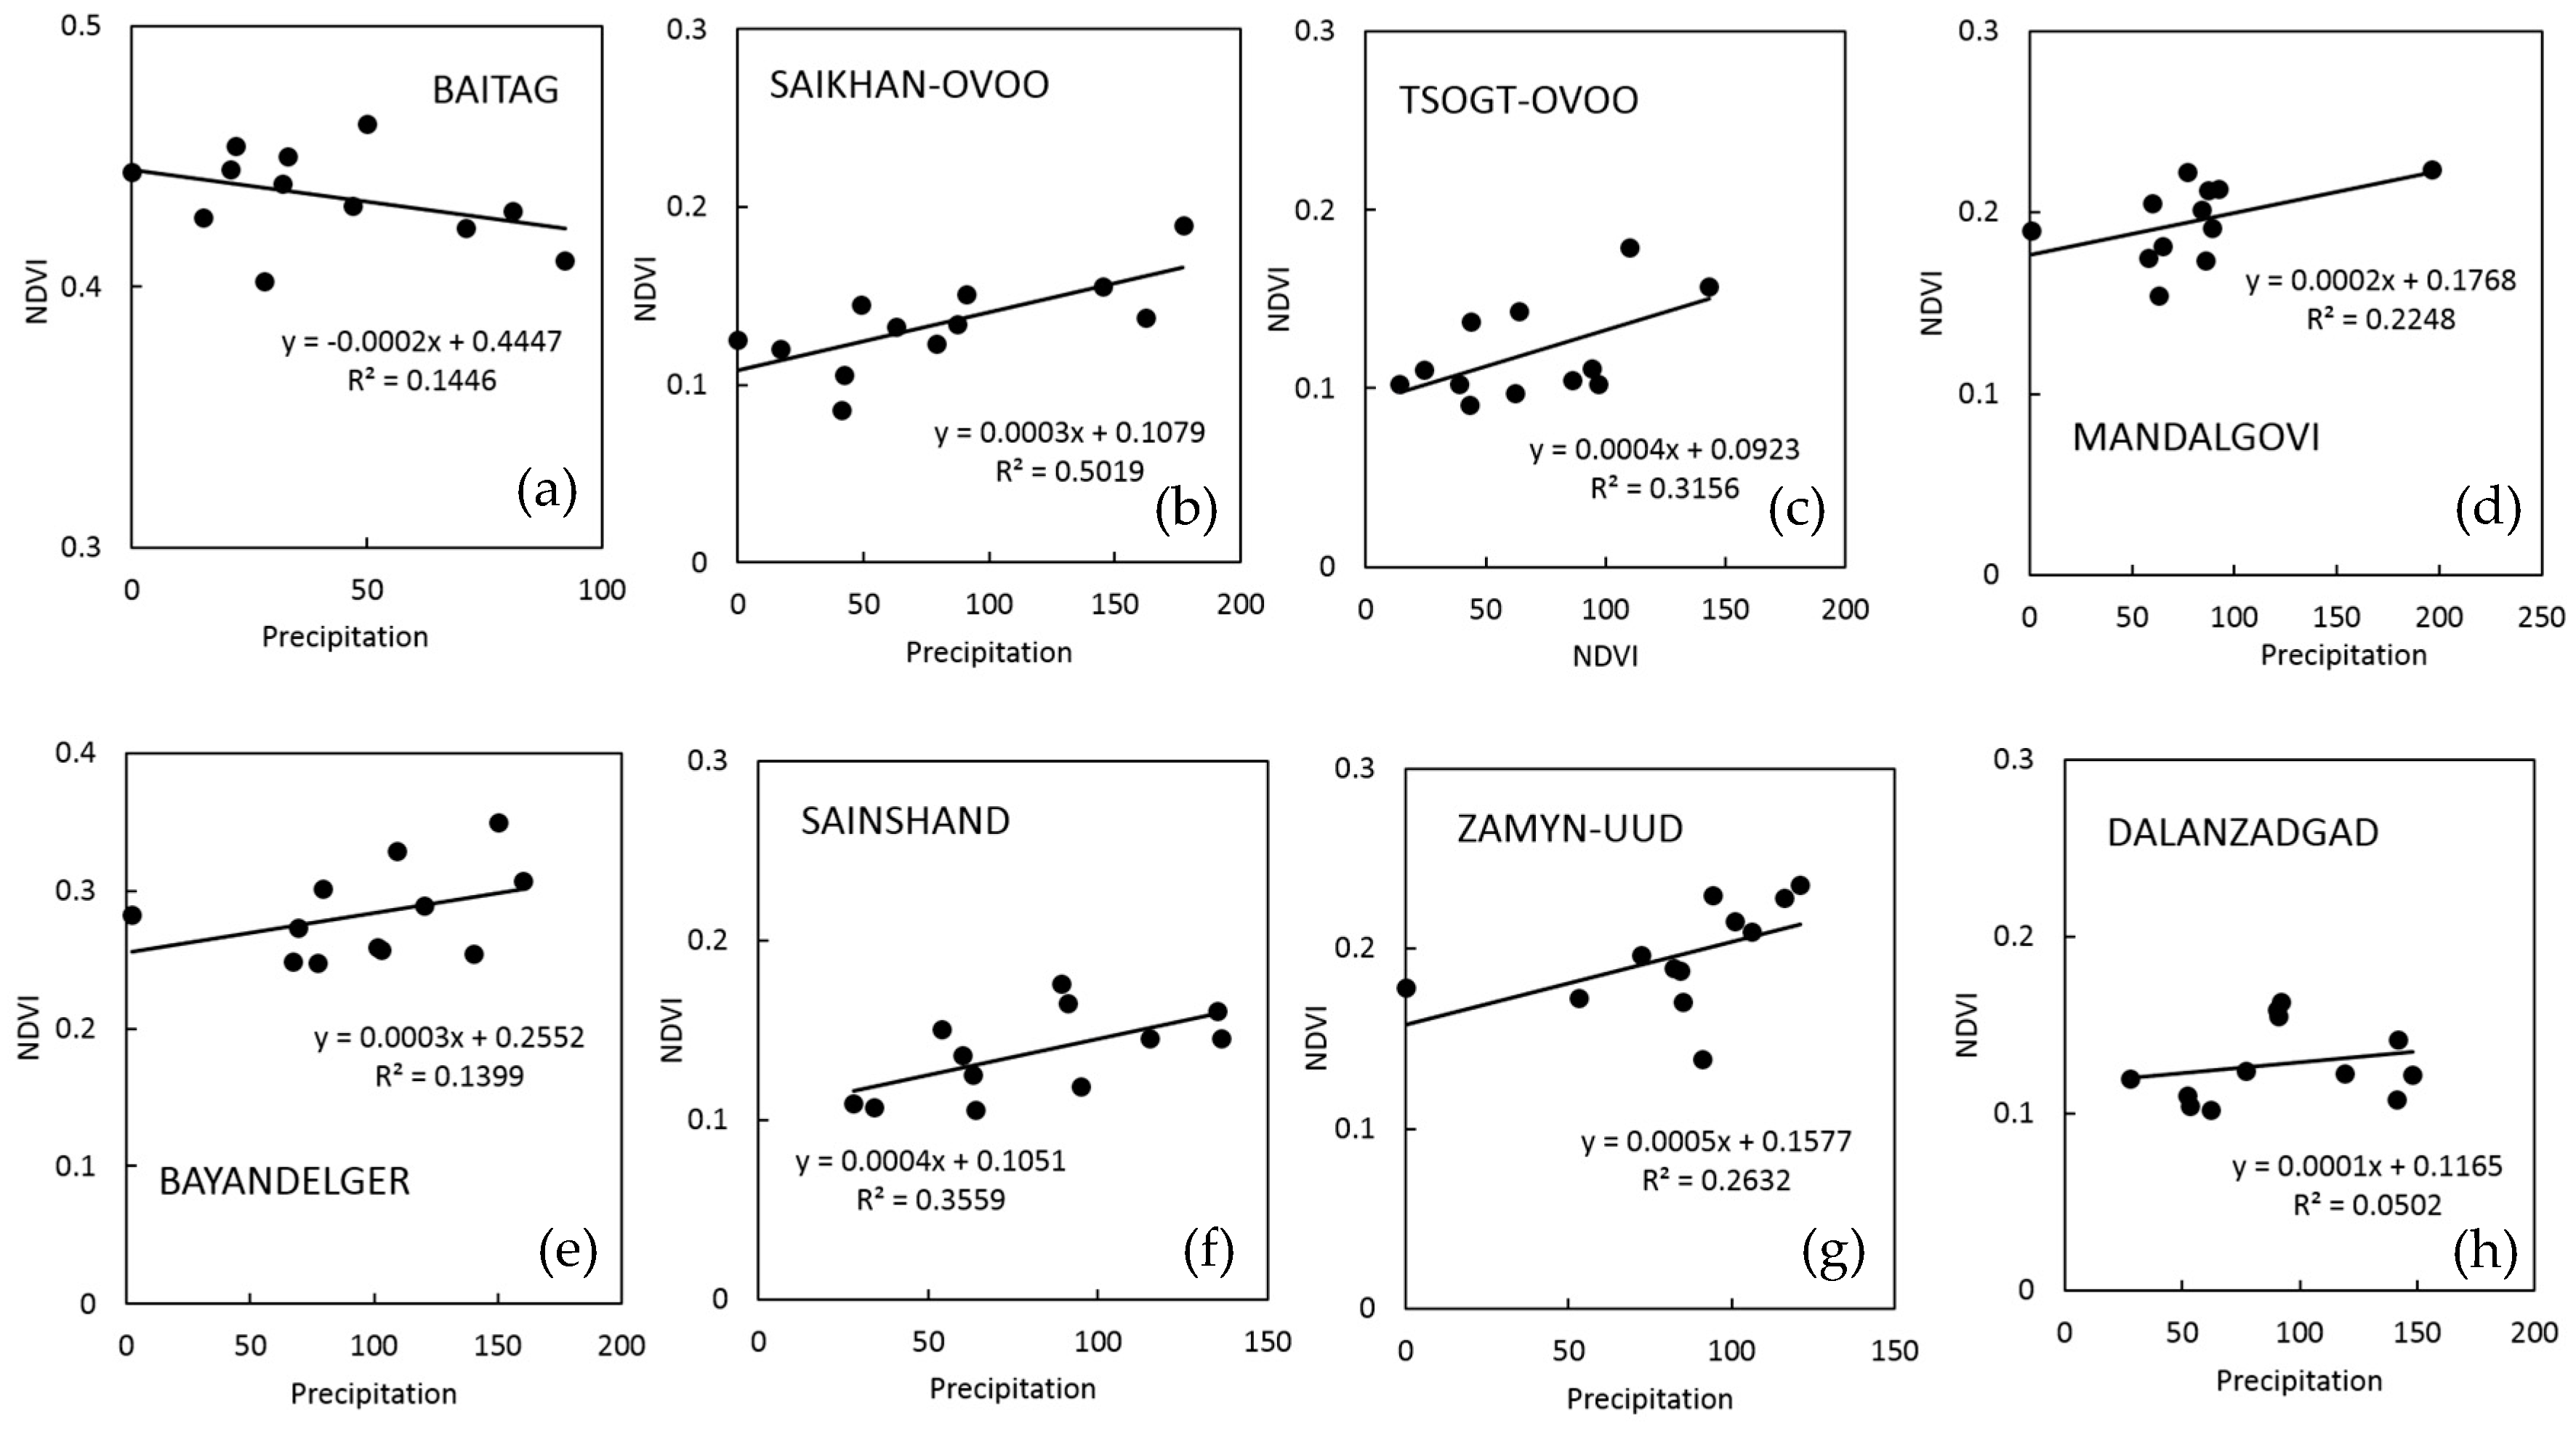
3.3. Single Regression Analysis

As shown in Figure 7, the highest frequency of dust storm occurs in the spring season. Figure 7 and Figure 8 show that the year of low vegetation agreed with relatively high frequency of dust storm occurrence, such as in 2009. Figure 8 shows the relationship between summer vegetation and the number of days in which dust storms occurred during the following spring at each meteorological station. These stations are located in the desert steppe zone of our study area. We analyzed this relationship using single regression analysis. From these results, the correlation coefficients were negative and the values were relatively high at Mandalgobi, Bayandelger, and Sainshand. These 3 sites have more plant species than places such as Tsogtovoo, Dalanzadgad and so on. Annual plant species are especially unstable, and the amount of biomass can have an effect on the frequency of dust storm occurrence. Therefore, the conditions of vegetation coverage during GS might influence dust storm frequency. It has been suggested that maintaining vegetation coverage during this period could reduce outbreaks of dust storms during the following spring. It also indicates that the vegetation condition in the southwest region of the Gobi should be monitored more carefully in the future. Figure 9 shows the relationship between NDVI and precipitation in GS at each station. The correlation coefficients were positive and the values were relatively high at Mandalgobi, Saikhan-ovoo, and Sainshand. These results show that precipitation can affect NDVI and also dust storm occurrences in some regions.

4. Discussion

In the arid and semi-arid Gobi region, vegetation cover is mainly constituted of annual and perennial plants. For example, Suaeda aralocaspica is a monoecious annual species commonly found in the Gobi desert and many perennial plants are found in this region, especially shrubs typified as Haloxylon ammodendron. Annual plants exist as dead grass in the spring, but are not reflected in NDVI. However, rainfall encourages the growth of annually herbaceous plants and is recorded as a memory of biomass (Dry Matter Productivity) in summer, and in the following year they suppress dust emission as dry grass. The differences in dead grass coverage rates may increase or decrease the outbreak of dust storms. On the other hand, perennial plants have very deep roots and this type of vegetation are effective in extracting water from their bare surroundings and therefore survive [25], so the effect of precipitation would be minimal. Furthermore, they can survive winter into the following spring and affect the frequency of dust storm outbreaks. However, once perennial plants, e.g., shrubs are in a dormant state, they need a substantial amount of time to recover. This is one of the contributory factors to the occurrence of desertification. In our study area, the typical plants are mainly perennial plants because of low precipitation and we found that the vegetation coverage had decreased in our study period.
Real world systems occasionally undergo substantial changes triggered by minor disturbances. A major theoretical finding when it comes to regime shifts is that ecosystems recover slowly from small perturbations in the vicinity of tipping points (Figure 10b). However, indicators of critical slowing down are not manifested in all cases where regime shifts occur, because not all regime shifts are associated with tipping points. In recent years, this challenge has gained importance as it is unclear how grassland ecosystems will respond to current trends in climate patterns and anthropogenic pressures [26]. The provided water such as rainfall is one of the most important factors for vegetation especially in arid regions (Figure 10a). As shown in Figure 10 and Figure 11, the areas highlighted with the circle and square respectively, are situated in China, such as Gansu, Xinjiang uygur and Bayannaoer. A previous study showed that there was a declining trend in Bayannaoer in Inner Mongolia during 1999–2012 [27]. In 2001 and 2002, very low precipitation with anomaly value of −40% or less was found and vegetation tendency changed around the same time, after that, the negative trend continued (Figure 10c,d). From these results, it is considered that one cause of vegetation degeneration is likely to be change in precipitation. In semi-arid ecosystems, water availability is the dominant factor regulating soil respiration [28]. Water availability moderates the effects of other factors such as temperature and substrate supply, on soil respiration. And its interannual variations is directly linked to both the intensity and the frequency of precipitation. Shifts in precipitation regime will alter not only the size of individual rainfall events, but also the length of the dry-spell duration and thus the antecedent soil water condition [29]. When the pasture land undergoes desertification, the seed bank in the soil disappears and the soil layer is destroyed. We found that vegetation does not respond to precipitation at all after a certain time in some regions (Figure 10). We found that since 2003, vegetation no longer responded to precipitation in F2 region.
Desertification can increase the occurrence of dust storms as has been observed in the Tibetan Plateau and Hexi Corridor in recent years [30]. This includes areas located in Northwest China, within the Tarim Basin. Perennial plants are dominant in this area due to low precipitation and desertification is therefore more likely to occur when there are drought conditions. This study focuses on the dynamic interaction between precipitation, vegetation (NDVI) and dust emissions, however, only in the growing season (GS) are the annual grasses reflected in NDVI. Desertification is a kind of environment regime shift. While environment regime shift was not found in our Mongolian sites, it was observed in our Chinese sites [31] (Figure 11). As shown in Figure 11, the area highlighted with the circle where vegetation cover was degraded, is situated in China and includes Gansu, Xinjiang Uygur and Bayannaoer. According to previous studies, due to its unique geographical position and vulnerable ecological environment, Xinjiang is very sensitive to climate change [24].

5. Conclusions

Satellite measurements of vegetation dynamics in the Gobi region for a period of 29 years showed interannual variation and trends. In the Gobi region, precipitation is confined to the period from May to September. The variations of NDVI anomalies in the eastern region correspond well with the documented precipitation anomalies during this period. However, some parts, especially those in the southwest region of the Gobi region showed that the NDVI had decreased regardless of the precipitation amount.
As a result of this study, it was unlikely that desertification would occur in our Mongolian sites. However, as a result of this study, precipitation variation became significantly higher in the period after the year 2000. Furthermore, we found that vegetation in low precipitation areas was more degraded than that in high precipitation areas. Therefore, it is necessary to carefully continue monitoring the vegetation condition, especially in this region, in future studies.

Acknowledgments

This work was supported by JSPS KAKENHI Grant Numbers JP24340111, JP25550079, JP26281003 and the MEXT Supported Program for the Strategic Research Foundation (S1391001) at Rakuno Gakuen University. We are grateful to P. Tsedendamba and D. Munkhjargal for their support on field survey in Mongolia. In addition, we would like to thank B. Alsaaideh for giving some kind advice about this paper.

Author Contributions

Y.S., B.H., E.N. and A.K. analyzed the data and wrote the draft of manuscript and designed the study. Y.D., K.K., Y.S., K.K., K.K. and T.S. participated in the field measurements and participated in the satellite images analysis. Y.S., Y.D. and B.H. also established the GIS special database.

Conflicts of Interest

The authors declare no conflict of interest.

Data Availability

The NDVI 3g dataset used in this paper can be accessed and freely downloaded from the ECOCAST homepage (the GIMMS group at NASA’s Goddard Space Flight Center): https://ecocast.arc.nasa.gov/data/pub/gimms/. Global Precipitation Climatology Project (GPCP) data can be downloaded from The NOAA/ESRL Physical Sciences Division (PSD) home page. https://www.esrl.noaa.gov/psd/data/gridded/data.gpcp.html. Number of livestock data can be downloaded from Mongolian Statistical Information Service home page. http://1212.mn/en/contents/stats/.

References

  1. Natsagdorj, L.; Jugder, D.; Chung, Y.S. Analysis of dust storms observed in Mongolia during 1937–1999. Atmos. Environ. 2003, 37, 1401–1411. [Google Scholar] [CrossRef]
  2. Huang, J.; Wang, T.; Wang, W.; Li, Z.; Yan, H. Climate effects of dust aerosols over East Asian arid and semiarid regions. J. Geophys. Res. Atmos. 2014, 119, 11398–11416. [Google Scholar] [CrossRef]
  3. Littmann, T. Dust storm frequency in Asia: Climatic control and variability. Int. J. Climatol. 1991, 11, 393–412. [Google Scholar] [CrossRef]
  4. Parungo, F.; Li, Z.; Li, X.; Yang, D.; Harris, J. Gobi dust storms and the great green wall. Geophys. Res. Lett. 1994, 21, 999–1001. [Google Scholar] [CrossRef]
  5. Ishizuka, M.; Mikami, M.; Yamada, Y. An observational study of soil moisture effects on wind erosion at a gobi site in the Taklimakan Desert. J. Geophys. Res. 2005, 110, D18S03. [Google Scholar] [CrossRef]
  6. Lee, E.H.; Shon, B.J. Examining the impact of wind and surface vegetation on the Asian dust occurrence over three classified source regions. J. Geophys. Res. 2009, 114, D06205. [Google Scholar] [CrossRef]
  7. Lee, E.H.; Shon, B.J. Recent increasing trend in dust frequency over Mongolia and Inner Mongolia regions and its association with climate and surface condition change. Atmos. Environ. 2011, 45, 4611–4616. [Google Scholar] [CrossRef]
  8. Kurosaki, Y.; Shinoda, M.; Mikami, M. What caused a recent increase in dust outbreaks over East Asia? Geophys. Res. Lett. 2011. [Google Scholar] [CrossRef]
  9. Nandintsetseg, B.; Shinoda, M. Land surface memory effects on dust emission in a Mongolian temperate grassland. J. Geophys. Res. Biogeosci. 2015, 120, 414–427. [Google Scholar] [CrossRef]
  10. Zou, X.K.; Zhai, P.M. Relationship between vegetation coverage and spring dust storms over northern China. J. Geophys. Res. 2004, 109. [Google Scholar] [CrossRef]
  11. Shinoda, M.; Nandintsetseg, B. Soil moisture and vegetation memories in a cold, arid climate. Glob. Planet. Chang. 2011, 79, 110–117. [Google Scholar] [CrossRef]
  12. Shinoda, M.; Nachinshonhor, G.U.; Nemoto, M. Impact of drought on vegetation dynamics of the Mongolian steppe: A field experiment. J. Arid Environ. 2010, 74, 63–69. [Google Scholar] [CrossRef]
  13. Liu, H.; Tian, F.; Hu, H.C.; Hu, H.P.; Sivapalan, M. Soil moisture controls on patterns of grass green-up in Inner Mongolia: An index based approach. Hydrol. Earth Syst. Sci. 2013, 17, 805–815. [Google Scholar] [CrossRef]
  14. Fu, C.; Diaz, H.F.; Dong, D.; Fletcher, J.O. Changes in atmospheric circulation over Northern Hemisphere oceans associated with the rapid warming of the 1920s. Int. J. Climatol. 1999, 19, 581–606. [Google Scholar] [CrossRef]
  15. Barlow, M.; Cullen, H.; Lyon, B. Drought in central and southwest Asia: La Nina, the warm pool, and Indian Ocean precipitation. J. Clim. 2002, 15, 697–700. [Google Scholar] [CrossRef]
  16. Dai, A.; Trenberth, K.E.; Karl, T.R. Global variations in droughts and wet spells: 1900–1995. Geophys. Res. Lett. 1998, 25, 3367–3370. [Google Scholar] [CrossRef]
  17. Lotsch, A.; Friedl, M.A.; Anderson, B.T.; Tucker, C.J. Response of terrestrial ecosystems to recent Northern Hemispheric drought. Geophys. Res. Lett. 2005, 32, L06705. [Google Scholar] [CrossRef]
  18. Huang, J.; Wang, T.; Wang, W.; Li, Z.; Yan, H. Accelerated dryland expansion under climate change. Nat. Clim. Chang. 2016, 6, 166–171. [Google Scholar] [CrossRef]
  19. Tucker, C.J.; Pinzon, J.E.; Brown, M.E.; Slayback, D.A.; Pak, E.W.; Mahoney, R.; Vermote, E.F.; Saleous, N.E. An extended AVHRR 8-km NDVI dataset compatible with MODIS and SPOT vegetation NDVI data. Int. J. Remote Sens. 2005, 26, 4485–4498. [Google Scholar] [CrossRef]
  20. Holben, B.N. Characteristics of maximum-value composite images from temporal AVHRR data. Int. J. Remote Sens. 1986, 7, 1417–1434. [Google Scholar] [CrossRef]
  21. Huffman, G.J.; Adler, R.F.; Bolvin, D.T.; Gu, G. Improving the global precipitation record: GPCP Version 2.1. Geophys. Res. Lett. 2009, 36, L17808. [Google Scholar] [CrossRef]
  22. Anyamba, A.; Tucker, C.J. Analysis of Sahelian vegetation dynamics using NOAA-AVHRR NDVI data from 1981–2003. J. Arid Environ. 2005, 63, 596–614. [Google Scholar] [CrossRef]
  23. Wang, B.; Fan, Z. Choice of South Asian summer monsoon indices. Bull. Am. Meteorol. Soc. 1999, 80, 629–638. [Google Scholar] [CrossRef]
  24. Hu, R.-J.; Fan, Z.-L.; Wang, Y.-J. Assessment about the impact of climate change on environment in Xinjiang since recent 50 years. Arid Land Geogr. 2001, 24, 97–103. (In Chinese) [Google Scholar]
  25. Hardenberg, J.; Meron, E.; Shachak, M.; Zarmi, Y. Diversity of vegetation patterns and desertification. Phys. Rev. Lett. 2001, 87, 198101. [Google Scholar] [CrossRef] [PubMed]
  26. Dakos, V.; Carpenter, S.R.; van Nes, E.H.; Scheffer, M. Resilience indicators: Prospects and limitations for early warnings of regime shifts. Philos. Trans. R. Soc. B Biol. Sci. 2015, 370, 20130263. [Google Scholar] [CrossRef]
  27. Buhe, B. Factor Analysis and Vegetation Change in China Inner Mongolia through Satellite Remote Sensing. Ph.D. Thesis, Chiba University, Chiba, Japan, 2015. [Google Scholar]
  28. Yan, L.; Chen, S.; Huang, J.; Lin, G. Water regulated effects of photosynthetic substrate supply on soil respiration in a semiarid steppe. Glob. Chang. Biol. 2011, 17, 990–2001. [Google Scholar] [CrossRef]
  29. Yan, L.; Chen, S.; Xia, J.; Luo, Y. Precipitation regime shift enhanced the rain pulse effect on soil respiration in a semi-arid steppe. PLoS ONE 2014, 9, e104217. [Google Scholar] [CrossRef] [PubMed]
  30. Wang, X.; Chen, F.; Dong, Z. The relative role of climatic and human factors in desertification in semiarid China. Glob. Environ. Chang. 2006, 16, 48–57. [Google Scholar] [CrossRef]
  31. Sofue, Y.; Hoshino, B.; Nduati, E.; Kondoh, A.; Kai, K.; Purevsuren, T.; Baba, K. Remote sensing methodology for detection of environmental regime shifts in semi-arid region. In Proceedings of the 37th Geoscience and Remote Sensing Symposium, Fort Worth, TX, USA, 23–28 July 2017; pp. 5113–5116. [Google Scholar]
Figure 1. Long-term mean NDVI for the Gobi region (1985–2013) showing the transition from the eastern region with NDVI values of 0.6 to the west with values 0.02. Where, Long-term mean NDVI was averaged monthly maximum NDVI from 1985 to 2013. The numbered locations indicate sites where NDVI data were extracted to examine the temporal variations and trends in NDVI from 1985 to 2013. Furthermore, the red triangles show that the distribution of WMO (the World Meteorological Organization) synoptic stations in Mongolia used for this study. All stations are located in the desert steppe zone of the study area.
Land 07 00019 g001
Figure 2. Hovmoller diagrams: (a) monthly precipitation and (b) monthly NDVI for the Gobi region averaged between 90° E–117.5° E and 40° N–47.5° N.
Land 07 00019 g002
Figure 3. Hovmoller diagrams: (a) precipitation anomaly and (b) NDVI anomaly for the Gobi region averaged between 90° E–117.5° E and 40° N–47.5° N.
Land 07 00019 g003
Figure 4. Time series of average GS (the Growing season for plants; from May to September) NDVI for selected sites across the Gobi region and cumulative GS precipitation during the same period (a,b). All sites, excluding site 4, exhibit a similar trend of precipitation variation over time (a). Site 4 shows minimal variation. On the one hand, the distribution patterns of NDVI have indicated a decreased amount of precipitation and a shift from the Northeast to Southwest region (b).
Land 07 00019 g004
Figure 5. (a) Map of the correlation between precipitation and NDVI, and distribution of time lag in response to precipitation; (b) Correlation coefficient matrix. Each bold number shows that the correlation coefficient has some time lag.
Land 07 00019 g005aLand 07 00019 g005b
Figure 6. (a,b) Relationship between NDVI and precipitation during GS at Saikhan-ovoo site.
Land 07 00019 g006
Figure 7. The annual and monthly distribution of dust storm days at Saikhan-ovoo site.
Land 07 00019 g007
Figure 8. (ah) Relationship between dust storm days and NDVI at each station.
Land 07 00019 g008
Figure 9. (ah) Relationship between NDVI and precipitation at each station.
Land 07 00019 g009
Figure 10. Environmental regime shifting in North China during 2003–2013. (a) shows that the concept of relationship between precipitation and vegetation. And (b) shows that the concept of regime shift. (c,d) are enhanced the difference Figure 3 (Hovmoller diagrams: where, (c) precipitation anomaly and (d) NDVI anomaly for the study area).
Land 07 00019 g010
Figure 11. Anomaly NDVI in GS in (a) 1989; (b) 1994; (c) 2003; (d) 2012 and (e) 2013 [31].
Land 07 00019 g011

