Article

Enhancement of Linear Agricultural Areas to Provide Invertebrates as Potential Food for Breeding Birds

1
Institute of Environmental Sciences, van Steenisgebouw, Einsteinweg 2, Leiden University, Leiden 2333 CC, The Netherlands
2
Illinois State Museum Research and Collections Center, 1011 E. Ash Street, Springfield, IL 62703, USA
*
Author to whom correspondence should be addressed.
Submission received: 27 May 2016 / Revised: 13 July 2016 / Accepted: 26 July 2016 / Published: 28 July 2016

Abstract

:
Birds are an important part of the agricultural landscape, as having nature value, but also as pest control agents and bio-indicators for the health of the environment. Here we look at linear non-crop elements in agricultural areas as a potential source of food for nestlings of avian species. We measured invertebrate availability as it relates to structural complexity at the local and landscape levels in three counties in central Illinois. Invertebrates were measured with taxonomic diversity, abundance, and estimated biomass during spring of 2012 and 2013. Our study shows that easily modifiable field edge characteristics have the greatest impact on invertebrate diversity and abundance, as compared to field and landscape features. This finding shows that a potential invertebrate food source as measured by both diversity and biomass, may be easily enhanced without changes to agricultural practices.

1. Introduction

In Illinois, as elsewhere, bird populations are changing with an overall decline in many species [1], which has been related to loss of habitat due to agricultural intensification and increased urbanization of the landscape [1]. The use of pesticides may also play a role in avian declines [2]. Agricultural intensification has the admirable goal of increasing production of food, feed, and fuel which is necessary to human life. At the same time, the loss of biodiversity and ecosystem services is a concern. In the United States, management for biodiversity has been with a focus on land sparing [3,4]. This leaves isolated tracts to be managed for biodiversity and other areas focused on housing or agriculture. Many countries in Europe use a land sharing approach. This tactic uses a combination of landscape complexity and agricultural practices with a conservation approach to maximize biodiversity and ecosystem services and subsidize farmers for the subsequent loss in yield [5,6,7].
The landscape of Illinois has altered dramatically since initial settlement over two centuries ago. In the early 19th century, the General Land Office Survey reported about two thirds of the landcover as prairie with the remainder forested [8]. Very little of the land was developed or cultivated. Settlement occurred moving from the south to the north with settlers coming from Tennessee and Kentucky. By 1920, 90% of Illinois was farmed with much of the population living in rural areas [1]. Cultivated ground was dominated by corn, and the remaining farmland a diverse mixture of hay, pasture and small grains (mostly oats). Most farms were small by today’s standards, averaging 52 ha in size and most (>90%) had both cattle and horses. Today, farms have grown in size to an average of 149 ha [1] with the fastest growing landuse type as developed (areas used for industrial, commercial, and residential purposes) [1]. The number of cattle and horses has dropped and with it, the need for hay, pasture, and small grains. Row crops are dominated by corn and soy in a two to three year rotation. Field size increased >80% while the number of fields was about halved. Landuse will continue to shift in response to human needs and climate change.
Avian populations shifted along with landuse. Idle grasslands, defined as not having been grazed, hayed or mowed in the year of the surveys, declined from 1.8 million acres in the early 1900s to 1.2 million acres in the 2000s. Surprisingly, the species richness of birds in grasslands decreased dramatically from 1900 to 1950 but increased from 1950 to 2000 [1]. What is less surprising is that the relative abundance of species has undergone a major shift since the surveys conducted in the early 1900s with some species dropping from dominance while other species prospered with changing habitat availability. Surveys of linear grasslands taken in the 2000s showed a decline in both the absolute abundance and the number of species from surveys taken in the 1950s; the result of increased field size and reduced field margin area [1]. Edges, i.e., the area between habitat patches, and their role as habitat for birds have been studied for decades [9]. Birds inhabiting this ecotone are often generalists that can use the heavily disturbed areas [1]. Little is known about the distribution of invertebrates in agricultural field margins in the Midwest. The neglect of this ecologically important group is somewhat surprising considering the importance of invertebrates as food items for breeding birds and their nestlings. During the breeding season, the diet of many avian species shifts to include insects as a protein source [10,11] and later to feed rapidly developing nestlings.
We looked at linear, non-crop elements in agricultural areas early in the avian breeding season as a possible source of invertebrates to feed nestlings. We examined linear non-crop elements, hereafter referred to as edge, and field features and landscape characteristics to determine which had the greatest impact on invertebrate diversity and estimated biomass with the goal of providing guidance to improving invertebrate biodiversity and food availability for bird nestlings within the agricultural landscape. Studies have shown that invertebrate richness and abundance are influenced by complexity at the landscape scale [12,13], field characteristics [14,15] and edge characteristics [16,17]. We examined the hypotheses that invertebrates were dependent on these features independently or in combination.

2. Materials and Methods
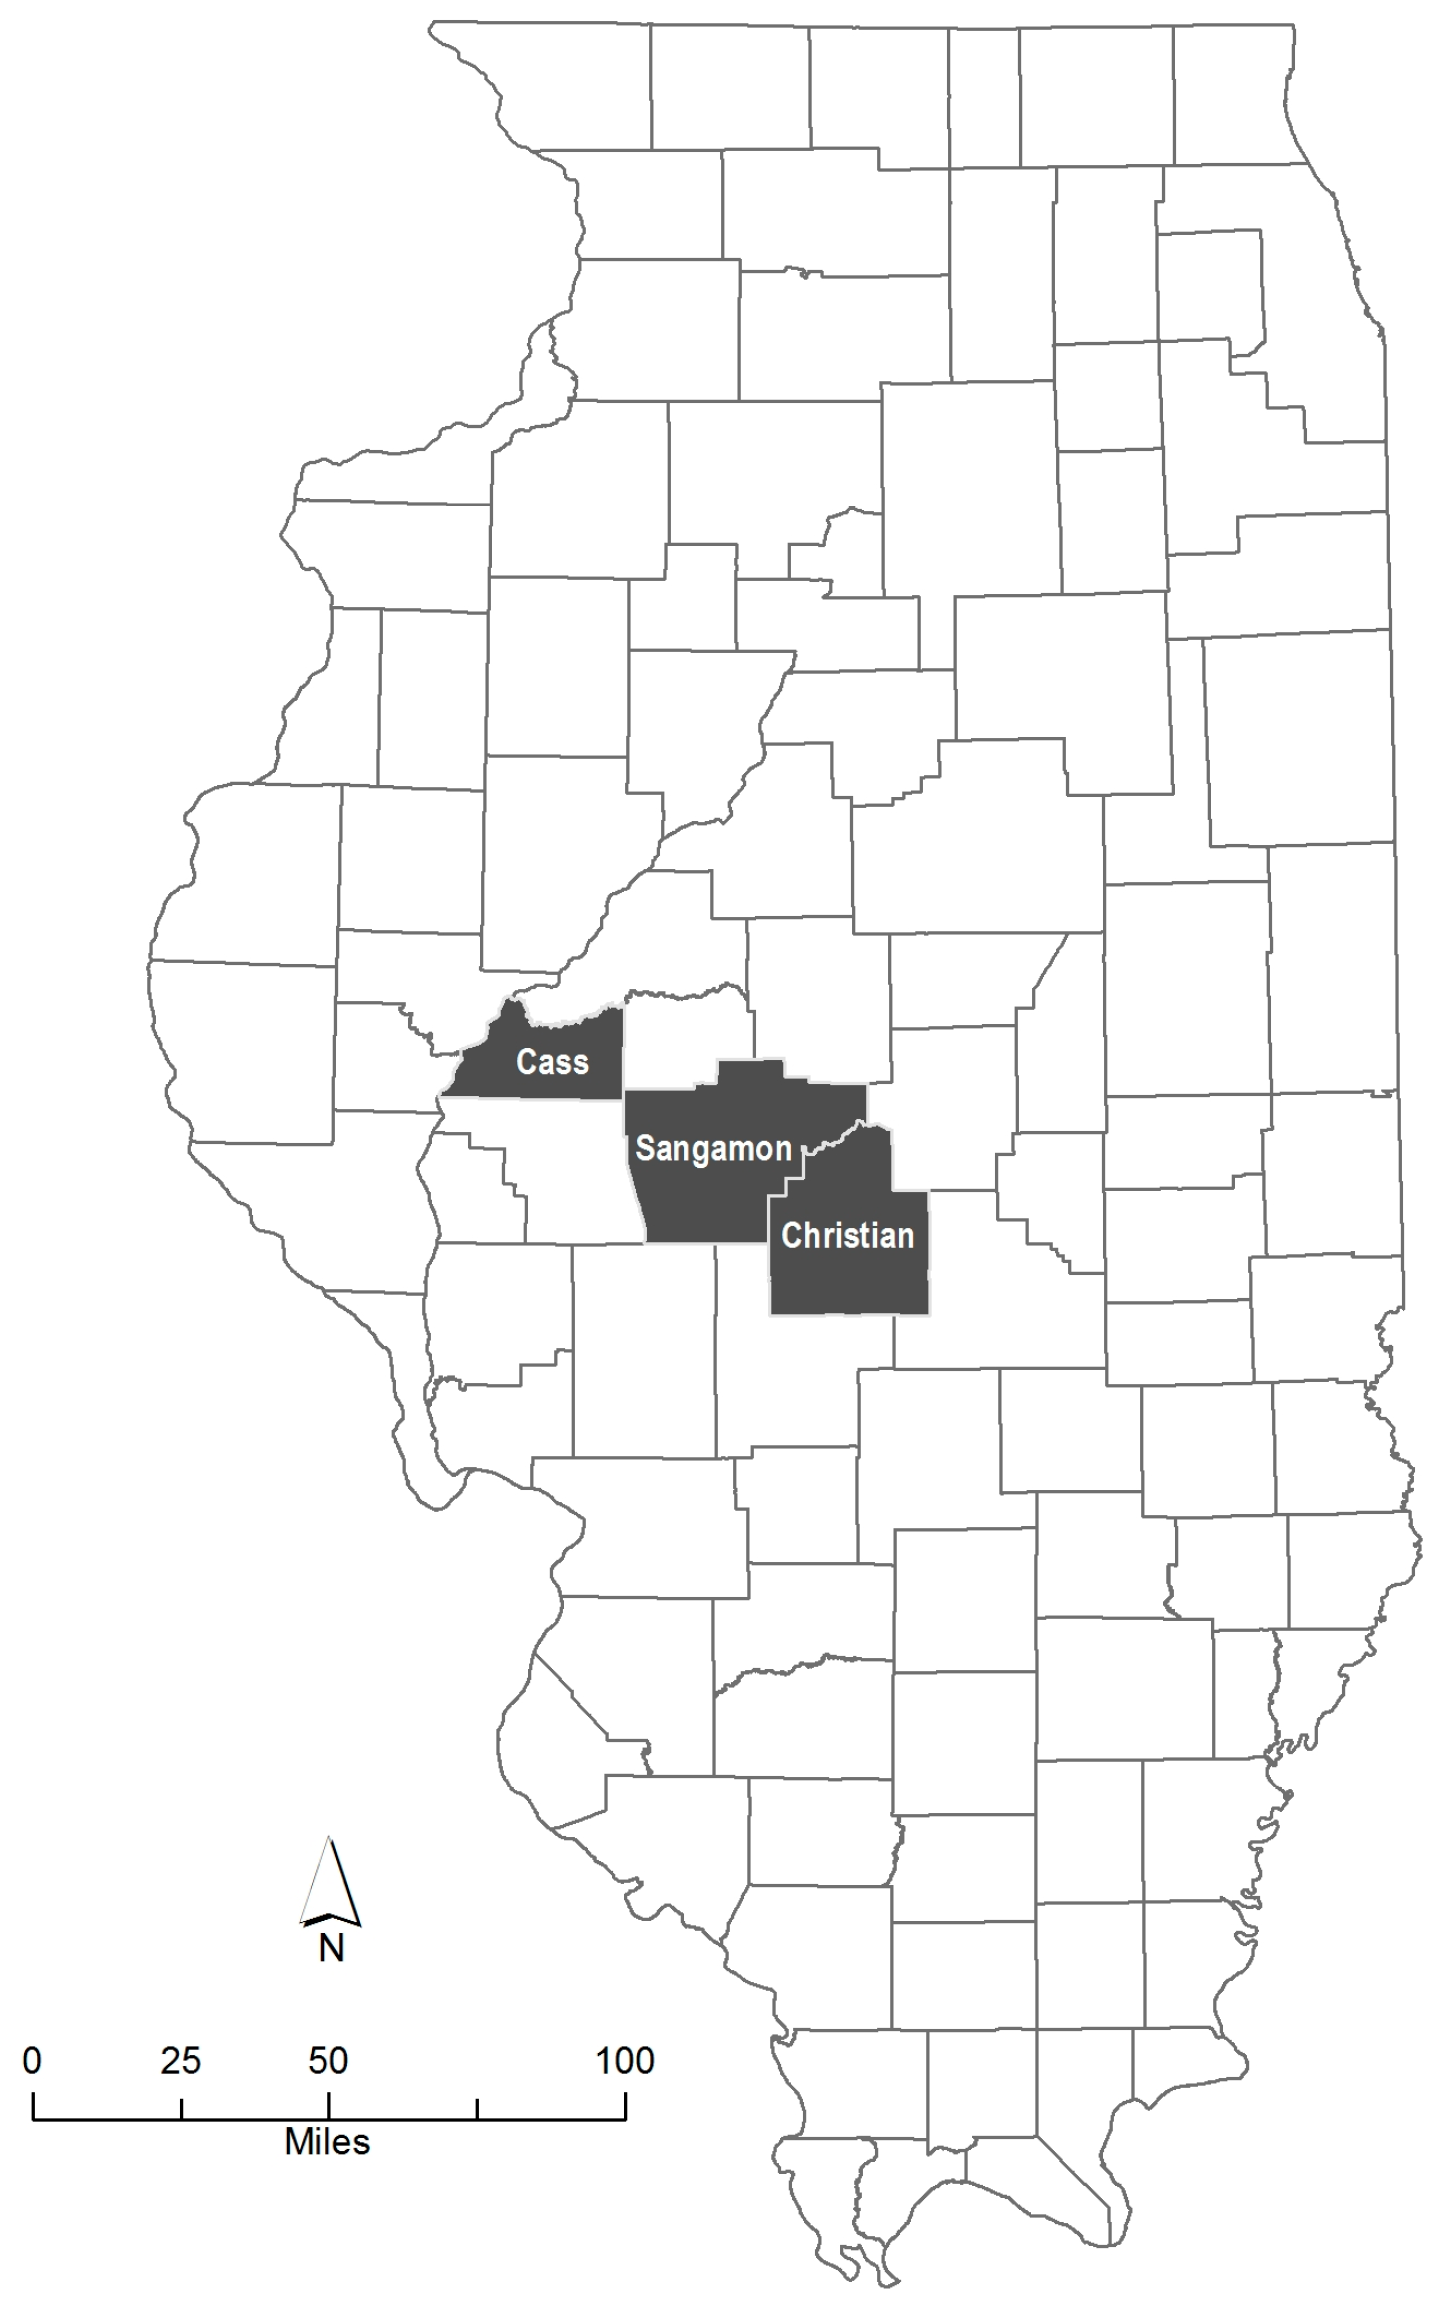
2.1. Study Area

The study was conducted in central Illinois in Cass, Christian and Sangamon Counties (Figure 1). This is part of the Grand Prairie Natural Division, a vast plain of formerly tallgrass prairie [18]. Soils are fertile and well drained with the use of tile lines and ditches. The topography is generally level to rolling. The climate of Illinois is typically continental with cold winter temperatures (mean = −3.8 °C), warm summers (mean = 24.6 °C) and frequently fluctuating temperature, humidity, cloudiness and wind conditions. Precipitation averages 895 mm per year and the growing season is ~185 days (Midwestern Regional Climate Center 2009; Springfield, Illinois http:/mcc.sws.uiuc.edu). During both years of the study, precipitation was much below normal. Due to the reduced precipitation and high ambient temperatures, the region was considered to be in an extreme drought (National Oceanic and Atmospheric Administration 2012).
We selected 30 agricultural fields, ten in each of three Illinois counties, mostly seeded in a two to three year corn (Zea mays) and soybean (Glycine max) rotation. The average field size was 28 ha varying between 1 and 117 ha. Habitat complexity in the areas around the fields ranged from simple landscapes with a relatively high percentage of arable land, to complex landscapes with a relatively low percentage of arable land and a large proportion of semi-natural land cover and other land use types. We selected fields with a range of edge structure and height from closely mown monoculture through shrubby vegetation several meters in height. Roadsides were managed with a variety of mowing regimes and some areas were impacted by herbicide drift. We obtained permission to access the fields from either the land managers or landowners. Landowners or managers seeded field interiors with genetically modified corn or soybeans, prior to the start of the study.
A general overview of the bird species present was generated by noting species seen or heard during the period of time the investigators were in the field either preparing or retrieving invertebrate samples, around 20 min per location each visit from 26 May to 13 June in 2011 and 2012. This survey was intended to show that birds were present in the area of study and could potentially benefit from increased invertebrate abundance and diversity.

2.2. Sampling Methods

From 26 May to 13 June in 2011 and 2012, invertebrates were sampled with sticky boards, sweep netting, and pitfall trapping [19]. We selected this time period early in the avian breeding season to be comparable to other studies [20,21] Sampling methods were chosen to reflect probable invertebrate locations (flying, gleaning, and epigeic). Six sticky boards and pitfall traps per field were grouped equidistant from the ends of the field and adjacent to the road or field edge; three in the cultivated field interior (FI) and three on the edge (FE) outside the tilled area and spaced at 10 m intervals. Sampling sites in the FI were 10–15 m from the edge in the second equipment row and not in the field head. Sites on the FE were 1–2 m from the FI and within the vegetated edge. Sweep netting was conducted only in the FE to avoid damage to the crops.
Pitfall traps were 150 mL plastic cups with an aperture of 70 mm placed into the ground so that the mouths were flush with the ground. Each trap was filled to ~2.5 cm with a solution of water and vinegar and a few drops of dish soap added to break the surface tension of the water. Ethylene glycol was not used because it attracted mammals to the traps during a pilot study. Pitfall traps were retrieved seven days after placement and contents placed in a labeled clear Ziploc bag containing 70% isopropyl alcohol.
One sticky board (Sensor ~8 cm × 13 cm Yellow Monitoring Cards, GrowSmart, Colorado Springs, CO, USA), attached to a flag (~6 cm × 9 cm × 76 cm LimeGlo, Forestry Suppliers, Jackson, MS, USA) was placed adjacent to each pitfall trap. Boards were placed with a minimum of half the board above the vegetation. Boards were retrieved after two days, and placed in a clear plastic cover.
A sweep net sample consisted of 30 strokes, 360° around the sweep netter in the field edge near each of the pitfall traps resulting in three samples per field margin. The net was 38 cm in diameter with muslin netting (Forestry Suppliers). All sweep net samples were collected on sunny days between 10:00 a.m. and 2:00 p.m. with wind 0–19 km/h as measured on the Beaufort scale. Invertebrates were placed in a “knockdown” jar containing chloroform soaked cotton for several minutes, and then placed in a labeled clear plastic Ziploc bag containing 70% isopropyl alcohol.
ArcView GIS 3.2 (Environmental Systems Research Institute, Inc., Redlands, CA, USA) was used on The Illinois Critical Trends Assessment landcover database [22] to determine field area (ha), field edge length (m), average width of edge (m), distance to nearest large non-agricultural area >1 ha (m), proportion of non-agricultural area at three different scales, and soil type. Complexity, i.e., proportion of non-agricultural area, was determined within a 1000-m circular plot around each sampling location. Arable land included corn, soybeans, other miscellaneous row crops, and winter wheat (Triticum aestivum). Non-arable land included upland forest, savannah, coniferous forest, wet meadow, marsh, seasonally flooded, floodplain forest, swamp and shallow water.
Field locations were determined using a global positioning system (Garmin Oregon 450t). Each field was assigned a number designating a specific sample location. Dates of trap placement, sample retrieval and sweep netting were recorded. Vegetation of the edge, field, and nearest neighboring field were also recorded. The height of vegetation within the field edge was measured at 30 points along a transect between pitfall traps using a measuring stick.
Characteristics of the edges included the height and variability of the vegetation within the edge; the management of the edge: whether it had been mown since the start of the growing season or affected by herbicide drift; the width and length of the edge; and the amount of bare ground [23] around the sample location. Variability was calculated as the standard deviation of the height measurements. Field characteristics included the crop in both the study field and adjacent field not separated by a hard surface (i.e., field road or secondary roadway), field size and length, and mean crop height and height variation. Landscape features included soil type, the distance to the nearest non-arable space >1 ha; and the proportion of non-arable land to arable land within a 1000-m radius.

2.3. Identification of Invertebrates

Invertebrates were examined using a binocular microscope. Ten percent of the samples were examined a second time as quality control. An independent investigator adjudicated any conflicting identifications. Numbers of invertebrates smaller than 2 mm were estimated. Invertebrates larger than 2 mm were identified to lowest operational taxonomic unit (OTU), which in most cases was family, using taxonomic keys [24] and reference collections housed at the Illinois State Museum Research and Collections Center (ISM RCC). Some invertebrates were identified to orders rather than family due to rarity, dominance of one family, or difficulty of identification. We used the reference collections to measure a random sample of ten invertebrates in each family, of the mostly commonly collected taxa in Illinois, to determine average length.

2.4. Data Analysis

All statistical analyses were performed using the package ‘lme4’ in R (version 3.0.2; The R Foundation for Statistical Computing 2013). We applied a generalized linear mixed models (GLMM) assuming a Poisson distribution. Response variables were taxonomic diversity (TD), and estimated biomass (WT). TD was the exponentially transformed Shannon Wiener H′ (eH), making it Hill numbers of order 1 [25,26]. This transformation was made to ensure TD had the correct statistical characteristics for analysis [26]. WT was an estimate of dry weight (mg) based on average length (mm) [27].
Mathematical models were used to represent the various hypotheses of response variables and model fit used as a method of choosing the best hypothesis (or best working model) [28]. The model-selection approach can help select among the numerous hypothesis that could not be tested using a single model approach. For the purpose of developing the models, we classified the predictor variables into three groups: (1) edge: edge vegetation height and variation, edge length and depth, amount of bare ground, and whether vegetation had been recently mown or exposed to herbicide drift; (2) field: crop in the field and adjacent field, area and length of the field, and height and variation of the crop; and (3) landscape: soil type, distance to the nearest non-arable land >1 ha, and percent of non-arable land within a 1000-m radius around the sampling site.
We developed eight hypotheses regarding the response variable X, either TD or WT, being dependent on a combination of these three groups of predictor variables. The eight hypotheses are as follows: H1: X dependent on edges; H2: X dependent on fields; H3: X dependent on landscape; H4: X dependent on edges and fields; H5: X dependent on edges and landscape; H6: X dependent on fields and landscape; H7: Global Model: X dependent on edges, fields and landscape; and H8: Null Model: X not dependent on either edges, fields or landscape.
Akaike’s information criteria corrected for sample size (AICc) was used to compare models [29]. Burnham and Anderson [28] suggest that models having ΔAICc (difference in AICc scores) within 1–2 of the best model have substantial support. Models within about 4–7 of the best model have considerably less support, while models with ΔAICc > 10 have essentially no support.
Random factors were method of collection (sticky board, pitfall trap, and sweep net), and field within county within year of sampling. TD was rounded up or down to the nearest whole number to be able to apply a Poisson family GLMM. Although the variance component of ID was small, this could indicate that the error of the models was not completely Poisson distributed without the ID [30]. In these cases the actual distribution can be assumed to be a quasi-Poisson distribution. Data is reported as X ¯ ± SE.

3. Results

There were 890 samples collected by pitfall trap, sticky boards, or sweep netting. We identified 155,460 specimens to 138 operational taxonomic units (OTUs). General invertebrate sampling results have been reported elsewhere [31]. Taxonomic diversity (TD) averaged 2.2 (1.0–15.3) ± 0.09. Biomass (WT) averaged 1155.0 mg (0.9–35,720) ± 74.30.
For both TD and WT, our first hypothesis (H1) had the best fit: TD and WT correlated with edge features which included edge vegetation height and variation, edge length and depth, amount of bare ground, and whether vegetation had been recently mown or exposed to herbicide drift. H2–H8 had ΔAICc > 10 (Table S1). In edges, diversity remains almost constant as edge height increases. It increases as vegetation height variability, edge depth and percent of bare ground increases. It decreases as field length increases. In fields, as edge height and variability and percent of bare ground increase, diversity increases. As field length increases, diversity in the field increases. As edge depth increased, diversity in the fields decreases. In both fields and edges, as edge height and variability and percent of bare ground increased, biomass increased. As field length increased, biomass in the edges showed a slight decline and an increase in fields. As edge depth increased, biomass in the fields declined and in the edges increased. TD was slightly greater in the edges where there was no mowing or evident herbicide drift and treatment of the edges had no impact on the fields. WT was greatest in edges impacted by herbicide drift and least in areas that had been mown (Table 1 and Table S2, Figure 2 and Figure 3).
There were 19 bird species identified during sampling (Table S3). All birds were seen or heard at least five times in each of the counties in each year of sampling. We also report population trends, residence status, nest placement, number of broods per year, feeding habits and habitat preferences based on literature [1,32,33].

4. Discussion

Our study shows that invertebrate taxonomic diversity (TD) and biomass (WT) are most impacted by vegetation features in the edges. The height and variability of the vegetation is a reflection of the vegetation diversity of the edge. It provides a number of niches for invertebrates to occupy [34,35]. Many edges in our study were planted with grasses and mown at some time either recently or possibly the end of the last growing season. In these cases the vegetation was a monoculture of uniform height. More varied vegetation height was generally found in edges that were not managed. Similar to other studies, as the biodiversity of the vegetation in the edges increased the biodiversity and biomass of the invertebrates increased as well [36,37].
The length of the edges is related to field size and has been increasing over time. As the field length increases, the TD and WT decline. There are several possible reasons for this decrease, including impacts from the non-vegetated areas such as roadways. Impacts include direct impacts of collision with vehicles and indirect impacts from de-icing chemicals and fluid leakage from vehicles. Additionally, as the length of the field increases so does the distance to the nearest non-tilled areas that serve as refugia or source populations in recovery after adverse events [38].
As the width of the edge increases TD and WT in the edges both increase. This could be from the lack of pesticide drift further from the agricultural field [39,40], as well as less exposure to road pollutants [41,42]. Greater width creates a higher interior to border ratio that might buffer the habitat from external effects. This also increases the area for occupation by invertebrates as well as provide more area for escape from external predators. The amount of bare ground has been shown to be directly related to TD as it was in our study. Edges planted in grasses were sometimes managed with mowing. Mowing and removing clippings allows greater insolation and access to living vegetation [43,44,45]. We noted if they had been mown since the start of the growing season. If the edges were mown, there was less WT both in the margins and in the fields. It is possible that they were more exposed to predation by having little to no place to hide or they moved to refugia immediately after the mowing event and had not repopulated the sampling site. Many invertebrates are susceptible to desiccation and might have left the sampling site if it was too hot and dry after mowing. The response to herbicide drift was interesting. Impact of herbicide drift was mostly evident in areas with tall grass. The structure of the grasses remained in place with new growth under the upper layer of dead vegetation. This allowed for refugia from predation, access to the soil surface, and protection from excessive drying. While the effects on invertebrate assemblages were predictable based on other research, it was interesting to note the effects on the fields did not parallel the effects in the edges. Invertebrates in the fields had a less strong reaction to the characteristics of the edge (Figure 2 and Figure 3).
Here we show the potential of linear elements with the agricultural landscape to provide invertebrate food items to avian taxa. Birds are an important part of the agricultural ecosystem. They consume many insects such as mosquitoes, Japanese beetles and European corn borer moths. Without birds, many of these insects would do considerably more damage to crops and spread diseases, such as West Nile Virus. Birds are also bio-indicators of environmental pollution with DDT contamination being an extreme example [46,47,48]. The birds in our study are generally considered common with some species increasing and others decreasing over time (Table S3). Our bird observations were somewhat limited because the time of day we conducted our sampling for invertebrates was a time of day birds were not very active. The birds noted in our study is an indication of what birds might potentially benefit from enhancing the agricultural edges. Since most of the birds noted in our study feed their young invertebrates, some of the invertebrates are potentially food for nestlings.
A limiting factor of our study is that when measuring the potential availability of bird food during the breeding season the sampling is concurrent with bird predation. When insects are at low densities, the impact of bird predation is proportionately greater [49]. We have looked at insect availability defined as abundance of possible prey items within the agricultural edge that has the potential for being used by a bird searching for food. Whether an available insect is actually eaten depends on factors outside the scope of this study such as its probability of being detected, its acceptability and its chances of being caught and eaten. Our study supports the theory that increasing ecological contrast has the potential for the enhancement of both invertebrate and avian taxa [50]. Birds use a variety of habitat components and the best configuration would be a matrix that had all needed components to fill life history needs [51,52]. Here, we show that edge features affect the diversity and biomass of potential food. Our study shows that the area outside the cultivated field has the potential for improving invertebrate diversity and abundance with minimal impact to the cultivated fields, and irrespective to factors in the surroundings. The characteristics of the field edges are such that this benefit can be achieved by the simple act of not mowing. This has the advantage of not requiring monetary expenditures or additional effort by the landowners. While management of linear agricultural areas to enhance local structure is easy to apply, there are some disadvantages. There is often social resistance to management of this type. Farmers like their fields to look manicured from the roads. There is the possibility that a lack of mowing might increase weeds and weed seed, representing a possible compensable cost to the landowner. There can be visibility issues from a traffic standpoint. There can also be increased bird fatalities from impact with vehicles. However, there are other benefits, such as reduced soil erosion, creation of pollinator habitats, and enhanced visual experience for the public. More studies are needed to determine the impacts of edge management and how to overcome social resistance.

Supplementary Materials

The following are available online at https://www.mdpi.com/2073-445X/5/3/26/s1, Table S1: Comparison of the models for taxonomic richness (TR), estimated biomass (WT) and abundance (AA), Table S2: Models and summary tables for taxonomic diversity (TD) and biomass (WT), Table S3: Birds seen or heard during sampling; population trends and life history compiled from literature.

Acknowledgments

We thank J. Noordijk and A. Bartke for advice and comments on previous drafts of this manuscript. We thank D. Fortman and A. Bartke for assistance with collections. We would like to thank the landowners and managers for their cooperation and access to their land. All funding was from personal funds.

Author Contributions

G.d.S., C.J.M.M., and T.R.E. designed the study; T.R.E. and M.J.M. collected data; T.R.E. and E.D.C. identified invertebrates; T.R.E. and C.J.M.M. analyzed data; and T.R.E., G.d.S, C.J.M.M., and M.J.M. prepared the manuscript.

Conflicts of Interest

The authors declare no conflict of interest.

References

  1. Walk, J.W.; Warwick, C. Illinois Birds: A Century of Change; Illinois Natural History Survey: Champaign, IL, USA, 2010. [Google Scholar]
  2. Geiger, F.; Bengtsson, J.; Berendse, F.; Weisser, W.W.; Emmerson, M.; Morales, M.B.; Ceryngier, P.; Liira, J.; Tscharntke, T.; Winqvist, C. Persistent negative effects of pesticides on biodiversity and biological control potential on european farmland. Basic Appl. Ecol. 2010, 11, 97–105. [Google Scholar] [CrossRef]
  3. Phalan, B.; Onial, M.; Balmford, A.; Green, R.E. Reconciling food production and biodiversity conservation: Land sharing and land sparing compared. Science 2011, 333, 1289–1291. [Google Scholar] [CrossRef] [PubMed]
  4. Grau, R.; Kuemmerle, T.; Macchi, L. Beyond ‘land sparing versus land sharing’: Environmental heterogeneity, globalization and the balance between agricultural production and nature conservation. Curr. Opin. Environ. Sustain. 2013, 5, 477–483. [Google Scholar] [CrossRef]
  5. Donald, P.F.; Evans, A.D. Habitat connectivity and matrix restoration: The wider implications of agri-environment schemes. J. Appl. Ecol. 2006, 43, 209–218. [Google Scholar] [CrossRef]
  6. Vickery, J.A.; Bradbury, R.B.; Henderson, I.G.; Eaton, M.A.; Grice, P.V. The role of agri-environment schemes and farm management practices in reversing the decline of farmland birds in england. Biol. Conserv. 2004, 119, 19–39. [Google Scholar] [CrossRef]
  7. Carvell, C.; Meek, W.R.; Pywell, R.F.; Goulson, D.; Nowakowski, M. Comparing the efficacy of agri-environment schemes to enhance bumble bee abundance and diversity on arable field margins. J. Appl. Ecol. 2007, 44, 29–40. [Google Scholar] [CrossRef]
  8. Anderson, R.C. Prairies in the prairie state. Trans. Ill. State Acad. Sci. 1970, 63, 214–221. [Google Scholar]
  9. Ries, L.; Fletcher, R.J., Jr.; Battin, J.; Sisk, T.D. Ecological responses to habitat edges: Mechanisms, models, and variability explained. Annu. Rev. Ecol. Evol. Syst. 2004, 35, 491–522. [Google Scholar] [CrossRef]
  10. Cavitt, J.F.; Thompson, C.F. Mass loss in breeding house wrens: Effects of food supplements. Ecology 1997, 78, 2512–2523. [Google Scholar] [CrossRef]
  11. Bell, G.P. Birds and mammals on an insect diet: A primer on diet composition analysis in relation to ecological energetics. Stud. Avian Biol. 1990, 13, 416–422. [Google Scholar]
  12. Batáry, P.; Báldi, A.; Szél, G.; Podlussány, A.; Rozner, I.; Erdős, S. Responses of grassland specialist and generalist beetles to management and landscape complexity. Divers. Distrib. 2007, 13, 196–202. [Google Scholar] [CrossRef]
  13. Steffan-Dewenter, I.; Tscharntke, T. Insect communities and biotic interactions on fragmented calcareous grasslands—A mini review. Biol. Conserv. 2002, 104, 275–284. [Google Scholar] [CrossRef]
  14. Westerman, P.; Hofman, A.; Vet, L.; van der Werf, W. Relative importance of vertebrates and invertebrates in epigeaic weed seed predation in organic cereal fields. Agric. Ecosyst. Environ. 2003, 95, 417–425. [Google Scholar] [CrossRef]
  15. Marvier, M.; McCreedy, C.; Regetz, J.; Kareiva, P. A meta-analysis of effects of Bt cotton and maize on nontarget invertebrates. Science 2007, 316, 1475–1477. [Google Scholar] [CrossRef] [PubMed]
  16. Wilson, J.D.; Morris, A.J.; Arroyo, B.E.; Clark, S.C.; Bradbury, R.B. A review of the abundance and diversity of invertebrate and plant foods of granivorous birds in northern europe in relation to agricultural change. Agric. Ecosyst. Environ. 1999, 75, 13–30. [Google Scholar] [CrossRef]
  17. Stinner, B.R.; House, G. Arthropods and other invertebrates in conservation-tillage agriculture. Annu. Rev. Entomol. 1990, 35, 299–318. [Google Scholar] [CrossRef]
  18. Schwegman, J.E. The Natural Divisions of Illinois; Illinois Nature Preserves Commission: Springfield, IL, USA, 1973. [Google Scholar]
  19. Eymann, J. Manual on field recording techniques and protocols for all taxa biodiversity inventories and monitoring. Abc Taxa 2010, 8. Part 1. Available online: http://www.abctaxa.be/ (accessed on 21 October 2011). [Google Scholar]
  20. Hendron, L.M. Do Arthropod Abundance and Diversity Differ between Grass Habitats Varying in Height? Master’s Thesis, University of Illinois, Urbana, IL, USA, 2010. [Google Scholar]
  21. Graber, R.R.; Graber, J.W. A comparative study of bird populations in Illinois, 1906–1909 and 1956–1958. Ill. Nat. Hist. Surv. Bull. 1963, 28. no. 03. [Google Scholar]
  22. Luman, D.; Joselyn, M.; Suloway, L. Critical Trends Assessment Project: Landcover Database; Illinois Natural History Survey: Champaign, IL, USA, 2009. [Google Scholar]
  23. Kennedy, P.L.; DeBano, S.J.; Bartuszevige, A.M.; Lueders, A.S. Effects of native and non-native grassland plant communities on breeding passerine birds: Implications for restoration of northwest bunchgrass prairie. Restor. Ecol. 2009, 17, 515–525. [Google Scholar] [CrossRef]
  24. Triplehorn, C.A.; Johnson, N.F. Borror and Delong’s Introduction to the Study of Insects; Thomson Brooks/Cole: Belmont, CA, USA, 2005. [Google Scholar]
  25. Hill, M.O. Diversity and evenness: A unifying notation and its consequences. Ecology 1973, 54, 427–432. [Google Scholar] [CrossRef]
  26. Jost, L. Partitioning diversity into independent alpha and beta components. Ecology 2007, 88, 2427–2439. [Google Scholar] [CrossRef] [PubMed]
  27. Rogers, L.E.; Hinds, W.; Buschbom, R.L. A general weight vs. Length relationship for insects. Ann. Entomol. Soc. Am. 1976, 69, 387–389. [Google Scholar] [CrossRef]
  28. Burnham, K.; Anderson, D. Model Selection and Inference: A Practical Informationtheoretic Approach: 60–64; Springer: Berlin/Heidelberg, Germany; New York, NY, USA, 1998. [Google Scholar]
  29. Burnham, K.P.; Anderson, D.R.; Huyvaert, K.P. Aic model selection and multimodel inference in behavioral ecology: Some background, observations, and comparisons. Behav. Ecol. Sociobiol. 2011, 65, 23–35. [Google Scholar] [CrossRef]
  30. Elston, D.; Moss, R.; Boulinier, T.; Arrowsmith, C.; Lambin, X. Analysis of aggregation, a worked example: Numbers of ticks on red grouse chicks. Parasitology 2001, 122, 563–569. [Google Scholar] [CrossRef] [PubMed]
  31. Evans, T.R.; Mahoney, M.J.; Cashatt, E.D.; Noordijk, J.; de Snoo, G.; Musters, C. The impact of landscape complexity on invertebrate diversity in edges and fields in an agricultural area. Insects 2016, 7, 7. [Google Scholar] [CrossRef] [PubMed]
  32. Ehrlich, P.; Dobkin, D.S.; Wheye, D. Birder’s Handbook; Simon and Schuster: New York, NY, USA, 1988. [Google Scholar]
  33. Kleen, V.M.; Cordle, L.; Montgomery, R.A. The Illinois Breeding Bird Atlas; Illinois Natural History Survey: Champaign, IL, USA, 2004; Volume 26. [Google Scholar]
  34. Kang, W.; Hoffmeister, M.; Martin, E.A.; Steffan-Dewenter, I.; Han, D.; Lee, D. Effects of management and structural connectivity on the plant communities of organic vegetable field margins in south korea. Ecol. Res. 2013, 28, 991–1002. [Google Scholar] [CrossRef]
  35. Noordijk, J.; Musters, C.; van Dijk, J.; de Snoo, G.R. Invertebrates in field margins: Taxonomic group diversity and functional group abundance in relation to age. Biodivers. Conserv. 2010, 19, 3255–3268. [Google Scholar] [CrossRef]
  36. Scheffer, M.; Achterberg, A.A.; Beltman, B. Distribution of macro-invertebrates in a ditch in relation to the vegetation. Freshw. Biol. 1984, 14, 367–370. [Google Scholar] [CrossRef]
  37. Healy, W.M. Turkey poult feeding activity, invertebrate abundance, and vegetation structure. J. Wildl. Manag. 1985, 49, 466–472. [Google Scholar] [CrossRef]
  38. Pryke, J.S.; Samways, M.J. Differential resilience of invertebrates to fire. Austral Ecol. 2012, 37, 460–469. [Google Scholar] [CrossRef]
  39. De Snoo, G.; Poll, R.v.d.; Bertels, J. Butterflies in sprayed and unsprayed field margins. J. Appl. Entomol. 1998, 122, 157–161. [Google Scholar] [CrossRef]
  40. Frampton, G.K.; Dorne, J.L.C.M. The effects on terrestrial invertebrates of reducing pesticide inputs in arable crop edges: A meta-analysis. J. Appl. Ecol. 2007, 44, 362–373. [Google Scholar] [CrossRef]
  41. Muskett, C.; Jones, M. The dispersal of lead, cadmium and nickel from motor vehicles and effects on roadside invertebrate macrofauna. Environ. Pollut. Ser. A Ecol. Biol. 1980, 23, 231–242. [Google Scholar] [CrossRef]
  42. Forman, R.T. Road ecology: A solution for the giant embracing us. Landsc. Ecol. 1998, 13. [Google Scholar] [CrossRef]
  43. Noordijk, J.; Schaffers, A.P.; Heijerman, T.; Boer, P.; Gleichman, M.; Sýkora, K.V. Effects of vegetation management by mowing on ground-dwelling arthropods. Ecol. Eng. 2010, 36, 740–750. [Google Scholar] [CrossRef]
  44. Parr, T.; Way, J. Management of roadside vegetation: The long-term effects of cutting. J. Appl. Ecol. 1988, 1073–1087. [Google Scholar] [CrossRef]
  45. Morris, M. Resoneses of grassland invertebrates to mangement by cutting: IV positive responses of auchenorhyncha. J. Appl. Ecol. 1981, 18, 763–771. [Google Scholar] [CrossRef]
  46. Padoa-Schioppa, E.; Baietto, M.; Massa, R.; Bottoni, L. Bird communities as bioindicators: The focal species concept in agricultural landscapes. Ecol. Indic. 2006, 6, 83–93. [Google Scholar] [CrossRef]
  47. Temple, S.A.; Wiens, J.A. Bird populations and environmental changes: Can birds be bio-indicators. Am. Birds 1989, 43, 260–270. [Google Scholar]
  48. Furness, R. Birds as monitors of pollutants. In Birds as Monitors of Environmental Change; Springer: Dordrecht, The Netherlands, 1993; pp. 86–143. [Google Scholar]
  49. Holmes, R.T.; Schultz, J.C.; Nothnagle, P. Bird predation on forest insects: An exclosure experiment. Science 1979, 206, 462–463. [Google Scholar] [CrossRef] [PubMed]
  50. Hammers, M.; Müskens, G.J.; van Kats, R.J.; Teunissen, W.A.; Kleijn, D. Ecological contrasts drive responses of wintering farmland birds to conservation management. Ecography 2015, 38, 813–821. [Google Scholar] [CrossRef]
  51. Leopold, A. A Sand County Almanac, 1949; Ballantine: New York, NY, USA, 1970. [Google Scholar]
  52. Smith, A.C.; Fahrig, L.; Francis, C.M. Landscape size affects the relative importance of habitat amount, habitat fragmentation, and matrix quality on forest birds. Ecography 2011, 34, 103–113. [Google Scholar] [CrossRef]
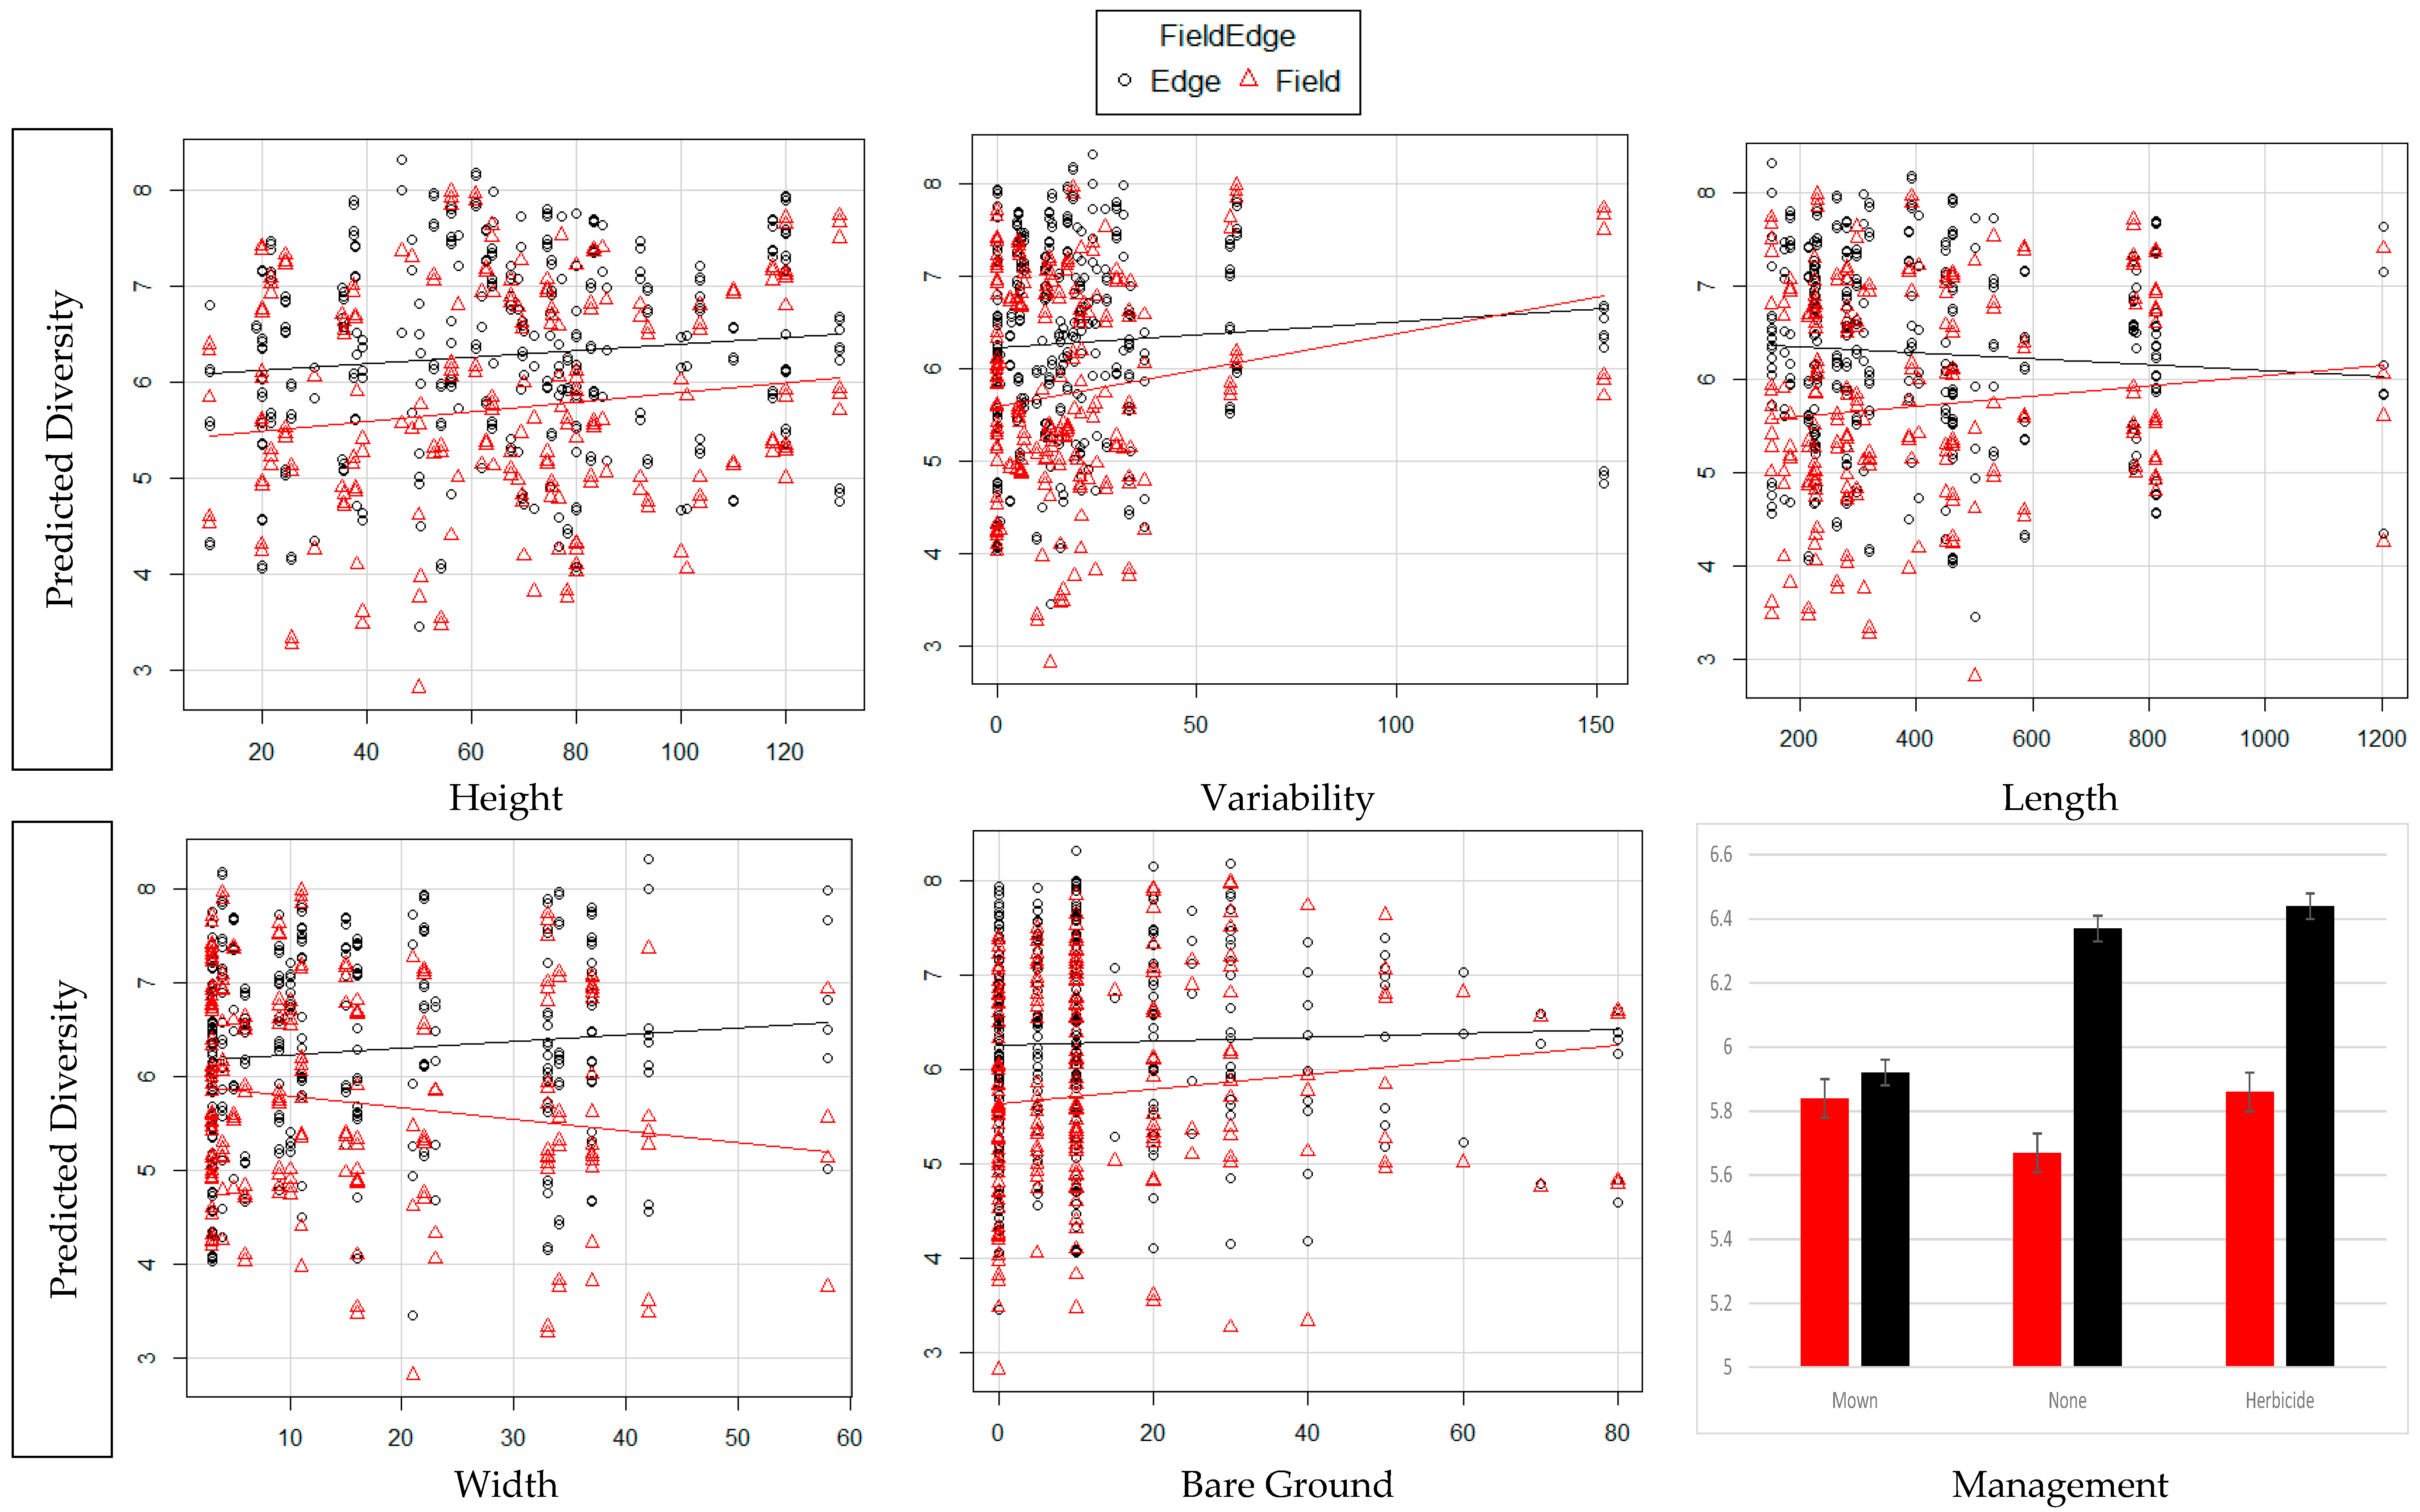
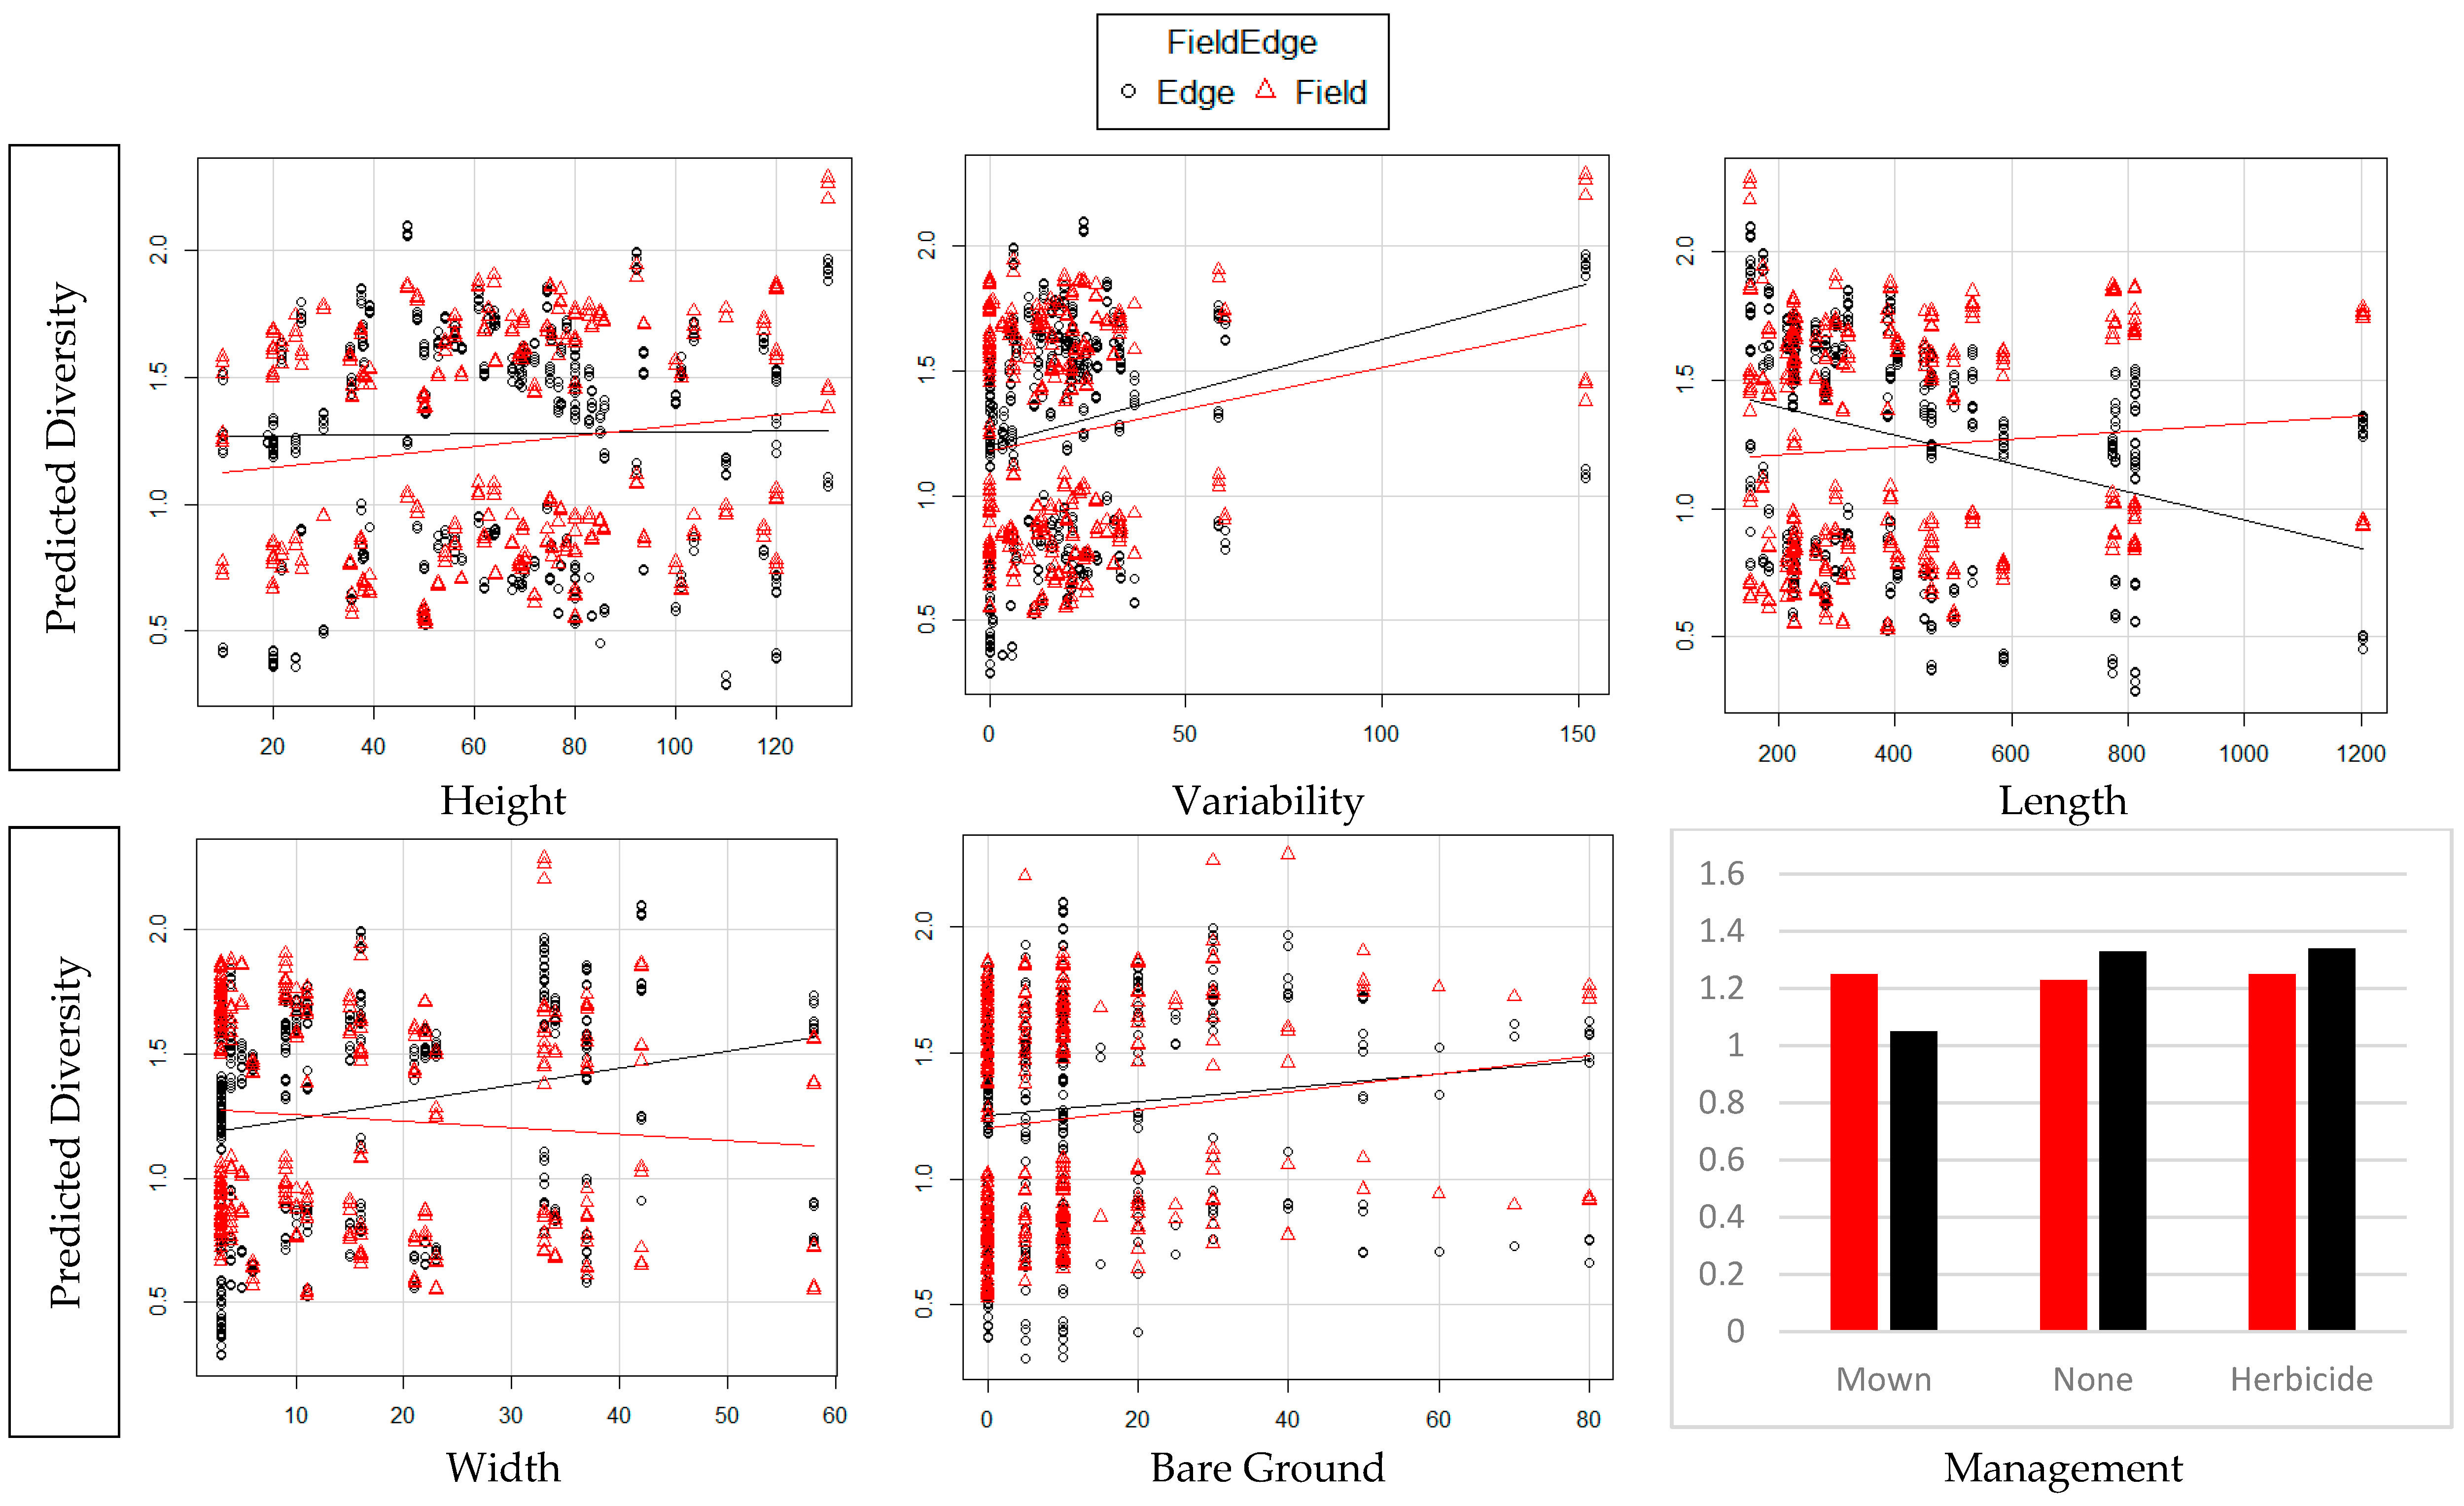
Figure 1. Map showing the location of the three Illinois counties in the study area.
Land 05 00026 g001
Figure 2. Diversity in fields and edges as predicted by each of the edge variables.
Land 05 00026 g002
Figure 3. Biomass in fields and edges as predicted by each of the edge variables.
Land 05 00026 g003
Table 1. Impact of individual variables in the fields and edges. Taxonomic diversity (TD) and biomass (WT).
Variable IncreaseTD EdgeTD FieldWT EdgeWT Field
Edge HeightDecreasedIncreasedIncreasedIncreased
Edge VariationIncreasedIncreasedIncreasedIncreased
Edge LengthDecreasedIncreasedDecreasedIncreased
Edge DepthIncreasedDecreasedIncreasedDecreased
Bare ground %IncreasedIncreasedIncreasedIncreased
ManagementMown (least)No ImpactMown (least)No Impact

