
Spatial Distribution of Estimated Wind-Power Royalties in West Texas


Abstract
:
1. Introduction

1.1. The Property Advantage
1.2. The Royalty Paradox
2. Research Design
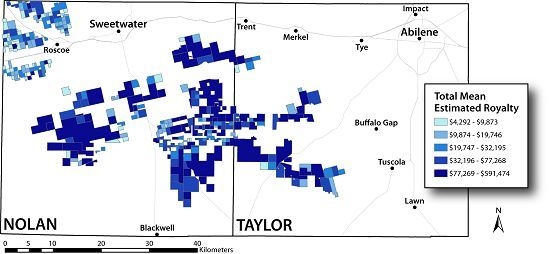
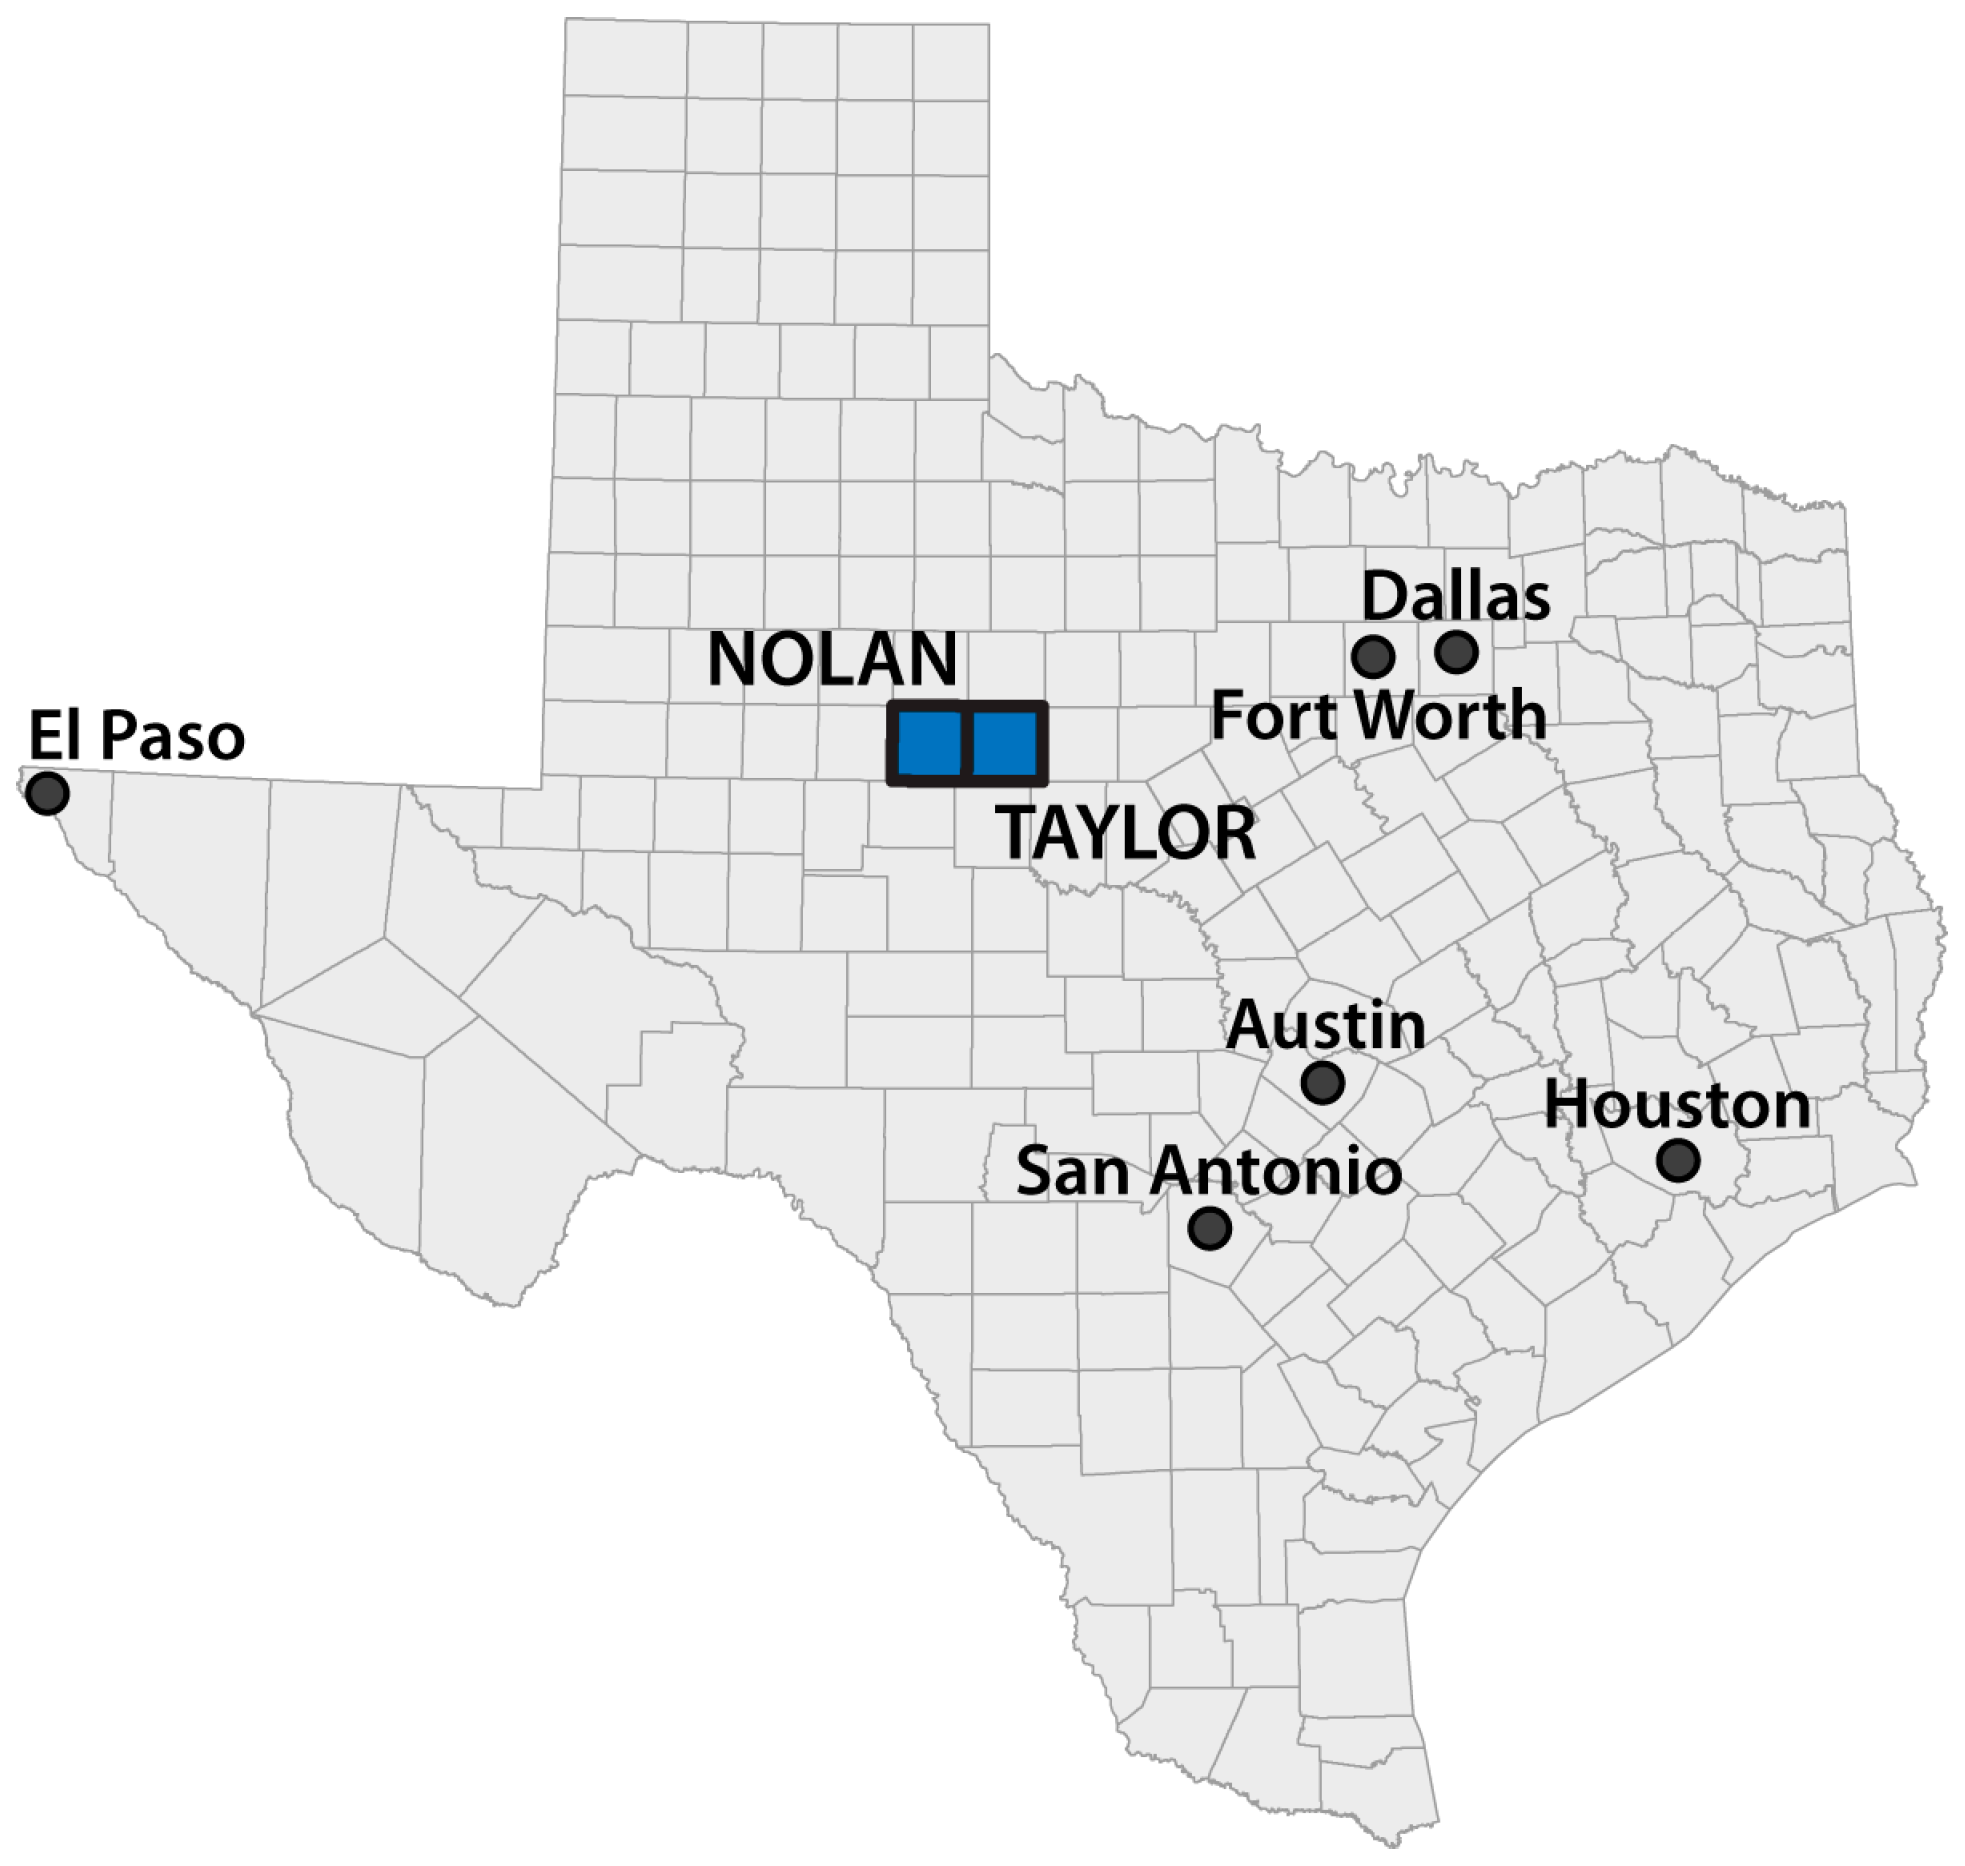
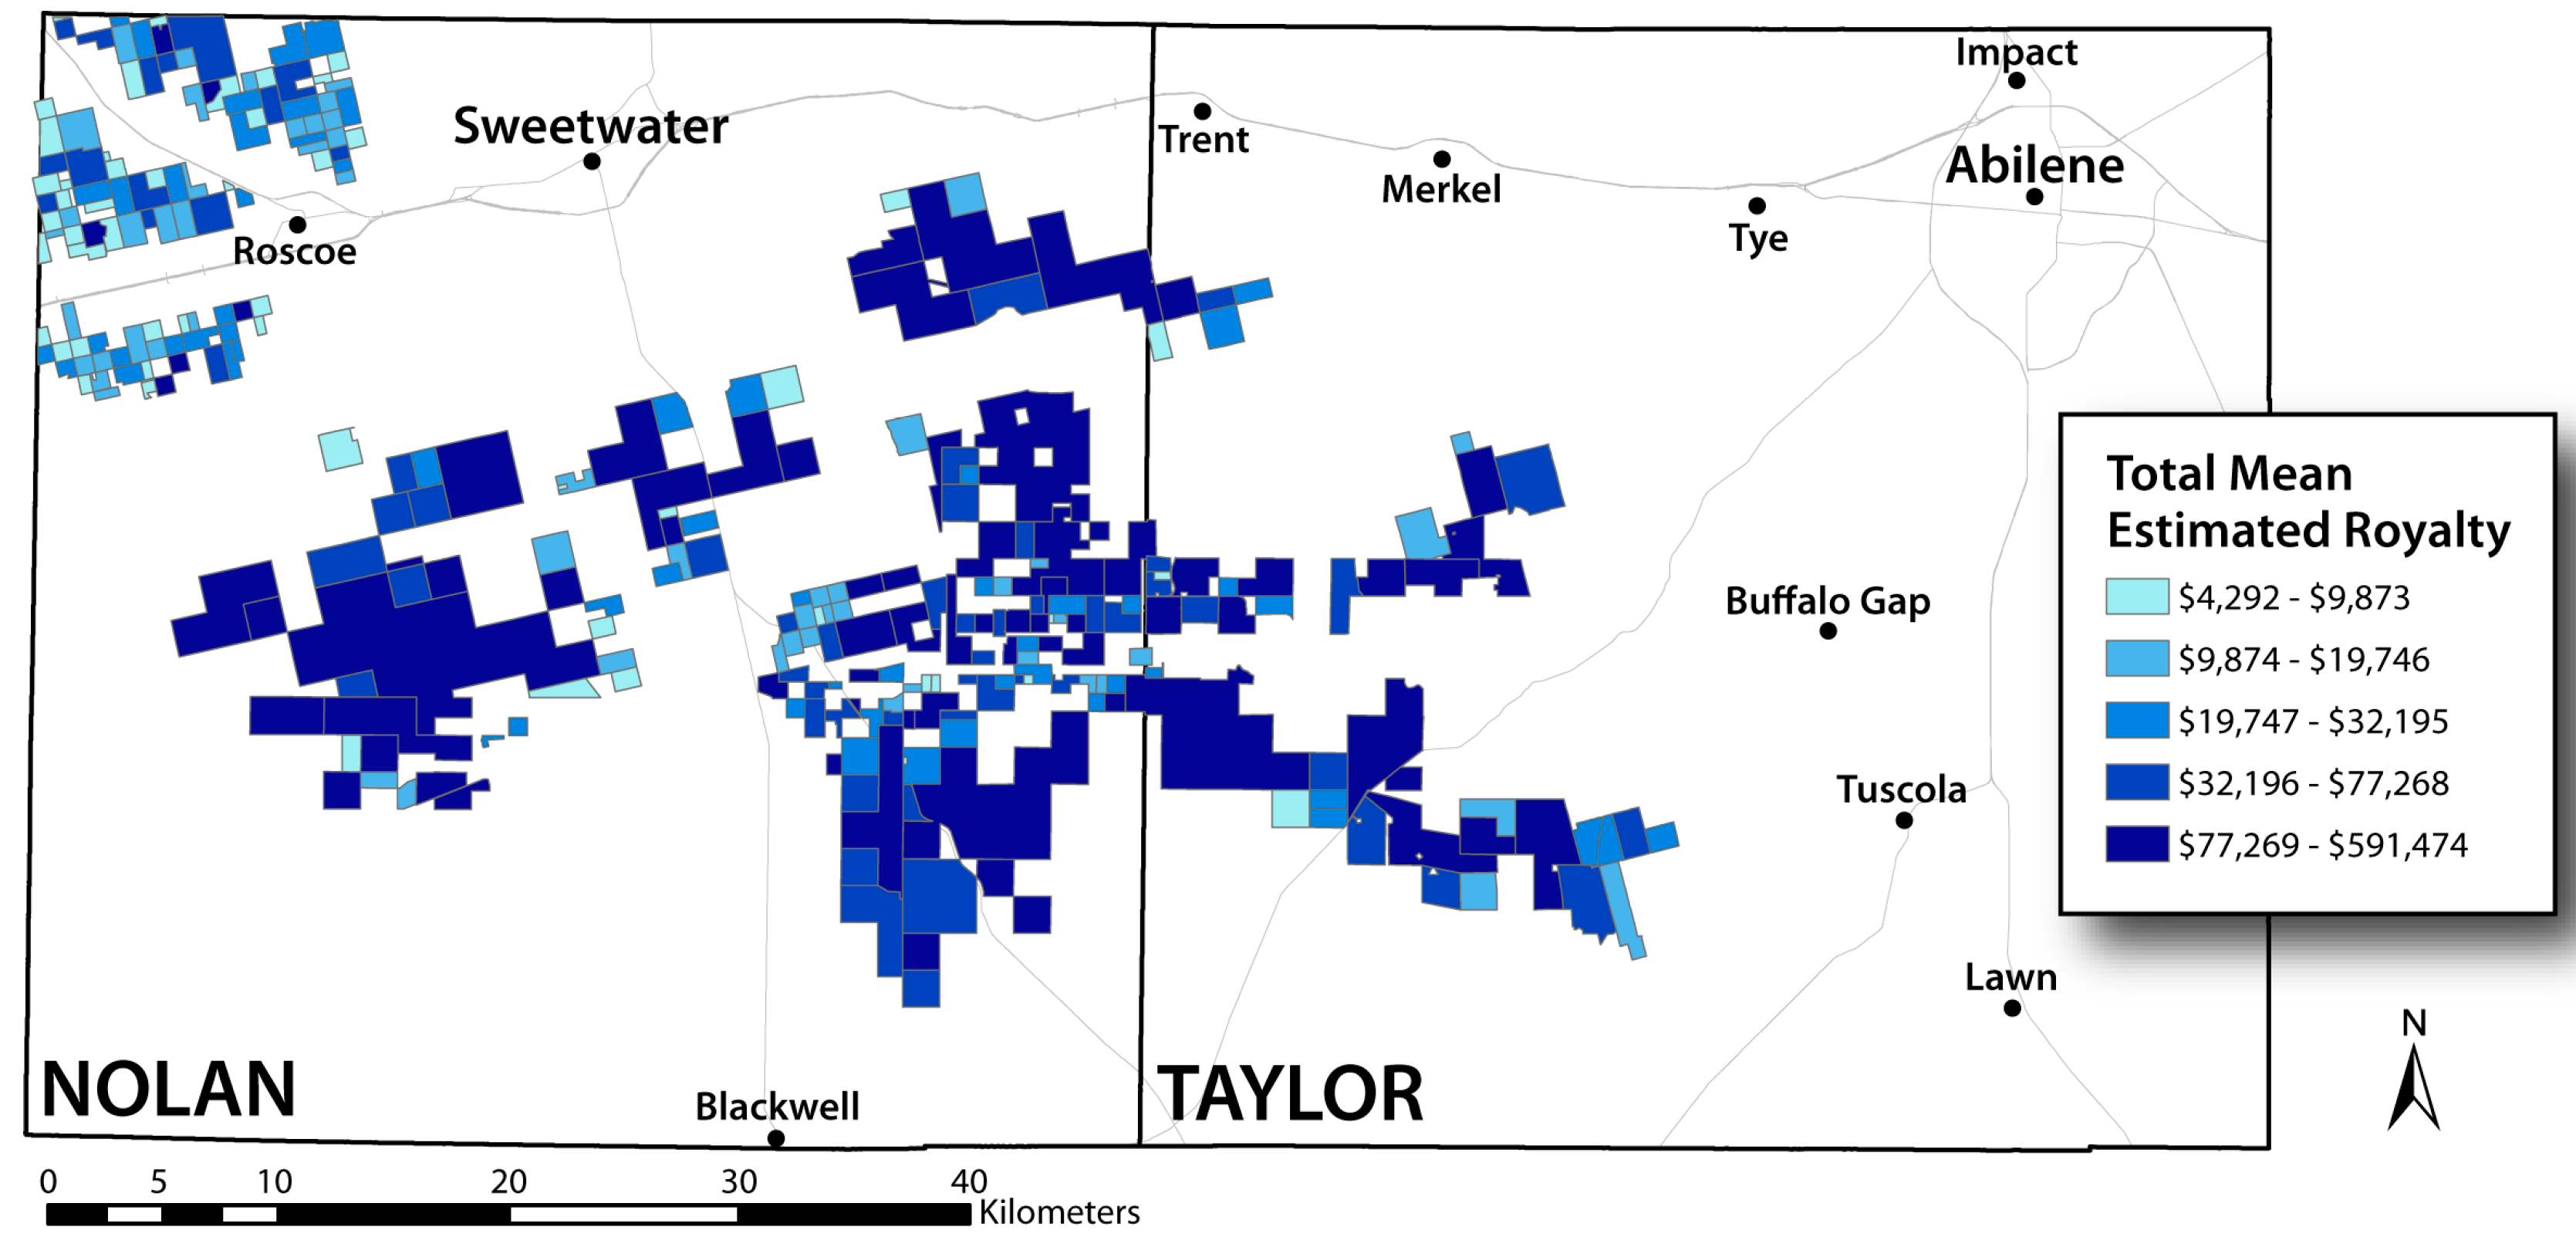
2.1. Study Region
2.2. Data Sources
2.3. Royalty Estimation

| Wind Farm Name | No. Turbines | MW per Turbine | Total MW | Estimated Royalty per Turbine per Year ($) |
|---|---|---|---|---|
| Buffalo Gap | 67 | 1.8 | 120.6 | 7726 |
| Buffalo Gap 3 | 73 | 2.3 | 167.9 | 9873 |
| Buffalo Gap II | 139 | 1.5 | 208.5 | 6439 |
| Callahan Divide | 76 | 1.5 | 114 | 6439 |
| Champion (Roscoe II) | 54 | 2.3 | 124.2 | 9873 |
| Horse Hollow II | 125 | 2.3 | 287.5 | 9873 |
| Horse Hollow | 292 | 1.5 | 438 | 6439 |
| Inandale (Roscoe IV) | 143 | 1.0 | 143 | 4292 |
| Roscoe | 100 | 1.0 | 100 | 4292 |
| South Trent Mesa | 43 | 2.3 | 98.9 | 9873 |
| Sweetwater | 171 | 1.5 | 257 | 6439 |
| Sweetwater 4a | 124 | 1.0 | 124 | 4292 |
| Sweetwater 4b | 46 | 2.3 | 105.8 | 9873 |
| Sweetwater 5 | 34 | 2.3 | 78.2 | 9873 |
| Trent Mesa | 101 | 1.5 | 151.5 | 6439 |
| Turkey Track | 113 | 1.5 | 169.5 | 6439 |
| Total | 1701 | 2688.1 |
3. Results and Discussion
| No. Turbines | Estimated Royalty Per Landholding ($) | Driving Time (minutes) to Tax Address | Landholding Area (hectares) | |
|---|---|---|---|---|
| Total | 1701 | 11,538,769 | 33,198 | 66,117 |
| Mean | 7 | 47,879 | 138 | 274 |
| Median | 4 | 25,756 | 38 | 129 |
| Mode | 2 | 29,619 | 21 | 65 |
| SD | 11 | 70,850 | 260 | 494 |
| Quintile and Metric | No. Turbines | Royalty per Landholding per Year ($) | Area per Landholding (ha) |
|---|---|---|---|
| Q1 Total (n=48) | 1020 (60.8%) | 7,017,091 (60.0%) | 40,425 (61.1%) |
| Mean | 21.3 | 146,189 | 842.2 |
| Median | 14 | 100,444 | 497.5 |
| Standard Dev. | 17.9 | 111,288 | 883.9 |
| Q2 Total (n=48) | 328 (18.5%) | 2,129,078 (19.3%) | 11,442 (17.3%) |
| Mean | 6.8 | 44,356 | 238.4 |
| Median | 6 | 39,492 | 211.5 |
| Standard Dev. | 1.7 | 10,932 | 152.4 |
| Q3 Total (n=48) | 173 (10.8%) | 1,249,539 (10.2%) | 5334 (8.1%) |
| Mean | 3.6 | 26,032 | 111.1 |
| Median | 4 | 27,473 | 86.5 |
| Standard Dev. | 0.5 | 4134 | 87.0 |
| Q4 Total (n=48) | 117 (6.7%) | 767,913 (6.9%) | 5307 (8.0%) |
| Mean | 2.4 | 15,998 | 110.6 |
| Median | 2 | 17,168 | 70.0 |
| Standard Dev. | 0.5 | 3340 | 84.5 |
| Q5 Total (n=49) | 63 (3.3%) | 375,148 (3.7%) | 3609 (5.5%) |
| Mean | 1.3 | 7656 | 73.7 |
| Median | 1 | 8584 | 65.0 |
| Standard Dev. | 0.5 | 2067 | 60.6 |

| Roscoe (n = 85) | Sweetwater (n = 156) | |||||
|---|---|---|---|---|---|---|
| No. Turbines | Royalty | Hectares | No. Turbines | Royalty | Hectares | |
| Mean | 3.6 | 19,310 | 115.6 | 8.9 | 63,307 | 361.3 |
| Median | 3.0 | 12,876 | 65.0 | 4.0 | 32,195 | 182.5 |
| Mode | 2.0 | 8584 | 65.0 | 3.0 | 29,619 | 259.0 |
| SD | 3.1 | 15,857 | 97.6 | 12.9 | 83,351 | 593.2 |
| Tax Address | No. Landholdings | No. Turbines | Royalty ($) |
|---|---|---|---|
| Nolan County | 105 (43.6%) | 739 (43.4%) | 4,867,684 (42.2%) |
| Taylor County | 42 (17.4%) | 312 (18.3%) | 2,219,266 (19.2%) |
| Other Texas | 79 (32.8%) | 538 (31.6%) | 3,652,962 (31.7%) |
| Other U.S. | 15 (6.2%) | 112 (6.6%) | 798,857 (6.9%) |
| Total | 241 | 1701 | 11,538,769 |
4. Conclusions
Acknowledgments
Author Contributions
Conflicts of Interest
References and Notes
- Brannstrom, C.; Vadjunec, J. Notes for avoiding a missed opportunity in sustainability science: Integrating land change science and political ecology. In Land Change Science, Political Ecology, and Sustainability: Synergies and Divergences; Brannstrom, C., Vadjunec, J., Eds.; Earthscan from Routledge: Abingdon, UK, 2013; pp. 1–23. [Google Scholar]
- Public Land and Wind Energy. Available online: http://www.awea.org/Issues/Content.aspx?ItemNumber=858 (accessed on 25 July 2014).
- Wiser, R.; Bolinger, M. 2012 Wind Technologies Market Report; U.S. Department of Energy: Washington, DC, USA, 2013. [Google Scholar]
- Wind Generates More than 10% of Texas Electricity in 2014. Available online: http://www.eia.gov/todayinenergy/detail.cfm?id=20051 (accessed on 7 June 2015).
- Swofford, J.; Slattery, M. Public attitudes of wind energy in Texas: Local communities in close proximity to wind farms and their effect on decision-making. Energy Policy 2010, 38, 2508–2519. [Google Scholar] [CrossRef]
- Slattery, M.C.; Johnson, B.L.; Swofford, J.A.; Pasqualetti, M.J. The predominance of economic development in the support for large-scale wind farms in the U.S. Great Plains. Renew. Sustain. Energy Rev. 2012, 16, 3690–3701. [Google Scholar] [CrossRef]
- Galbraith, K.; Price, A. The Great Texas Wind Rush: How George Bush, Ann Richards, and a Bunch of Tinkerers Helped the Oil State Win the Race to Wind Power; University of Texas Press: Austin, TX, USA, 2013. [Google Scholar]
- Weber, J.G.; Brown, J.P.; Pender, J. Rural Wealth Creation and Emerging Energy Industries: Lease and Royalty Payments to Farm Households and Businesses; Federal Reserve Bank of Kansas City: Kansas City, MO, USA, 2013. [Google Scholar]
- Fry, M.; Briggle, A.; Kincaid, C. Fracking and environmental (in) justice in a Texas City. Ecol. Econ. 2015, 117, 97–107. [Google Scholar] [CrossRef]
- Sowers, J. Fields of opportunity wind machines return to the plains. Gt. Plains Q. 2006, 26, 99–112. [Google Scholar]
- Walker, C.; Baxter, J.; Ouellette, D. Beyond rhetoric to understand determinants of wind turbine support and conflict in two Ontario, Canada communities. Environ. Plan. A 2013, 46, 730–745. [Google Scholar] [CrossRef]
- Abbott, J.A. The localized and scaled discourse of conservation for wind power in Kittitas County, Washington. Soc. Nat. Resour. 2010, 23, 969–985. [Google Scholar] [CrossRef]
- Mulvaney, K.K.; Woodson, P.; Prokopy, L.S. A tale of three counties: Understanding wind development in the rural midwestern United States. Energy Policy 2013, 56, 322–330. [Google Scholar] [CrossRef]
- Kahn, M.E. Local non-market quality of life dynamics in new wind farm communities. Energy Policy 2013, 59, 800–807. [Google Scholar] [CrossRef]
- Brown, J.P.; Pender, J.; Wiser, R.; Lantz, E.; Hoen, B. Ex post analysis of economic impacts from wind power development in U.S. counties. Energy Econ. 2012, 34, 1743–1754. [Google Scholar] [CrossRef]
- Slattery, M.; Lantz, E.; Johnson, B.L. State and local impacts from wind energy projects: Texas case study. Energy Policy 2011, 39, 7930–7940. [Google Scholar] [CrossRef]
- Lantz, E.; Tegen, S. Variables affecting economic development of wind energy. In Presented at WINDPOWER 2008, Houston, TX, USA, 1–4 June 2008.
- Greene, J.S.; Geisken, M. Socioeconomic impacts of wind farm development: A case study of Weatherford, Oklahoma. Energy Sustain. Soc. 2013. [Google Scholar] [CrossRef]
- BBC News. The world’s largest wind farms. BBC News, 25 November 2010. [Google Scholar]
- Shlachter, B. Rancher’s windfall. Ft. Worth Star-Telegram, 29 January 2006. [Google Scholar]
- Baxter, J.; Morzaria, R.; Hirsch, R. A case-control study of support/opposition to wind turbines: Perceptions of health risk, economic benefits, and community conflict. Energy Policy 2013, 61, 931–943. [Google Scholar] [CrossRef]
- Warren, C.R.; McFayden, M. Does community ownership affect public attitudes to wind energy? A case study from south-west Scotland. Land Use Policy 2010, 27, 204–213. [Google Scholar] [CrossRef]
- Bohn, C.; Lant, C. Welcoming the wind? Determinants of wind power development among U.S. States. Prof. Geogr. 2009, 61, 87–100. [Google Scholar] [CrossRef]
- Pasqualetti, M.J. Opposing wind energy landscapes: A search for common cause. Ann. Assoc. Am. Geogr. 2011, 101, 907–917. [Google Scholar] [CrossRef]
- Greene, A.C. A Personal Country; Texas A&M University Press: College Station, TX, USA, 1979 (1969). [Google Scholar]
- Moore, R.R. West Texas after the Discovery of Oil: A Modern Frontier; Jenkins Publishing and Pemberton Press: Austin, TX, USA, 1971. [Google Scholar]
- Fewer Wind Curtailments and Negative Power Prices Seen in Texas after Major Grid Expansion. Available online: http://www.eia.gov/todayinenergy/detail.cfm?id=16831 (accessed on 7 June 2015).
- Bolinger, M.; Wiser, R. Wind power price trends in the United States: Struggling to remain competitive in the face of strong growth. Energy Policy 2009, 37, 1061–1071. [Google Scholar] [CrossRef]
- Parker, B.D. Capturing the Wind: The Challenges of a New Energy Source in Texas; House Research Organization: Austin, TX, USA, 2008. [Google Scholar]
- Baldick, R. Wind and energy markets: A case study of Texas. IEEE Syst. J. 2012, 6, 27–34. [Google Scholar] [CrossRef]
- Zarnikau, J. Successful renewable energy development in a competitive electricity market: A Texas case study. Energy Policy 2011, 39, 3906–3913. [Google Scholar] [CrossRef]
- Tao, H.Y.S.; Srivastava, A.K.; Pineda, R.L.; Mandal, P. Wind power generation impact on electricity price in ERCOT. In Proceedings of the IEEE Power and Energy Society General Meeting, San Diego, CA, USA, 22–26 July 2012; pp. 1–7.
- Brannstrom, C.; Jepson, W.; Persons, N. Social perspectives on wind-power development in west Texas. Ann. Assoc. Am. Geogr. 2011, 101, 839–851. [Google Scholar] [CrossRef]
- Jepson, W.; Brannstrom, C.; Persons, N. “We don’t take the pledge”: Environmentality and environmental skepticism at the epicenter of US wind energy development. Geoforum 2012, 43, 851–863. [Google Scholar] [CrossRef]
- Boccard, N. Capacity factor of wind power realized values vs. estimates. Energy Policy 2009, 37, 2679–2688. [Google Scholar] [CrossRef]
- New Amsterdam Wind Source. Nolan County: Case study of wind energy economic impacts in Texas. 2008. Available online: http://www.moakcasey.com/articles/viewarticledoc.aspx/Nolan%20County%20Case%20Study.pdf?AID=168&DID=288 (accessed on 2 March 2009).
- Combs, S. The Energy Report; Texas Comptroller of Public Accounts: Austin, TX, USA, 2008. [Google Scholar]
- Lu, X.; McElroy, M.B.; Kiviluoma, J. Global potential for wind-generated electricity. Proc. Natl. Acad. Sci. USA 2009, 109, 10933–10938. [Google Scholar] [CrossRef] [PubMed]
- Wiser, R.; Bolinger, M. 2008 Wind Technologies Market Report; Department of Energy: Washington, DC, USA, 2009. [Google Scholar]
- Confidential interview with respondent 17, 20 May 2009.
- Confidential interview with respondent 25, 2 October 2010.
- Weaver, J.L. Unitization of Oil and Gas Fields in Texas: A Study of Legislative, Administrative, and Judicial Policies. Resources for the Future: Washington, DC, USA, 1986. [Google Scholar]
- Whitaker, J.B. The varying impacts of agricultural support programs on U.S. farm household consumption. Am. J. Agric. Econ. 2009, 91, 569–580. [Google Scholar] [CrossRef]
© 2015 by the authors; licensee MDPI, Basel, Switzerland. This article is an open access article distributed under the terms and conditions of the Creative Commons Attribution license (http://creativecommons.org/licenses/by/4.0/).
Share and Cite
Brannstrom, C.; Tilton, M.; Klein, A.; Jepson, W. Spatial Distribution of Estimated Wind-Power Royalties in West Texas. Land 2015, 4, 1182-1199. https://doi.org/10.3390/land4041182
Brannstrom C, Tilton M, Klein A, Jepson W. Spatial Distribution of Estimated Wind-Power Royalties in West Texas. Land. 2015; 4(4):1182-1199. https://doi.org/10.3390/land4041182
Chicago/Turabian StyleBrannstrom, Christian, Mary Tilton, Andrew Klein, and Wendy Jepson. 2015. "Spatial Distribution of Estimated Wind-Power Royalties in West Texas" Land 4, no. 4: 1182-1199. https://doi.org/10.3390/land4041182
APA StyleBrannstrom, C., Tilton, M., Klein, A., & Jepson, W. (2015). Spatial Distribution of Estimated Wind-Power Royalties in West Texas. Land, 4(4), 1182-1199. https://doi.org/10.3390/land4041182