
Patterns of Wastewater Infrastructure along a Gradient of Coastal Urbanization: A Study of the Puget Sound Region


Abstract
:1. Introduction
2. Patterns of Wastewater Infrastructure
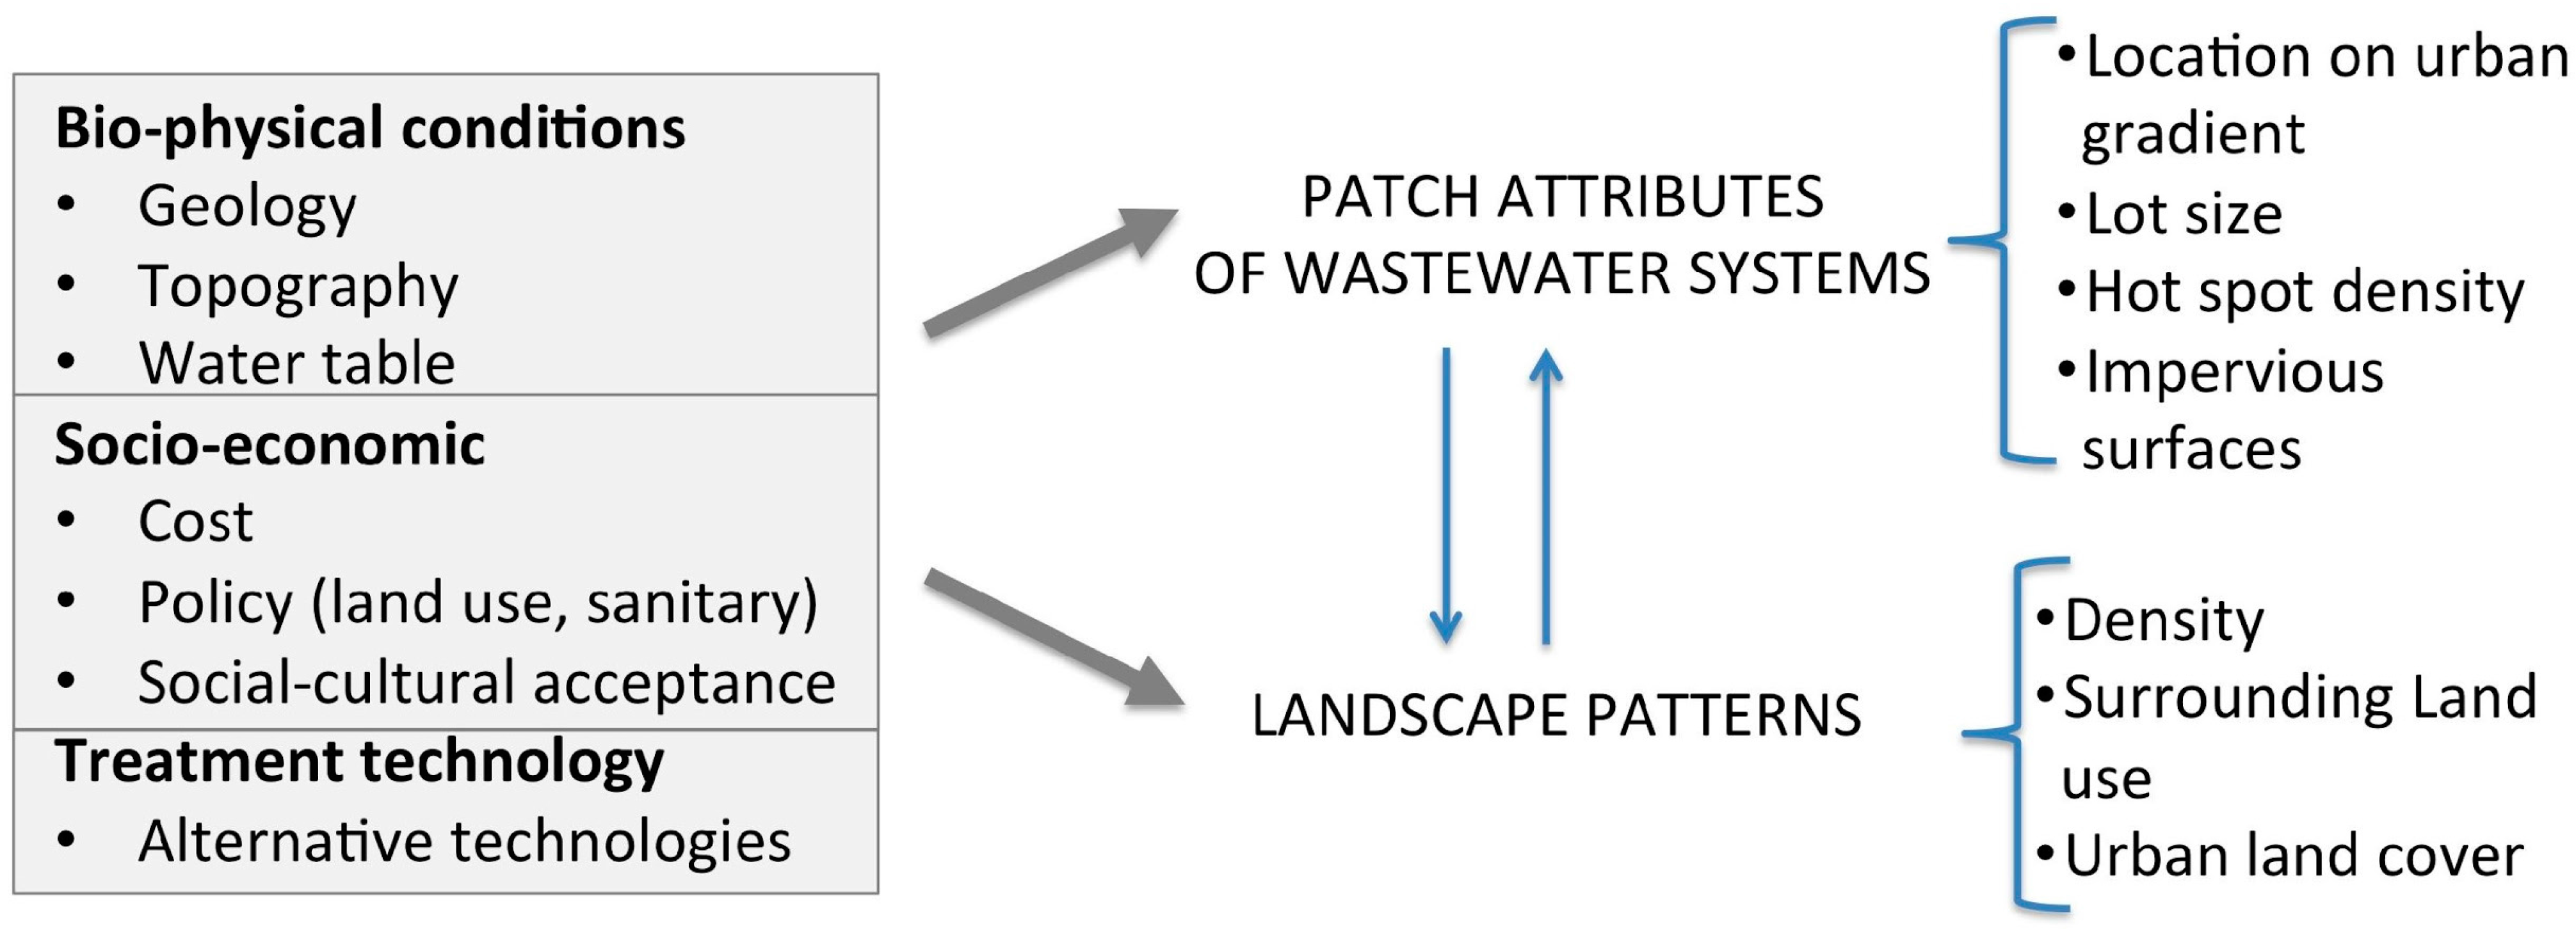
2.1. Bio-Physical and Socio-Economic Factors
2.1.1. Bio-Physical Factors
2.1.2. Sanitary and Infrastructure Policies
2.1.3. Economic Factors

3. Materials and Methods
3.1. Study Area and Data Description
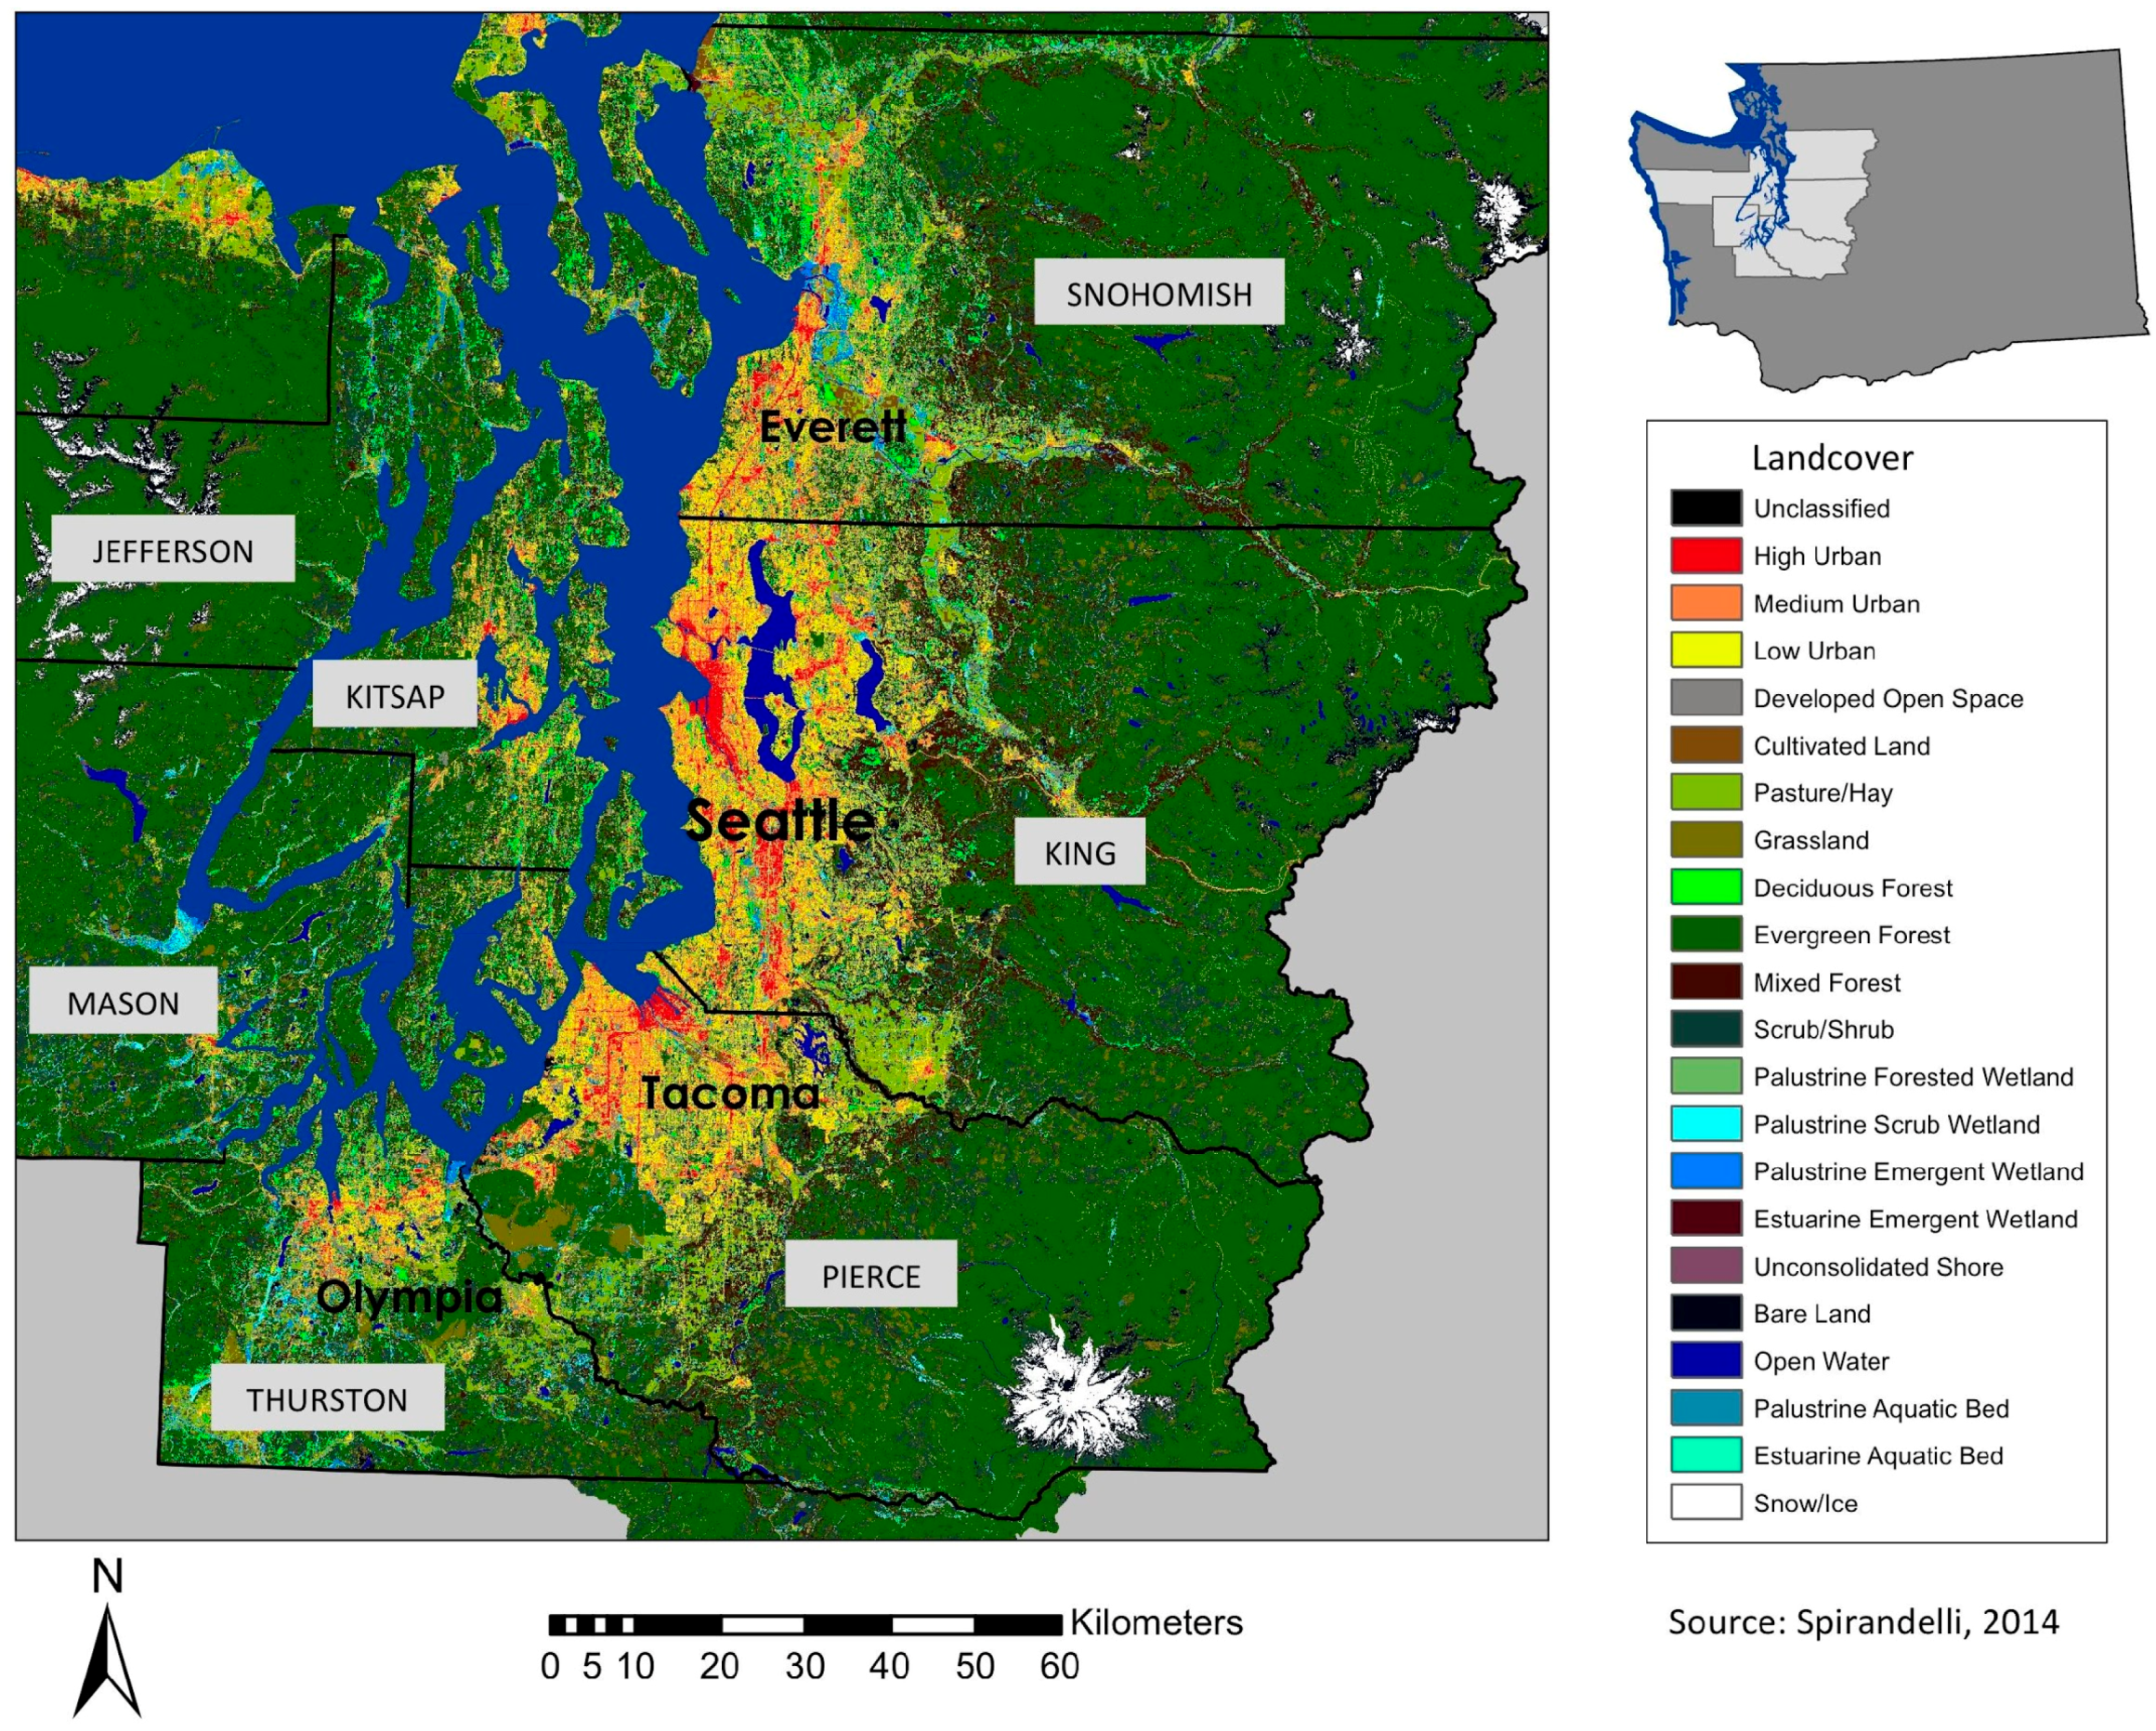
3.1.1. Study Area

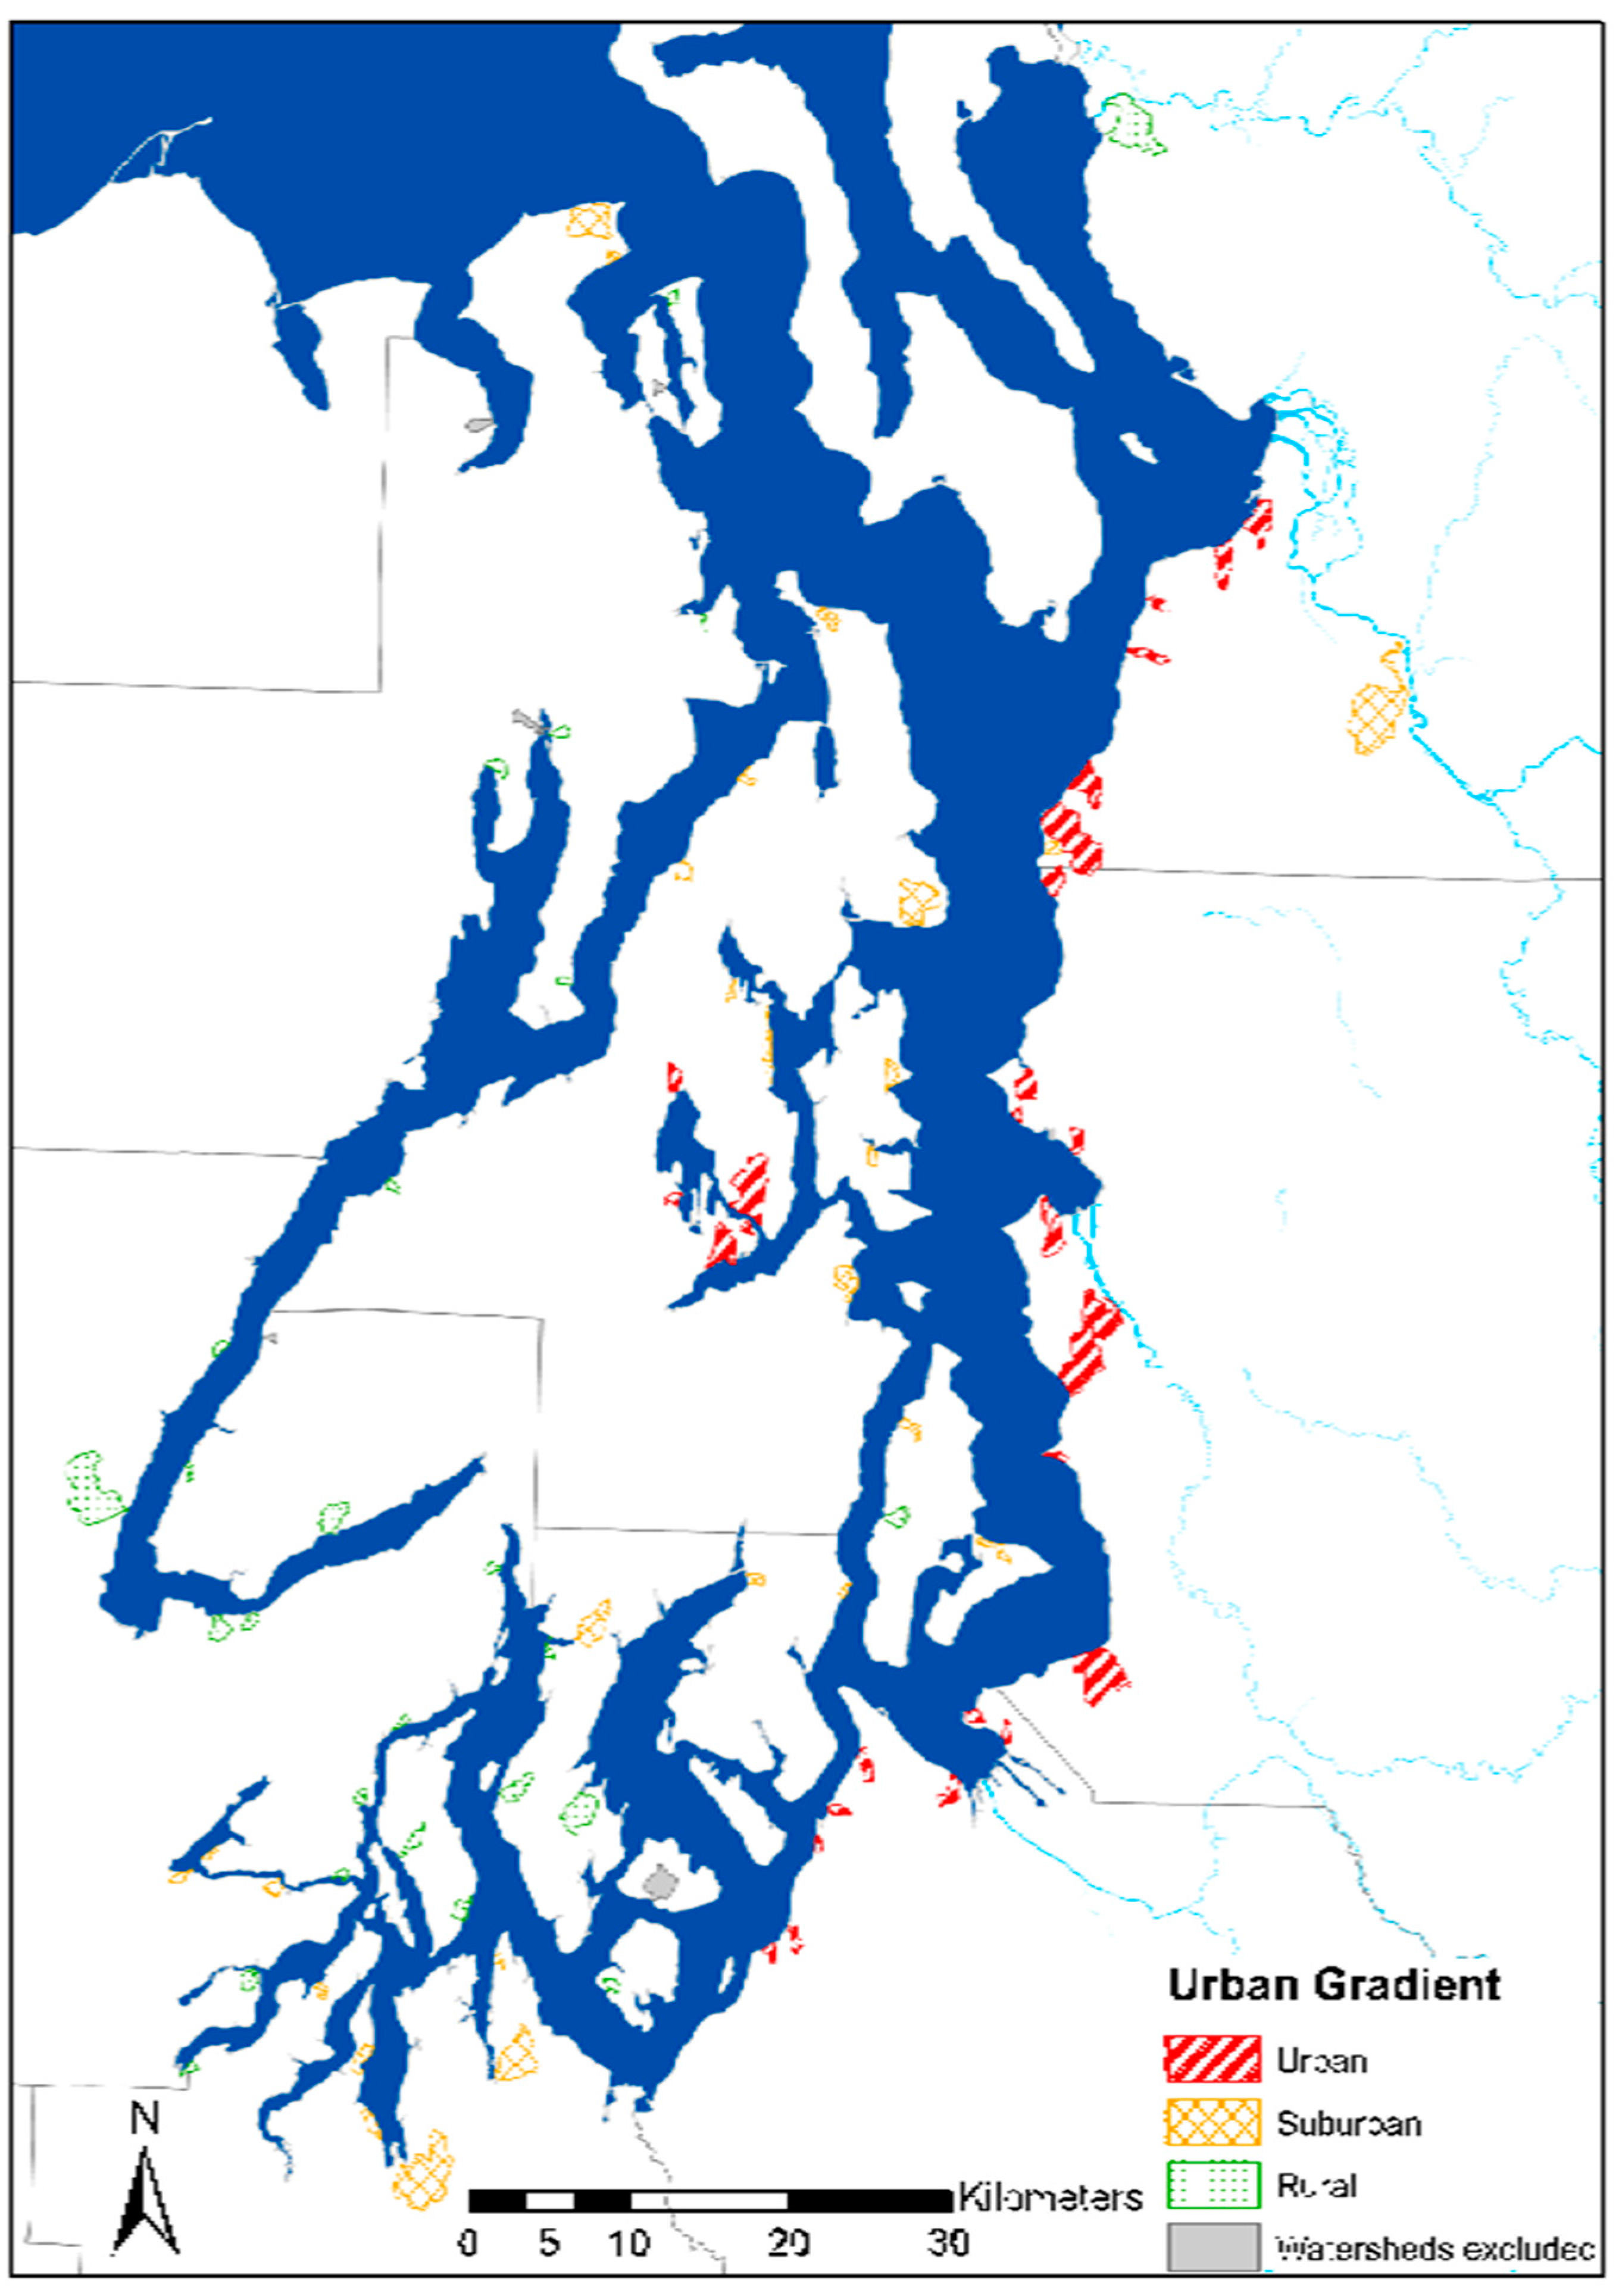
3.1.2. Sampling of Coastal Watersheds across an Urban Gradient

3.2. Watershed Analysis
Spatial Metrics

| Metric | Description |
|---|---|
| Mean count of sewers and septic tanks | The sum of all parcels on either a septic system, sewer system or no system |
| Proportion of parcels on wastewater system | Total number of parcels on a septic or sewer system divided by the sum of parcels on a wastewater type |
| Mean parcel-lot | Lot size of parcels on sewers and septic tanks averaged across watershed |
| Kernel density of parcels on a septic system | Proxy for density of septic systems, which may be a stressor on the nearshore |
| % Impervious | Measure of urbanization |
4. Results
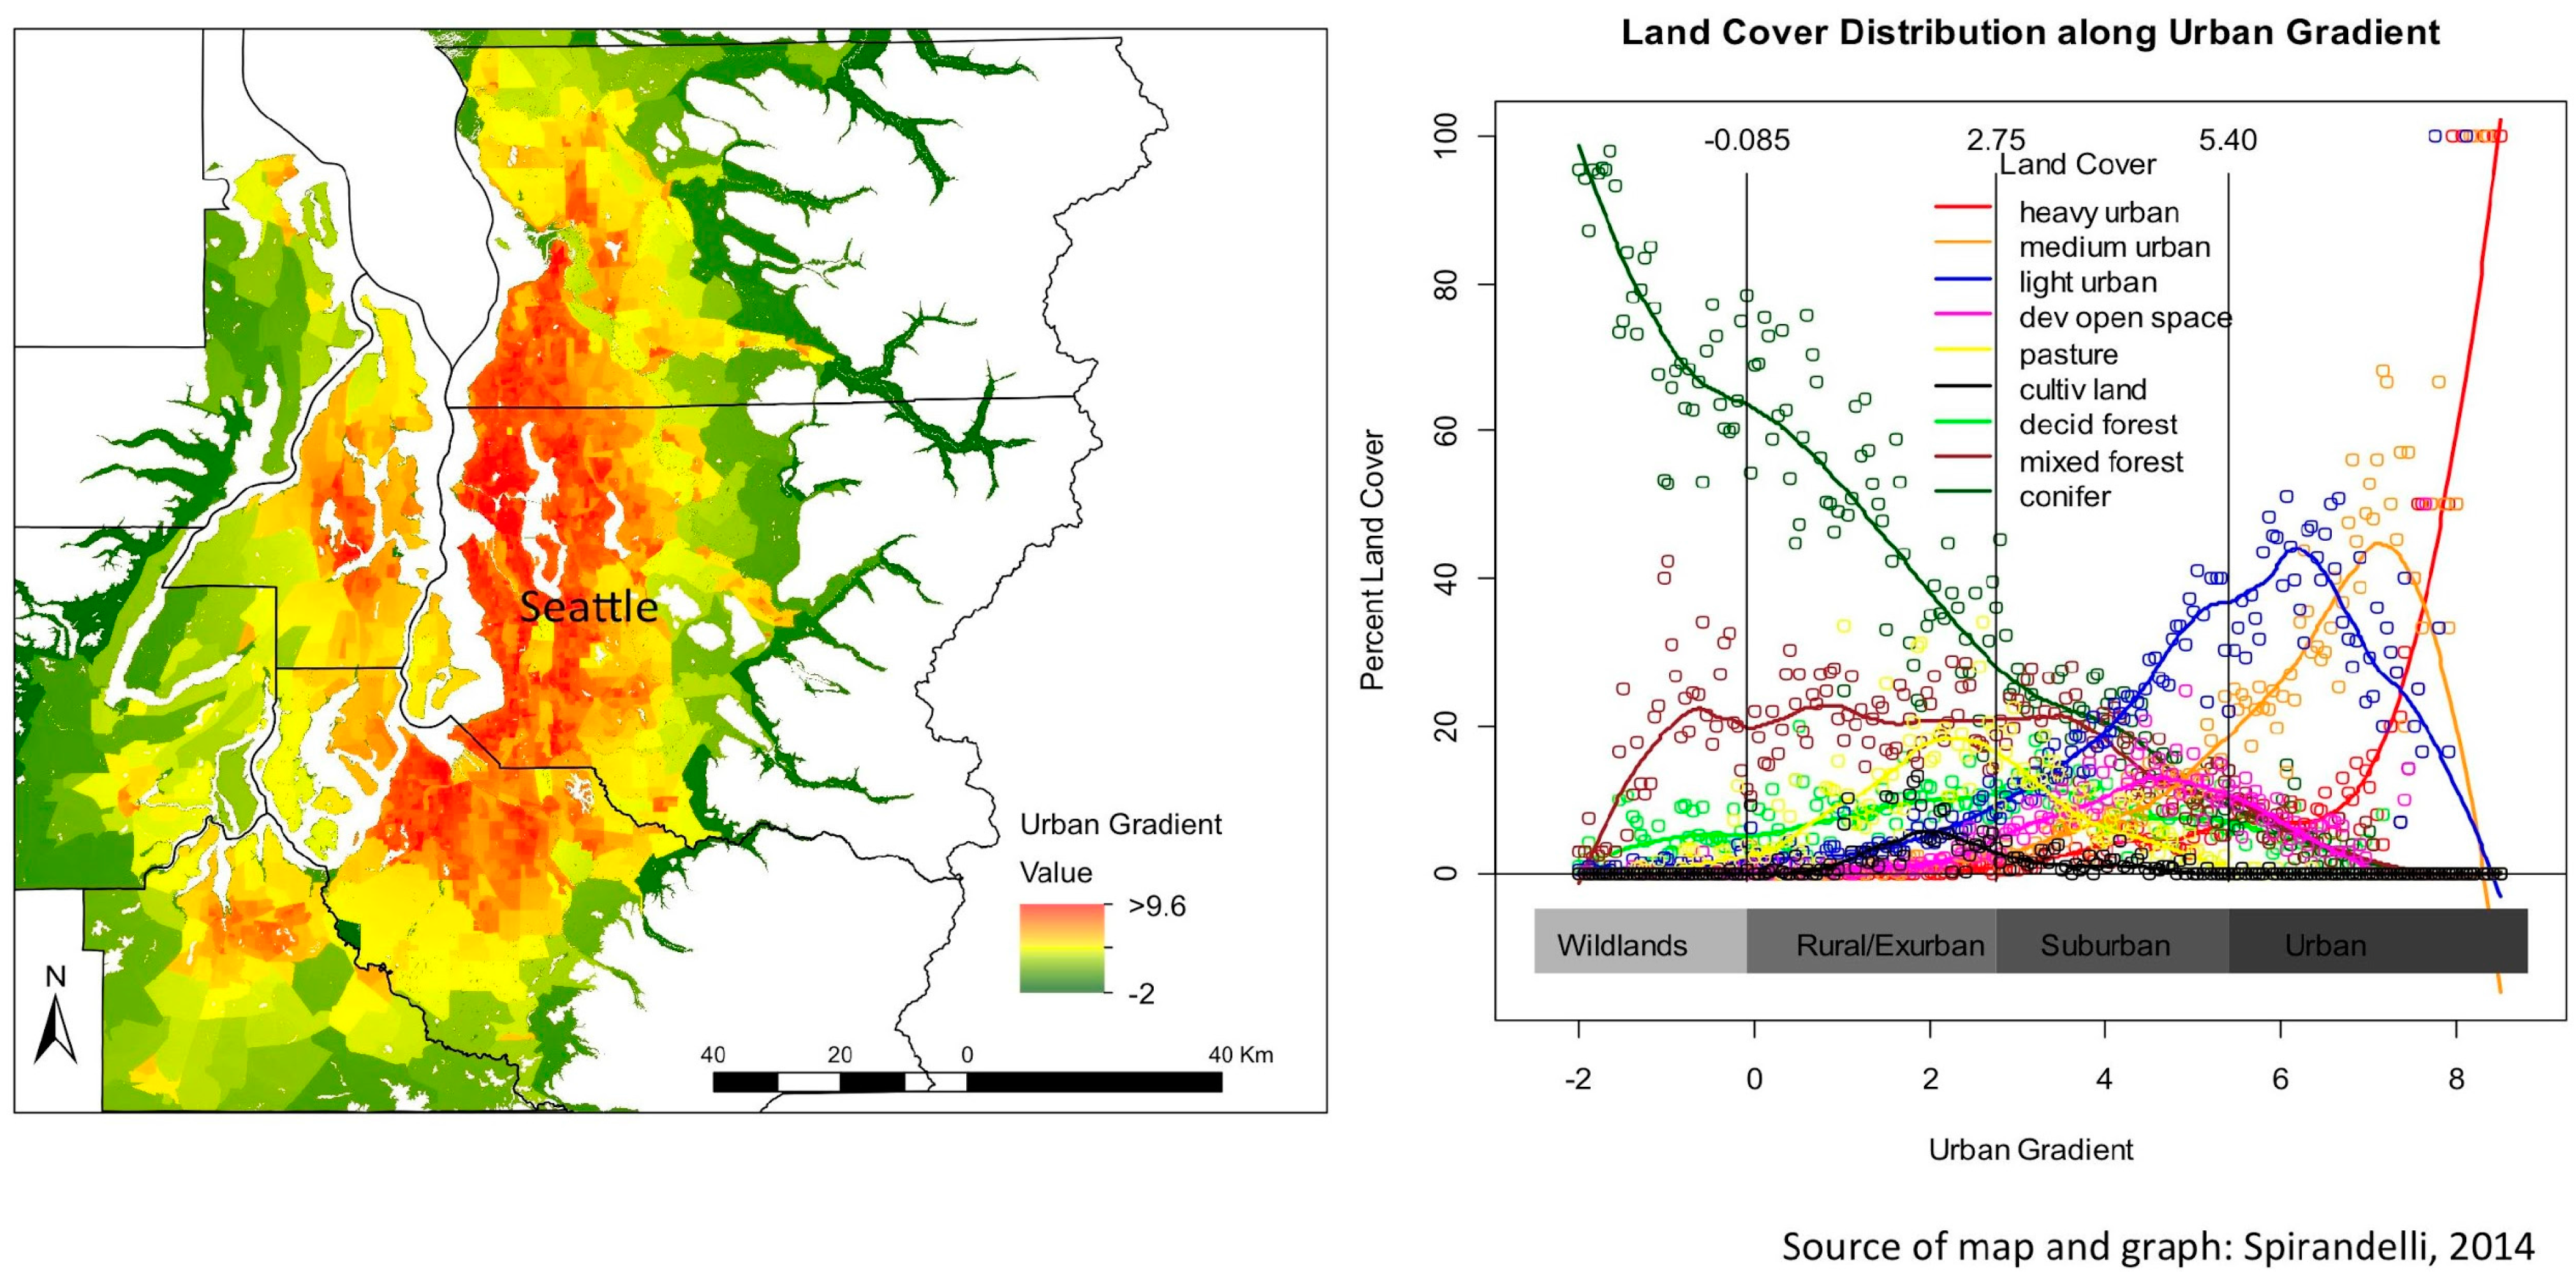
4.1. Coastal Watershed Patterns
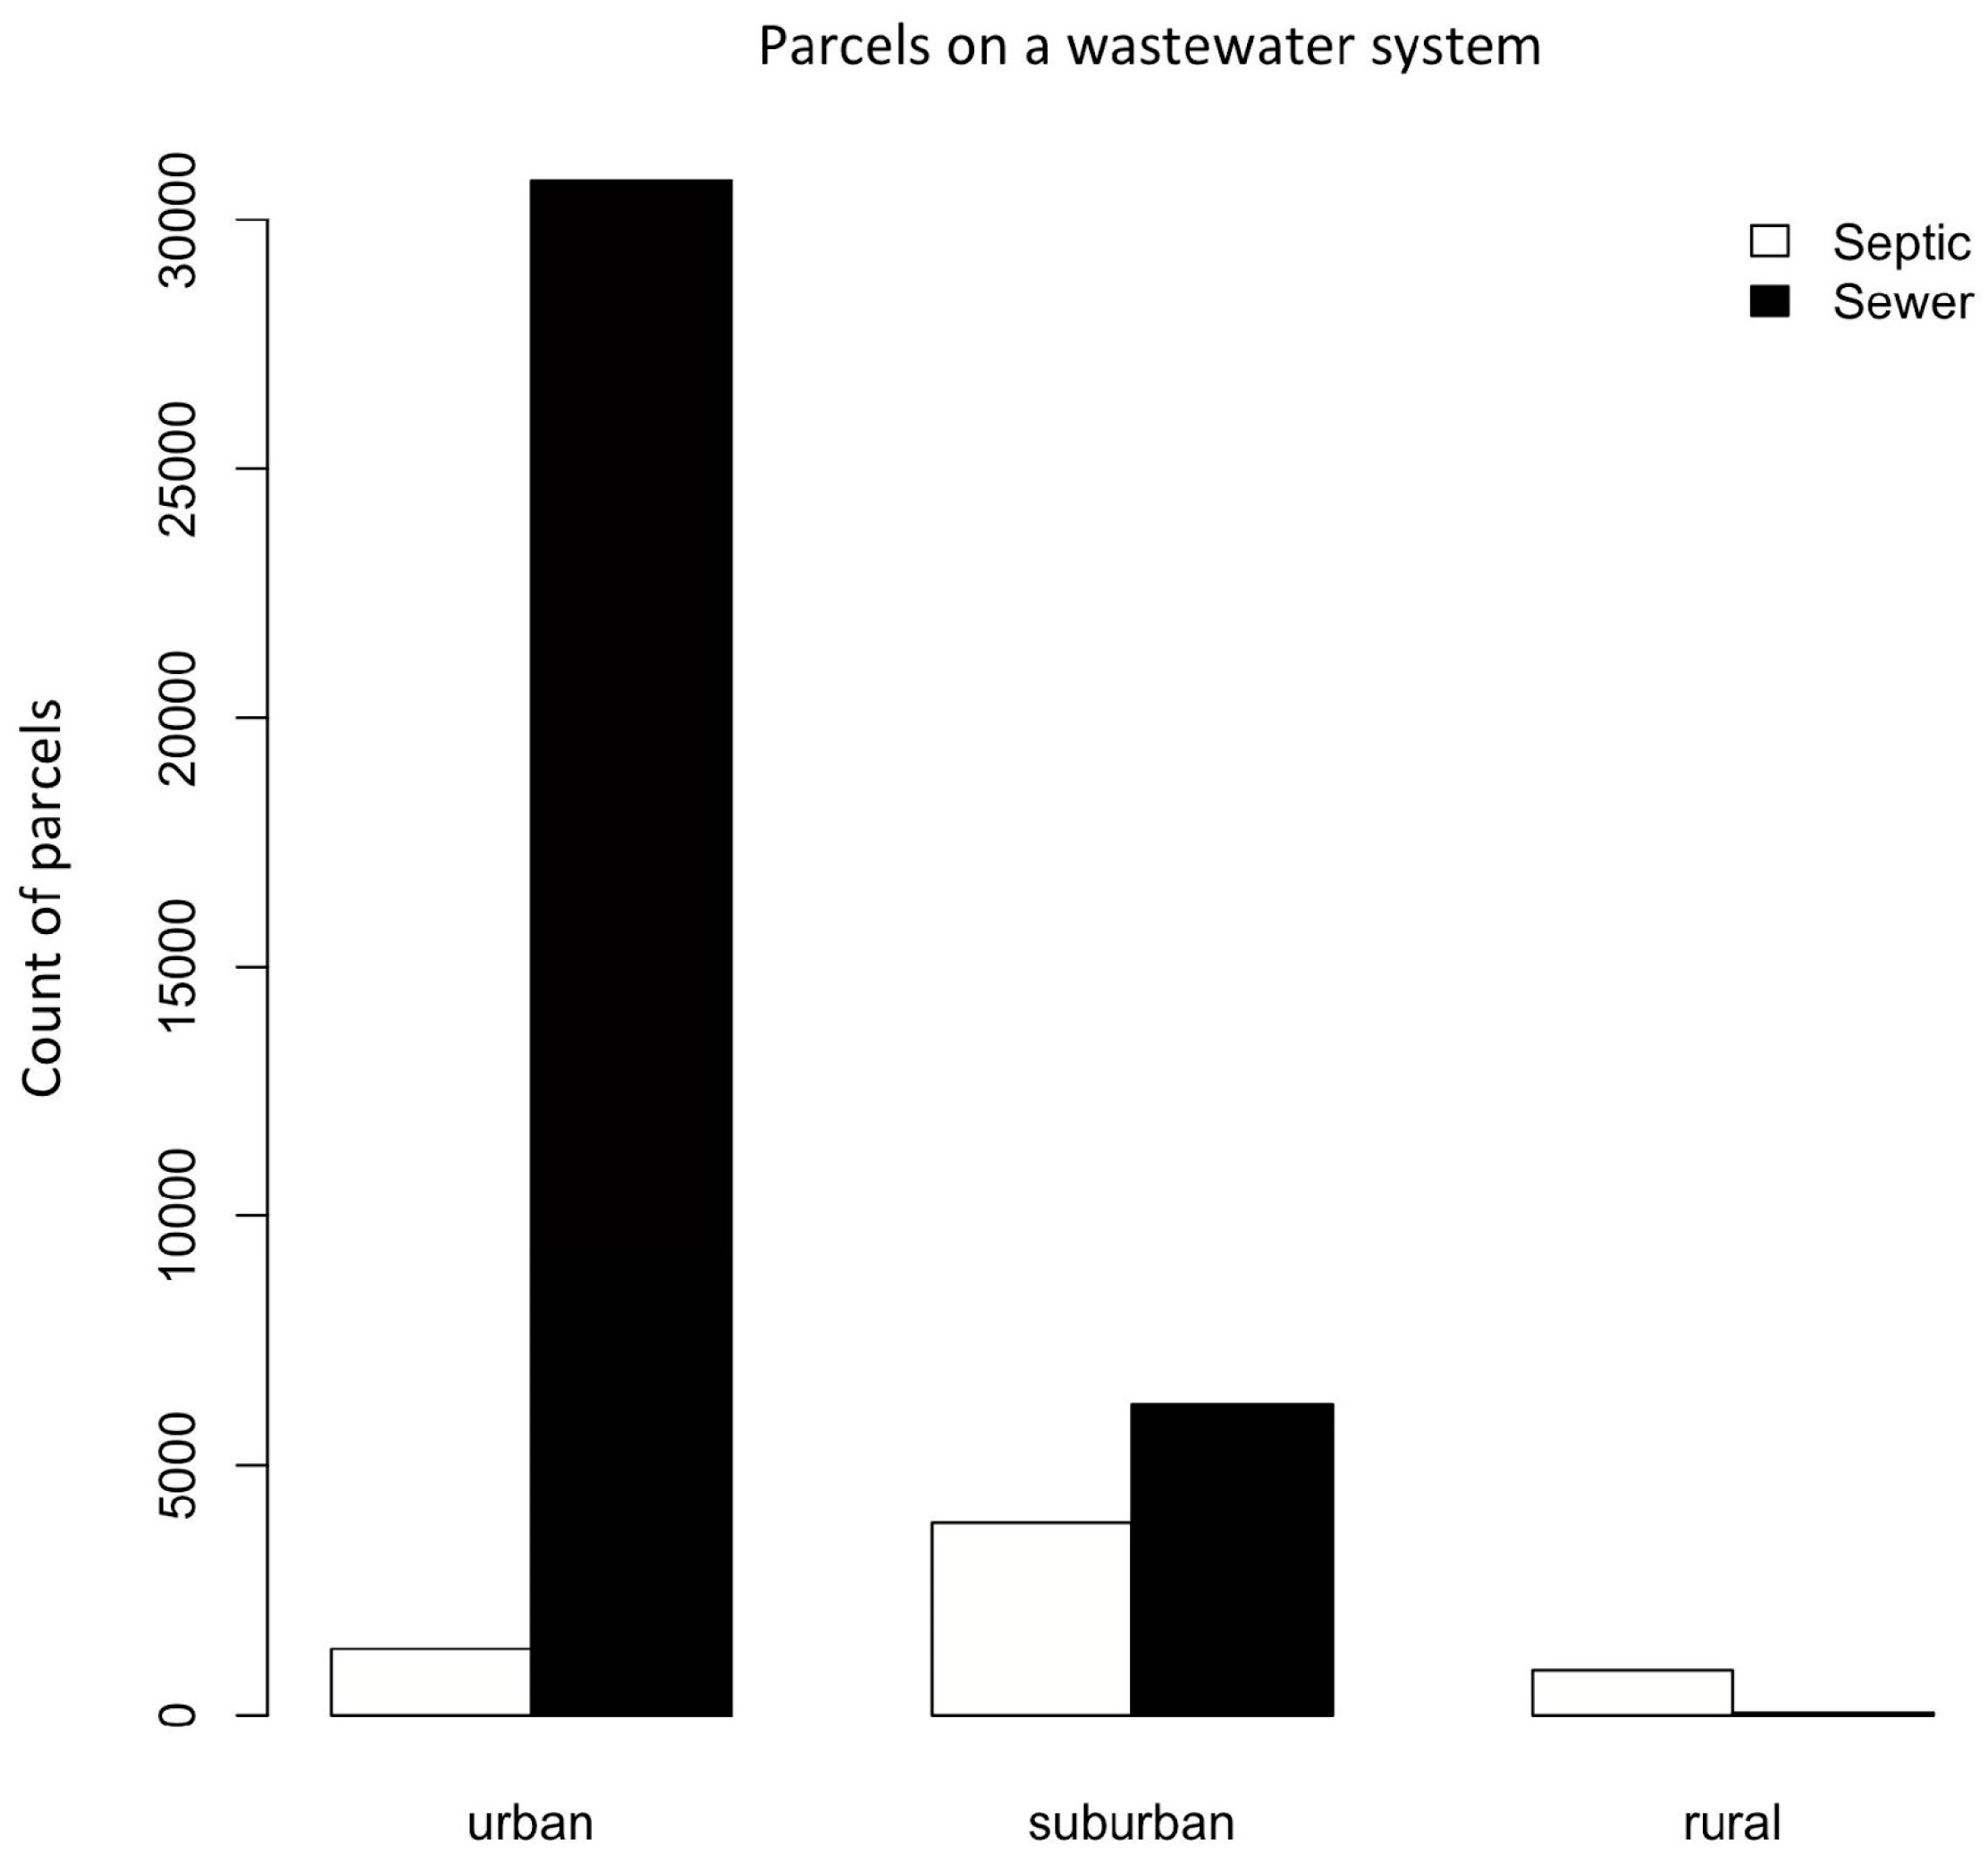
4.2. Wastewater Infrastructure Patterns

| Count of parcels | Urban | Suburban | Rural | Total (n) |
|---|---|---|---|---|
| Septic (n) Percent of total | 1323
(22%) | 3845
(63%) | 889
(14%) | 6057
(14%) |
| Sewer (n) Percent of total | 32,305
(85%) | 6220
(15%) | 47
(0.05%) | 38,572
(86%) |
| All parcels on wastewater (n) | 33,628 | 10,065 | 936 | 44,629 |
| Population count | Urban 1 | Suburban 2 | Rural 2 | Total |
| Population on septic | 3056
(21%) | 9497
(64%) | 2195
(15%) | 14,748
(14%) |
| Population on sewer | 74,624
(83%) | 15,363
(17%) | 116
(.001%) | 90,103
(86%) |
| Population using wastewater system | 77,680 | 24,860 | 2311 | 104,851 |
| Lot size (mean acre) | Urban | Suburban | Rural | |
| Septic | 0.5 ± 2.8 | 1.37 ± 3.07 | 2.8 ± 5.3 | |
| Sewer | 0.3 ± 1.21 | 0.32 ± 2.10 | 0.3 ± 0.2 | |
| All residential parcels | 0.32 ± 1.5 | 0.94 ± 4.22 | 4.07 ± 9.7 | |
| Septic density (units/km2) | Urban | Suburban | Rural | |
| Mean density | 26 ± 60 | 90 ± 103 | 18 ± 20 | |
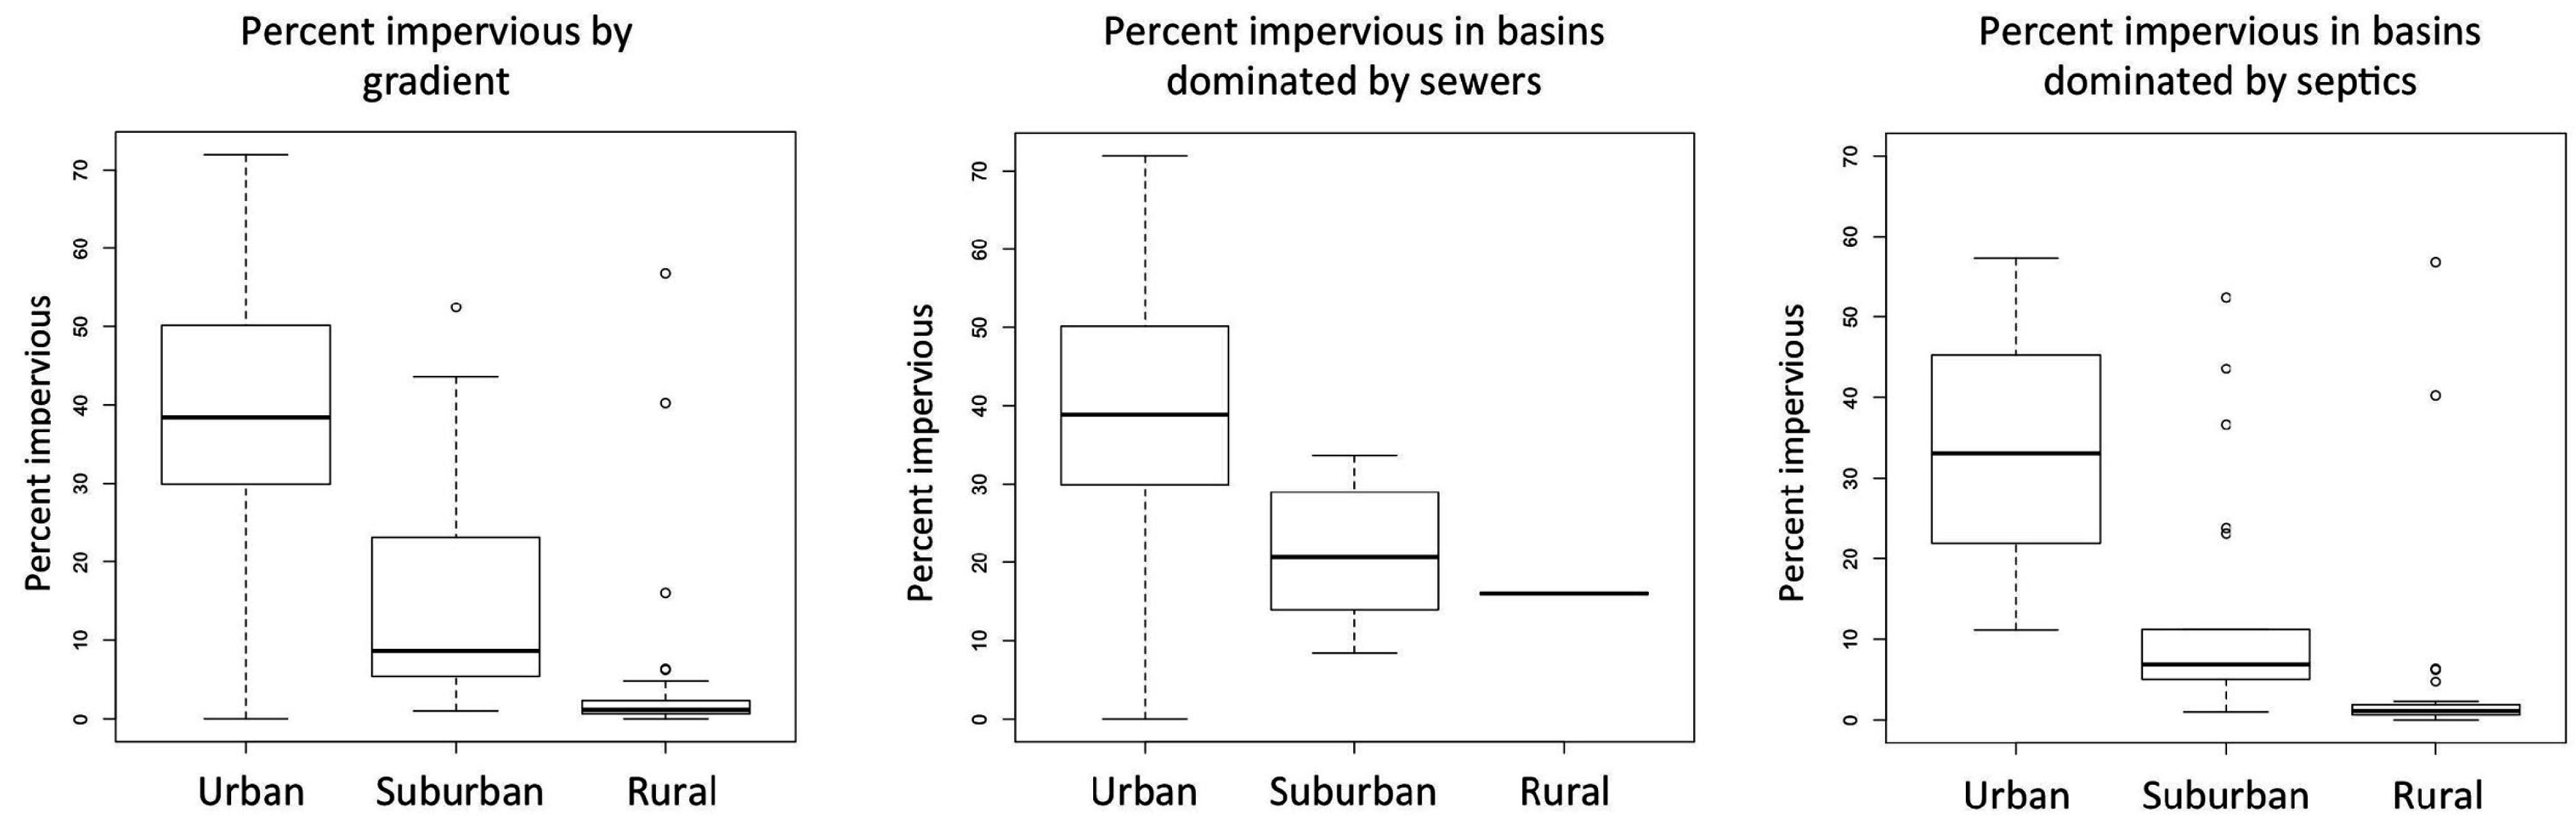
| Mean impervious (%) | Urban | Suburban | Rural | Mean % |
| Septic dominated | 8 ± 14 | |||
| Sewer dominated | 34.5 ± 16 | |||
| All watersheds | 38 ± 16 | 13 ± 16 | 5 ± 13 |

5. Discussion
5.1. Proportion and Density of Wastewater Treatment across an Urban Gradient
5.2. Lot Size of Parcels with Different Wastewater Treatment
5.3. Wastewater Treatment and Patterns of Imperviousness
6. Conclusions
Acknowledgments
Author Contributions
Conflicts of Interest
References and Notes
- Crosset, K.; Culliton, T.; Wiley, P.; Goodspeed, T. Population Trends along the Coastal United States: 1980–2008; Coastal Trends Report Series; NOAA’s National Ocean Service Management and Budget Office: Silver Spring, MD, USA, 2005. [Google Scholar]
- Small, C.; Nicholls, R.J. A global analysis of human settlement in Coastal Zones. J. Coast. Res. 2003, 19, 584–599. [Google Scholar]
- Islam, M.S.; Tanaka, M. Impacts of pollution on coastal and marine ecosystems including coastal and marine fisheries and approach for management: a review and synthesis. Mar. Pollut. Bull. 2004, 48, 624–649. [Google Scholar] [CrossRef] [PubMed]
- Burton, G.; Pitt, R. Manual for Evaluating Stormwater Runoff Effects in Receiving Waters; Lewis Publishers: Boca Raton, FL, USA, 2001. [Google Scholar]
- Arnold, C.L.; Gibbons, C.J. Impervious surface coverage. J. Am. Plan. Assoc. 1996, 62, 243–258. [Google Scholar] [CrossRef]
- Leopold, L. Hydrology for Urban Land Planning: A Guidebook on the Hydrologic Effects of Urban Land Use; U.S. Geolgoical Survey: Washington, DC, USA, 1968. [Google Scholar]
- Wear, S.L.; Thurber, R.V. Sewage pollution: mitigation is key for coral reef stewardship. Ann. N.Y. Acad. Sci. 2015, 1355, 15–30. [Google Scholar] [CrossRef] [PubMed]
- Halpern, B.S.; Walbridge, S.; Selkoe, K.A.; Kappel, C.V.; Micheli, F.; D’Agrosa, C.; Bruno, J.F.; Casey, K.S.; Ebert, C.; Fox, H.E.; et al. A global map of human impact on marine ecosystems. Science 2008, 319, 948–952. [Google Scholar] [CrossRef] [PubMed]
- Stewart, J.; Gast, R.; Fujioka, R.; Solo-Gabriele, H.; Meschke, J.S.; Amaral-Zettler, L.; del Castillo, E.; Polz, M.; Collier, T.; Strom, M.; et al. The coastal environment and human health: microbial indicators, pathogens, sentinels and reservoirs. Environ. Health 2008, 7 (Suppl. 2), S3. [Google Scholar] [CrossRef] [PubMed]
- Shuval, H. Estimating the global burden of thalassogenic diseases: human infectious diseases caused by wastewater pollution of the marine environment. J. Water Health 2003, 1, 53–64. [Google Scholar] [PubMed]
- Tchobanoglous, G.; Burton, F.L.; Stensel, H.D. Wastewater Engineering: Treatment and Reuse, 3rd ed.; Metcalf and Eddy Inc.: Boston, MA, USA, 2003. [Google Scholar]
- US EPA. Onsite Wastewater Treatment Systems Manual; EPA/625/R-00/008; Office of Water and Office of Research and Development: Washington, DC, USA, 2002. [Google Scholar]
- National Research Council (N.R.C.). Managing Wastewater in Coastal Urban Areas; National Academy Press: Washington, DC, USA, 1993. [Google Scholar]
- Mallin, M.A. Wading in waste. Sci. Am. 2006, 294, 52–59. [Google Scholar] [CrossRef] [PubMed]
- National Research Council. Clean Coastal Waters: Understanding and Reducing the Effects of Nutrient Pollution; National Academies Press: Washington, DC, USA, 2000. [Google Scholar]
- Carey, R.O.; Hochmuth, G.J.; Martinez, C.J.; Boyer, T.H.; Dukes, M.D.; Toor, G.S.; Cisar, J.L. Evaluating nutrient impacts in urban watersheds: Challenges and research opportunities. Environ. Pollut. 2013, 173, 138–149. [Google Scholar] [CrossRef] [PubMed]
- Hatt, B.; Fletcher, T.; Walsh, C.; Taylor, S.L. The influence of urban density and drainage infrastructure on the concentrations and loads of pollutants in small streams. Environ. Manag. 2004, 34, 112–124. [Google Scholar] [CrossRef] [PubMed]
- Lipp, E.K.; Kurz, R.; Vincent, R.; Rodriguez-Palacios, C.; Farrah, S.R.; Rose, J.B. The effects of seasonal variability and weather on fecal pollution and enteric pathogens in a subtropical estuary. Estuaries 2001, 24, 266–276. [Google Scholar] [CrossRef]
- Cahoon, L.B.; Hales, J.C.; Carey, E.S.; Loucaides, S.; Rowland, K.R.; Nearhoof, J.E. Shellfishing closures in southwest Brunswick County, North Carolina: Septic tanks vs. storm-water runoff as fecal coliform sources. J. Coast. Res. 2006, 222, 319–327. [Google Scholar] [CrossRef]
- Kelsey, H.; Porter, D.E.; Scott, G.; Neet, M.; White, D. Using geographic information systems and regression analysis to evaluate relationships between land use and fecal coliform bacterial pollution. J. Exp. Mar. Biol. Ecol. 2004, 298, 197–209. [Google Scholar] [CrossRef]
- Sowah, R.; Zhang, H.; Radcliffe, D.; Bauske, E.; Habteselassie, M.Y. Evaluating the influence of septic systems and watershed characteristics on stream faecal pollution in suburban watersheds in Georgia, USA. J. Appl. Microbiol. 2014, 117, 1500–1512. [Google Scholar] [CrossRef] [PubMed]
- Young, K.; Thackston, E. Housing density and bacterial loading in urban streams. J. Environ. Eng. 1999, 125, 1177. [Google Scholar] [CrossRef]
- Walsh, C. The urban stream syndrome: Current knowledge and the search for a cure. J. N. Am. Benthol. Soc. 2005, 24, 706. [Google Scholar] [CrossRef]
- McDonnell, M.; Hahs, A. The use of gradient analysis studies in advancing our understanding of the ecology of urbanizing landscapes: current status and future directions. Landsc. Ecol. 2008, 23, 1143–1155. [Google Scholar] [CrossRef]
- Luck, M.; Wu, J. A gradient analysis of urban landscape pattern: a case study from the Phoenix metropolitan region, Arizona, USA. Landsc. Ecol. 2002, 17, 327–339. [Google Scholar] [CrossRef]
- Alberti, M. The effects of urban patterns on ecosystem function. Int. Reg. Sci. Rev. 2005, 28, 168–192. [Google Scholar] [CrossRef]
- McDonnell, M.J.; Pickett, S.T.A. Ecosystem structure and function along urban-rural gradients: an unexploited opportunity for ecology. Ecology 1990, 71, 1232. [Google Scholar] [CrossRef]
- Alberti, M. Advances in Urban Ecology: Integrating Humans and Ecological Processes in Urban Ecosystems; Springer: New York, NY, USA, 2008. [Google Scholar]
- Pickett, S.; Cadenasso, M.; Grove, J.M.; Groffman, P.; Band, L.; Boone, C.; Burch, W.; Grimmond, S.; Hom, J.; Jenkins, J.; et al. Beyond urban legends: An emerging framework of urban ecology, as illustrated by the Baltimore Ecosystem Study. BioScience 2008, 58, 139. [Google Scholar] [CrossRef]
- Pickett, S.T.A.; Cadenasso, M.L.; Grove, J.M.; Nilon, C.H.; Pouyat, R.V.; Zipperer, W.C.; Costanza, R. Urban ecological systems: linking terrestrial ecological, physical, and socioeconomic components of metropolitan areas. Ann. Rev. Ecol. Syst. 2001, 32, 127–157. [Google Scholar] [CrossRef]
- Grimm, N.B.; Foster, D.; Groffman, P.; Grove, J.M.; Hopkinson, C.S.; Nadelhoffer, K.J.; Pataki, D.E.; Peters, D.P. The changing landscape: ecosystem responses to urbanization and pollution across climatic and societal gradients. Front. Ecol. Environ. 2008, 6, 264–272. [Google Scholar] [CrossRef]
- LaGro, J., Jr. Landscape context of rural residential development in southeastern Wisconsin (USA). Landsc. Ecol. 1998, 13, 65–77. [Google Scholar] [CrossRef]
- Walsh, C.J.; Papas, P.J.; Crowther, D.; Sim, P.T.; Yoo, J. Stormwater drainage pipes as a threat to a stream-dwelling amphipod of conservation significance, Austrogammarus australis, in southeastern Australia. Biodivers. Conserv. 2004, 13, 781–793. [Google Scholar] [CrossRef]
- Alberti, M.; Booth, D.; Hill, K.; Coburn, B.; Avolio, C.; Coe, S.; Spirandelli, D. The impact of urban patterns on aquatic ecosystems: An empirical analysis in Puget lowland sub-basins. Landsc. Urban Plan. 2007, 80, 345–361. [Google Scholar] [CrossRef]
- Curtis, K.J. Growth-liberating technology meets fragmented regulation: Decentralized wastewater systems in Wilson County, Tennessee. Geogr. Bull. 2008, 49, 3–17. [Google Scholar]
- Harrison, M.; Stanwyck, E.; Beckingham, B.; Starry, O.; Hanlon, B.; Newcomer, J. Smart growth and the septic tank: Wastewater treatment and growth management in the Baltimore region. Land Use Policy 2012, 29, 483–492. [Google Scholar] [CrossRef]
- Melosi, M.V. The Sanitary City: Urban Infrastructure in America from Colonial Times to the Present; Johns Hopkins University Press: Baltimore, MD, USA, 2000. [Google Scholar]
- Healey, P. Urban Complexity and Spatial Strategies: Towards a Relational Planning for our Times; Routledge: New York, NY, USA, 2007. [Google Scholar]
- Marsh, W.M. Landscape Planning: Environmental Applications, 5th ed.; Wiley: Hoboken, NJ, USA, 2010. [Google Scholar]
- Berke, P.R.; Godschalk, D.R.; Kaiser, E.J. Urban Land Use Planning; University of Illinois Press: Chicago, IL, USA, 2006. [Google Scholar]
- Popper, F.J. Unshaping growth: The potential land-use implications of the sand filter and related alternative wastewater treatment technologies. Am. Land Forum 1980, 2, 8–14. [Google Scholar]
- Jacobs, H.M.; Hanson, M.E. Land use impacts of private sewage systems in Wisconsin. J. Soil Water Conserv. 1989, 44, 149–152. [Google Scholar]
- Rome, A. The Bulldozer in the Countryside; Cambridge University Press: New York, NY, USA, 2001. [Google Scholar]
- Pendall, R.; Martin, J.; Fulton, W. Holding the Line - Urban Containment in the United States; Brookings Institute: Washington, DC, USA, 2002. [Google Scholar]
- Bengston, D.N.; Fletcher, J.O.; Nelson, K.C. Public policies for managing urban growth and protecting open space: policy instruments and lessons learned in the United States. Landsc. Urban Plan. 2004, 69, 271–286. [Google Scholar] [CrossRef]
- Growth Management Act. Revised Code of Washington (RCW), Title 36, Chapter 36.70A, 1990.
- Miles, M.; Berens, G.; Eppli, M.; Weiss, M. Real Estate Development: Principles and process, 4th ed.; Urban Land Institute: Washington, DC, USA, 2007. [Google Scholar]
- Real Estate Research Corporation. The Costs of Sprawl: Environmental and Economic Costs of Alternative Residential Development Patterns at the Urban Fringe: Prepared for the Council on Environmental Quality, the Office of Policy; U.S. Govt. Print. Off.: Washington, DC, USA, 1974. [Google Scholar]
- Windsor, D. A critique of the costs of sprawl. J. Am. Plan. Assoc. 1979, 45, 279–292. [Google Scholar] [CrossRef]
- Speir, C.; Stephenson, K. Does sprawl cost us all?: Isolating the effects of housing patterns on public water and sewer costs. J. Am. Plan. Assoc. 2002, 68, 56–70. [Google Scholar] [CrossRef]
- Burchell, R. Sprawl Costs: Economic Impacts of Unchecked Development; Island Press: Washington, DC, USA, 2005. [Google Scholar]
- Wastewater Management Plan; City of Olympia: Olympia, WA, USA, 2010.
- Balkema, A.J.; Preisig, H.A.; Otterpohl, R.; Lambert, F.J.D. Urban Water 2002, 4, 153–161.
- Spirandelli, D. Examining the Effects of Wastewater Infrastructure on Puget Sound Near-shore Water Quality Across a Gradient of Urbanization. Ph.D. Thesis, University of Washington, Seattle, WA, USA, 2014. [Google Scholar]
- Wu, J. Urban ecology and sustainability: The state-of-the-science and future directions. Landsc. Urban Plan. 2014, 125, 209–221. [Google Scholar] [CrossRef]
- McDonnell, M.; Pickett, S.; Groffman, P.; Bohlen, P.; Pouyat, R.; Zipperer, W.C.; Parmelee, R.; Carre, M. Ecosystem processes along an urban-to-rural gradient. Urban Ecosyst. 1997, 1, 21–36. [Google Scholar] [CrossRef]
- Kruckeberg, A. The Natural History of Puget Sound Country; Weyerhaeuser Environmental Books; University of Washington Press: Seattle, WA, USA, 1995. [Google Scholar]
- Plats - Subdivisions - Dedications. Revised Code of Washington (RCW), Title 58, Chapter 58.17, Section 010, 1974.
- Puget Sound Nearshore Ecosystem Restoration Project. PSNERP Change Analysis Geodatabase, Version 3.0, 2009. Available online: http://www.pugetsoundnearshore.org/index.html (accessed on 9 February 2009).
- National Oceanic and Atmospheric Administration. The Coastal Change Analysis Program regional land cover (C-CAP); National Oceanic and Atmospheric Administration: Silver Springs, MD, USA, 2006. Available online: https://coast.noaa.gov/dataregistry/search/collection/info/ccapregional (accessed on 9 February 2009).
- United States Department of Agriculture. National Agricultural Imagery Program, National Agriculture Statistics Service, 2006. Available online: http://rocky2.ess.washington.edu/data/raster/naip2006/index.html (accessed on 10 January 2010).
- Cochran, W. Sampling Techniques, 3rd ed.; John Wiley & Sons: New York, NY, USA, 1977. [Google Scholar]
- Rogers, L.; Cooke, A.; McLaughlin, M. The Washington State Parcel Database, Version 2009n, Edition 9.2, Release 1.1. 2010. [Google Scholar]
- Silverman, B.W. Density Estimation for Statistics and Data Analysis; Monographs on Statistics and Applied Probability, Chapman and Hall: London, UK, 1986. [Google Scholar]
- Brabec, E.; Schulte, S.; Richards, P. Impervious surfaces and water quality: A review of current literature and its implications for watershed planning. J. Plan. Lit. 2002, 16, 499–514. [Google Scholar] [CrossRef]
- Wollheim, W.; Pellerin, B.; Vorosmarty, C.; Hopkins, C. N Retention in Urbanizing Headwater Catchments. Ecosystems. 2005, 8, 871–884. [Google Scholar] [CrossRef]
- Groffman, P.M.; Law, N.L.; Belt, K.T.; Band, L.E.; Fisher, G.T. Nitrogen Fluxes and Retention in Urban Watershed Ecosystems. Ecosystems 2004, 7, 393–403. [Google Scholar] [CrossRef]
- Paul, M.; Meyer, J.L. Streams in the urban landscape. Ann. Rev. Ecol. Syst. 2001, 32, 333. [Google Scholar] [CrossRef]
- Heimlich, R.; Anderson, W. Development at the Urban Fringe and Beyond: Impacts on Agriculture and Rural Land; Agricultural Economic Report 803; U.S. Department of Agriculture: Economic Research Station, 2001. [Google Scholar]
- Hepinstall-Cymerman, J.; Coe, S.; Hutyra, L.R. Urban growth patterns and growth management boundaries in the Central Puget Sound, Washington, 1986–2007. Urban Ecosyst. 2013, 16, 109–129. [Google Scholar] [CrossRef]
- Kim, J.; Zhou, X. Landscape structure, zoning ordinance, and topography in hillside residential neighborhoods: A case study of Morgantown, WV. Landsc. Urban Plan. 2012, 108, 28–38. [Google Scholar] [CrossRef]
- Mallin, M.; Johnson, V.; Ensign, S. Comparative impacts of stormwater runoff on water quality of an urban, a suburban, and a rural stream. Environ. Monit. Assess. 2008, 159, 475–491. [Google Scholar] [CrossRef] [PubMed]
- Holland, A.F.; Sanger, D.M.; Gawle, C.P.; Lerberg, S.B.; Santiago, M.S.; Riekerk, G.H.; Zimmerman, L.E.; Scott, G.I. Linkages between tidal creek ecosystems and the landscape and demographic attributes of their watersheds. J. Exp. Mar. Biol. Ecol. 2004, 298, 151–178. [Google Scholar] [CrossRef]
- Newburn, D.; Berck, P. Exurban development. J. Environ. Econ. Manag. 2011, 62, 323–336. [Google Scholar] [CrossRef]
© 2015 by the author; licensee MDPI, Basel, Switzerland. This article is an open access article distributed under the terms and conditions of the Creative Commons Attribution license (http://creativecommons.org/licenses/by/4.0/).
Share and Cite
Spirandelli, D. Patterns of Wastewater Infrastructure along a Gradient of Coastal Urbanization: A Study of the Puget Sound Region. Land 2015, 4, 1090-1109. https://doi.org/10.3390/land4041090
Spirandelli D. Patterns of Wastewater Infrastructure along a Gradient of Coastal Urbanization: A Study of the Puget Sound Region. Land. 2015; 4(4):1090-1109. https://doi.org/10.3390/land4041090
Chicago/Turabian StyleSpirandelli, Daniele. 2015. "Patterns of Wastewater Infrastructure along a Gradient of Coastal Urbanization: A Study of the Puget Sound Region" Land 4, no. 4: 1090-1109. https://doi.org/10.3390/land4041090
APA StyleSpirandelli, D. (2015). Patterns of Wastewater Infrastructure along a Gradient of Coastal Urbanization: A Study of the Puget Sound Region. Land, 4(4), 1090-1109. https://doi.org/10.3390/land4041090