Article

Assessing Site Availability of Aspen and Northern Hardwoods for Potential Feedstock Development in Michigan: A Case Study

*
Author to whom correspondence should be addressed.
School of Forest Resources and Environmental Science, Michigan Technological University, 1400 Townsend Drive, Houghton, MI 49931, USA
Land 2015, 4(2), 413-435; https://doi.org/10.3390/land4020413
Submission received: 2 February 2015 / Accepted: 6 May 2015 / Published: 14 May 2015

Abstract

:
The importance of wood and wood byproducts as biomass feedstocks is of increasing interest as a source of ethanol and electricity. Second generation woody feedstock sources in Michigan, e.g., hybrid poplar and hybrid willow (Populus spp.), and native forests, particularly aspen and northern hardwoods, are a potential source of woody biomass for these uses. This study provides a geographic information system (GIS) framework for assessing the current spatial extent of aspen and northern hardwoods) and their proximity to roads. Additionally, the potential for expanding the area of these feedstock sources based on pre-European settlement vegetation cover is assessed. Utilizing GIS technology to compile, edit and analyze available geospatial data (e.g., present day and pre-European settlement land use/cover, soils, road infrastructure, and land ownership) for counties located in the eastern half of the Upper Peninsula and northern half of the Lower Peninsula of Michigan provides a robust framework for various management scenarios to be evaluated in a cost effective manner and foster better decision making.

Graphical Abstract

1. Introduction

Producing sufficient energy and transitioning to non-fossil fuel energy sources is of growing concern, given issues of energy security and global climate change. Current global energy consumption is dominated by fossil fuels (oil, gas, and coal). Nonrenewable energy resources are believed to be limited [1], and some predict world oil production will peak around 2030 if the current global energy portfolio holds into the future [2,3,4]. Hence, new policies and incentives to develop sustainable energy sources and increase their utilization are under development [5]. Interestingly, high oil production forecasts by the International Energy Agency (IEA), the United States’ Energy Information Administration (EIA), and the Organization of Petroleum Exporting Countries (OPEC) suggest that peak oil production is not a serious threat [4]. However, energy security is increasingly an overarching concern since major oil production occurs in many countries experiencing political instability. Therefore, to improve energy security, the world needs to spend time and financial resources to diversify the global energy portfolio. However, global energy transition will be challenging since industrial and economic processes depend highly on fossil fuels and their byproducts.
In addition, developing renewable energy resources is important due to global climate change. There is extensive evidence that the world is becoming warmer [6]. Since fossil fuels have large carbon footprints, it is critical for global energy policies to focus on lower carbon footprint energy sources such as solar, wind, hydropower, and biofuels. Biofuels are viewed by many as a viable renewable energy source which can be used in the primary energy mix, particularly in the transportation fuel and electricity generation sectors [7,8]. Thorough investigations into the potential of replacing fossil fuels with biofuels are needed before substantial changes in energy policies can occur [9].
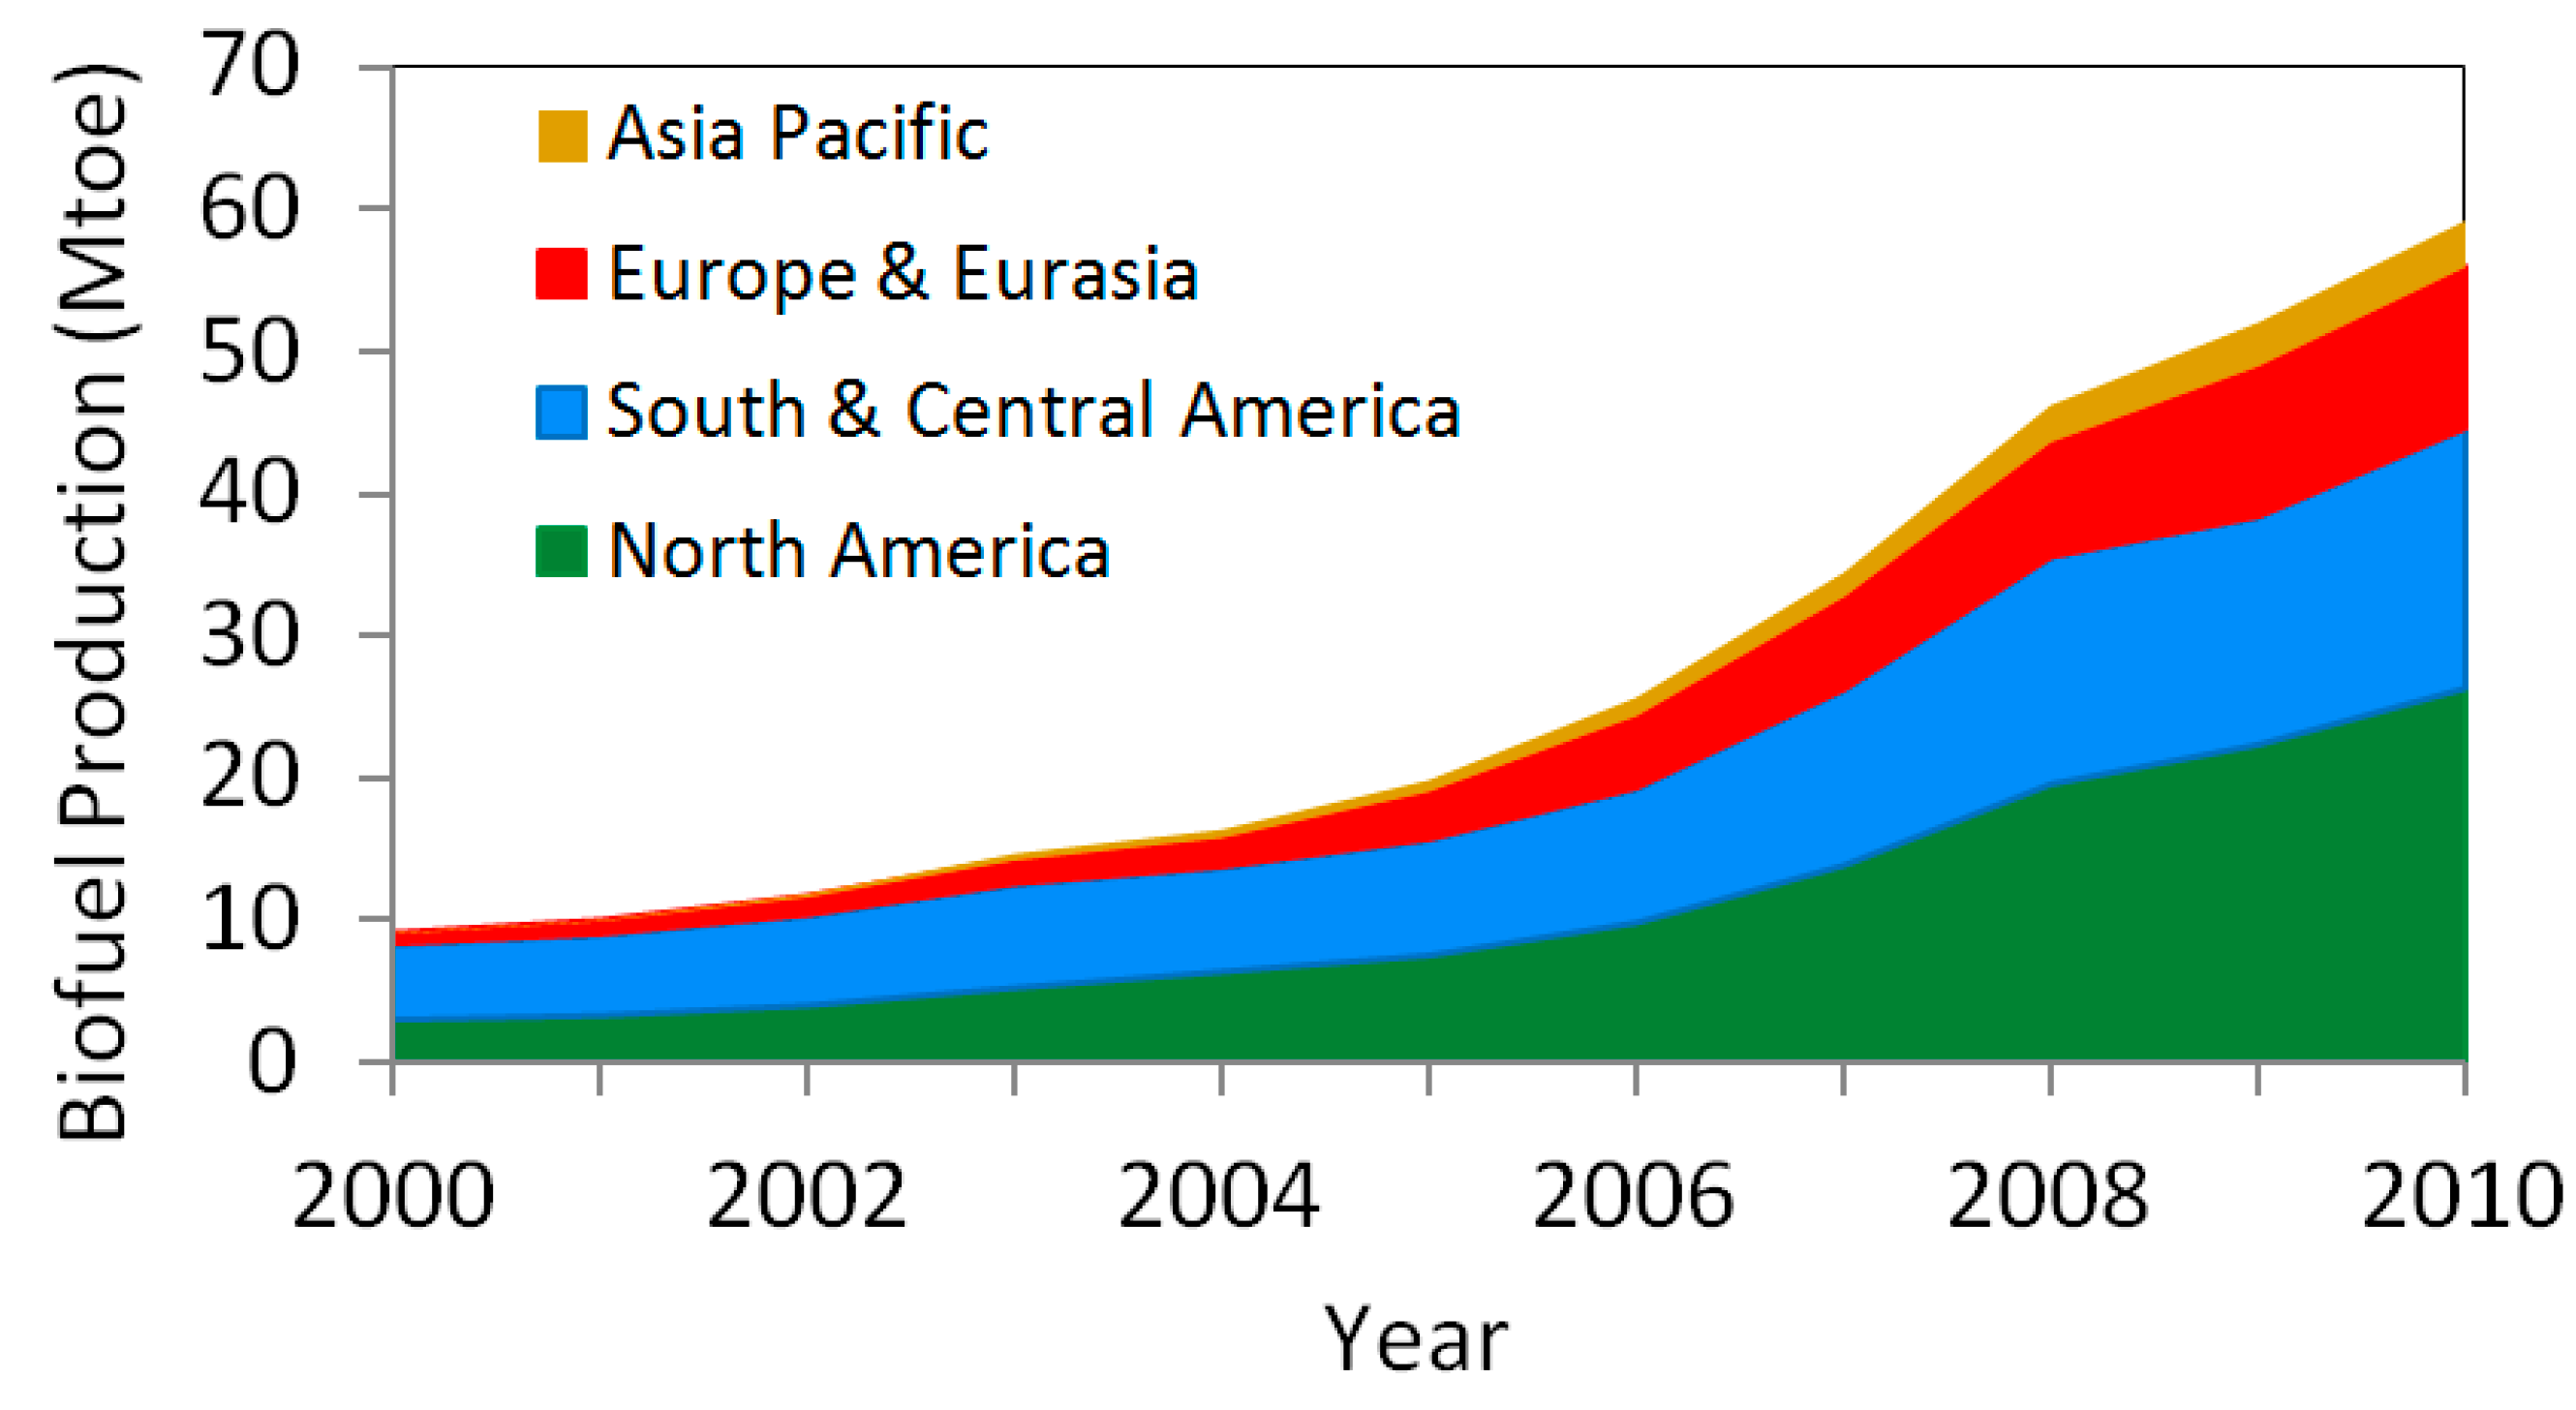
The use of transportation fuels derived from biomass has been projected to increase by more than 400% by 2035 [10]. Energy production from biofuels doubled between 2000 and 2005, and further increased up to six times between 2005 and 2010 (Figure 1). North, South and Central America are the major producers of biofuels. Proponents of biofuels attribute a number of benefits to this energy source including low greenhouse gas (GHG) emissions, improving local energy security and trade balances, and creating opportunities for socio-economic development in rural areas. However, a key factor constraining the use of biomass for energy production is resource availability and sustainability [1]. Furthermore, the choice of feedstock species grown and harvested will determine biomass yield, which is critical for the long term economic viability of production facilities [11]. As a result of these concerns, present and future amounts of local and regional woody feedstock availability need to be better understood before biofuels’ share in the energy portfolio can be projected realistically.
From a historical standpoint, most countries relied heavily on woody biomass to meet their energy needs. In the United States in 1880, almost 60% of energy came from wood. However by the mid-19th century, fossil fuels replaced woody biomass due to their high energy intensity, and ease of transportation and use [12]. Recent biofuels research findings are setting the stage for reintroduction of woody biomass as a key energy source. For example, Bartle and Abadi [3] demonstrated the superiority of second generation feedstocks (woody crops) to first generation feedstocks (sugar, starch and vegetable oils) by illustrating their lower effective cost, sustainability and environmental impacts. Furthermore, first generation biofuel feedstocks are also used as food crops, creating potential competition between uses [9]. Wood chips are likely a better resource of ethanol as compared with other green resources such as corn, sugarcane, soy, etc. because of a lower GHG footprint [5].
Figure 1. Biofuel production between 2000 and 2010 (Source of data: BP [13]).
Land 04 00413 g001
Over the last 35 years, major changes in energy policy and economy have led the energy market to use wood energy as a competitor with traditional coal-fired and natural gas electricity generation. Applying a life cycle analysis to compare carbon emission of wood pellet firing and coal generating stations in Ontario, Canada, Zhang et al. [14] found that carbon emissions of coal generating stations are more than 10× greater than that of wood pellet firing plants. However, large scale net carbon emission reductions for generating power from wood residues may be achievable only in the long run rather than short term [15].
In the United States, a sustainable supply of biomass for biofuel production is strategically important because biomass is currently the only renewable source of liquid transportation fuels. About one-third of the United States’ current transportation fuel could be produced from 1366 million dry tons of biomass [16]. Forestlands cover about one-third of the United States (approximately 303 million ha), of which two-thirds is timberland with private (58%) or industrial (13%) ownership. About 10% of the forestland is used for non-timber uses and another 23% is classified as low productivity areas [
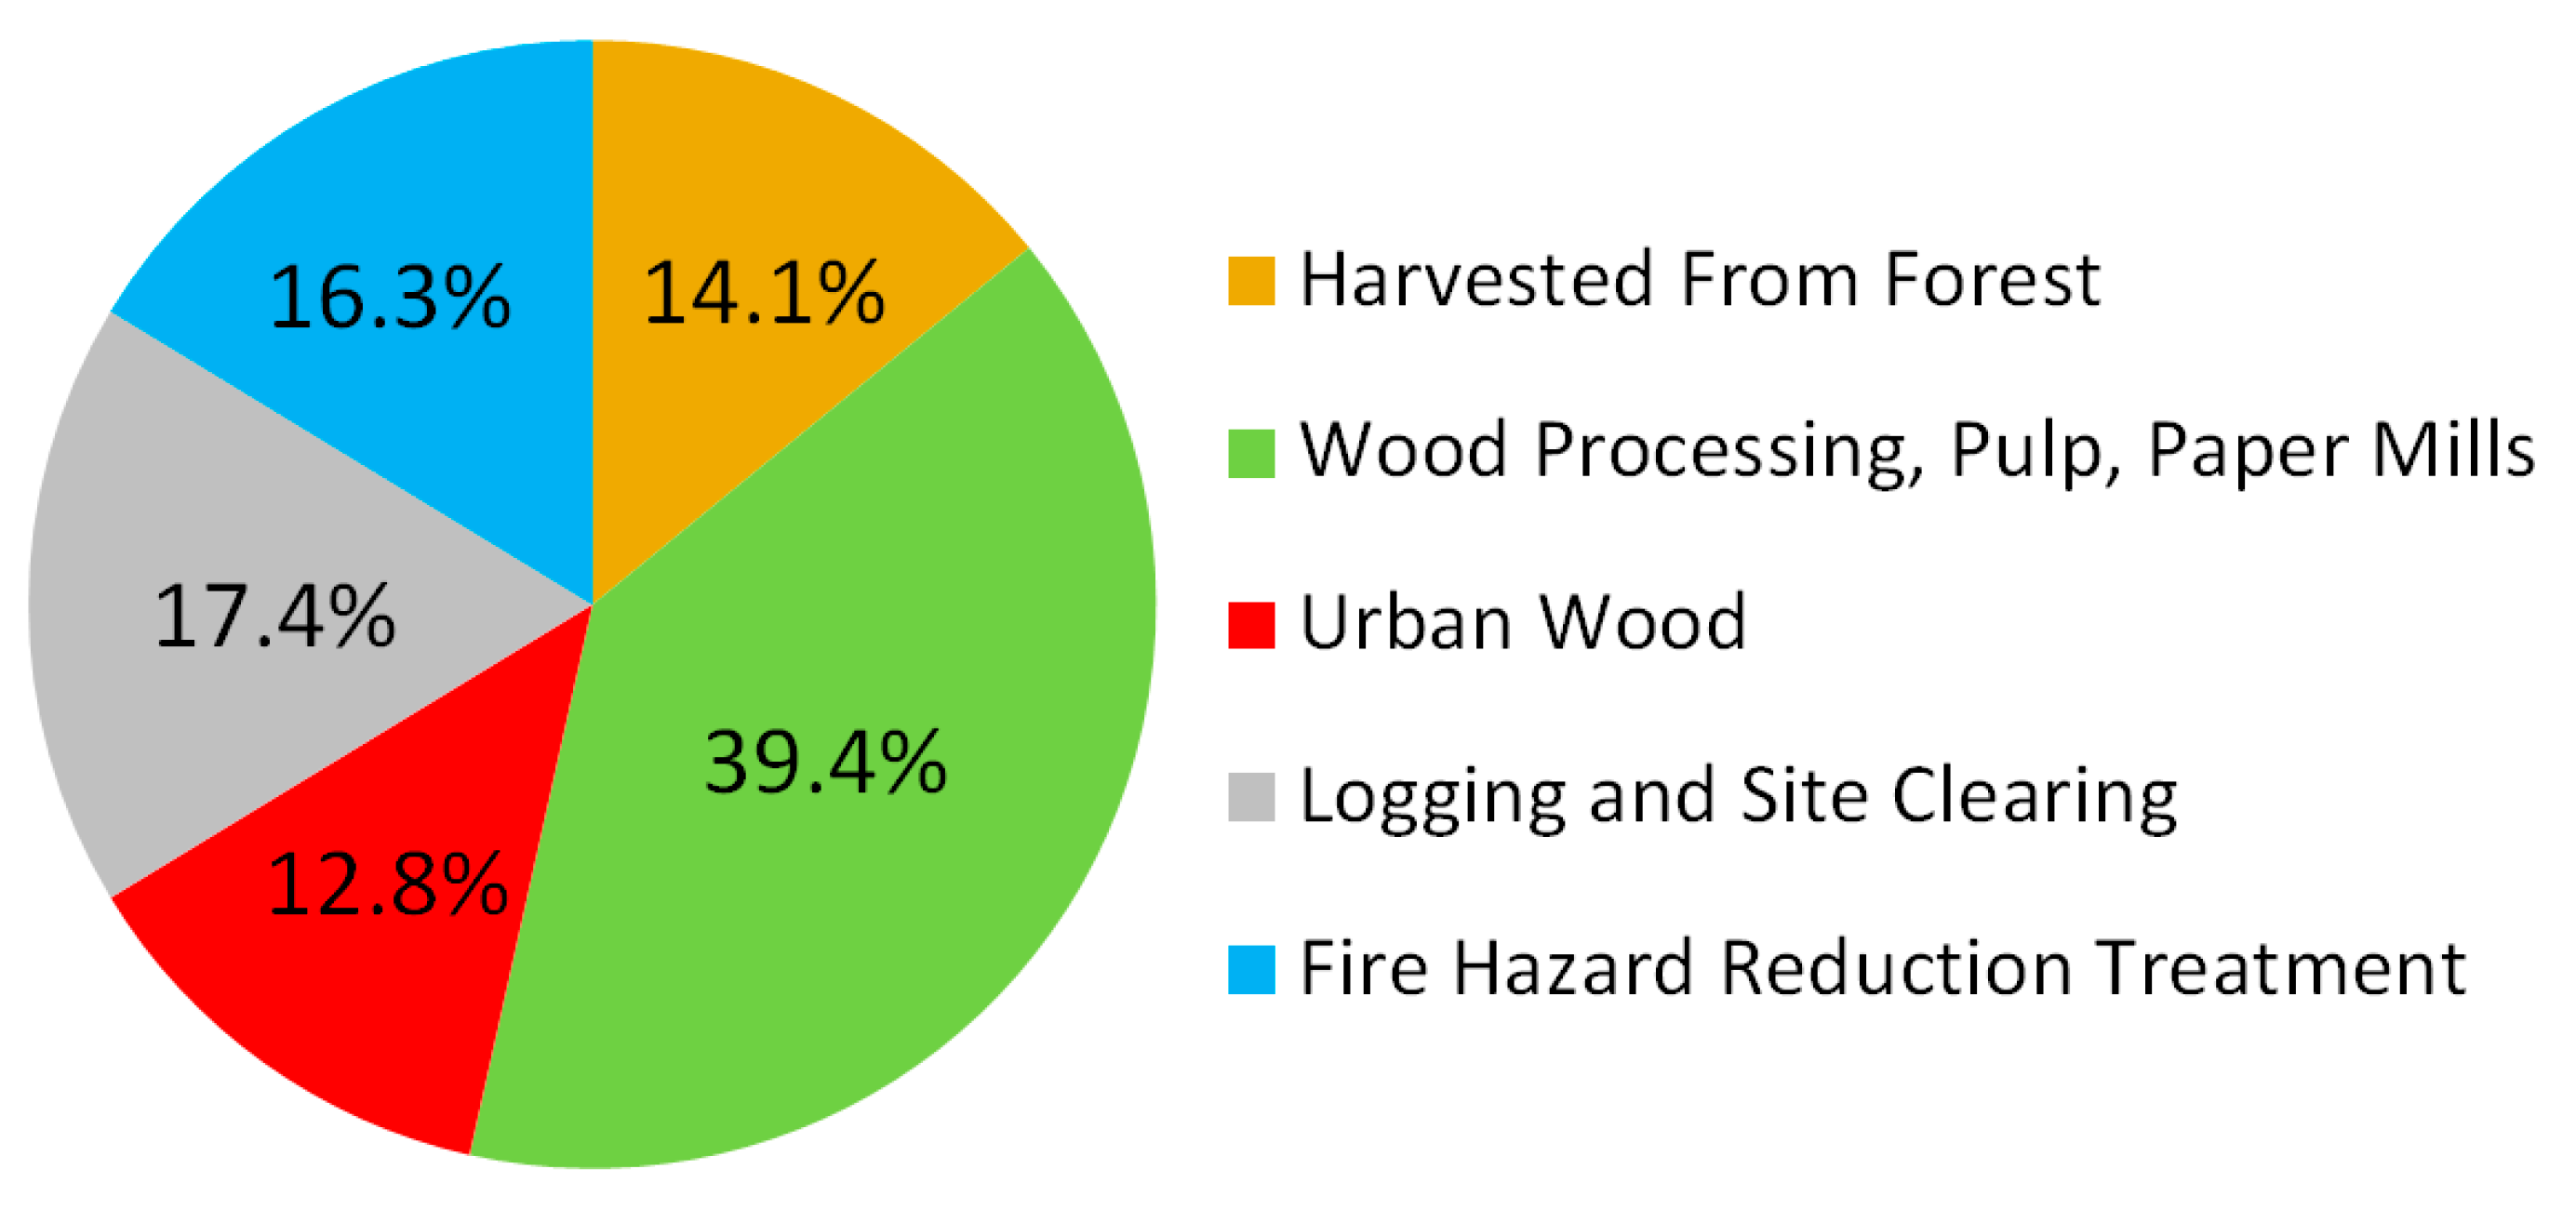
17]. The United States has the potential to meet about 30% of its transportation fuel demand from various biomass sources (Figure 2), including residues from wood processing mills, pulp and paper mills, urban wood, logging residues, site clearing operations, and fuel treatment operations to reduce fire hazards [16].
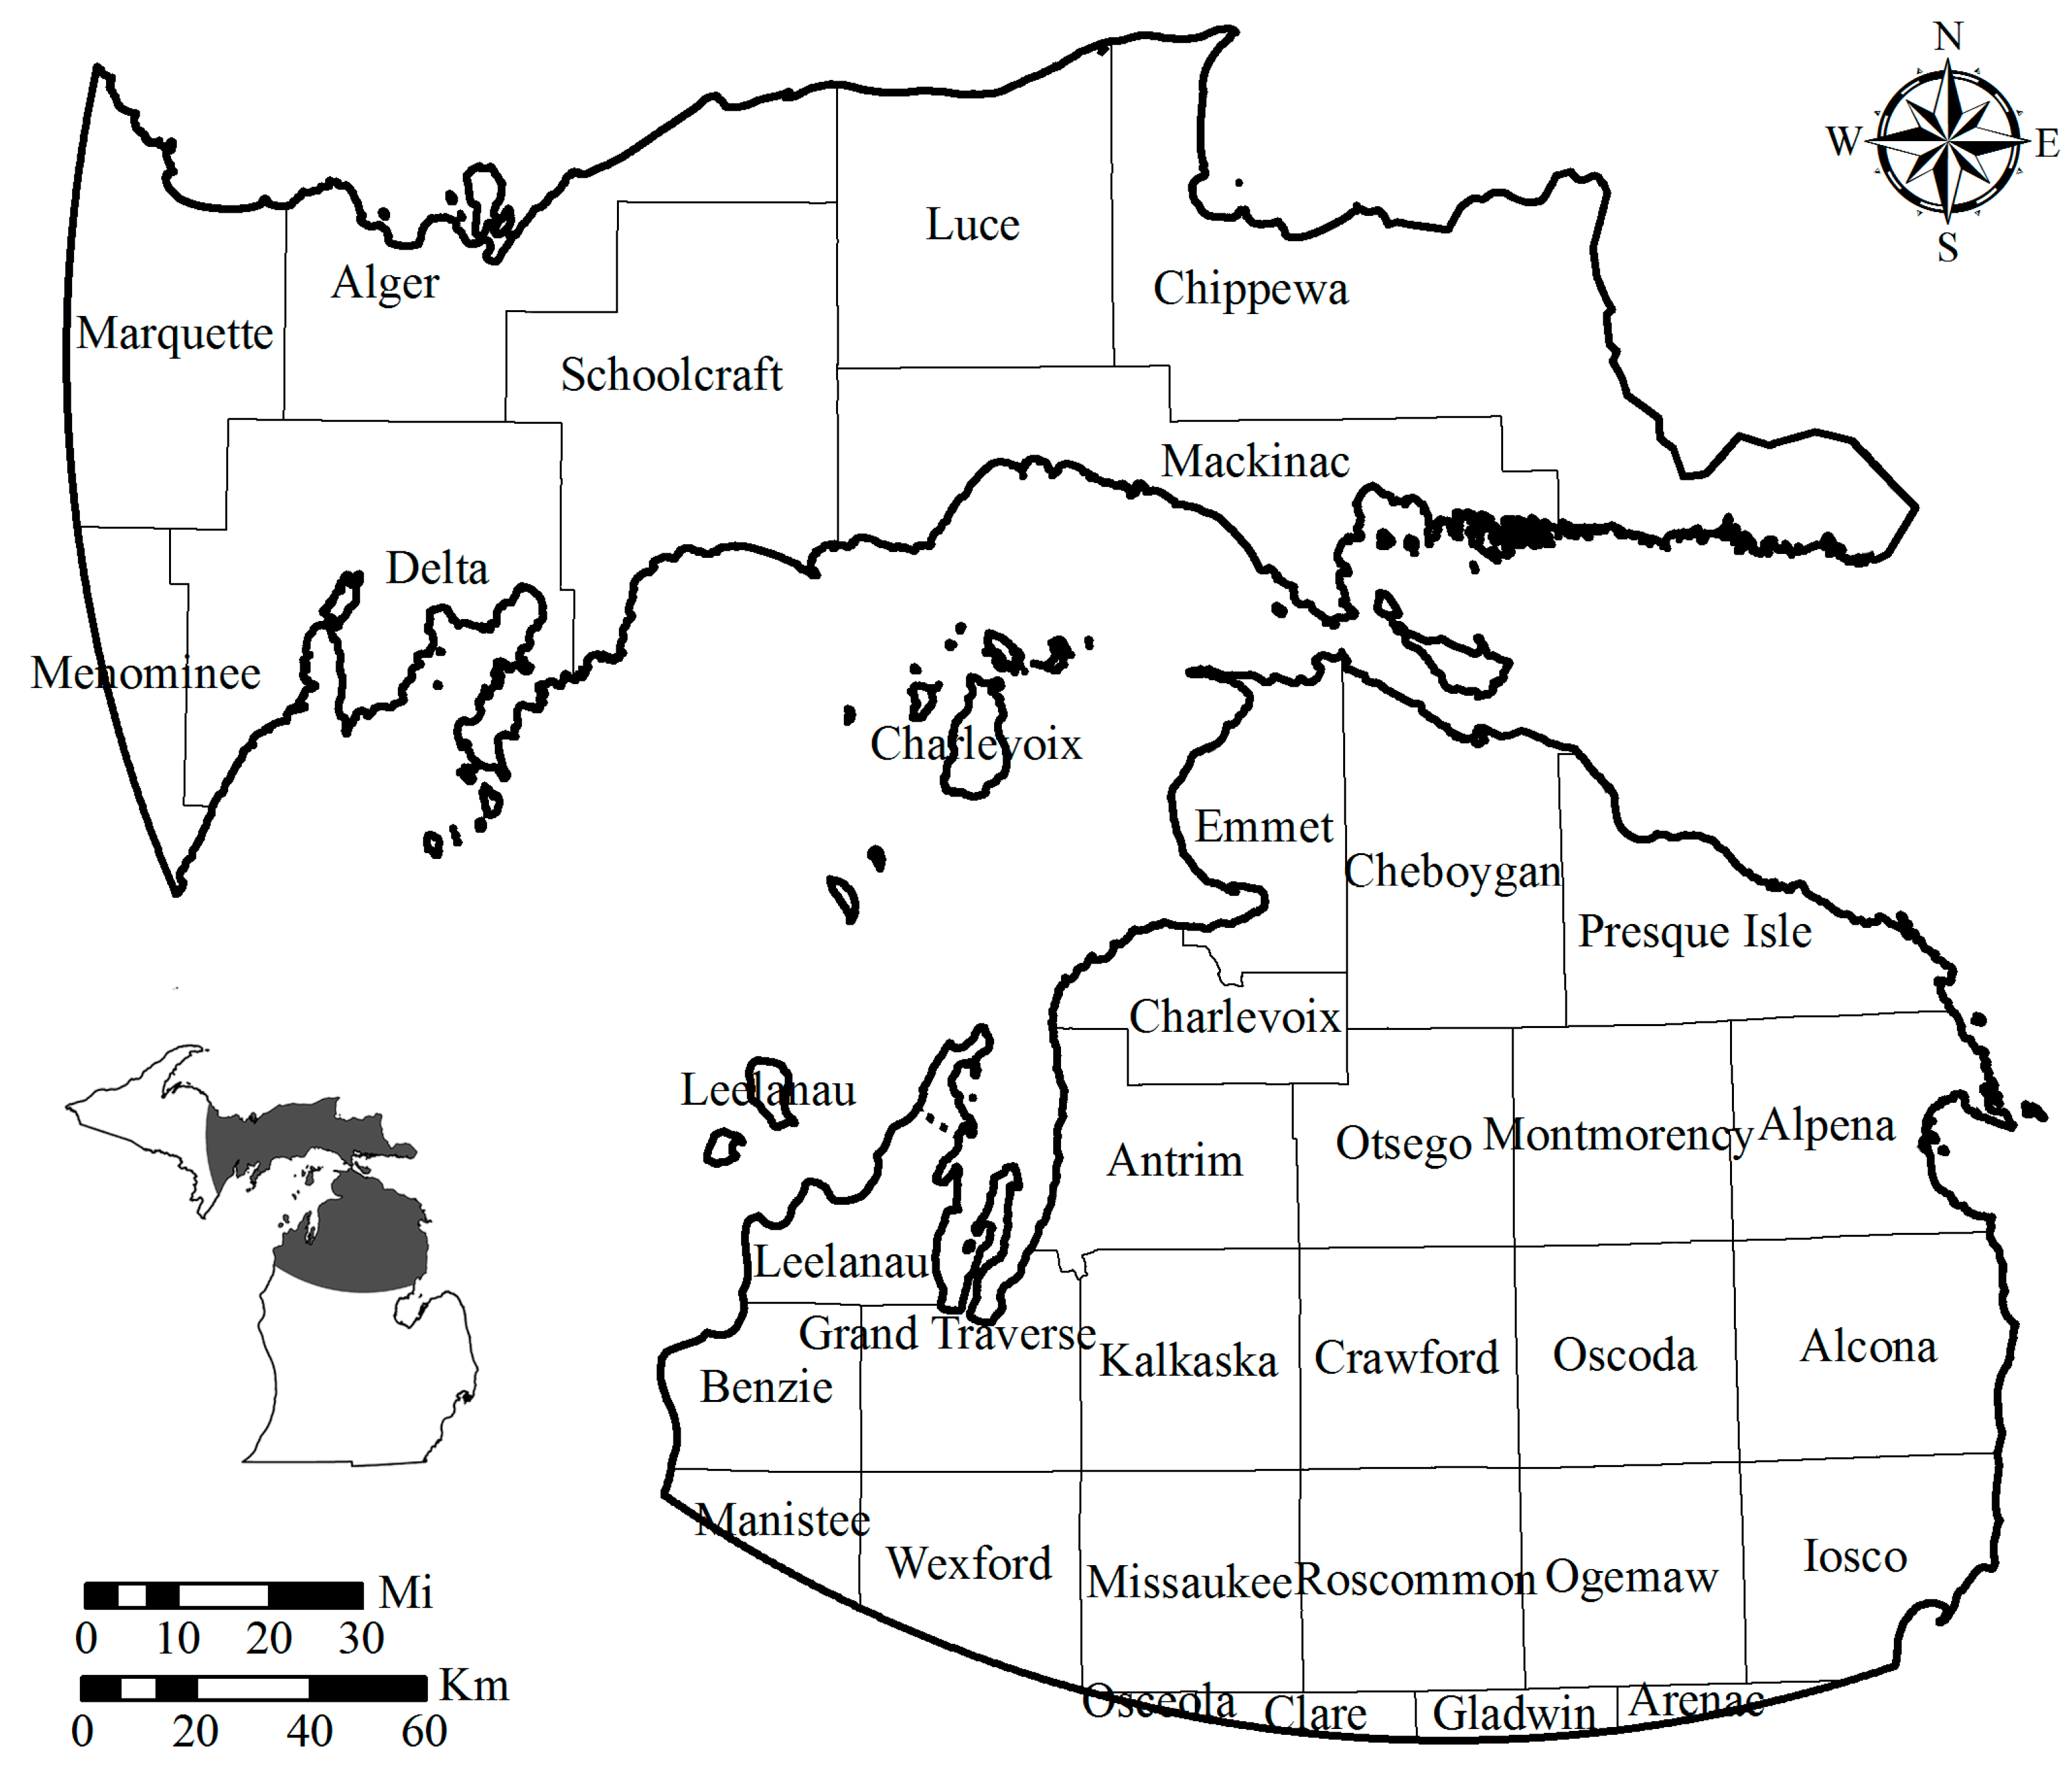
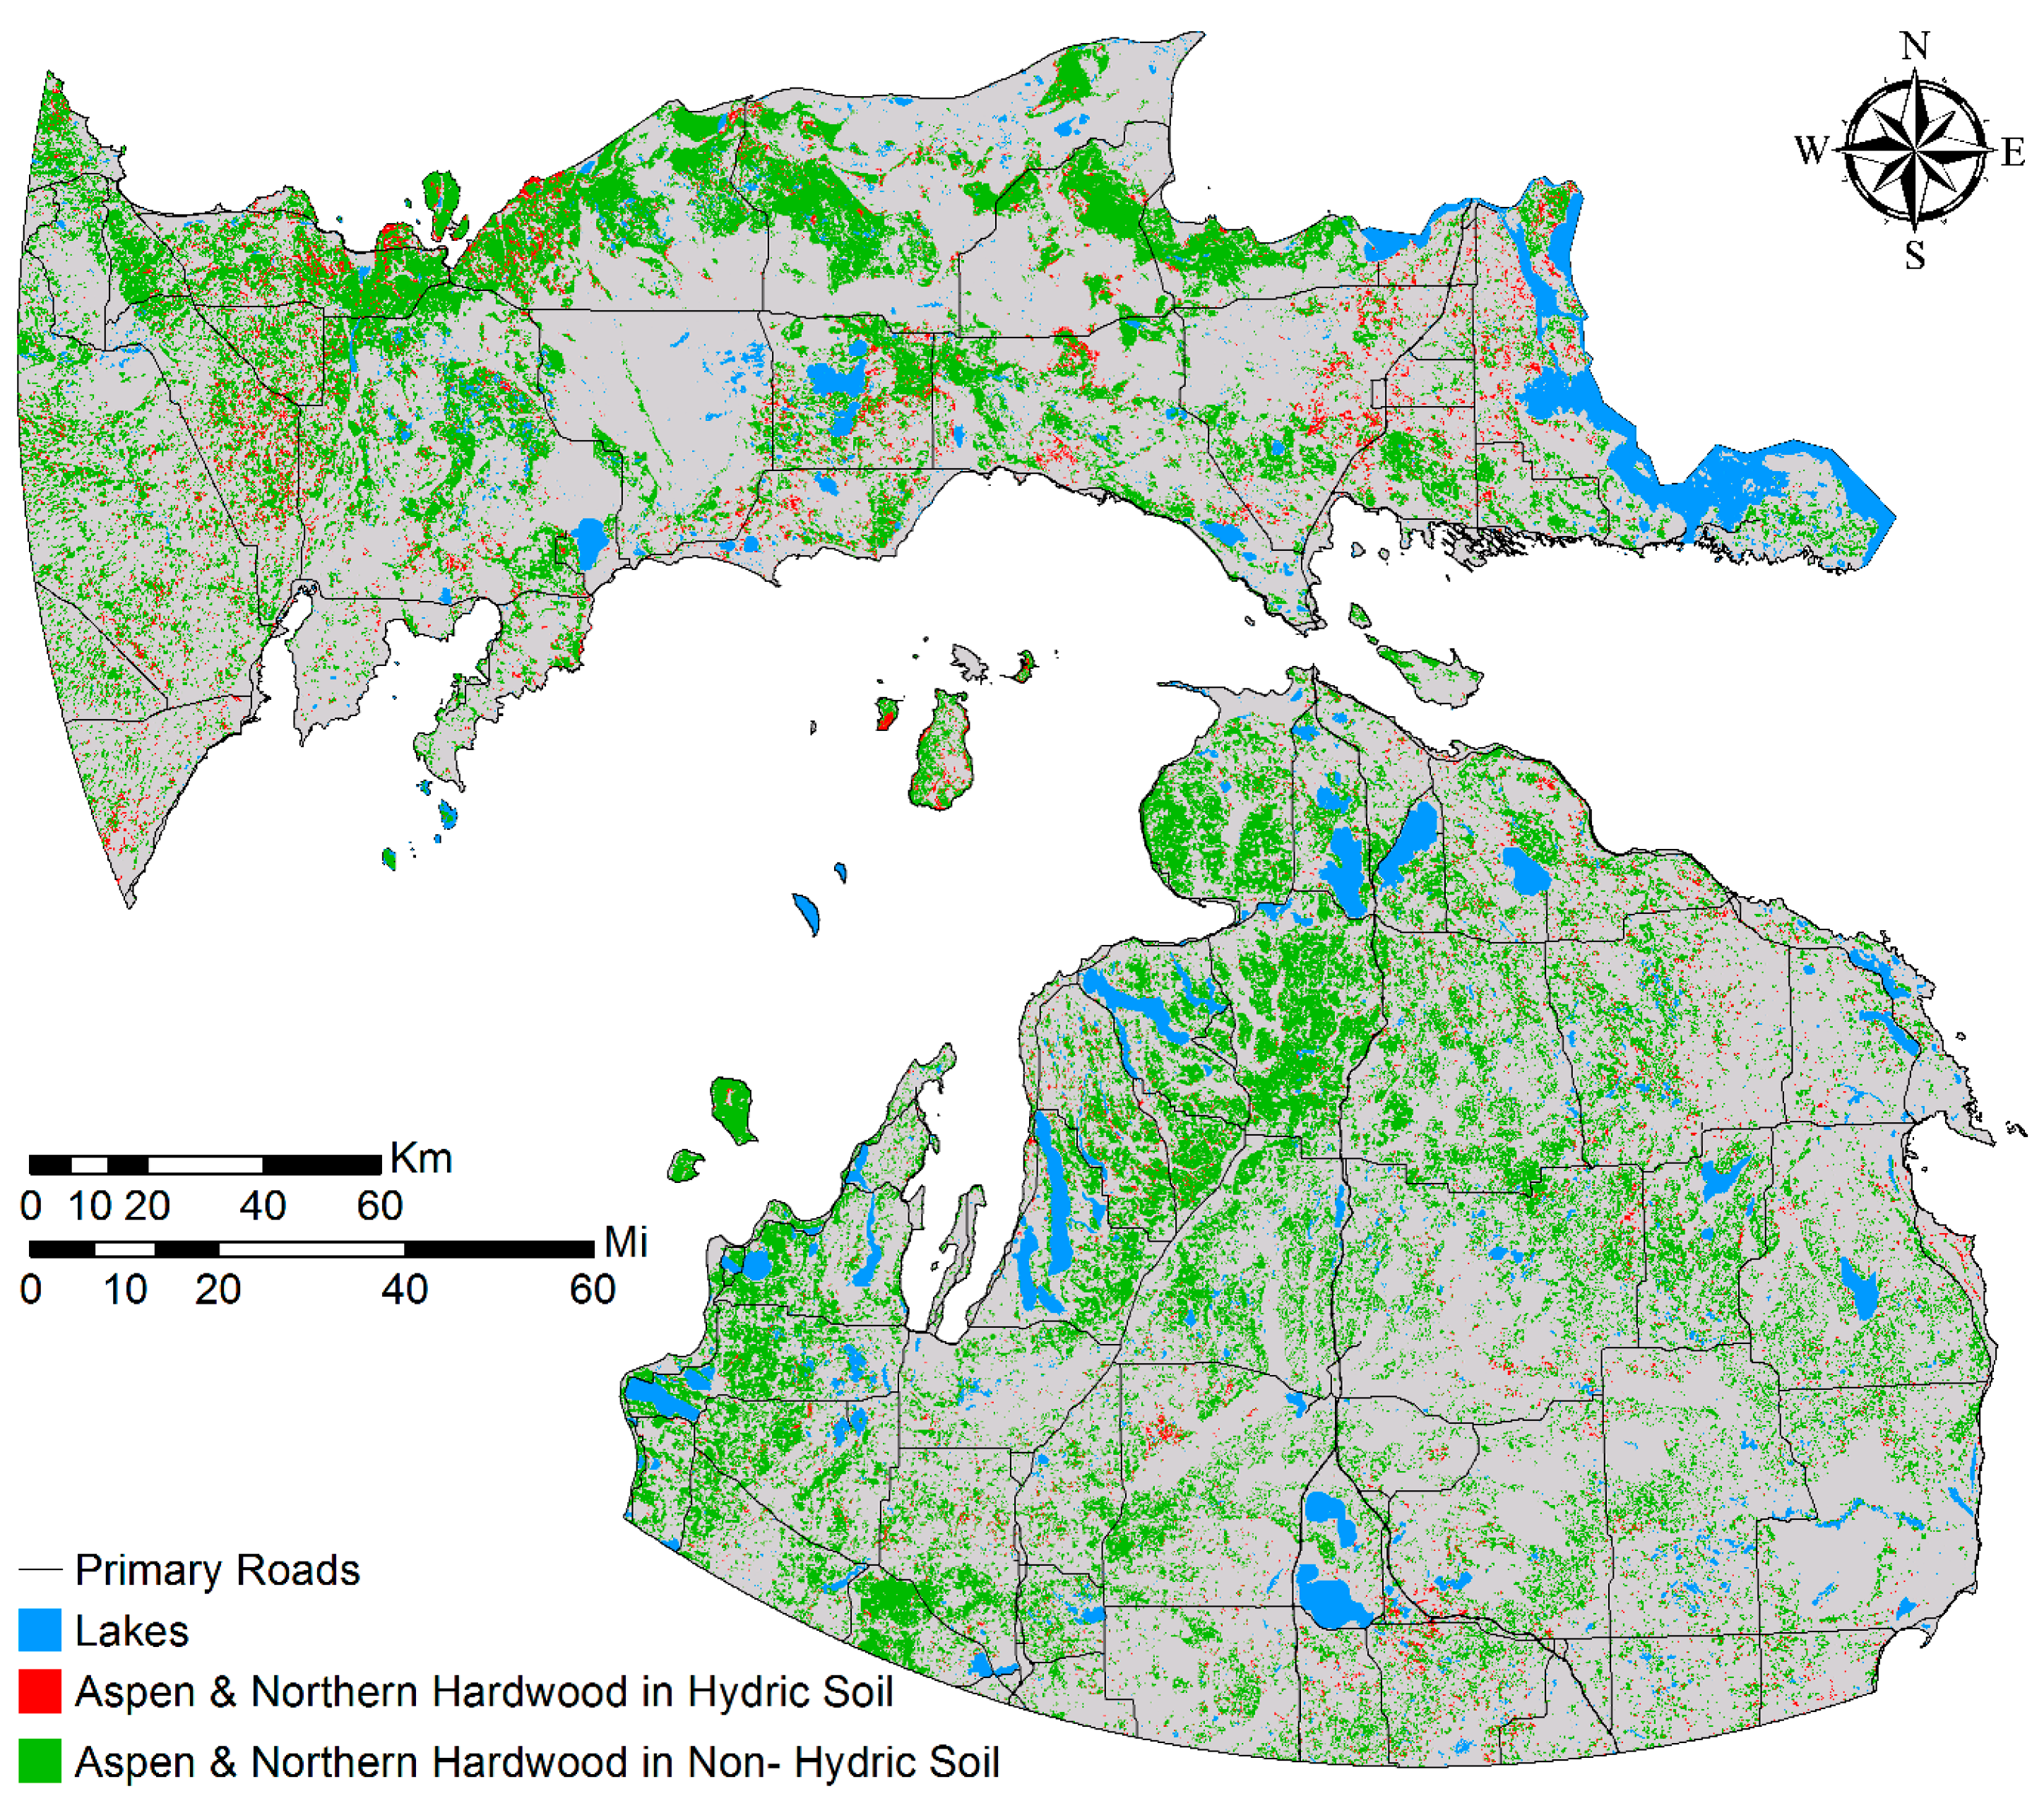
In Michigan’s Upper Peninsula (UP) and northern Lower Peninsula (LP) there is considerable potential for producing biofuels from feedstock sources such as aspen, hybrid poplar and hybrid willow (Populus spp.), and northern hardwoods, particularly since the current rate of growth of aspen and northern hardwoods exceeds the amount harvested. Table 1 shows several facilities in Michigan that produce electric power from wood fuel [14].
Figure 2. The United States’ woody feedstock sources (Source of data: US Billion Ton [16]).
Land 04 00413 g002
Table 1. Wood fuel electric power production facilities in Michigan (Source of data: Forestry Biofuel Statewide Collaboration Center (FBSCC) [18]).
PlantLocationProduction Capacity (kW)Wood Consumption (tons/yr)
Hillman Power Co.Hillman20,000230,000
Viking Energy/Lincoln PowerLincoln18,000150,000
Cadillac Renewable EnergyCadillac39,600375,000
Viking Energy/McBain PowerMcBain18,000150,000
Genesee Power StationFlint39,500300,000
Grayling Generating StationGrayling38,000250,000–300,000
Geographic Information Systems (GIS) have been used extensively around the world to provide valuable baseline information to support biofuel investment decisions [19,20]. To begin ensuring long term feedstock availability and sustainability, it is important to gain an understanding of the spatial distribution of the current feedstock, its location relative to the road network for harvesting accessibility, general land ownership, and changes in land use/cover patterns with reference to natural or undisturbed condition. The use of GIS facilitates incorporation of disparate spatial datasets in bioenergy feasibility and feedstock production assessment, including agricultural, economic, biophysical, and infrastructural data [21,22,23] to determine feedstock land availability and estimate biomass for energy production [24,25]. Furthermore, GIS-based decision support tools have been developed to evaluate the transportation cost of energy crop feedstock and associated environmental implications [26,27,28,29,30,31], which are crtical for bioenergy production planning. These applications of GIS in the bioenergy planning literature have not incorporated historical land use conditions to guide site availability of bioenergy feedstocks, which is important for sustainable feedstock production while promoting native biodiversity.
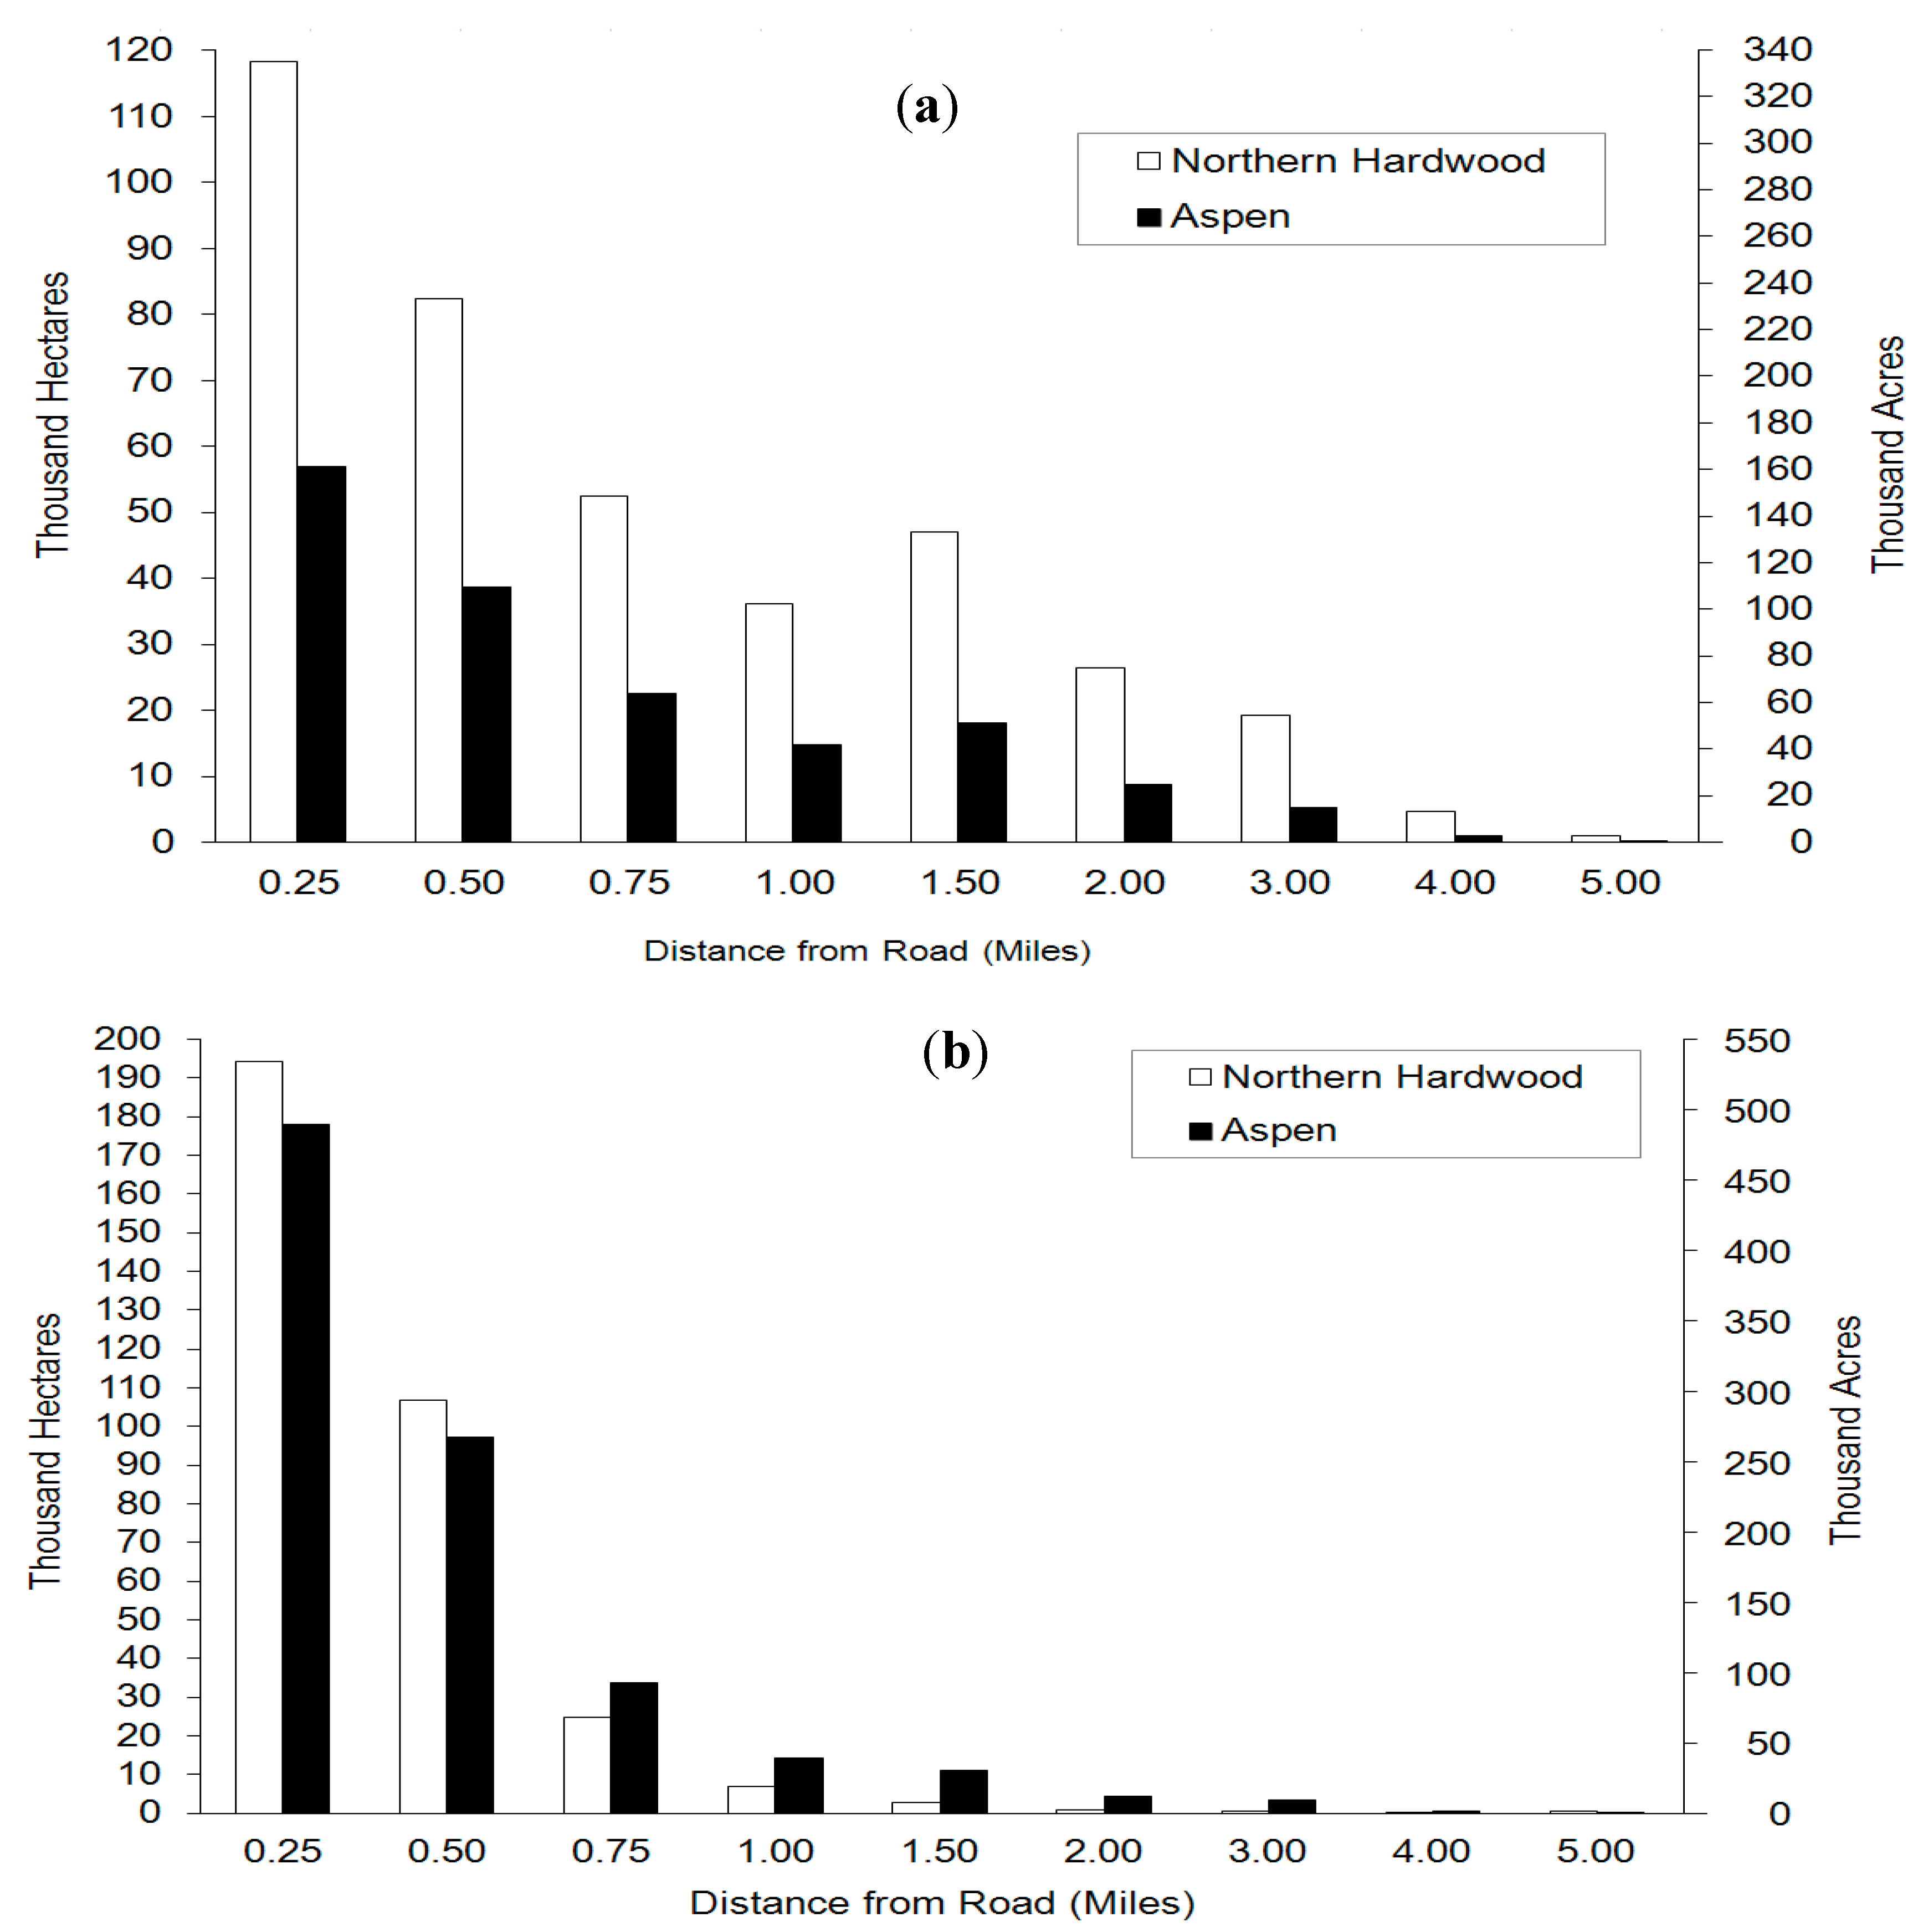
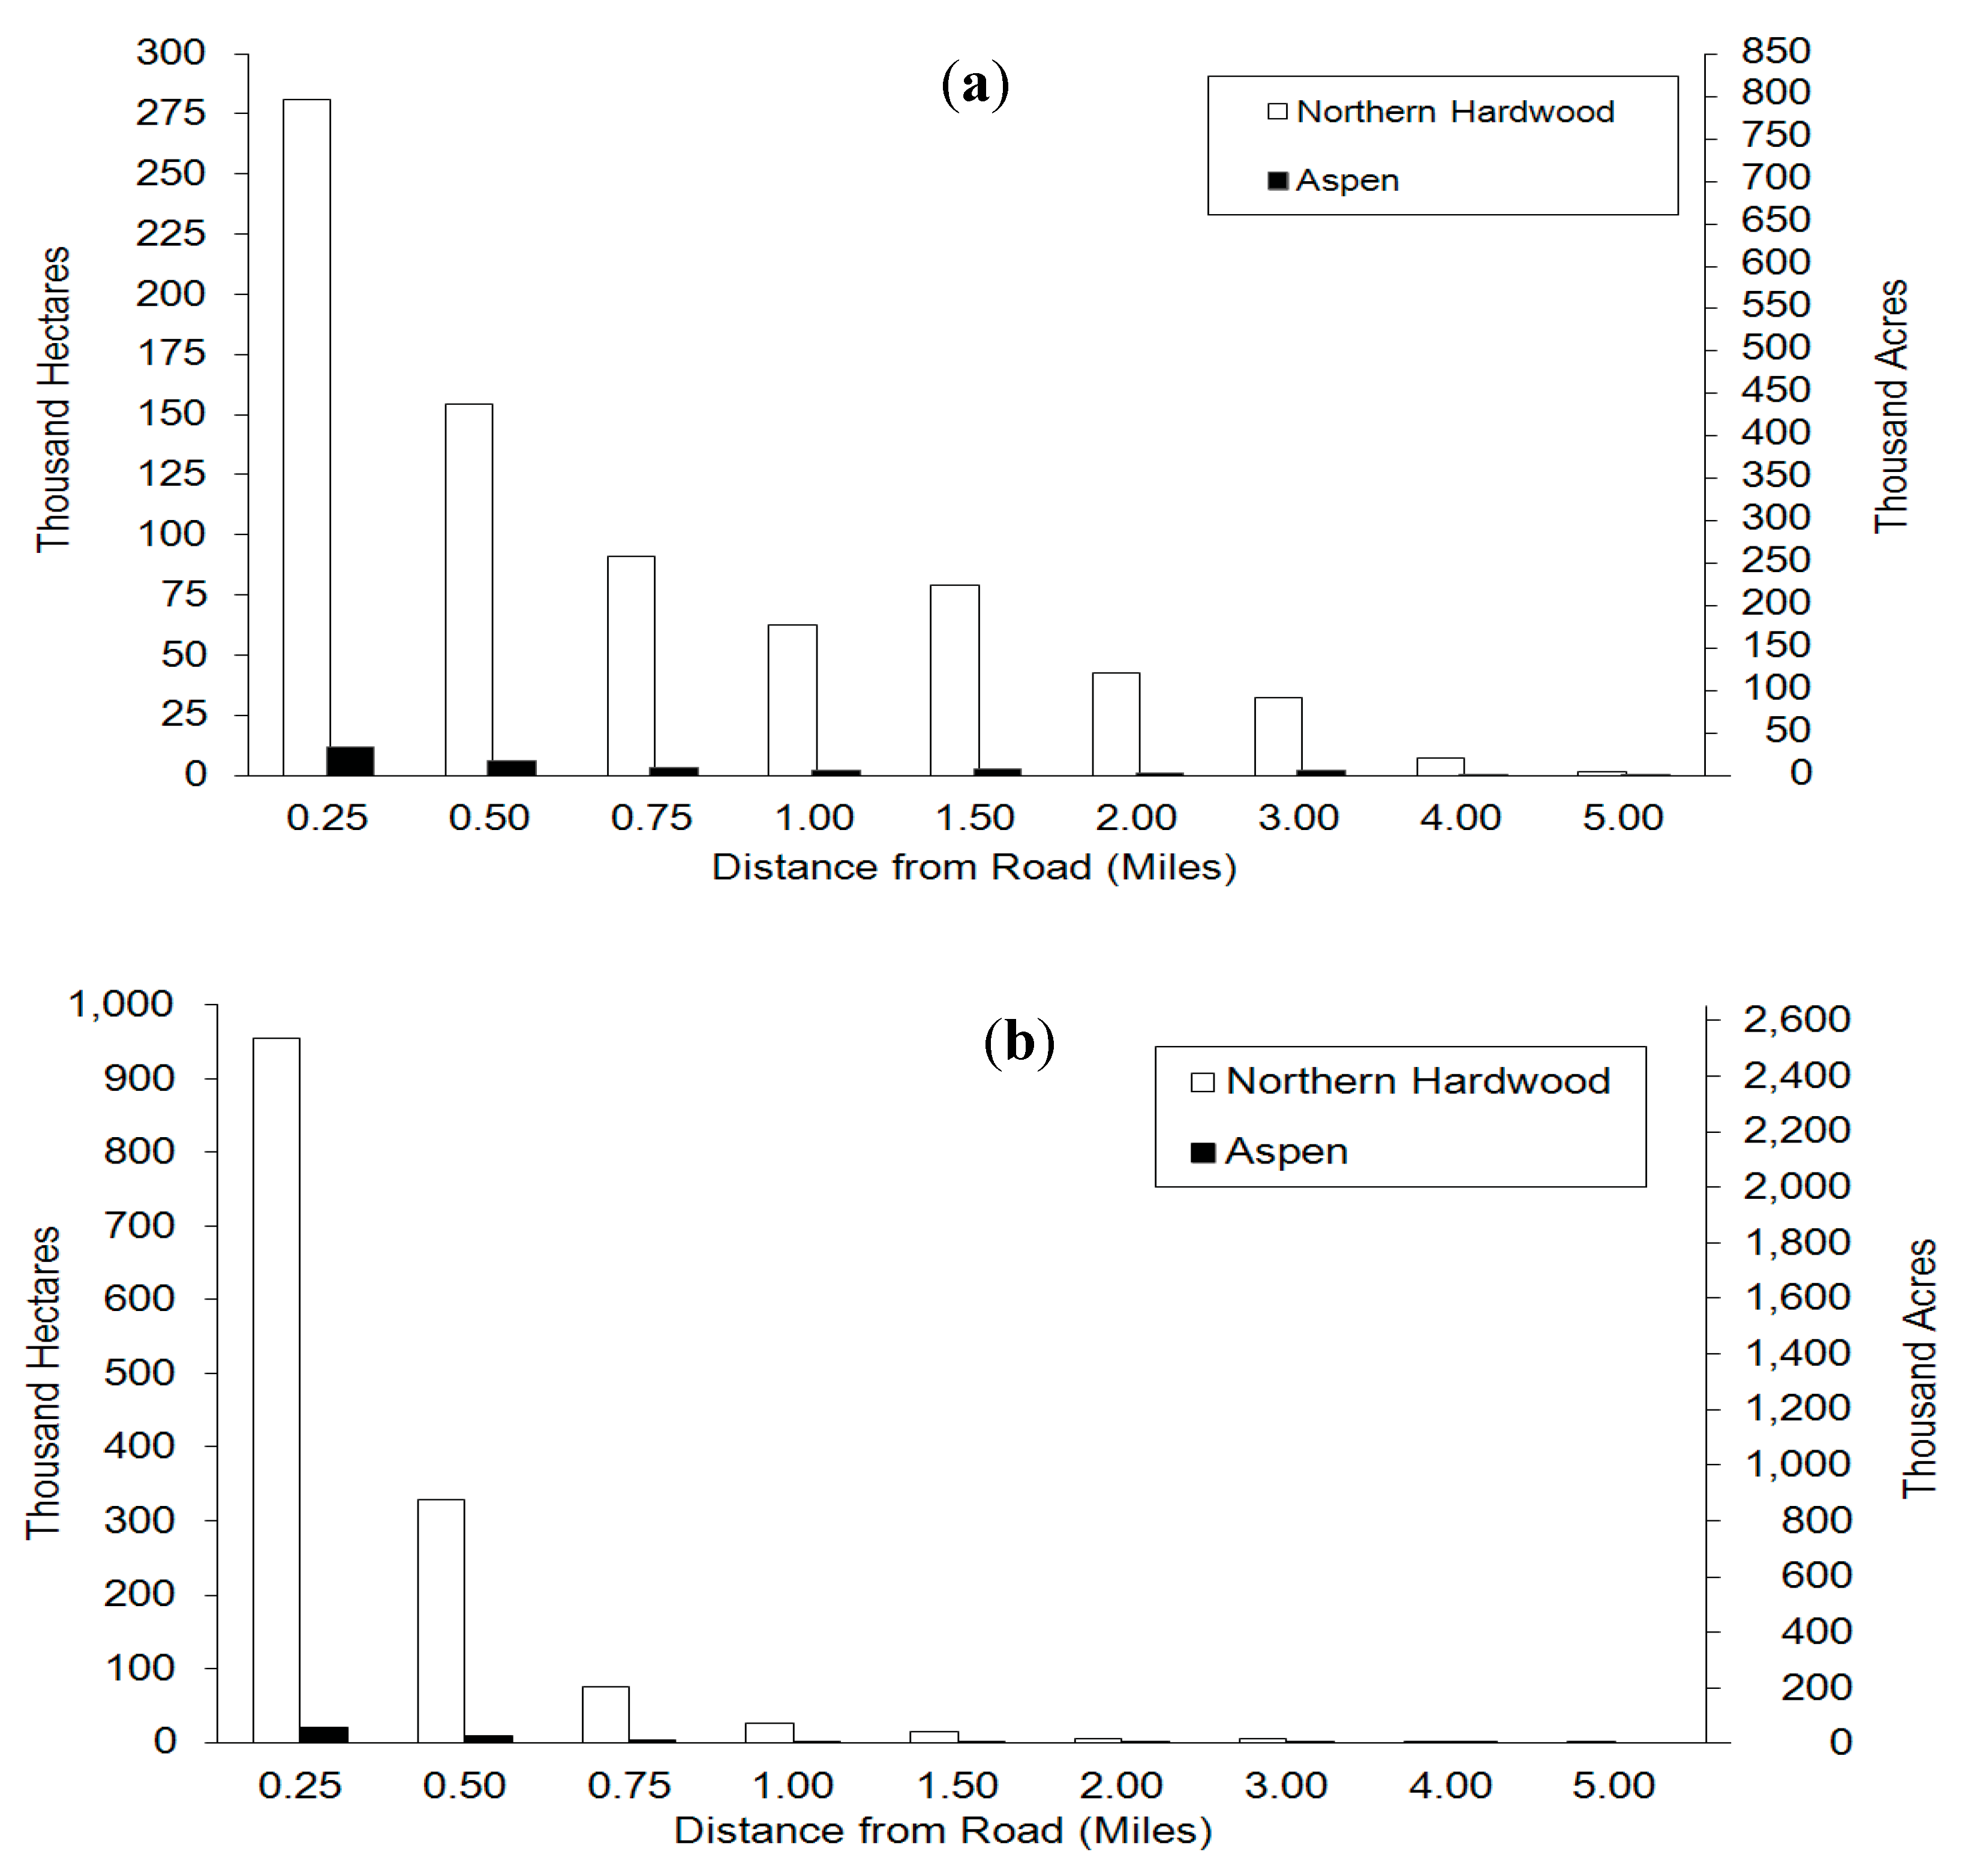
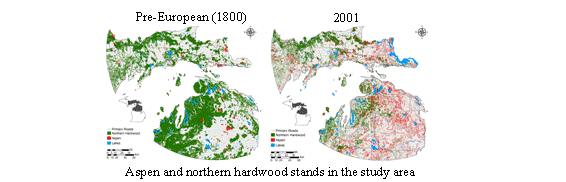
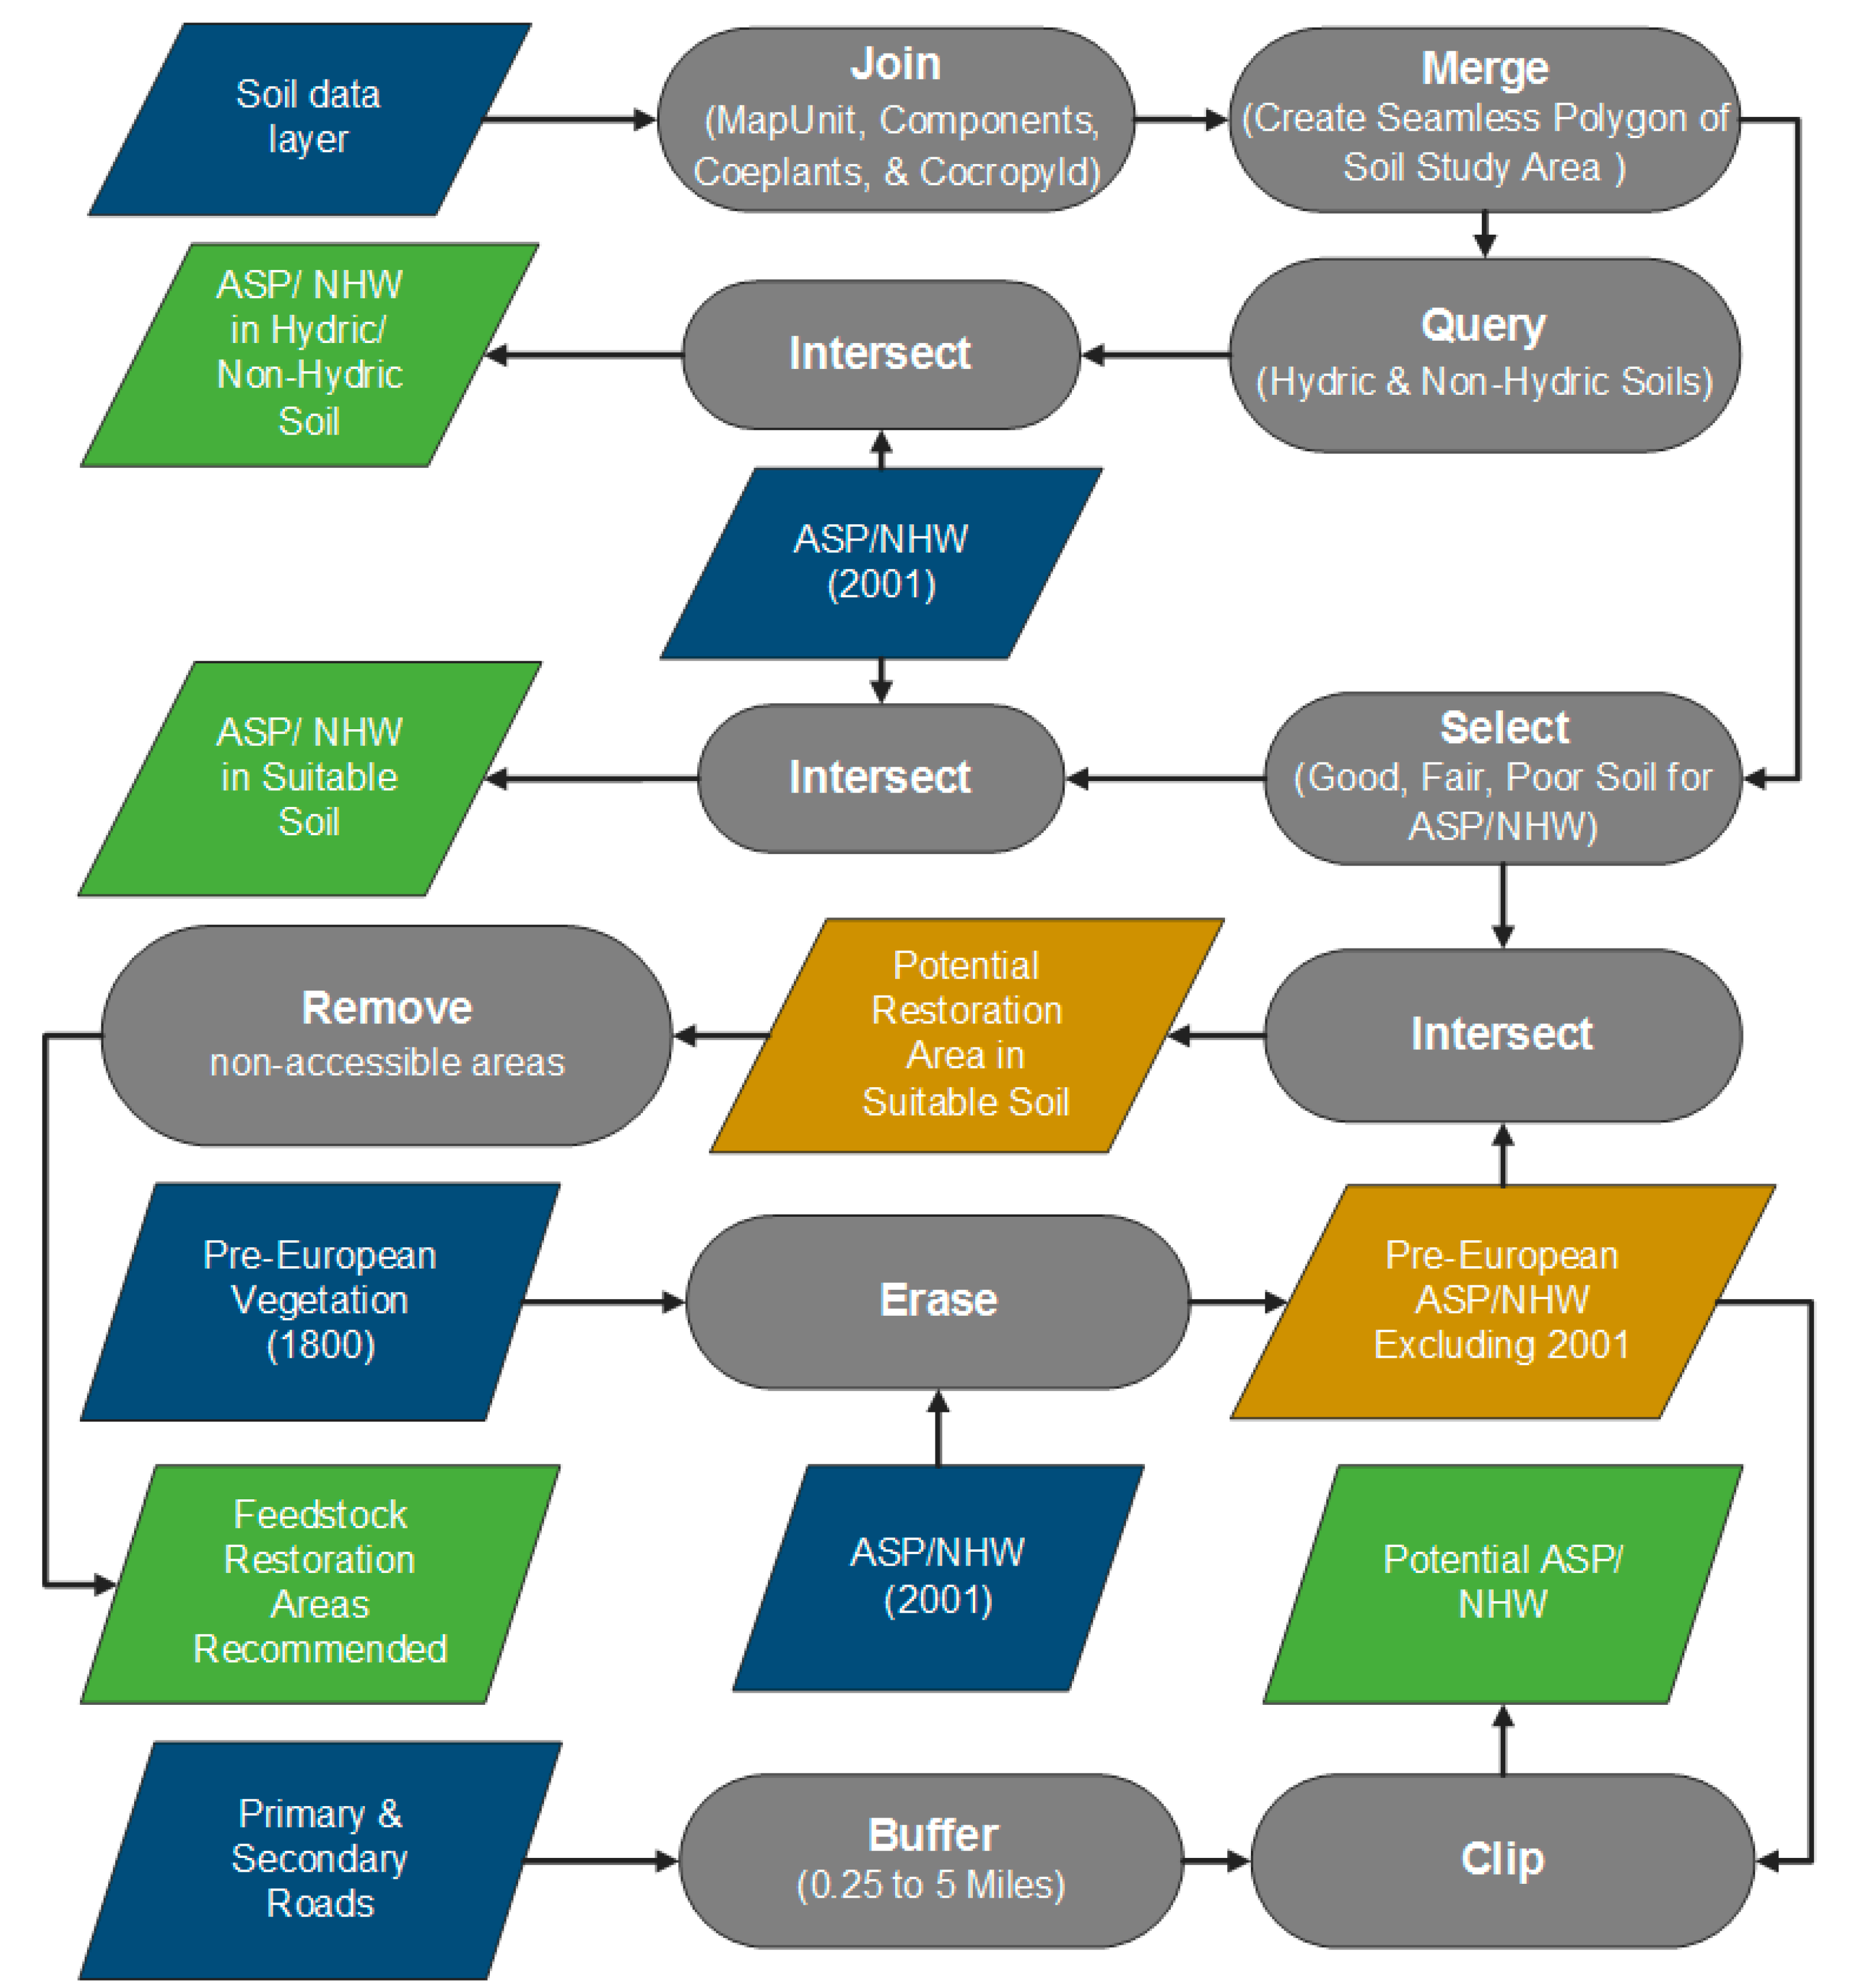
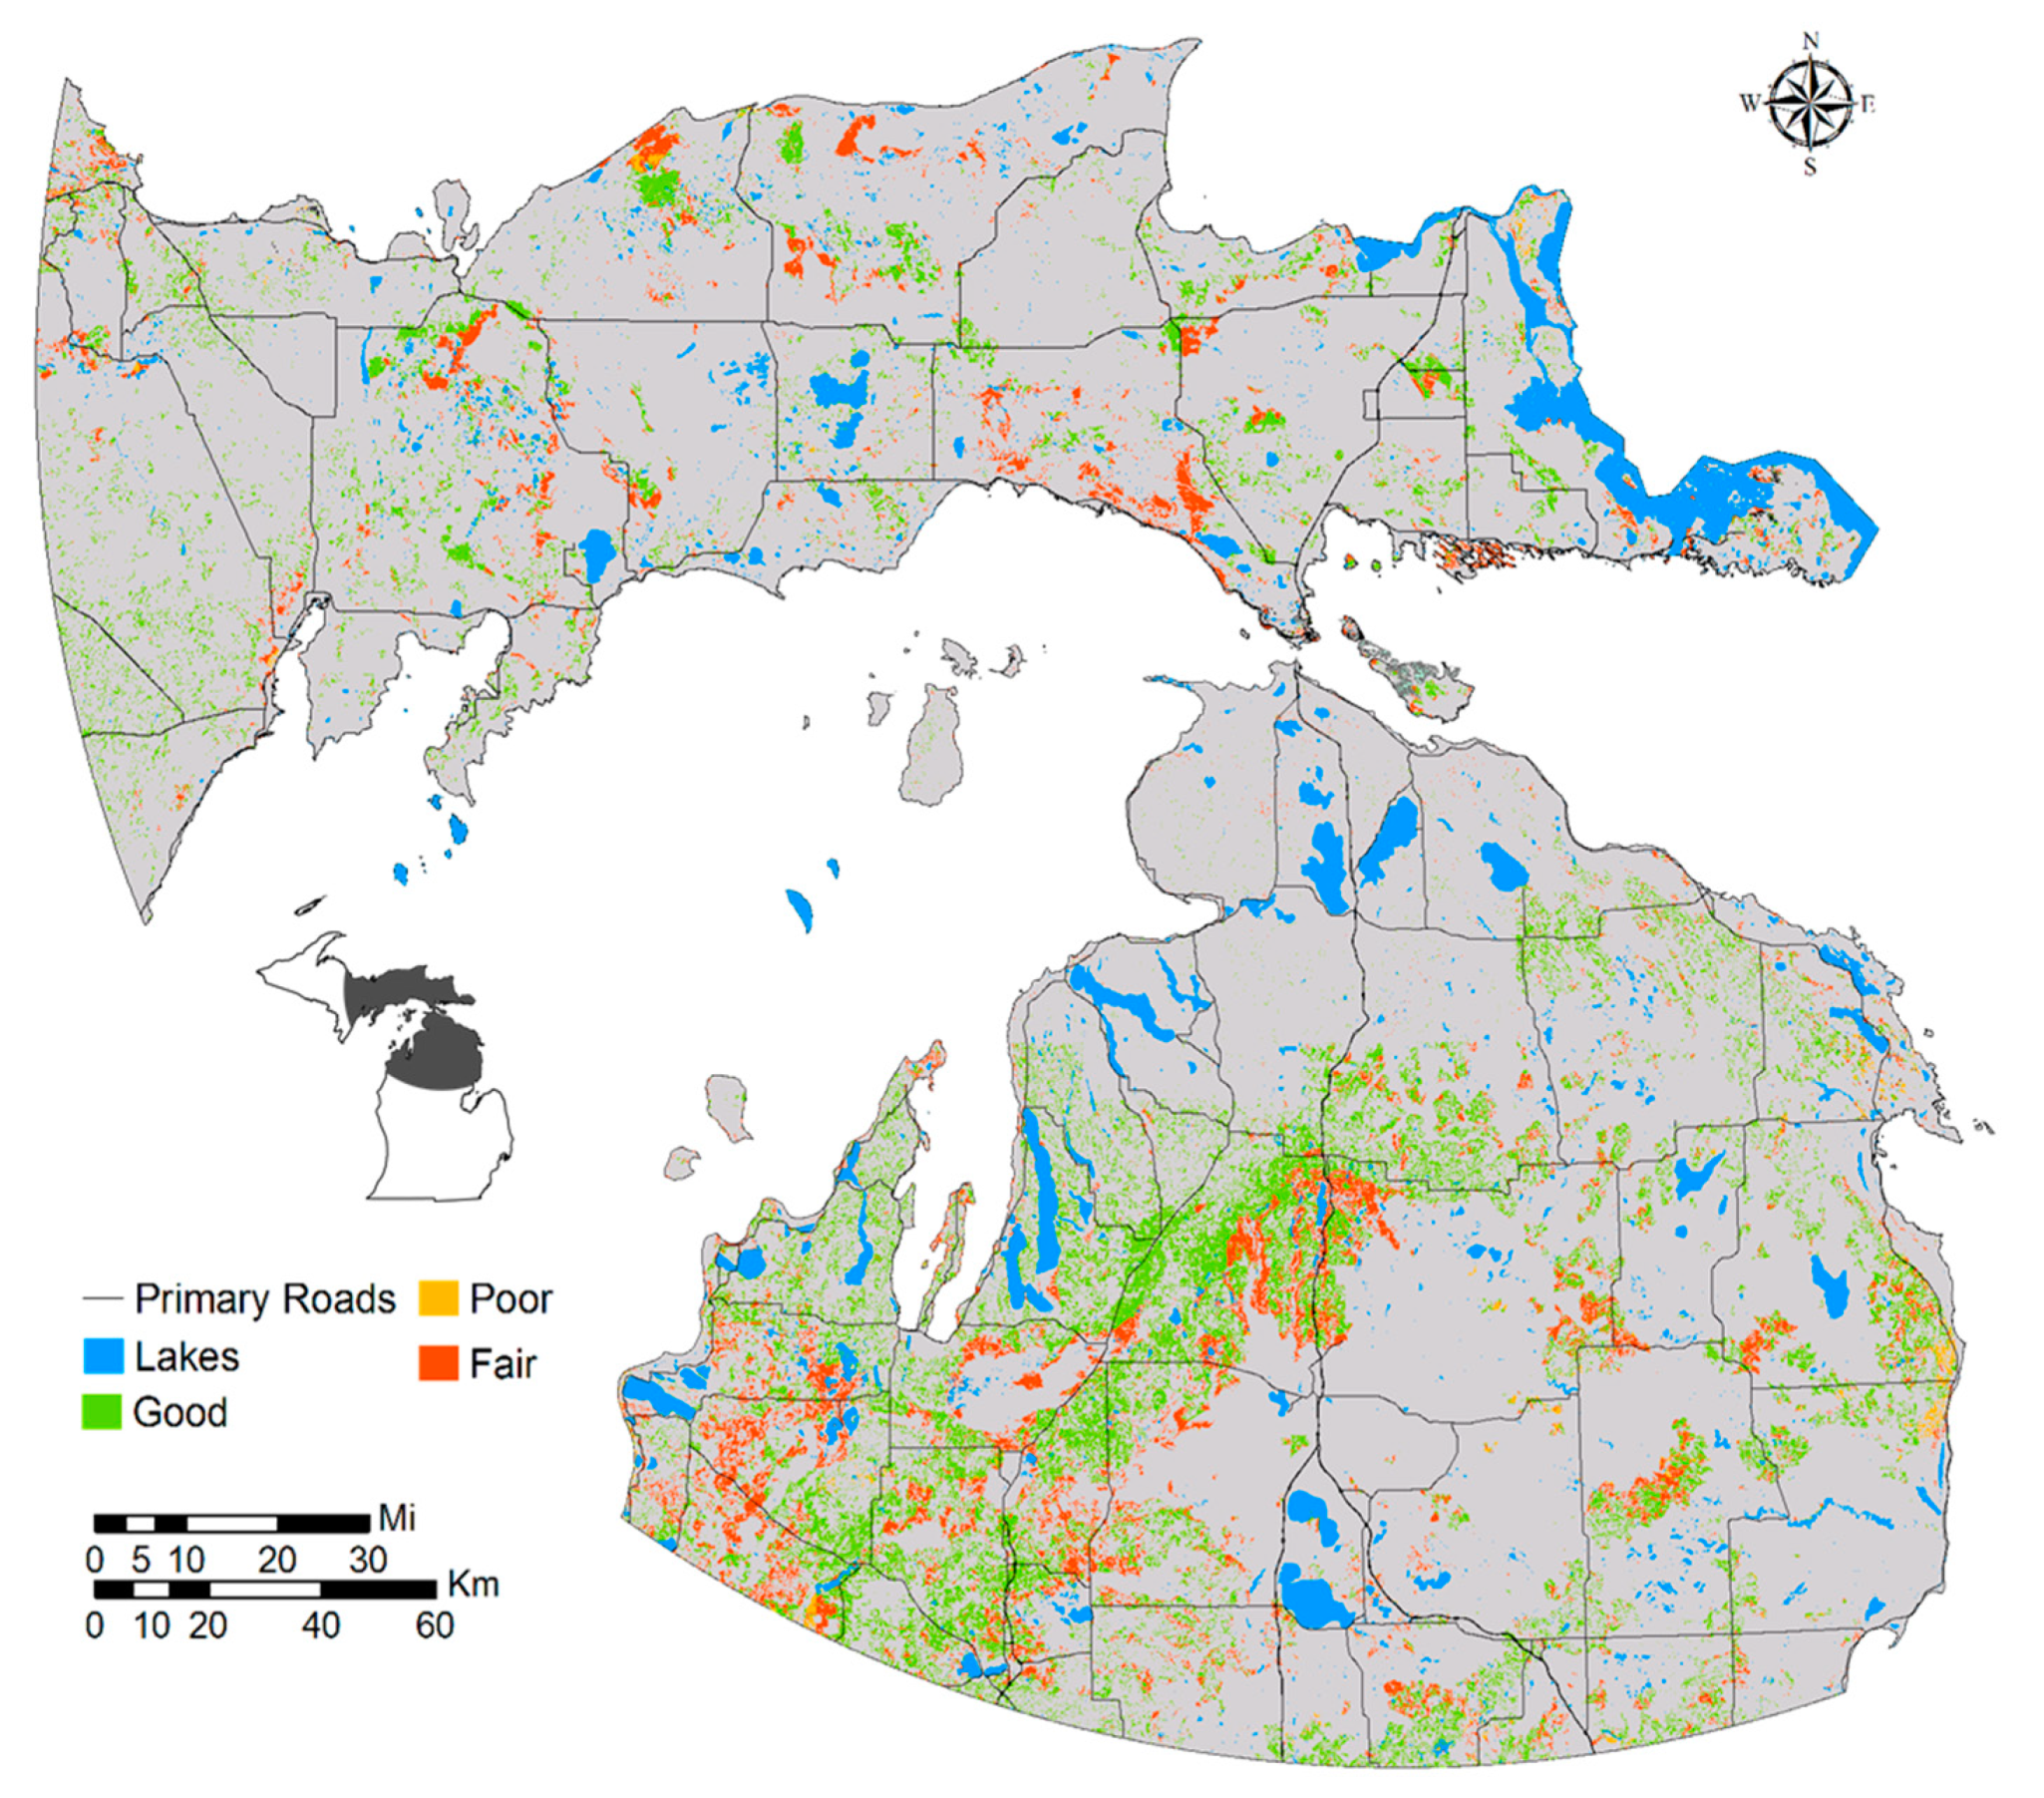
The present study underscores the importance of changes in land use/cover patterns with reference to natural or undisturbed condition as a valuable source of information for feedstock development. A multi-faceted GIS-based approach has been developed to assess the current spatial extent of woody feedstocks, harvesting accessibility, and the potential for woody feedstock development based on information about pre-European settlement (circa. 1830) land cover in Michigan, the United States. The objectives of this research are to: (i) Determine the spatial distribution of aspen and northern hardwood forests and their proximity to appropriate transportation networks; and (ii) Compare current land use/cover to historic (pre-European settlement) extent to gain insight where underutilized land, such as abandoned agriculture fields, could potentially be restored to pre-European settlement conditions in order to increase long term feedstock availability while at the same time promoting diversity for native flora and fauna and meeting best management practice (BMP) guidelines. ArcMap 10.1 GIS is used to develop a spatial dataset in the form of a geodatabase and analyze the spatial distribution of aspen and northern hardwoods in the eastern UP and northern LP of Michigan.

2. Study Area and Data Inputs

The study area (Figure 3) is the eastern half of Michigan’s UP and the northern half of the LP. Surveys of logging truck drivers in Michigan, Wisconsin, and Minnesota suggest most biomass transportation occurs within 150 miles from unloading locations [32].
Figure 3. Study area in Michigan’s upper and lower peninsulas.
Land 04 00413 g003

2.1. Data and Resources

The requisite spatial data for the analysis are available from various geospatial clearing houses (Table 2), and a description of the data is provided below. Michigan GeoRef was used as the projected coordinate system for the geospatial processing in order to project the geospatial data layers using a single zone.
Table 2. Data inputs and sources.
Data TypeSourceReference
Land Cover (IFMAP)Michigan Geographic Data Library http://www.michigan.gov/cgi/[33]
Crop Data Layer (CDL) 2011National Agricultural Statistics Service http://www.nass.usda.gov/research/Cropland/SARS1a.htm[34]
Land Cover circa. 1830Michigan Geographic Data Library www.mcgi.state.mi.us/mgdl[33]
NRCS SoilsGeospatial data gateway http://datagateway.nrcs.usda.gov/[35]
NWI WetlandsThe National Wetlands Inventory (NWI) www.fws.gov/nwi/[36]
Hydrography & TransportationMichigan Geographic Data Library www.mcgi.state.mi.us/mgdl[33]
Federal/Native American OwnershipNational Atlas www.nationalatlas.gov[37]
State of Michigan OwnershipMichigan Geographic Data Library www.mcgi.state.mi.us/mgdl[33]
County BoundariesMichigan Geographic Data Library http://www.michigan.gov/cgi/[33]

2.2. Land Use/Cover

Four sources of land use/cover data are utilized in this study, including the Integrated Forest Monitoring, Assessment and Prescription (IFMAP) land use/land cover data from 2001, the Cropland Data Layer (CDL) from 2011, pre-European land cover circa. 1830 developed by the Michigan Natural Features Inventory (MNFI), and the National Wetlands Inventory (NWI). IFMAP was developed by the Michigan Department of Natural Resources (MDNR) and provides land use/cover information in a raster format with a 30 m spatial resolution. Its primary purpose is inventorying resource information for managing timber production and other forest resources. IFMAP includes 32 land use/cover classes in a hierarchical classification scheme [33], providing northern hardwood associations, aspen associations, and other land use/cover types. It is recognized that this dataset is slightly outdated. However, it is the only land use/cover dataset for Michigan which separates aspen from northern hardwoods; hence its utilization in this study.
The CDL 2011 is a product of the United States Department of Agriculture’s (USDA) National Agricultural Statistics Service (NASS). The dataset provides a geo-referenced raster file with a 30 m spatial resolution, and contains crop specific land use information. Digital imagery acquired during the growing season from a variety of sources is used to produce the dataset [34]. The CDL is produced to provide a detailed classification of agricultural lands identifying the spatial extent of various crops.
The Public Land Survey (PLS) conducted by General Land Office (GLO) between 1816 and 1856 provides information about pre-European settlement land cover. Information collected by land surveyors about land cover and other landscape features were interpreted by the MNFI from the original PLS surveyors’ notes and a land cover map interpolated. These data provide a basis to characterize land use changes between pre-European settlement and current conditions. The use of these data in research is widely accepted [38,39].
The National Wetlands Inventory (NWI) is produced by the United States Fish and Wildlife Service (FWS) for mapping the approximate location, type, and areal extent of wetlands and other surface waters in a vector format. The NWI and associated mapping has been completed utilizing satellite and aerial imagery, topographic information and soils data.

2.3. Digital Soils Data

Soils data for each county within the study area provide detailed geo-referenced data produced via digitization of remotely sensed imagery incorporated with field data. Soils are grouped into two broad categories: hydric and non-hydric drainage conditions. Additional information utilized included: component existing plants (coeplants), component crop yield (cocropyld), component forest productivity (coforprod), and map unit (mapunit) tables. The Natural Resources Conservation Service (NRCS) defines hydric soils as “those that are sufficiently wet in the upper part to develop anaerobic conditions during the growing season.” Aspen grows best in deep, well drained soils [40]; whereas hydric soils characterizing very wet conditions are moderately suitable for aspen production [41]. Northern hardwoods are typically found on loamy sand to sandy loam soils, with small stands occasionally located in swampy hydric mineral soils [42].

2.4. Road Network

A geo-referenced road network is available from the Michigan Geospatial Data Library. Primary and secondary roads, since they carry the bulk of wood products, are selected to calculate the proximity of aspen and northern hardwood forests to roads. Primary roads are “generally divided, limited-access highways within the interstate highway system or under State management, and are distinguished by the presence of interchanges. Secondary roads are main arteries, usually in the U.S. Highway, State Highway, and/or County Highway system” [43].

2.5. Land Ownership

The United States National Atlas provides Federal and Native American ownership boundaries. State ownership boundaries are available from the MDNR. These ownerships are utilized to identify land potentially restricted for harvesting and expansion of woody feedstock sources. State and national parks, wildlife refuges, military installations and Native American lands were considered restricted for this study and are excluded from the analyses.

2.6. Geospatial Analysis

A flowchart of the geospatial analysis procedures used in ArcMap 10.1 are shown in Figure 4. The IFMAP and CDL raster files are converted to polygon feature classes, since polygons allow for explicit representation of geospatial features. By contrast, raster files provide an implicit representation, which is limited by the spatial resolution (pixel size).
Figure 4. Flowchart for site evaluation of aspen and northern hardwoods based on soil characteristics, road accessibility, and comparison between pre-European settlement and present day vegetation. Blue, green, and yellow parallelograms respectively represent input, output, and output used as input. Grey ovals represent ArcMap tools.
Land 04 00413 g004
Comparison between the IFMAP and pre-European settlement land cover began by identifying areas classified as aspen or northern hardwoods in both datasets. These are set aside as areas of “no change”. Further comparison between the two datasets requires the pre-European land cover classes to be cross-walked to the IFMAP land use/cover classification scheme. The IFMAP and revised pre-European settlement land cover classes are overlaid to determine where and how much land use/cover change has occurred. The conversion of aspen and northern hardwoods to other land use/cover types is of key importance as many forest management plans and BMPs often recommend restoration of these stands to their original cover type. Since the comparison shows locations where native aspen and northern hardwood forests have been converted to under-utilized or abandoned agricultural lands, it provides a starting point for locating potential sites for conversion back to forested areas whether in the form of restoration plantings or conversion to woody biomass crops.
The proximity of aspen and northern hardwood stands, using both the IFMAP and pre-European settlement land use/cover maps, to primary and secondary roads is analyzed. Incremental buffers ranging from 0.4 km up to 8 km are calculated, and the areal change evaluated. This is done to assist land managers in determining transportation costs not only over the existing transportation network, but also to assess potential road construction costs for increased accessibility. Determination of these actual costs is beyond the scope of this study.
Lastly, existing and pre-European settlement aspen and northern hardwood stands are evaluated to determine if they are growing on hydric and non-hydric soils. Successful restoration efforts require understaning soil characteristics since restoration and harvesting activities can potentially alter physical, chemical and/or biological properties of soils [44].

3. Results

3.1. Aspen and Northern Hardwood Distribution circa. 2001

There are large contiguous stands of northern hardwoods ~124,610 ha in the northern portion of the UP study area, making up ~30% of the total northern hardwood stands in this part of the study area. Area of these stands ranges between 10,000 and 67,640 ha. Large northern hardwood stands in the western part of the LP study area occupy ~131,100 ha. These stands range between 1000 and 18,060 ha, and they contain ~38% of the total northern hardwoods in the LP portion of the study site. There are a few large, contiguous aspen stands ranging between 1000 and 3370 ha throughout the entire study area. Numerous northern hardwood stands ranging from 1 to 1000 ha are scattered throughout the study site. A total of 564,955 ha of aspen and northern hardwoods are identified in the UP portion of the study area, and 689,985 ha in the LP portion of the study area. Table 3 summarizes the areas of aspen (ASP) and northern hardwoods (NHW) distribution. Figure 5a shows the 2001 aspen and northern hardwood extents within the study area.
Table 3. Aspen and northern hardwoods distribution (2001) in the Upper Peninsula (UP) and Lower Peninsula (LP) portions of the study area.
LocationLand CoverTotal (ha)Total (acres)
Upper Peninsula (UP)ASP168,290415,852
NHW396,665980,175
Total564,9551,396,027
Lower Peninsula (LP)ASP345,220853,055
NHW344,765851,960
Total689,9851,705,015
Figure 5. Pre-European (a) and 2001 (b) aspen and northern hardwood stands in the study area.
Land 04 00413 g005

3.2. Aspen and Northern Hardwood Distribution circa. 1800

The pre-European settlement data shows extensive northern hardwood stands and very few aspen stands located throughout the UP portion of the study area (Figure 5). There were ~754,000 ha of northern hardwoods and ~30,000 ha of aspen prior to European settlement in the UP portion of the study area. Significant amounts of northern hardwood stands ~1,417,000 ha were available in the western half of the LP portion of the study area. Aspen stands (~33,500 ha) are scattered throughout the LP portion of the study area.
A comparison between the IFMAP and pre-European data shows that there are aspen and northern hardwoods areas that have remained unchanged. However, aspen and northern hardwoods types have also been converted to many other land uses/covers. Furthermore, IFMAP shows small areas of aspen and northern hardwoods that were other vegetation types in the pre-European settlement era. These can be explained, in part, by natural succession and also interpolation error in the pre-European settlement data. Table 4 provides a comparison of these types. There is a 27.93% (UP) and 52.42% (LP) decrease in the total amount of aspen and northern hardwoods from circa. 1830 to 2001.
Table 4. Aspen (ASP) and northern hardwoods (NHW) change between circa. 1830 and 2001.
LocationASP/NHW ChangeFeedstockArea (ha)Area (ac)Change * (%)
UPNo change ASP/NHW areas between circa. 1830 and 2001ASP700017,300-
NHW411,4151,016,630-
ASP/NHW circa. 1830/ not in 2001ASP22,74056,1902.9
NHW342,780847,03043.7
ASP/NHW 2001/not circa. 1830ASP73,990182,83513.1
NHW72,550179,27512.8
Total ASP/NHW in circa. 1830783,9351,937,150−27.9 *
Total ASP/NHW in 2001564,9551,396,040
LPNo change ASP/NHW areas between circa. 1830 and 2001ASP702017,340-
NHW480,3151,186,885-
ASP/NHW circa. 1830 and not in 2001ASP26,53065,5601.8
NHW936,5952,314,38064.6
ASP/NHW 2001 and not circa. 1830ASP174,030430,03025.2
NHW28,62070,7204.1
Total ASP/NHW circa. 18301,450,4603,584,165−52.4 *
Total ASP/NHW in 2001689,9851,704,975
* Minus sign indicates a decrease in the areal extent of ASP/NHW.
A lotal of 54% of northern hardwoods and 24% of aspen have been converted to other land uses in the UP portion of the study area (Table 5). In the LP portion of the study area, 34% of the pre-European settlement northern hardwood and 21% of the aspen has been converted. Large areas of the pre-European aspen and northern hardwood stands have changed to other forested lands (such as conifer plantations), rangelands or agricultural lands.
Table 5. Land use change from northern hardwood (NHW) and aspen (ASP) to other land uses between circa. 1830 and 2001.
Location (Cover Type)UnitLand Use/Cover Changed to
Forested *AgriculturalBarrenRangelandUrbanWetland
UP (ASP)ha15,95051531036008601300
ac39,3901300770900021403200
Change%30.10.110.20.2
UP (NHW)ha213,24032,240353071,45012,0708850
ac526,92579,6708725176,56029,82021,570
Change%38711322
LP (ASP)ha13,40028104805630770500
ac33,1209650119013,90019001220
Change%210.220.30.2
LP (NHW)ha389,535215,7456844264,20043,96012,350
ac962,560533,12016,910952,845108,62030,525
Change%563113862
* Forested includes all species other than apsen and northern hardwoods.

3.3. Current Agricultural Lands Suitable for Potential Feedstock Production

Croplands in the study area are mostly classed as prime farmlands or locally important farmlands according to the soil survey data. Prime farmlands have the best combination of physical, chemical and nutrient soil characteristics suitable for high crop yields [33]. Locally important farmlands provide locally important agricultural crops, although these lands are not identified as important at national or state levels. Using the Cropland Data Layer (CDL) for 2011, the spatial extents of corn fields (feed, pop, ornamental or sweet) were identified. The study focuses on corn fields since corn (particularly when commodity prices are high) is planted on suboptimal areas such as flood plains or steep slopes, on highly erodible soils and/or soils not classed as prime or locally important farmlands [45]. These lands can be managed more sustainably if converted to woody biomass crops such as hybrid poplar or willow, switchgrass or other native grasses, or even restored to their original land cover. Approximately 1% of the croplands in the UP portion of the study area are corn fields greater than 5 acres. In the LP portion of the study area, ~12% of croplands are corn fields. Interestingly, the CDL 2011 shows hybrid popular being planted in northeastern Presque Isle County and southwestern Benzie County on private under-utilized agriculture lands and former corn fields and is part of an ongoing MTU study [45].
With proper management, perennial energy crops improve soil quality in fields that have been overused for annual row crops, such as corn, on suboptimal sites. The extensive root system of these plants enhances the structure of the soil and increases its organic content. Since tilling occurs infrequently, the soil suffers little physical damage and erosion is significantly reduced [46].

3.4. Wetlands, Hydric, and Non-Hydric Soils

Areas designated as wetlands cannot be considered as potential sites for aspen, northern hardwood restoration or other woody biomass crops. Part 303 of Michigan’s wetland statute, Wetlands Protection, of the Natural Resources and Environmental Protection Act, 1994 PA 451, as amended, provides a legal definition for wetlands, i.e., “land characterized by the presence of water at a frequency and duration sufficient to support, and that under normal circumstances does support, wetland vegetation or aquatic life, and is commonly referred to as a bog, swamp, or marsh” [47]. This legal definition of wetlands applies to public and private lands regardless of zoning or ownership. Fifty-three percent of the UP portion of the study area and 37% of the LP portion of the study area are designated as wetlands by the NWI. As expected, they contain a small proportion of the aspen and northern hardwood stands in the study area (~110,700 ha in the UP portion of the study area, and ~80,500 ha in the LP portion of the study area. Likewise, the amount of aspen and northern hardwood forests on hydric soils not mapped as wetlands is insignificant. Stands located on hydric soils have often been ditched to improve drainage. Approximiately 87% of aspen and northern hardwood in the UP study area and 94% in the LP study area are located on non-hydric soils (Figure 6).
Figure 6. Aspen and northern hardwoods stand on hydric and non-hydric soils.
Land 04 00413 g006

3.5. Soil Suitability Characteristics for Aspen and Northern Hardwoods Stands

The soils component forest productivity table (coforprod) provides guidance to suitable areas for woody biomass plantings and/or aspen/northern hardwood restoration regardless of current land use/cover. The table ranks soil suitability for aspen/northern hardwood plantings into four groups (good, fair, poor, and very poor). A rating of good requires the least cost and effort for successful establishment; whereas a rating of fair means that planting or restoration activities can be established with some management and cost. A rating of poor indicates establishment may be successful in most places subject to continuous and intensive management practices. Very poor areas are unlikely to support plantings despite intensive management [48]. Most current aspen and northern hardwoods stands are located on good or fair soils.
In order to provide further insight about potential restoration areas with reference to hydric and non-hydric soils, present day soils are intersected with the pre-European settlement land cover. This is done to obtain a rough estimate of the number of hectares of aspen and northern hardwoods located on hydric and non-hydric soils. Assuming the areal extent of the present-day hydric and non-hydric soil types is representative of soil conditions in the pre-European settlement era, it was found that ~14% of the pre-European settlement aspen and northern hardwood forests in the UP study area were growing on hydric soils and about 84% were on non-hydric soils. In the LP study area, about 7% of the aspen and northern hardwood forests were located on hydric soils, and ~91% were on non-hydric soils. Of the present-day aspen and northern hardwood forests, which are significantly less abundant as compared with pre-European settlement era, ~12% are on hydric soils and ~87% on non- hydric soils in the UP study area, and ~6% on hydric soils and ~93% on non-hydric in the LP study area.
Potential restoration areas, obtained by comparing pre-European land cover and IFMAP land cover 2001, are also located in good and fair soil types as shown in Section 3.8. This suggests that aspen and northern hardwood restoration for woody feedstock production can be satisfactorily accomplished without intensive land management and associated costs.

3.6. Ownerships

The study area includes private land ownership (nonindustrial private, timber management organizations, real estate trusts, and industrial forest) as well as federal (e.g., national forests, wildlife refuges, national parks and military installations), state (parks, forests and wildlife areas), and Native American lands. For purposes of this study, these ownerships were divided into two broad categories: potential, or restricted for aspen and northern hardwood expansion and restoration. Areas already designated for timber production include national and state forests. National forest ownership covers 24% of the UP portion of the study area and 11% of the LP portion of the study area. Approximately 26% of the aspen and 8% of the northern hardwood forests are located on federal lands. State forests cover 24% of the UP and 22% of the LP portions of the area, and include 31% of the total aspen and northern hardwoods. Around 52% of the timberland, over 1.7 million ha, is in private ownership [48].
Restricted areas are where access is limited or prohibited due to management practices or ownership, including national and state parks, military installations, wildlife refuges, and Native American owned land. Pictured Rocks National Park (~1% of the UP study area) is an example of a restricted area within the study area; it includes ~1.4% of the total aspen and northern hardwood. A small proportion of aspen and northern hardwood in the UP and LP study areas (~1.2%) are located within military installations, which encompass about 1.1% of the study area. Wildlife refuges take ~1.3% of the study area, and include <0.2% of aspen and northern hardwoods. Native American Lands cover an insignificant area (~0.1%). In total, ~2.7% of the study area is designated restricted, comprising ~2% of the area’s total aspen and northern hardwoods. Table 6 summarizes the area of restricted lands and the area of aspen and northern hardwoods within them.
Table 6. Non-accessible lands in the study area and their corresponding amount of aspen and northern hardwood associations in 2001.
Non-Accessible LandPercent of Study Area (%)Percent of Total ASP and NHW (%)ASP and NHW Area
(ha)(ac)
Pictured Rocks National Park1.01.417,55743,384
Military Installation1.10.7877821,692
Wildlife Refuge0.5<0.1<1254<3099
Native American Land0.1insignificant
Timber harvesting studies [49] show that the vast majority of timber currently harvested within the study area comes from private lands designated as timber management organizations, real estate trusts, or industrial forests. Forests in this part of Michigan contribute significantly to the regional economy, largely through the forest products industries and tourism [50]. One significant trend has been the sale of forest industry lands to various types of investors. Many of these lands continue to be managed for timber production and are enrolled in the Commercial Forest Program. In some cases, the former owners enter into long-term timber supply agreements with the new landowners. Regarding land sales, there are concerns that some of the lands owned by investors may be sold for “higher and better uses”. However, in the short term, it is unlikely that sales will have a significant impact of timber supplies.
To identify potential aspen and northern hardwood expansion sites within national and state forests, boundaries of these areas were overlaid on the pre-European land cover. About 784,000 and 1,450,000 ha of aspen and northern hardwoods, respectively, are located within these two owerships. This breaks down to 27% of the total stands in the UP portion of the study and 7% in LP portion of the study area. Also, 18% of the potential expansion sites in the UP portion the study area, and 17% in the LP portion of the study area are located within state managed lands. A small proportion of aspen and northern hardwood forests are located inside wildlife refuges (~2%) and military installation lands (~0.1%) in the study area. The results of this analysis suggest a 28% decrease in the aspen and northern hardwood in the UP study area, and a 43% decrease in the LP study area when compared with the IFMAP data. This comparison explicitly shows where areas are located for increased aspen and northern hardwood expansion or other woody biomass crops as well as providing information on the potential for creating wildlife corridors and providing tracts of contiguous habitat for threatened and endangered flora and fauna.

3.7. Aspen and Northern Hardwoods Proximity to the Primary and Secondary Existing Road Network

A forest stand’s proximity to a road, along with its ownership, impacts its accessibility. Figure 7 shows the distribution of IFMAP aspen and northern hardwoods stands within incremental distance buffers from the primary and secondary road network and whether the soil types are hydric or non-hydric soils. The analysis shows most of the aspen (>175,000 ha) and northern hardwoods (>372,000 ha) are available within 0.25 mile of primary or secondary roads. The number of stands sharply declines as distance from the road network increases (Figure 7) [51], indicating a well-developed road network exists throughout the study area.
Figure 7. Present-day aspen and northern hardwoods area proximity to primary or secondary roads in the UP (a) and LP (b).
Land 04 00413 g007
Pre-European settlement aspen and northern hardwood stand locations and their extent assist in identifying potential areas for restoration and management to meet BMP and other management guidelines. To identify these areas with convenient road access, the present-day road network incremental buffers are overlaid with the pre-European settlement land cover, and changes in the amount of aspen and northern hardwood forests are calculated. The results indicate significant potential aspen and northern hardwood expansion areas exist within 1.5 miles of a primary or secondary road in the UP portion of the study area (Figure 8), and within 0.75 miles in the LP portion of the study area.
Figure 8. Pre-European settlement aspen and northern hardwoods proximity to primary or secondary roads in the UP (a) and LP (b). Good, fair, and poor denote soil suitability for aspen/northern hardwood plantings.
Land 04 00413 g008

3.8. Potential Restoration Feedstock Sites Meeting Analysis Criteria

Table 7 presents a summary of the total extent of potential restoration sites in the study area. These recommended restoration areas are in close vicinity of the existing road network. The recommended sites in the UP and LP study area are mostly located within 0.4 km of primary and secondary roads (Figure 9).
Table 7. Incremental aspen and northern hardwood located within eight kilometers of the road network in the recommended restoration sites (ha) in the eastern half of the UP and northern half of the LP study area.
Distance From Roads (km)LP (ha)LP (ac)UP (ha)UP (ac)
0.4301,931827,59377,647212,830
0.893,338255,84035,34096,867
1.222,51361,70820,00954,845
1.6902024,72413,11135,937
2.4540414,81215,18741,628
3.220945740729119,985
4.821365855614416,841
6.41995459632640
8.0383801042
Total436,6381,196,825176,072482,615
Figure 9. Potential aspen and northern hardwood expansion areas meeting the criteria of soils, land ownership, and proximity to roads.
Land 04 00413 g009

4. Discussion

Site availability assessment is the first step in sustainable feedstock planning for bioenergy production, which should be complemented with techno-economic feasibility analysis of bioenergy conversion technologies [20] and socio-ecological aspects of biomass resources management [52].
Two critical questions are: where are existing feedstock sources located and where were the historical sites of these sources? Herein, we presented a GIS-based spatial analysis procedure to identify where current apen and northern hardwoods stands that can be used for bioenergy production are located in a Michigan study area while determining potential sites for future feedstock development based on pre-European settelement vegetation data, representing undisturbed land cover.
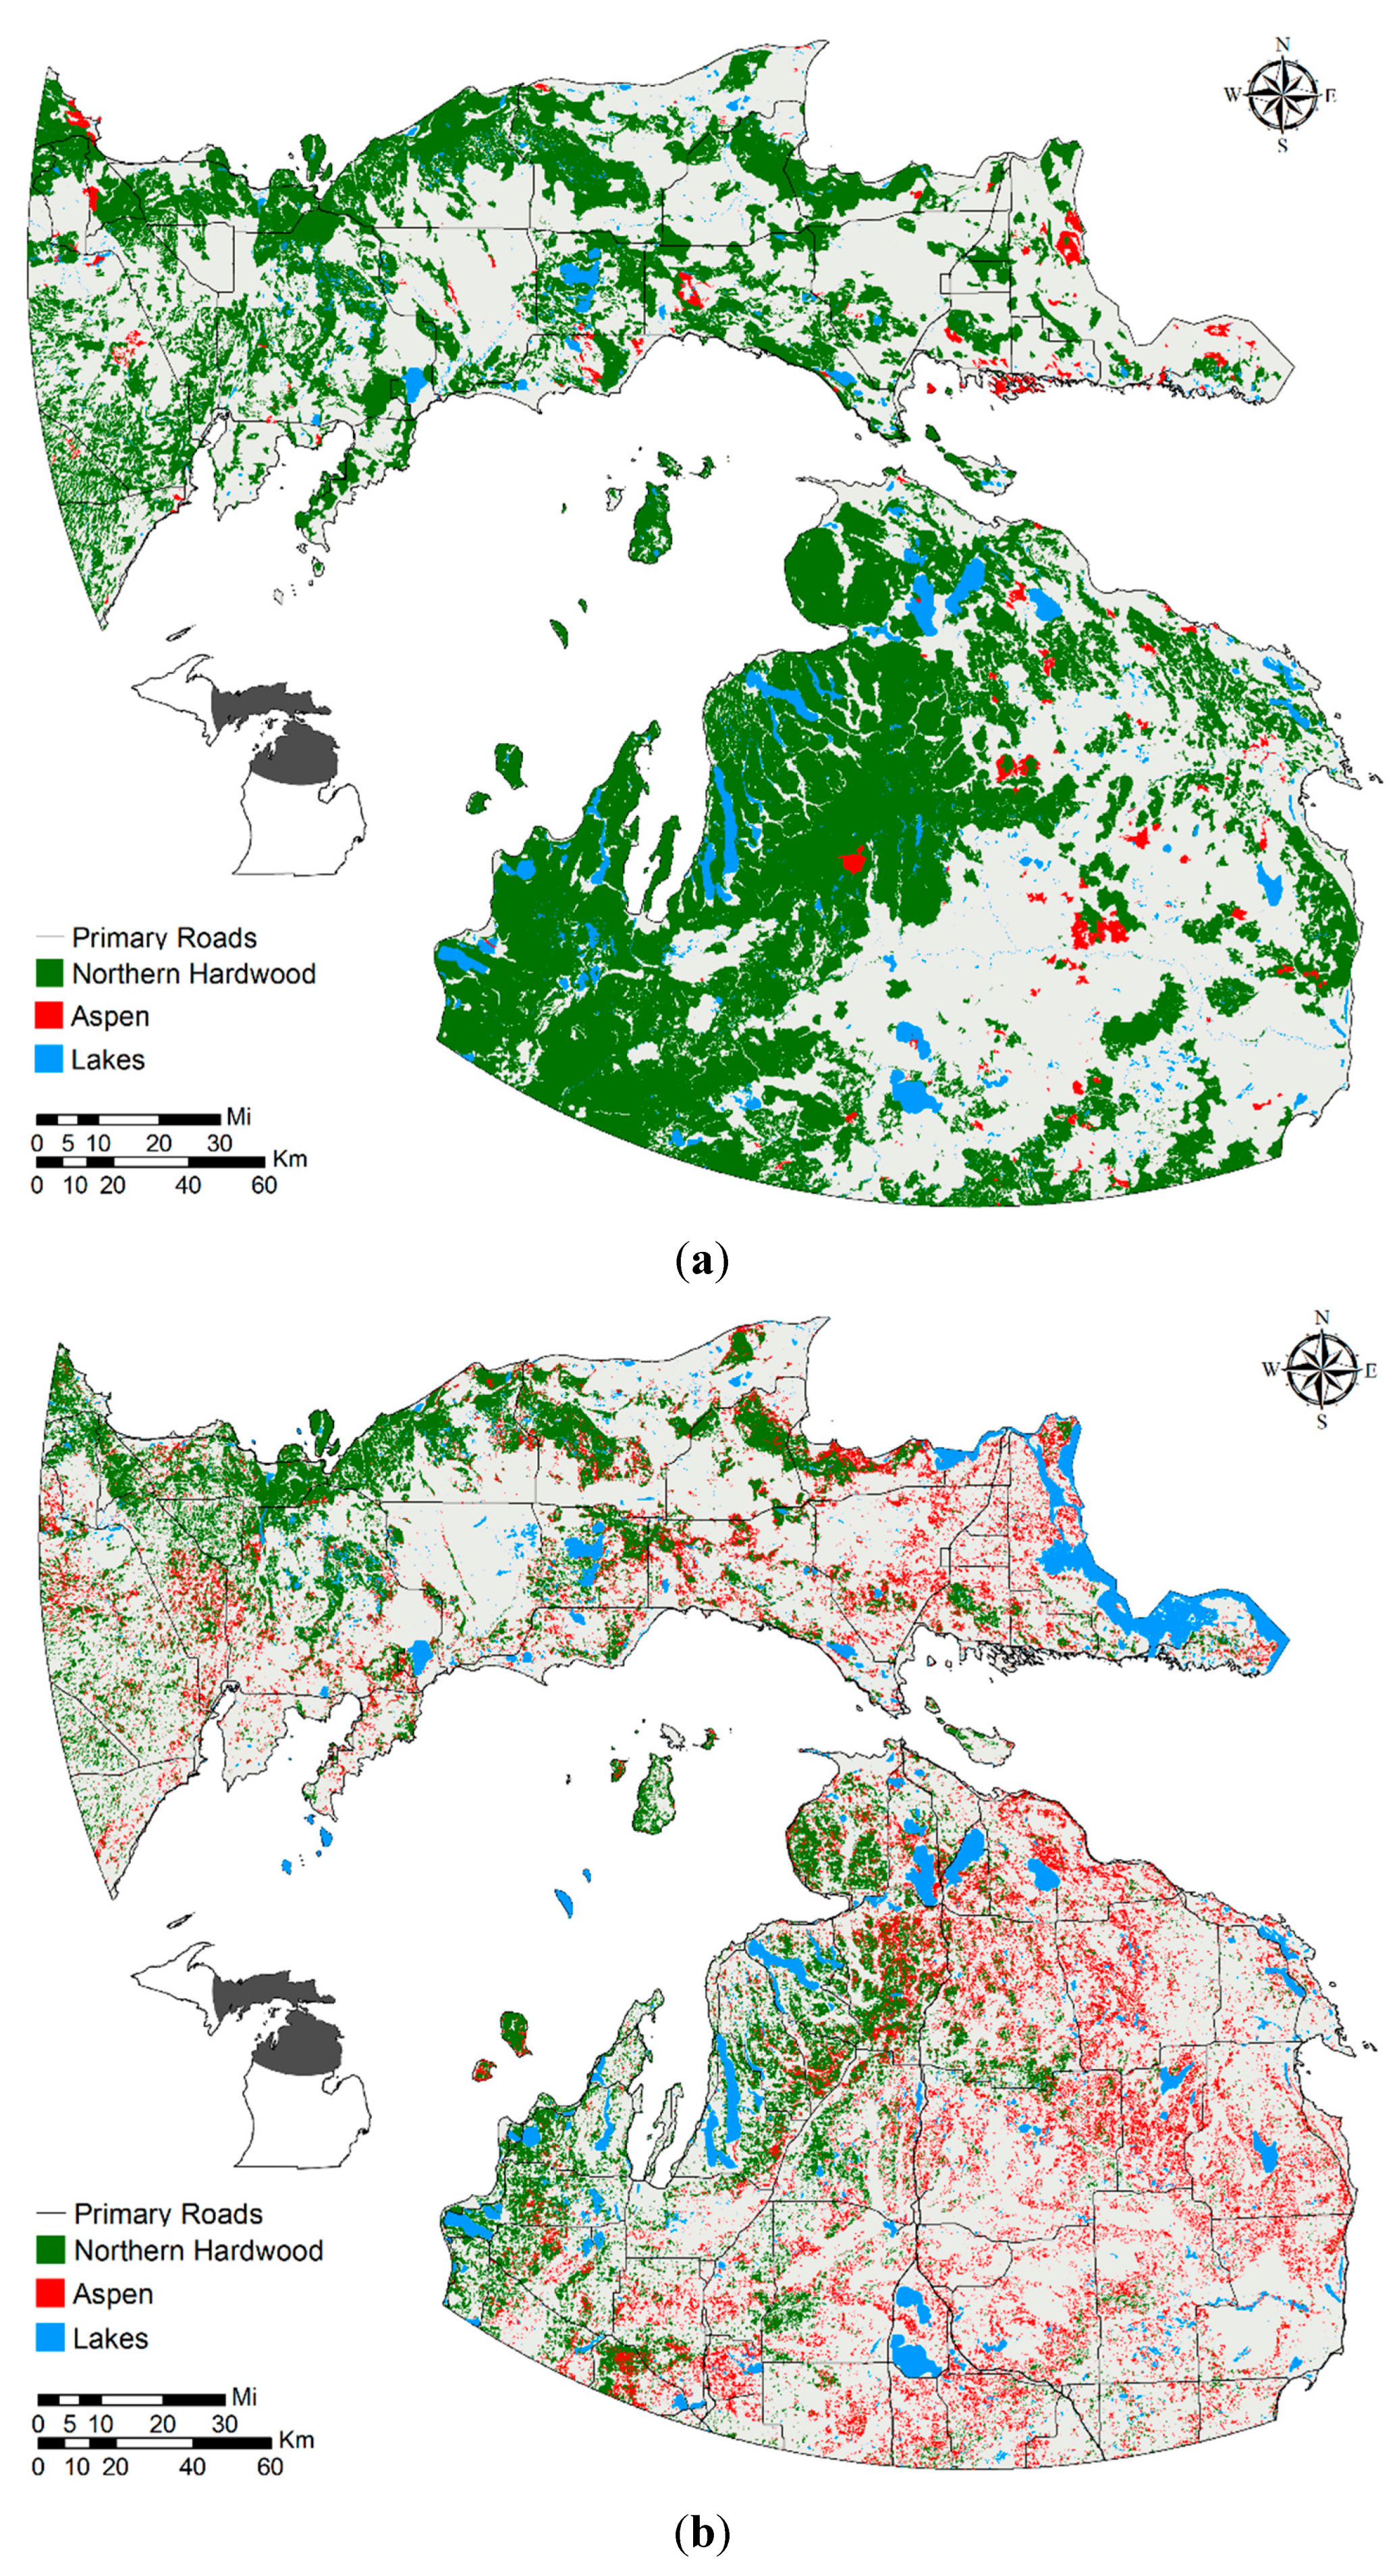
A significant amount of aspen and northern hardwoods has been converted to other land use and cover types since European settlement, and the scattering of aspen stands has increased. Furthermore, a significant amount of woody biomass is available in close vicinity of the existing road network, which can be effectively used as feedstock in the future.
Sustainability of timber supply under a scenario of increased harvest levels requires both site- and landscape-level considerations. While large landowners such as state, national forests, and large private commercial forests have effective resource planning methods, private lands owned by individuals or families often lack management plans and harvests across many private owners are uncoordinated. Hence, one of the next questions which needs to be addressed is evaluating stands located on private nonindustrial lands and working with these private landowners. Family forests account for 8.96 million acres in Michigan. Most family forests are less than 200 acres in size, with over half of them in parcels of 1 to 9 acres [49]. It is likely that owners within the study have more lands skewed toward larger ownerships on average than statewide totals. Further, the owners are more likely to harvest timber due to more active timber markets and a culture more attuned to harvesting.
Previous applications of GIS in feedstock planning have not incorporated natural condition or undisturbed vegetation data to ascertain potential sites for feedstock source development or to implement Best Management Practices. The presented procedure can be exported to other study sites in the United States for application using spatial datasets available from federal and state GIS clearinghouses. Likewise, the approach can be applied in other countries where similar datsets of soils, road accessibility, land ownership, and natural vegetation conditions can be compiled to support feedstock development and vegetation restoration decisions.

5. Conclusions

Instability of production and the price of oil, as well as environmental concerns such as anthropogenic climate change necessitate efforts for expanding the global energy mix and increasing sustainable energy sources. The need for expanding biofuel production is increasing as the world prepares to diversify the global energy mix to increase security and sustainability of energy production. The Americas produce a large share of the world’s biofuel. The state of Michigan, with its vast feedstock sources hybrid poplar and hybrid willow (Populus spp.) is an area where biofuel production can be expanded. However, availability of sufficient feedstock sources and the potential for long-term feedstock production needs to be characterized to ensure long term feedstock supplies without environmental degradation. Understanding the spatial distribution of the current feedstock sources, in terms of area, soil characteristics, accessibility from roads and land ownership, is important for long-term feedstock production.
The study provides a spatial analysis procedure which identifies where current and potential stands are located. A GIS was developed to compile present day (2001) and pre-European settlement (circa. 1830s) land use/cover, soils, road infrastructure, and ownership data for the eastern part the UP and northern part of the LP. The land use change between pre-European settlement and 2001 was characterized, and suitable areas for aspen, northern hardwood or other woody biomass development were identified with respect to soil condition, land ownership, and proximity to roads. The results suggest a significant conversion of northern hardwoods to other land use/cover types since European settlement, and an increase in the scattering of aspen stands. The insights from this work provide a basis for expanding woody feedstock sources in the in the study area.
Significant increases in timber production beyond current or historic levels will likely raise questions about long-term sustainability of wood supplies, and protection of non-timber resources. Coordinated efforts among public and private interests to establish guidance on sustainable management will be needed if industrial wood utilization is increased.

Acknowledgments

The first author aknowledges partial funding from Michigan Technological University’s School of Forest Resources and Environmental Science. The authors appreciate the comments from three anonymous reviewers. All opinions, findings, conclusions, and recommendations expressed in this material are solely those of the authors.

Author Contributions

The study plan was initiated by A.M. Data collection and analyses was carried out by S.A. Results were evaluated by S.A. and A.M. Manuscript was written by S.A. and edited by A.M. The order of authors indicates contribution from each author.

Conflicts of Interest

The authors declare no conflict of interest.

References

  1. World Energy Council (WEC). 2010 Survey of Energy Resources; WEC: London, UK, 2010; Available online: http://www.worldenergy.org/documents/ser_2010_report_1.pdf (accessed on 12 June 2014).
  2. Sorrell, S.; Miller, R.; Bentley, R.; Speirs, J. Oil futures: A comparison of global supply forecasts. Energy Policy 2010, 38, 4990–5003. [Google Scholar] [CrossRef]
  3. Bartle, J.R.; Abadi, A. Toward sustainable production of second generation bioenergy feedstocks. Energy Fuels 2010, 24, 2–9. [Google Scholar] [CrossRef]
  4. Mirchi, A.; Hadian, S.; Madani, K.; Rouhani, O.M.; Rouhani, A.M. World energy balance outlook and OPEC production capacity: Implications for global oil security. Energies 2012, 5, 2626–2651. [Google Scholar] [CrossRef]
  5. Scharlemann, J.P.W.; Laurance, W.F. How green are biofuels? Science 2008, 319, 43–44. [Google Scholar] [CrossRef] [PubMed]
  6. Intergovernmental Panel on Climate Change (IPCC). Climate Change 2001: Scientific Basis; Contribution of Working Group III to the Third Assessment Report of the Intergovernmental Panel on Climate Change, Houghton, J.T., Griggs, D.J., Noguer, M., van der Linden, P.J., Dai, X., Maskell, K., Johnson, C.A., Eds.; Cambridge University Press: New York, NY, USA, 2001. [Google Scholar]
  7. McKendry, P. Energy production from biomass (Part 2): Conversion technologies. Bioresour. Technol. 2002, 83, 47–54. [Google Scholar] [CrossRef] [PubMed]
  8. Hill, J.; Nelson, E.; Tilman, D.; Polasky, S.; Tiffany, D. Environmental, economic, and energetic costs and benefits of biodiesel and ethanol biofuels. Proc. Natl. Acad. Sci. USA 2006, 103, 11206–11210. [Google Scholar] [CrossRef] [PubMed]
  9. Tilman, D.; Socolow, R.; Foley, J.A.; Hill, J.; Larson, E.; Lynd, L.; Pacala, S.; Reilly, J.; Searchinger, T.; Somerville, C.; et al. Beneficial biofuels—The food, energy, and environment trilemma. Science 2009, 325, 270–271. [Google Scholar] [CrossRef] [PubMed]
  10. International Energy Agency (IEA). World Energy Outlook 2010; IEA: Paris, France, 2010; Available online: http://www.iea.org/textbase/npsum/weo2010sum.pdf (accessed on 19 January 2013).
  11. Solomon, B.D.; Barnes, J.R.; Halvorsen, K.E. Grain and cellulosic ethanol: History, economics, and energy policy. Biomass Bioenergy 2007, 31, 416–425. [Google Scholar] [CrossRef]
  12. Simpkins, D.; Allard, N.; Patrick, J. Clean Energy from Wood Residues in Michigan, Michigan Biomass Energy Program; Department of Labor & Economic Growth: Lansing, MI, USA, 2006. Available online: http://www.michigan.gov/documents/wood_energy_in_michigan--final1_169999_7.pdf (accessed on 19 January 2013).
  13. British Petroleum (BP). BP Statistical Review of World Energy 2011; BP: London, UK, 2011; Available online: http://www.bp.com/sectionbodycopy.do?categoryId=7500&contentId=7068481 (accessed on 25 November 2012).
  14. Zhang, Y.; McKechnie, J.; Cormier, D.; Lyng, R.; Mabee, W.; Ogino, A.; MacLean, H.L. Life cycle emissions and cost of producing electricity from coal, natural gas, and wood pellets in Ontario, Canada. Environ. Sci. Technol. 2010, 44, 538–544. [Google Scholar] [CrossRef] [PubMed]
  15. Mckechnie, J.; Colombo, S.; Chen, J.; Mabee, W.; Maclean, H. Forest bioenergy or forest carbon? Assessing trade-offs in greenhouse gas mitigation with woodbased fuels. Environ. Sci. Technol. 2011, 45, 789–795. [Google Scholar] [CrossRef] [PubMed]
  16. Perlack, R.D.; Wright, L.L.; Turhollow, A.F.; Graham, R.L.; Stokes, B.J.; Erbach, D.C. US Billion-Ton Update: Biomass Supply for a Bioenergy and Bioproducts Industry; Oak Ridge National Lab: TN, USA, 2005; Available online: http://www.dtic.mil/dtic/tr/fulltext/u2/a436753.pdf (accessed on 26 February 2015).
  17. Alig Ralph, J.; Plantinga, A.J.; Ahn, S.; Kline, J.D. Land Use Changes Involving Forestry in the United States: 1952 to 1997, with Projections to 2050. USDA. 2003. Available online: http://www.uvm.edu/cosmolab/papers/Alig_2003_4051.pdf (accessed on 26 February 2015).
  18. Johnson, D.M.; Johnson, M.A.; Zhang, F. Final Report for Forestry Biofuel Statewide Collaboration Center (FBSCC)—Subtask b4: Extended Supply Chain Model and Assess Economic Business Viability Project; Biofuel Statewide Collaboration Center, Michigan Technological University, Sustainable Futures Institute (SFI): Houghton, MI, USA, 2011; Available online: http://www.michiganforestbiofuels.org/sites/default/files/FBSCC%20Task%20B4%20Final%20Report.pdf (accessed on 13 June 2014).
  19. Domínguez, J.; Amador, J. Geographical information systems applied in the field of renewable energy sources. Comput. Ind. Eng. 2007, 52, 322–326. [Google Scholar] [CrossRef]
  20. Calvert, K. Geomatics and bioenergy feasibility assessments: Taking stock and looking forward. Renew. Sustain. Energy Rev. 2011, 15, 1117–1124. [Google Scholar] [CrossRef]
  21. Voivontas, D.; Assimacopoulos, D.; Koukios, E.G. Assessment of biomass potential for power production: A GIS based method. Biomass Bioenergy 2001, 20, 101–112. [Google Scholar] [CrossRef]
  22. Beccali, M.; Columba, P.; D’Alberti, V.; Franzitta, V. Assessment of bioenergy potential in Sicily: A GIS-based support methodology. Biomass Bioenergy 2009, 33, 79–87. [Google Scholar] [CrossRef]
  23. Zhang, F.; Johnson, D.M.; Sutherland, J.W. A GIS-based method for identifying the optimal location for a facility to convert forest biomass to biofuel. Biomass Bioenergy 2011, 35, 3951–3961. [Google Scholar]
  24. Fernandes, U.; Costa, M. Potential of biomass residues for energy production and utilization in a region of Portugal. Biomass Bioenergy 2010, 34, 661–666. [Google Scholar] [CrossRef]
  25. Viana, H.; Cohen, B.W.; Lopes, D.; Aranha, J. Assessment of forest biomass for use as energy. GIS-based analysis of geographical availability and locations of woodfired power plants in Portugal. Appl. Energy 2010, 87, 2551–2560. [Google Scholar] [CrossRef]
  26. Graham, R.L.; English, B.C.; Noon, C.E. A geographic information system-based modeling system for evaluating the cost of delivered energy crop feedstock. Biomass Bioenergy 2000, 18, 309–329. [Google Scholar] [CrossRef]
  27. Ranta, T. Logging residues from regeneration fellings for biofuel production—A GIS-based availability analysis in Finland. Biomass Bioenergy 2005, 28, 171–182. [Google Scholar] [CrossRef]
  28. Panichelli, L.; Gnansounou, E. GIS-based approach for defining bioenergy facilities location: A case study in northern Spain based on marginal delivery costs and resources competition between facilities. Biomass Bioenergy 2008, 32, 289–300. [Google Scholar] [CrossRef]
  29. Shi, X.; Elmore, A.; Li, X.; Gorence, N.J.; Jin, H.; Zhang, X.; Wang, F. Using spatial information technologies to select sites for biomass power plants: A case study in Guangdong Province, China. Biomass Bioenergy 2008, 32, 35–43. [Google Scholar] [CrossRef]
  30. Haddad, M.A.; Anderson, P.F. A GIS methodology to identify potential corn stover collection locations. Biomass Bioenergy 2008, 32, 1097–1108. [Google Scholar] [CrossRef]
  31. Yoshioka, T.; Sakurai, R.; Aruga, K.; Sakai, H.; Kobayashi, H. A GIS-based analysis on the relationship between the annual available amount and the procurement cost of forest biomass in a mountainous region in Japan. Biomass Bioenergy 2011, 35, 4530–4537. [Google Scholar] [CrossRef]
  32. Hicks, J. Modeling the Multi-Modal Transport of Logs and the Effects of Changing Fuel Prices. Master’s Thesis, Michigan Technological University, Houghton, MI, USA, 2009. [Google Scholar]
  33. Michigan Department of Technology, Management, and Budget (DTMB), Center for Shared Solutions, Michigan Geographic Data Library. Available online: http://www.michigan.gov/cgi/0,4548,7-158-52927_53037_12693---,00.html (accessed on 3 July 2013).
  34. United States Department of Agriculture National Agriculture Statistics Service (USDANASS). Available online: http://www.nass.usda.gov/research/Cropland/metadata/meta.htm (accessed on 10 March 2013).
  35. Geospatial Data Gateway. Available online: http://datagateway.nrcs.usda.gov/ (accessed on 12 June 2014).
  36. United States Fish and Wildlife Service, National Wetland Inventory (NWI). Available online: http://www.fws.gov/wetlands/Data/Mapper.html (accessed on 10 January 2013).
  37. The National Atlas. Available online: http://nationalmap.gov/small_scale/atlasftp.html (accessed on 23 January 2013).
  38. Cole, K.L.; Davis, M.B.; Stearns, F.; Guntenspergen, G.; Walker, K. Historical Landcover Changes in the Great Lakes Region; US Geological Survey (USGS), Biological Resources Division: Fort Collins, CO, USA, 1998. Available online: http://landcover.usgs.gov/luhna/chap6.php (accessed on 17 April 2015).
  39. Michigan Department of Natural Resources, Michigan’s Vegetation Circa. 1800. Available online: http://www.michigan.gov/dnr/0,4570,7-153-10370_12142-70465--,00.html (accessed on 17 April 2015).
  40. Graham, S.A.; Harrison, R.P., Jr.; Westell, C.E., Jr. Aspens: Phoenix Trees of the Great Lakes Region; University of Michigan Press: Ann Arbor, MI, USA, 1963; p. 272. [Google Scholar]
  41. Gustafson, E.J.; Lietz, S.M.; Wright, J.L. Predicting the spatial distribution of aspen growth potential in the upper Great Lakes region. For. Sci. 2003, 49, 499–508. [Google Scholar]
  42. Michigan Natural Features Inventory, Northern Hardwood Swamp. Available online: http://mnfi.anr.msu.edu/abstracts/ecology/Northern_hardwood_swamp.pdf (accessed on 17 April 2015).
  43. U.S. Department of Commerce (US DOC). TIGER/Line Shapefile, 2010, State, Connecticut, Primary and Secondary Roads State-Based Shapefile; U.S. Census Bureau, Geography Division, Geographic Products Branch: Washington, DC, USA, 2011. Available online: http://magic.lib.uconn.edu/magic_2/vector/37800/PrimarySecondaryroadct_37800_0000_2010_s100_census_1_t.htm#7 (accessed on 15 June 2013).
  44. Page-Dumroese, D.S.; Jurgensen, M.; Terry, T. Maintaining soil productivity during forest or biomass-to-energy thinning harvests in the western United States. West. J. Appl. For. 2010, 25, 5–11. [Google Scholar]
  45. Froese, R.; Michigan Technological University, Houghton , MI, USA. Personal communication, 2015.
  46. Daniel, G.; Walsh, M.E.; Shapouri, H.; Slinsky, S.P. The Economic Impacts of Bioenergy Crop Production on US Agriculture, 2003. USDA, Agricultural Economic Report No. 816. Available online: https://bioenergy.ornl.gov/papers/wagin/index.html (accessed on 26 February 2015).
  47. Department of Environmental Quality, State and Federal Wetland Regulations. Available online: http://www.michigan.gov/deq/0,4561,7-135-3313_3687-10801--,00.html (accessed on 26 February 2015).
  48. Natural Resources Conservation Service, United States Department of Agriculture. Web Soil Survey. Available online: http://www.nrcs.usda.gov/wps/portal/nrcs/detail/national/nedc/training/soil/?cid=nrcs142p2_053631 (accessed on 15 February 2015).
  49. Leefers, L.A.; Vasievich, J.M. Timber Resources and Factors Affecting Timber Availability and Sustainability for Kinross, Michigan; Report Prepared for the Feedstock Supply Chain Center of Energy Excellence; Kinross Project 2 Report, Version 3.0; Michigan State University, Department of Forestry: East Lansing, MI, USA, 2010; p. 55. [Google Scholar]
  50. Froese, R.E.; Hyslop, M.D.; Miller, C.A.; Garmon, B.; McDiarmid, H.; Shaw, A., Jr.; Leefers, L.; Lorenzo, M.; Brown, S.; Shy, M.; et al. Large-Tract Forestland Ownership Change: Land Use, Conservation, and Prosperity in Michigan’s Upper Peninsula; National Wildlife Federation: Ann Arbor, MI, USA, 2007; p. 54. [Google Scholar]
  51. Alian, S. Assessment of Aspen and Northern Hardwood Availability in Thirty Three Counties of Upper/Lower Michigan. Master’s Thesis, Michigan Technological University, Houghton, MI, USA, 2013. [Google Scholar]
  52. Calvert, K.; Mabee, W. Spatial analysis of biomass resources within a socio-ecologically heterogeneous region: Identifying opportunities for a mixed feedstock stream. ISPRS Int. J. Geo-Inf. 2014, 3, 209–232. [Google Scholar] [CrossRef]

