Article

Mapping Urban Transitions in the Greater Beirut Area Using Different Space Platforms

National Center for Remote Sensing, National Council for Scientific Research (CNRS), Riad al Soloh, 1107 2260 Beirut, Lebanon
*
Author to whom correspondence should be addressed.
Land 2014, 3(3), 941-956; https://doi.org/10.3390/land3030941
Submission received: 5 May 2014 / Revised: 16 July 2014 / Accepted: 22 July 2014 / Published: 4 August 2014

Abstract

:
A particular challenge for undertaking urbanization mapping of Beirut is the absence of a unified understanding of the city. Migration, informal settlements, a lack of urban planning, political corruption, as well as internal conflict have made this task even harder. The population in Lebanon is unevenly distributed among regions, where one third of the population resides in the Greater Beirut Area (GBA), whereas it occupies only 233 km2 (2% of Lebanon’s total area). The Greater Beirut Area is subject to pressures arising from population growth and economic expansion. This study aims to follow the evolution of urbanization from 1963 till 2005 by processing and interpreting topographical maps and satellite images acquired by different space platforms. Satellite imagery change analysis shows that average annual urban growth surpassed 1.8 km2∙yr−1. Actually, a variety of factors triggers urban growth in the GBA (i.e., transportation, public policies, economic activities and environmental variables). The logistic regression method has been applied to model future urban growth in the region of Greater Beirut. Consequently, an urban growth scenario map has been generated. To validate our results, we compared an urban map derived from RapidEye satellite acquired in 2010 to our model’s outcome of the same year. The output shows a satisfactory rate of success (~61%). This research aims to provide policy makers and urban planners in Lebanon an essential decision tool to support upcoming urban planning in this study area or in others major cities in Lebanon.

1. Introduction

Urban growth and population dynamics are among the most critical information needed for land use planning, natural resources allocation and environmental management [1]. Accelerated urban growth is usually associated with the population concentration in an area. Land use and land cover changes may have negative impacts on the ecology of the area, especially hydro-geomorphology and vegetation [2].
In Lebanon, statistical and spatial data are deficient. Remote sensing is cost effective and technologically sound; therefore, it is increasingly used for the analysis of the urban change and population size [1].
Beirut gained importance as a Levantine city in the mid-19th century. The growth of Beirut has been affected by the interplay of local and global forces and events. A period of strong growth took place between the independence of Lebanon in 1943 until to the civil war that began in 1975, from about 400,000 to 1.1 million inhabitants [3]. The Metropolitan Area of Greater Beirut continues to spread along the coast and the surrounding mountains, critically reducing the green space, the available open space and the rural character of these regions.
Several approaches have been addressed for urban change detection by using remotely sensed imagery [1,2,4,5,6]. Some studies try to understand this urban growth [7]. Others create simple mathematical models [8,9]. Meanwhile, using and developing logistic regression has grown in recent years [10,11,12]. Anyhow, methods based on image comparison are generally accurate. However, they suffer from the inability to provide detailed information on how urban land use/cover categories change [1].
Beirut has undergone several studies of urban growth, including studies conducted by the Observatory Research on Beirut that debate the urbanization in the Metropolitan Area of Greater Beirut [13,14,15]. These studies have mainly used the maps produced by IAURIF (Institute of Planning and Urbanism of the Ile-de-France) in their various studies conducted over Lebanon in 1984, 1986 and 1995 and with a scale of 1/50,000.
This study proposes the use of maps and satellite images of a high spatial resolution and on different dates to define the spatial boundary of the current urban area of Beirut and the extent of this urbanization. The intersection of urban dynamics with GIS layers will assist in identifying the physical conditions of this growth. The integration of this set of multi-date geographic data allows us to analyze the effect of urbanization in our study area. Accordingly, the project aims to achieve the following objectives: (1) provide a synoptic view of the study area; (2) identify urban morphologies at various times and detect the transformation of spatial urban configuration during four decades; (3) study the applicability of the logistic regression model to predict potential future trends of change.

2. Study Area

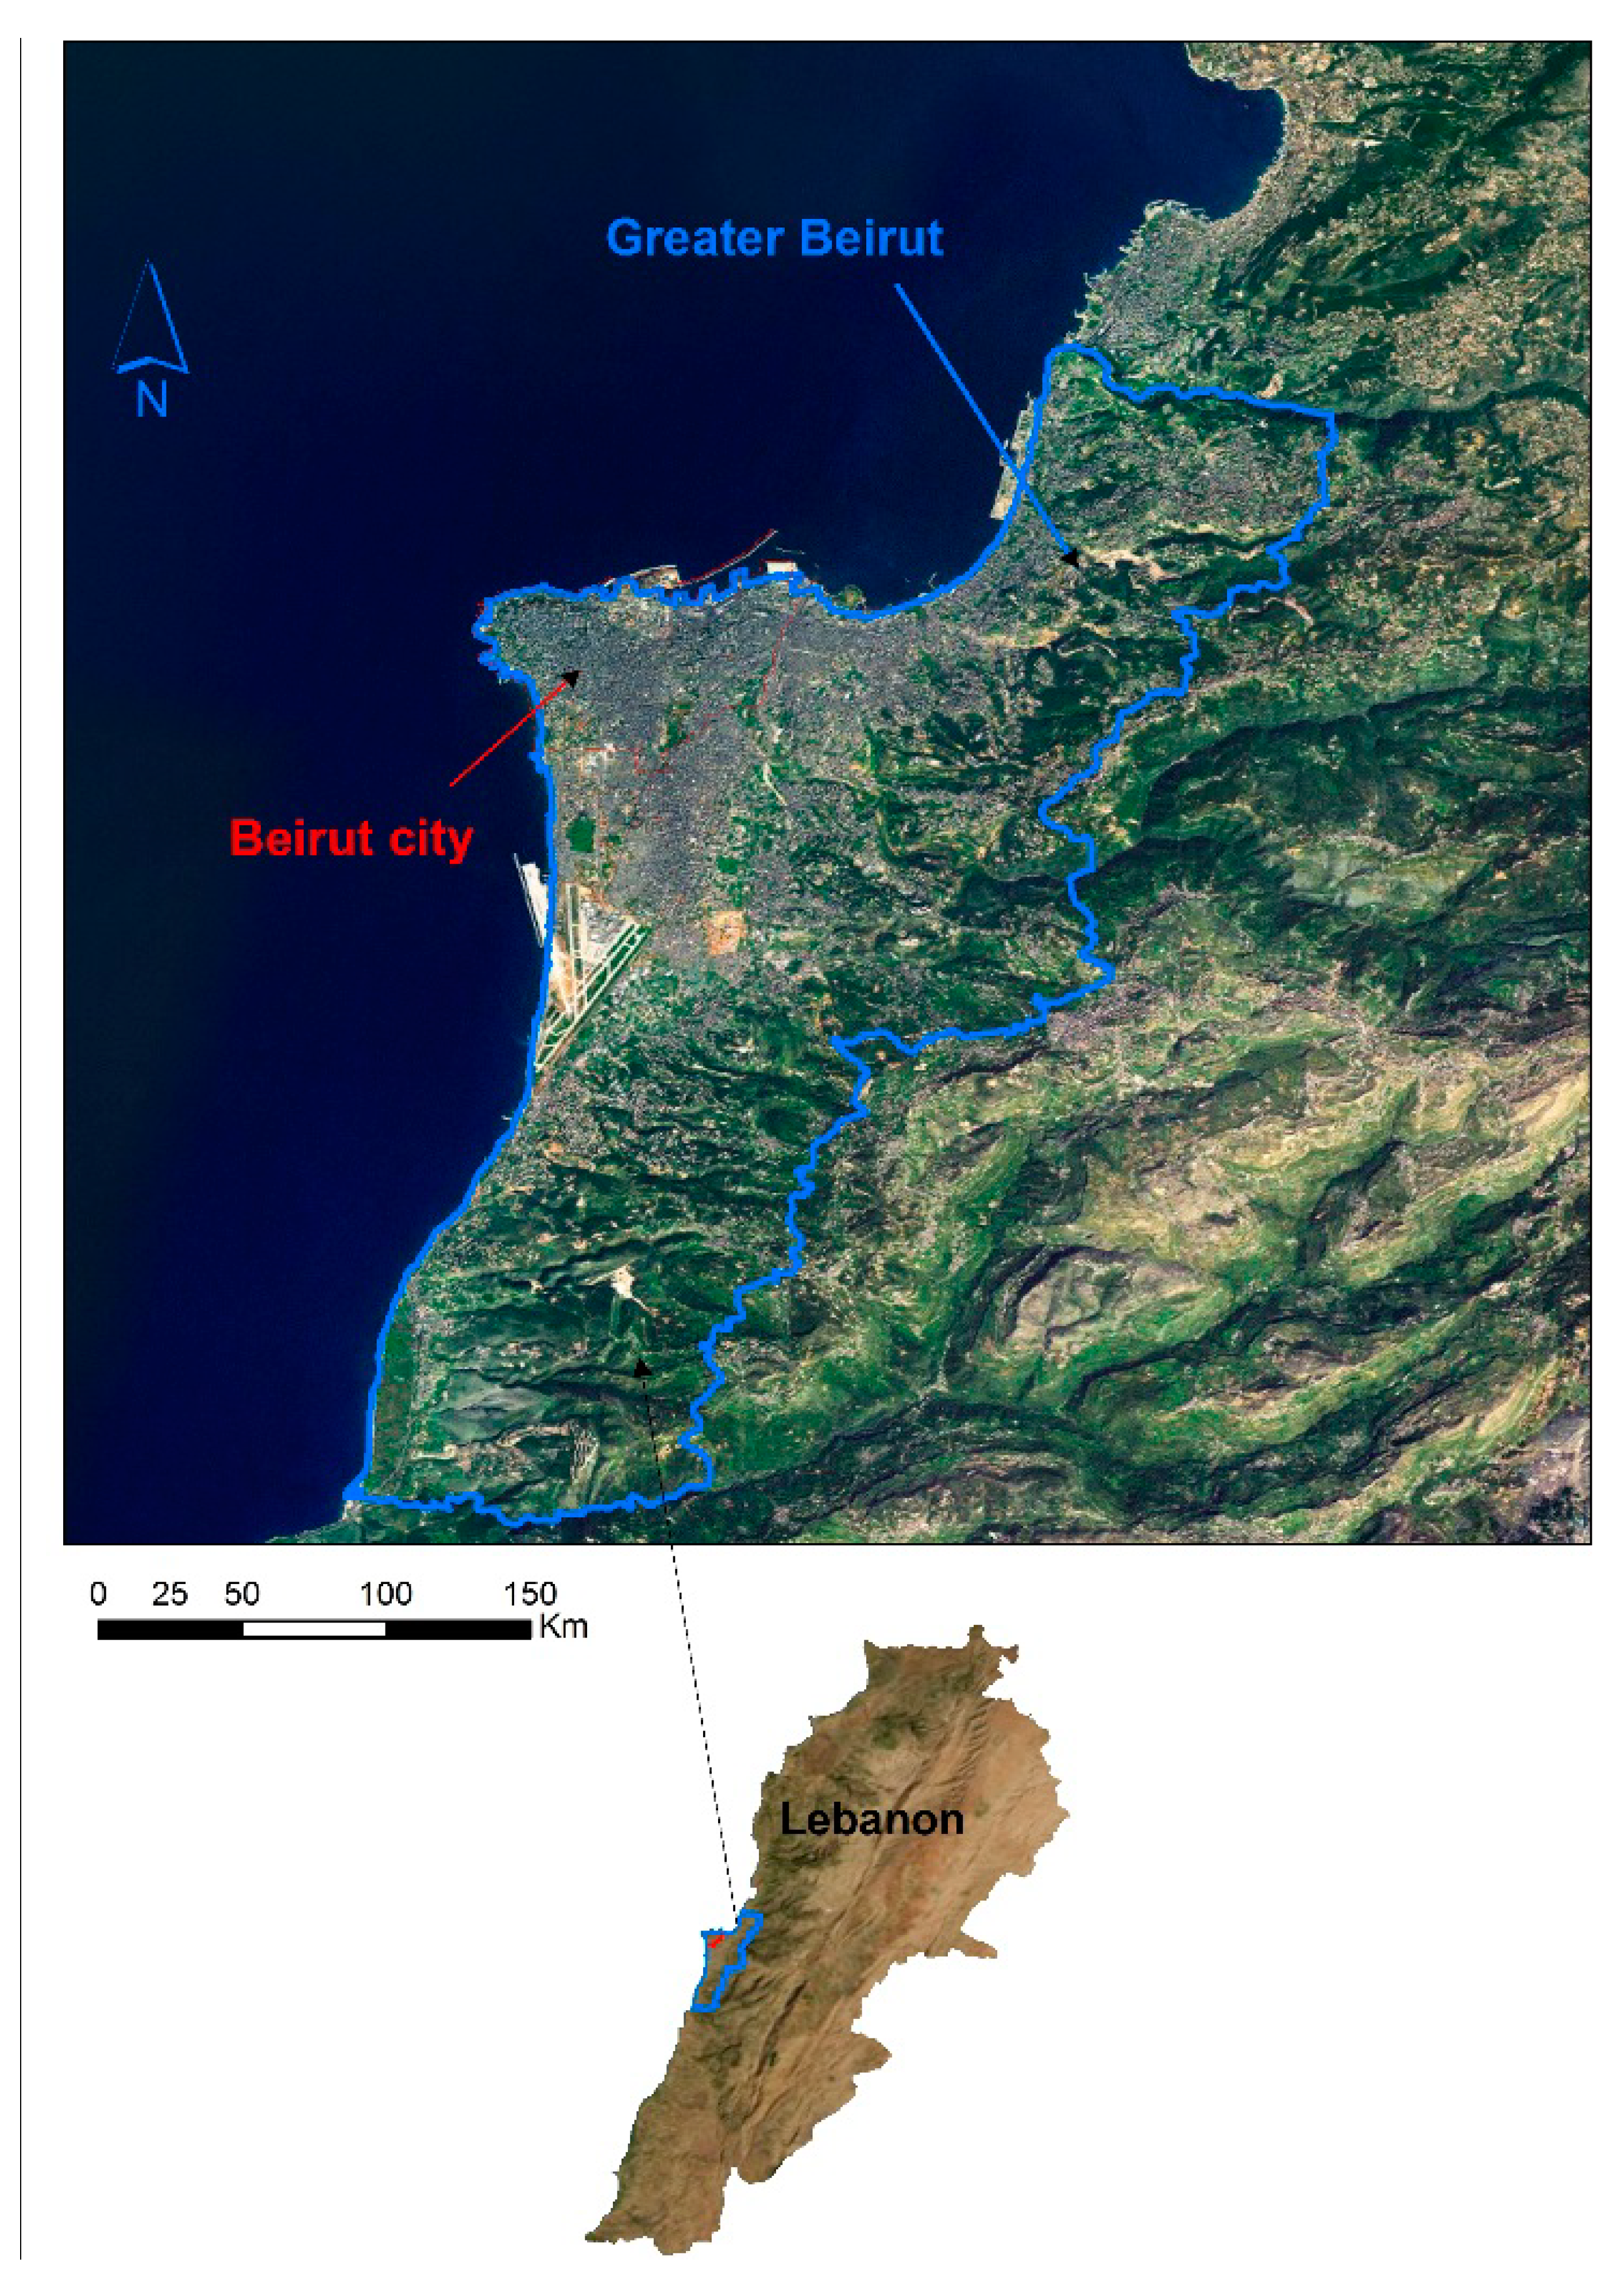
The capital of Lebanon since 1920 [16], Beirut and its suburbs (Figure 1) were inhabited with the population of 1.5 million people in 2001 with an average density of approximately 6200 inhabitants per km2 [3]. Beirut has long been considered, due to its strategic location, as a crossroads between the three continents (i.e., Asia, Africa and Europe). The destruction of the city center by the civil war has led to an intense urbanization of the north and south coast. Greatly affected by the war since 1975, Beirut is now trying to regain its important financial center role in the Middle East and in the Mediterranean.
Figure 1. Location of the Greater Beirut Area.
Land 03 00941 g001
The study area is located in the central coastal area of Lebanon. It covers an area of 233.2 km2, which corresponds to 2.2% of the Lebanese territory. It extends from the coastline to an altitude of 750 m. This area, which includes the administrative area of the city of Beirut and many part of the cazas of Metn, Baabda, Chouf and Aley (95 land districts and 50 municipalities), is constantly subjected to pressures arising from population growth and economic growth—42% of companies are located in the Greater Beirut Area [3]. However, this city does not follow any development program. Urban planning has always been established by considering short-term resolutions only. Consequently, this area has grown into an overwhelming urbanization, added to by the fact that future policies to predict, control and monitor this urban development are absent.

3. Methods

3.1. Spatial Database

Data were acquired from different sources: a topographic map (1/20,000) was prepared by the Directorate of Geographic Affairs (DAG) in 1963; Russian COSMOS KVR1000 images were acquired in 1994 by an analog sensor on a negative film and then scanned at high resolution for a spatial resolution of 2 m; Landsat satellite images were acquired in October 1998 by the multispectral TM (Thematic Mapper) with a spatial resolution of 30 m. These images were fused with panchromatic Indian Remote Sensing satellite (IRS-1C) in order to improve the spatial resolution (the final pixel size is 5 m); SPOT 5 satellite imagery have three scenes acquired in December, 2003, with a spatial resolution of 5 m; IKONOS satellite images were acquired in December, 2005, covering the whole territory by a multispectral sensor with a spatial resolution of 1 m; and RapidEye satellite images were acquired in September 2010, with a 5-m spatial resolution (Table 1).
Table 1. Products of the satellite imagery used.
Satellite ImagesYearResolution (m)
COSMOS KVR100019942
Landsat 5199830
IRS-1C19985
SPOT 520035
IKONOS20051
RapidEye20105
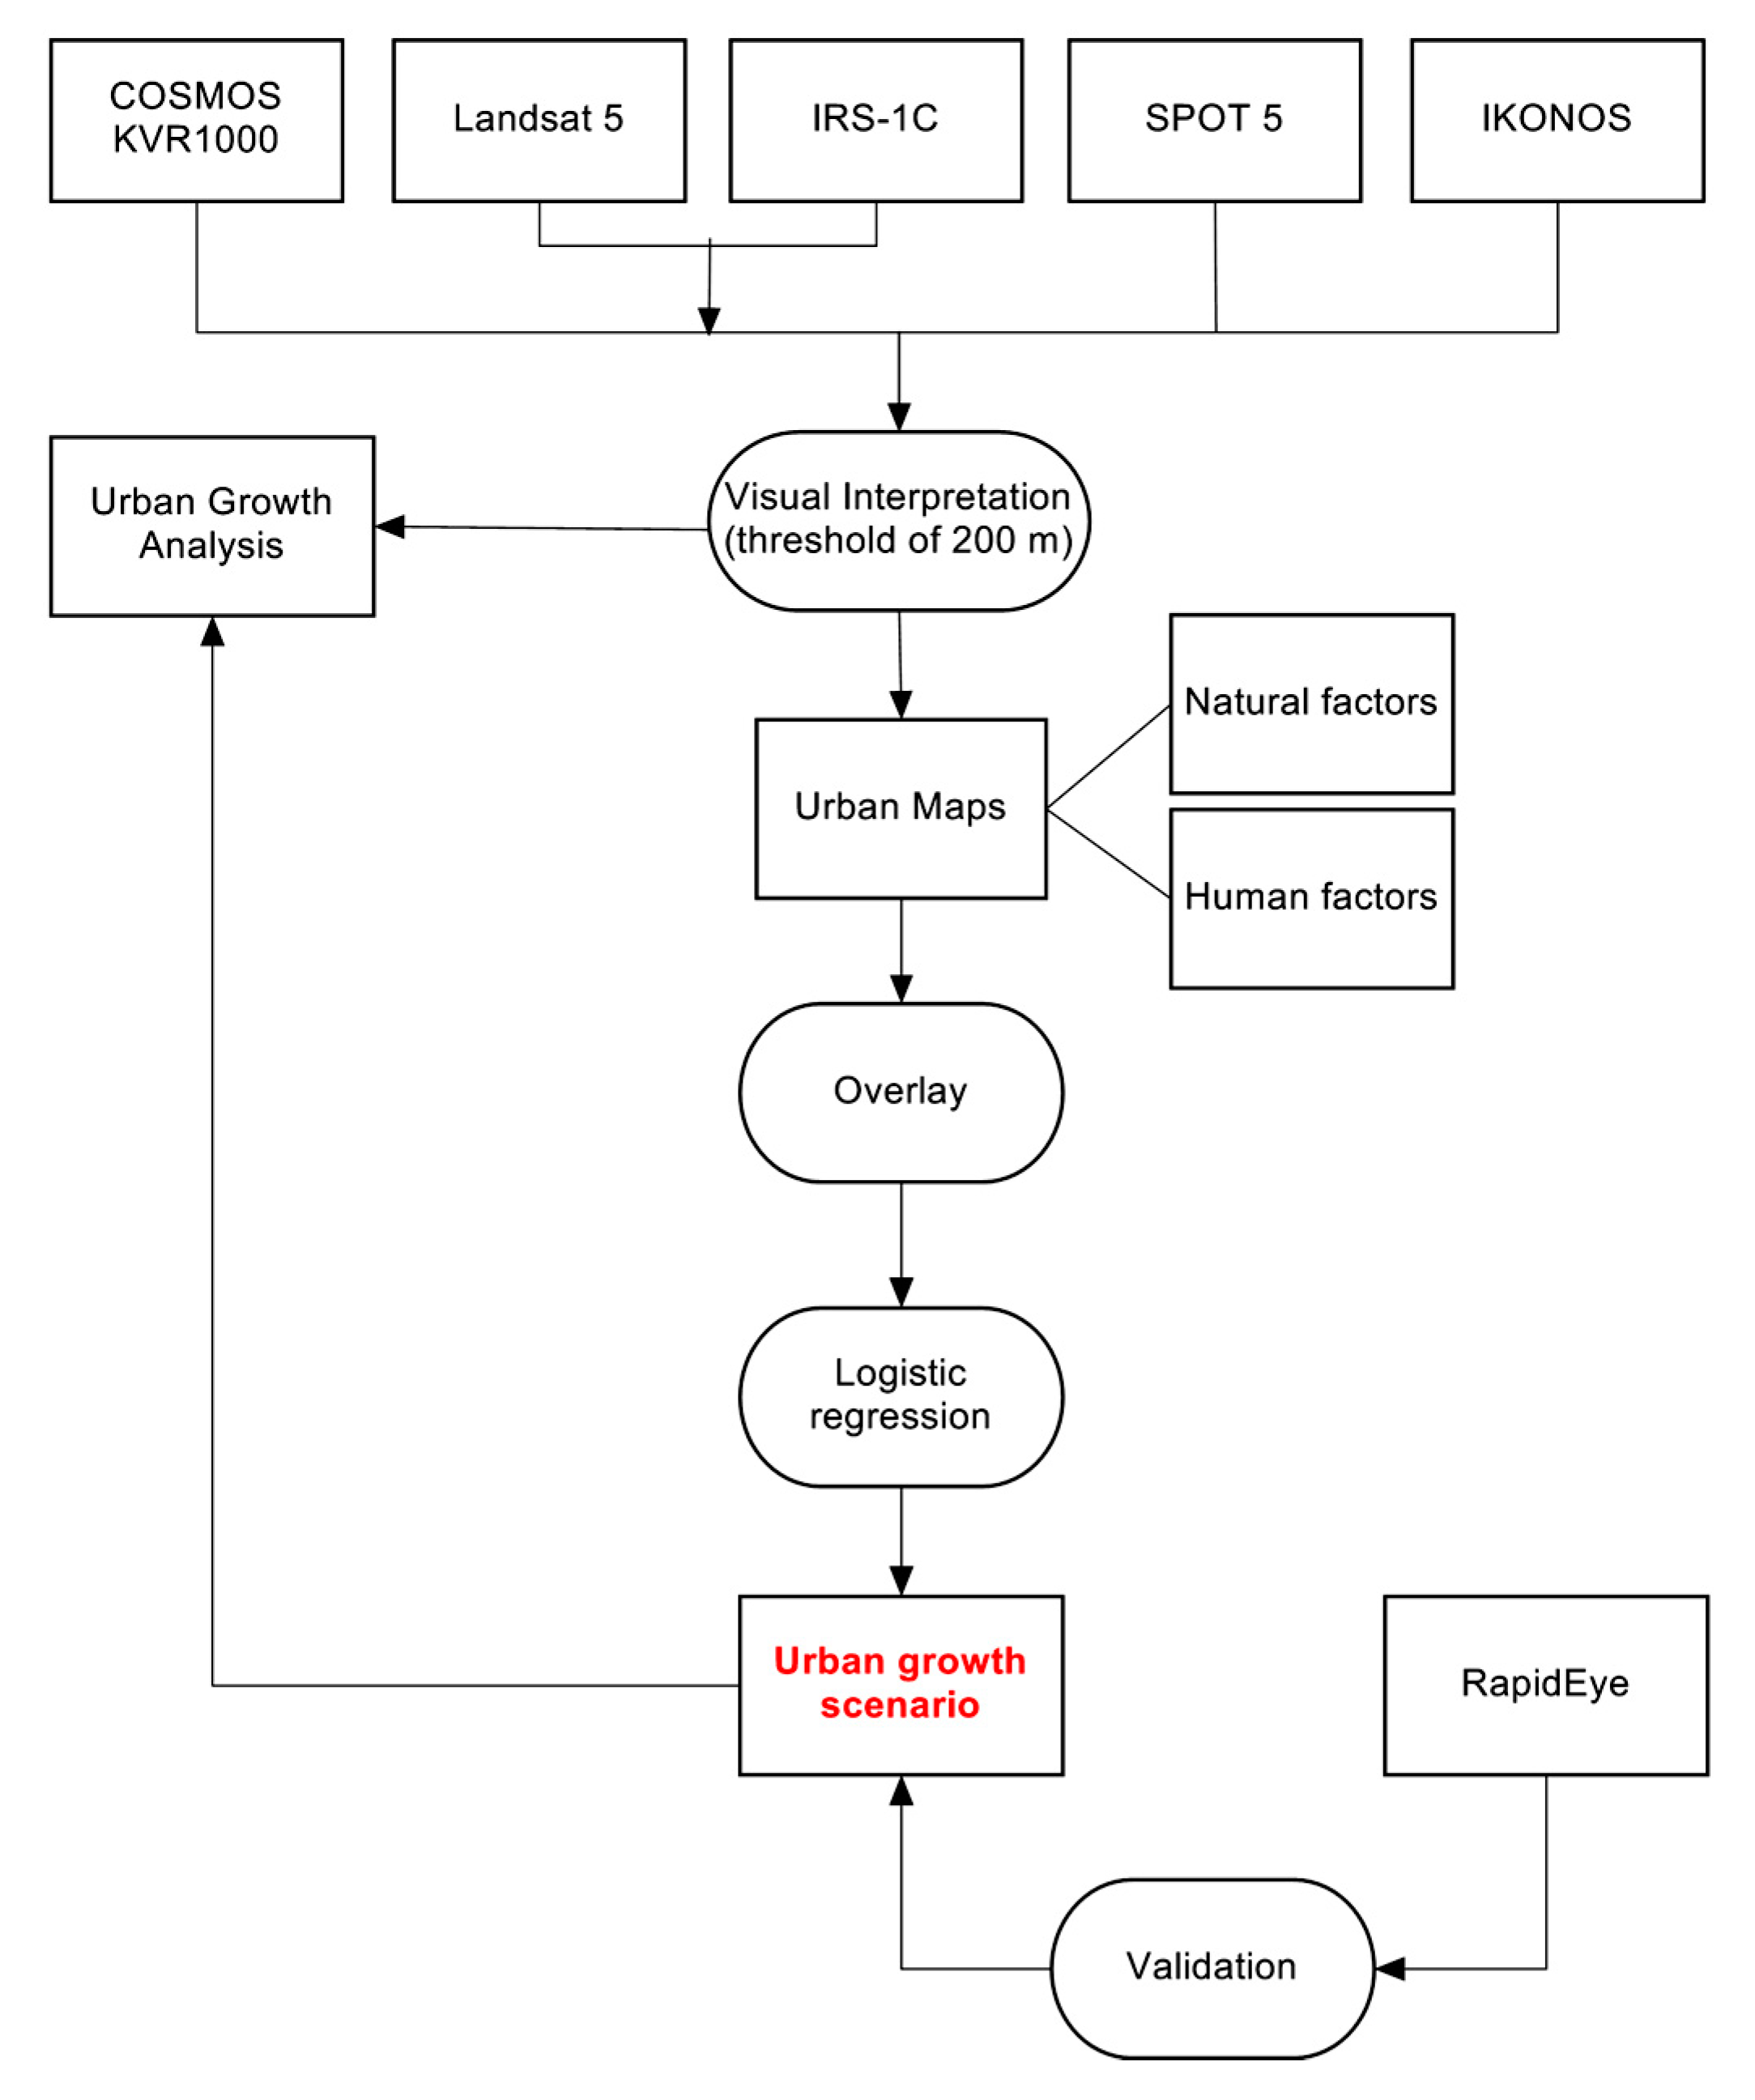
Figure 2. Methodology flowchart.
Land 03 00941 g002
All satellite images were orthorectified using a digital elevation model (DEM) with an accuracy of 10 m added to several control ground points (CGP) that were collected by GPS. Then, these images were interpreted (i.e., image registration, geometric correction, atmospheric normalization) and processed. The output was a time series of GIS layers reflecting urban transformation in the Greater Beirut Area. A methodology flowchart is represented in Figure 2.

3.2. Variables Identification

To quantify the relationship between urban growth and its causal factors, we related the map of 1963–2005 land use change to a set of predictor variables that was selected a priori based on our current knowledge of the urbanization process in the GBA. By analyzing times series satellite images and by referring to others studies [2,17,18,19,20,21,22,23,24,25], we identified various factors that may influence the urban growth in the GBA. These factors can be divided into natural factors—i.e., altitude and slope—and human factors—i.e., the distance variable, indicating distances to certain elements, such as roadway infrastructure, demographic variables, indicating the influence of urban agglomeration, the total exploitation coefficient, as well as the impact of the population density in general.
The choice of the distance from urban agglomeration plays a significant role in the determination of the built environment in the GBA. The threshold value can vary from 50 to 200 m, but commonly, a threshold of 200 m between buildings is preferred [26]. Thus, we selected this same value in our study.

3.3. Statistical Analysis

As for the statistical model, a multivariate logistic regression model was chosen to represent the non-linear nature of urban growth problems [27]. More specifically, this model was developed by McFadden [28] and conceptually based on the theory of random utility. It examines the relationships between urban land uses and independent variables. When the dependent variable is dichotomous, logistic regression can be applied to predict the presence or absence of a characteristic based on a matrix of independent variables [29]. When the dependent variable was qualitative, it holds no natural numeric value. We introduced, however, a quantitative coding to represent the different attributes; for example, a code of “1” if the attribute is “urban” and “0” otherwise. Linear regression analysis was prepared using R for Windows, release 3.1.

4. Results and Discussion

4.1. Dynamics of Urban Change

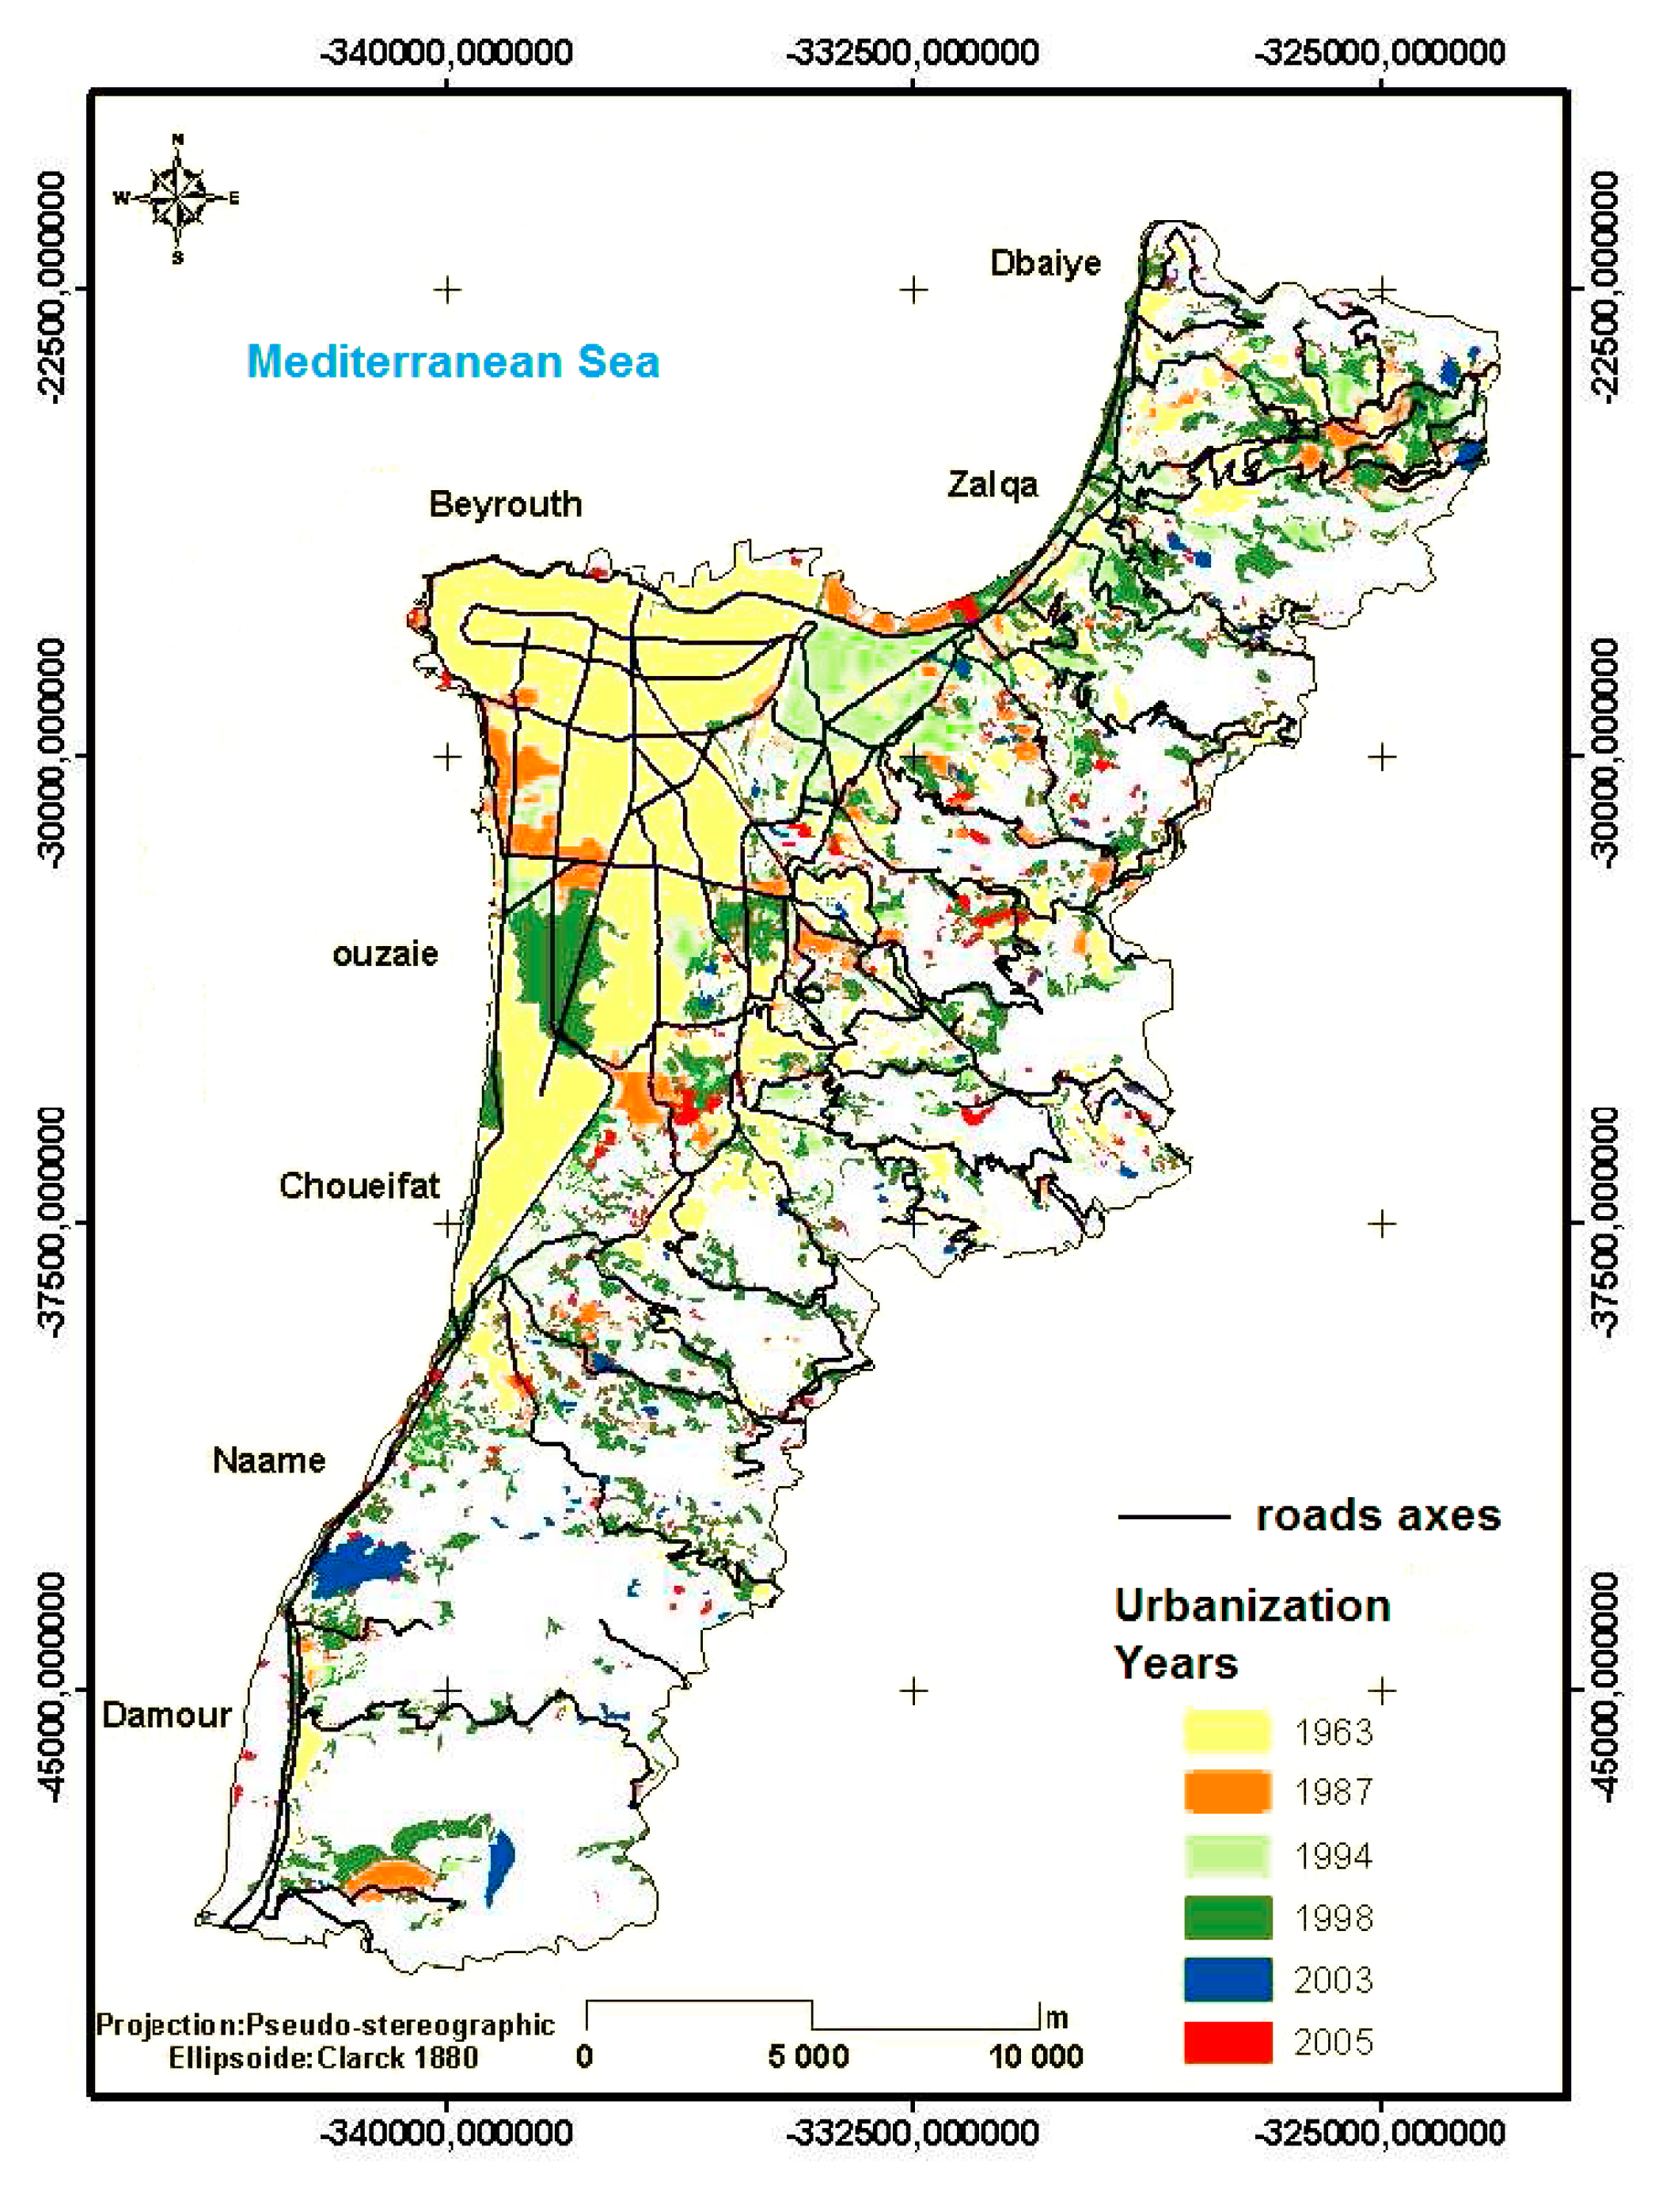
Topographic maps (1963) and satellite images from 1987, 1994, 1998, 2003 and 2005 from different satellites were merged. As a result, Table 2 and Figure 3 show the evolution of urbanization in the Greater Beirut Area between 1963 and 2005. In 1963, the urbanized area formed a region of ~68 km2. After twenty four years, in 1987, this area had reached ~80 km2, then, expanding to 143 km2 in 2005, which is doubled the value in comparison to 1963. The growth rate achieved a maximum in 1998 with nearly 10.8 km2∙yr−1. The year 2005 follows, with 2.2 km2∙yr−1.
Table 2. Urbanization growth rate in the Greater Beirut Area, 1963–2005.
YearUrbanized Area (km2)Growth Rate (km2∙yr−1)
196367.8-
198780.20.52
199491.91.67
1998135.410.86
2003138.70.66
2005143.22.25
Figure 3. Urbanization evolution in the Greater Beirut Area (GBA), 1963–2005.
Land 03 00941 g003

4.2. Urban Growth Factors

4.2.1. Natural Factors

Altitude

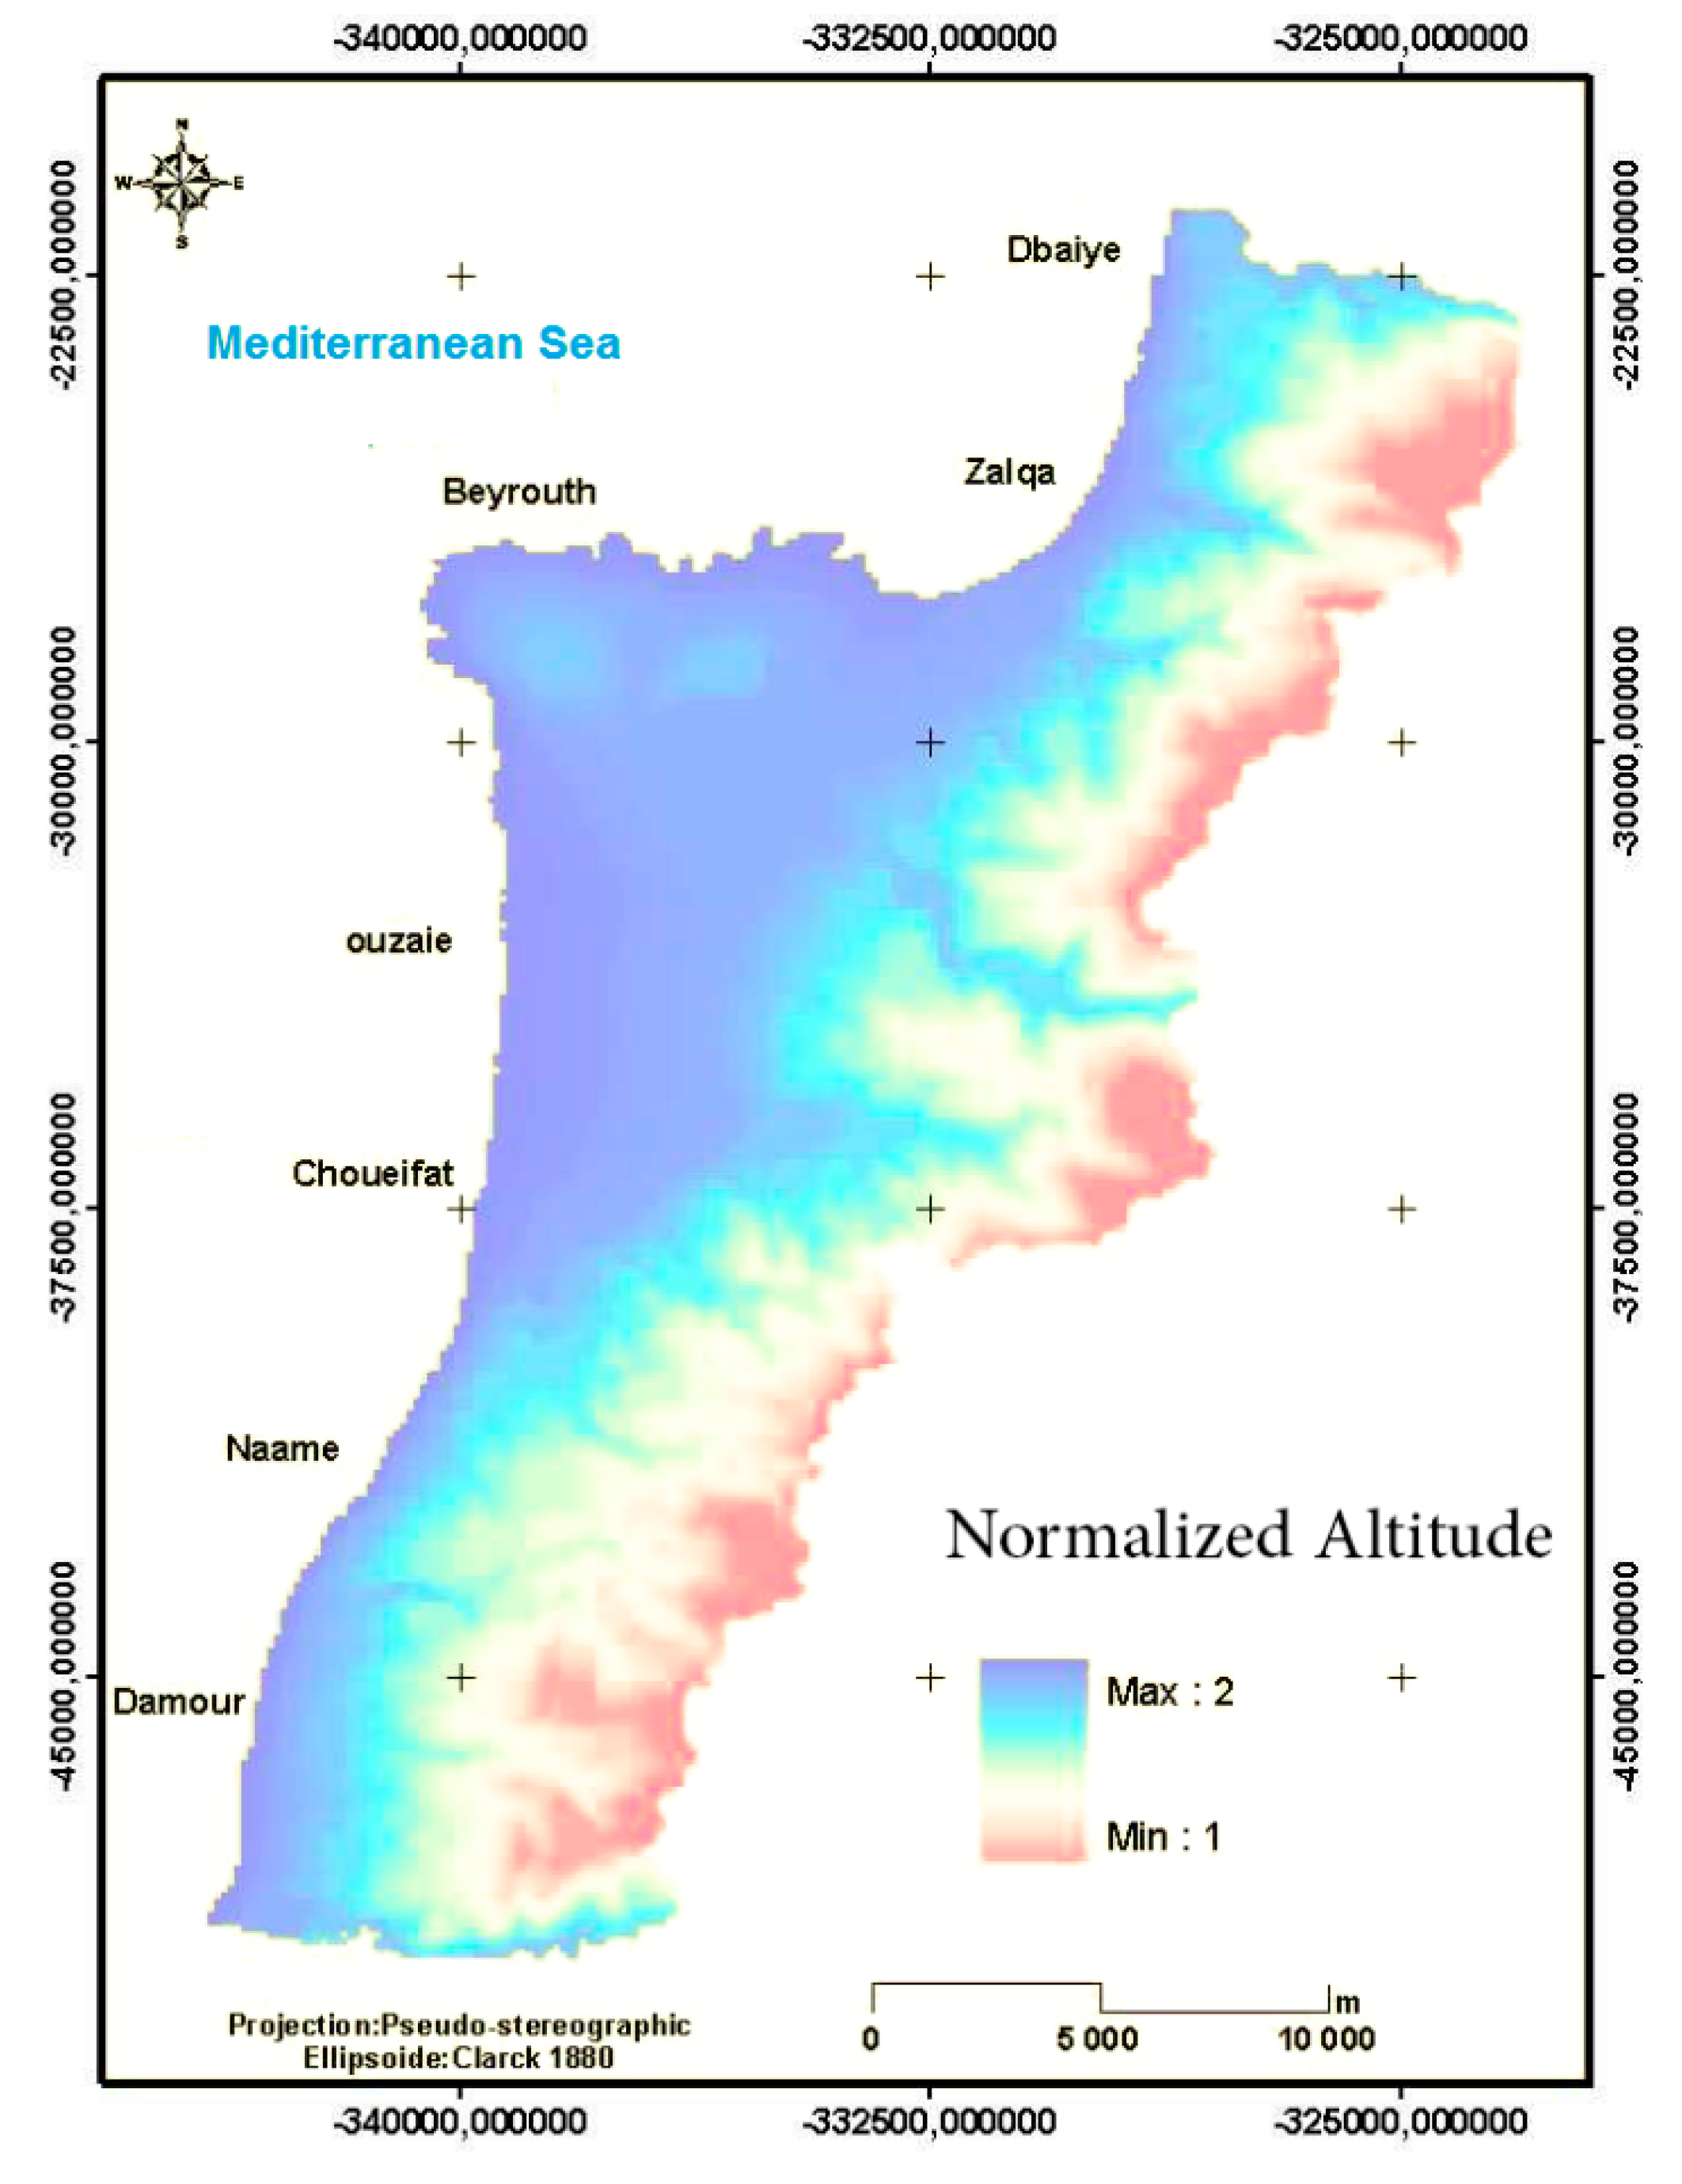
By merging the digital elevation model (DEM) with an accuracy of 50 m with the urbanization map (Figure 3), Table 3, which identifies the distribution of urbanization in relation to altitude, was created. Over 70% of the local population lives in an area below 200 m. However, there is no standard correlation between altitude and urbanization, with the second highest percentage (nearly 15%) being between 600 and 750 m. Later, a normalized altitude factor was retrieved with a pixel size of 50 m (Figure 4).
Table 3. Urbanization distribution based on altitude, 2005.
AltitudePercentage (%)
0–20070
200–3009.87
300–45010.12
450–6006.96
600–75014.77
Figure 4. Normalized altitude for the GBA.
Land 03 00941 g004

Slope

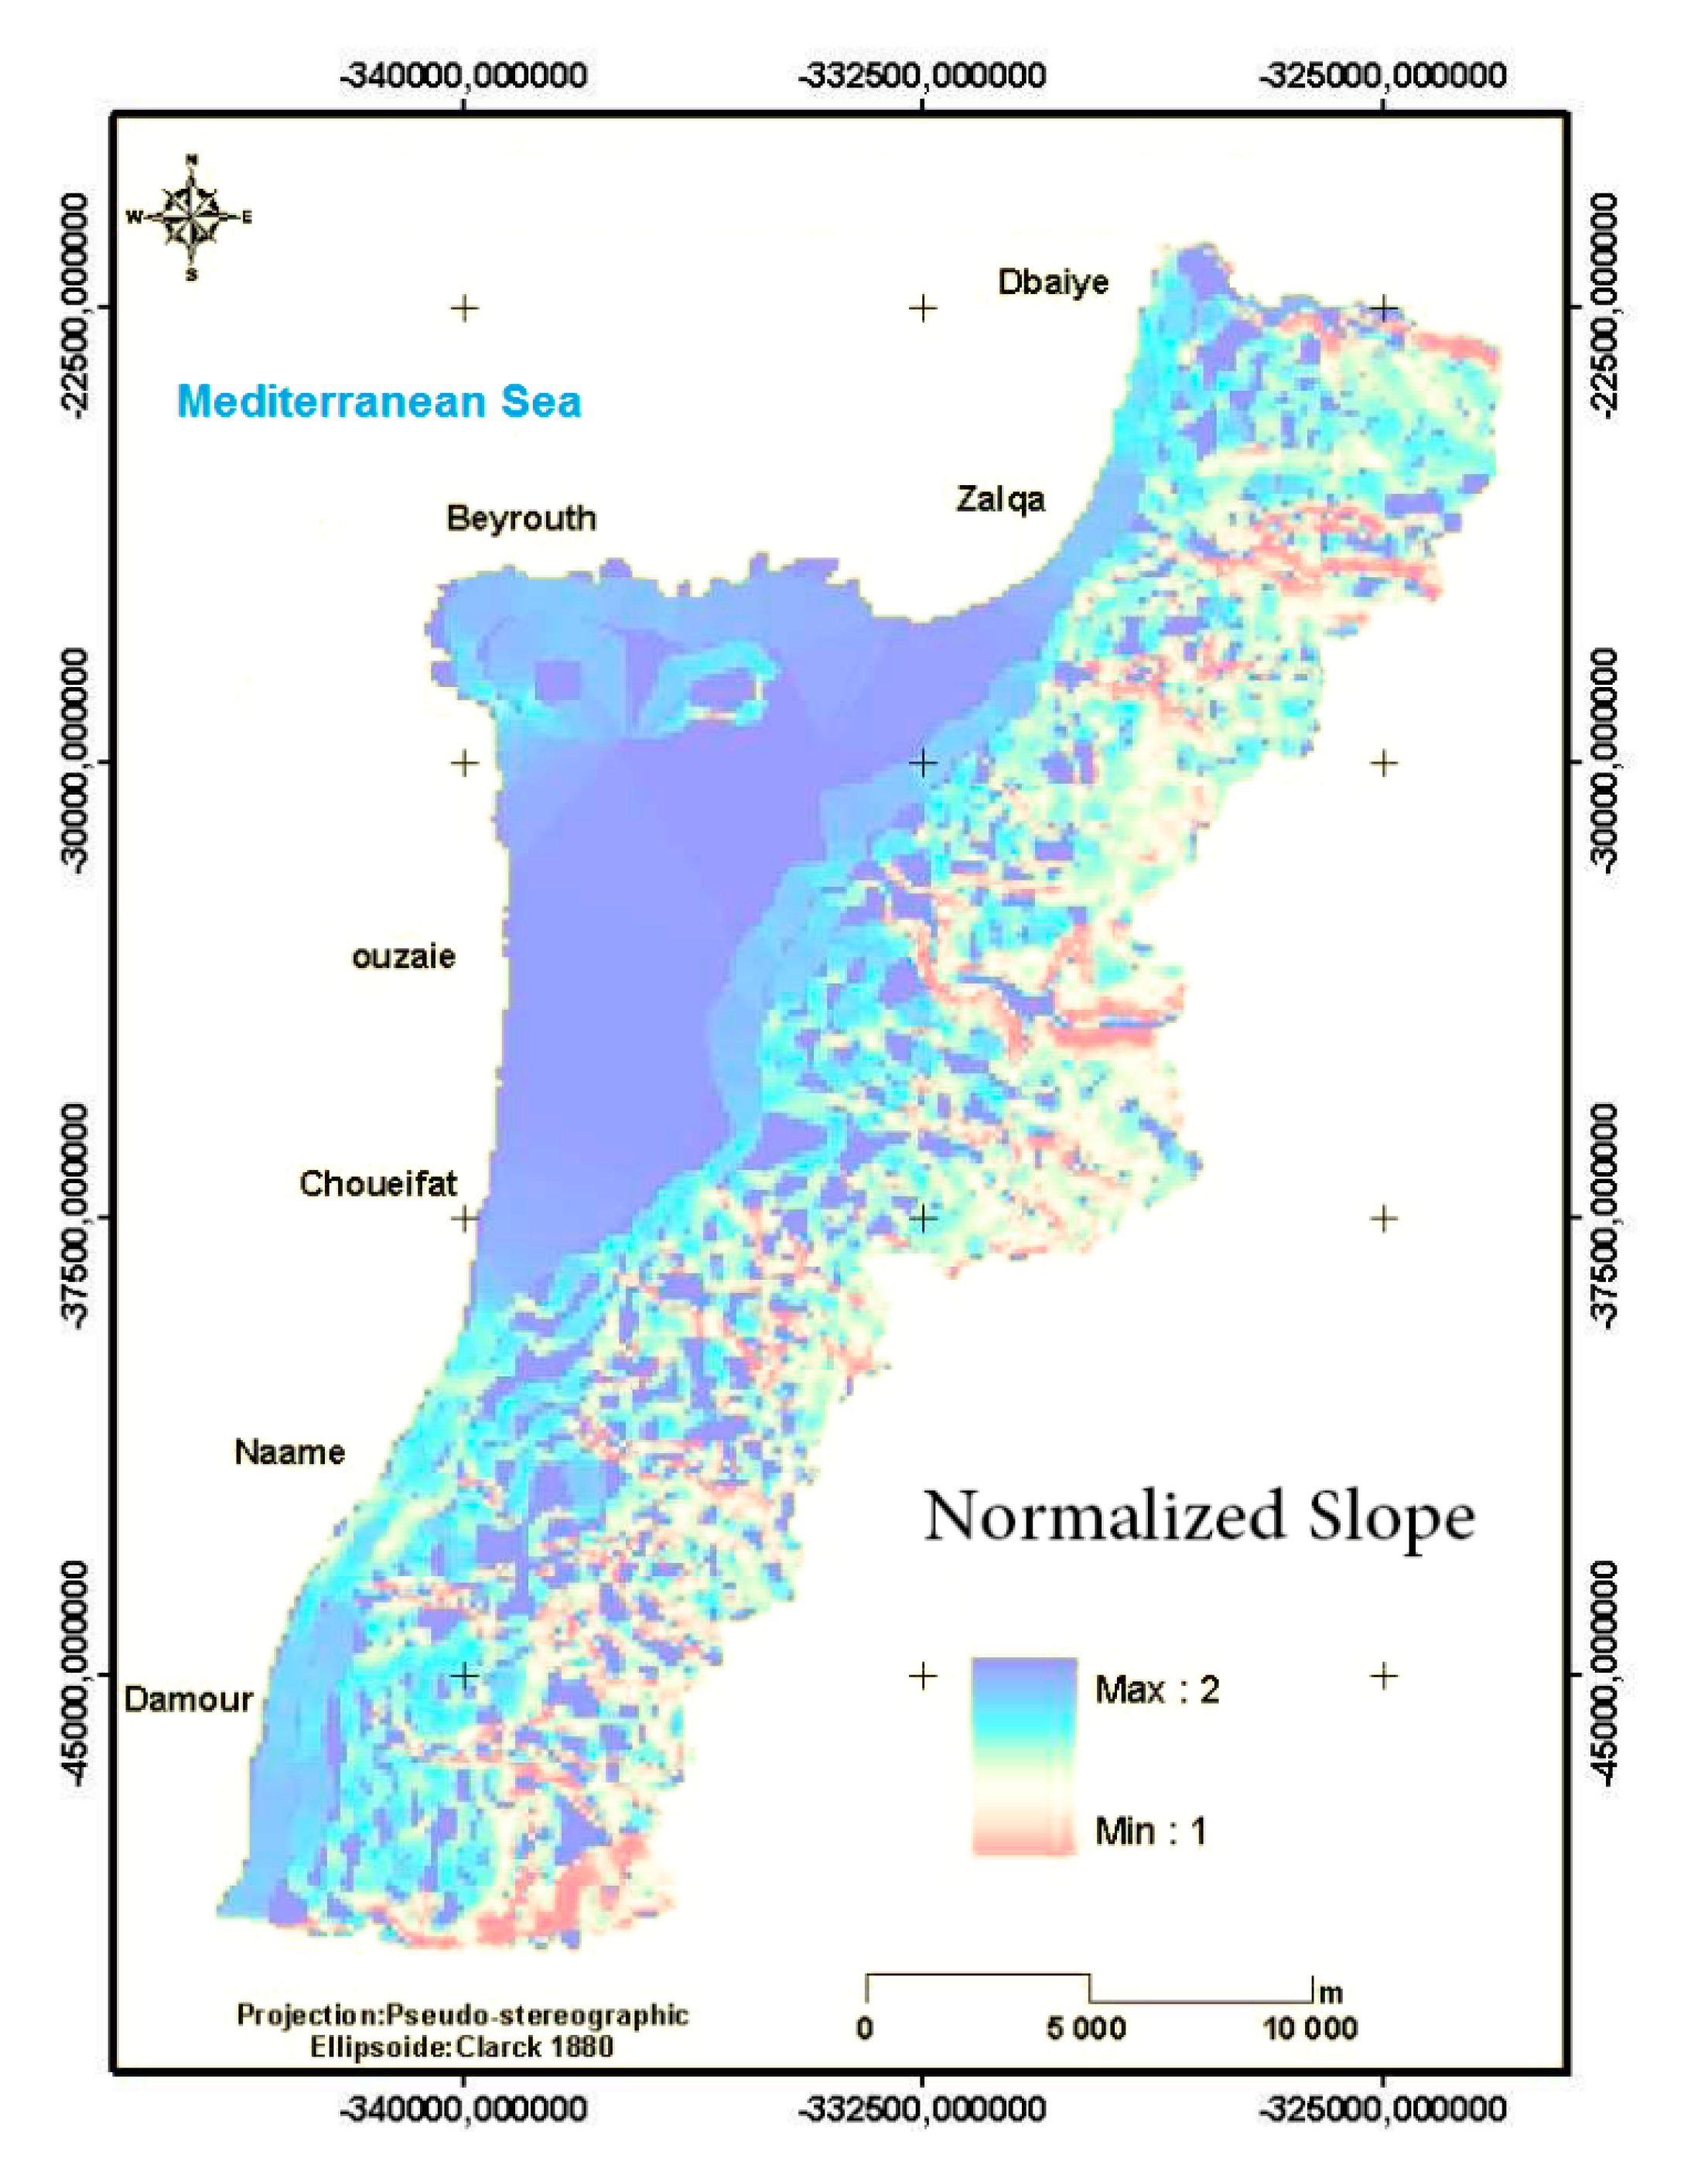
Slopes are classified into five categories (i.e., very gentle (0%–5%); gentle (5%–10%); average (10%–20%); steep (20%–30%); and very steep (>30%)).
Table 4 was produced when combining the slope recognized from a digital elevation model (DEM) with an accuracy of 50 m with the urbanization map from different years. On gentle slopes (<10%) close to the coast line, a high level of urbanization (68.66%) is found. On moderate slopes (10%–20%), urban growth is at a lower rate (26.51%). However, steep slopes and very steep slopes (>20%) show a low rate of urban growth (4.82%), which accounts for a small urbanized area of nearly 15 km2. Practically, there is no built area on slopes greater than 40%. Then, a normalized slope factor was retrieved with a pixel size of 50 m. The zone with a very steep slope was masked (Figure 5).
Moreover, the analysis of this table shows that until 1994, the urbanization was concentrated in areas that have low or very low slopes (approximately 80%); the rest of the urbanization is distributed on average slopes. Ever since 1998, the average slopes had attracted more urbanization, which seems logical, since the lands with a slope lower than 10% were already urbanized.
Table 4. Urbanization distribution based on slopes, 1963–2005.
YearsVery Gentle SlopesGentle SlopesAverage SlopesSteep SlopesVery Steep Slopes
196369.6513.2815.51,50.07
198769.1113.8515.661.340.04
199465.5511.9619.212.880.4
199843.1417.5331.646.591.1
200329.4620.8840.987.61.08
200540.0317.5136.115.690.66
Average52.8215.8426.514.270.55
Figure 5. Normalized slope for the GBA.
Land 03 00941 g005

4.2.2. Human Factors

Distance Variable
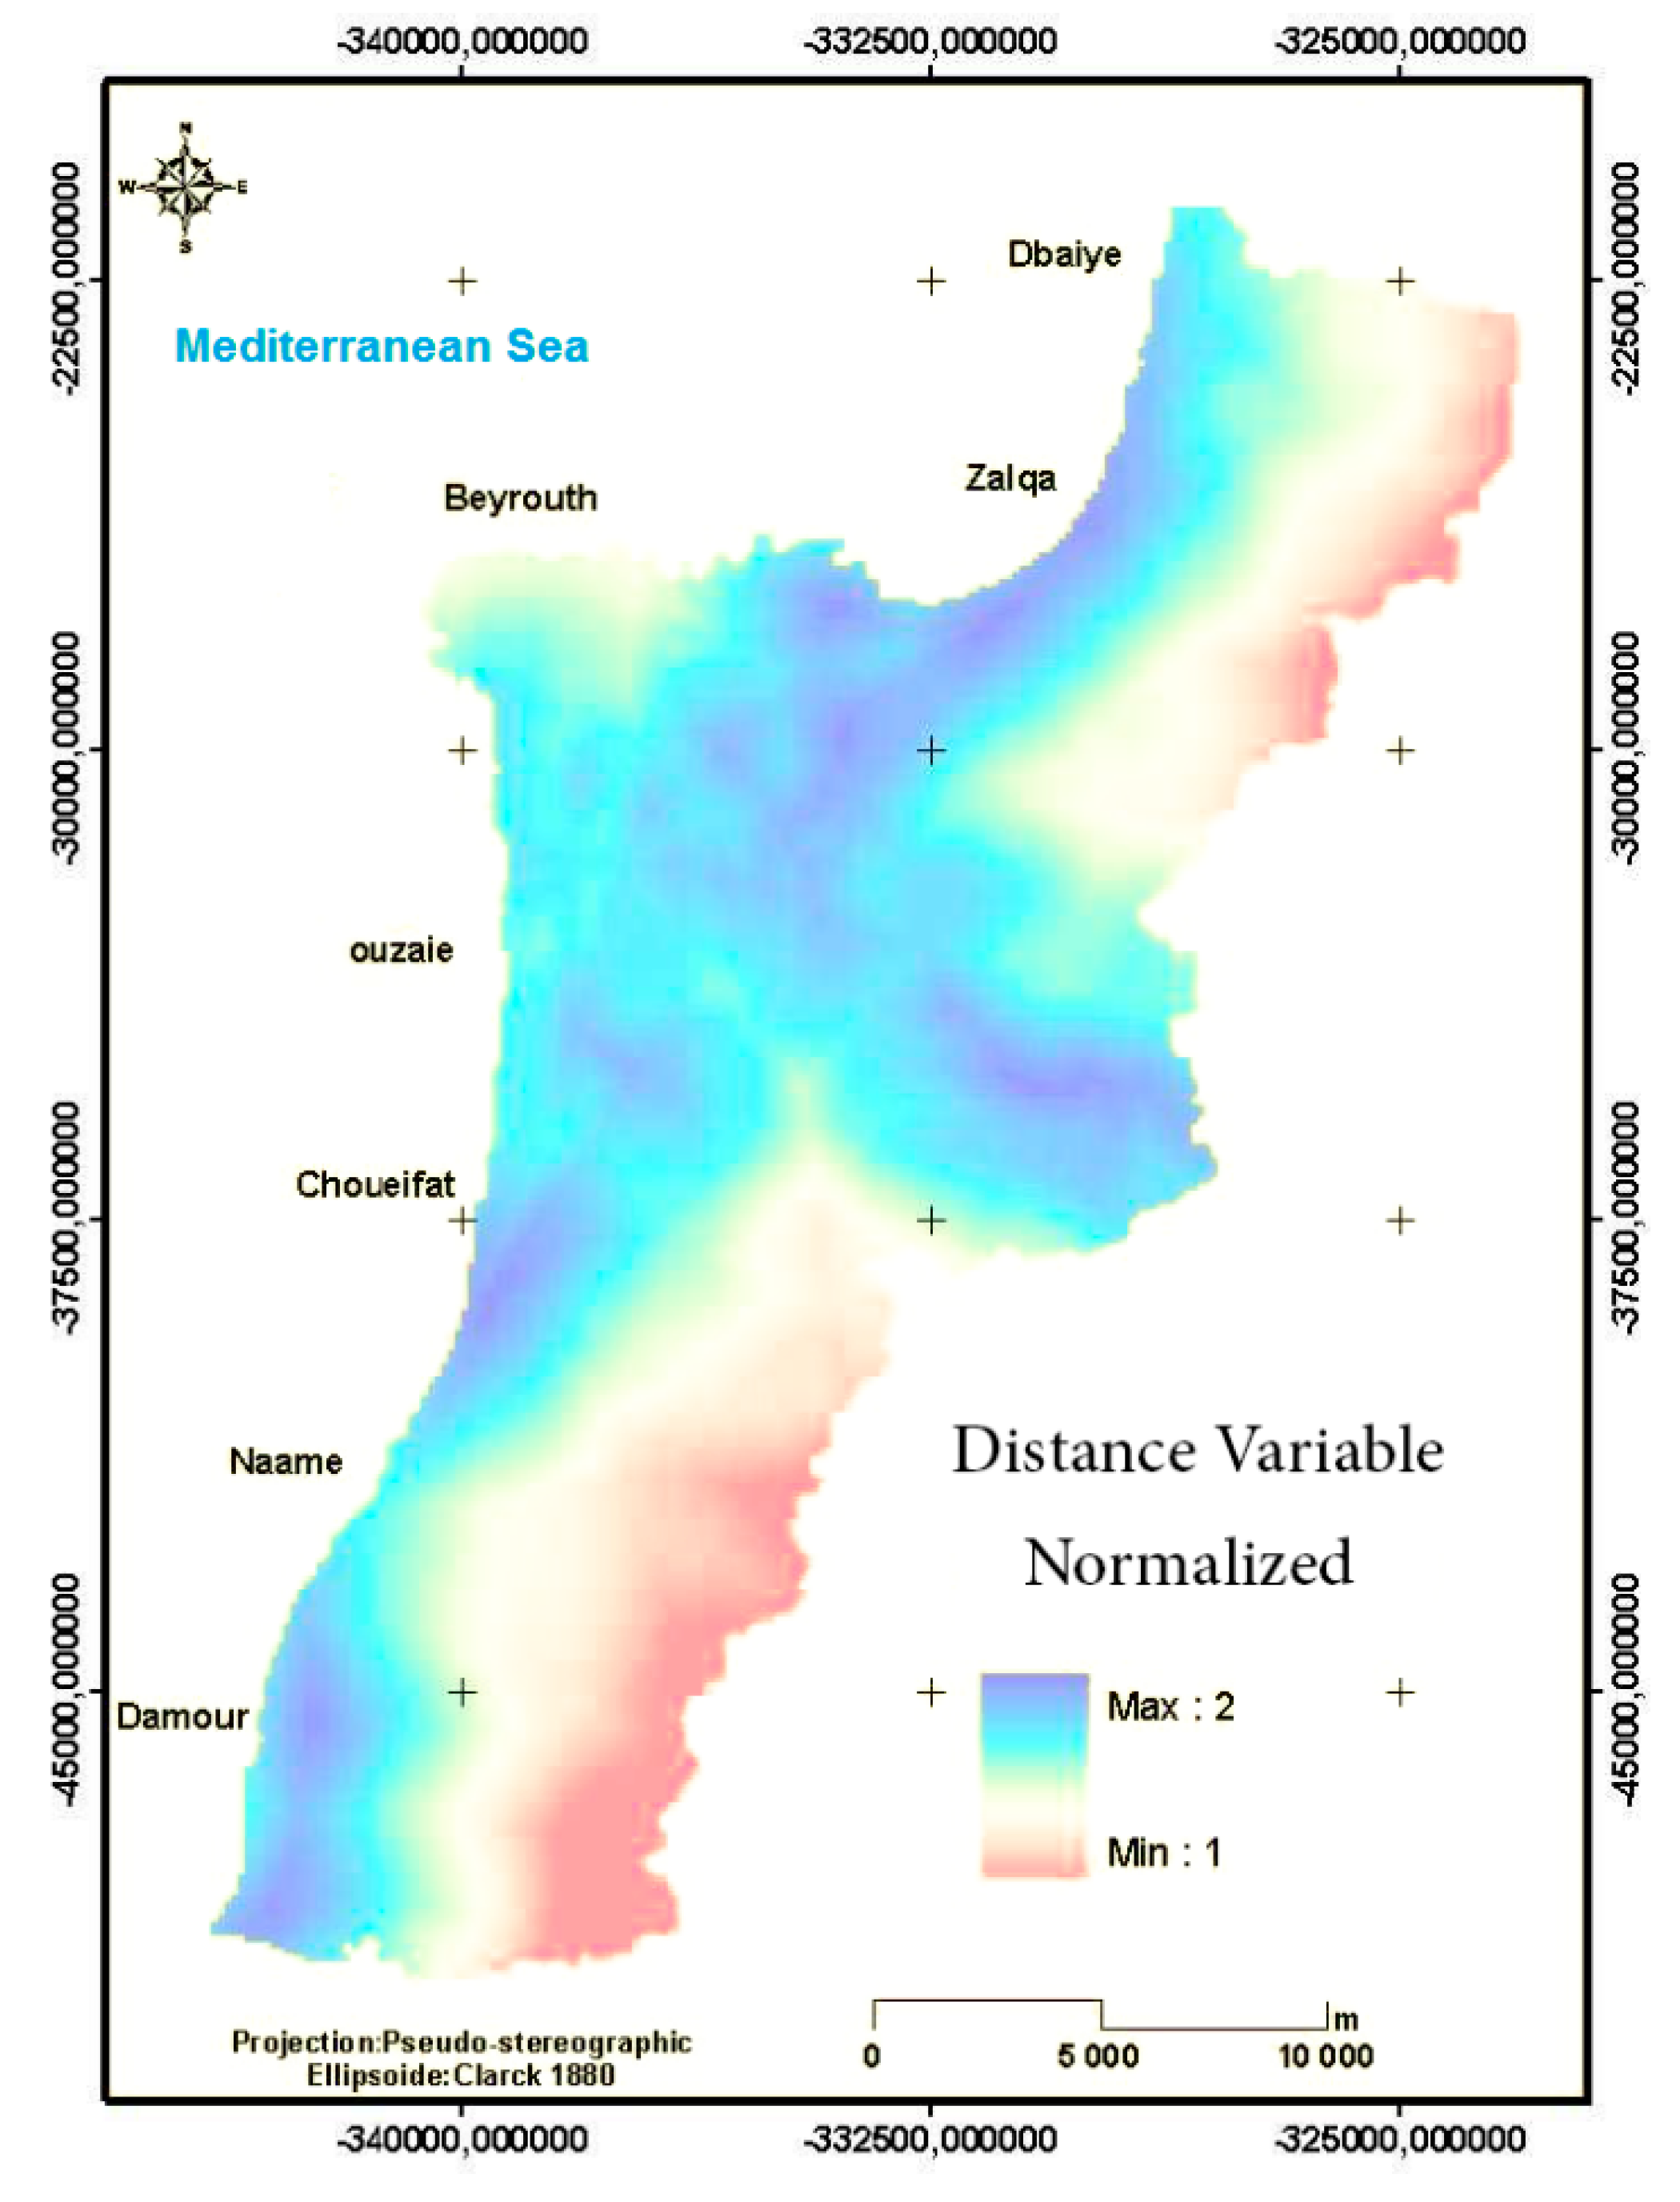
The road network plays a key role in urbanism planning: it is essential to economic development, both national and local, and it has a major unifying influence of the territory by linking cities to each other. It is always a temptation for urbanization.
Figure 6 shows the distance variable normalized. It is generated by applying an importance rules as follows: (international road) × 3 + (primary road) × 2 + (secondary road)/6. This factor was normalized between one and two.
Figure 6. Normalized distance variable for the GBA.
Land 03 00941 g006

Demographic Variables

Demographic variables are as follow: population density, urban agglomeration and total exploitation coefficient. In fact, an area that has a high population density tends to be much more urbanized than an area that is sparsely populated. It is clear that the city of Beirut and all of the suburbs close to the center and to the south have the highest density. This is caused by Palestinian refugee camps, as well the presence of informal settlements. Besides, the areas existing inside urban agglomeration, which is the second variable, are the most probable to be urbanized. The total exploitation coefficient, which is the third variable, integrates the horizontal and the vertical dimension of urbanization. In other words, two plots of the same size and the same land use coefficient do not have the same speed of urbanization. Then, an area with the highest total exploitation coefficient will have a greater tendency to be urbanized. These factors were normalized (between values of one and two) and displayed as maps (Figure 7).
Figure 7. (A) Normalized population density, (B) urban agglomeration and (C) total exploitation coefficient for the GBA.
Land 03 00941 g007

4.3. Urban Growth Scenario

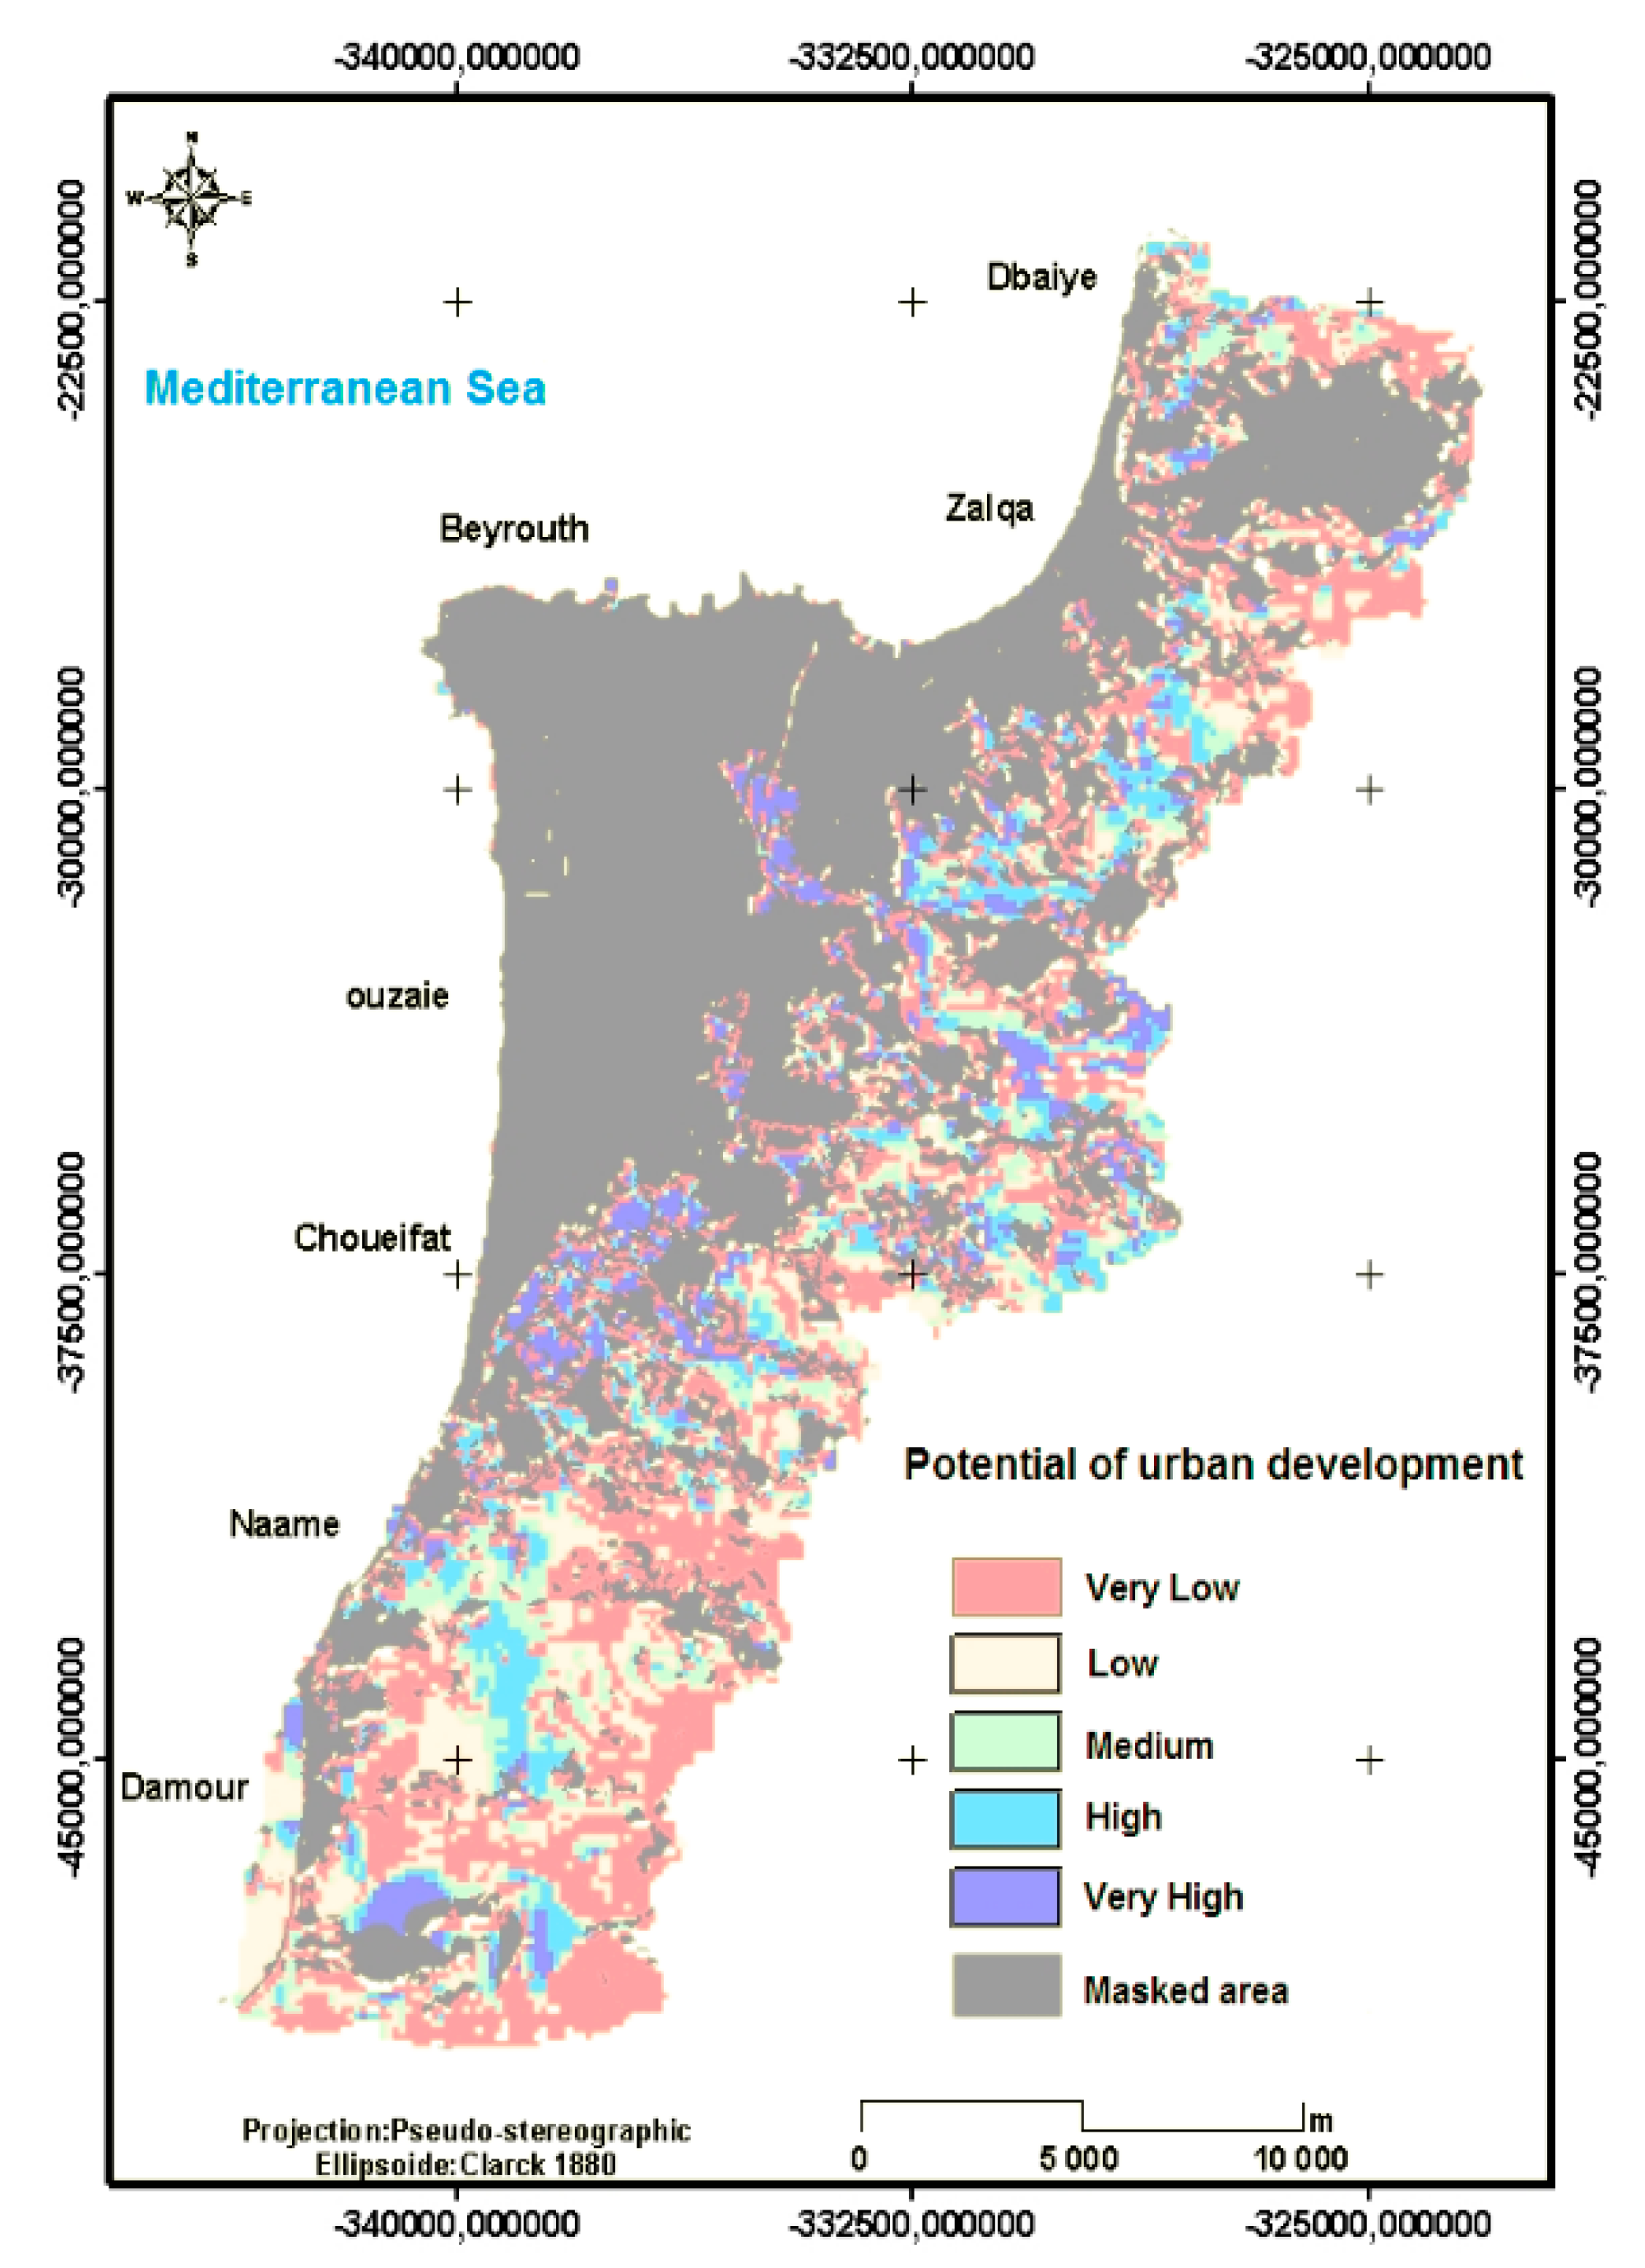
The probability of a pixel to be urbanized was classified into five categories: very low (<10%), low (10%–40%), medium (40%–60%), high (60%–90%) and very high (>90%). This probability was generated based on all the factors already mentioned. By applying the logistic regression method, a table file (Table 5) was produced, which indicates the initial state that has the same values of the dependent variable, the final state, the probability of being non-urbanized (IP_0) and the probability of being urbanized (IP_1) of each pixel.
Table 5. The probability of each pixel to be urbanized.
PixelInitial StateIntoIp_0Ip_1
204110.3189890.681011
205000.9952440.004756
206010.3211770.678823
207000.9938840.006116
208100.5491820.450818
209000.9944890.005511
Figure 8. Potential of urban development, 2005.
Land 03 00941 g008
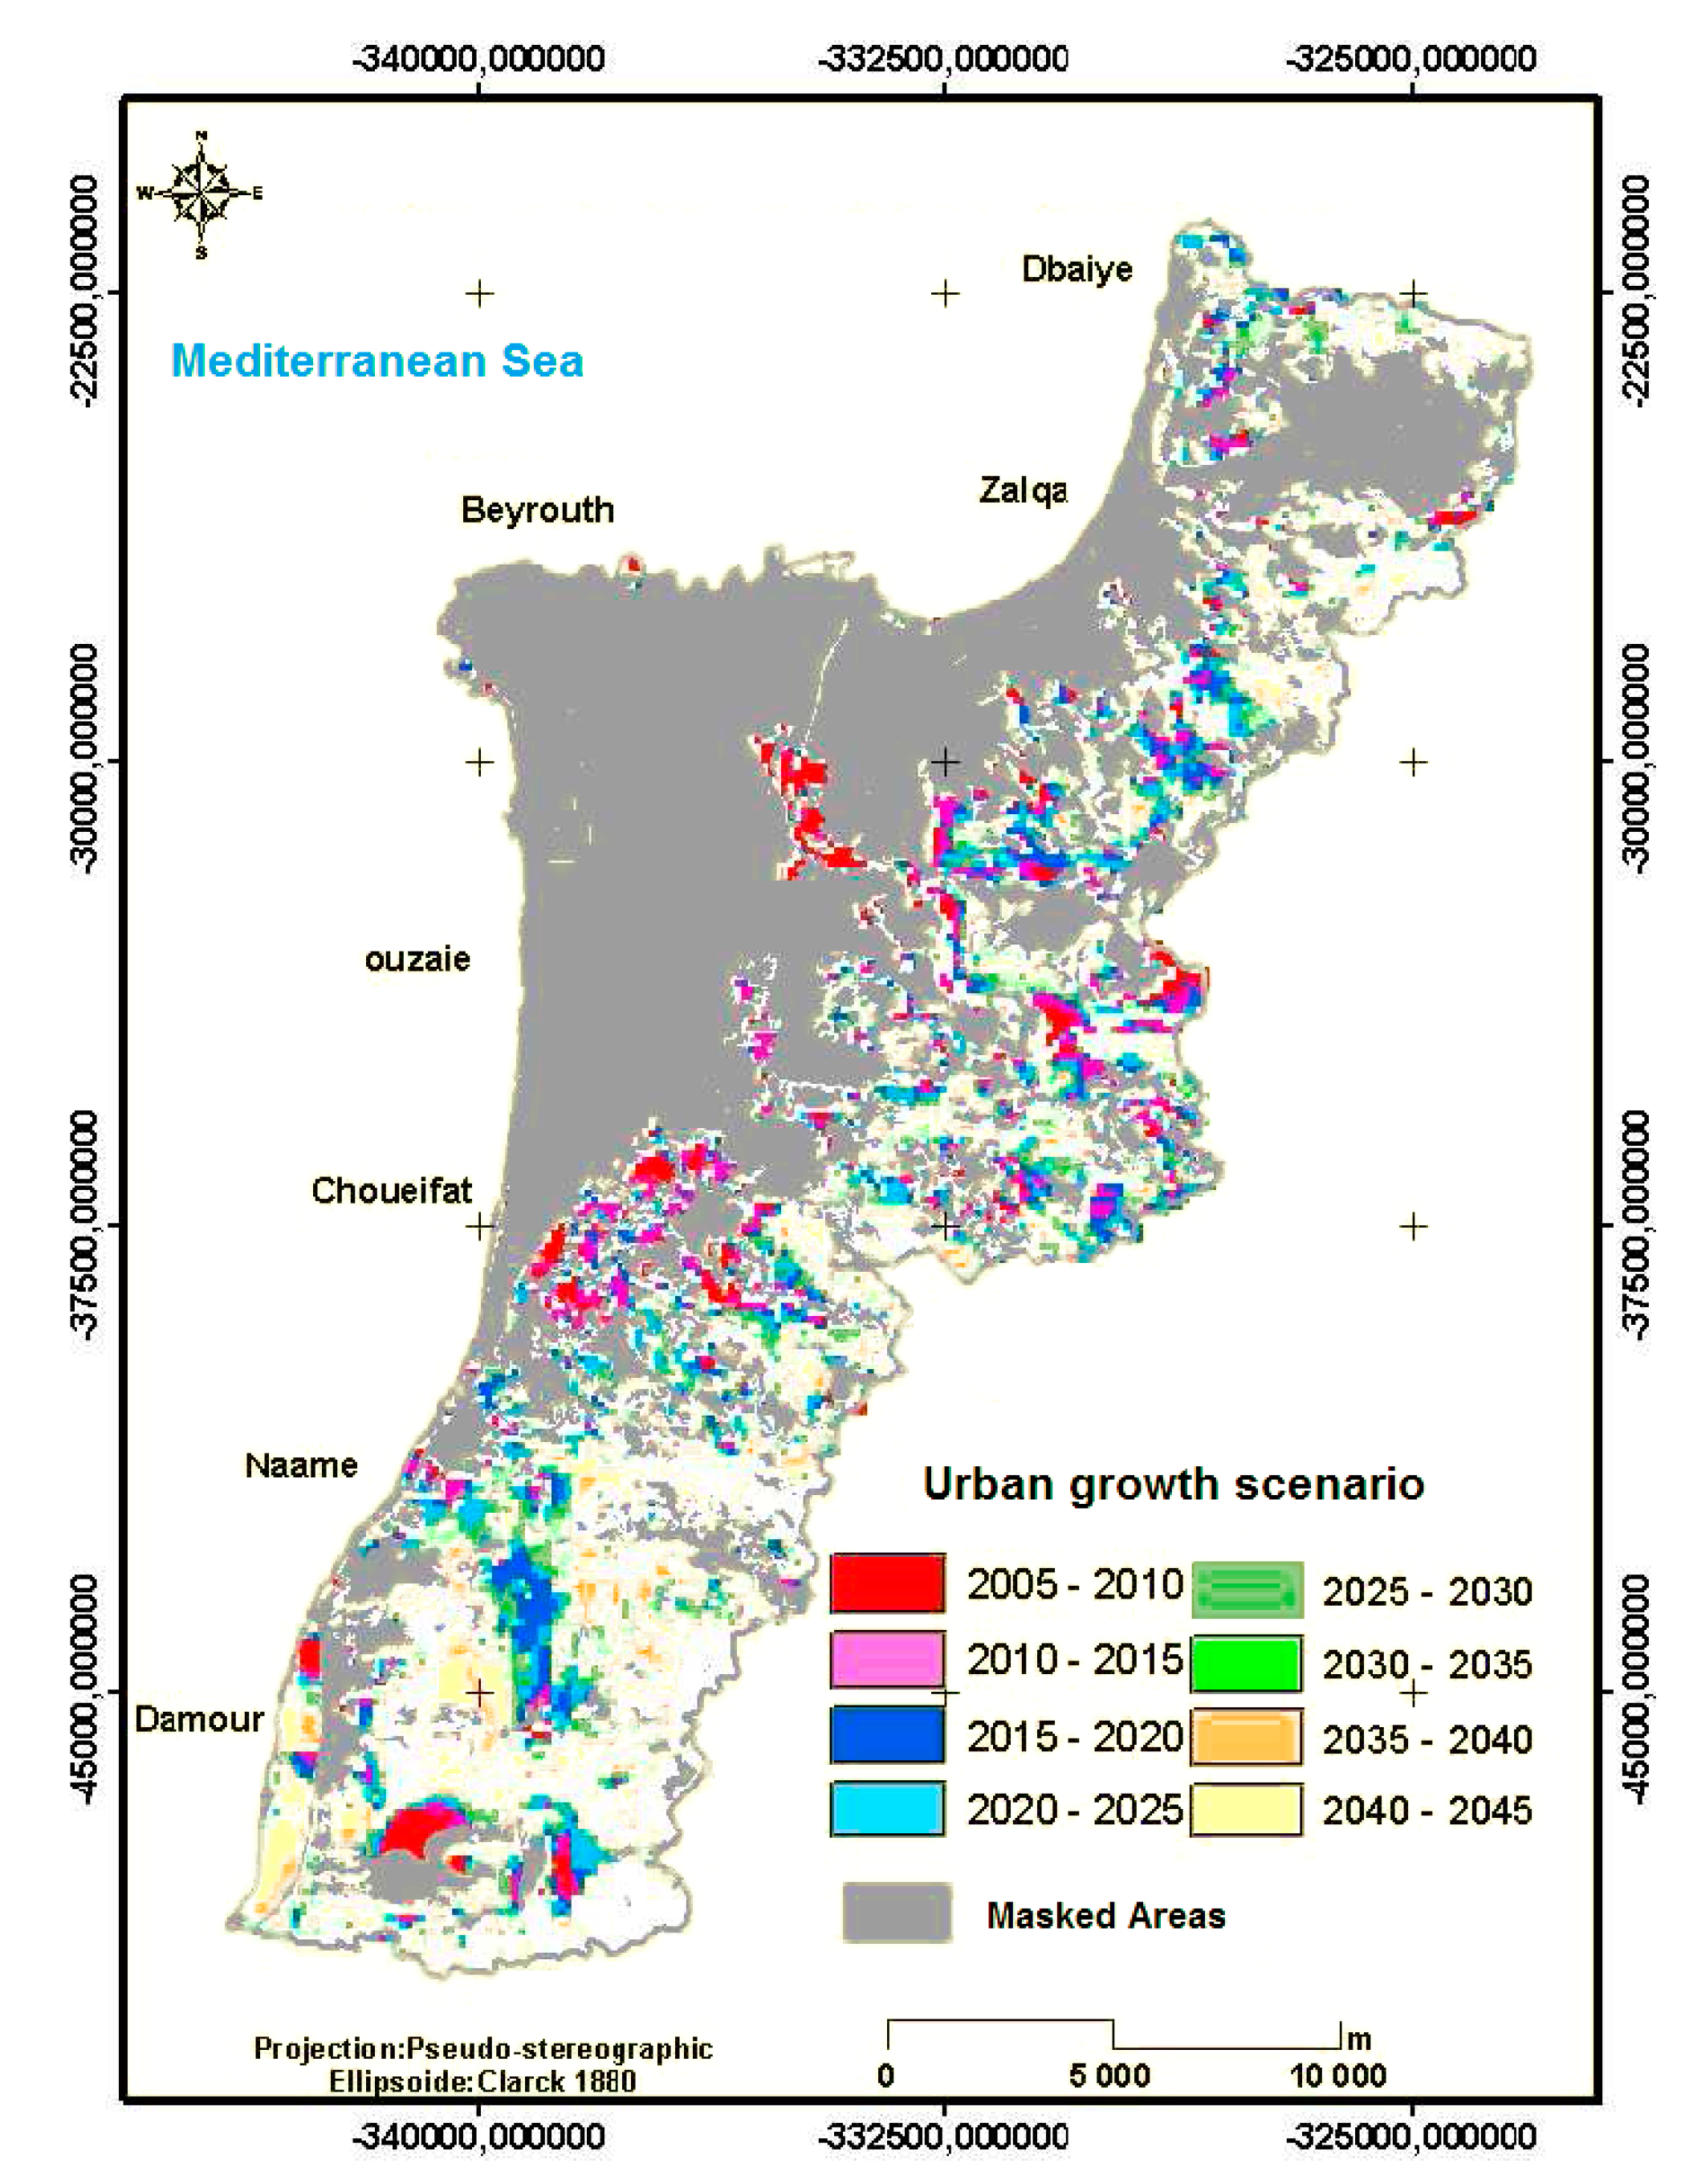
Figure 9. Urban growth scenario in the Greater Beirut Area, a forecast until 2045.
Land 03 00941 g009
Note that the final state (the probability to be urbanized) of each pixel was coded “1” or “0”, which reflect if the pixel has the probability “to be urbanized” or “not”, respectively (R software assumes that the pixel is urbanized if this probability is greater than 0.5). For example, the initial state of the pixel 205 was non-urbanized “0” and has a very low probability of being urbanized (0.004 < 0.5); consequently, the final state remains non-urbanized “0”. In ArcGIS 10.2, from these results, the potential of urban development is achieved based on the likelihood of each pixel being urbanized (IP_1) (Figure 8).
Based on the potential of urbanization (Figure 8), it is possible to propose a scenario for future urbanization growth over time. The average annual growth rate in the study area is 1.8 km2∙yr−1 (based on Table 1), which is 9 km2 over five years, also equivalent to 900 pixels in this map. Figure 9 shows the scenario of urban growth expected in the study area every five years, projected until 2045.
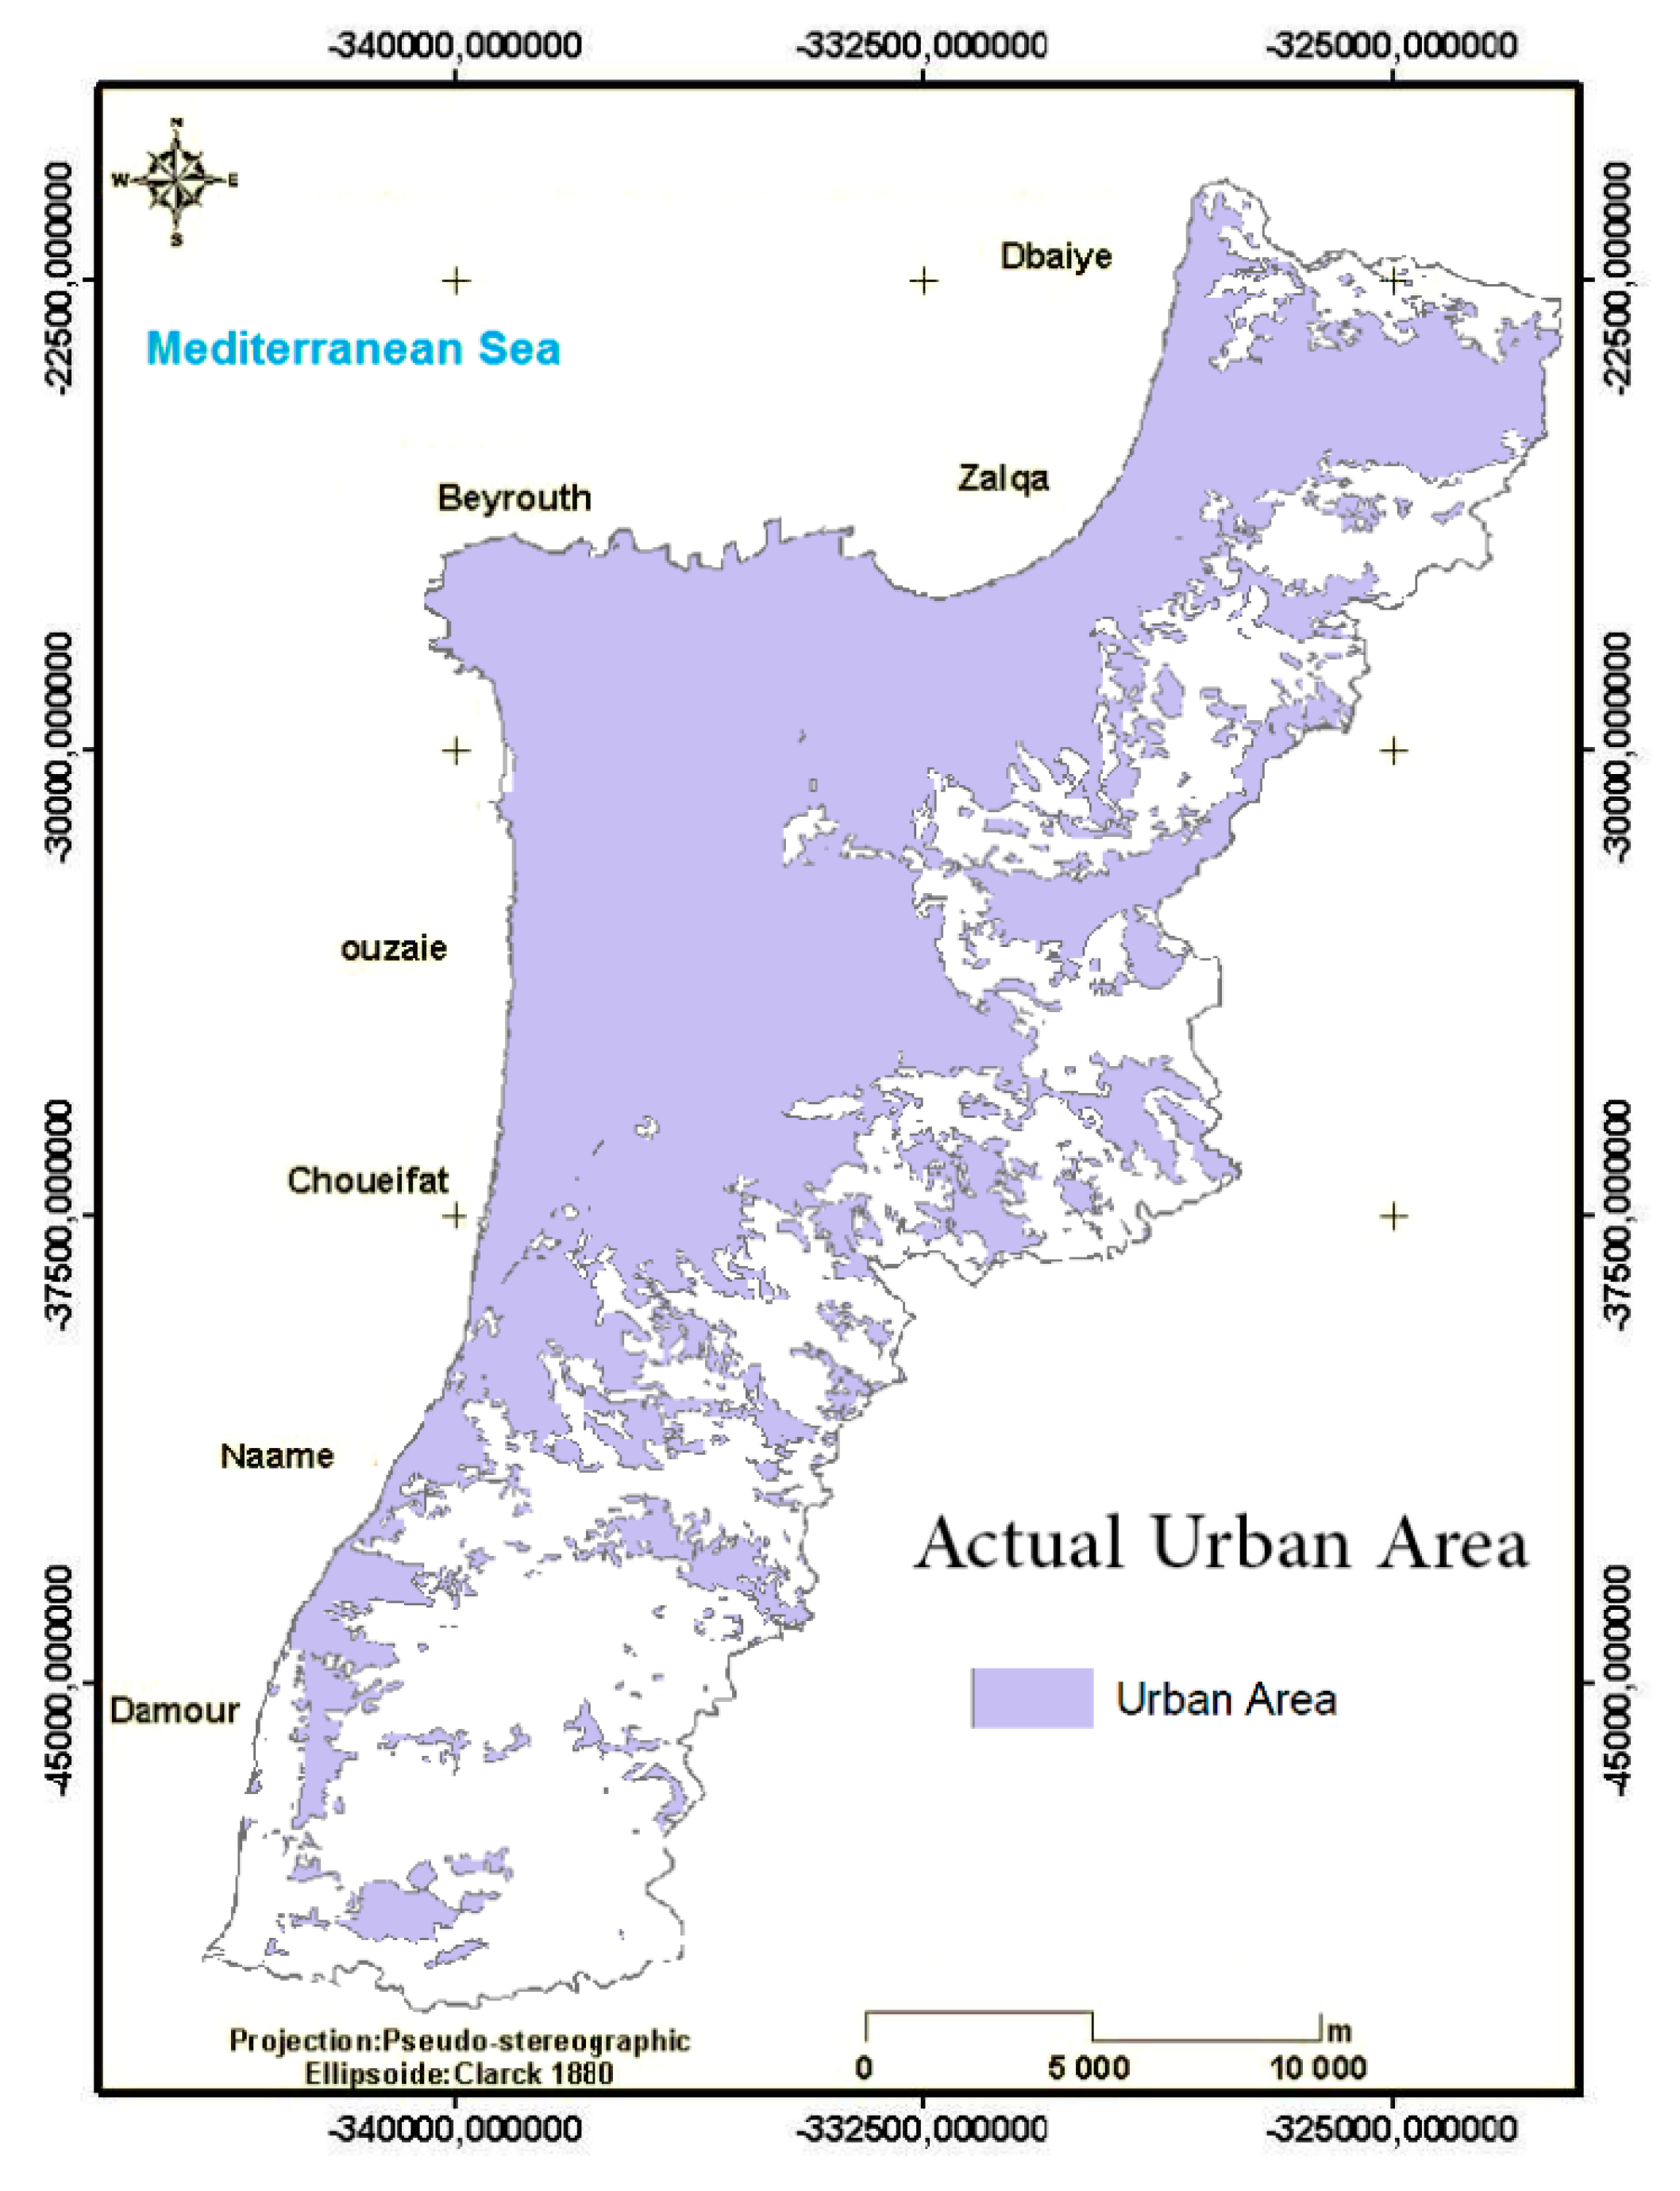
For validation, we compared an image taken from the RapidEye satellite in 2010 (Figure 10) with our projected map for the year 2010. The output reflects a high correlation between these two maps: it has an accuracy rate of 61%. For future validation studies, reducing the high number of possible variables and including some others, like environmental variables, are advised. Adjusting the projection map with new and updated data over the years would also be recommended.
Figure 10. Urban area based on RapidEye imagery for the GBA, 2010.
Land 03 00941 g010

5. Conclusions

In this research, it has been shown that multi-date satellite images can estimate urban growth with reasonable accuracy. With the absence of an updated planning tool and monitoring of the spatial growth in a city, this method proves to be a fast, inexpensive and reliable approach.
The study area (Greater Beirut Area), which corresponds to 2.2% of the Lebanese territory, is constantly subject to pressures arising from population growth (with an average density of approximately 6200 inhabitants∙km−2) [3]. With an average urban growth rate of 1.8 km2∙yr−1, this urban area continues to increase along the coastal zone and the nearby mountain, greatly reducing the green space and the rural character of these areas (1.7 km2∙yr−1 of green surfaces missing). In the future, the risk is that urbanization will spread to new natural areas, making Lebanon lose one of its major strengths and causing a decline in the quality of life in this country.
Initially, we were able to map the dynamics of urbanization on different dates and to estimate the average annual growth rate of urbanization. First, urban growth in multiple region and roads were identified; the civil war has contributed to the expansion of the urban area. It has forced more than a quarter of the population of this country to displace. In 1963, urbanization was concentrated around the historic city center of Beirut and along the main roads. Between 1963 and 1987, the rate of growth was very limited due to the civil war that began in 1975. Urbanization was mainly concentrated all along the main roads with partial outer expansion to the immediate suburbs of the city. Between 1987 and 1994, while the civil war was ended in 1990, the process of urbanization had accelerated along the transport network and through the flat suburban area of the GBA. Between 1994 and 1998, the growth rate was very high, higher than the average, which is due to the large reconstruction effort encouraged by the Lebanese government after the end of the war and supported by foreign investment and aid [20]. The period 1998–2003 is characterized by slow economic growth and, thus, a reduction in construction. Lastly, between 2003 and 2005, the growth rate rises again, due to the new government economic policies that promoted foreign investment [30]. Then, the density of the road network was investigated with an increasing density when approaching the city of Beirut. Next, the population density in the GBA was examined; as we reach the city center, a smaller population density is found. As for slopes and altitude, a gentle slope (<10%) and an altitude between 0 and 200 m above the sea level have a huge attraction for population growth. Then, a logistic regression model was applied. In the results, the potential of the urban development map was created. This last assisted in generating an urban growth scenario that focus on a projection till 2045 every five years. This model has a success rate of 61%. Optimistically, this map will provide policy makers and urban planners in Lebanon an essential decision tool to support upcoming urban planning in this study area or in others major cities in Lebanon. However, further procedures should be implemented in a future report by integrating the variety of demographic, economic and environmental parameters.

Acknowledgments

This manuscript has benefited from the comments and suggestions of different anonymous reviewers.

Author Contributions

The main text of the paper was authored by Ghaleb Faour and Mario Mhawej. The reviewers’ comments were also responded to by both authors.

Conflicts of Interest

The authors declare no conflict of interest.

References

  1. Fusilli, L.; Marzialetti, P.; Laneve, G.; Santilli, G. Urban growth assessment around Winam Gulf of Kenya based on satellite imagery. Acta Astronaut. 2014, 93, 279–290. [Google Scholar] [CrossRef]
  2. Jat, M.K.; Garg, P.K.; Khare, D. Monitoring and modelling of urban sprawl using remote sensing and GIS techniques. Int. J. Appl. Earth Obs. Geoinf. 2008, 10, 26–43. [Google Scholar]
  3. Council for Development and Reconstruction (CDR); Lebanese Directorate of Geographic Affairs (DGA). Schéma Directeur d’Amenagement du Territoire Libanais (SDATL); Report of Phase 1, Diagnosis and Problematic; Dar IAURIF Group: Beirut, Lebanon/Paris, France, 2002; Volume 6, p. 188. [Google Scholar]
  4. Zhang, Z.H.; Su, S.L.; Xiao, R.; Jiang, D.W.; Wu, J.P. Identifying determinants of urban growth from a multi-scale perspective: A case study of the urban agglomeration around Hangzhou Bay, China. Appl. Geogr. 2013, 45, 193–202. [Google Scholar] [CrossRef]
  5. Linard, C.; Tatem, A.J.; Gilbert, M. Modelling spatial patterns of urban growth in Africa. Appl. Geogr. 2013, 44, 23–32. [Google Scholar] [CrossRef]
  6. Wu, Q.; Li, H.-Q.; Wang, R.-S.; Paulussen, J.; He, Y.; Wang, M.; Wang, B.-H.; Wang, Z. Monitoring and predicting land use change in Beijing using remote sensing and GIS. Landsc. Urban Plan. 2006, 78, 322–333. [Google Scholar] [CrossRef]
  7. Cheng, J.Q.; Masser, I.; Ottens, H. Understanding Urban Growth System: Theories and Methods. Available online: http://www.itc.eu/library/Papers_2003/art_proc/cheng.pdf (accessed on 23 April 2014).
  8. Bracken, A.J.; Tuckwell, H.C. Simple mathematical models for urban growth. Proc. Roy. Soc. Lond. Math. Phys. Sci. 1992, 438, 171–181. [Google Scholar] [CrossRef]
  9. Dmitriev, V.I.; Kurkina, E.S.; Simakova, O.E. Mathematical models of urban growth. Comput. Math. Model. 2011, 22, 54–68. [Google Scholar] [CrossRef]
  10. Hu, Z.Y.; Lo, C.P. Modeling urban growth in Atlanta using logistic regression. Comput. Environ. Urban Syst. 2007, 31, 667–688. [Google Scholar] [CrossRef]
  11. Poelmans, L.; van Rompaey, A. Complexity and performance of urban expansion models. Comput. Environ. Urban Syst. 2010, 34, 17–27. [Google Scholar] [CrossRef]
  12. Fang, S.F.; Gertner, G.Z.; Sun, Z.L.; Anderson, A.A. The impact of interactions in spatial simulation of the dynamics of urban sprawl. Landsc. Urban Plan. 2005, 73, 294–306. [Google Scholar] [CrossRef]
  13. Eric, V. Une Ville Et Ses Urbanistes: Beyrouth En Reconstruction. Ph.D. Thesis, Universerty De Paris I Sorbonne, Paris, France, 2002; p. 646. [Google Scholar]
  14. May, D. Beyrouth 1825–1975: Un Siècle et Demi d’Urbanisme; Ordre des Ingénieurs et Architectes: Beirut, Lebanon, 2001. [Google Scholar]
  15. Huybrechts, E.; Verdeil, E. Beyrouth entre reconstruction et métropolisation—Beirut between reconstruction and metropolization. Villes en Parallèle 2000, 32, 63–87. [Google Scholar]
  16. Yassin, N. Beirut. Cities 2012, 29, 64–73. [Google Scholar]
  17. Faour, G.; Haddad, T.; Velut, S.; Verdeil, E. Beyrouth: Quarante ans de Croissance Urbaine. Revue Mappemonde, N° 79. 2005. Available online: http://mappemonde.mgm.fr/num7/articles/art05305.pdf. (accessed on 22 April 2014).
  18. Aguayo, M.I.; Wiegand, T.; Azócar, G. D.; Wiegand, K.; Vega, C.E. Revealing the driving forces of mid-cities urban growth patterns using spatial modeling: A case study of Los Ángeles, Chile. Ecol. Soc. 2007, 12, 13. [Google Scholar]
  19. Lu, C.; Wu, Y.Z.; Shen, Q.P.; Wang, H. Driving force of urban growth and regional planning: A case study of China’s Guangdong Province. Habitat Int. 2013, 40, 35–41. [Google Scholar] [CrossRef]
  20. Ascione, M.; Campanella, L.G.; Cherubini, F.; Ulgiati, S. Environmental driving forces of urban growth and development: An emergy-based assessment of the city of Rome, Italy. Landsc. Urban Plan. 2009, 93, 238–249. [Google Scholar] [CrossRef]
  21. Hasselmann, F.; Csaplovics, E.; Falconer, I.; Bürgi, M.; Hersperger, A.M. Technological driving forces of LUCC: Conceptualization, quantification, and the example of urban power distribution networks. Land Use Policy 2010, 27, 628–637. [Google Scholar] [CrossRef]
  22. Bhatta, B. Analysis of urban growth pattern using remote sensing and GIS: A case study of Kolkata, India. Int. J. Remote Sens. 2009, 30, 4733–4746. [Google Scholar] [CrossRef]
  23. Fichera, C.R.; Modica, G.; Pollino, M. Land cover classification and change-detection analysis using multi-temporal remote sensed imagery and landscape metrics. Eur. J. Remote Sens. 2012, 45, 1–18. [Google Scholar] [CrossRef]
  24. Modica, G.; Vizzari, M.; Pollino, M.; Fichera, C.R.; Zoccali, P.; di Fazio, S. Spatio-temporal analysis of the urban–rural gradient structure: An application in a Mediterranean mountainous landscape (Serra San Bruno, Italy). Earth Syst. Dyn. 2012, 3, 263–279. [Google Scholar] [CrossRef]
  25. Sudhira, H.S.; Ramachandra, T.V.; Jagadish, K.S. Urban sprawl: Metrics, dynamics and modelling using GIS. Int. J. Appl. Earth Obs. Geoinf. 2004, 5, 29–39. [Google Scholar] [CrossRef]
  26. Pumain, D.; st Julien, T.; Cattan, N.; Rozenblat, C. Le Concept Statistique de la Ville en Europe; EUROSTAT: Document Statistique, Theme 3, Series E; Office for Official Publications of the European Communities: Luxembourg, 1992; p. 89. [Google Scholar]
  27. Landis, J.D.; Zhang, M. Modeling urban land use change: The next generation of the California urban future model. In Proceedings of the Land Use Modeling Workshop, Sioux Falls, SD, USA, 5–6 June 1997.
  28. McFadden, D. Conditional logit analysis of qualitative choice behavior. In Frontiers in Econometrics; Academic Press: New York, NY, USA, 1973; pp. 105–142. [Google Scholar]
  29. Dimitrios, T.; Giorgos, M. Urban growth prediction: A review of computational models and human perceptions. J. Geogr. Inf. Syst. 2012, 4, 555–587. [Google Scholar]
  30. Nizar, A. Investment Challenges in Lebanon; Working Paper; Organisation for Economic Co-Operation and Development: Paris, France, 2004. [Google Scholar]