Article

Assessing the Quality of Agricultural Landscape Change with Multiple Dimensions

1
Economic Research, MTT Agrifood Research Finland, Latokartanonkaari 9, 00790 Helsinki, Finland
2
Plant Production Research, MTT Agrifood Research Finland, Datum, Tietotie, 31600 Jokioinen, Finland
3
Economic Research, MTT Agrifood Research Finland, Laboratorium Uutetie 2 A, 31600 Jokioinen, Finland
4
Plant Production Research, MTT Agrifood Research Finland, Eteläranta 55, 96300 Rovaniemi, Finland
*
Author to whom correspondence should be addressed.
Land 2014, 3(3), 598-616; https://doi.org/10.3390/land3030598
Submission received: 19 December 2013 / Revised: 18 June 2014 / Accepted: 24 June 2014 / Published: 1 July 2014
(This article belongs to the Special Issue Landscape Perspectives on Environmental Conservation)

Abstract

:
Better recognition of public perceptions is called for in developing policies that affect landscape qualities, such as agri-environmental policies. The present study focused on the evaluation of typical agricultural landscapes in Finland. We utilized and operationalized the visual landscape quality scales introduced by Tveit et al. (2006) and further explored how these scales can be applied in citizen evaluation of agricultural landscapes. From landscape data collected via an Internet survey, we analysed whether and how the attributes of agricultural landscapes were linked to their evaluation. The results demonstrated that visual concepts such as openness, naturalness, species richness and the impression of being taken care of were significantly associated with six landscape attributes, i.e., grain, cattle, bales, farmhouses, buses and disturbances. A relationship between key landscape concepts and normative evaluation was found. The normative pleasantness of the landscape also significantly associated with individual landscape attributes and the socio-demographic characteristics of the perceivers.

1. Introduction

The importance of the agricultural landscape for rural livelihoods, culture and the identity of rural residents is well recognized [1,2]. Although rural policies, and agri-environmental schemes (AES) in particular, impose basic obligations on farmers to keep the landscape open and well managed, the implementation of AES activities often compromises different aims in farming [3,4]. Furthermore, AES do not account for perceptions of the agricultural landscape among the public. Recent policies have emphasised better recognition of public perceptions of landscape qualities. For example, the European Landscape Convention [5] suggests that landscapes and their changes should be identified and assessed “by the interested parties and the population concerned” (Article 6). It also calls for procedures for the participation of the general public, local and regional authorities, and other parties with an interest in the definition and implementation of landscape policies (Article 5).
Although research has focused on citizen evaluation of landscapes and landscape characteristics, this research has very often concerned tourism, heritage or landscapes with a specific natural value. However, the European Landscape Convention [5] and the Faro Convention on the Value of Cultural Heritage for Society [6] emphasize everyday landscapes. According to these Conventions, agricultural landscapes without any specific value, such as a high natural value or value as traditional biotopes, should attract equal concern. In particular, it is important to define those agricultural landscape attributes that are changing in response to agricultural policy and determine the effects of these changes on how the landscapes are evaluated.
Some researchers have aimed to capture the multidimensionality of landscape qualities with a limited number of measures [7,8,9,10]. These measures attempt to combine various aspects of the landscape that are assumed to affect subjective landscape assessment. Based on the literature, Tveit et al. [10] identified nine key concepts that describe different characteristics of the landscape: stewardship, coherence, disturbance, historicity, the visual scale, imageability, complexity, naturalness and ephemera. These key visual concepts focus on different aspects of the landscape, and together result in the holistic experience of its visual quality. The concepts of Tveit et al. [10] suggest that some universal ways exist to evaluate a landscape, even though cultural and genetic factors influence our perceptions, implying that the concepts and context are observer dependent.
Tveit et al. [10] demonstrated with the help of agrarian landscape photographs the importance of the key concepts. They provided objective illustrations of quality but did not use the concepts in measuring citizen perceptions of the landscape. The key visual concepts were not evaluative on a positive to negative scale, i.e., high or low quality landscapes, but as expressed by Tveit et al. [10], some of these concepts may increase visual quality. They stated that empirical research is needed on the relationship between the concepts and landscape preferences. Although structured with key concepts, landscape quality can be subjectively perceived. Sevenant and Antrop [11,12] measured individual perceptions of quality, and demonstrated a correlation between some of the key visual concepts and the aesthetic quality of the landscape in the case of Belgium. However, only half of these concepts were found to be reliable predictors. Hence, more empirical studies are needed on the relationship between key landscape concepts and normative evaluation of the landscape.
Everyday agricultural landscapes are multidimensional, both in spatial and temporal terms [13]. Besides cultivated landscapes and semi-natural biotopes (such as grazing lands), agricultural landscapes are comprised of various elements, including wild nature (plants, rocks, water), man-made elements such as buildings of different ages, roads and transmission lines, and animals (wild and domesticated), as well as signs of farming (bales, fences). Previous literature has demonstrated that the presence of a single landscape attribute may cause a marked change in the overall subjective assessment of the landscape structure and quality (e.g., [14,15,16]). However, the relationship between landscape attributes, particularly agricultural attributes, and key characteristics of landscape quality, such as those presented by Tveit et al. [10], is open to question. Furthermore, research has revealed that perceptions or experiences of agricultural landscape quality reflect a number of socio-economic, psychological and cultural factors, such as age, profession, education, and the sense of place of the perceiver. A distinction can therefore usually be made, for example, between farmers, city dwellers, experts and conservationists [17,18,19,20].
Photographs have increasingly been used to explore landscape evaluations (e.g., [18,19,21,22,23,24,25]). If photographs are used to evaluate the quality of the landscape, the quality of the photographs themselves may affect the evaluation [26]. As argued by Rose [27], an image has particular effects upon us, depending on its contextual information (actual and expressive contents, colour, spatial organization and light). Colour photographs provide more information on the landscape than black-and-white photographs [28,29], but they can be more sensitive to the differences caused by the weather conditions or the period during the growing season, for example. An experiment by Shuttleworth [26] indicated that black-and-white photographs tend to induce more extreme and more highly differentiated responses than colour photographs, and that the latter relate more closely to field responses. In using photographs to investigate landscape evaluations, we also took the opportunity to examine the effect of the type of photograph on evaluations of various contexts.
The present study focused on landscape evaluations by citizens based on photographs representing five agricultural landscapes in Finland with changing attributes. The first objective was to use the indicators suggested by Tveit et al. [10] to measure citizen perceptions of landscape quality from several landscape photographs, as a limited amount of space is available in a survey and respondent effort needs to be kept on moderate level. A second objective was to identify the relationships between the key concepts (those developed by Tveit et al. [10]) measurable visual attributes of the agricultural landscape, and their normative (positive and negative) ratings. Furthermore, we compared landscape evaluations between black-and-white and colour versions of the same landscape photographs to determine whether measures of key concepts are sensitive to the photograph type.

2. Methods

2.1. Survey Design

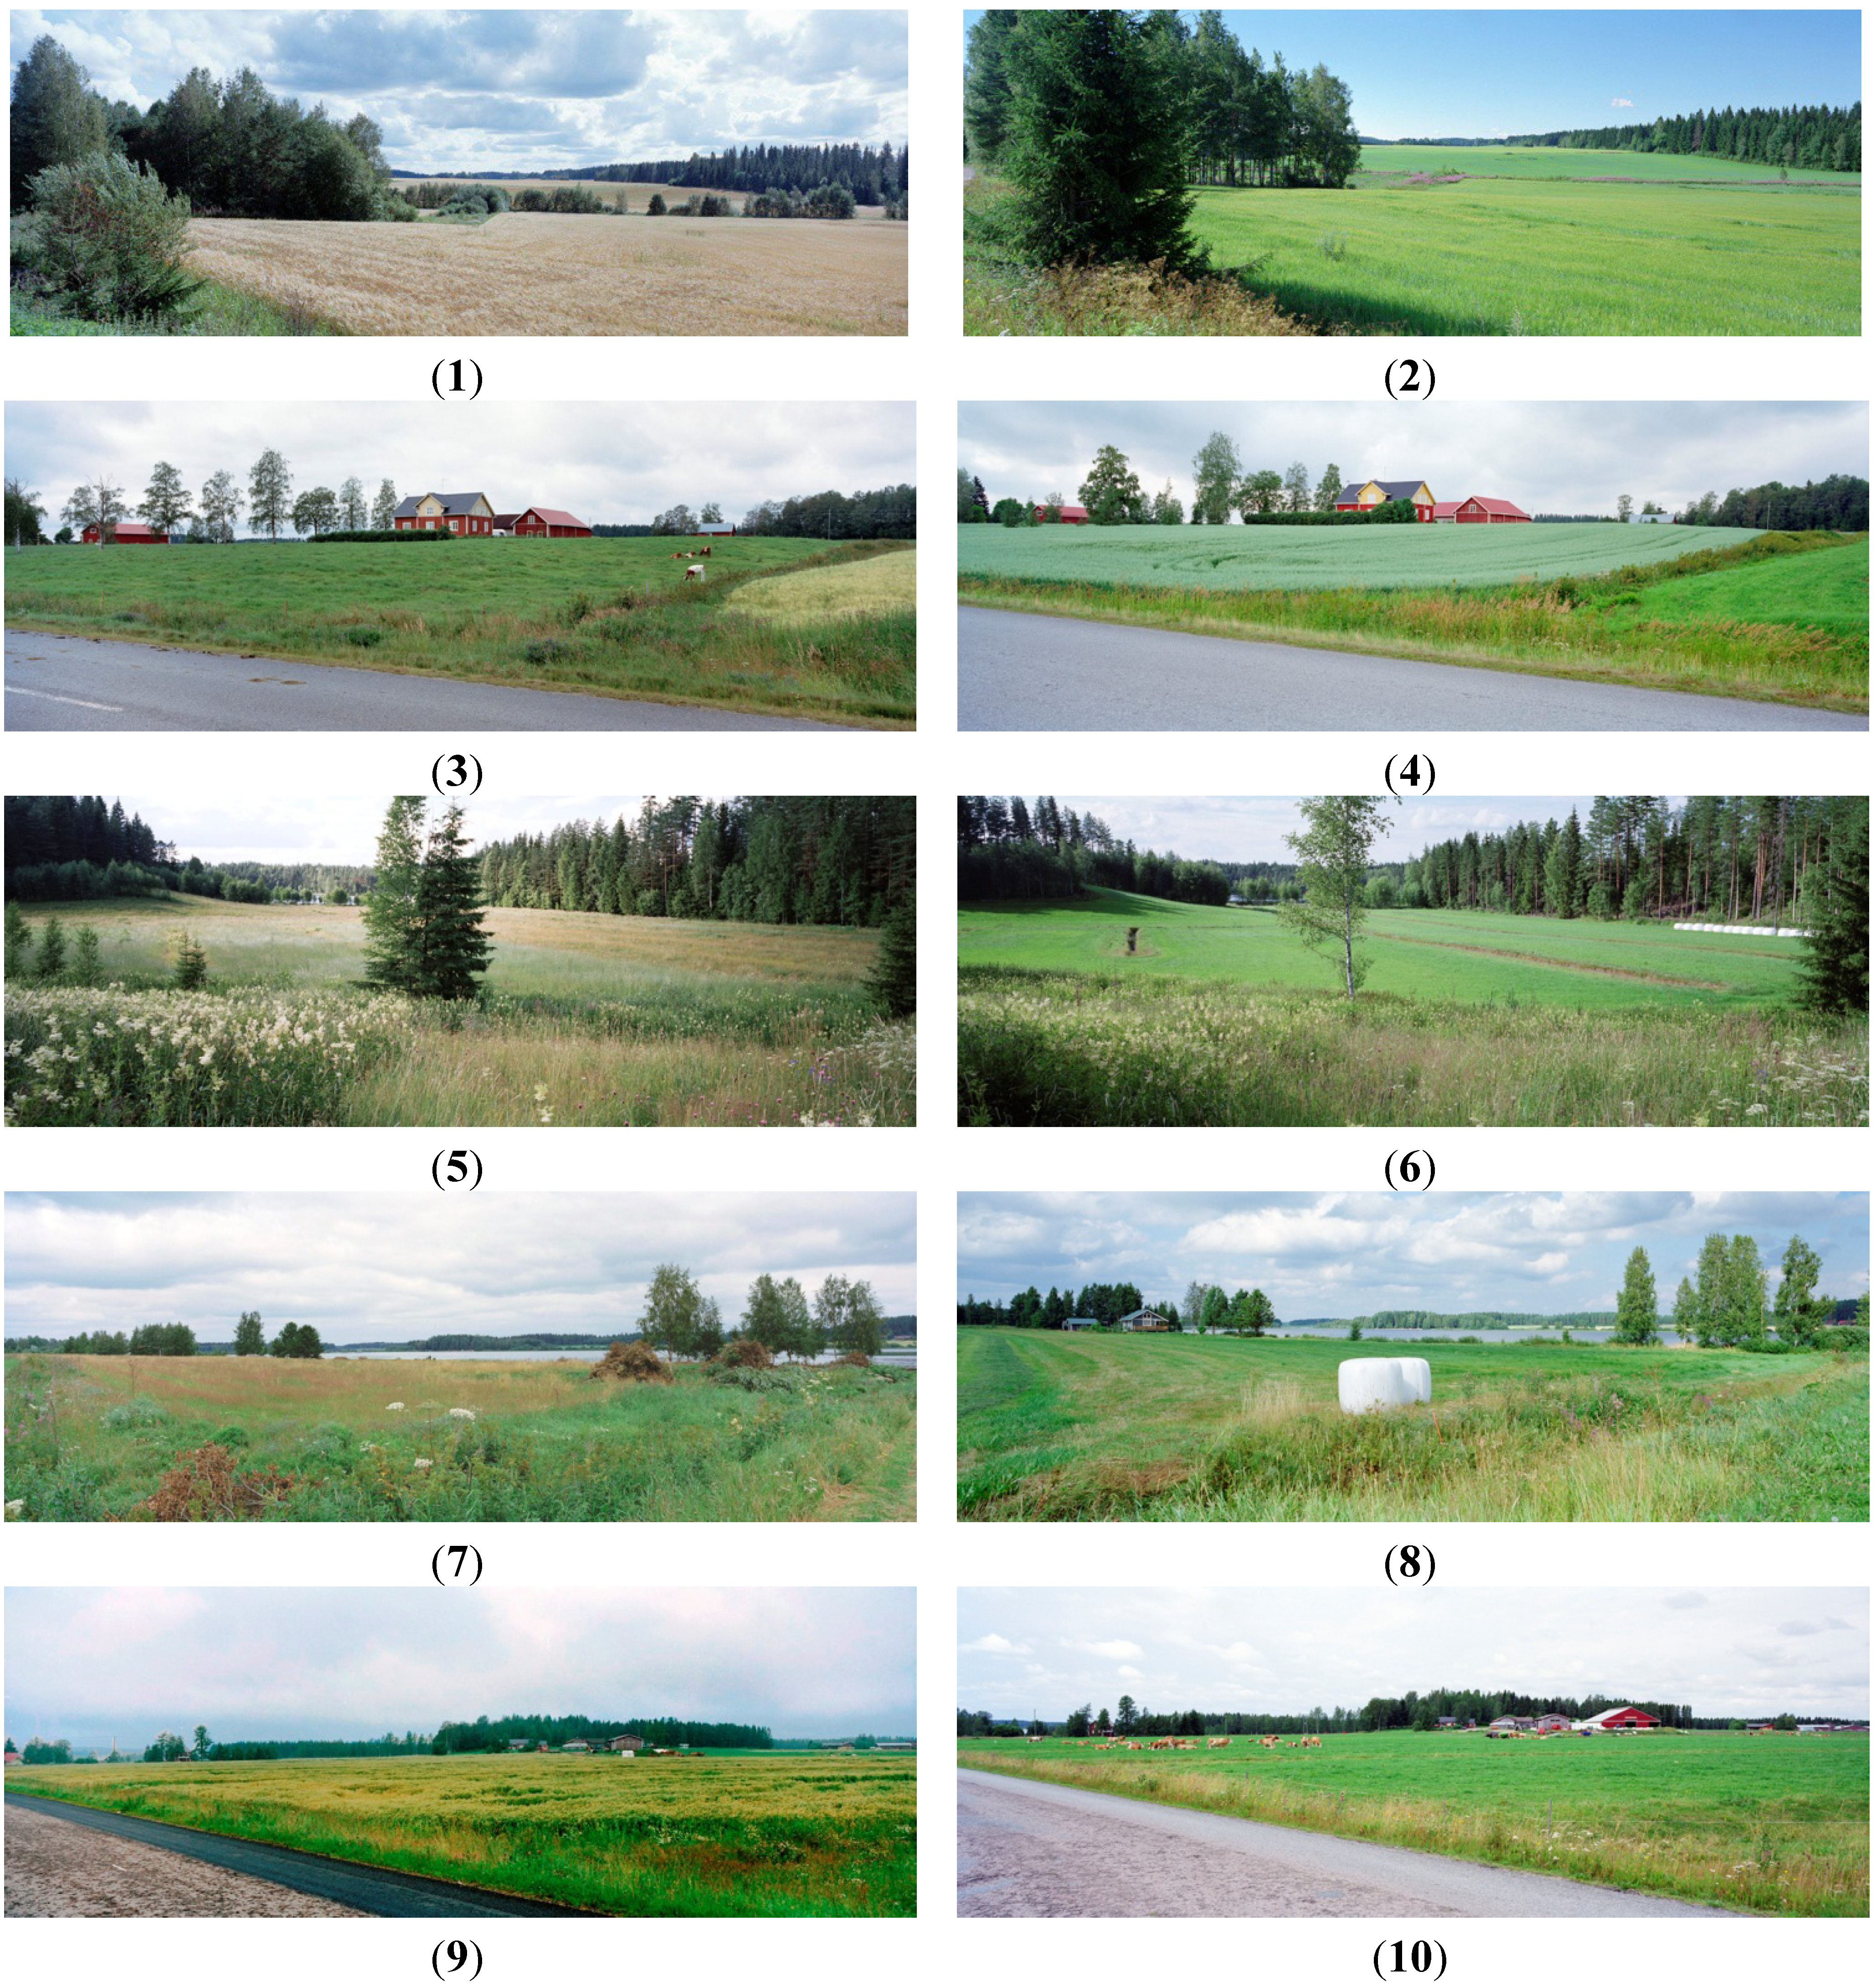
2.1.1. Selection of Photographs

In the survey, we illustrated the landscape using photographs. In landscape evaluation studies, the landscapes and their attributes have most often been visualized with aerial or landscape photographs (e.g., [18,19,21,22,23,24,25]). Here, we also opted to use photographs rather than on-site methods, as they allow more people to participate in the research, make the research less expensive [19,30] and enable comparisons between different landscape types, since they direct the observer’s focus to visual qualities instead of assessments based on other senses [31]. A number of researchers have reported high correlations between photo-based and on-site evaluations of landscapes [32]. Photographic visualization is also an easily applicable method in landscape evaluations via Internet questionnaires [33,34].
In our Internet survey questionnaire, respondents were presented photographs of five agricultural landscapes, with two photos of each landscape taken at different times of the year: in mid- and late summer (Figure 1). For half of the respondents, the photos were presented in black and white, while colour photos were presented to the other half in order to examine the effect of image type on the assessments.
Figure 1. (110) Photographs used in the survey (colour versions, late summer on the left, mid-summer on the right).
Land 03 00598 g001
The photographs were selected from an archive of 2950 images of agricultural landscapes in Finland from 13 different areas representatively around the country [35] taken in the years 2000, 2007 and 2010.

2.1.2. Selection of Attributes

Previous research provided further guidelines for identifying the landscape attributes and selecting the photographs. Summarizing past literature guidelines [36], landscape characteristics may be grouped into two main categories: the level of management of vegetation, and the status and condition of man-made elements in the landscape. Regarding the cultivation style, Howley [37] and Howley et al. [38] concluded that people provide higher evaluations of traditional, more extensive farming landscapes than more modern, intensive farming ones. In general, evaluations are lower if landscapes consist of homogeneous monocultures [18,39,40,41]. Arriaza et al. [42] reported that the visual quality of the landscape increases as a function of the percentage cover of vegetation. Benjamin et al. [40] also demonstrated that vegetation matters, as abandoned farmland was found to be the most unfavourable landscape, followed by cornfields. Rechtman [43] studied the effect of the crop texture and found that the presence of vegetation had a positive impact on preferences, but also that a mixture of field crops and orchards was appreciated more than a homogeneous crop texture.
Previous studies have shown that man-made attributes have a powerful effect on evaluations. Rural buildings [44], particularly farm buildings [45,46] and cultural buildings [47,48], are positively related to landscape evaluations, especially when these buildings are old [41], traditional [16,37,49] or well preserved [42]. Moreover, respondents approve of the presence of visual dividers, i.e., buffer zones that contain grassy or tree-covered areas, hedgerows or terraces [15,45,50,51], and the presence of grazing animals [37,46,49].
Beyond the previous literature, our aim was to focus on those attributes that had typically changed in the Finnish agricultural landscape due to policy and technological changes: a decrease in cattle production in the southern part of Finland, less frequent turn-out of cattle to pasture, technological changes in fodder production/hay storage systems, the increasing size of farm compounds and enlarged field plots leading to a decrease in field edges. The 10 photographs from five sites were selected so that visual characteristics in the agricultural landscapes could be identified with landscape attributes. By applying the ideas from previous studies to Finnish conditions [35], some of the photographs represented the grain production landscape, and some depicted grass production for cattle farming.
Cattle farming was also visible in two photographs as the presence of cattle or silage bales. At one of the sites, the landscape variation resulted from the management of ditch edges by either removing or allowing bushes and small trees to grow (photos 1 and 2). There was also variation in the presence of agricultural buildings, which were included in five of the photographs. One of the photographs (photo 7) included a landscape disturbance in the form of a pile of brushwood. The characteristics of the photos could be converted into numerical information on the landscape. The image content could be expressed in terms of landscape characteristics that were coded in the data as six dichotomous variables: grain/grass, cattle, bales, farmhouses, bushes and disturbances. These variables varied between the photographs and sites.
After viewing each photograph, the respondents were asked to evaluate the landscape. This was done by utilizing the key concepts introduced by Tveit et al. [10], complemented with evaluation of pleasantness and biodiversity. Using the concepts of Tveit et al. as a starting point, we applied the idea of semantic differential scales [52] and aimed to find adjective pairs that described and operationalized each dimension in a way that could be easily presented to Finnish respondents in the Finnish language. Consequently, the English translations of the adjective pairs measured were: pleasant–unpleasant, taken care of/maintained–not taken care of/not maintained (“stewardship”), consistent–diffuse (“coherence”), harmonious–disturbing (“disturbance”), involve history-only reflect the present (“historicity”); open–closed (“visual scale”), original–typical (“imageability”), diverse–monotonous (“complexity, diversity”), natural–human modified (“naturalness”), stable–changing (“ephemera”) and rich in species–poor in species (“biodiversity”). The evaluation was measured by asking respondents to rate each photograph on a five-point scale between each word pair. These adjective pairs were tested in a pilot study, and as an adequate spread of the data for each measure was obtained and no indication of misunderstanding of the word pairs was observed, the adjective pairs were accepted in the final survey as such. In the following, we use the first adjective in each pair to describe the dimension.

2.1.3. Measures of Socio-Demographic Profile

Previous research has demonstrated that the socio-demographic profile of the perceiver, whether a resident or visitor, is associated with landscape perceptions. In particular, landscape evaluations have been found to be affected by the perceiver’s educational level [38,53,54,55,56] and gender [37,49,55]. Moreover, the length of residence [57,58] and age of the perceivers [14,16,37,49,55,56] can be of importance, as they relate to previous experiences and knowledge of the history of a landscape. The childhood environment (farm, rural or urban) [37,49,51] significantly affects people’s evaluation of scenic beauty. People who are more acquainted with a landscape experience the landscape differently and thus express different preferences (e.g., [37]). Rural dwellers, i.e., people who live in the countryside but whose livelihoods do not depend on agriculture, show different preferences compared to experts or farmers [18]. Furthermore, a profession related to the economic use of natural resources has been found to have an effect on the evaluation of landscape utilization (e.g., [20,24,59,60,61,62]). Based on these ideas from previous studies, in addition to gender and age, the socio-demographic background of the respondents, such as education, profession and income, and variables related to the living environment, i.e., current and childhood living environment, were measured at the end of the survey.

2.2. Data

An online Internet survey conducted in April 2011 provided information on the evaluation of the agricultural landscape. The data were collected from the Internet panel of a private survey company, Taloustutkimus. The panel comprised 30,000 respondents who had volunteered to participate in the panel [63]. After the pilot survey of 100 people, a random sample of 3016 respondents was selected, and 800 people completed the survey, resulting in a response rate of 27%. The data were close to representative of the general population [64] regarding gender (45% females in the data, 51% in the population) and age (mean 48 years in the data, 42 in the population). The educational level was somewhat higher in the sample, as 32% of respondents had a higher education, while in the population their share was 27%. The proportion of individuals with children in the family was clearly higher in the sample (29%) than in the general population (16%). The data were also somewhat skewed to over-represent people from other parts of the country than the more populated southern Finland (62% in the data, 50% in the population).

2.3. Statistical Methods

First, we analysed the operationalization of the scales developed by Tveit et al. [10]. This was done with descriptive analysis and by calculating the Spearman rank correlations between measures. The assumption of monotonic relationships between variables in Spearman correlation was investigated with cross tabulations and observed to be met in a clear majority of relationships. By correlating the measures with the evaluation of pleasantness (pleasant–unpleasant), we could also examine the association of the measures with normative evaluation.
Next, linear mixed models were selected to explain the variation in key visual concepts due to landscape attributes [65]. The effects of the five sites and of each individual were taken into account as random effects. All the landscape characteristics and socio-demographic variables were examined as potential explanatory variables (fixed effects) in these models. The models were built so that all the individually significant and consequently promising variables were included in the model together. Then, the non-significant variables were deleted from the model one by one based on the highest p-value (Type 3 F-tests) in each reduced model. The variable elimination was continued until all the p-values were significant or very close to significant. The model for normative evaluation is presented in detail, but the 10 models for quality scales are only presented with indicative coefficient signs and significances to save space. Although not optimal for the situation, as the response variables were measured on an ordinal five-point scale instead of as a continuous measure, the method was considered as the best possible alternative, because it yields results in a user friendly form. Other assumptions of the model were tested using graphical methods: residuals were plotted against the fitted values and the normality of the residuals was checked through quantile-quantile plots, and the assumptions were reasonably met.
The final models for key visual concepts of the landscape were constructed so that the potential explanatory variables were first tested individually with the random effects in the model. Based on these initial models, the significant variables were simultaneously added to the combined model, and the model was reduced by eliminating non-significant variables one at a time. The statistical modelling was performed using the MIXED procedure of SAS 9.3 (SAS Institute Inc., Cary, NC, USA).
The effect of photograph type (black and white vs. colour) was further analysed by comparing the means of evaluations between types.
Linear mixed models were also used to analyse the effects of the photograph itself, the photograph type (black and white vs. colour) and their interaction in various concepts. In these models, the effects of each individual were considered as random effects.

3. Results

3.1. Evaluating Measures of Key Visual Concepts

In Table 1, we present descriptive information on the measures of key visual concepts developed by Tveit et al. [10], as well as on the measures of pleasantness and biodiversity. The means of the measures indicated the participants’ perceptions of the openness of the agricultural landscape, as the openness quality measure was rated higher in all photographs than other concepts. The means also expressed the respondents’ rather high perception that the landscapes had been taken care of and that they were harmonious and consistent. Approximately in the middle of the scales from 1 to 5 were evaluations of the naturalness, stability and originality. Normatively, the landscapes were perceived as rather pleasant with a mean of 4.1 for all photographs. The F-test showed that the concepts were able to reveal differences in landscapes between the photographs, as the means differed significantly for all concepts. Table 1 presents the lowest and highest evaluations, showing that the highest evaluations, in particular, accumulate in individual photographs (5).
Table 1. Descriptive statistics of the key visual concepts measured on a scale from 1 (low) to 5 (high). The differences between photographs were statistically significant for all the measured concepts according to the F-test (p < 0.001).
Photograph12345678910
Means, Scale 1, ..., 5
Pleasantness4.414.294.204.264.314.123.813.963.633.89
Species richness3.393.183.473.063.883.303.883.063.213.43
Taken care of4.154.293.934.423.024.222.344.173.373.87
Consistency3.773.923.633.873.473.623.083.473.263.30
Harmony4.074.003.813.953.893.563.273.313.333.39
Involve history3.503.303.553.323.743.183.683.023.533.37
Openness3.974.243.763.783.663.683.773.833.733.82
Originality2.932.752.932.853.092.682.922.732.762.79
Diversity3.583.203.553.343.803.313.483.273.043.40
Naturalness2.632.382.652.163.702.383.842.222.702.41
Stability2.992.923.013.023.092.862.992.842.892.84
Bold highest value; bold italics lowest value in each concept. SD—Standard deviation.
The correlations between key visual concepts (Table 2) indicated that nearly all of these, as well as the normative measures, were significantly associated with each other. This implies that as stated by Tveit et al. [10], the concepts are interrelated and work together to form the totality of visual landscape. The variation in correlations also indicated that some concepts are more closely linked than others.
The correlations were especially weak between naturalness and other measures. However, they were particularly strong between the measure of diversity and other scales, and between harmony and other scales, as well as between harmony and consistency (0.534) and also between species richness and diversity (0.502).
From the correlations with the evaluation of pleasantness (pleasant–unpleasant), we were also able to examine the association of key concepts with the normative positive–negative dimension. All of the measures of key concepts correlated positively and significantly with pleasantness. Regarding some concepts, this was obvious, as concepts such as harmony can be easily interpreted to represent positive and negative evaluations. The correlations with the normative scale were weakest for the concept of naturalness, which nevertheless had a significant positive association with pleasantness.
Table 2. Spearman correlation coefficients between 11 landscape evaluation scales.
PleasantnessTaken Care ofConsistencyHarmonyInvolve HistoryOpennessOriginalityDiversityNaturalnessStabilitySpecies Richness
Pleasantness1
Taken care of0.488 **1
Consistency0.451 **0.459 **1
Harmony0.645 **0.440 **0.534 **1
Involve history0.226 **−0.054 **0.137 **0.193 **1
Openness0.428 **0.312 **0.456 **0.437 **0.245 **1
Originality0.239 **0.058 **0.166 **0.214 **0.241 **0.171 **1
Diversity0.450 **0.165 **0.252 **0.430 **0.306 **0.277 **0.337 **1
Naturalness0.069 **−0.356 **−0.105 **0.060 **0.179 **−0.048 **0.192 **0.253 **1
Stability0.165 **0.079 **0.128 **0.216 **0.063 **0.097 **0.059 **0.173 **0.269 **1
Species richness0.310 **−0.0120.144 **0.286 **0.308 **0.193 **0.264 **0.502 **0.388 **0.208 **1
** Correlation is significant at the 0.01 level (2-tailed). Correlations over |0.4| with bold.

3.2. Modelling Landscape Evaluations

The results of the linear mixed model for pleasantness are reported in Table 3. The model takes into account the simultaneous effects of the time of year, photograph type (black and white or colour), landscape characteristics, socio-demographic variables and random effects of the site and individual. Table 3 provides least square means estimates, which are model-based means for each class (for example, means of pleasantness on a scale from 1 to 5 for black-and-white and coloured photos), otherwise assuming average individual and photograph characteristics.
As can be seen in Table 3, if other variables were held at the average level, bushes by ditches improved the evaluation, while disturbances (piles of brushwood) reduced the level of pleasantness. The presence of cattle had a statistically significant, but minor positive effect on the general pleasantness evaluation. Other attributes (grain, bales, farmhouses) had no significant effect on pleasantness. These non-significances may also relate to correlations with other more significant variables in the model, for example in the case of farmhouses with the cattle, and in the case of bales with the time of the year, i.e., mid-summer.
The perceived pleasantness of the photographs negatively associated with them being taken in late summer, as the estimated means were lower with a somewhat significant p-value of 0.0498. Pleasantness was affected by the photograph type, with black-and-white landscapes receiving slightly higher evaluations. The model also revealed a significant interaction between photograph type and the season. In mid-summer photographs, the coloured versions were perceived as more pleasant than black and white, but the effect was opposite in late summer photographs.
Table 3. Linear mixed model results for the “pleasantness” scale of landscape evaluation.
Fixed EffectsClasses“Pleasantness” Scale
Estimated MeansType 3 Tests
EstimateStandard ErrorF-Valuep-Value
Cattle No4.1180.13115.18<0.0001
Yes4.2210.133
BushesNo4.0910.12913.440.0002
Yes4.2480.136
DisturbanceNo4.2250.1296.670.0002
Yes4.1140.136
Photograph typeBlack and white4.2180.1325.560.0187
Colour4.1210.133
SeasonLate summer4.1490.1333.850.0498
Mid-summer4.1910.113
Interaction between Season and Photograph typeLate summer B & W4.2680.13471.89<0.0001
Mid-summer B & W4.1690.134
Late summer Col.4.0300.132
Mid-summer Col.4.2130.135
Gendermale4.0630.13225.55<0.0001
female4.2760.133
Age13–304.1260.1422.780.0400
30–344.1110.141
41–554.1710.134
55–654.2710.134
EducationElementary school4.2090.1463.00.0178
Vocational school4.2290.135
Upper secondary school4.0430.141
College4.2550.139
University4.1130.138
Professional statusBlue collar4.2220.1362.340.0724
White collar4.1240.139
Entrepreneur, manager4.2300.137
Other4.1030.135
Region in FinlandSouthern 4.0800.1142.050.0698
Eastern4.2830.125
Middle4.0450.136
Western4.1030.115
Northern4.1160.126
Other (Åland)4.3910.427
Random effects EstimateStandard Errorz-valuep-value
Observation 0.2980.01816.81<0.0001
Site 0.0550.0391.400.081
Residual 0.5520.00959.96<0.0001
N800/8000
Pseudo R20.11
A few socio-demographic variables also had a significant effect on the perceived pleasantness. Female and older respondents had higher landscape evaluations. Education additionally had a significant effect. Those with a college or vocational education particularly valued the landscapes more than the other respondents. Professional status had significant positive effect on perceived pleasantness, i.e., blue-collar workers and entrepreneurs had higher evaluations. Evaluations were lowest in southern and central parts of the country.
The results of linear mixed models reported in Table 4 focus on the simultaneous effects of the landscape attributes on each of the key quality concepts. The table provides information on the significance of the effect and the direction of the association. Table 4 reveals that a grain field in the landscape associated significantly with consistency and negatively with originality, diversity, naturalness and species richness. For fields that were in grass production, landscape evaluation followed the opposite direction, since the landscapes that were not in grain production consisted of grassland. The existence of cattle in the landscape was related to lower perceived originality, diversity, naturalness and species richness. Bales on a field increased the impression of the landscape being taken care of, and surprisingly also the impression of harmony. However, such bales were negatively associated with most of the other scales. They reduced the perception of originality, diversity, naturalness, species richness and the sense of history attached to the landscape. Farmhouses only significantly associated with a few scales, increasing the impression of the landscape being human-modified and poor in species. Bushes that divided field plots increased the feeling that the landscape was taken care of, as well as the originality, diversity and species richness. However, bushes also increased the impression of a closed landscape and human modification of the landscape. Disturbances in the form of piles of brushwood reduced the consistency, originality and diversity of the landscape, as well as the impression of it being taken care of. The photographs that were taken in late summer associated significantly with diversity, history and species richness. The mid-summer photographs, by comparison, were perceived as more open and consistent, and the landscape was seen as taken care of. Presenting respondents with black-and-white instead of colour photos had a significant positive effect on the majority of the evaluations.
The concepts of openness, naturalness, species richness and the impression being taken care of were best explained by the landscape attributes according to goodness-of-fit statistics (see Pseudo R2 statistics in Table 4). The six significant landscape attributes (i.e., grain, cattle, bales, farmhouses, bushes, disturbances) in the analyses also associated quite differently with most of the key visual concepts. Only species richness, naturalness and diversity seem to be explained by rather similar variables.
To gain more insights into the effect of image type, we tested its effect separately by comparing the means of pleasantness scale evaluations between black-and-white and colour versions of the same photos (Table 5). For six landscapes out of 10, the black-and-white (BW) photographs received a higher evaluation than those in colour (C). Comparisons of means confirmed the model results, as we observed that particularly for the photos taken in late summer, the black and white versions received higher evaluations than the colour ones. Furthermore, the significant differences in late summer photographs appeared to be particularly related to the yellow-brownish colours of ripened vegetation. If these colours were present in colour versions of photos, the black and white equivalent appeared to produce higher evaluations. Among the photos taken in mid-summer, there was only a significant difference for one photo.
Table 4. Summary of the linear mixed models for each evaluative scale. The effect of landscape attributes on key visual concepts.
Taken Care ofConsistencyHarmonyInvolve HistoryOpennessOriginalityDiversityNaturalnessStabilitySpecies Richness
Significant variables and their direction in linear mixed models for each evaluative scale;
+/− Positive or negative effect; * p < 0.1; ** p < 0.05; *** p < 0.01
Fixed effects
Grain + *** − ***− ***− *** − ***
Cattle − ***− **− *** − **
Bales + *** + ***− *** − ***− ***− ***− ***− ***
Farm houses −* − *** − ***
Bushes + *** − ***+ ***+ ***− *** + **
Disturbances− ***− *** − ***− ***
Black and white + **+ *** + ***+ *+ ** + ***
Season+ ***+ *** − ***+ *** + **− ***− *− ***
Random effects
Observation******************************
Site***** *
Residual******************************
Pseudo R20.190.080.070.080.110.110.080.160.140.18
N800/8000800/8000800/8000800/8000800/8000800/8000800/8000800/8000800/8000800/8000
Full models are available from the authors.
Table 6 provides a summary of the differences between black-and-white and colour photographs in relation to the quality concepts. Table 6 also shows that the interaction between the photograph and photograph type was significant in all key concepts except in stability. The significant interaction indicates that the difference between color and BW photographs varies from picture to picture. From the table it can be observed that the photograph itself had a significant effect in all the concepts. Back-and-white photographs associated significantly with the evaluation in six concepts from 10. The concepts that were evaluated higher in black and white particularly involved history, originality and species richness. None of the concepts were evaluated higher in fewer coloured photographs than in black-and-white versions. The concept of consistency was evaluated equally, i.e., higher in two black-and-white and in two coloured photographs. It can also be noted that particularly the late summer photographs (in odd numbers) had higher evaluations for several concepts if they were in black and white.
Table 5. Landscape pleasantness in black-and-white (BW) and colour photographs and the statistical significance of differences between the means.
Photo NumberSeasonPleasantness, Mean BW Colourt-Test p-Value
1 Late summer4.484.340.012
2 Mid-summer4.194.400.000
3 Late summer4.254.150.096
4 Mid-summer4.314.200.061
5 Late summer4.464.160.000
6 Mid-summer4.114.120.935
7 Late summer4.083.550.000
8 Mid-summer3.904.030.065
9 Late summer3.703.550.051
10 Mid-summer3.923.870.476
All 4.144.040.000
Table 6. Linear mixed model with individual respondent as a random effect: effects of photograph, photograph type (Black-and-white BW, coloured C) and their interaction. Total number of photos = 10.
Type 3 Tests of Fixed Effects
F-Test p-Value
PhotographPhotograph Type (BW/C)Interaction between Photograph and Photograph Type (BW/C)BW Sig. Higher (p < 0.1) Photograph NumberC Sig. Higher (p < 0.1) Photograph Number
Taken care of<0.00010.460<0.00013, 5, 71, 2
Consistency<0.00010.199<0.00017, 91, 2
Harmony<0.00010.013<0.00013, 4, 5, 7, 92, 7
Involve history<0.00010.0010.0391, 2, 5, 7, 8, 9
Openness<0.00010.1130.0233, 5, 7
Originality<0.00010.0080.0241, 3, 4, 5, 7
Diversity<0.00010.020<0.00011, 7
Naturalness<0.00010.033<0.00011, 7, 9
Stability<0.00010.1170.263 7
Species richness<0.0001<0.00010.0121, 2, 3, 4, 5, 6, 7, 9, 10

4. Discussion

Our application of the key visual concepts presented by Tveit et al. [10] to measure citizen perceptions of agricultural landscape with adjective pairs produced feasible results. Following our aims, we examined the association between the concepts and normative evaluation in the case of the Finnish agricultural landscape, showing that all the original concepts of Tveit et al. [10] correlated with the normative concept of pleasantness. This result supports the observations of Sevenanat and Antrop [11] that concepts with similarities to those of Tveit et al. [10] were associated with a “beautiful” score. Nevertheless, it needs to be pointed out that some of the measures, such as naturalness, were conceptually and also empirically further from a positive–negative scale. In this sense, we cannot simply claim that landscape evaluation is a one-dimensional issue [7,8,10]. We added species richness to our measurement and found that it correlated rather highly with diversity. Thus, respondents appear to have conceptually associated species richness with the more general complexity and diversity of the landscape.
Our objective was also to identify the relationships between the key concepts and measurable attributes of the agricultural landscape. The citizen perceptions of the landscape in relation to key visual concepts were significantly associated with several physical landscape attributes. The landscape attributes contributed by particularly explaining openness, naturalness, species richness and the impression of being taken care of. Nevertheless, the six significant landscape attributes associated quite differently with the 10 key visual concepts, and only the concepts of naturalness and species richness were found to be explained by the same set of variables. This supports the importance of applying all these concepts in evaluation of the agricultural landscape. The concepts of originality, diversity and naturalness, in particular, related to several attributes that can be directed with agricultural policy.
The typical changes in agricultural landscapes could be identified and described with attributes to enable the modelling of landscape evaluations with a normative evaluation, i.e., a pleasantness scale. The results particularly implied the opposition of respondents towards the intensification of cultivation and the monotonicity of agricultural landscapes due to the increase in the size of field plots, as the results indicated that bushes dividing the plots may provide a positive impact and variation in an otherwise monotonous agricultural landscape. On the other hand, there is a current tendency to cultivate lands based on leasing agreements, which might lead to a decline in the maintenance of field margins and an increase in the growth of bushes. The farming culture may also be gradually changing: the removal of bushes is no longer necessarily considered by farmers to be an essential part of appropriate or good agricultural practices, as it used to be [66,67]. Preferences concerning the maintenance of vegetation may indicate gradual changes in both landscape stewardship and how it is perceived. In the AES, natural shrub vegetation (consisting of bushes) is not permitted. Planned and maintained bushes and trees are accepted in the AES special schemes on water protection zones, although they are not suggested or required in order to receive subsidies.
Grass plots, typically composed of several plant species, were valued more highly compared to plots of grain crops. Grass crops, which are often associated with a higher environmental value, were especially appreciated in relation to the dimensions of naturalness and diversity. On the other hand, previous studies have shown that the number of plots with various plant species has little impact on landscape valuation [47]. The growing of grass crops particularly affects the landscape due to the regional concentration of production systems. In Finland, the relative share of grass production is greater in northern areas and decreases towards the south. The impact of silage bales on the landscape was twofold. Although they were considered as signs of a managed landscape, they had a negative impact on the many other landscape concepts, as well as on the natural and historical dimension.
In our study, cattle were perceive as an element of pleasantness of the landscape, similarly to the findings of Grammatikopoulou et al. [47] in another study conducted in Finland, in which citizens were found to appreciate the presence of grazing animals in the landscape. However, according to our results, cattle were not perceived to increase the diversity or the naturalness of the landscape. The fact that the presence of livestock in the landscape was not seen as a positive feature in these dimensions can be associated with increased awareness of the environmental impacts of intensive livestock farming.
The results indicated a relatively minor value attached to farm buildings, as they did not affect the evaluation of pleasantness and were only clearly associated with human modification and poorness in species diversity. This was also against our expectations based on earlier findings regarding the significance of the presence of man-made elements in the landscape [46,47].
Colour photographs are currently favoured in landscape preference studies. As an additional outcome, this study provided information on the effect of the image type, and showed generally higher evaluations with black-and-white than with colour photos. Particularly concepts that related to originality and history were sensitive to photograph type. This could indicate that black-and-white photography, as an older technique, makes these concepts more salient in the respondents’ minds. On the other hand, colour photographs, which emphasize more distinctive features of the landscape, may also bring out the negative components related to the landscape. This is in contrast to Shuttleworth [26], who suggested that black-and-white photographs tended to induce more extreme and more highly differentiated responses than colour photographs. Our results particularly demonstrated a seasonal effect associated with the difference in perceptions between black-and-white and colour photographs, as the black-and-white photos hid the brownish colours of the late summer landscapes.

5. Conclusions

The European Landscape Convention places particular emphasis on taking public opinion into account in landscape policy and management. This study demonstrated that key visual concepts [10] provide a feasible tool for researchers to measure lay people’s perceptions of multidimensional landscapes, such as agricultural landscapes. Although, the significant dependences of key concepts on actual landscape attributes demonstrated the validity of the measures based on the concepts of Tveit et al. [10], further research is needed to compare the semantic differential technique with a more exhaustive evaluation of landscape character based on Tveit et al. [10].
The analysis indicated that future agri-environmental policy should emphasise the versatility of production. This could be seen in the higher evaluation of divided field plots and decreased monotony, as the results indicated that bushes dividing the plots provide a positive impact and variation. As grass and cattle in the landscape resulted in higher evaluations for several concepts, we can conclude that agricultural policy should lead to landscapes with versatility in production lines. This would also support other agri-environmental objectives such as rotational cultivation and the cycling of nutrients in farming.
The correlation between the key visual concepts and the normative evaluation of pleasantness of the agricultural landscape raises the possibility to reduce the dimensionality of analysis, which is an important research question to be further studied in the future. Although generalisations are needed for policy making, the more general and normative the evaluation is, the more interpretation is needed. However, discussions related to the different interpretations should be considered as a means to involve various actors in landscape planning and management. Thus, such discussions can serve one of the aims of evaluations, acting as means of communication.

Acknowledgments

We thank Tapio Heikkilä and Oiva Hakala for the possibility to use the photographs in this study.

Author Contributions

Eija Pouta participated in planning the survey, analyzing Table 1, Table 2 and Table 5, writing the results section and finalizing the article. Ioanna Grammatikopoulou reviewed the previous literature on agricultural landscape evaluations. Timo Hurme described the linear mixed models and provided the analysis for Table 3 and Table 4. Katriina Soini participated in planning the survey and writing the Introduction and the Discussion and conclusions. Marja Uusitalo took part in planning the survey and reviewed the literature on landscape evaluation methods.

Conflict of Interest

The authors declare no conflicts of interest.

References

  1. Ruiz, J.; Domon, G. Relationships between rural inhabitants and their landscapes in areas of intensive agricultural use: A case study in Quebec (Canada). J. Rural Stud. 2012, 28, 590–602. [Google Scholar] [CrossRef]
  2. Soini, K.; Vaarala, H.; Pouta, E. Residents’ sense of place and landscape perceptions at the rural-urban interface. Landsc. Urban Plan. 2012, 104, 124–134. [Google Scholar] [CrossRef]
  3. Kaljonen, M. Co-construction of agency and environmental management. The case of agri-environmental policy implementation at Finnish farms. J. Rural Stud. 2006, 22, 205–216. [Google Scholar] [CrossRef]
  4. Soini, K.; Aakkula, J. Framing the biodiversity of agricultural landscape: The essence of local conceptions and constructions. Land Use Policy 2007, 24, 311–321. [Google Scholar] [CrossRef]
  5. Council of Europe. The European Landscape Convention; Council of Europe: Strasbourg, France, 2000. [Google Scholar]
  6. Council of Europe. Faro Convention on Value of Cultural Heritage on Society; Council of Europe: Strasbourg, France, 2005. [Google Scholar]
  7. Rosley, M.S.F.; Lamit, H.; Rahman, S.R.A. Perceiving the aesthetic value of the rural landscape through valid indicators. Proced.—Soc. Behav. Sci. 2013, 85, 318–331. [Google Scholar] [CrossRef]
  8. Fry, G.; Tveit, M.S.; Ode, Å.; Velarde, M.D. The ecology of visual landscapes: Exploring the conceptual common ground of visual and ecological landscape indicators. Ecol. Indic. 2009, 9, 933–947. [Google Scholar] [CrossRef]
  9. Van der Jagt, A.; Craig, T.; Anable, J.; Brewer, M.J.; Pearson, D.G. Unearthing the picturesque: The validity of the preference matrix as a measure of landscape aesthetics. Landsc. Urban Plan. 2014, 124, 1–13. [Google Scholar] [CrossRef]
  10. Tveit, M.S.; Ode, Å.; Fry, G. Key concepts in a framework for analysing visual landscape character. Landsc. Res. 2006, 31, 229–256. [Google Scholar] [CrossRef]
  11. Sevenant, M.; Antrop, M. Cognitive attributes and aesthetic preferences in assessment and differentiation of landscapes. J. Environ. Manag. 2009, 90, 2889–2899. [Google Scholar] [CrossRef]
  12. Sevenant, M.; Antrop, M. The use of latent classes to identify individual differences in the importance of landscape dimensions for aesthetic preference. Land Use Policy 2010, 27, 827–842. [Google Scholar] [CrossRef]
  13. Tress, B.; Tress, G. Capitalizing on multiplicity: A transdisciplinary systems approach to landscape research. Landsc. Urban Plan. 2001, 57, 143–157. [Google Scholar] [CrossRef]
  14. Coeterier, J.F. Dominant attributes in the perception and evaluation of the Dutch landscape. Landsc. Urban Plan. 1996, 34, 27–44. [Google Scholar] [CrossRef]
  15. Sullivan, W.C.; Anderson, O.M.; Lovell, S.T. Agricultural buffers at the rural-urban fringe: An examination of approval by farmers, residents, and academics in the Midwestern United States. Landsc Urban Plan. 2004, 69, 299–313. [Google Scholar] [CrossRef]
  16. Tempesta, T. The perception of agrarian historical landscapes: A study of the Veneto plain in Italy. Landsc. Urban Plan. 2010, 97, 258–272. [Google Scholar] [CrossRef]
  17. Bujis, A.E.; Pedroli, B.; Luginbühl, Y. From hiking through farmland to farming in a leisure landscape: Changing social perceptions of the European landscape. Landsc. Ecol. 2006, 21, 375–389. [Google Scholar] [CrossRef]
  18. Rogge, E.; Nevens, F.; Gulinck, H. Perception of rural landscapes in Flanders: Looking beyond aesthetics. Landsc. Urban Plan. 2007, 82, 159–174. [Google Scholar] [CrossRef]
  19. Tveit, M.S. Indicators of visual scale as predictors of landscape preference; A comparison between groups. J. Environ. Manag. 2009, 90, 2882–2888. [Google Scholar] [CrossRef]
  20. Ode Sang, Å.; Tveit, M.S. Perceptions of stewardship in Norwegian agricultural landscapes. Land Use Policy 2013, 31, 557–564. [Google Scholar] [CrossRef]
  21. Shafer, J.E.L.; Brush, R.O. How to measure preferences for photographs of natural landscapes. Landsc. Plan. 1977, 4, 237–256. [Google Scholar] [CrossRef]
  22. Daniel, T.C.; Vining, J. Methodological issues in the assessment of landscape quality. In Behaviour and the Natural Environment; Altman, I., Wohwill, J.F., Eds.; Plenum Press: New York, NY, USA, 1983; pp. 39–83. [Google Scholar]
  23. Scott, M.J.; Canter, D.V. Picture or place? A multiple sorting study of landscape. J. Environ. Psychol. 1997, 17, 263–281. [Google Scholar] [CrossRef]
  24. Karjalainen, E.; Komulainen, M. Field afforestation preferences: A case study in northeastern Finland. Landsc. Urban Plan. 1998, 43, 79–90. [Google Scholar] [CrossRef]
  25. Daniel, T.C.; Meitner, M.M. Representational validity of landscape visualizations: The effects of graphical realism on perceived scenic beauty of forest vistas. J. Environ. Psychol. 2001, 21, 61–72. [Google Scholar] [CrossRef]
  26. Shuttleworth, S. The use of photographs as an environmental presentation medium in landscape studies. J. Environ. Manag. 1980, 11, 61–76. [Google Scholar]
  27. Rose, G. Visual methodologies. In An Introduction to the Interpretation of Visual Materials, 2nd ed.; Sage Publications: London, UK, 2007; p. 301. [Google Scholar]
  28. Nassauer, J.I. Framing the landscape in photographic simulation. J Environ. Manag. 1983, 16, 4. [Google Scholar]
  29. Mollie-Stefulesco, C.; Quesney, D. Séquences paysages. In Revue de L’observatoire Photographique du Paysage; Hazan, Ed.; Ministère de l’environnement: Paris, France, 1997; p. 112. [Google Scholar]
  30. Trent, R.B.; Neumann, E.; Kvashny, A. Presentation mode and question format artifacts in visual assessment research. Landsc. Urban Plan. 1987, 14, 225–235. [Google Scholar] [CrossRef]
  31. Garcia Pérez, J.D. Ascertaining landscape perceptions and preferences with pair-wise photographs: Planning rural tourism in Extremadura, Spain. Landsc. Res. 2002, 27, 297–308. [Google Scholar] [CrossRef]
  32. Hetherington, J.; Daniel, T.C.; Brown, T.C. Is motion more important than it sounds? The medium of presentation in environmental research. J. Environ. Psychol. 1993, 13, 283–291. [Google Scholar] [CrossRef]
  33. Wherrett, J.R. Creating landscape preference models using internet survey techniques. Landsc. Res. 2000, 25, 79–96. [Google Scholar] [CrossRef]
  34. Roth, M. Validating the use of Internet survey techniques in visual landscape assessment—An empirical study from Germany. Landsc Urban Plan. 2006, 78, 179–192. [Google Scholar] [CrossRef]
  35. Heikkilä, T.; Hietala-Koivu, R. Maatalousmaiseman visuaalinen seuranta. In Maatalouden Ympäristötuen Merkitys Luonnon Monimuotoisuudelle ja Maisemalle: Mytvas-Seurantatutkimus 2000–2003; In Series Suomen ympäristö No. 709; Kuussaari, M., Tiainen, J, Helenius, J., Hietala-Koivu, R., Heliölä, J., Eds.; Edita: Helsinki, Finland, 2004; p. 212. [Google Scholar]
  36. Ode, Å.; Tveit, M.S.; Fry, G. Capturing landscapes visual character using indicators: Touching base with landscape aesthetic theory. Landsc. Res. 2008, 33, 89–117. [Google Scholar] [CrossRef]
  37. Howley, P. Landscape aesthetics: Assessing the general publics’ preferences towards rural landscapes. Ecol. Econ. 2011, 72, 161–169. [Google Scholar] [CrossRef]
  38. Howley, P.; Hynes, S.; Donoghue, C.O. Countryside preferences: Exploring individuals’ willingness to pay for the conservation of the traditional farm landscape. Landsc. Res. 2012, 37, 703–719. [Google Scholar] [CrossRef]
  39. Dramstad, W.E.; Tveit, M.S.; Fjellstad, W.J.; Fry, G.L.A. Relationships between visual landscape preferences and map-based indicators of landscape structure. Landsc. Urban Plan. 2006, 78, 465–474. [Google Scholar] [CrossRef]
  40. Benjamin, K.; Bouchard, A.; Domon, G. Abandoned farmlands as components of rural landscapes: An analysis of perceptions and representations. Landsc. Urban Plan. 2007, 83, 228–244. [Google Scholar] [CrossRef]
  41. Strumse, E.; Hauge, L. Landscape protection evaluations and visual preferences for western Norwegian agrarian landscapes. Norsk Geogr. Tidsskr. 1998, 52, 1–15. [Google Scholar] [CrossRef]
  42. Arriaza, M.; Cañas-Ortega, J.F.; Cañas-Madueño, J.A.; Ruiz-Aviles, P. Assessing the visual quality of rural landscapes. Landsc. Urban Plan. 2004, 69, 115–125. [Google Scholar] [CrossRef]
  43. Rechtman, O. Visual perception of agricultural cultivated landscapes: Key components as predictors for landscape preferences. Landsc. Res. 2013, 38, 273–294. [Google Scholar] [CrossRef]
  44. Sayadi, S.; Gonzalez, M.; Calatrava-Requena, J. Public preferences for landscape features: The case of agricultural landscape in mountainous Mediterranean areas. Land Use Policy 2009, 26, 334–344. [Google Scholar] [CrossRef]
  45. Rambolinaza, M.; Dachary-Bernard, J. Land-use planning and public preferences: What can we learn from choice experiment method? Landsc. Urban Plan. 2007, 83, 318–326. [Google Scholar] [CrossRef] [Green Version]
  46. Grammatikopoulou, I.; Pouta, E.; Salmiovirta, M.; Soini, K. Heterogeneous preferences for agricultural landscape improvements in southern Finland. J. Landsc. Urban Plan. 2012, 107, 181–191. [Google Scholar] [CrossRef]
  47. Campbell, D. Willingness to pay for rural landscape improvements: Combining mixed logit and random-effects models. J. Agric. Econ. 2007, 58, 467–483. [Google Scholar] [CrossRef]
  48. Van Berkel, D.B.; Verburg, P.H. Spatial quantification and valuation of cultural ecosystem services in an agricultural landscape. Ecol. Indic. 2014, 37, (Part A). 163–174. [Google Scholar] [CrossRef]
  49. Howley, P.; Donoghue, C.O.; Hynes, S. Exploring public preferences for traditional farming landscapes. Landsc. Urban Plan. 2012, 104, 66–74. [Google Scholar] [CrossRef]
  50. Hynes, S.; Campbell, D. Estimating the welfare of agricultural landscape change in Ireland: A choice experiment approach. J. Environ. Plan. Manag. 2011, 54, 1019–1039. [Google Scholar]
  51. Arnberger, A.; Eder, R. Exploring the heterogeneity of rural landscape preferences: An image-based latent class approach. Landsc. Res. 2011, 36, 19–40. [Google Scholar] [CrossRef]
  52. Snider, J.G.; Osgood, C.E. Semantic Differential Technique: A Sourcebook; Chicago: Aldine, TX, USA, 1969. [Google Scholar]
  53. Múgica, M.; de Lucio, J.V. The role of on-site experience on landscape preferences. A case study at Doñana National Park (Spain). J. Environ. Manag. 1996, 47, 229–239. [Google Scholar] [CrossRef]
  54. Kaltenborn, B.P.; Bjerke, T. Associations between environmental value orientations and landscape preferences. Landsc. Urban Plan. 2002, 59, 1–11. [Google Scholar] [CrossRef]
  55. Franco, D.; Franco, D.; Mannino, I.; Zanetto, G. The impact of agroforestry networks on scenic beauty estimation: The role of a landscape ecological network on a socio-cultural process. Landsc. Urban Plan. 2003, 62, 119–138. [Google Scholar] [CrossRef]
  56. Ives, C.D.; Kendal, D. Values and attitudes of the urban public towards peri-urban agricultural land. Land Use Policy 2013, 34, 80–90. [Google Scholar] [CrossRef]
  57. Ryan, R.L. Local perceptions and values for a Midwestern river corridor. Landsc. Urban Plan. 1998, 546, 1–13. [Google Scholar]
  58. Crow, T.; Brown, T.; de Young, R. The Riverside and Berwyn experience: Contrasts in landscape structure, perceptions of the urban landscape, and their effects on people. Landsc. Urban Plan. 2006, 75, 282–299. [Google Scholar] [CrossRef]
  59. Tahvanainen, L.; Tyrväinen, L.; Ihalainen, M.; Vuorela, N.; Kolehmainen, O. Forest management and public perceptions—Visual versus verbal information. Landsc. Urban Plan. 2001, 53, 53–70. [Google Scholar] [CrossRef]
  60. Tahvanainen, L.; Tyrväinen, L. Model for predicting the scenic value of rural landscape: A preliminary study of landscape preferences in North Carelia. Scand. J. For. Res. 1998, 13, 379–385. [Google Scholar] [CrossRef]
  61. Gómez-Limón, J.; de Lucío, J.V. Changes in use and landscape preferences on the agricultural-livestock landscapes of the central Iberian Peninsula (Madrid, Spain). Landsc. Urban Plan. 1999, 44, 165–175. [Google Scholar] [CrossRef]
  62. Brush, R.; Chenoweth, R.E.; Barman, T. Group differences in the enjoyability of driving through rural landscapes. Landsc. Urban Plan. 2000, 47, 39–45. [Google Scholar] [CrossRef]
  63. Taloustutkimus. Internet Panel. Available online: http://www.taloustutkimus.fi/in-english/products_services/internet_panel/ (accessed on 28 November 2013).
  64. Statistics Finland. Available online: http:// www.stat.fi, 2011 (accessed on 28 November 2013).
  65. Littell, R.C.; Milliken, G.A.; Stroup, W.W.; Wolfinger, R.D.; Schabenberger, O. SAS® for Mixed Models, 2nd ed.; SAS Institute Inc.: Cary, NC, USA, 2006. [Google Scholar]
  66. Burton, R.J.F. Seeing through the “good farmer’s” eyes: Towards developing an understanding of the social symbolic value of “productivist” behaviour. Sociol. Rural. 2004, 44, 195–216. [Google Scholar]
  67. Soini, K. Beyond the Ecological Hot Spots: Understanding Local Residents’ Perceptions of Biodiversity of Agricultural Landscapes. Ph.D. Thesis, Turun Yliopisto, Turku, Finland, 2007. [Google Scholar]

