1. Introduction
Accelerated urbanization has been viewed as an important instrument for promoting economic development and reducing regional wealth disparities in some developing countries [
1,
2]. Nevertheless, the literature has brought forward a wide range of negative effects pertaining to the human-environment system in sprawled urban areas [
3]. A frequent conflict exists between urban expansion and farmland protection, because urban expansion is unavoidably at the expense of clearing surrounding fertile farmlands, which were once fundamental to the city’s agricultural market. To protect farmland and open space many developed countries have already adopted various measures, including farmland protection [
4,
5], smart conservation [
6], greenway [
7], green infrastructure [
8] and market oriented policies [
9]. However, in the developing world, not only are such strategies unimplemented, but the problem itself is also more pressing as this is where the increase in global urban population is concentrated [
10,
11].
Developing countries are experiencing an accelerated urbanization [
10]. Their cities will probably hold more than 95% of the net increase in global population by 2050 [
11]. In China, the world’s second-largest economy and currently the most populous developing country, the urban population has increased by 500 million during 1980–2011 that exceeds the total population in most countries. Its proportion in the total population has unbelievably risen from 19.6% to 51.3% [
12,
13]. This trend will continue in the coming decades and by 2050, the number of urban dwellers will rise by another 300 million [
11]. Without a doubt, existing urban areas will sprawl out and new urban centers will spring up to hold the growing dwellers. Farmlands are therefore at great risk of being developed without land use policy reformation.
Farmland loss in China receives a lot of attention because of concerns about how to feed the largest population in the world [
14,
15,
16,
17,
18]. The Chinese central government made farmland protection an essential tool and enacted both the Basic Farmland Protection Regulation (BFPR) and the new Land Administration Law (LAL) in 1999 [
19] to reduce farmland loss, ensure grain production and increase urban land use efficiency [
17,
18]. These policies require that local governments and individuals reduce the demand for new urban lands by using them more efficiently and ensure that development on farmlands is only allowed if their substitutes can be reclaimed elsewhere [
20]. However, as land resource is significant in promoting economic growth in China, decision-makers are therefore conflicted about whether or not to implement them strictly at the cost of lowering economic benefit [
2,
21].
Many studies found that the land policies only reduced the net loss of farmland through reclaiming farmlands in peripheral areas. Li [
22] argued that the farmland protection policy could give rise to reclaiming new farmlands on less suitable areas of lower productivity. Liu
et al. [
17], and Liu
et al. [
23] analyzed satellite images of mainland China for 1990, 2000 and 2005. They found farmland decreased enormously in rapidly urbanized provinces whereas considerable farmlands were reclaimed in peripheral areas. Wang
et al. [
24] reached a similar conclusion based on the nation-wide survey data of land use change during 1996–2008. Moreover, Zhang
et al. [
25] also found farmland displacement in Foshan of the Pearl River Delta. Therefore, not only could the land policies ensure farmland stability to a certain extent but they could also cause farmland displacement as a by-product. Nevertheless, it is still unknown how this mechanism works at a regional scale.
On the other hand, studies also argued that current land policies were not capable of controlling urban expansion. Lichtenberg and Ding [
19] conceptually analyzed the possible consequences of current land policies in the context of the institutional structure and argued that current policies could cause excessive farmland loss and inefficient land use in urban areas. Moreover, Lu and Huang [
26] analyzed the survey data of urban lands during 1997–2008 and reported that rapidly expanding urban lands were far less than efficiently used. They found that the urban lands increased much faster than population did and a considerable amount of cleared farmlands lay idle for several years before any actual construction. Similarly, Wei and Zhao [
27], and Tan
et al. [
28] argued that the current land policies caused over-consumption of farmland compared with a competitive market situation based on case studies in Guangzhou and Yingtan, respectively. It therefore seems that the policies do not work as designed by the decision-makers and not succeed in controlling urban expansion.
At present, however, a spatial analysis of the impact of land policies on multiple land use changes remains to be elucidated in a metropolitan area. The above findings were mainly based on the national level studies [
17,
18,
23,
24] except some cases of individual municipalities or counties [
25,
27,
28,
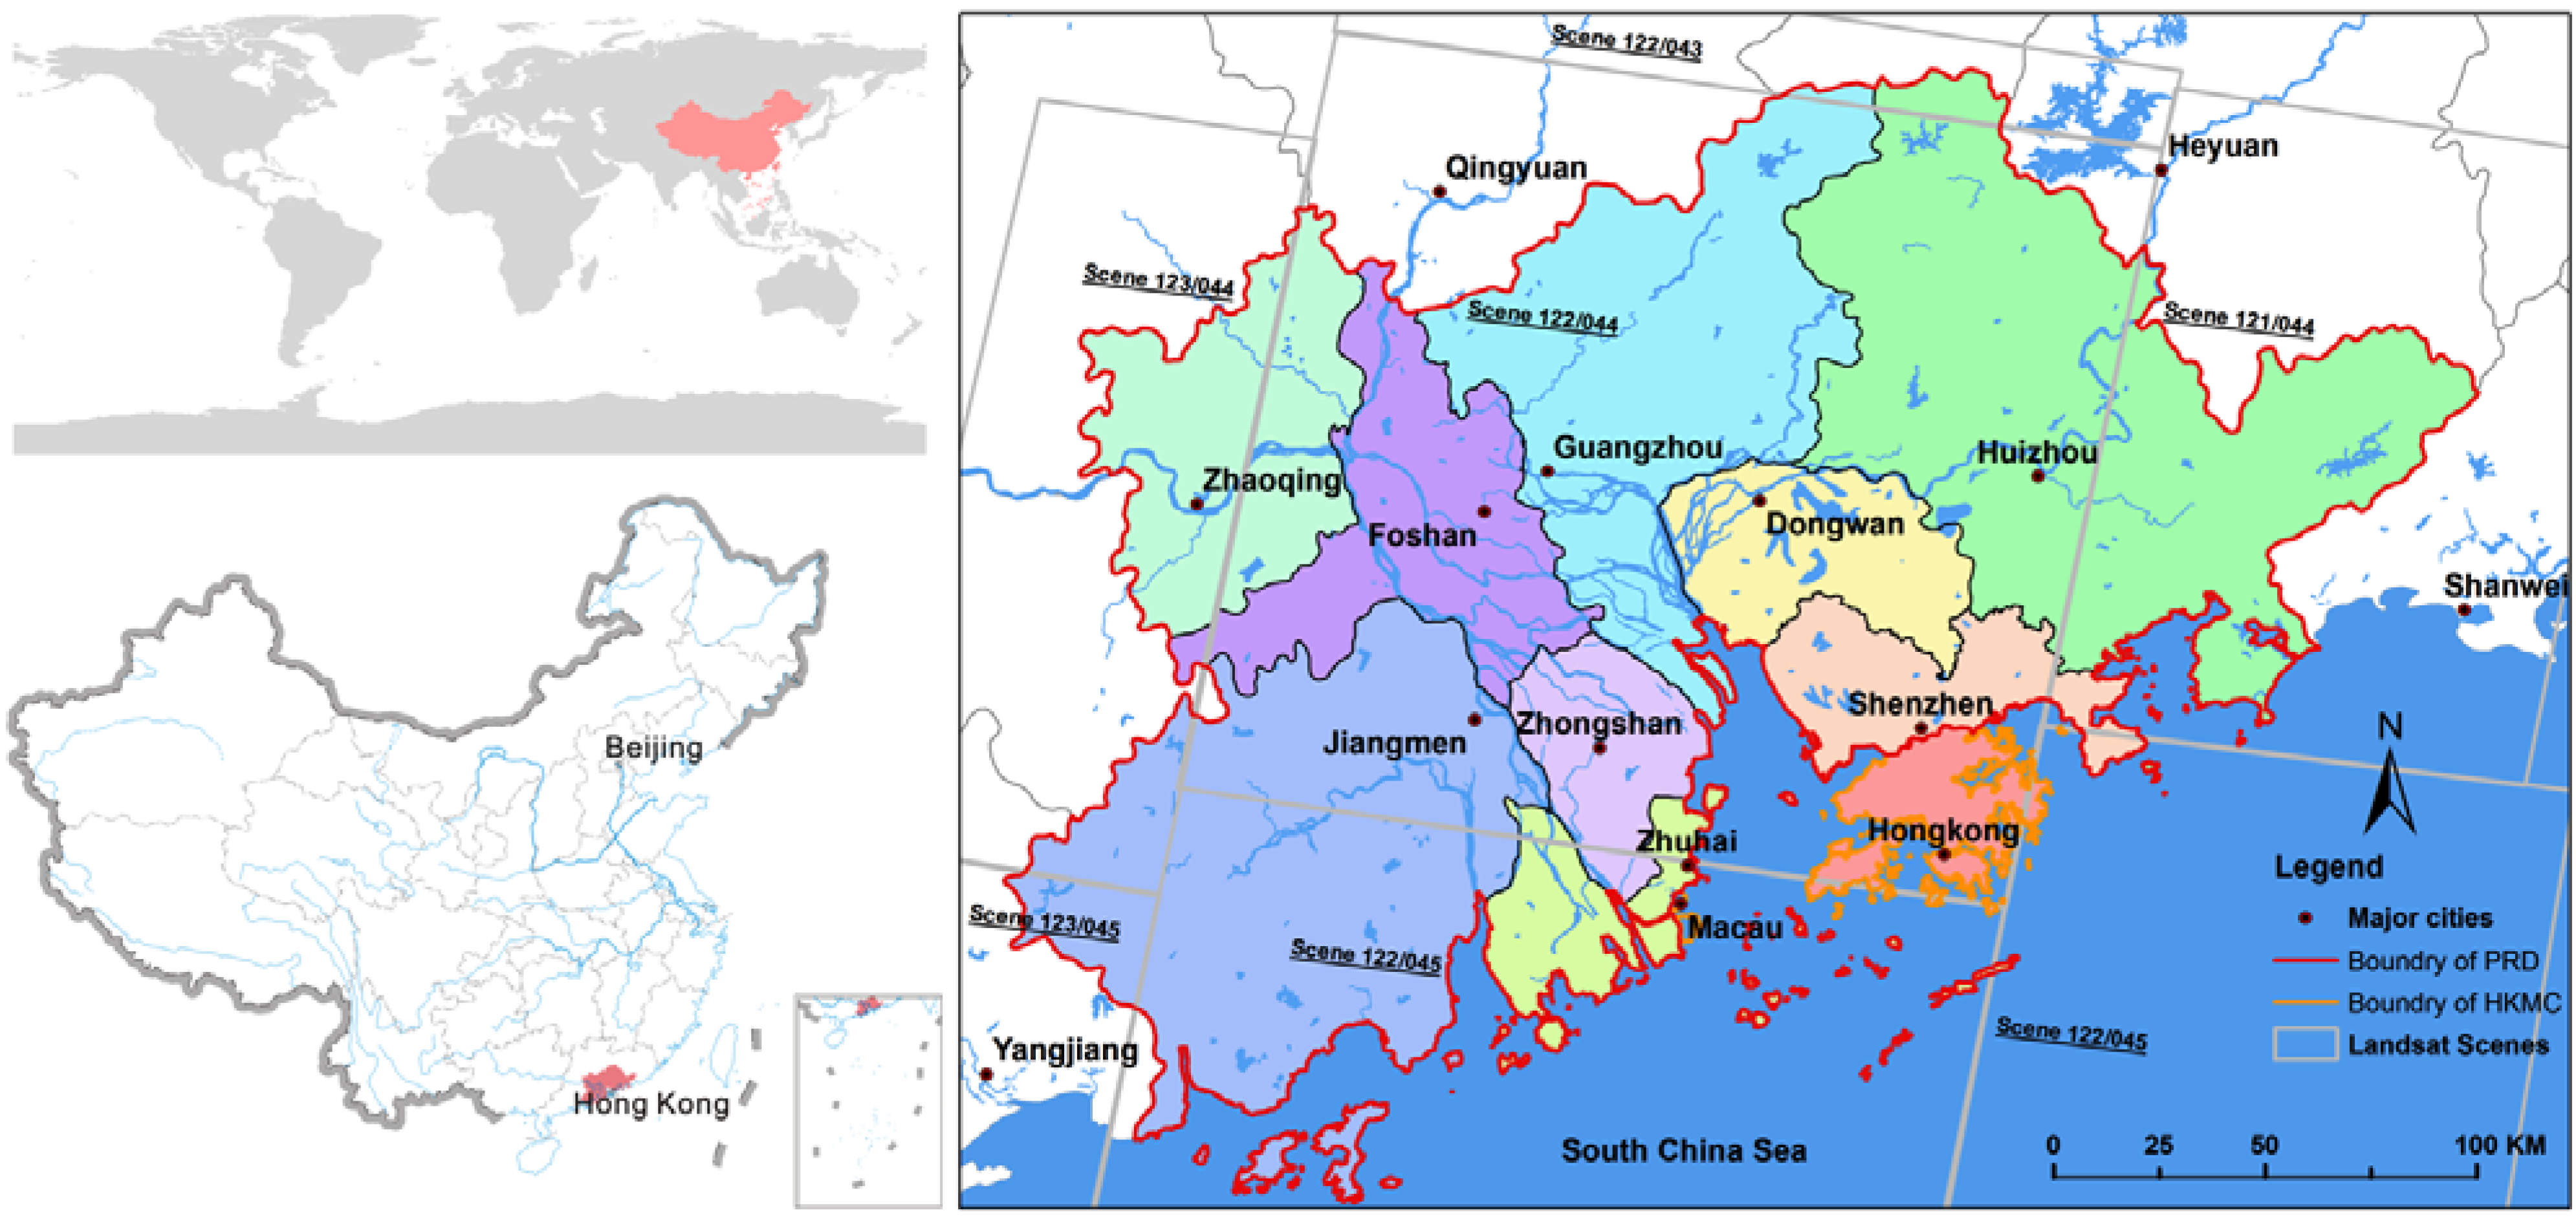
29]. Moreover, it is still unclear how the conflict between increasing urbanization for economic development and protecting farmland against urban sprawl is addressed. It is therefore necessary to compare the land use changes before and after the enacting of the main policies in 1999. It would be more reliable to compare the land use changes between areas that implemented the policies in mainland China and other areas with independent policies and planning system, such as Hong Kong and Macau. Fortunately, Remote Sensing methods can facilitate such a study. Among the remote sensing datasets, Landsat imagery is a relative high resolution satellite dataset and has produced an uninterrupted multispectral record of the land surface since 1972 [
17,
30]. It thus can play critical role in mapping the land use conditions and analyzing the temporal and spatial land use variation.
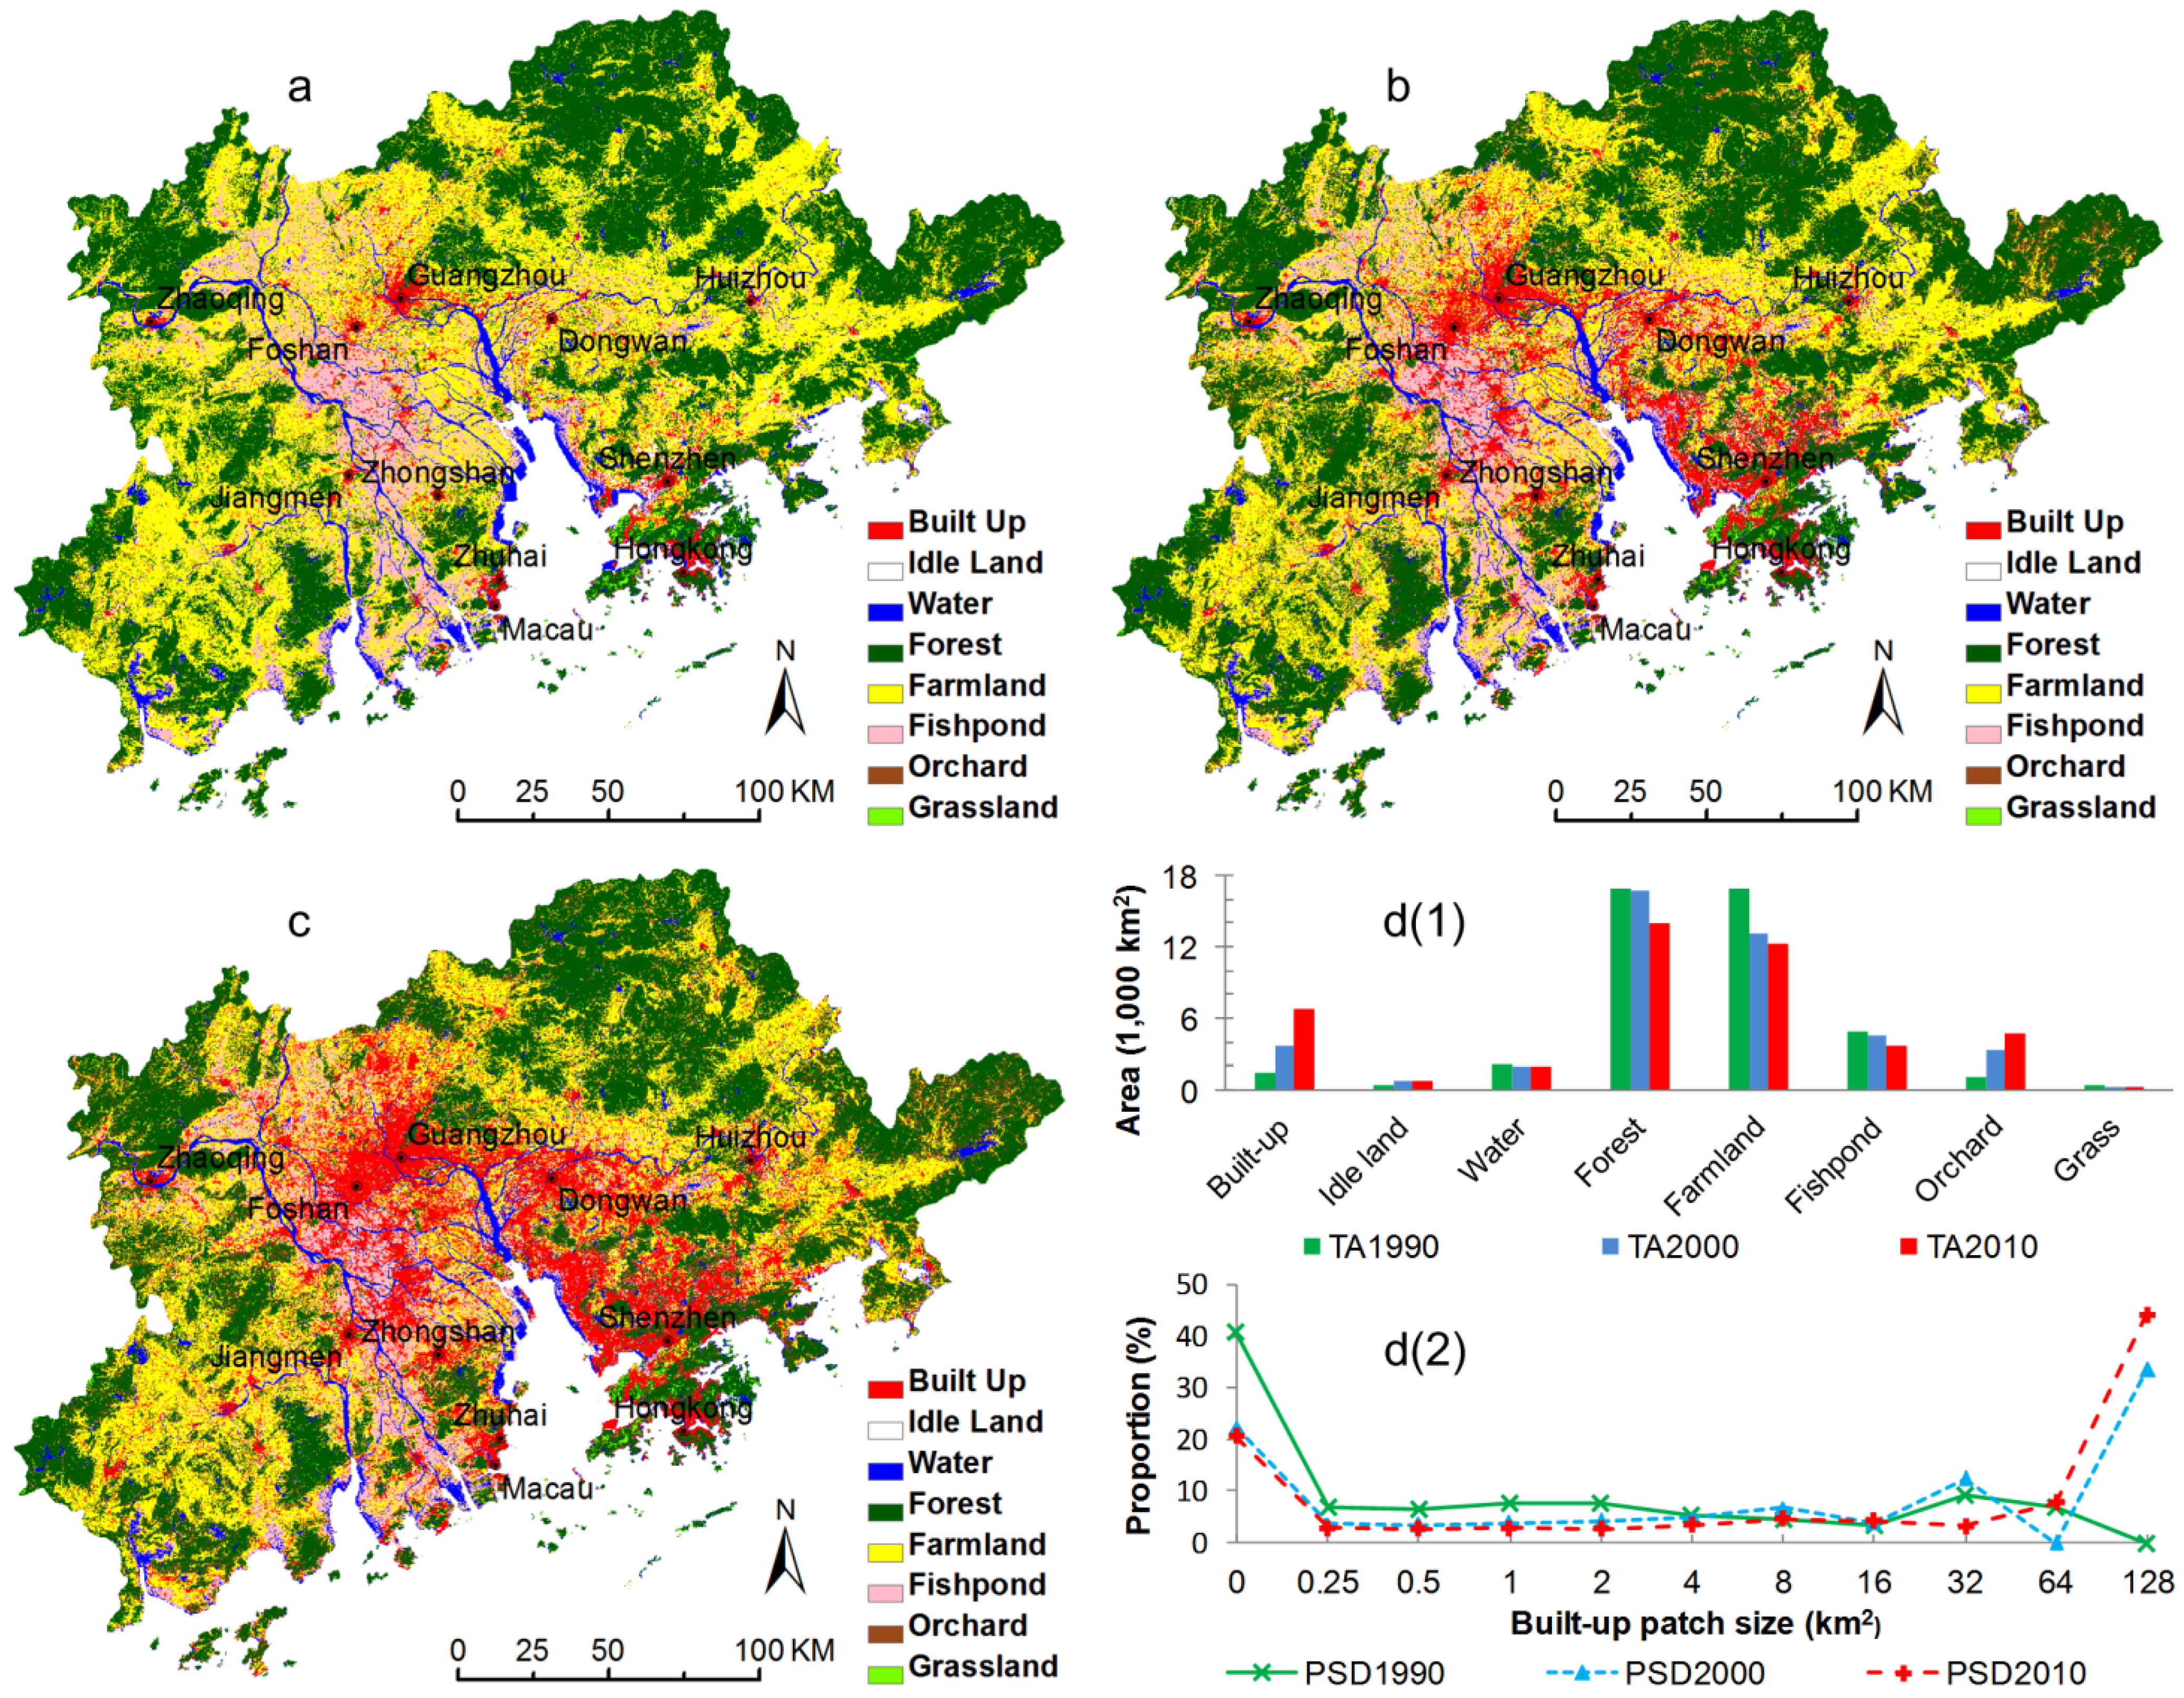
We mainly aim to investigate the changes in regional landscape both qualitatively and quantitatively in the context of current land policies. Taking as an example the Pearl River Delta (PRD), one of the most rapidly urbanized areas in China [
2,
31,
32,
33], we employed Landsat datasets and spatial analysis to answer the following questions: (1) How does the landscape change in the context of rapid urbanization? (2) Is there connection between urban expansion and the changes in other land use types? (3) How do stakeholders respond to the trade-offs between economic growth and farmland protection?
4. Discussions
The results presented above are mainly based on remote sensing studies. It is clear that maps produced through image classification cannot be completely error-free. However, validation of land use maps shows an average accuracy of more than 84%. Moreover, the detected land use change results agree with other reports for the PRD on built-up land growth by Ye
et al. [
44] and on farmland displacement by Zhang, Ma and Wang [
25]. Additionally, the process of urbanization acceleration and farmland displacement can also be found in studies of the Yangtze River Delta [
45]. Thus, the remote sensing detected processes of urbanization acceleration and farmland displacement in the PRD are in consistent with other studies; moreover, the complex relationships between the two processes have been investigated by means of spatial analysis.
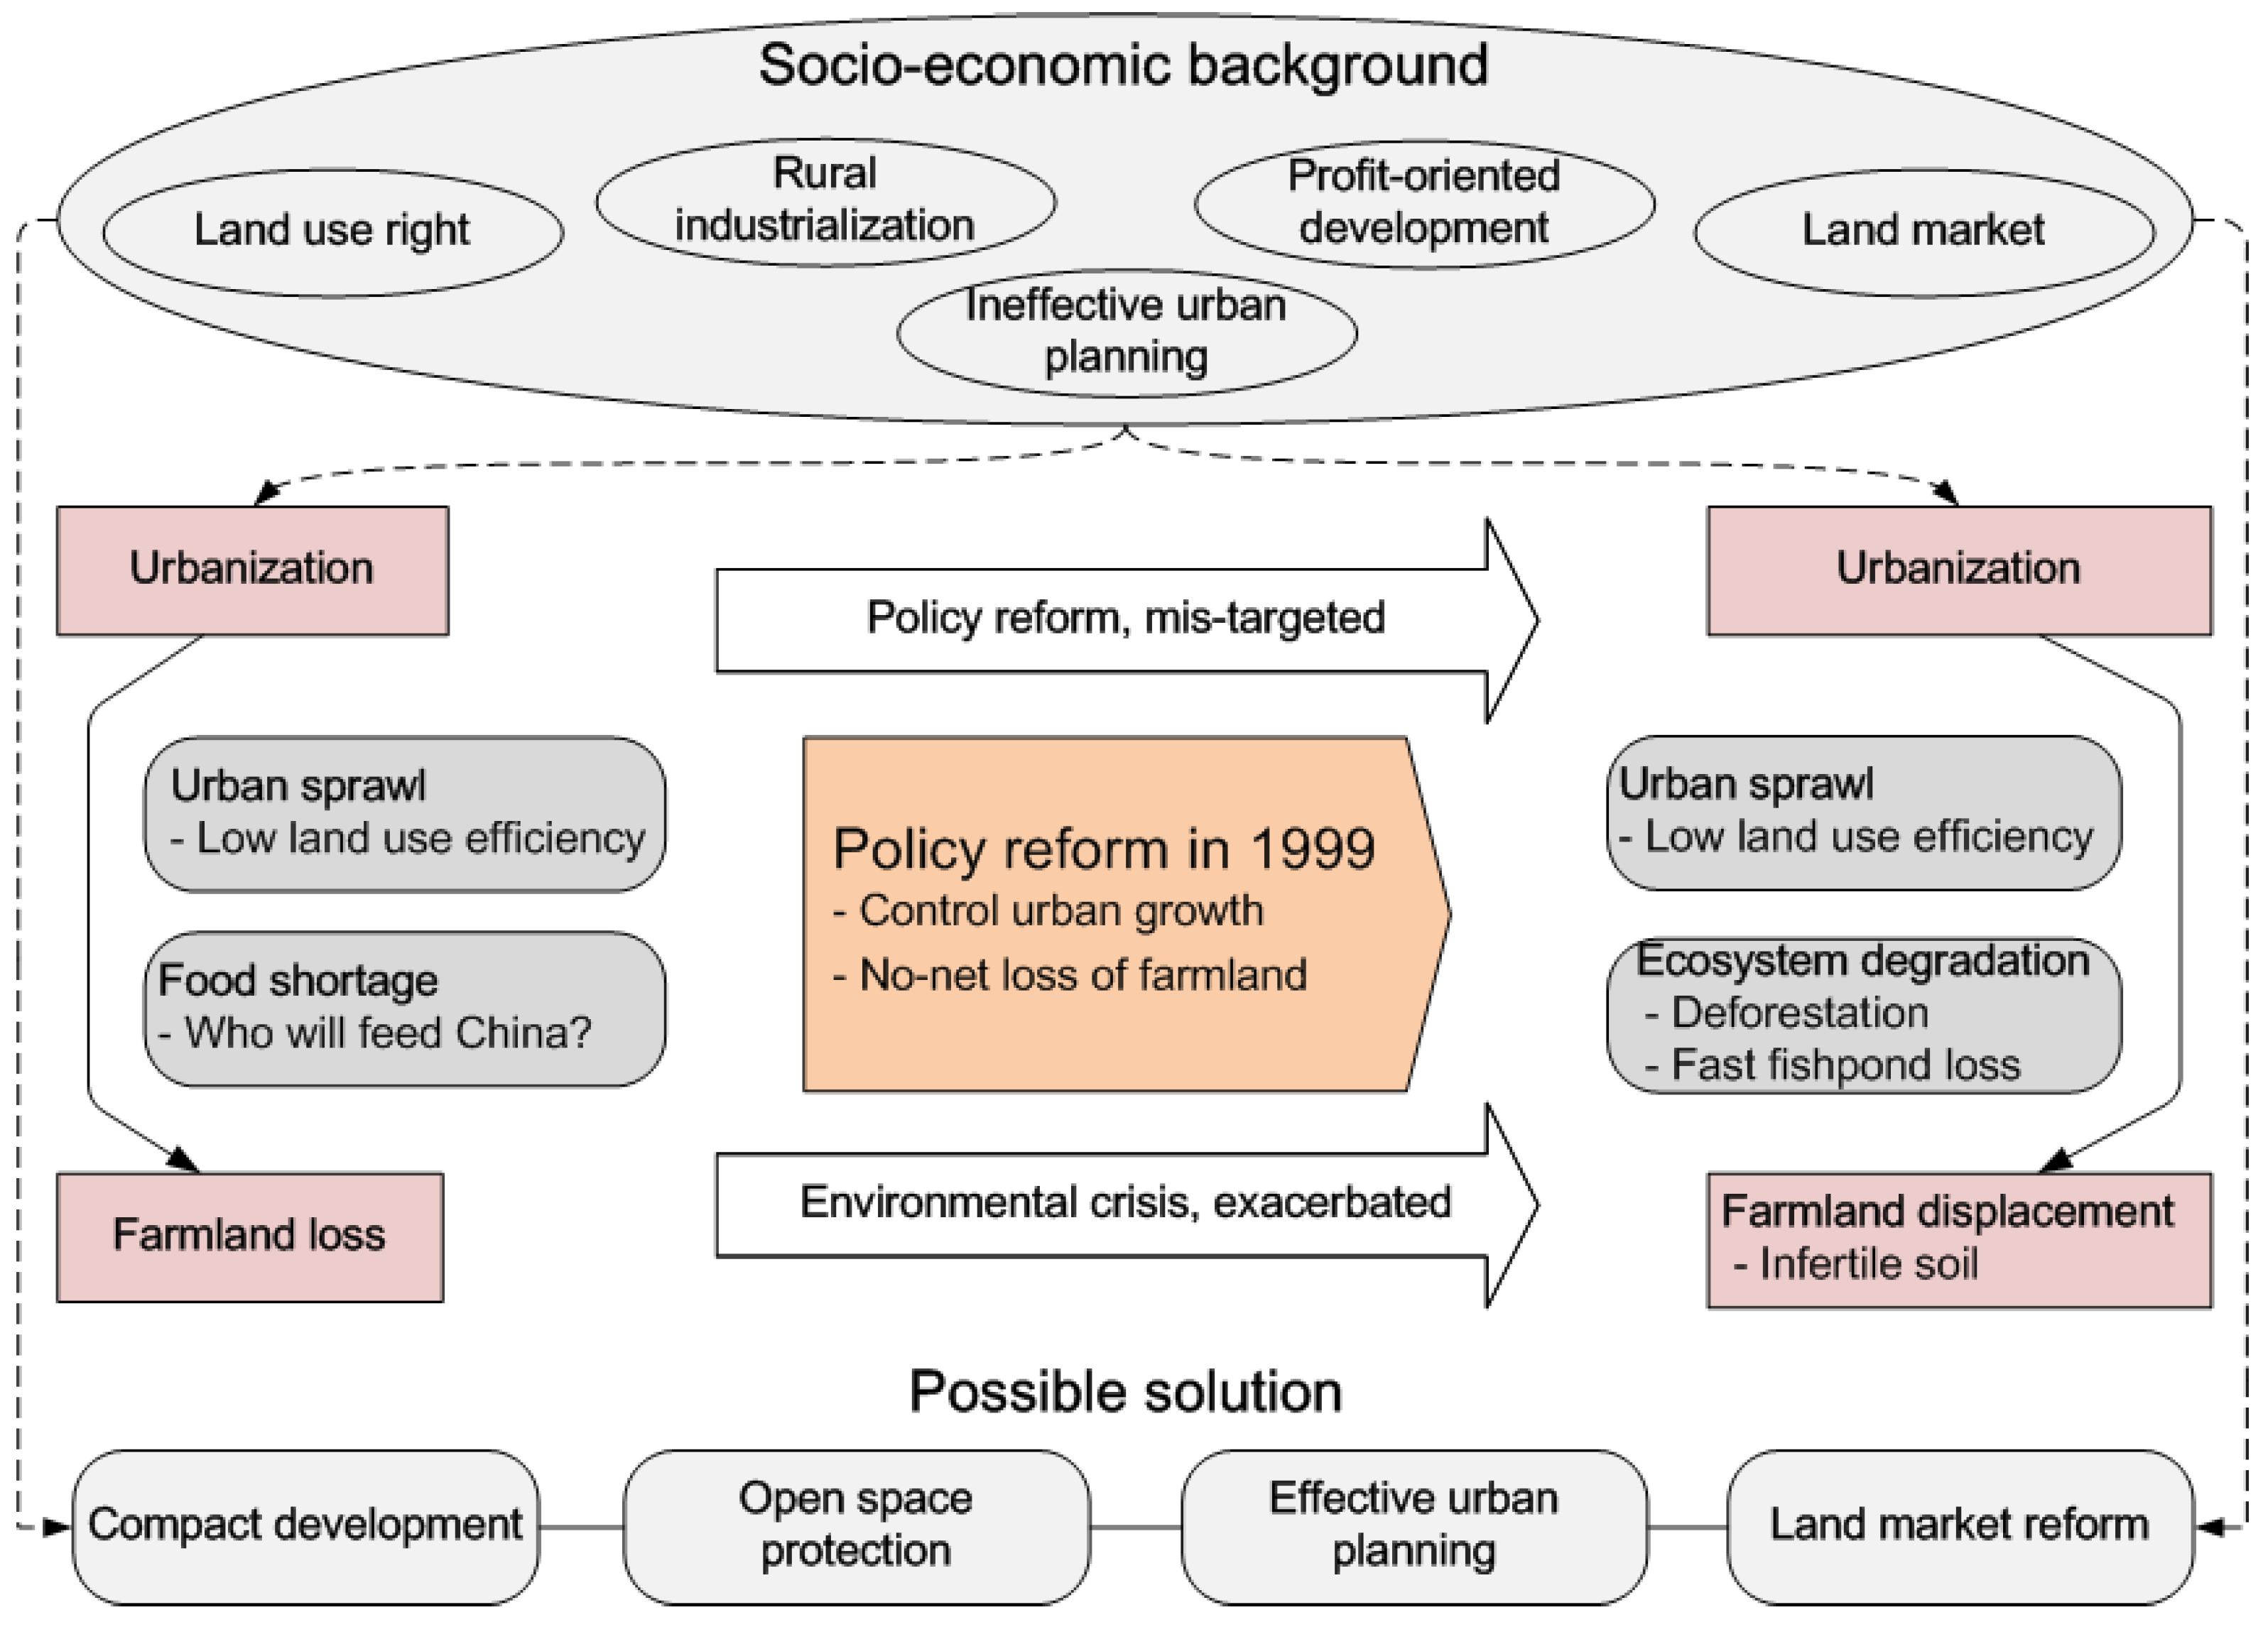
The results reveal that the two processes are indeed combined through complex mechanisms (
Figure 6). In order to control urban sprawl and protect farmland, the Basic Farmland Protection Regulation (BFPR) and the Land Administration Law (LAL) have been adopted from 1999 [
19,
20,
46]. They require stakeholders to control the growth of urban lands by using them more efficiently and development on farmlands is only allowed if their substitutes can be reclaimed elsewhere. The two policies are supposed to have two consequences. First, the increase in built-up land would reduce to some extent; second, developers would change the preference of developing on lands from farmlands to others. However, both the two hypotheses are refused as the increase in built-up land has accelerated and it has been consistently dominantly from farmland. Besides, the unchanged preference of accelerated urban expansion on farmlands and the effects to keep farmland stability cause farmland displacement and deforestation. Thus, urban growth has the priority over farmland protection that seems unavoidable in current social-economic condition.
The urban sprawl is primarily because of land price difference between rural and urban lands [
47]. The land price in villages is only half or less of that in towns and far below than in cities [
48]; the considerable differences encourages small industries to install in villages and towns, especially at the beginning. Also due to the land price difference [
47], cities prefer to spread towards rural surroundings rather than improve the efficiency of existing urban lands. Moreover, the land conversion from agricultural use to urban use could enormously increase the land value that mainly becomes governments’ revenue [
2,
28,
49]. In some cities, this revenue could account for 30%–70% of governments’ financial income [
2], which would probably be invested in industrial facilities and infrastructure to promote the GDP growth and consequently the urban sprawl. It is thus difficult to control urban sprawl since lands of relatively low price are essential for attracting industrial investments [
47] and land development is significant in increasing governments’ revenue [
2].
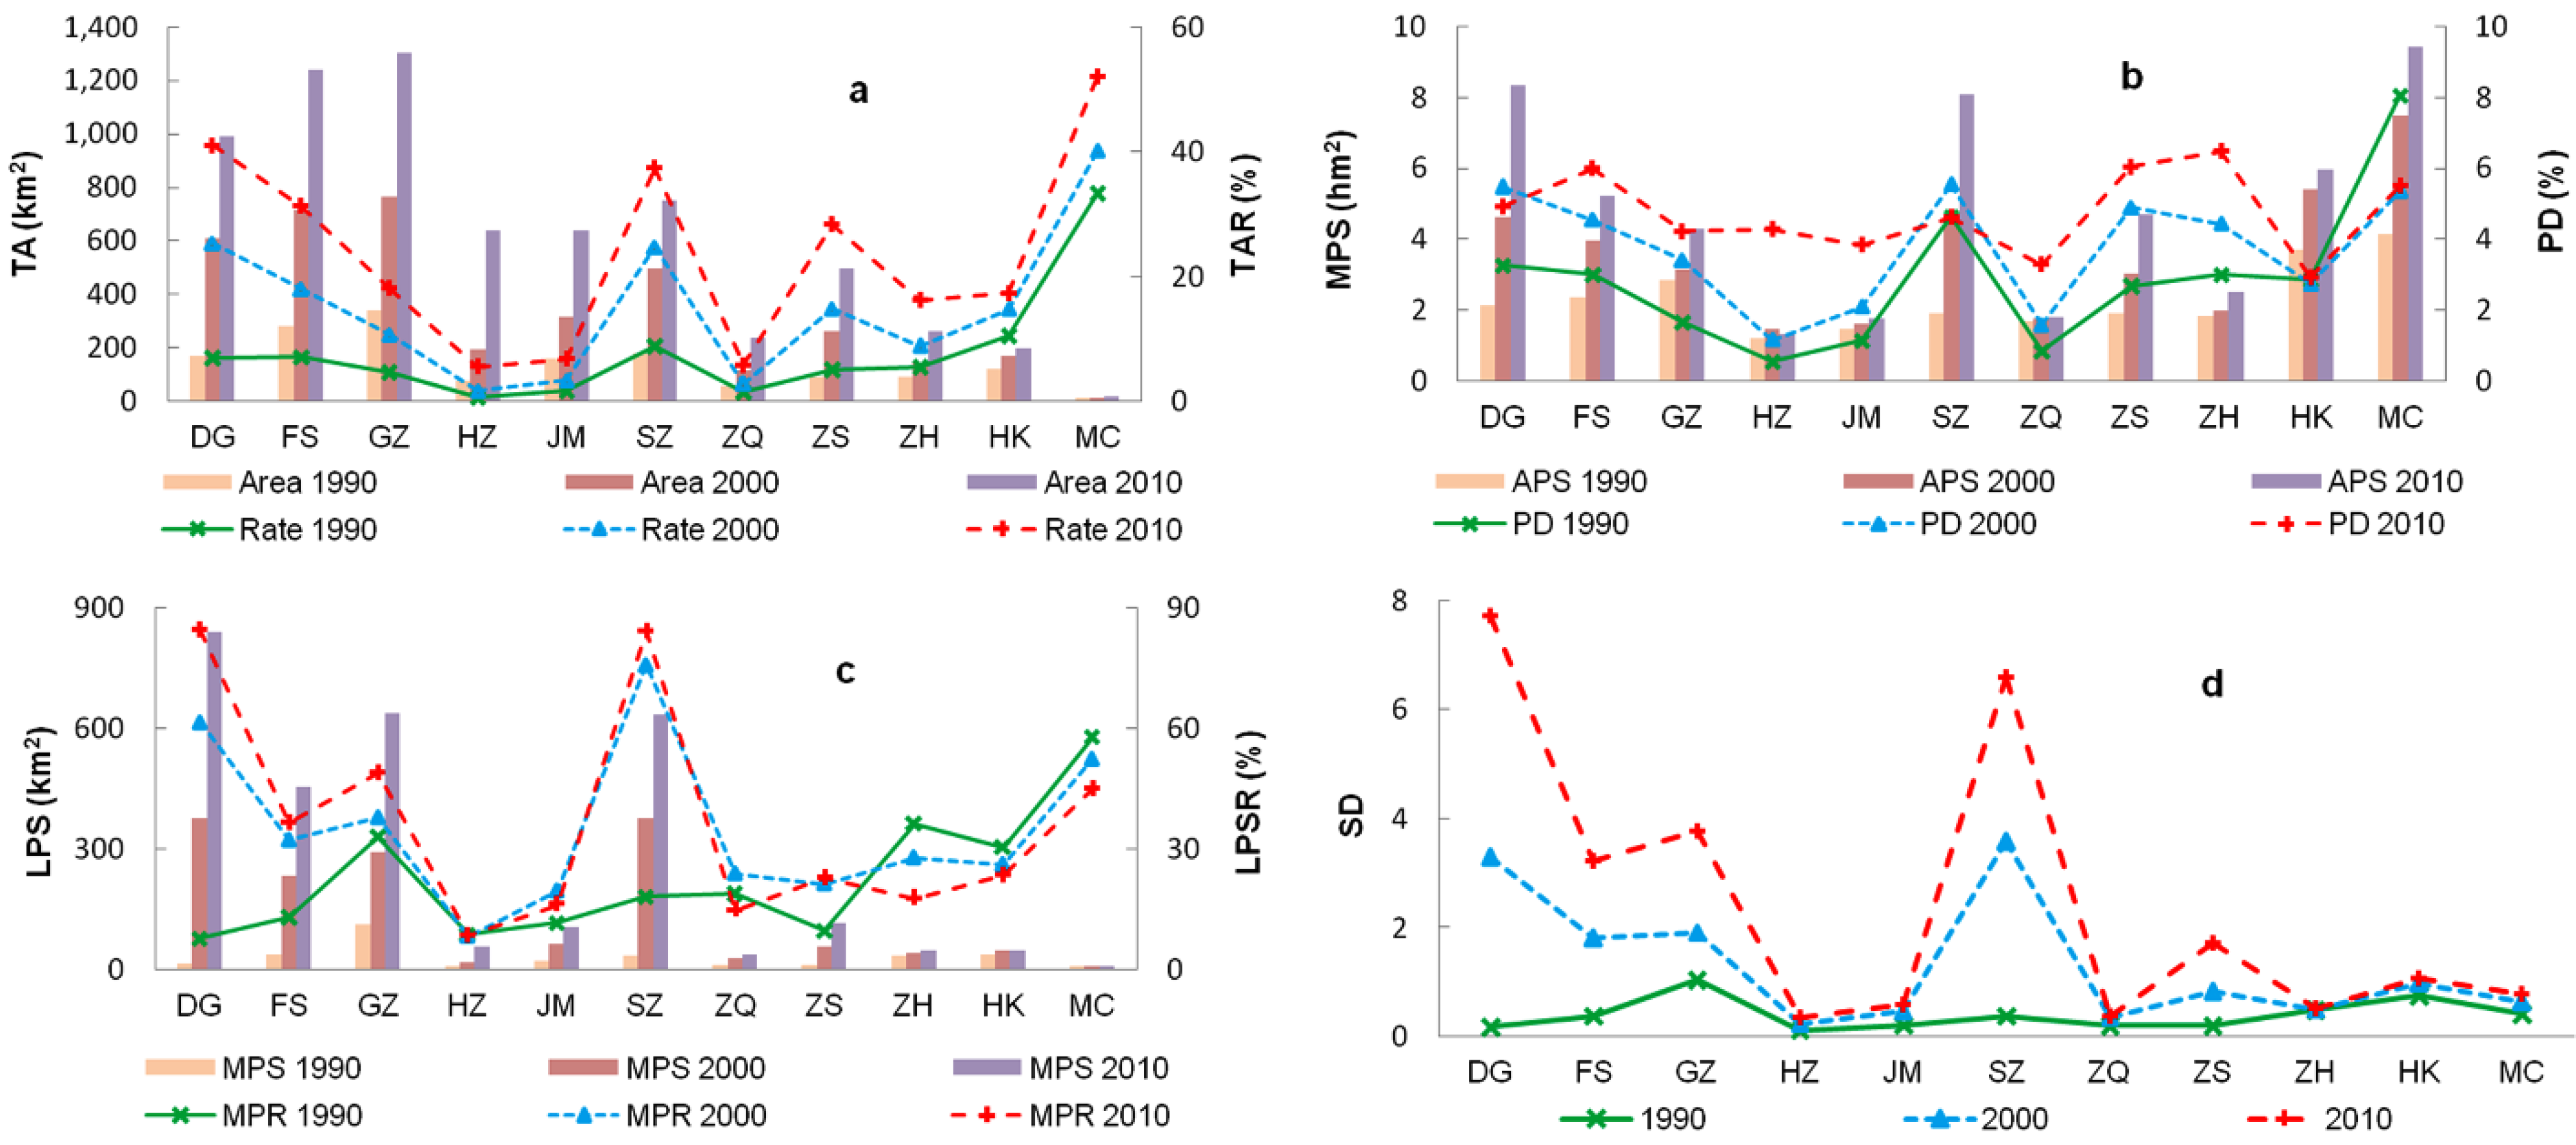
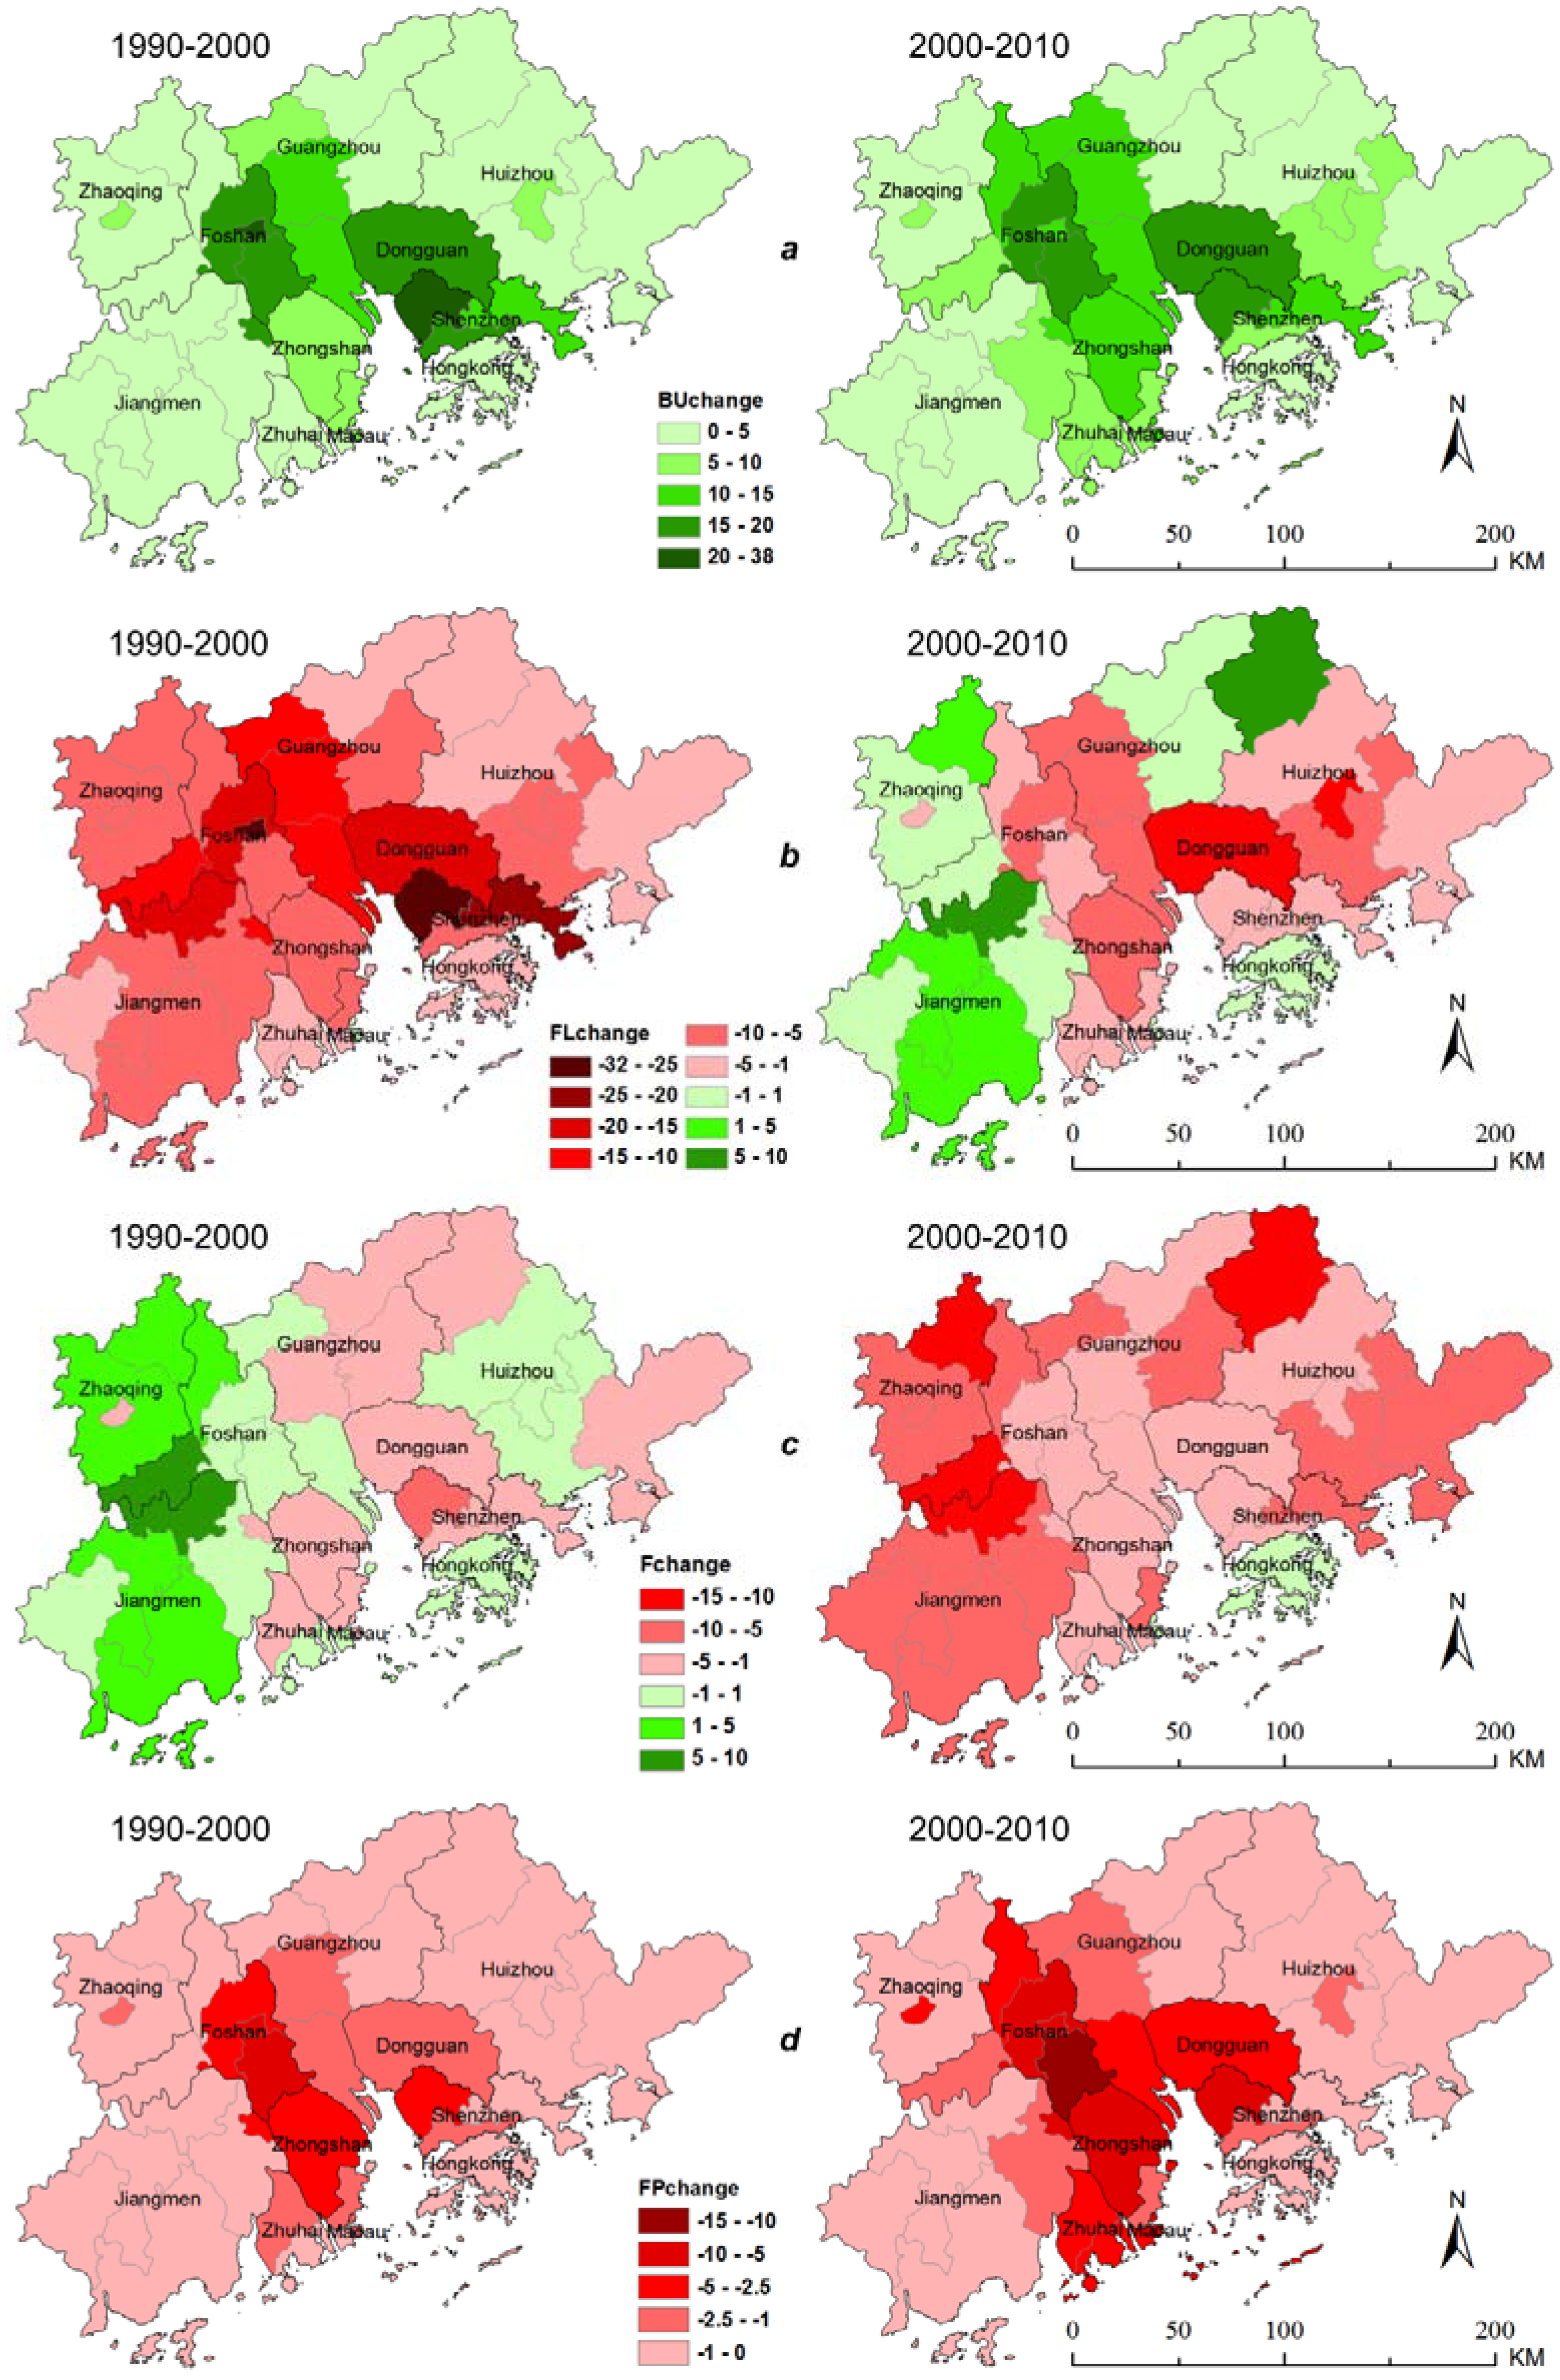
Figure 5.
Relative land use change at county level in (a) built up; (b) farmland; (c) forest; and (d) fishpond.
Figure 5.
Relative land use change at county level in (a) built up; (b) farmland; (c) forest; and (d) fishpond.
Urban sprawl is further out of control due to inefficient land use planning [
2,
21,
49,
50]. In China, government controls the supply of land as the public is the official owner but local government is the manager in practice [
2,
19]. At the same time, land use planning is approved and implemented by the government itself with limited public participation [
50]. Government is thus a combination of manager, planner and supervisor [
28]. Consequently, land use planning is far less than well implemented and urban expansion always oversteps planned quantity [
50] in the context of excessive pursuit for economic growth. Therefore, the conflict between urbanization and farmland protection [
2,
21] is simply resolved by farmland displacement.
Figure 6.
The land use change mechanism and possible solution.
Figure 6.
The land use change mechanism and possible solution.
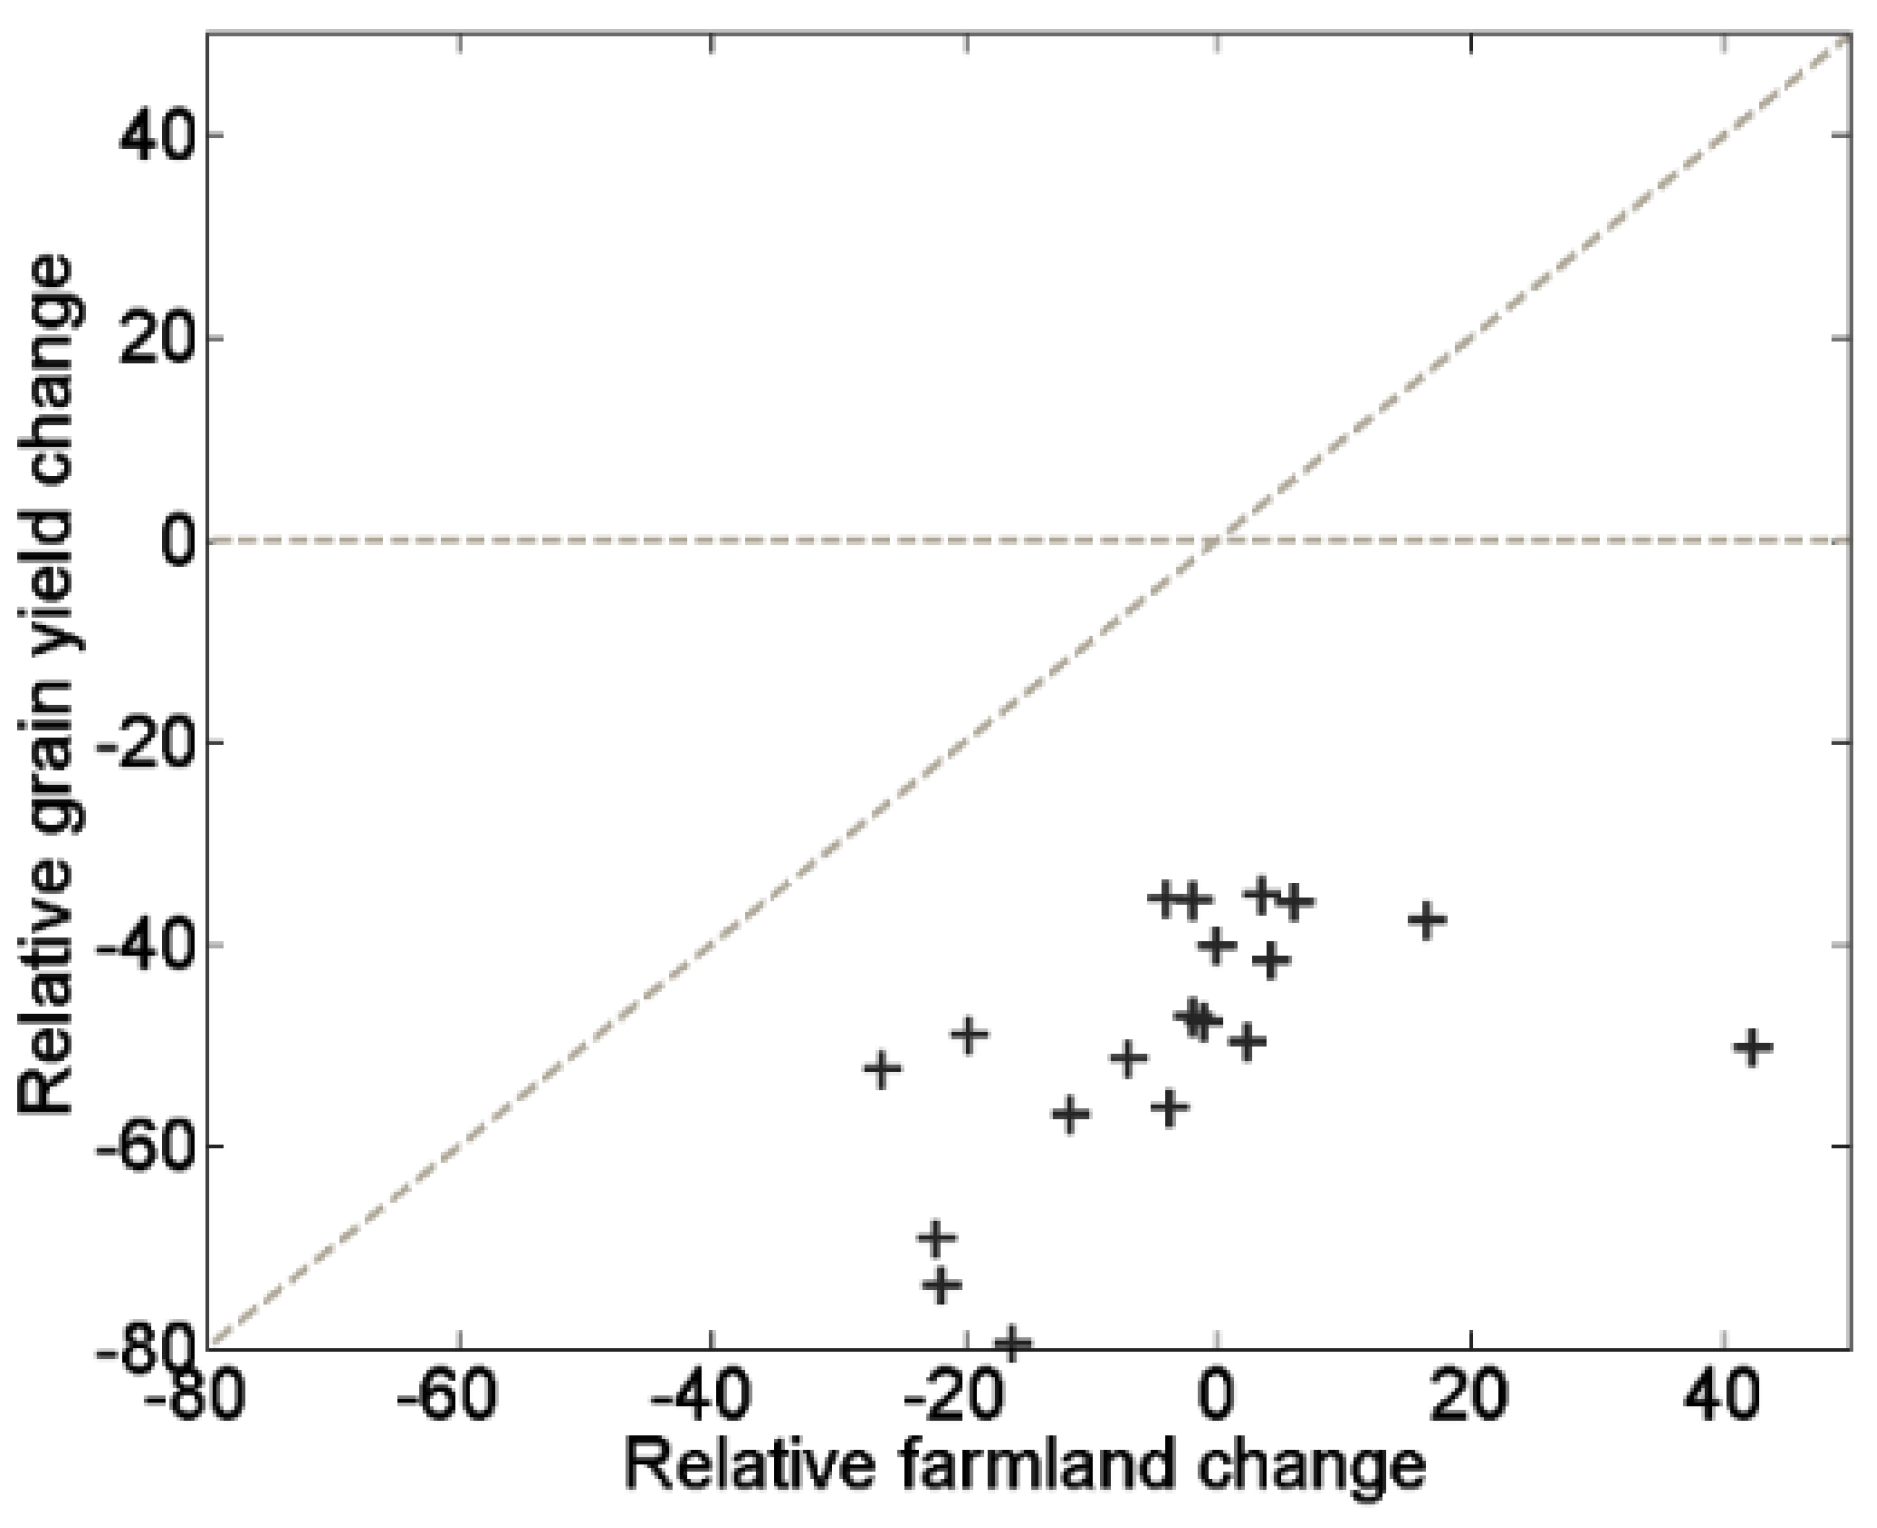
However, the newly reclaimed farmland is mainly on steeper slope and shallower soil that is unlikely to ensure grain production. Averagely, the new farmland pixels are 7.7 degrees in slope and 80.3 m in elevation during 2000s whereas the levels for their disappeared counterparts are just 2.6 degrees and 14.9 m, respectively. Therefore, the average productivity on the new farmland would probably be lower than on its original counterpart, which partially causes the significant decrease in grain yields from 4.6 million tons to 2.2 million tons during 2000s [
51,
52]. Nonetheless, the relative decrease in total grain production is much higher than that of farmland area (
Figure 7) even in the central PRD counties where very limited new farmland has been reclaimed and grain production mainly takes place on existing older farmland. It thus implies that farmers have diversified the agricultural structure from food grain production to market-oriented farming activities such as livestock husbandry, orchards and vegetables [
32,
49]. Regarding fruits and vegetables, per capita production rises from 53 kg and 156 kg to 152 kg and 319 kg in the past decade, respectively [
52].
To control urban expansion and protect open space, Hong Kong could be a good example as it controls urban sprawl relatively well while experiencing significant population growth and economy development. In this process, effective land use planning plays a critical role through public participation and separation of making and implementing land use plan [
50]. Nonetheless, Hong Kong has actually promoted the urban sprawl process in the PRD through industrial relocation and investment. Nowadays, rising land prices and labor shortage in the PRD are pushing away low-profit industries to other areas [
53]. These areas will probably face the same conflict between economic development by urban expansion and farmland protection against urban sprawl that once occurred in the PRD. The new host areas should learn from the experiences of the PRD and plan their industrial sites and urban land use accordingly.
Figure 7.
Relationship between relative change in grain yield and relative change in farmland area.
Figure 7.
Relationship between relative change in grain yield and relative change in farmland area.
5. Conclusions
This paper examined the landscape change and its driving forces in the rapidly urbanized area of the Pearl River Delta (PRD) and its neighboring Hong Kong-Macau, China, based on compiled land use maps for 1990, 2000 and 2010. The land use maps are relatively accurate according to both the point-to-point validation and comparison with other studies [
25,
44,
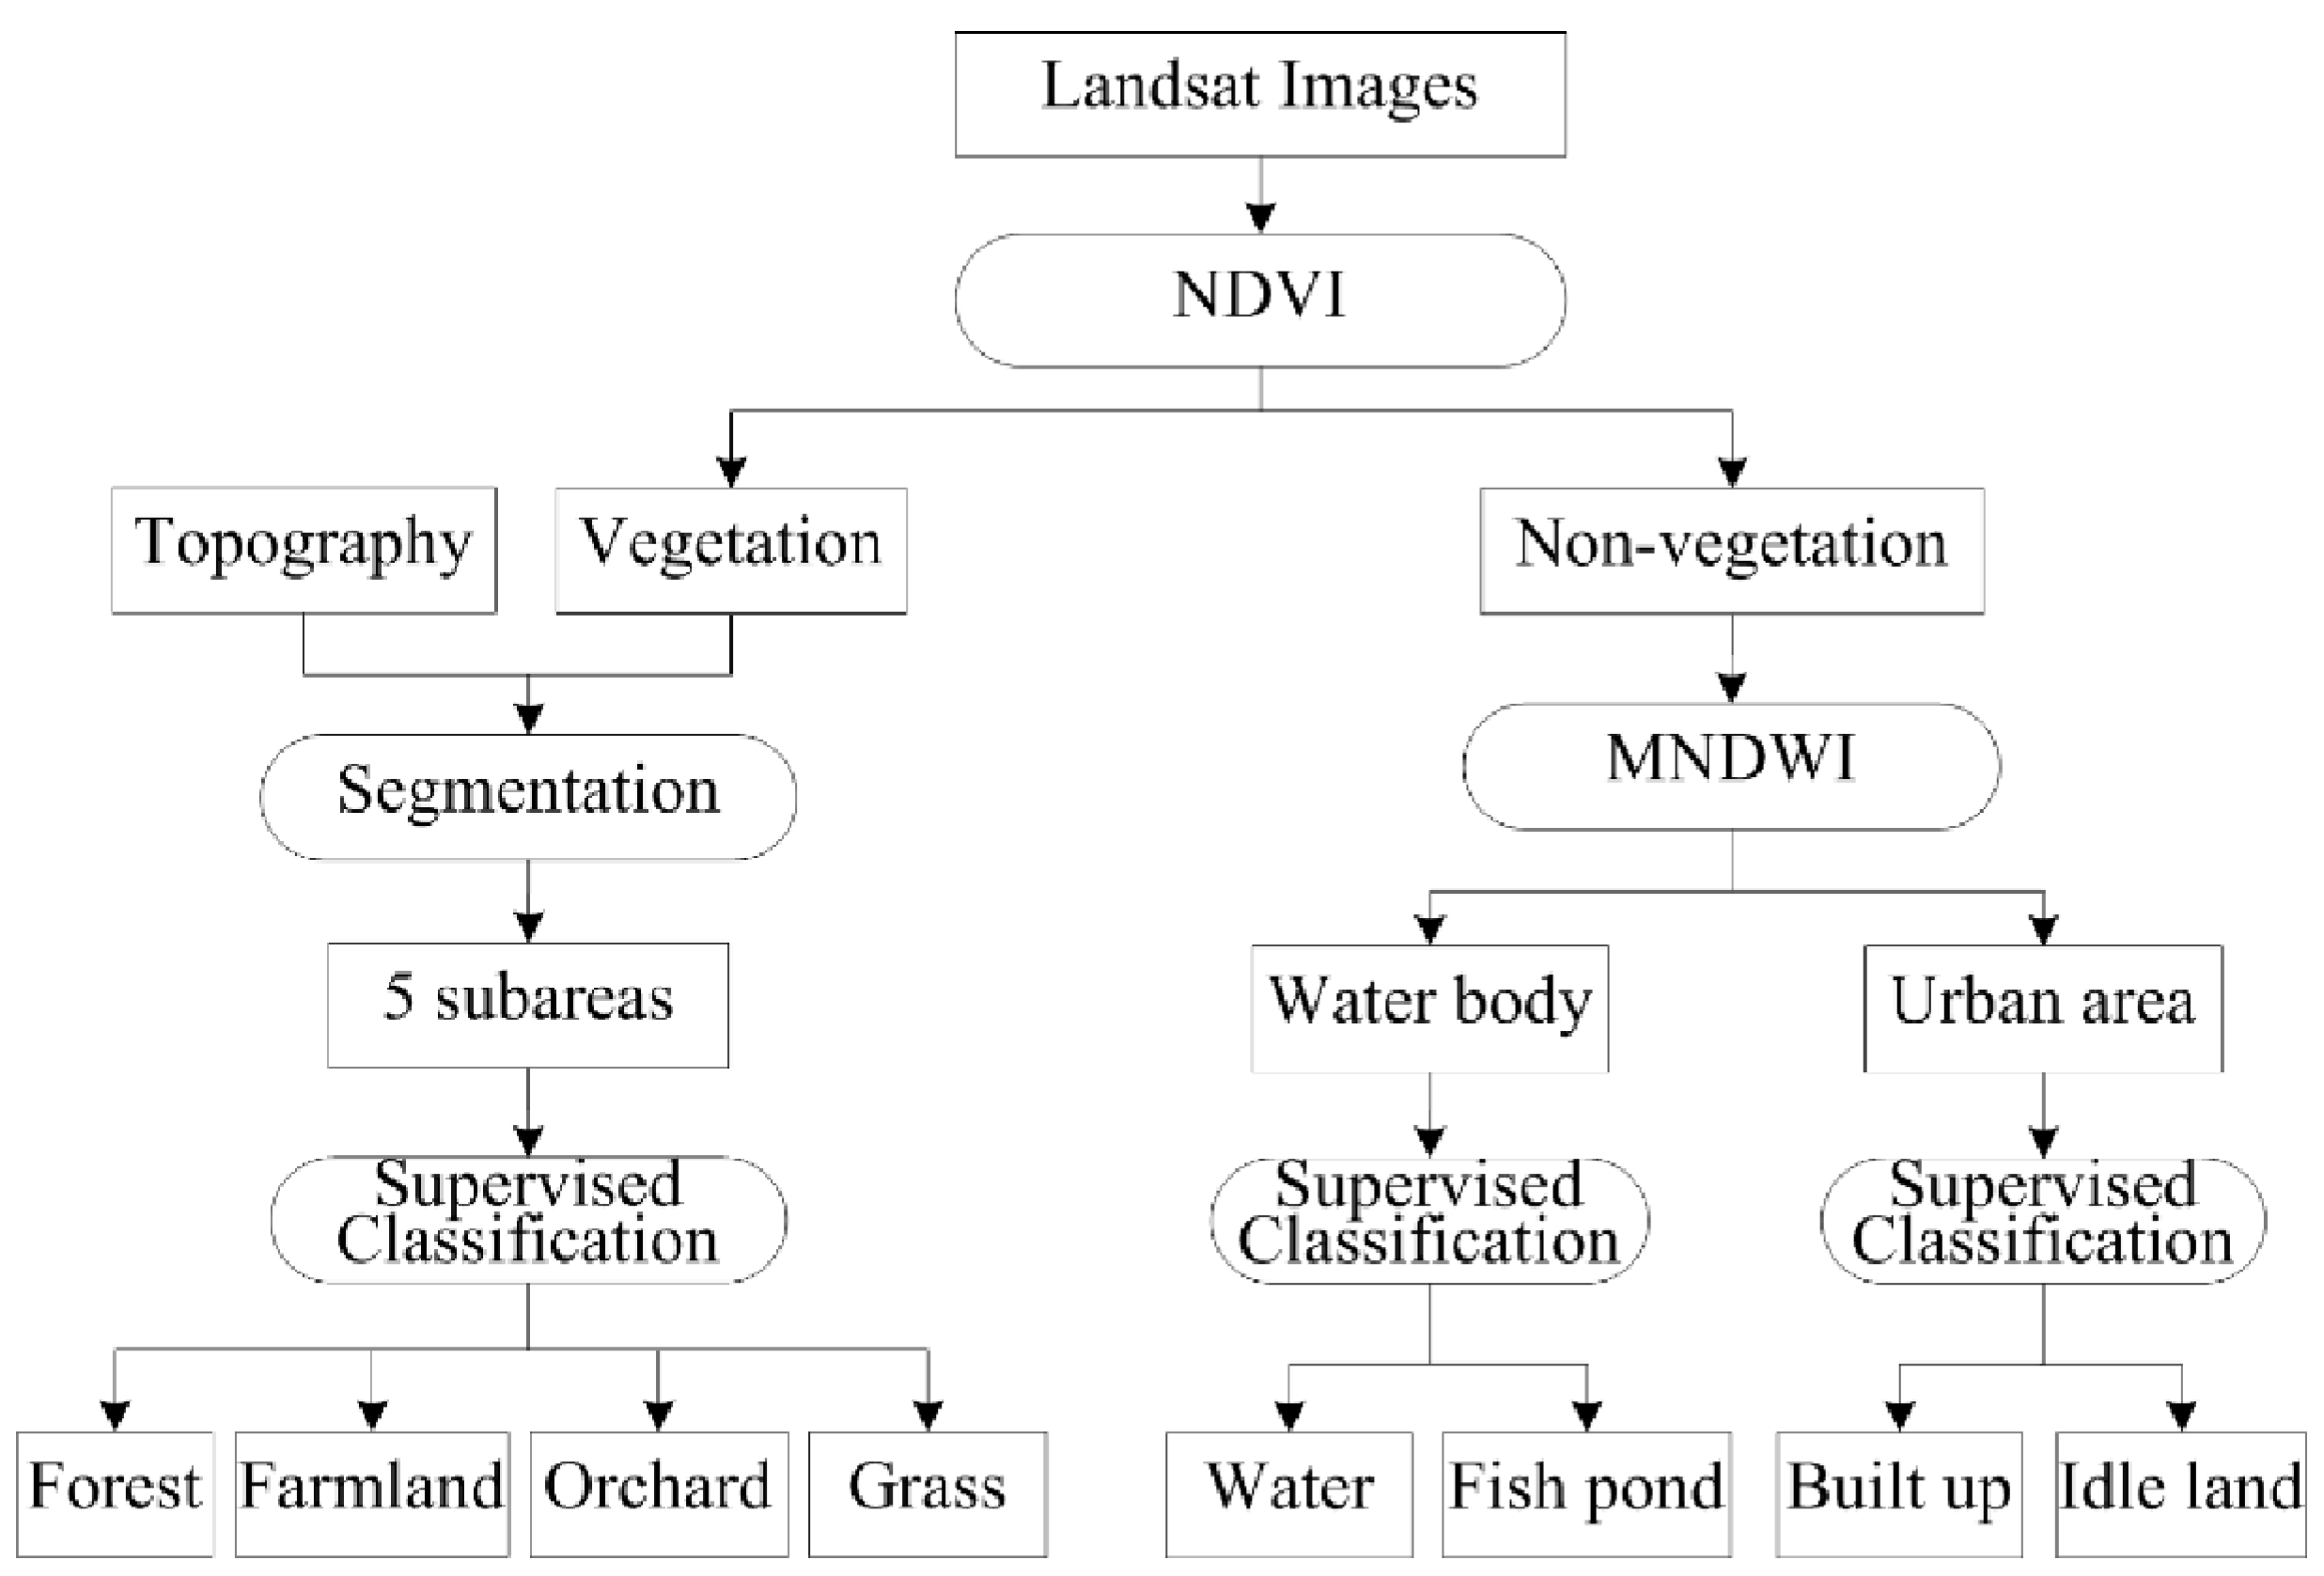
45]. The accuracy was ensured by the relative high resolution Landsat imagery and the classification procedure. In imagery classification, image segmentation was employed to divide the vegetation areas into five sub-areas by means of topographic attributes. It is a useful method in analyzing Remote Sensing data because it can divide the image into homogeneous sub-areas and be able to reduce the image’s complexity [
37]. It is very suitable to be applied in vegetation classification because vegetation is often heterogeneous due to multiple plant types and densities, and different irrigation and harvest seasons. Landscape metrics were employed in analyzing the urban expansion variation over time and space. Additionally, spatial analysis and statistical data were used to investigate the impact of urban expansion on farmland reclamation and deforestation, and the relationship between farmland change and grain production variation. These quantitative methods precisely revealed the conflicts between urban expansion and farmland protection, and thus have the potential to assistant land use planning.
Urban sprawl has accelerated in the past 20 years due to the profit-oriented development and inefficient land use planning, despite huge concern for farmland protection and urban sprawl control. In addition, the conflict between economic growth and farmland protection [
2,
21] has been simply addressed by dislocating farmland to unsuitable lands. Moreover, the farmland displacement does not ensure the stability of grain production but further causes deforestation. Urban sprawl is actually encouraged at present because encroaching farmlands is relatively cheap and concerned governments could benefit from this process [
2,
21,
27]. A revision of current land policies should therefore focus on stimulating more efficient urban land use. Such stimuli could come from taxation of urban development on farmlands [
27]. It may be more effective if the revenue from the tax and the incremental land value could be used for open space protection and as subsidies to ecological agriculture [
54]. On the other hand, an ecological agriculture and open space protection system is vital to China’s sustainable development as people are increasingly worried about food pollution [
55]. This system could thus encourage public awareness and promote wide participation in open space protection and sustainable rural development.


