1. Introduction
Urbanization refers to the migration of populations from rural to urban areas. Globally, urban populations have increased significantly over the past few decades, with estimates indicating that 55% of the world’s population resided in urban areas in 2018—a figure projected to rise to 68% by 2050 [
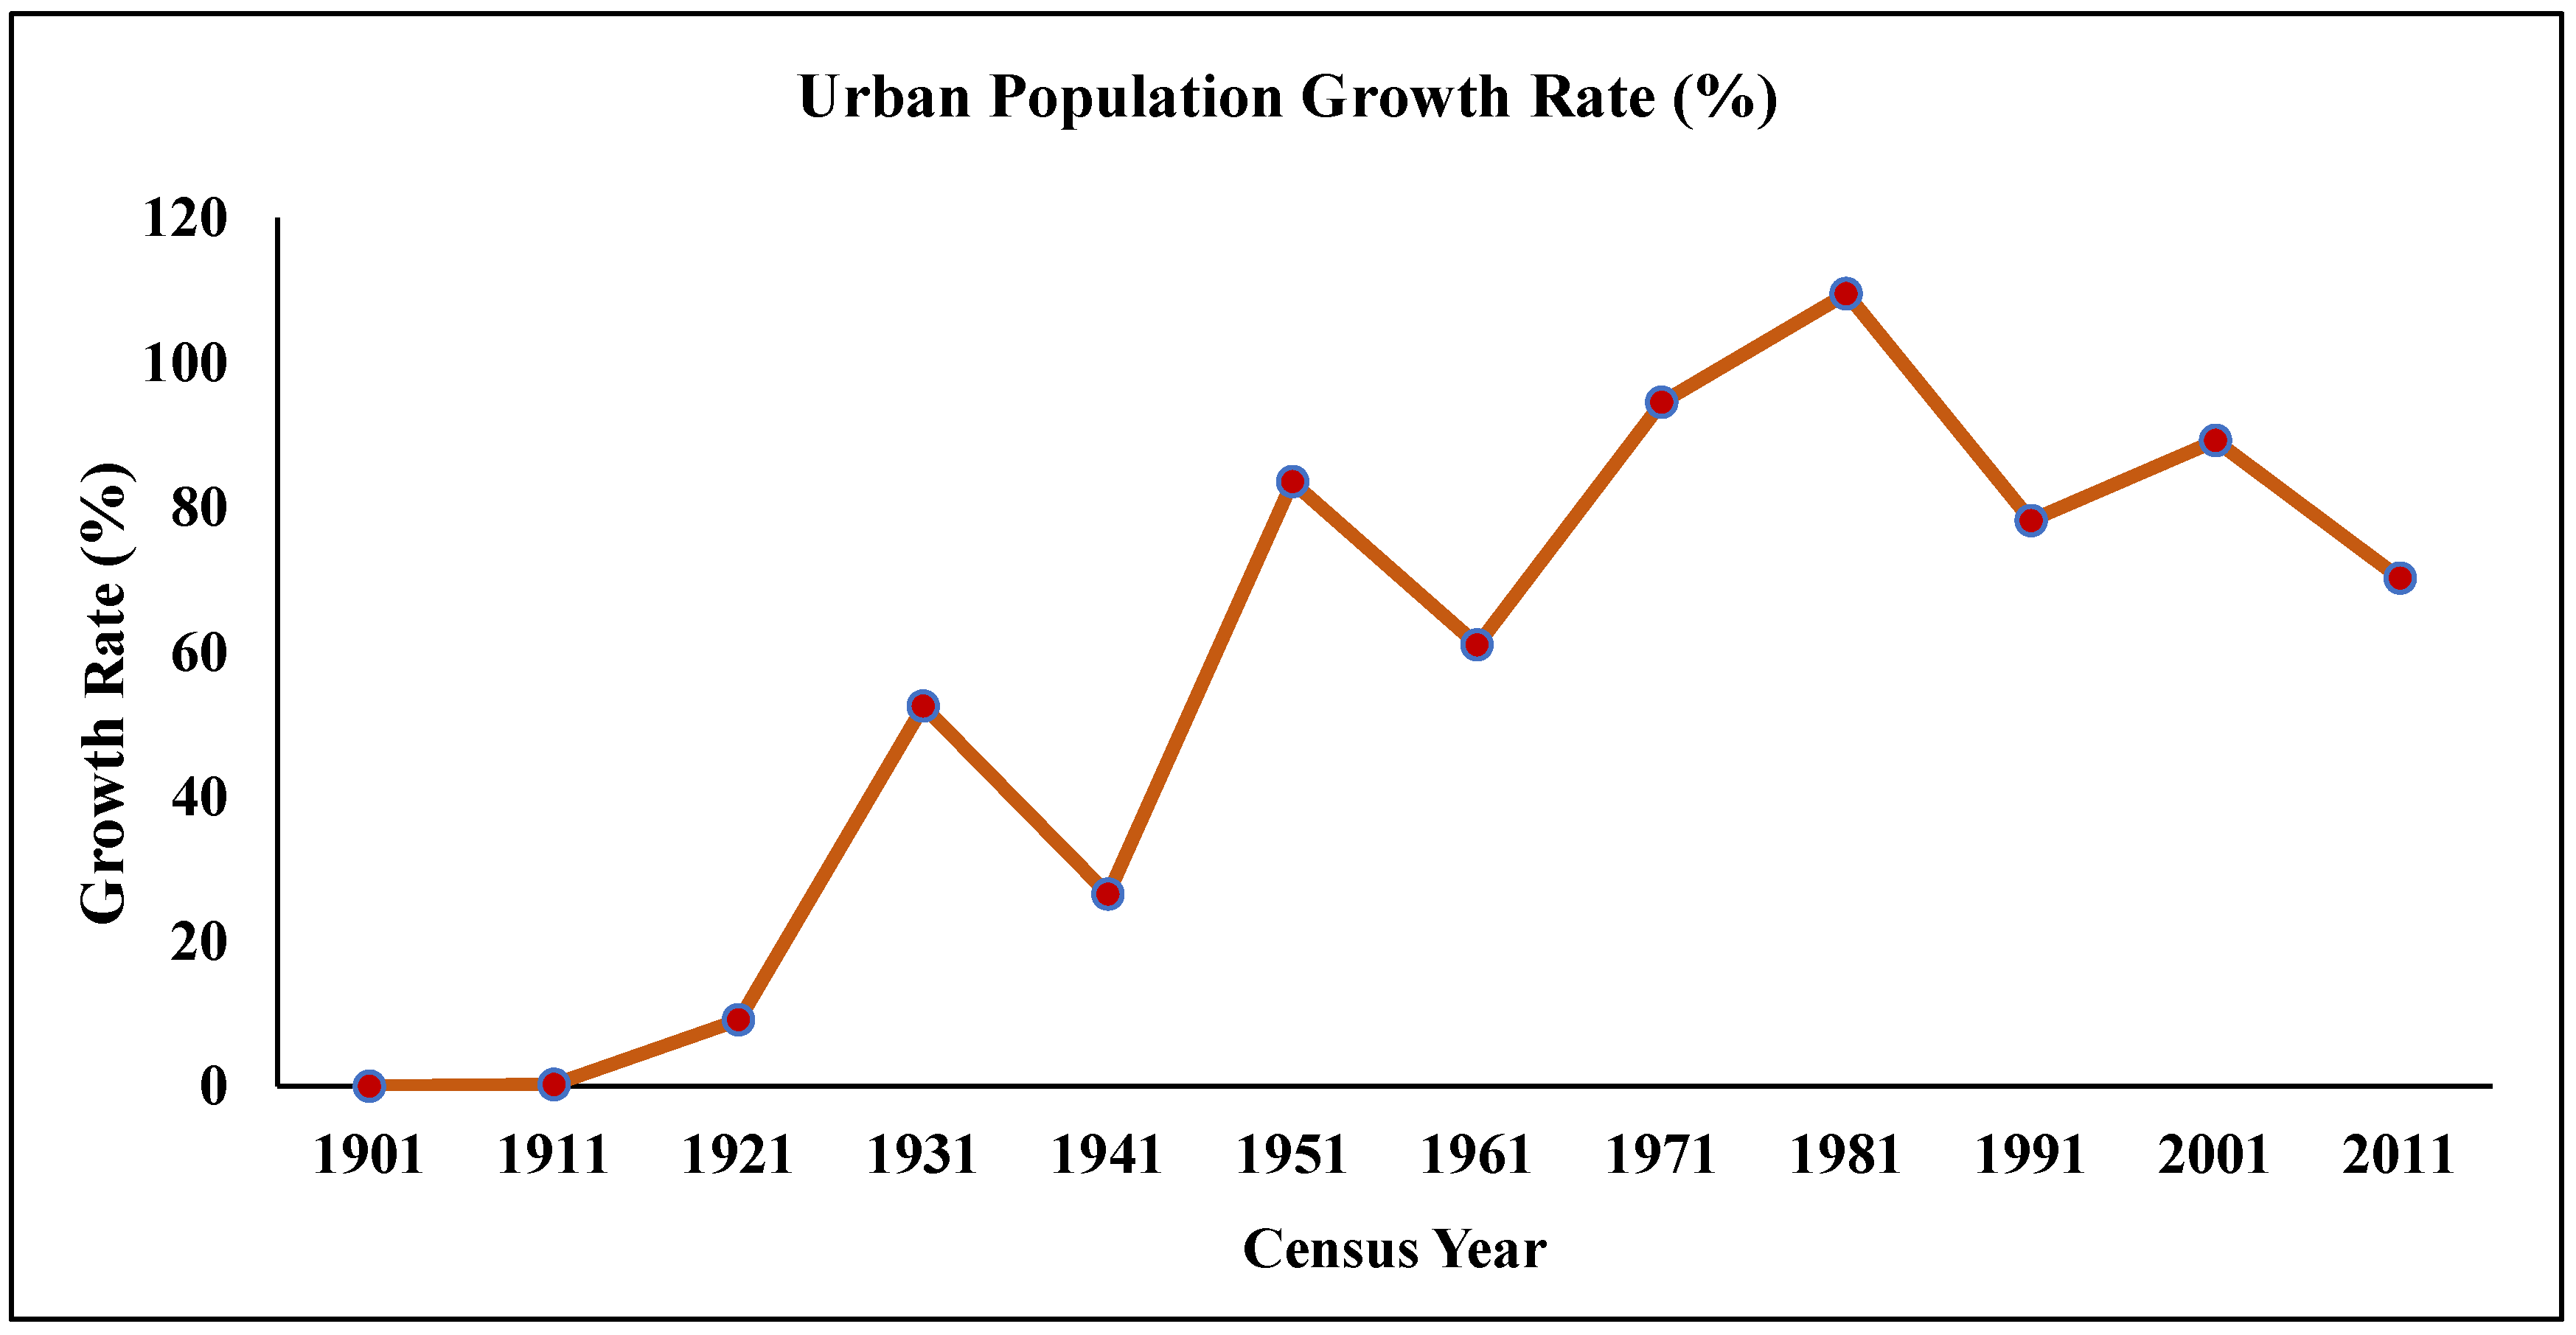
1]. Since independence, India has witnessed considerable urban expansion, driven largely by a rapidly growing urban population. The proportion of urban residents in India increased from approximately 17.3% in 1951 to 31.16% in 2011 [
2]. It is projected that by 2030, over 40% of India’s population will live in cities and contribute to 75% of the country’s GDP [
3]. Urbanization, which involves both population migration to urban areas and land cover changes, has been strongly associated with environmental degradation, particularly in terms of waste generation, air pollution, and climate change [
4,
5]. The UHI effect is strongly linked to human-driven effects on energy consumption [
6], air quality [
7], and changes in precipitation patterns [
8]. The UHI phenomenon, wherein the urban core experiences elevated temperatures compared to its surrounding suburban or rural areas [
9,
10], was initially observed by Luke Howard (1772–1864) [
11]. Since then, numerous studies and literature reviews addressing the UHI phenomenon have been published shortly after their discovery, including literature reviews [
12] and articles [
13].
The recent surge in urban population is primarily attributed to extensive rural-to-urban migration, driven by enhanced economic opportunities and improved living conditions in cities and large metropolitan centers [
14,
15,
16]. Urbanization transforms natural land into impervious surfaces, significantly changing its thermal characteristics and contributing to increased heat retention. These modifications intensify the thermal environment of urban areas and contribute to the formation of surface urban heat islands [
17,
18]. Understanding land use changes is essential for assessing the impacts of human activities on the landscape [
19]. Changes in urban land use have led to several environmental issues, such as the emergence of localized microthermal and microclimatic zones [
20]. Consequently, the decline in vegetation and the rapid growth of urban settlements are likely to elevate
LST [
21,
22]. The integration of RS and GIS technologies has proven effective for modeling changes in LULC and
LST [
23,
24,
25].
UHIs are characterized by higher surface and air temperatures compared to their natural surroundings [
26,
27]. As a consequence of rapid urban expansion, significant LULC transformations have occurred in many cities. The most prominent consequence of LULC changes in Indian cities has been their impact on climate conditions, through rising temperatures, altered precipitation patterns, and declining air quality [
20,
28,
29]. Several studies have quantitatively demonstrated a strong relationship between LULC changes and variations in land surface temperature [
30,
31,
32].
The UHI effect can exacerbate extreme heat events, making them more intense and frequent [
33,
34]. Enhanced environmental pollution not only increases public health risks but also leads to higher energy consumption [
35]. Urban heat islands (UHIs), air pollution, severe climatic conditions, and other human–nature conflicts are among the critical challenges that have arisen over the last century due to rapid urban expansion and LULC alterations [
36]. Rapid urbanization and drastic land cover transformations have significantly altered surface energy balances, resulting in elevated land surface temperatures in urban centers [
37]. Several studies have highlighted a strong association between
LST, UHI intensity, and the spatial extent of built-up and vegetated areas [
38,
39,
40]. The UHI effect leads to localized heat accumulation, resulting in higher urban temperatures relative to surrounding areas and posing serious health risks to urban populations [
41,
42]. The study of the UHI phenomenon is critical for developing effective thermal mitigation methods and improving the thermal resilience of urban environments, thereby contributing to the achievement of the United Nations Sustainable Development Goals [
43]. Extreme temperatures observed on these high
LST surfaces are referred to as urban hot spots [
44]. Identifying and assessing
UHSs is crucial for effective urban temperature regulation and maintaining ecological balance in the urban environment [
45]. The main aim of this research is to identify urban hot spots within Ghaziabad, thereby assessing the prevailing levels of thermal comfort in the region.
Due to its proximity to the national capital, Ghaziabad has benefited from increased industrialization and associated economic opportunities. However, this rapid development has also introduced significant environmental and infrastructural challenges. The city’s thermal environment has experienced significant changes as a result of intensified industrial development and rapid urbanization. This research examines the dynamics of land use/land cover (LULC) and their interactions with land surface temperature (LST) and surface urban heat islands (SUHIs). Additionally, the study aims to identify urban hot spots and evaluate the correlations between different land use indices and LST. Unlike many previous remote sensing studies of urban heat islands, this research integrates SUHIs and UTFVI with UHS mapping to provide a more detailed assessment of thermal stress. By examining a three-decade period (1992–2022), it captures the long-term trajectory of UHI dynamics in Ghaziabad. The results of this investigation are expected to provide valuable insights into urban planning, environmental management, and the development of strategies aimed at mitigating the effects of climate change.
2. Materials and Methods
2.1. Study Area
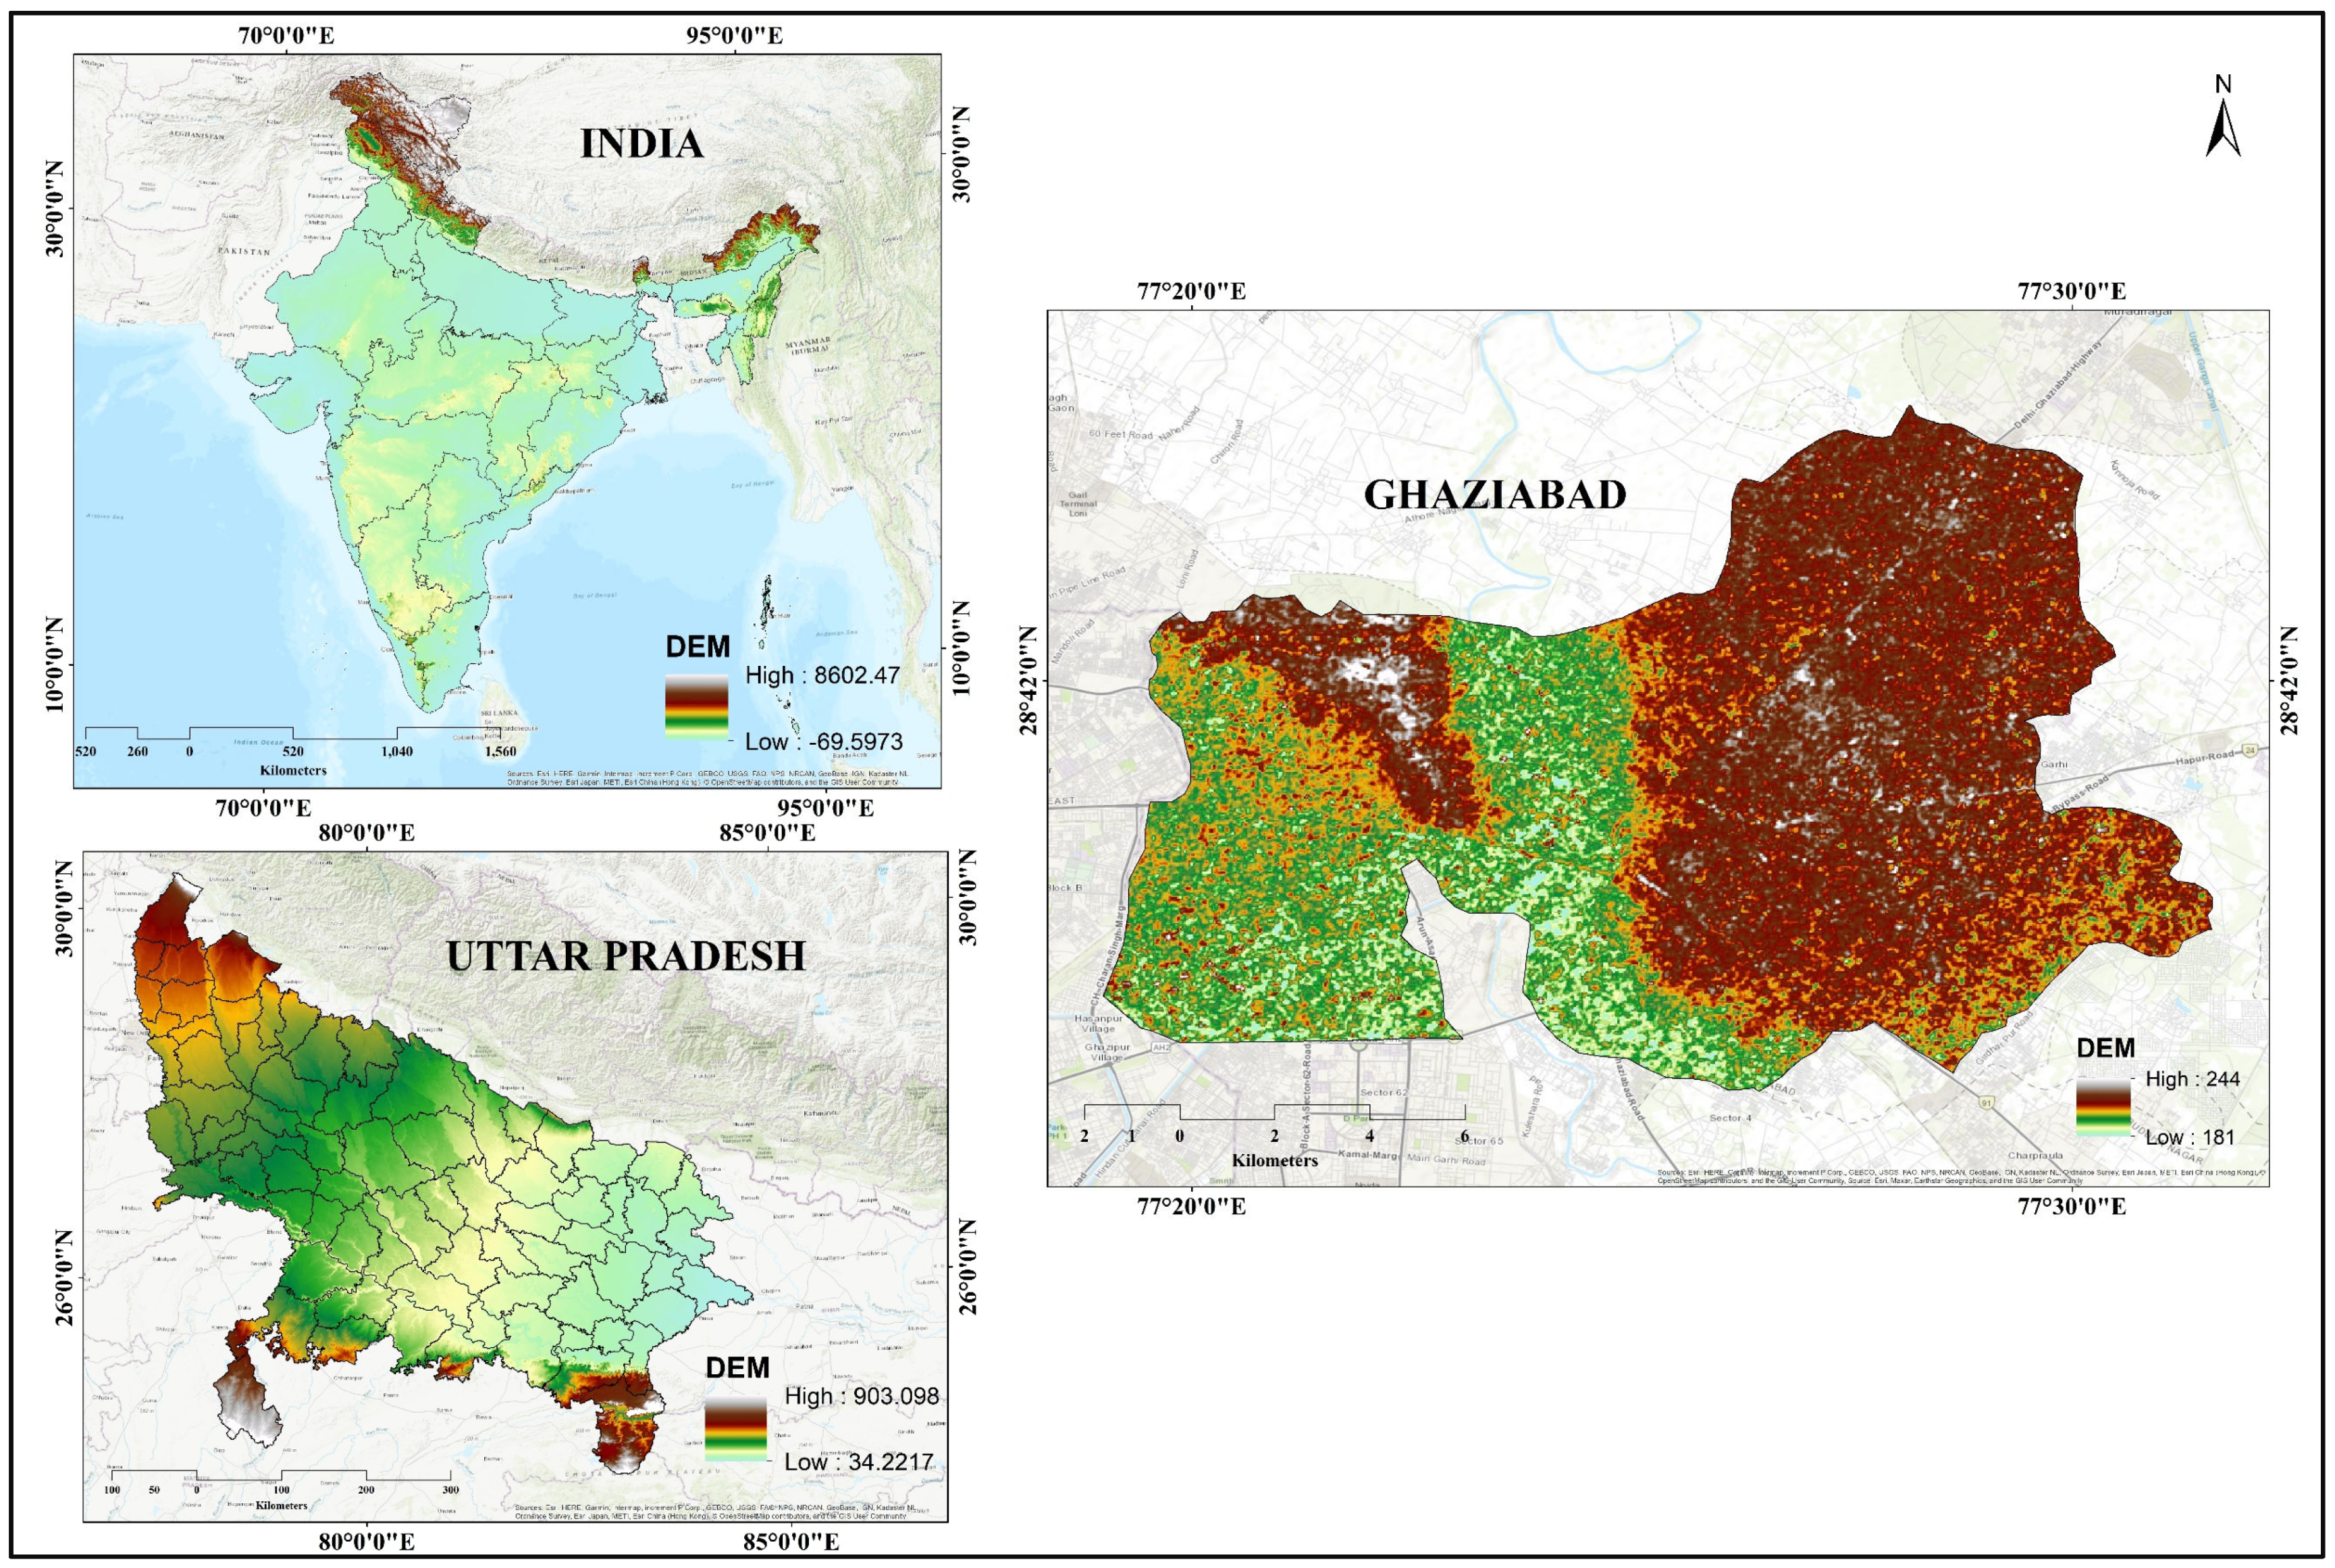
Ghaziabad is located in the east of the national capital territory of Delhi and west of the state of Uttar Pradesh. It is in the National Capital Region (NCR), as shown in
Figure 1. Due to its location adjacent to Delhi, it is known as the “Gateway of Uttar Pradesh.” Ghaziabad is surrounded by the district Meerut in the north, Gautam Budh Nagar and Bulandshahar in the south, Hapur on the east, and the national capital Delhi on the west side. The city is divided into the CIS Hindon Area (CHA) in the east and the Trans-Hindon Area (THA) in the west by the Hindon River, which flows through it. THA comprises 1/3 of the city’s area and population, while CHA comprises 2/3. Ghaziabad is a central industrial and corporate hub in Uttar Pradesh. In this area, similarly to other regions in northern India, there are mainly three distinct seasons: summer, winter, and the monsoon. The city experiences a dry and healthy climate, characterized by very high temperatures during the summer and significantly low temperatures in the winter. The monsoon season typically starts between late June and early July and continues until October. A significant amount of rainfall in the area occurs during the monsoon season. Ghaziabad, a significant district in Uttar Pradesh, is within the NCR and is part of the Meerut division. The 2011 census ranked it as the third-most populous district. Located in the center of the Ganga Yamuna doab, Ghaziabad has a roughly rectangular shape, measuring approximately 72 km in length and 37 km in width; the size of the sample area we examined is 177.9 km
2. Ghaziabad Metropolitan Area has a total population of 1,648,643, comprising 874,607 males and 774,036 females. Its geographical coordinates lie between 28°30′ and 28°59′ north latitude and 77°26′ and 78°10′ east longitude.
Different Landsat satellite images were used to assess LULC changes, extract
LST, and examine UHI variations in the study area. All images featured a spatial resolution of 30 m for Bands 1–5 and 7 (
Table 1). All Landsat images were sourced from the United States Geological Survey (USGS) platform (
https://earthexplorer.usgs.gov/, accessed on 12 October 2024). These datasets are widely used for surface temperature estimations [
46] and LULC change assessments [
47]. The selected images had high spatial resolution and cloud cover of less than 2%. The shapefile for the study area was obtained from a verified source. Georeferencing was initially conducted using four Ground Control Points (GCPs), followed by careful digitization of the shapefile.
To investigate changes in LULC, LST, and NDVI within Ghaziabad, all data were transformed into the UTM/WGS84 coordinate system. Landsat images were geometrically corrected to the Zone 43 North UTM projection using the WGS84 geodetic datum. ArcGIS 10.8 software (Esri, Redlands, CA, USA) was utilized for spatial analysis, while ERDAS 2014 (Hexagon Geospatial, Sweden) was employed to assess LULC changes and process images.
2.2. Image Processing and Classification
The study area was delineated, and false color composite (FCC) images were generated by combining spectral bands to facilitate visual interpretation and improve classification accuracy. Visual interpretation provides valuable insights into land cover changes over time [
48]. Image enhancement techniques have improved the interpretability of satellite imagery [
49].
Remote sensing techniques employing Landsat images have been used to classify and map LULC changes by identifying distinct landscape elements [
50]. More than 300 training samples were collected across all LULC classes to ensure accurate classification, with over 70 samples collected for each class. Five LULC categories were identified to assess the impact of land use changes on
LST and
SUHIs.
These categories—built-up area, agriculture, open land, vegetation, and water bodies—were classified using a supervised approach. The maximum likelihood algorithm was employed to classify the five land cover categories. The thermal band was excluded due to its non-reflective properties [
49]. A detailed description of LULC classes is given in
Table 2.
2.3. Land Use/Land Cover (LULC) Extraction and Change Analysis
There are several ways to implement supervised classification; however, in this study, the commonly used maximum likelihood classifier (MLC) was employed together with ERDAS IMAGINE software. Ghaziabad was classified into five main LULC classes—built-up area, vegetation, agricultural, open land, and water bodies. Different spectral signatures of Landsat images were identified and validated using Google Earth images from the same period. Before assigning LULC classifications, band composition was applied to the Landsat images. The maximum likelihood classifier was applied using composite bands from the three study years as input parameters; a critical advantage of parametric algorithms, such as MLC, is their ease of application. Parametric techniques are especially effective for less complex terrains with well-defined LULC categories
Producer Accuracy (PA) measures the percentage of correctly classified pixels for a given class. In contrast, User Accuracy (UA) indicates the likelihood that a pixel classified as a particular category genuinely belongs to that category. The ratio of the accurately classified reference points to the total reference points was considered to calculate the overall accuracy.
2.4. Accuracy Assessment
Accuracy can be assessed by comparing reference data with information obtained through remote sensing techniques [
51,
52], emphasizing the importance of the number and representativeness of training samples in image classification. Additionally, it is vital to collect ground reference data as close as possible to the date of the historical imagery [
53]. Ref. [
54] notes that reference data were systematically generated for accurate evaluation. Ref. [
55] reported using a stratified random sampling method to generate reference points for accuracy assessment. They also noted that a confusion matrix was employed to evaluate the accuracy of each LULC map [
56]. A confusion matrix was generated in ERDAS IMAGINE 2014 to compute user accuracy, producer accuracy, and overall classification accuracy. The outcomes and confusion matrix for various LULC classifications are presented in
Table 3. The overall accuracy of the LULC maps is above 90%.
2.5. Derivation of Spectral Indices
2.5.1. Normalized Difference Vegetation Index (NDVI)
The
NDVI is an indicator of relative greenness used to assess vegetation. It is also effective for monitoring vegetation productivity and identifying changes in vegetation [
57]. Surfaces without vegetation exhibited negative values [
58].
NDVI analysis was conducted using ArcGIS 10.8 to identify green areas within Ghaziabad and to validate land use changes detected from satellite imagery. The required bands were added in ArcGIS, and the calculation was performed using a raster calculator.
NDVI was calculated as suggested by [
59] using Equation (1).
Whereas R corresponds to band 3 in Landsat 5 (TM), it represents band 4 in Landsat 8 OLI and TIRS. On the other hand, NIR signifies band 4 in Landsat 5 TM and band 5 in Landsat 8.
2.5.2. Normalized Difference Built-Up Index (NDBI)
Previous studies have shown that high
NDBI values indicate urbanized areas, whereas negative values represent non-urban features such as vegetation and water bodies [
60]. In urban settings and exposed soil, reflectance in the Short-Wave Infrared (SWIR) spectrum exceeds that of the Near Infrared (NIR). The infrared spectrum did not reflect water bodies.
NDBI is determined using reflectance values from the SWIR and NIR bands in remote sensing data.
NDBI values vary from −1 to +1, with negative values indicating water bodies and higher values signifying built-up areas. Vegetation typically exhibits low
NDBI values.
NDBI was estimated using the method described by [
60] using Equation (2).
Band 5 in Landsat 5 (TM) and band 6 in Landsat 8 (OLI/TIRS) correspond to the SWIR band.
2.5.3. Normalized Difference Moisture Index (NDMI)
NDMI was derived by computing the normalized difference between the NIR and SWIR bands. It indicates the moisture content of vegetation and assesses the water stress level. By analyzing the NDMI’s absolute value, it is possible to pinpoint areas of a field or farm experiencing water stress.
As suggested by [
61], the NIR and SWIR bands were used to calculate the
NDMI. The calculation was performed using Equation (3).
The information regarding bands is mentioned above.
2.6. Retrieval of Land Surface Temperature (LST)
LST was computed over three years using thermal bands from Landsat satellite imagery. ArcGIS 10.8 software was used to retrieve
LST. The
LST retrieval process involved three main steps: (i) determining the brightness temperature, (ii) estimating the amount of vegetation (
Pv), and (iii) correcting emissivity using
NDVI [
62]. This is among the most widely used methods that differentiates between vegetated and non-vegetated areas. It is also used in the areas of mixed land cover, where emissivity varies significantly. The entire
LST retrieval methodology for the different Landsat sensors is described below.
2.6.1. Retrieval of LST for Landsat 5 (TM)
Step 1: Top of Atmospheric Radiance
The equation suggested by Artis and Carnahan was used to calculate spectral radiance, as shown in Equation (4).
where
Lλ stands for spectral radiance;
LMAX λ for the maximum spectral radiance of the satellite sensor, scaled to correspond with the maximum quantized calibration value (
QcalMAX); and
LMIN λ for the minimum spectral radiance of the satellite sensor, scaled to match the minimum quantized calibration value (
QcalMIN).
Step 2: Convert Radiance into Brightness Temperature (BT) in Kelvin
The next step involved applying Equation (5) to calculate the brightness temperature (BT) from the top of the atmosphere (TOA) reflectance [
63].
In the above equation,
Lλ represents spectral radiance, and
BT represents brightness temperature expressed in Kelvin. The constants
K1 and
K2 are radiometric calibration parameters provided in
Table 4.
Step 3: Conversion of Kelvin into Degrees Celsius
The temperature values were converted from Kelvin to degrees Celsius using the following Equation (6).
In this equation, T(°C) refers to Land Surface Temperature, and BT is the measured temperature in Kelvin.
2.6.2. Extracting LST from Landsat 8 Data
(i) Top of Atmosphere (TOA) Radiance
The radiance rescaling factor transforms thermal infrared digital numbers into Top-of-Atmosphere (TOA) spectral radiance, as shown in Equation (7).
Lλ represents TOA spectral radiance, expressed in watts per square meter per steradian per micrometer (W·m−2·sr−1·μm−1). Qcal represents the pixel’s quantized and calibrated DN values in the standard product. ML is the radiance multiplicative scaling factor for the particular band, while AL is the corresponding additive factor.
(ii) Conversion of Top of Atmosphere (TOA)/Brightness Temperature (BT)
Thermal calibration constants from the Metadata file were used to convert spectral radiance data into top-of-atmosphere brightness temperature, as shown in Equation (8).
BT is the brightness temperature at the top of the atmosphere, measured in Kelvin Lλ is the is the top-of-atmosphere spectral radiance, measured in watts per square meter per steradian per micrometer {W/ (m2 × r × μm)}. K1 and K2 are constants specific to the bands being evaluated.
(iii) Normalized Differential Vegetation Index (NDVI)
NDVI has been calculated as previously described in Equation (1).
(iv) Proportion of Vegetation Index
The proportion of vegetation (
Pv) was calculated using Equation (9).
In this context, PV is the proportion of vegetation, NDVI is the DN value from the NDVI image, and NDVImin and NDVImax are the minimum and maximum DN values from the NDVI image, respectively.
(v) Land Surface Emissivity (LSE):
LSE is a parameter that describes the average emissivity of the earth’s surface, as determined by
NDVI values, and is based on the radiative properties of natural land features. It is calculated by using Equation (10).
PV represents the vegetation proportion, and E stands for land surface emissivity.
(vi) Land Surface Temperature (LST)
The radiative temperature, known as
LST, was estimated by utilizing the wavelength of the emitted radiation, land surface emissivity, and brightness temperature at the top of the atmosphere, as shown in Equation (11).
BT is the brightness temperature measured in Kelvin, is the wavelength of the emitted radiation, E denotes land surface emissivity, and the value is 14,380.
2.7. Estimation of Surface Urban Heat Islands (SUHIs)
UHI represents a prominent environmental issue that impacts major cities where the air temperature is considerably higher than in surrounding suburban areas. The UHI effect also contributes to poor air quality and atmospheric haze. High-density urban infrastructures significantly contribute to the UHI effect since they not only restrict airflow but also release heat from solar energy that has been captured. The loss of wetlands and vegetation further reduces the ability of cities to release heat. Since the UHI impact poses a serious concern to the environment and human health [
64,
65], minimizing and mitigating it has become essential.
SUHIs have been used in numerous prior studies to investigate the spatial extent and intensity of UHIs [
66,
67,
68,
69].
The surface urban heat island (
SUHI) was calculated by using Equation (12).
In this equation, Tmean is the mean LST, SD is the standard deviation of LST; Ts is the LST at a specific location.
2.8. Modeling of Urban Hot Spots (UHSs)
The UHS was modeled to identify areas with the highest land surface temperatures (
LST). UHS typically occurs in isolated areas of highly densely populated land, barren land, or open land that manifests unusually hot temperatures and is unsuitable for human habitation. The
UHSs were modeled using Equation (13), following the method of [
45].
In this equation, µ denotes the mean LST, while δ is the standard deviation of LST within the study area.
2.9. Estimation of UTFVI
The Urban Thermal Field Variance Index (
UTFVI) is an extensively used metric for quantifying the surface urban heat island effect [
70].
UTFVI values are typically higher and concentrated in areas experiencing elevated surface temperatures compared to their surrounding environments [
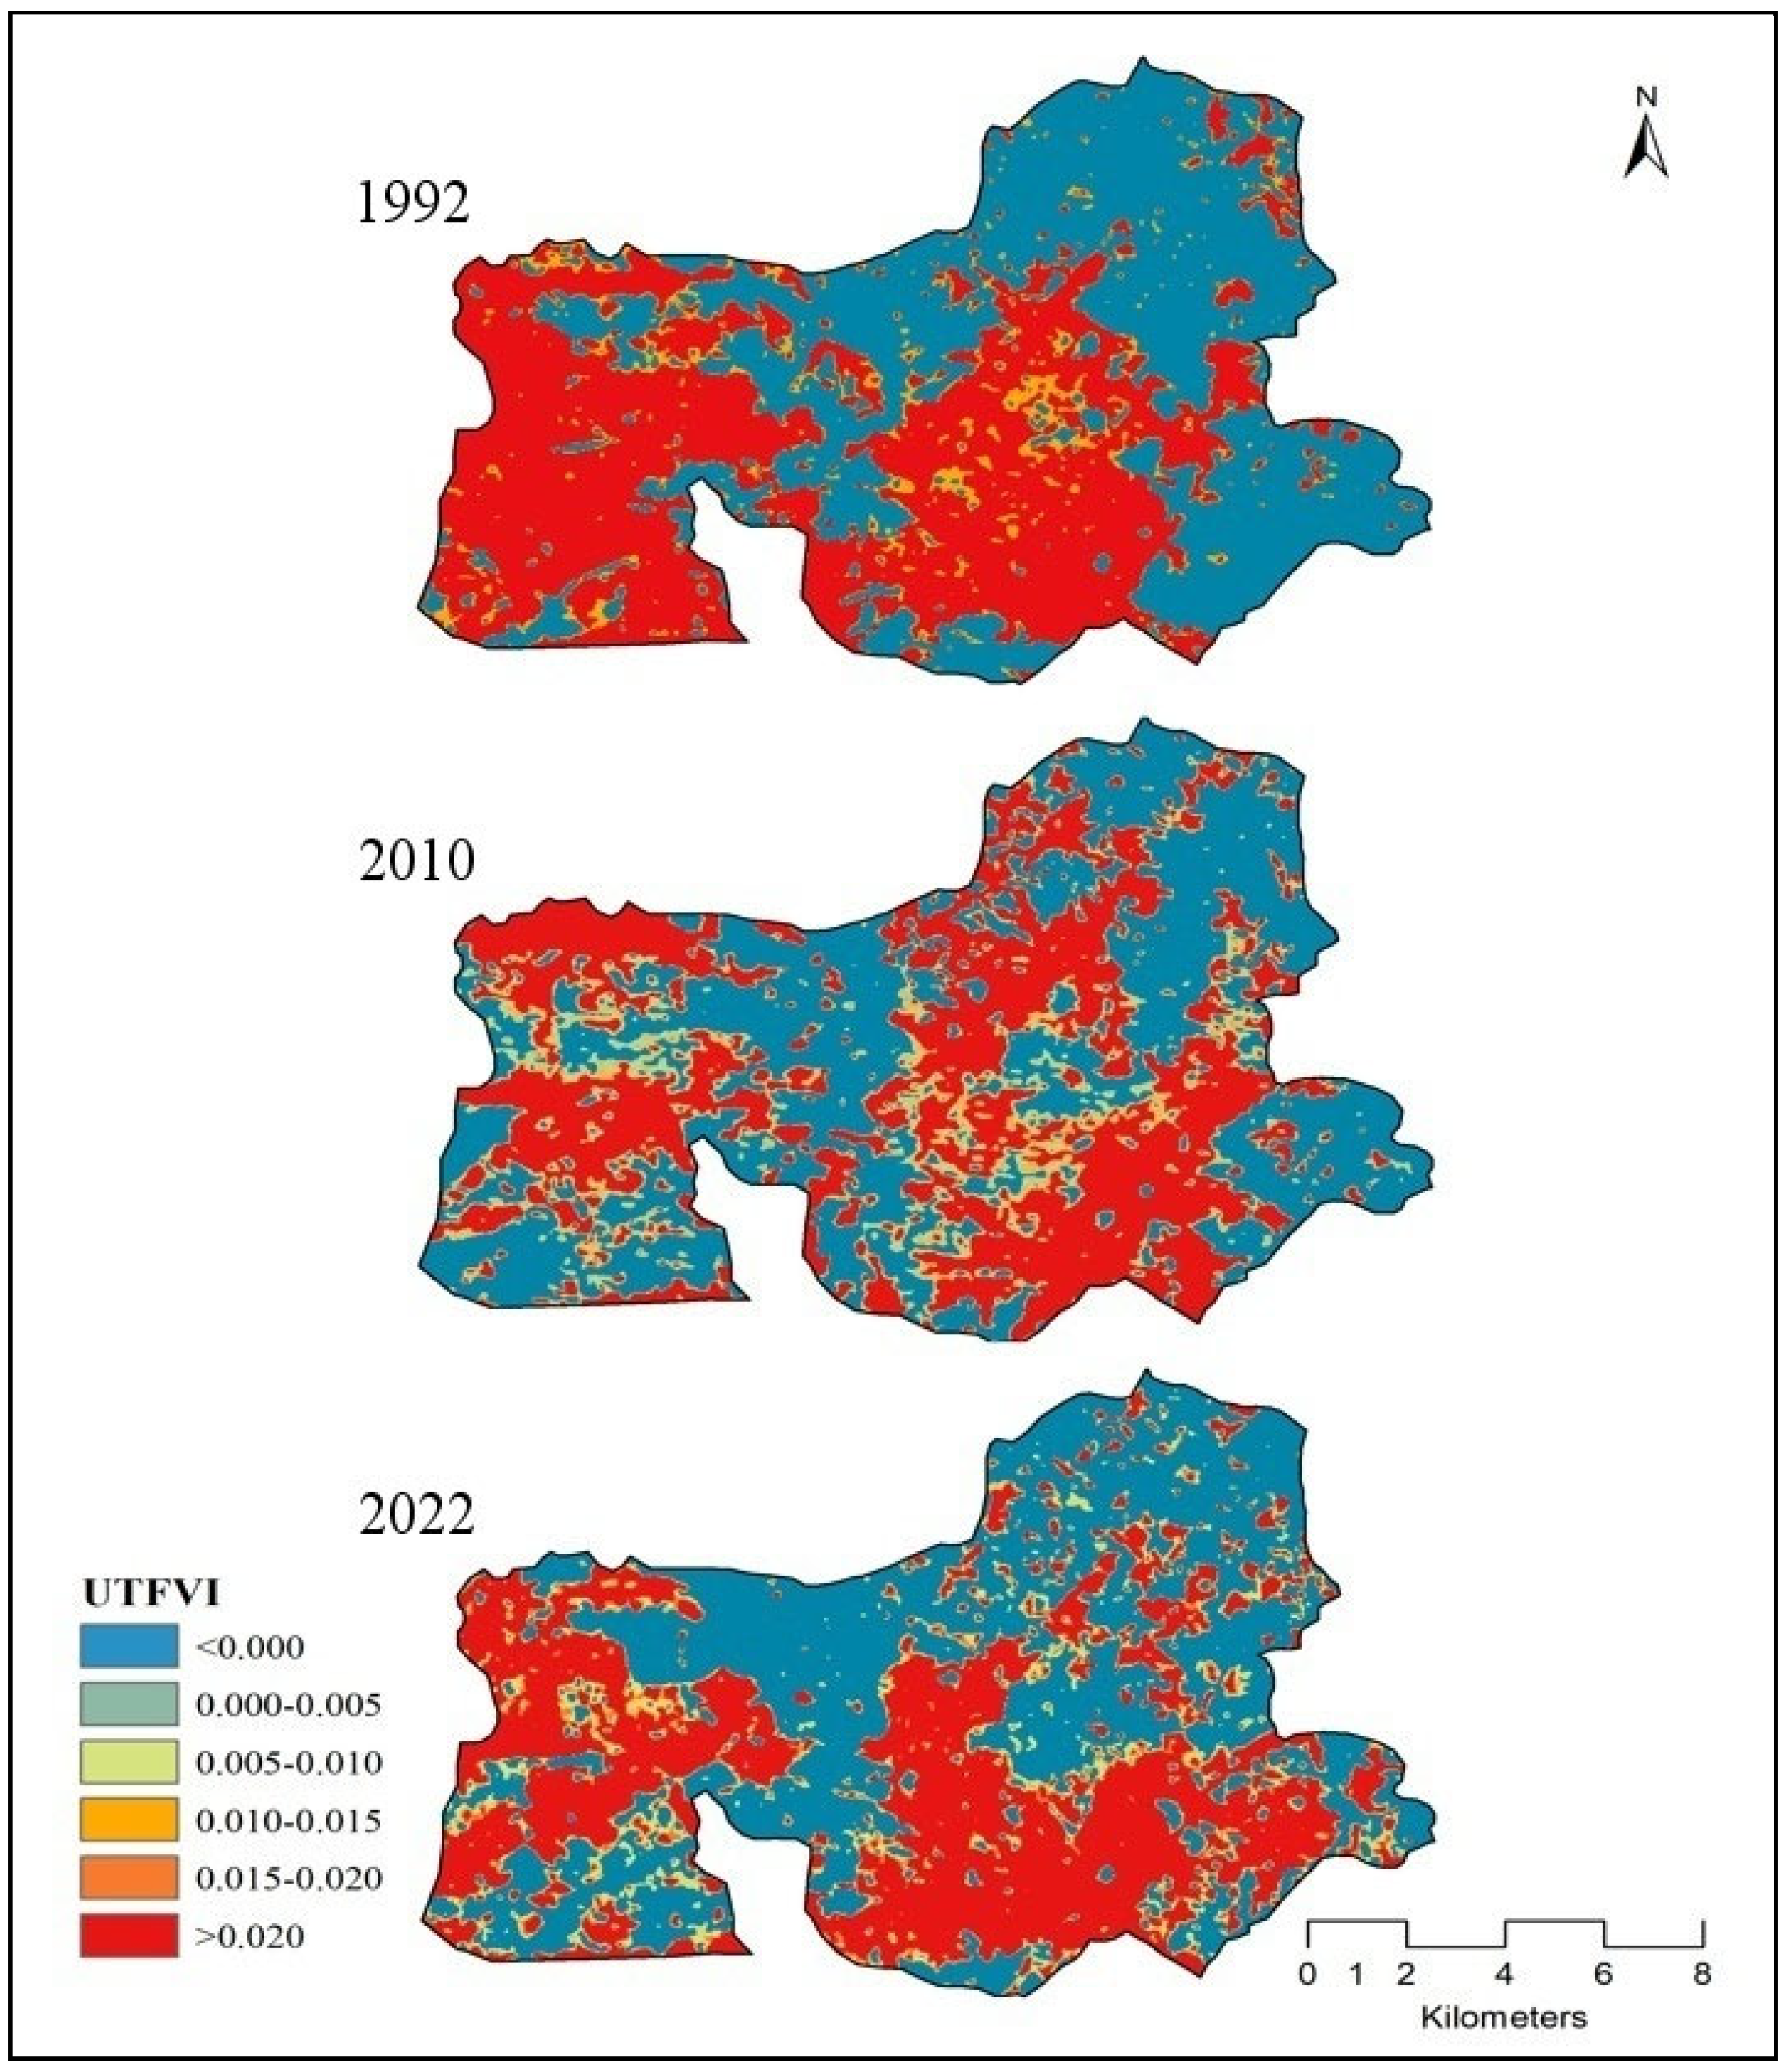
71]. This index categorizes Ghaziabad into six thermal ecological zones: excellent, good, normal, bad, worse, and worst, based on levels of human thermal comfort. These categories represent a gradient of thermal conditions, ranging from optimal to severely uncomfortable [
72]. Equation (14) was used to model the
UTFVI [
73].
The comprehensive methodology is shown in
Figure 2.
5. Discussion
This study analyzed the spatiotemporal dynamics of LULC, their impact on the development of
SUHIs, and their relationship with urbanization in Ghaziabad between 1992 and 2022, using multi-temporal Landsat datasets. Ghaziabad has undergone dramatic transformations in its LULC pattern, which have notably affected SUHI dynamics [
39,
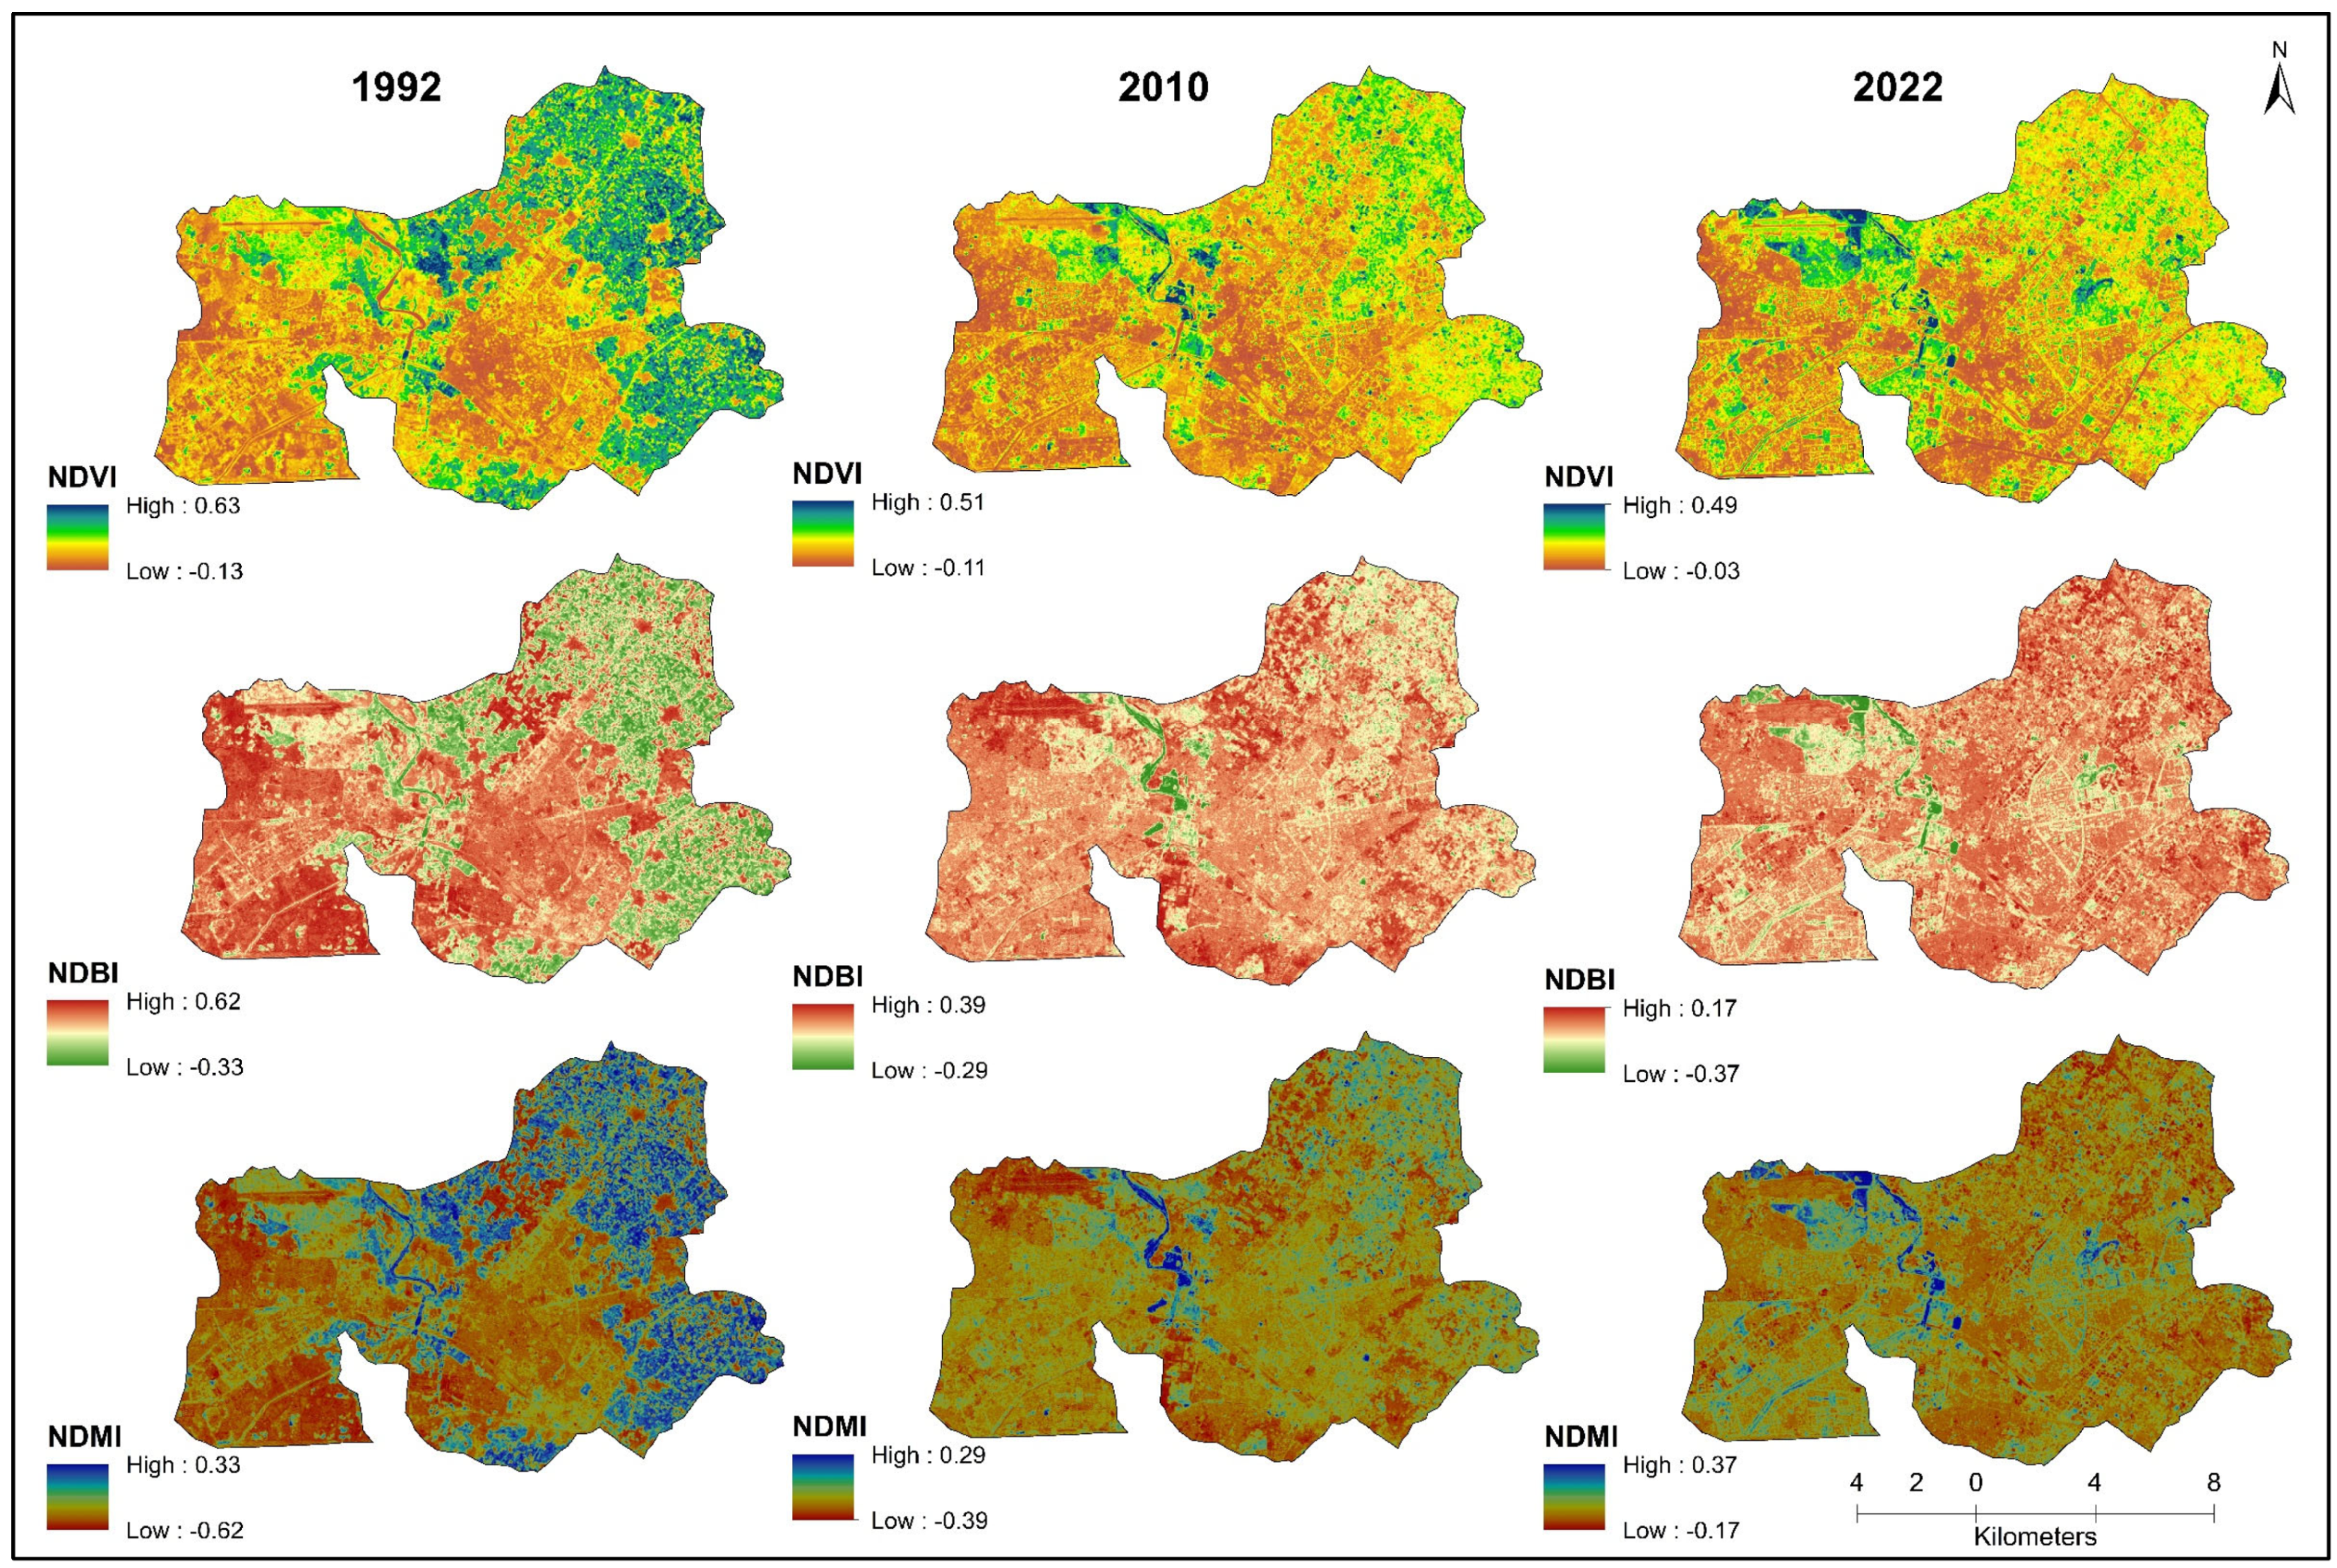
83]. The analysis revealed marked spatiotemporal variations in all evaluated land use indices, including
NDVI,
NDBI, and
NDMI. These changes are primarily attributed to urban expansion, increasing built-up areas that retain less moisture than natural surfaces [
76,
84]. This study explores how temporal shifts in LULC affect
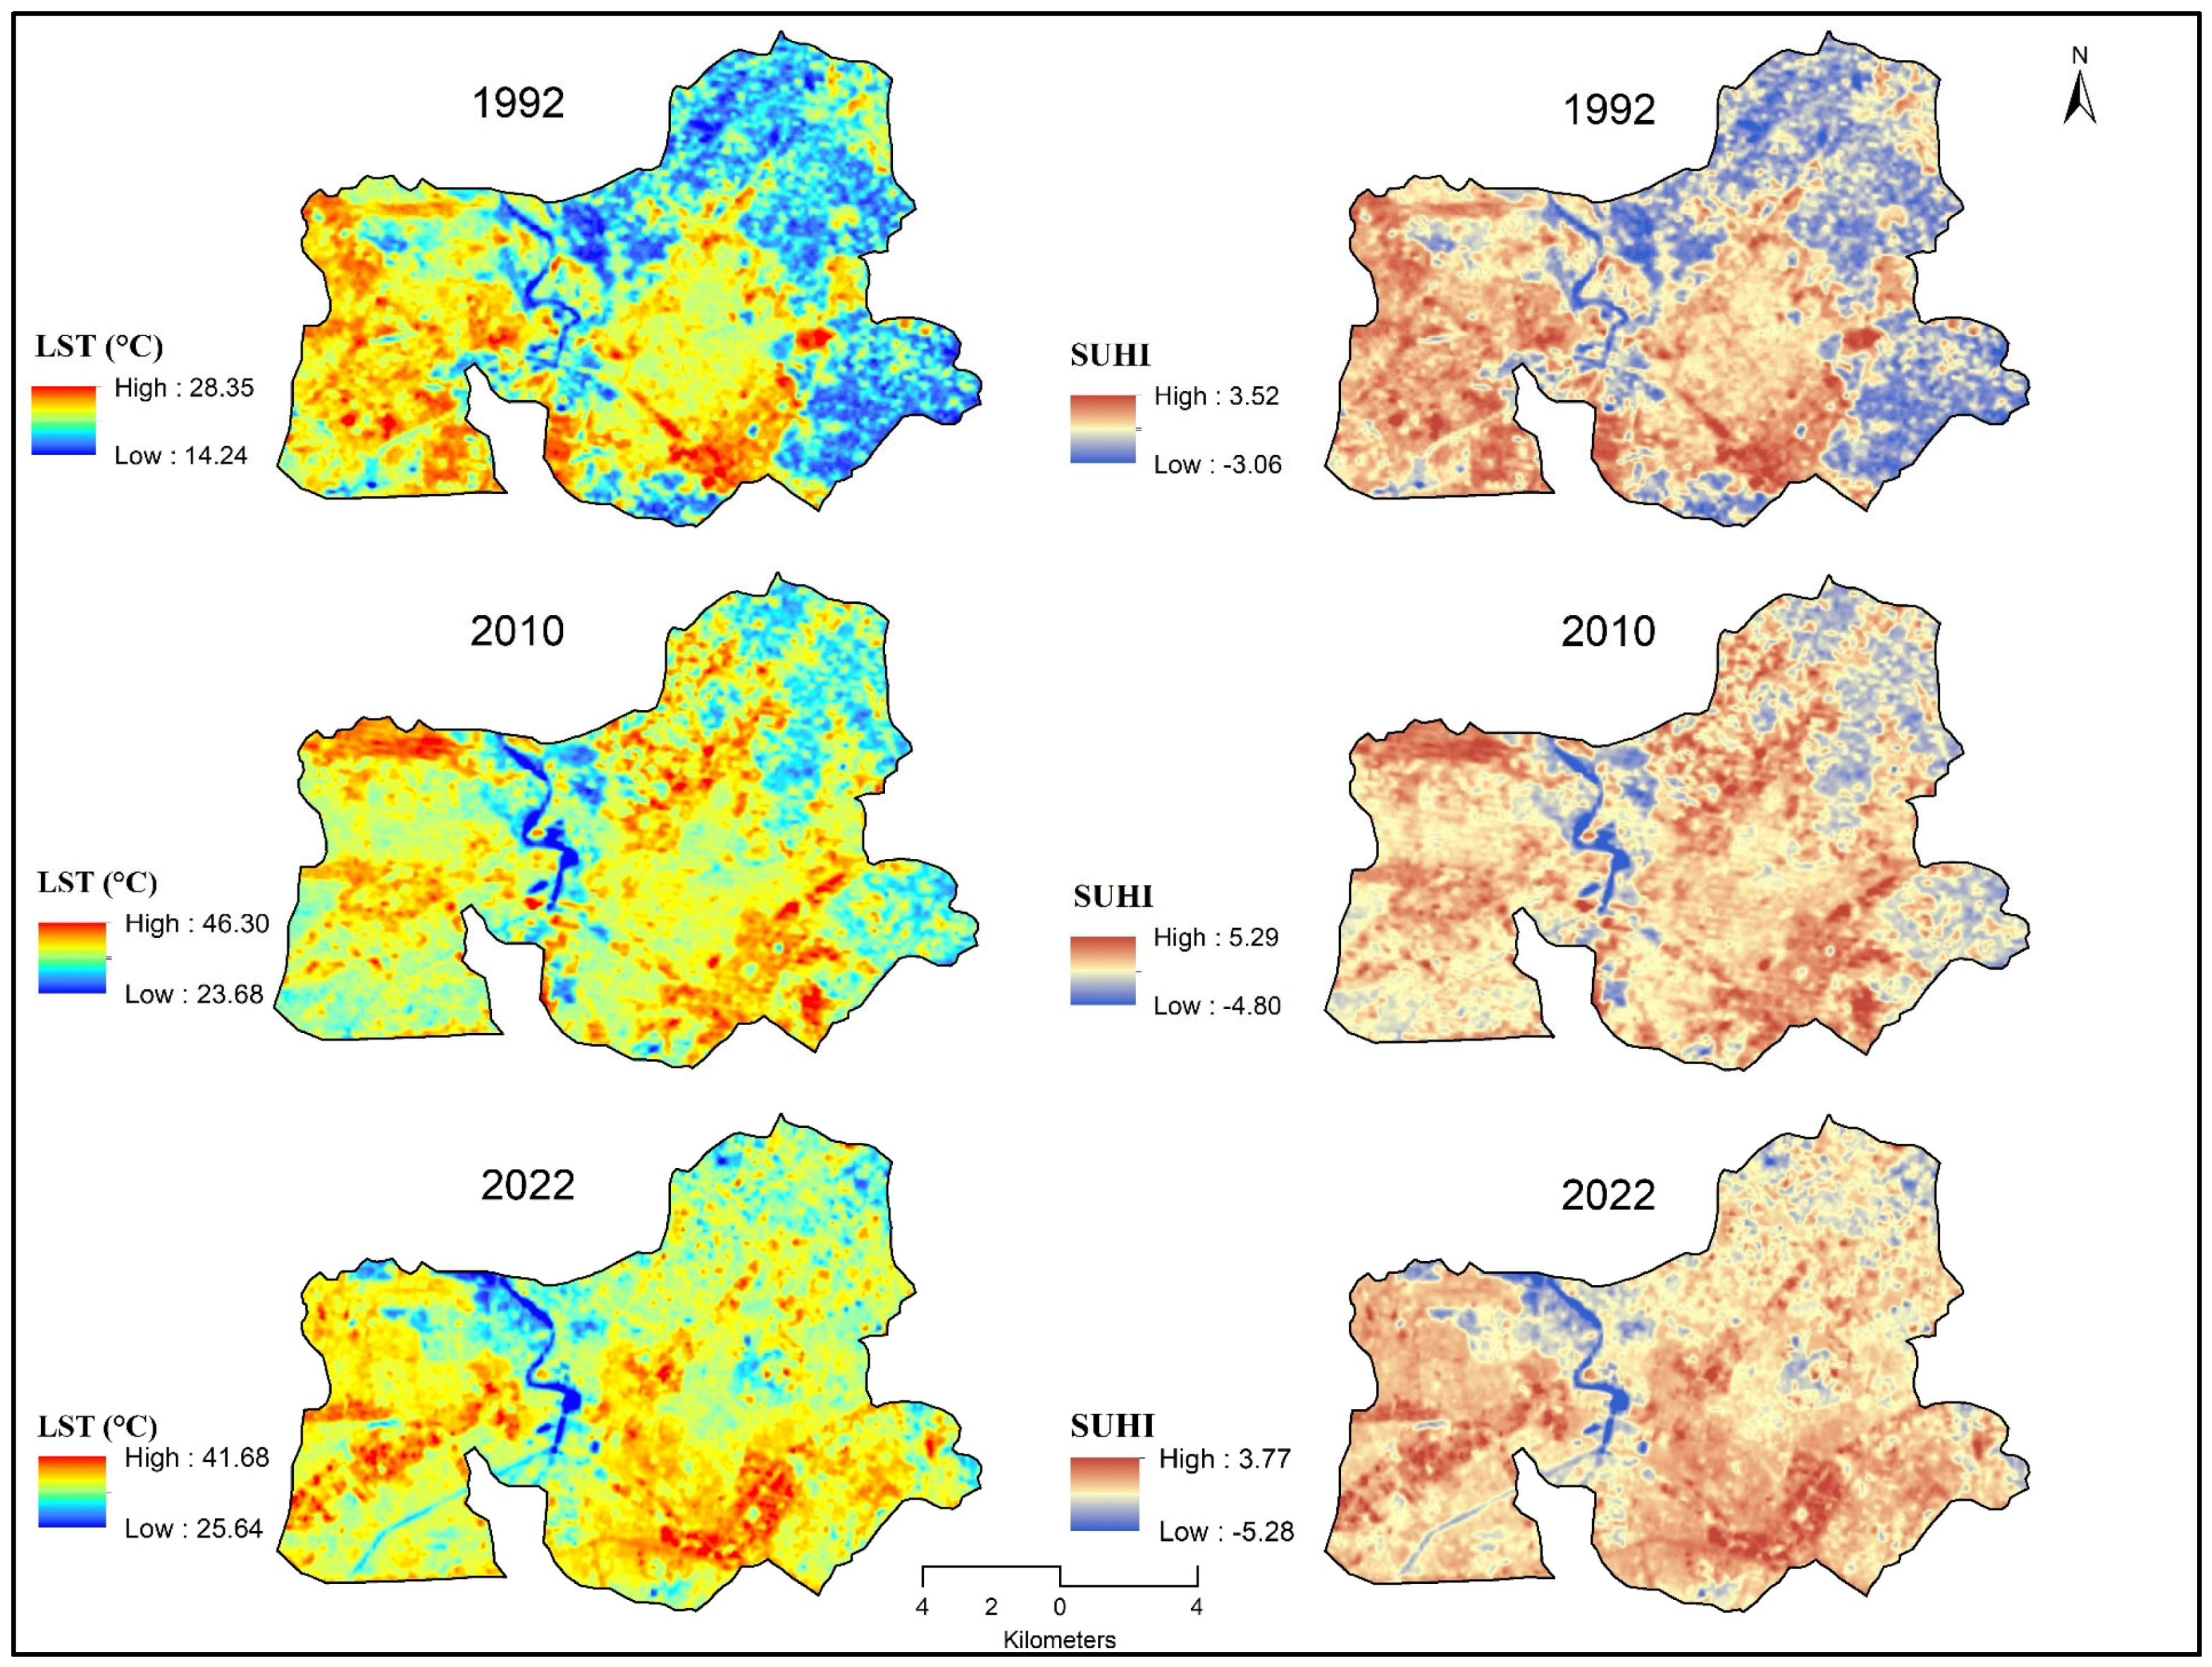
LST and SUHI patterns. The analysis was focused on detecting LULC changes in Ghaziabad and quantifying the SUHI phenomenon using
LST derived from GIS and remote sensing. The research addressed the following objectives: (1) to assess the relationship between LULC indices and
LST; (2) to investigate and track spatiotemporal variations in LULC; (3) to examine the dynamics of
LST and
SUHIs; and (4) to identify and analyze urban hot spots (
UHSs).
Several studies have focused on the spatiotemporal dynamics of LULC [
85,
86,
87,
88,
89] and their impact on surface urban heat islands [
5,
23,
90,
91,
92,
93,
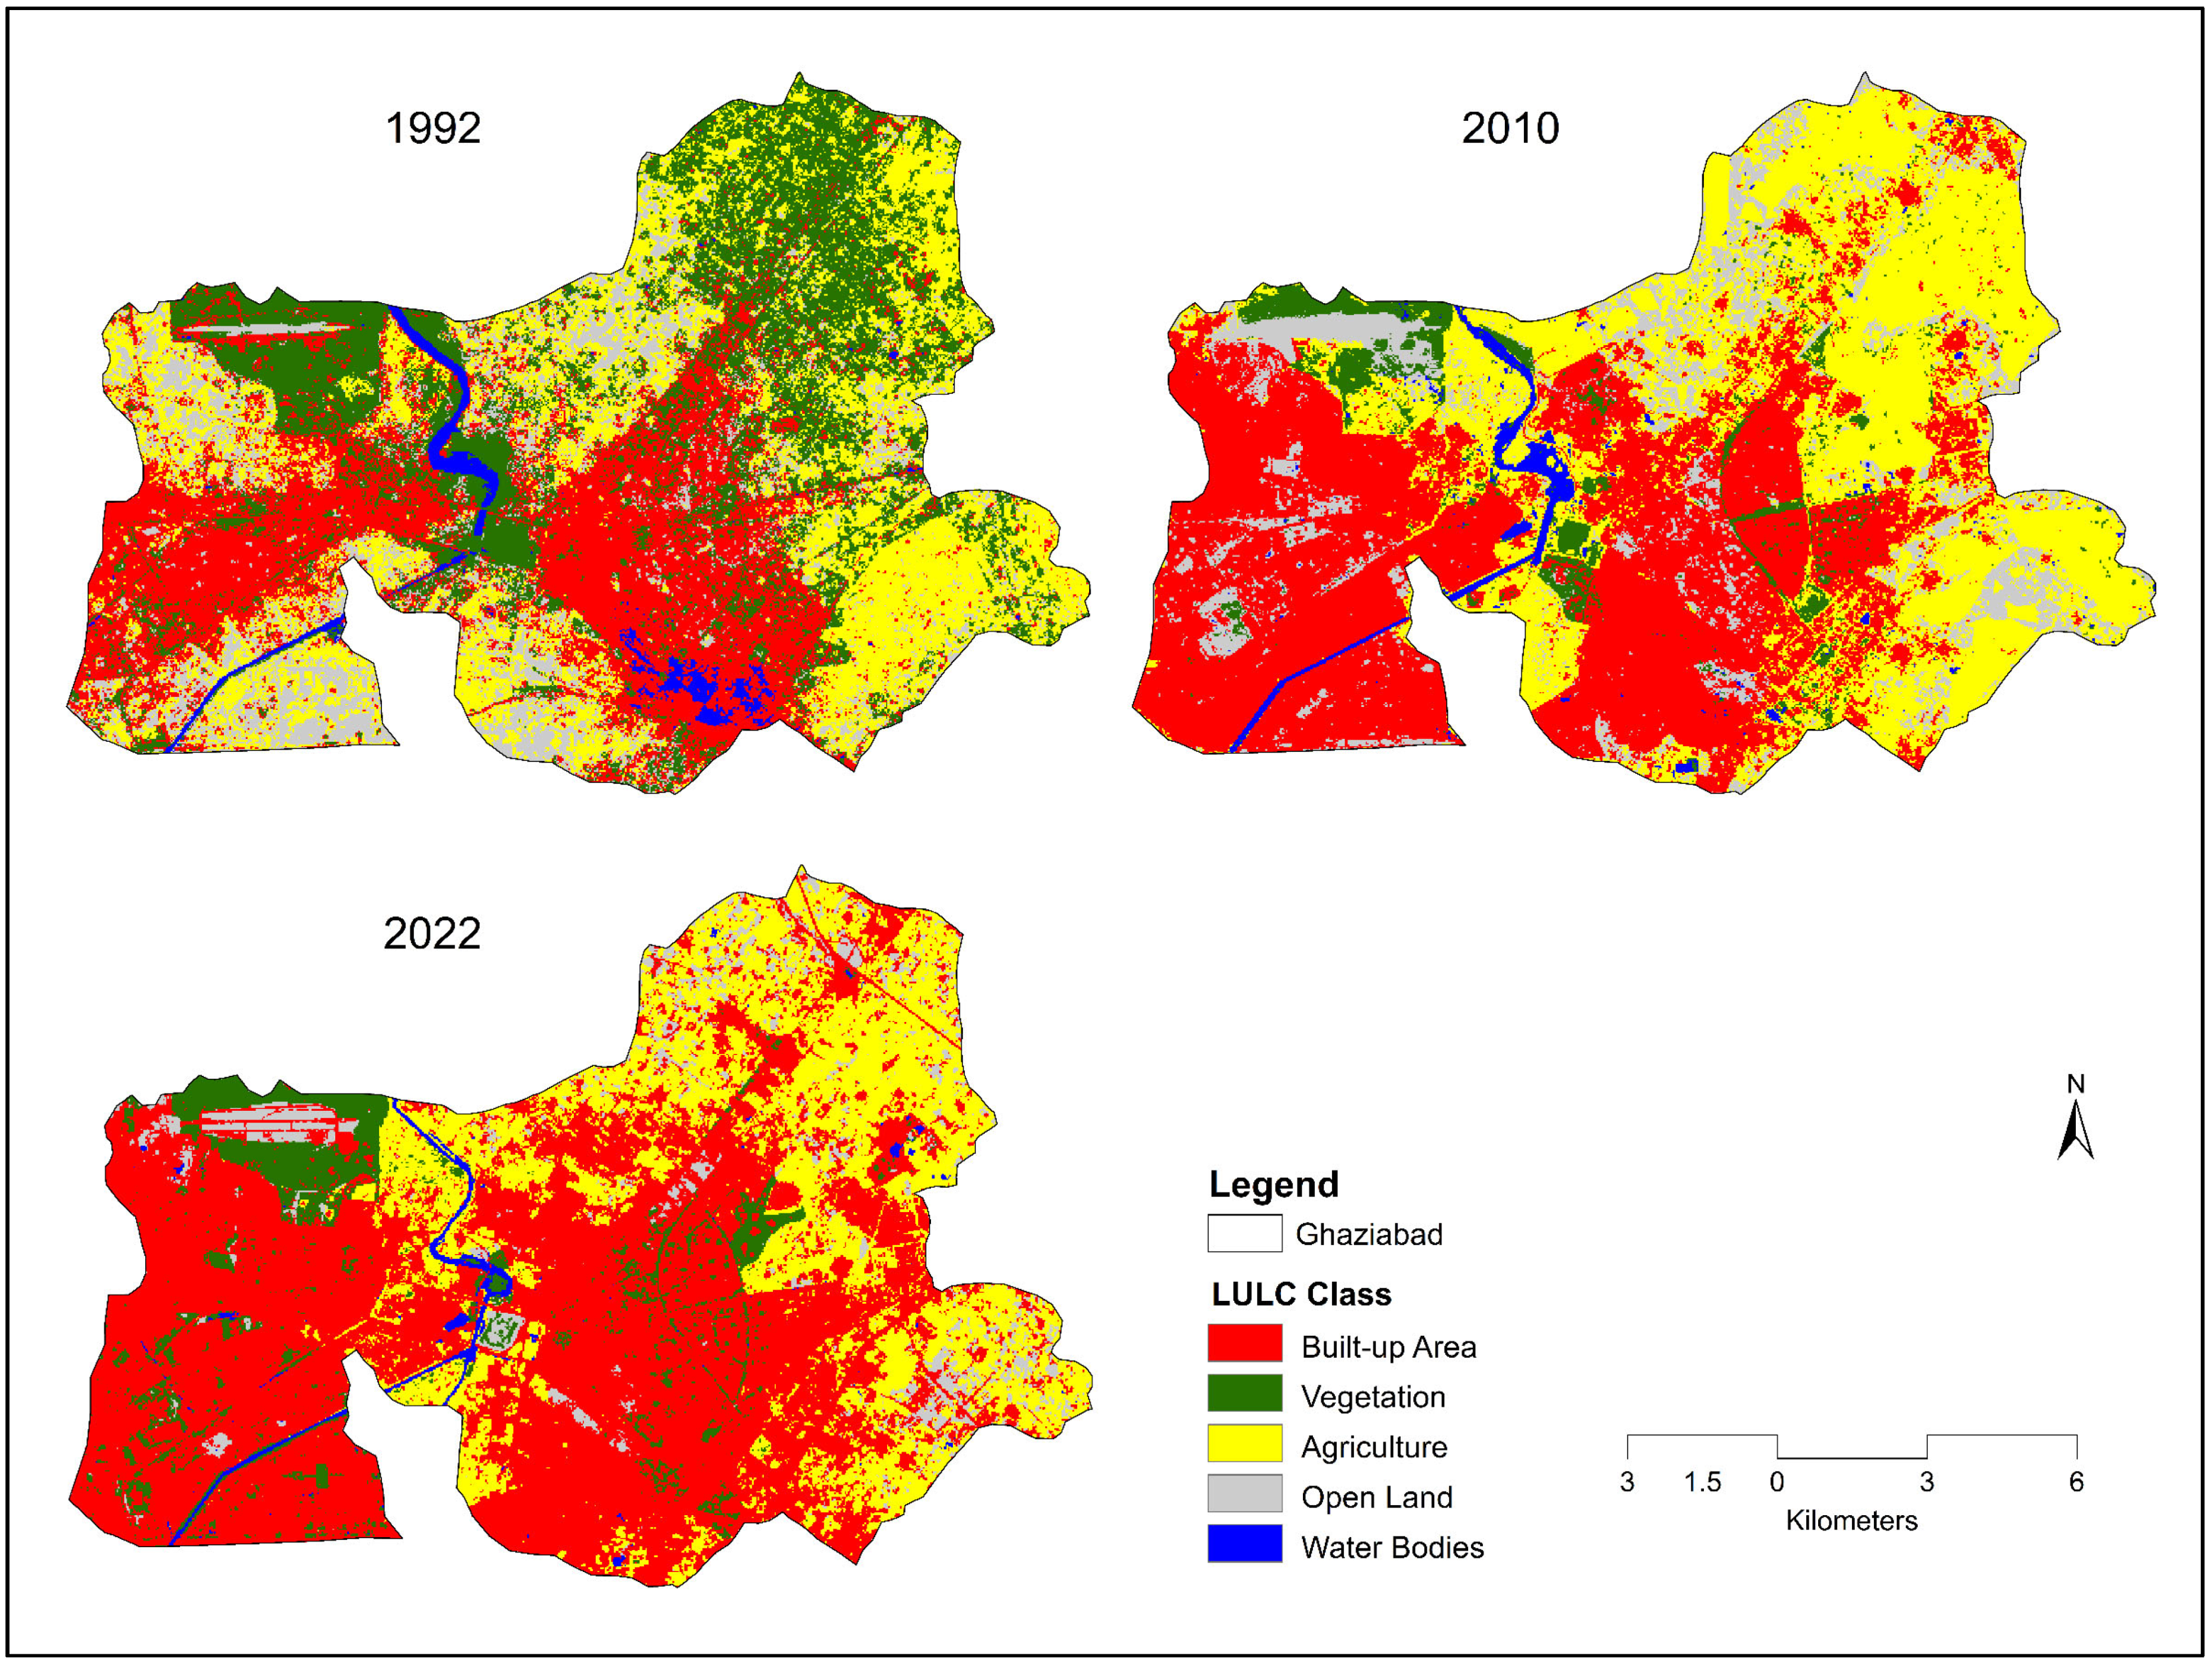
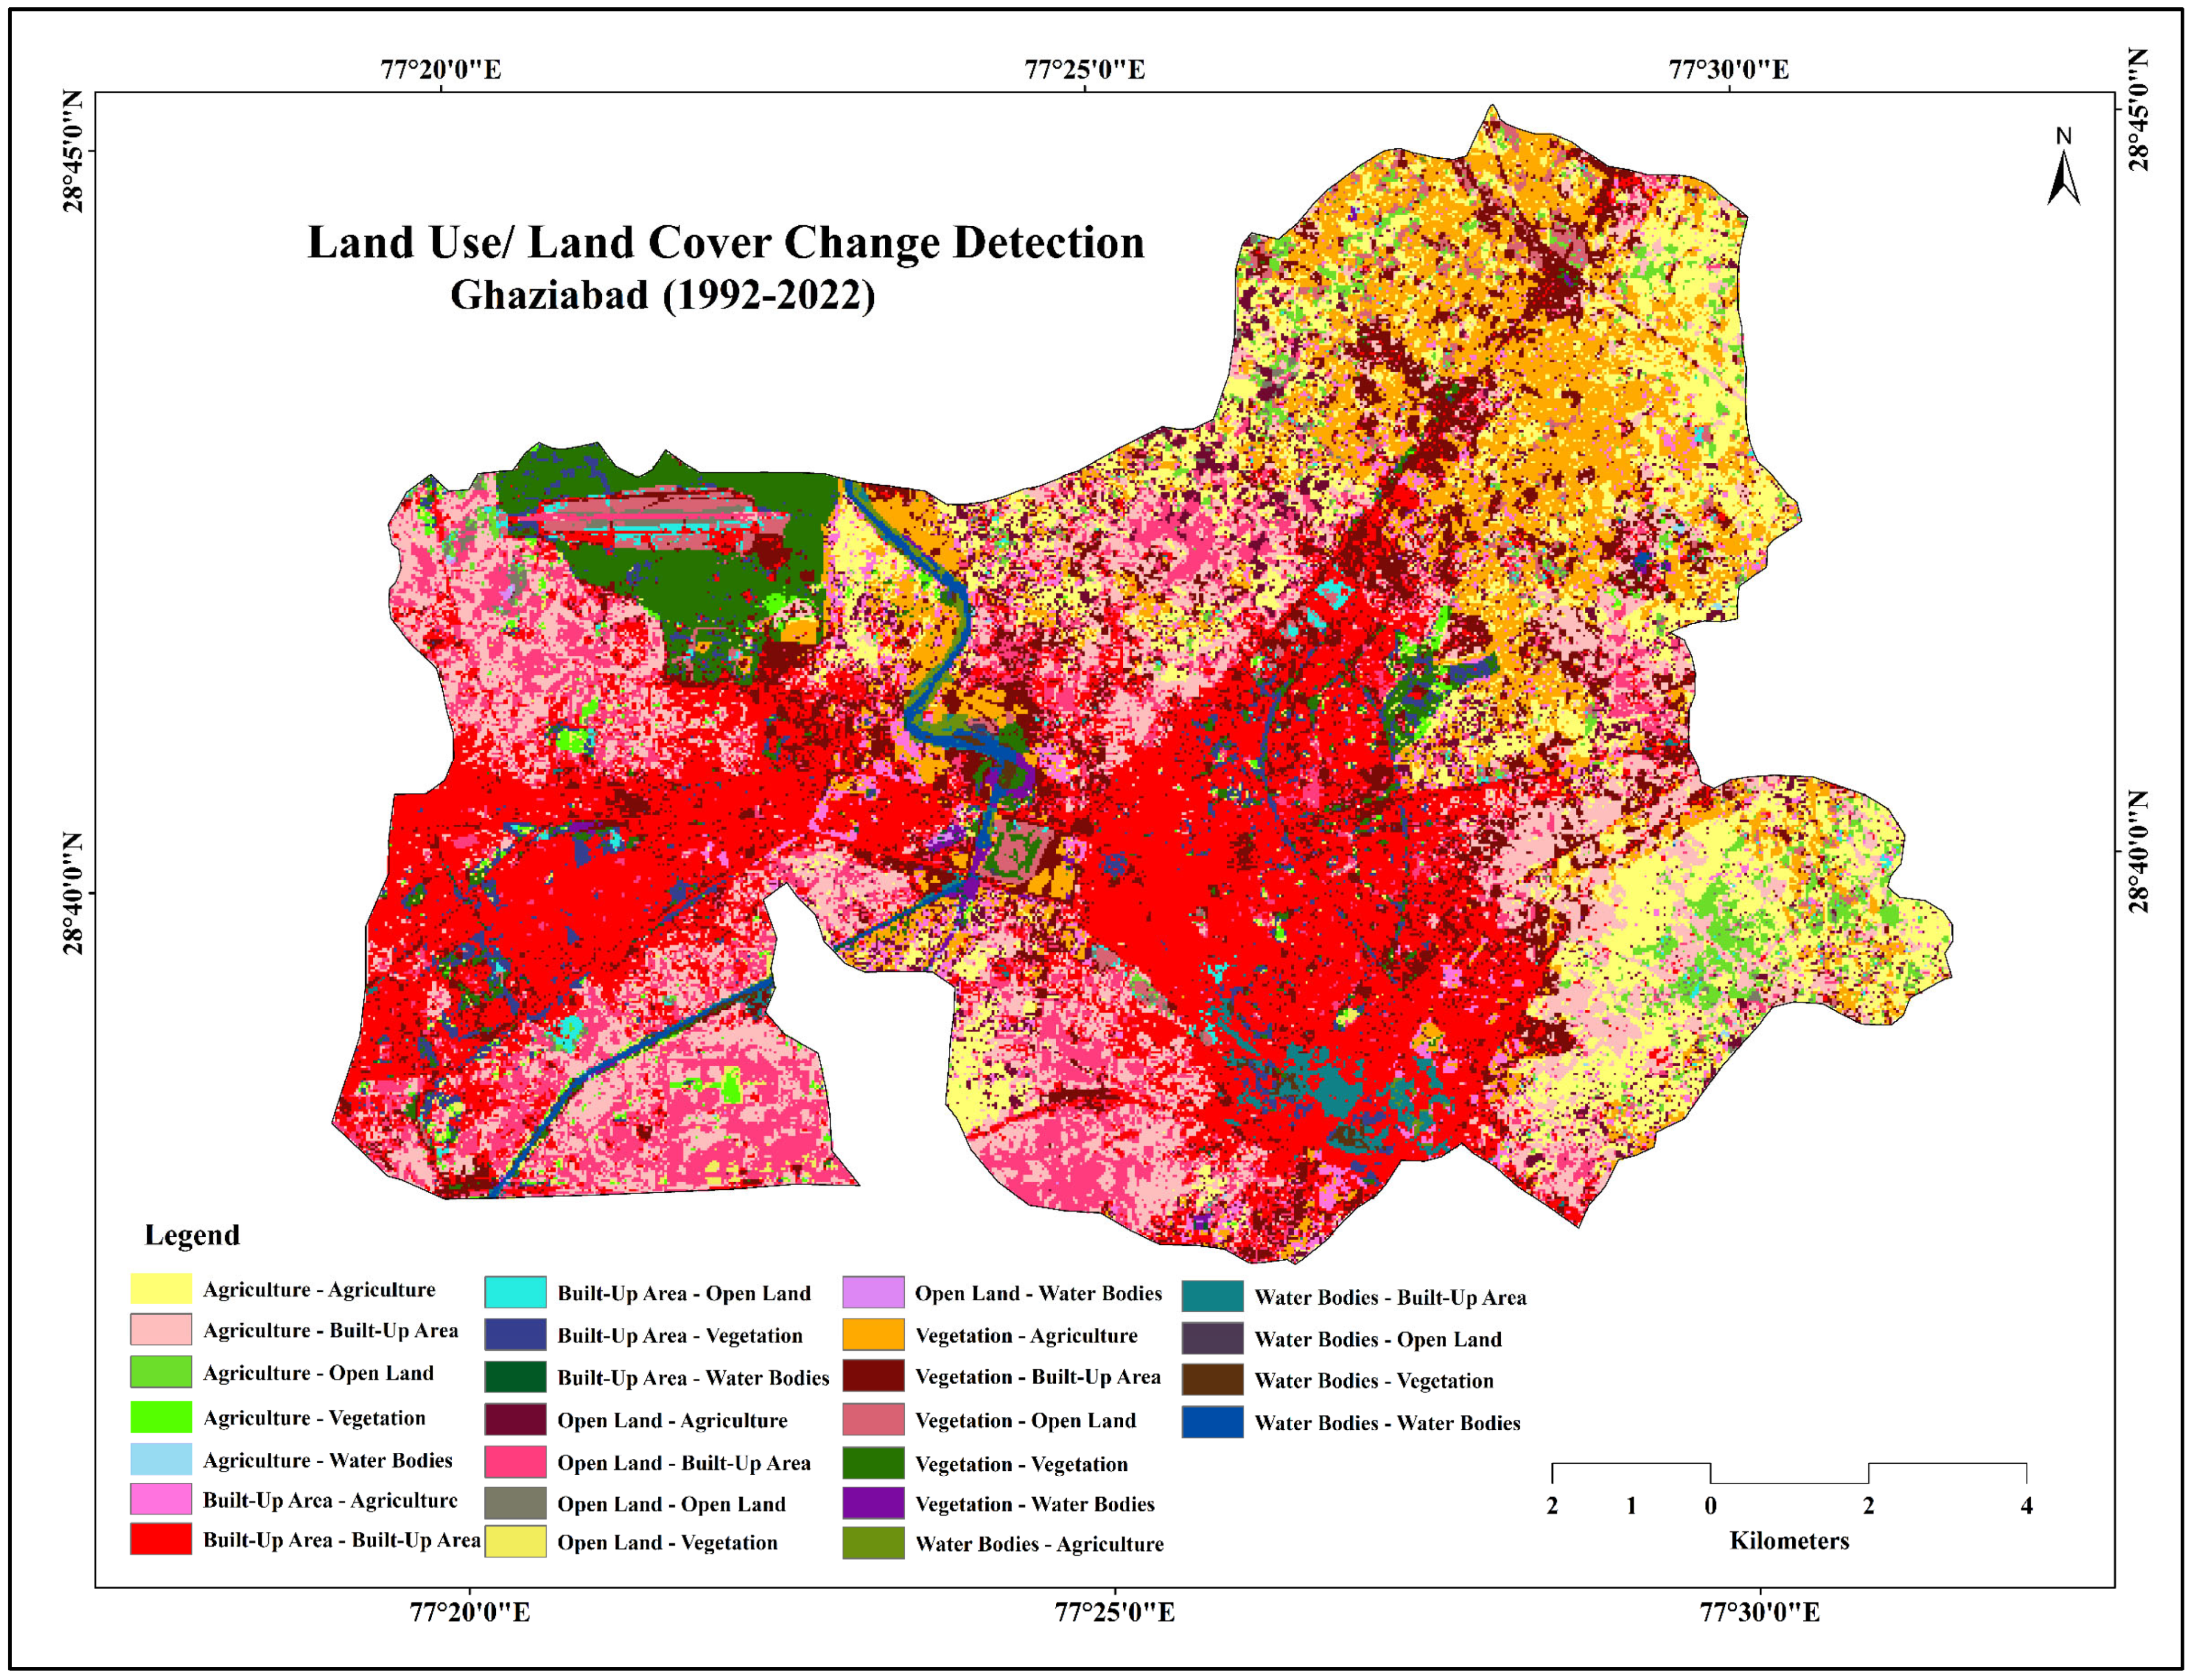
94]. Analysis of LULC changes revealed a significant transformation in land surface composition throughout the study period. This transformation was primarily driven by urban expansion, which reduced vegetation cover, open land, and water bodies [
95]. Similar results were observed in a study on Sivas city and also some cities in India, such as Delhi, Noida, Meerut, Mumbai, etc., where vegetated areas declined between 1992 and 2010, followed by an increase from 2010 to 2022 [
89,
96,
97,
98].
NDVI values in 1992 showed substantial spatial variability, whereas in 2022, overall
NDVI values were considerably lower. However, the notable
NDVI increase observed in specific areas during 2022 may be attributed to plantation initiatives in the Delhi NCR region.
NDBI values exhibited notable spatial variation across the study area in 2010, whereas changes were minimal in 1992, reflecting limited urban development in the earlier period. Therefore, to reduce the detrimental impacts of climate change, including UHIs, legislators and urban planners must prioritize integrating green spaces into city planning [
99].
The maximum, minimum, and mean values of
LST in Ghaziabad showed a significant fluctuation for all three datasets used in this study. Temporally, all land use classes have shown a noticeable variation. Built-up area was the category that experienced the highest temperature during both datasets, followed by open land, agriculture, vegetation, and water bodies, except for the data of 3 April 2010. Open land observed higher
LST than built-up area in 2010 due to exposure of more open hard surfaces, concrete materials, and brick kilns. Similar patterns of vegetative decline and its thermal consequences in cities/urban areas around the world [
78]. Studies suggest that reduced (diurnal/daily) temperature variation and rising surface temperatures, characteristic of UHIs, are key indicators of urbanization’s contribution to climate change [
6].
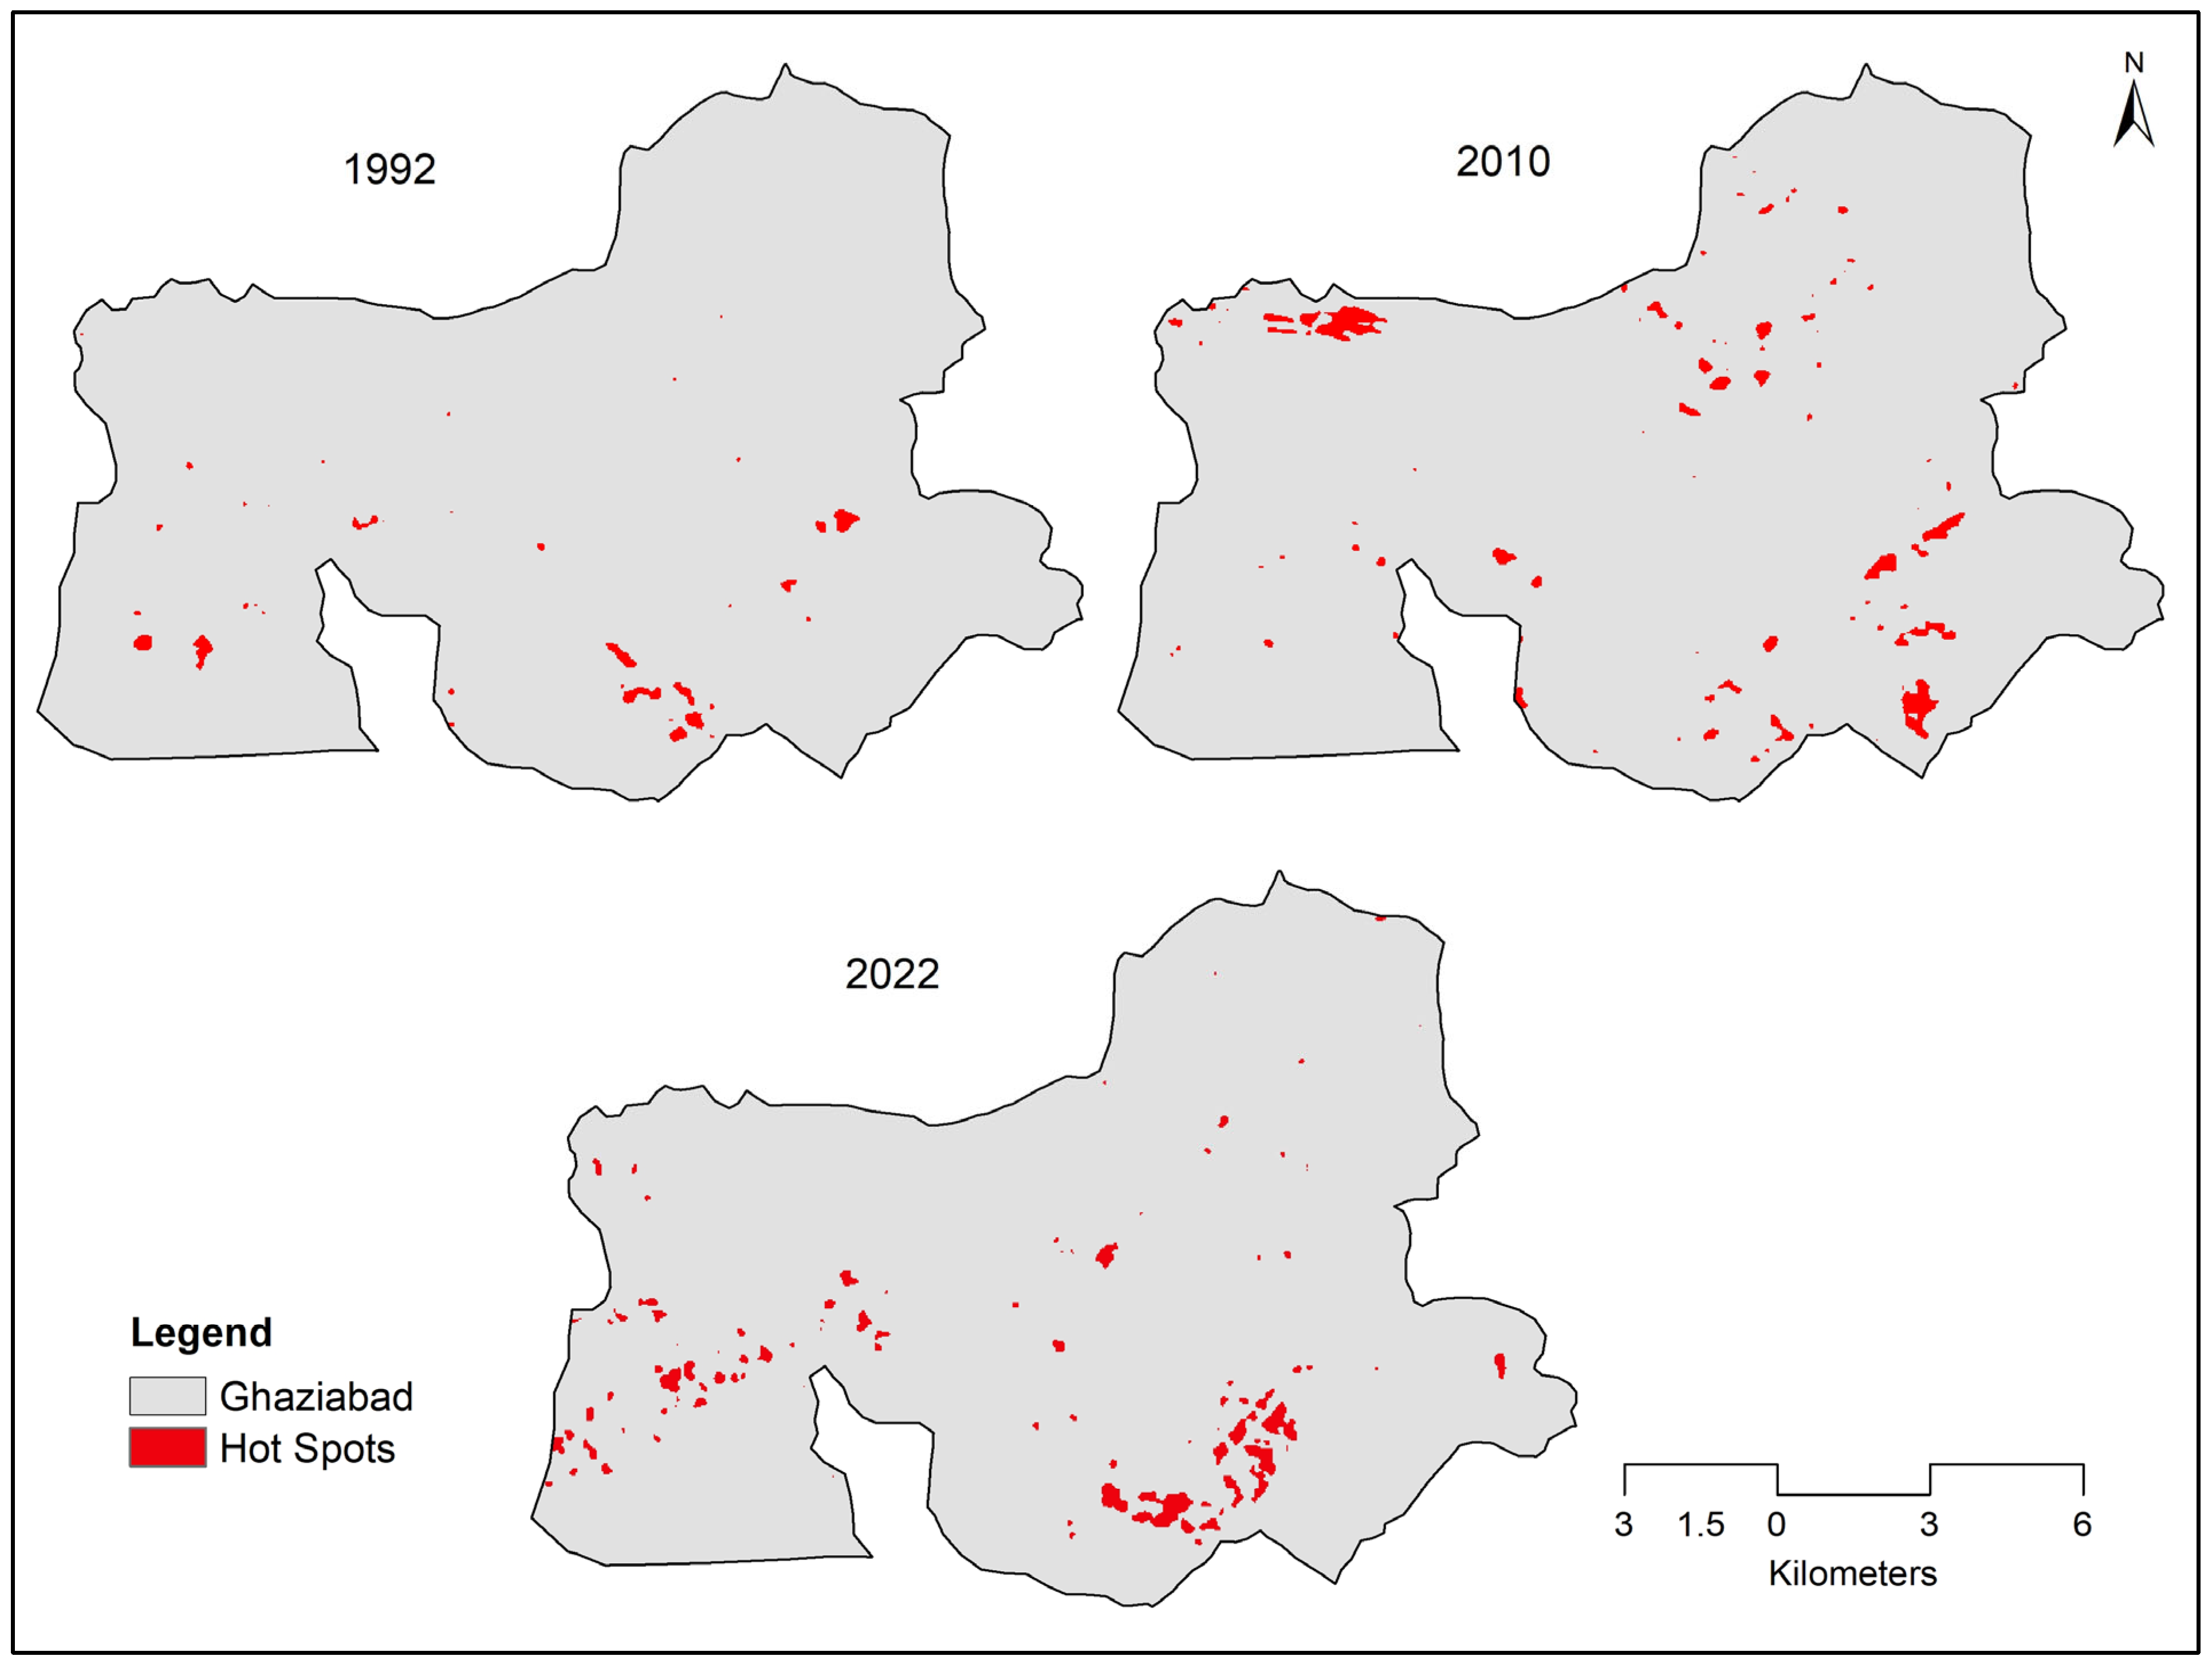
In Ghaziabad, a significant shift in the SUHI pattern was observed between 1992 and 2010. These changes were primarily linked to barren surfaces and expanding settlements, particularly in the central, southern, and southwestern regions, where built-up land cover was extensive. Like SUHI patterns, urban hot spots (
UHSs) also exhibited temporal and spatial shifts across Ghaziabad. These areas recorded the highest surface temperatures, largely due to heat-retaining materials such as concrete and asphalt [
44]. The development of
UHSs in Ghaziabad was primarily associated with impervious concrete surfaces and densely settled urban regions. Urban hot spots (
UHSs) expanded from small, scattered patches in 1992 to a more widespread distribution across Ghaziabad by 2010. However, their highest concentration remained localized in specific built-up zones. However, in 2022, it is clear that inhabited regions have a notably higher proportion of
UHSs.
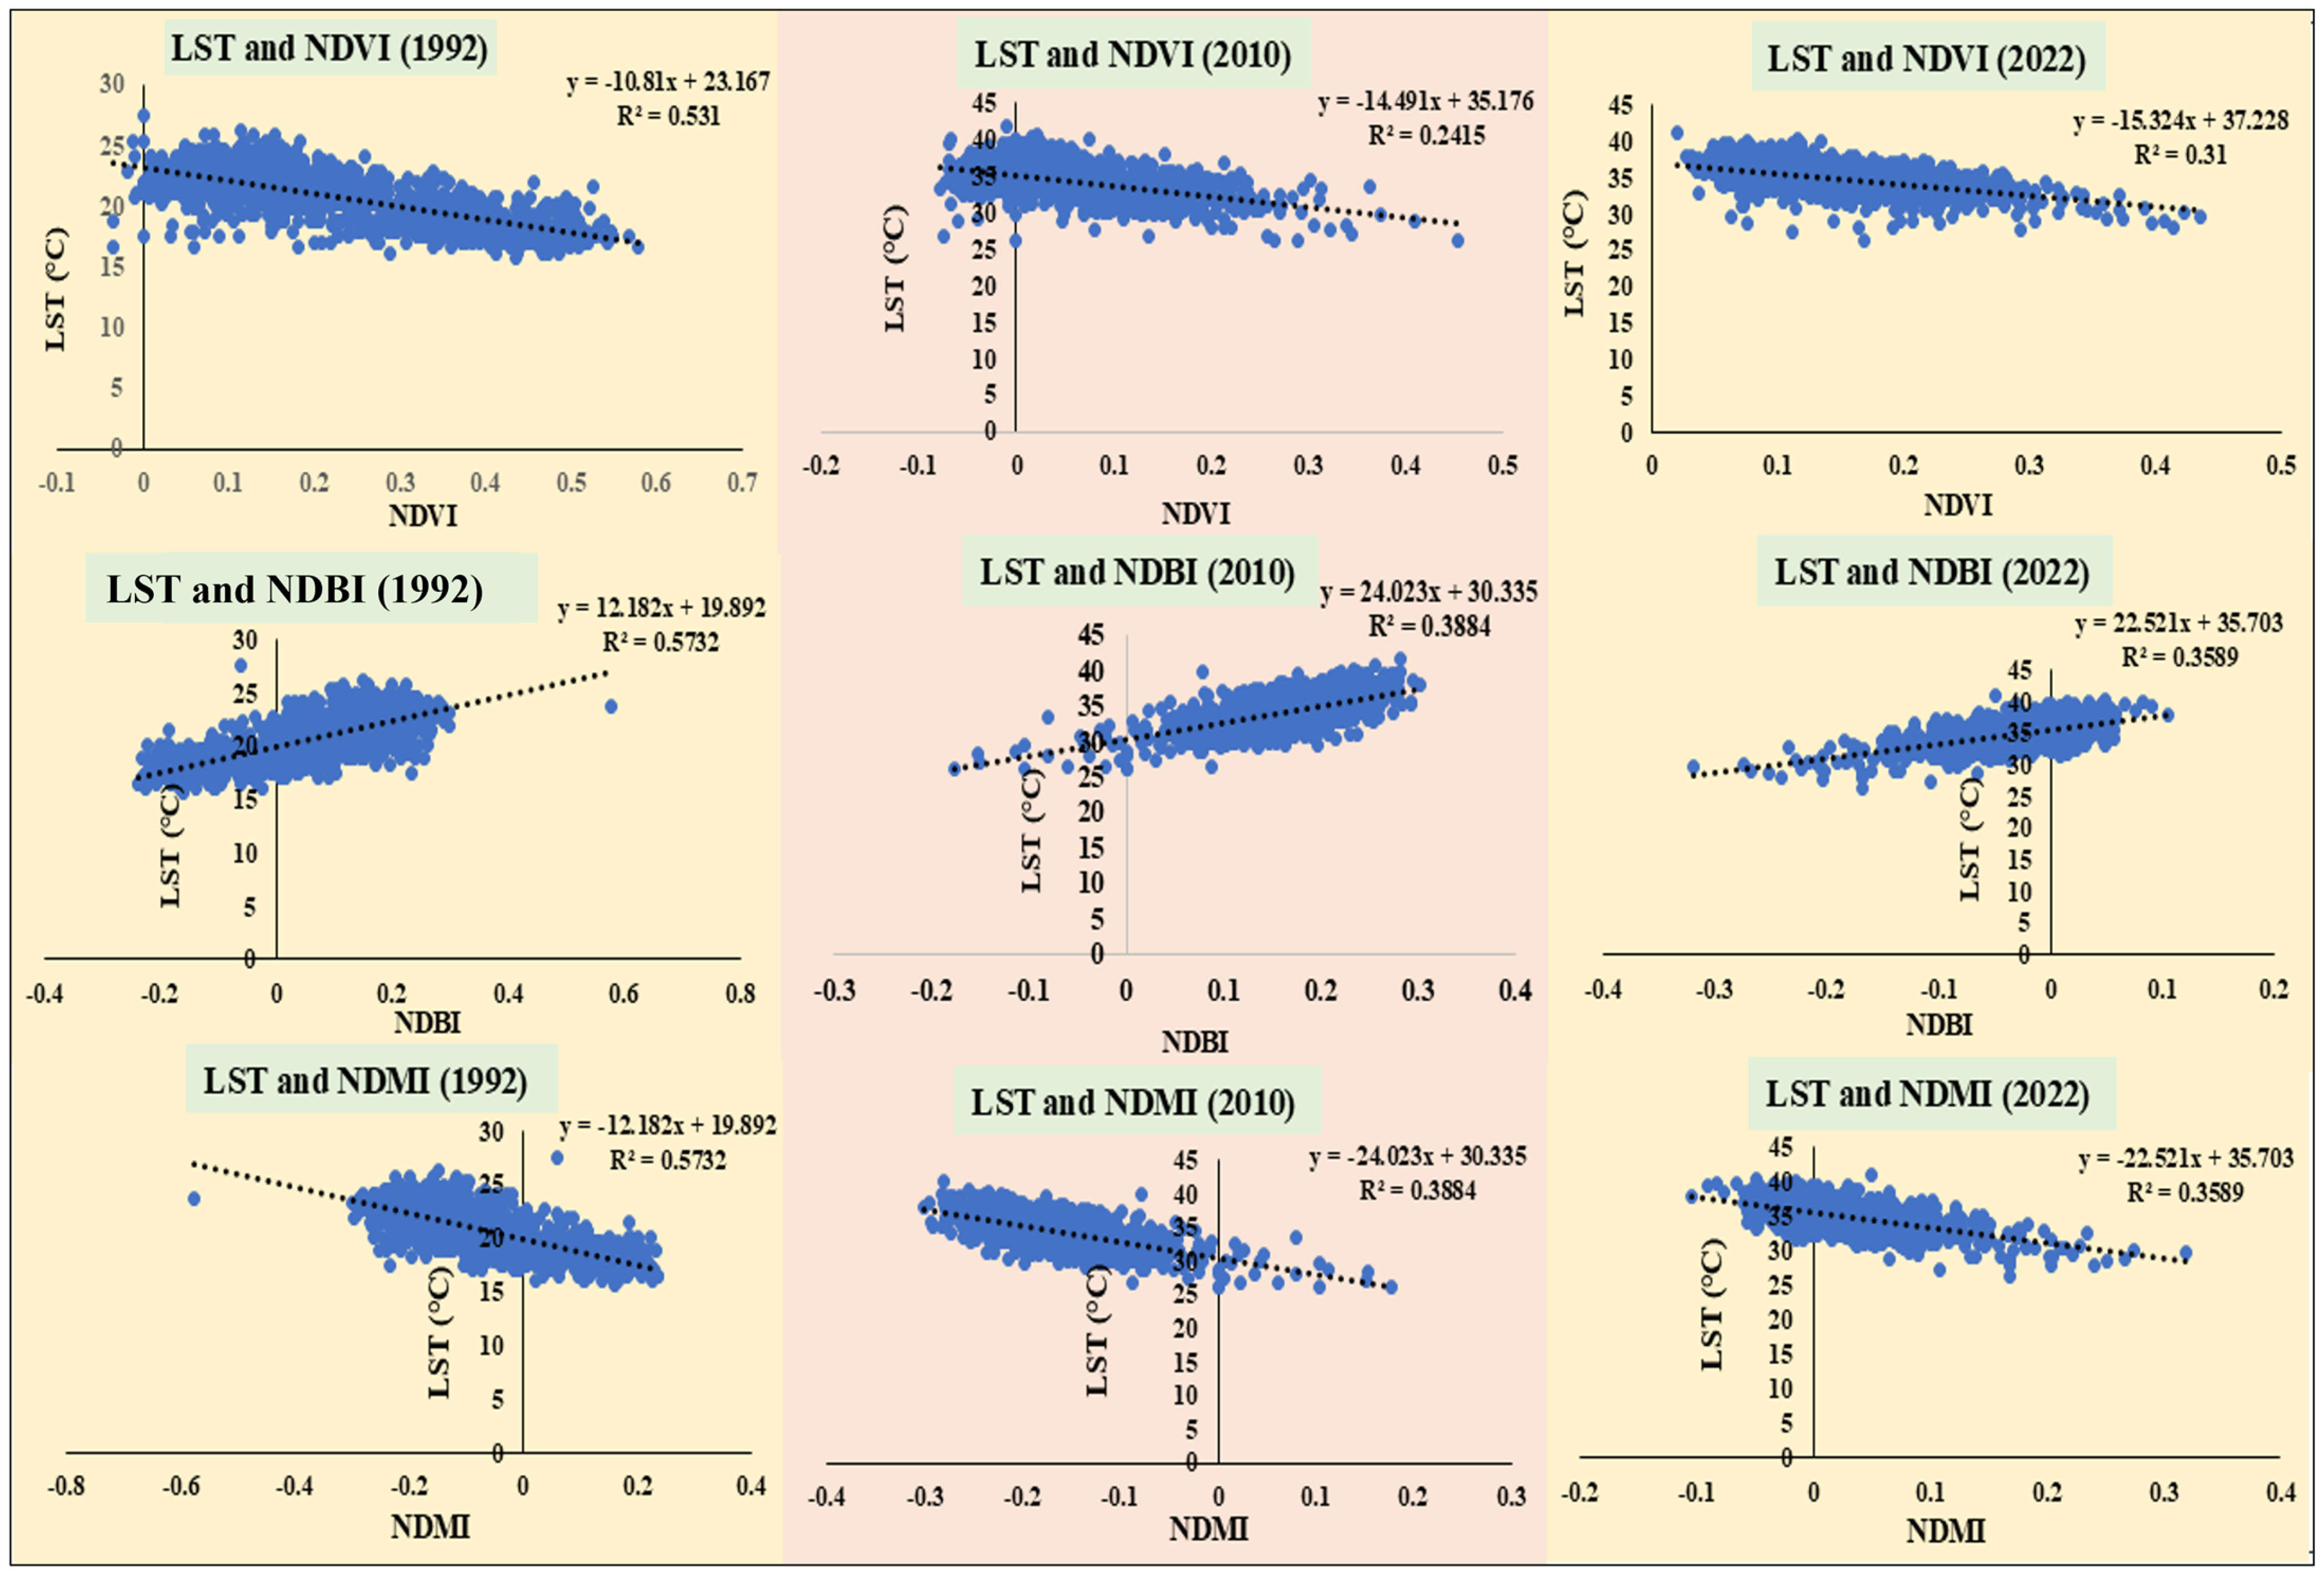
This study also assessed how changes in LULC influenced
LST patterns across the study area. Three geographical indices—the
NDBI,
NDVI, and
NDMI—were used to evaluate their correlations with
LST. Correlation analysis revealed a significant positive association between
LST and
NDBI, indicating that urban expansion contributes directly to increased surface temperatures. The continued expansion of urban features such as concrete and asphalt surfaces results in greater absorption of solar radiation, thereby elevating
LST. In contrast, both
NDVI and
NDMI exhibited negative correlations with
LST, as higher vegetation and moisture levels help to moderate surface temperatures [
66,
92].
The intensity of the UHI phenomenon has significantly increased in Indian cities, while urban thermal comfort has declined due to expanding impervious surfaces and the loss of vegetative cover [
29,
78]. Therefore, to reduce UHI impacts and enhance urban thermal comfort, it is crucial to integrate green infrastructure over barren surfaces and throughout residential and industrial areas. Urban planners and municipal authorities can utilize the findings of this study to inform the spatial planning and distribution of green spaces in Ghaziabad.
6. Conclusions
The current study used different Landsat datasets to evaluate the impact of urbanization on the LULC change of Ghaziabad, as well as the extent to which the observed changes in LULC can be connected to the spatiotemporal pattern of the LST and SUHIs in Ghaziabad during 1992–2022. Accuracy assessments of the findings demonstrated that over the study period, there was a decline in open land, water bodies, vegetation, and agriculture, and a dramatic increase in built-up areas. The primary catalyst for this expansion of built-up areas is the gradual transition from rural to urban residential communities. The city’s central, southern, and southwestern regions have seen the most growth. The findings also demonstrate the significant influence of all land use indices, including NDVI, NDBI, and NDMI on SUHIs. These also have an apparent association with Ghaziabad’s LST, with built-up area having a more significant influence from 1992 to 2022 than the others. The results obtained also reveal a different pattern of LST in Ghaziabad. Between 1992 and 2022, there was a consistent change in the SUHI and UHSs. The categories designated as “worse” and “worst” thermal ecological zones in the UTFVI showed a notable increase during the study period, signifying a deterioration in the thermal ecological conditions within Ghaziabad from 1992 to 2022. This study indicates that swift urban expansion contributes to the decline of the urban thermal environment in Ghaziabad. Though some regions of Ghaziabad have seen an increase in vegetation in recent years, the central, southern, and southwestern regions of Ghaziabad have experienced a rapid shift due to an unprecedented pace of urbanization.
Considering the study’s findings, Ghaziabad has a problem with UHIs and other related issues. As per the findings, locations with high LST and UHIs, such as industrial and densely populated areas, can be targeted for mitigation initiatives, including green roofs and lighter-colored surfaces. Determining UHIs is also essential for implementing appropriate mitigation measures, and the government should act immediately to address the urban heat island region by taking the steps needed. To achieve more accurate outcomes, future researchers are advised to consider other factors and locational impacts in their studies on LST and UHIs. This study has several limitations, such as using only three time series data; however, more time series data would be ideal for the analysis. If longer-period series data were used in the study, this would produce a better image of the UHI and UHS.
