Article

The Synergistic Effects of Climate Change and Human Activities on Wetland Expansion in Xinjiang

1
College of Geographic Science and Tourism, Xinjiang Normal University, Urumqi 830054, China
2
State Key Laboratory of Ecological Safety and Sustainable Development in Arid Lands, Xinjiang Institute of Ecology and Geography, Chinese Academy of Sciences, Urumqi 830011, China
*
Authors to whom correspondence should be addressed.
Land 2025, 14(9), 1889; https://doi.org/10.3390/land14091889
Submission received: 12 August 2025 / Revised: 9 September 2025 / Accepted: 12 September 2025 / Published: 15 September 2025

Abstract

Wetlands function as crucial transitional zones between land and water ecosystems worldwide, contributing significantly to the stability of local ecosystems. However, there is limited research on landscape changes in Xinjiang’s arid interior regions and the factors driving these changes. This study uses data reanalysis techniques to examine the spatial and temporal evolution and landscape patterns of wetlands, as well as their driving forces, in Xinjiang between 1990 and 2023. The results show that over the past three decades, the wetland area in Xinjiang has grown from 18,427 km2 in 1990 to 21,532 km2 in 2023, with an annual increase of about 94 km2. The greatest growth in wetlands, particularly lakes, marshes, and rivers, has occurred around the periphery of the Tarim Basin and the Ili River Basin, while mountainous areas have seen slight reductions. The distribution pattern shows higher wetland coverage in southern Xinjiang and less coverage in the north, with the largest proportion of wetlands found in the south. Additionally, wetland expansion has led to improvements in the number, density, aggregation, and connectivity of wetland patches, while the complexity of their shapes has decreased. The overall habitat quality of wetlands has also improved over time. Attribution analysis highlights that the rise in runoff due to temperature increases over the past 30 years is a major driver of wetland expansion, with warming accounting for the largest share of expansion in lakes (36%) and in rivers (47.9%). Furthermore, the implementation of large-scale engineering measures, such as ecological water diversion, water-saving irrigation, and reservoir management, has contributed significantly to wetland expansion and ecological restoration. These results provide useful insights for the long-term conservation and management of wetland resources in the arid areas of Xinjiang.

1. Introduction

Wetlands are an essential part of the Earth’s ecosystem and perform a vital ecological regulatory function at the interface between land and water ecosystems [1]. They not only have outstanding ecological and environmental service value, but are also an important natural resource for maintaining human sustainable development. However, their vulnerability also makes them the most threatened ecosystem type globally [2]. As climate change-related events become more frequent and human activities intensify, wetland degradation is becoming increasingly severe, with significant changes occurring in the structure and functions of wetland ecosystems [3]. These ecosystems possess important ecological conservation value and are crucial to regional ecological and environmental security. The spatiotemporal evolution of their landscape patterns and changes in their ecological functions are central issues in current landscape ecology and global wetland change research [4].
Many scholars have utilized multi-source remote sensing data and technology for monitoring land use products to reveal the evolutionary characteristics of wetland landscapes in different regions and their driving mechanisms [5,6]. Existing research has found that wetland landscape fragmentation not only leads to a reduction in suitable habitat area, but also further reduces habitat quality through edge effects and uneven patch distribution mechanisms, while also affecting ecosystem stability, resilience, and service functions [7,8,9]. In addition, changes in wetlands are significantly influenced by ecohydrological processes. Climate change and hydrological changes can lead to significant fluctuations in wetland hydrological processes, resulting in a series of issues such as water supply and vegetation growth [10]. Meanwhile, the acceleration of urbanization has also had a profound impact on wetland ecosystems [11]. Combining the analysis of human activities, wetland protection policies introduced by the international community and the Chinese government, and the implementation of wetland protection, restoration, and artificial ecological water transfer in the urbanization process of Xinjiang further reflects the challenges faced by wetland conservation and the need to protect these areas [12]. Moreover, empirical analyses of wetland restoration projects across Europe reveal that the annual value of ecosystem services generated by wetland restoration significantly exceeds the average input costs, demonstrating robust ecological and economic benefits [13]. Related field observation studies also indicate that climatic factors, as key processes in wetland hydrological balance, play a vital role in maintaining ecological stability, particularly in natural peat wetlands [14]. In addition, research on changes in wetland landscape patterns highlights that human activities and climate change jointly drive the spatiotemporal evolution of wetlands through multiple scales and pathways, providing theoretical support for differentiated management strategies [15,16].
Xinjiang is located in an inland arid region and consists of three major ecosystems: mountains, oases, and deserts. Its “three mountains flanking two basins” topography has given rise to diverse wetland types and unique distribution patterns [17]. Research on wetlands in this typical arid region is therefore particularly important. However, due to limitations in actual wetland monitoring conditions and inconsistent wetland classification standards, existing studies are unable to fully elucidate the spatiotemporal evolution of wetland landscapes in Xinjiang. Therefore, determining how to use high-resolution remote sensing data to accurately classify wetlands and analyze the driving mechanisms behind changes in wetland area dynamics is an important scientific issue in current wetland research in the arid regions of Xinjiang. In addition, since the implementation of the Wetland Protection Law, although some progress has been made, the effectiveness of wetland protection and the challenges it faces remain issues warranting in-depth discussion. Therefore, based on CN_LUCC remote sensing data and the integration of landscape pattern analysis with habitat quality assessment, this study systematically examines the spatiotemporal evolution of wetlands in arid Xinjiang from 1990 to 2023. Using the SHAP interpretation model, it quantitatively identifies the relative impacts of primary natural and anthropogenic drivers. This research aims to reveal (1) the spatial patterns and evolutionary characteristics of wetland changes in Xinjiang; (2) trends in wetland landscape patterns and habitat quality; and (3) the dominant mechanisms of wetland expansion driven by climate change and human activities. Our findings provide a scientific basis for understanding the spatiotemporal dynamics of arid wetland ecosystems, support the conservation of wetland biodiversity and the restoration of ecosystem stability, and offer guidance for wetland ecosystem protection, thereby advancing wetland conservation and restoration efforts.

2. Materials and Methods

2.1. Location of Study

Xinjiang, located in northwestern China, is the country’s largest provincial-level administrative region, with a total area of approximately 1.6649 million square kilometers. Situated at the heart of Central Asia’s arid inland zone, its unique geographical position borders eight countries, including Kazakhstan, Kyrgyzstan, Tajikistan, and Pakistan, endowing it with significant ecological and geo-strategic importance. Xinjiang’s topography primarily follows a “three mountain ranges flanking two basins” pattern, comprising the Altai Mountains in the north, the Tianshan Mountains in the center, and the Kunlun Mountains in the south, with the Junggar Basin and Tarim Basin situated between them. The region exhibits a typical temperate continental arid climate characterized by large diurnal temperature variations, significant spatial temperature fluctuations, low annual precipitation, and a highly uneven spatial distribution of rainfall. Mountainous areas receive higher levels of precipitation, while plains experience sparse rainfall and intense evaporation [18] (Figure 1).

2.2. Data

2.2.1. Wetland Data

This study primarily relies on the definition of wetlands outlined in the Ramsar Convention, combined with the unique geographical characteristics of the Xinjiang region, to classify wetlands into six types: rivers, lakes, marshes, paddy fields, tidal flats, and reservoir ponds [19]. This classification system is internationally applicable while aligning with regional characteristics, making it suitable for detailed studies of wetlands in arid zones. The primary data source employed is the multi-period land use/land cover (LUCC) remote sensing monitoring dataset (CN_LUCC) released by the Chinese Academy of Sciences Resource and Environment Science Data Center. This dataset spans 11 periods from 1990 to 2023, with a spatial resolution of 1 km [20]. Data construction is based on medium- to high-resolution Landsat remote sensing imagery, with a human–machine interactive visual interpretation method employed to ensure high classification consistency and temporal comparability [21]. Currently, this dataset is widely applied in land use and environmental monitoring studies across diverse ecological regions in China [22,23,24]. Multiple studies indicate that CN_LUCC data exhibits high classification accuracy and stability nationwide, with overall classification accuracy generally exceeding 85% and Kappa coefficients above 0.80. This data effectively supports regional-scale monitoring and analysis of wetland changes [25,26]. Given Xinjiang’s location in a typical arid region characterized by vast expanses and complex topography, wetland evolution exhibits significant long-term persistence and spatial heterogeneity. Therefore, employing remote sensing data products with unified technical standards enhances the spatiotemporal consistency of analytical results and the reproducibility of methodologies. Furthermore, comparisons with other remote sensing datasets, such as GlobeLand30_LUCC and CLCD_LUCC, reveal that CN_LUCC explicitly delineates the six wetland categories required for this study within its secondary classification system: paddy fields, rivers, lakes, reservoirs/ponds, floodplains, and marshes [27]. This accurately reflects the typical distribution patterns and typological structure of wetlands in the Xinjiang region. The specific wetland types and their classification criteria are given below (Table S1).

2.2.2. Driver Data

This study employs a comprehensive analysis of climate and human activities to identify the driving factors of wetland change (Table 1). Primary data sources for wetland change research encompass factors such as climate, topography, hydrology, and population density. Data sources include Terra Climate meteorological data, ASTER GDEM topography data, FLDAS hydrological data, and LandScan population density data, covering the time span from 1990 to 2023.

2.3. Research Methodology

This study primarily employs wetland area dynamics calculation methods to project spatial changes in wetlands onto an 8 km grid, illustrating the spatial patterns of wetland contraction and expansion. In addition, it utilizes land use transition matrices to analyze changes in wetland types within Xinjiang’s arid regions and applies landscape pattern indices to investigate landscape pattern shifts across different wetland types. Through the habitat quality module of the InVEST model, this study assesses habitat quality in Xinjiang’s wetlands and reveals their ecosystem health status. The habitat quality assessment provides crucial data support for wetland ecological conservation and restoration in arid Xinjiang, particularly in ecologically fragile regions like the Xinjiang arid zone, offering a scientific basis for formulating wetland protection and restoration strategies. Finally, SHAP feature analysis is employed to quantify the impacts of human activities and climatic factors on different wetland types.

2.3.1. Wetland Area Dynamics

To assess the dynamic changes in Xinjiang’s wetland areas, the changes in the areas of different types of wetlands were analyzed using CN_LUCC data [28]. The intensity of wetland changes was quantitatively analyzed with the following formula:
I = S 2 S 1 S 1 × 100 %
where S 2 represents the wetland area at the end of the study period and S 1 denotes the initial wetland area at the start of the study period. Furthermore, using ArcGIS 10.8 tools, we extracted wetland change areas in arid regions, constructed an 8 km × 8 km grid to statistically analyze wetland changes, and spatially presented the results to examine the dynamic changes in Xinjiang’s arid-region wetlands from 1990 to 2023.

2.3.2. Land Transfer Analysis

The land use transfer matrix is an effective tool for quantifying temporal and spatial land cover changes. This approach effectively captures the conversion patterns of different land categories within a research area on a temporal scale through matrix construction [24], as expressed by the following equation:
A i j = A 11     A 12     A 1 n A n 1 A n 2     A n n
where A i j refers to the area converted from land use type i to type j during a specific period, and n represents the total number of land use types.

2.3.3. Landscape Pattern Index

The landscape index serves as a quantitative tool for assessing the structural composition and spatial distribution of wetlands. To analyze the evolution of wetland patterns in Xinjiang’s arid regions, six key indicators were chosen to capture the most significant changes: patch number (NP), patch density (PD), patch cohesion (COHESION), largest patch index (LPI), landscape shape index (LSI), and aggregation index (AI) [26]. Wetland pattern indices for different wetland types in Xinjiang, calculated using Fragstats 4.2 software, cover the period from 1990 to 2023.

2.3.4. InVEST Model

This assessment module combines land use suitability with biodiversity threat factors to create a comprehensive system for evaluating habitat quality. The habitat quality index (HQ) represents the model’s output, with scores between 0 and 1. Higher scores correspond to improved habitat quality and more favorable conditions for organisms [29]. Habitat quality is divided into five categories based on score ranges: low (0–0.2), fair (0.2–0.4), moderate (0.4–0.6), high (0.6–0.8), and optimal (0.8–1). The specific calculation process is outlined below:
H Q x j = H j 1 S x j z S x j z + K z
where H Q x j and S x j are the habitat quality index and the degree of habitat degradation of the xth raster in the jth land use type; H j is the habitat suitability of the jth land use type; K is the half-saturation parameter, with a value of 0.5; and Z is the system default value. S x j is calculated as follows:
S x j = r = 1 T y = 1 Y r N r r T N R r y δ r x y ρ x P j r
In the model, T represents the total number of threat sources, y denotes the grid within the threat source r , Y r is the total number of grids within the rth threat source category, N r represents the weight associated with the rth class of threat sources, and r y represents the intensity of the threat. The parameter P j r indicates how sensitive land use type j is to a particular threat source, ρ x signifies the reachability of the habitat grid with respect to the threat, and δ r x y denotes the impact of the stressor in grid y on grid x . The model parameters were determined based on the specific conditions in Xinjiang, with reference to the model manual and related case studies [30] (Tables S2 and S3).

2.3.5. Methodology for Analyzing Drivers of Wetland Change

To assess the impacts of climate change and human activities on the evolution of different wetland types in Xinjiang, this study employs the SHAP (SHapley Additive exPlanations) method to conduct a feature importance analysis of key drivers [31]. The SHAP method originates from the Shapley value theory in game theory. Its core concept involves decomposing the prediction results of complex models into the sum of the marginal contributions from each input feature, thereby enabling the interpretation of model outputs [32]. In our analysis, we used the area changes of six wetland types between 1990 and 2023 as the response variable. Five explanatory variables—temperature (TEM), precipitation (PRE), surface runoff (SR), subsurface runoff (SSR), and population density (POP)—were selected, with their relative importance assessed via SHAP values [33]. Specifically, we calculated the mean SHAP value for each factor across different wetland types and normalized them to a percentage format to quantify the relative contribution of each driver to wetland change. This approach effectively identifies dominant factors in wetland dynamics while maintaining model generality, supporting quantitative interpretations of the mechanisms linking climate and human activities.

3. Results

3.1. Spatial and Temporal Dynamics of Wetlands in Xinjian

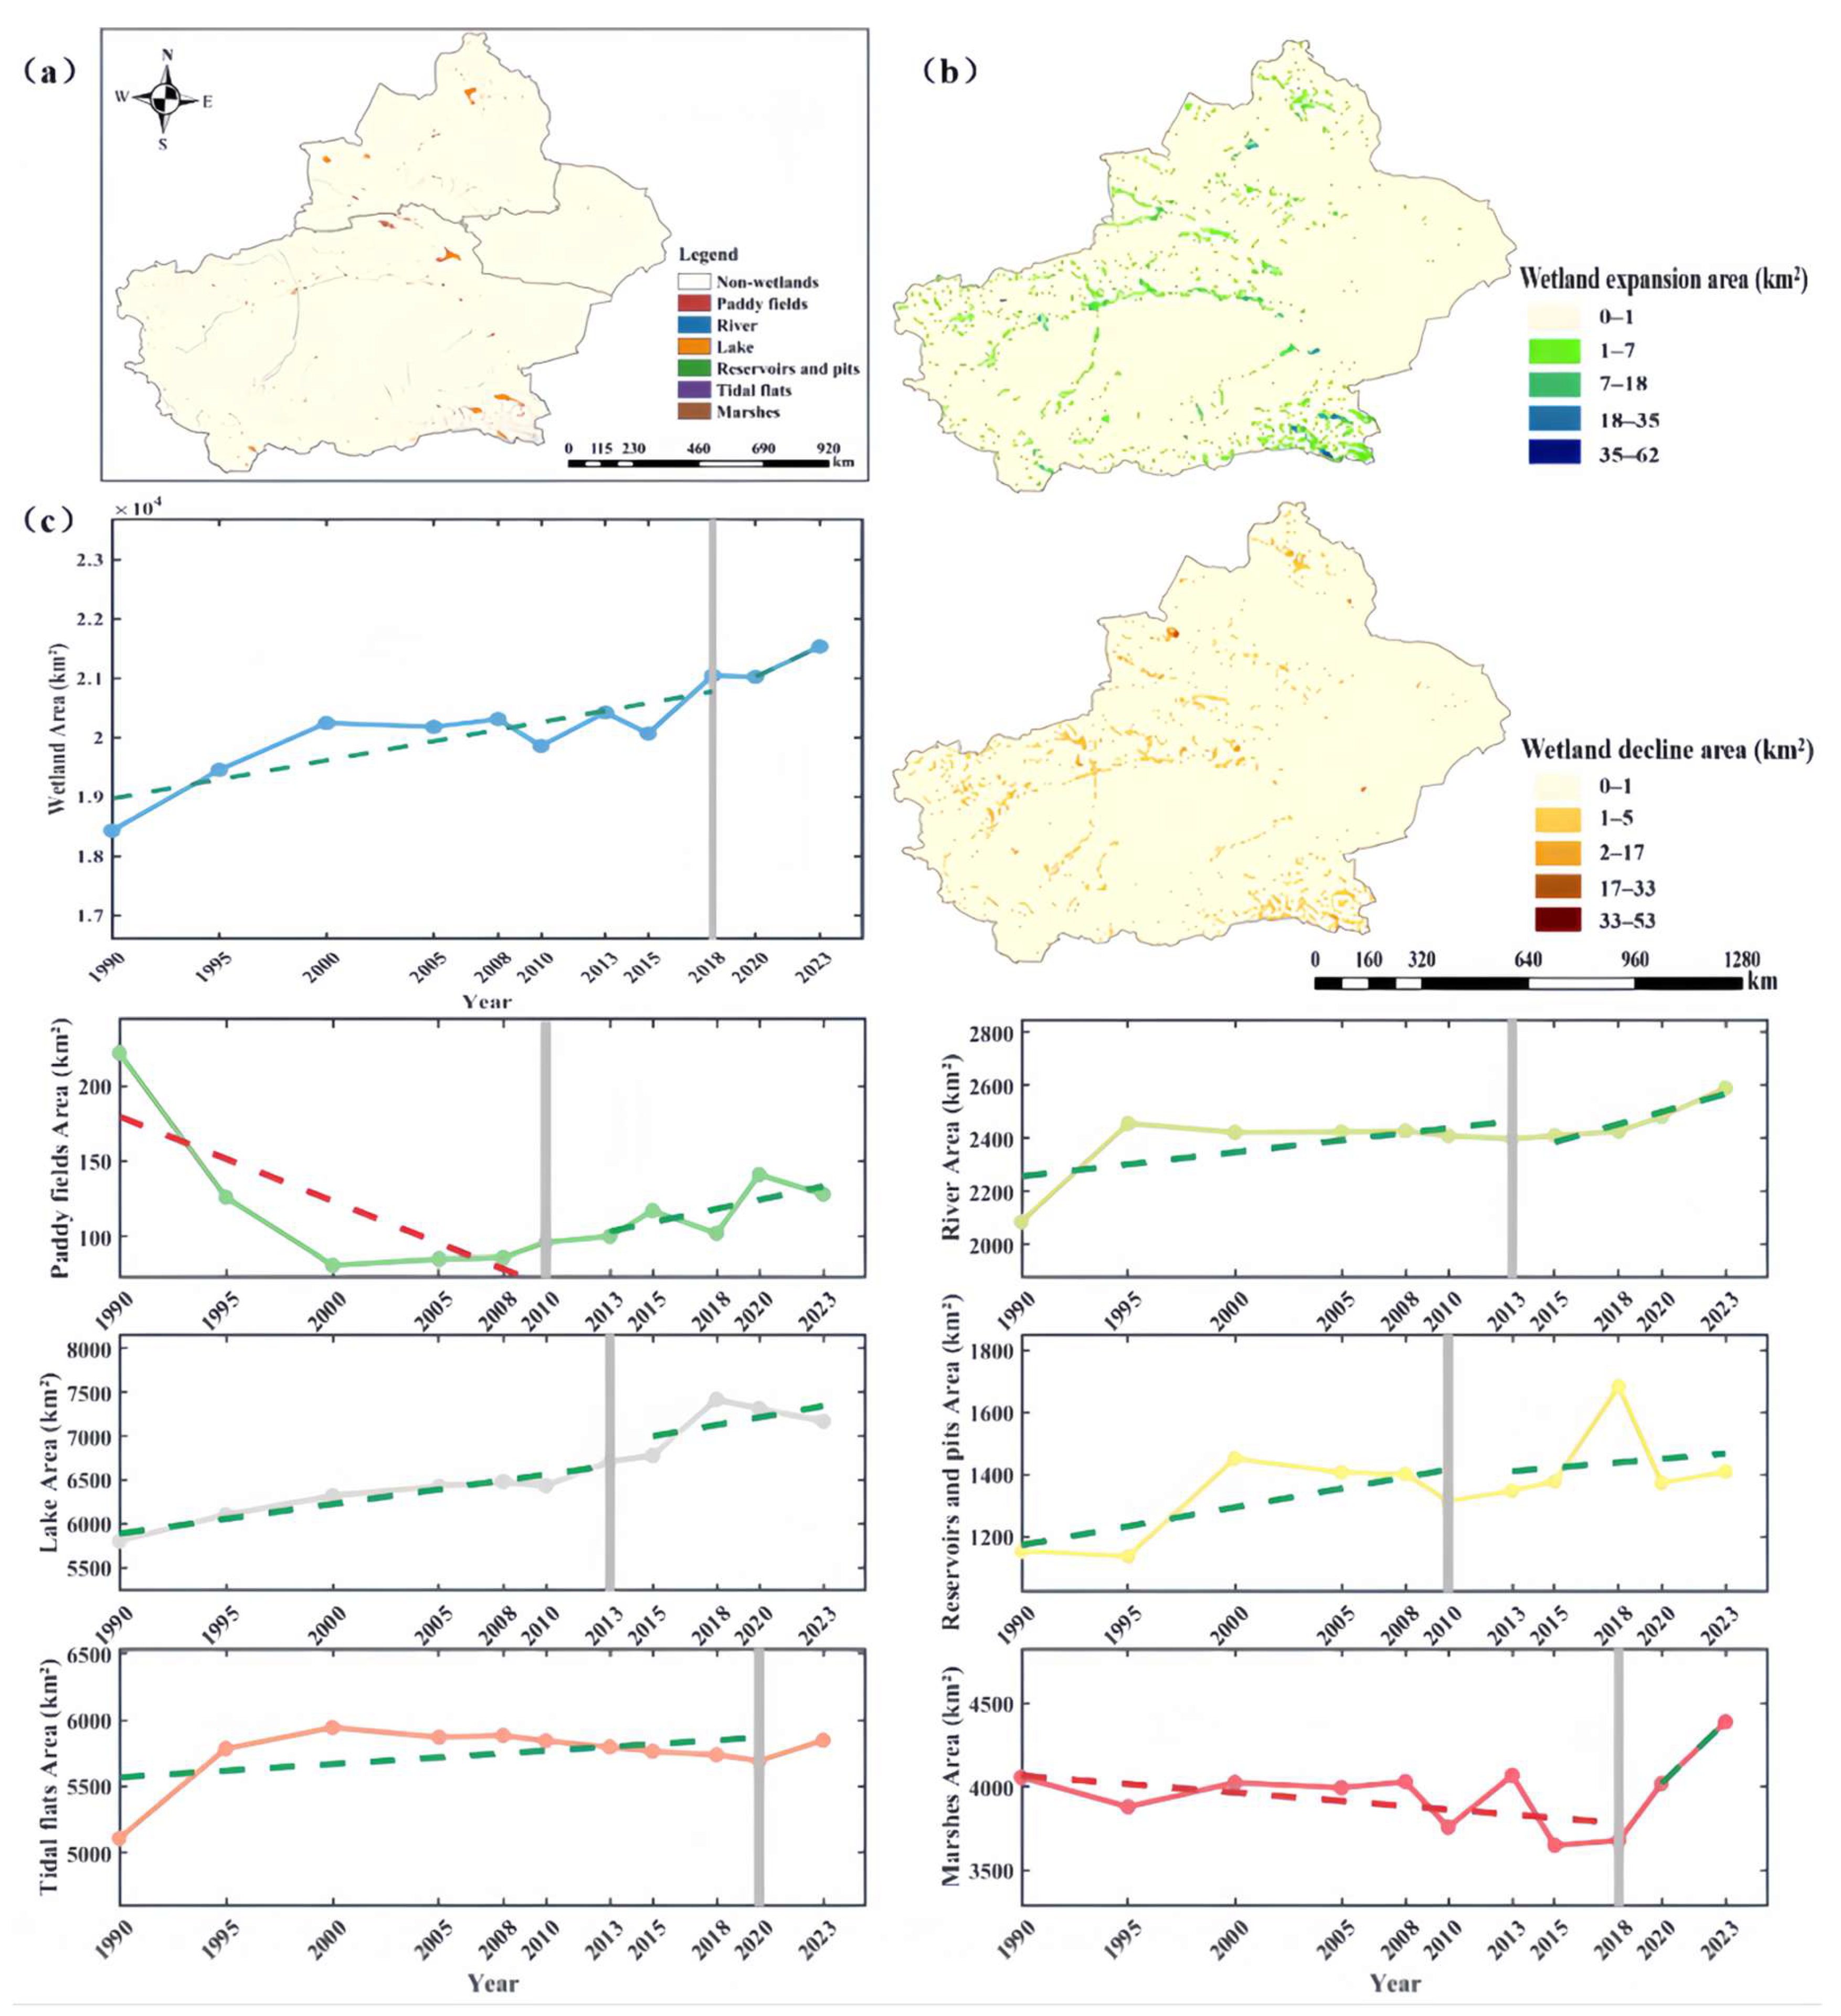
From 1990 to 2023, the wetland area in Xinjiang increased from 18,427 km2 to 21,532 km2, marking a 16.8% increase (Figure 2). Wetlands expanded most significantly around the Tarim and Junggar Basins, while wetlands in the Altai Mountains, Tianshan Mountains, and central Tarim Basin experienced some reduction. Notably, lake areas saw the largest increase, growing from 5803 km2 to 7171 km2, a 23.5% increase. River areas grew from 2084 km2 to 2589 km2, while floodplains expanded from 5107 km2 to 5846 km2, and marshes and reservoir ponds also showed growth. In contrast, paddy fields shrank from 222 km2 to 128 km2.
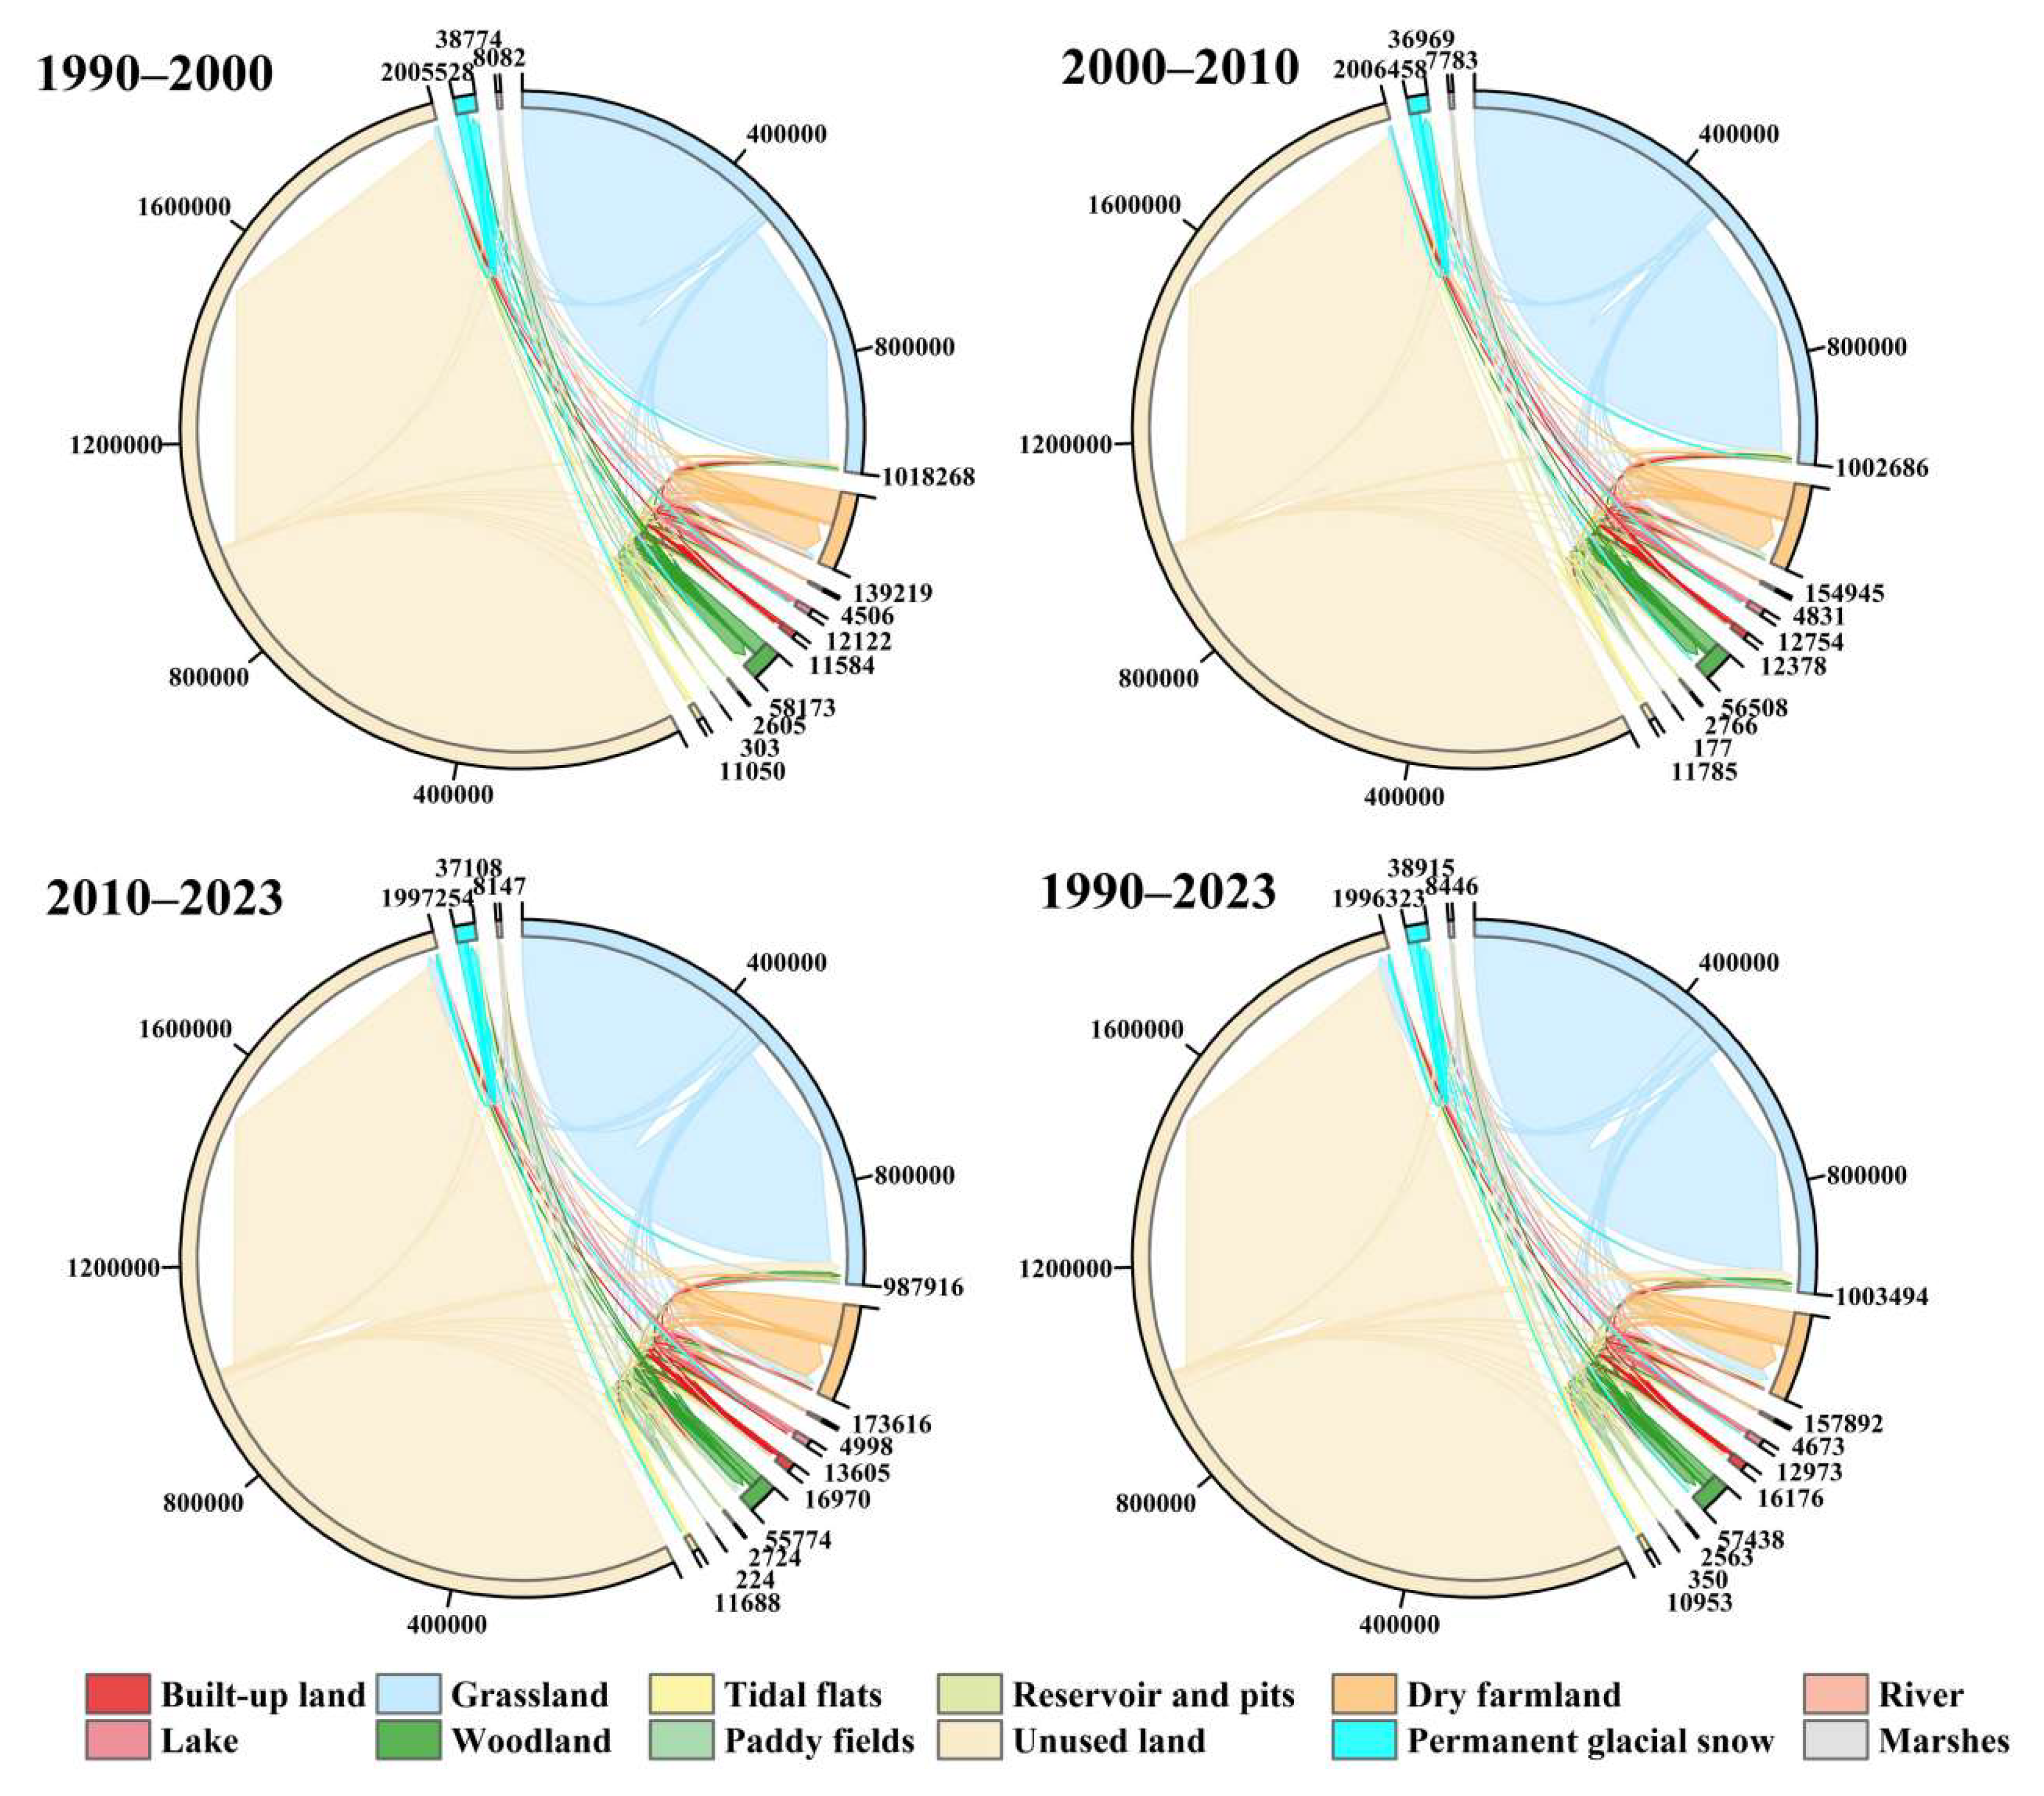
Further analysis of changes in wetland land use types revealed that over the past 30 years, all wetland types have shown a significant growth trend (Figure 3). Specifically, lake areas have increased from 5803 km2 to 7171 km2, with an average annual growth of 41.45 km2; rivers have increased from 2084 km2 to 2589 km2; and tidal flats have increased from 5107 km2 to 5846 km2. Between 1990 and 2000, the areas of rivers, lakes, reservoirs, ponds, and tidal flats increased by 159 km2, 251 km2, 206 km2, and 229 km2, respectively. This change was primarily due to the conversion of grasslands and unutilized land. On the contrary, paddy fields showed a decreasing trend, with their area shrinking from 222 km2 to 128 km2. Additionally, the area of marshland slightly decreased, with some marshland converted into unused land. Between 2000 and 2010, the areas of rivers and canals, lakes, reservoirs and ponds, and tidal flats increased by 338 km2, 516 km2, 297 km2, and 836 km2, respectively, primarily due to the conversion of grasslands and unutilized land. The area of the marshland remained stable throughout this period. Between 2010 and 2023, the areas of rivers and lakes increased by 180 km2 and 851 km2, respectively, with changes primarily resulting from the conversion of grasslands and unutilized land. The areas of reservoirs, ponds, and tidal flats slightly decreased, primarily due to their conversion into unutilized land. The area of marshland increased by 364 km2, with its growth also attributed to the conversion of grasslands and unutilized land.
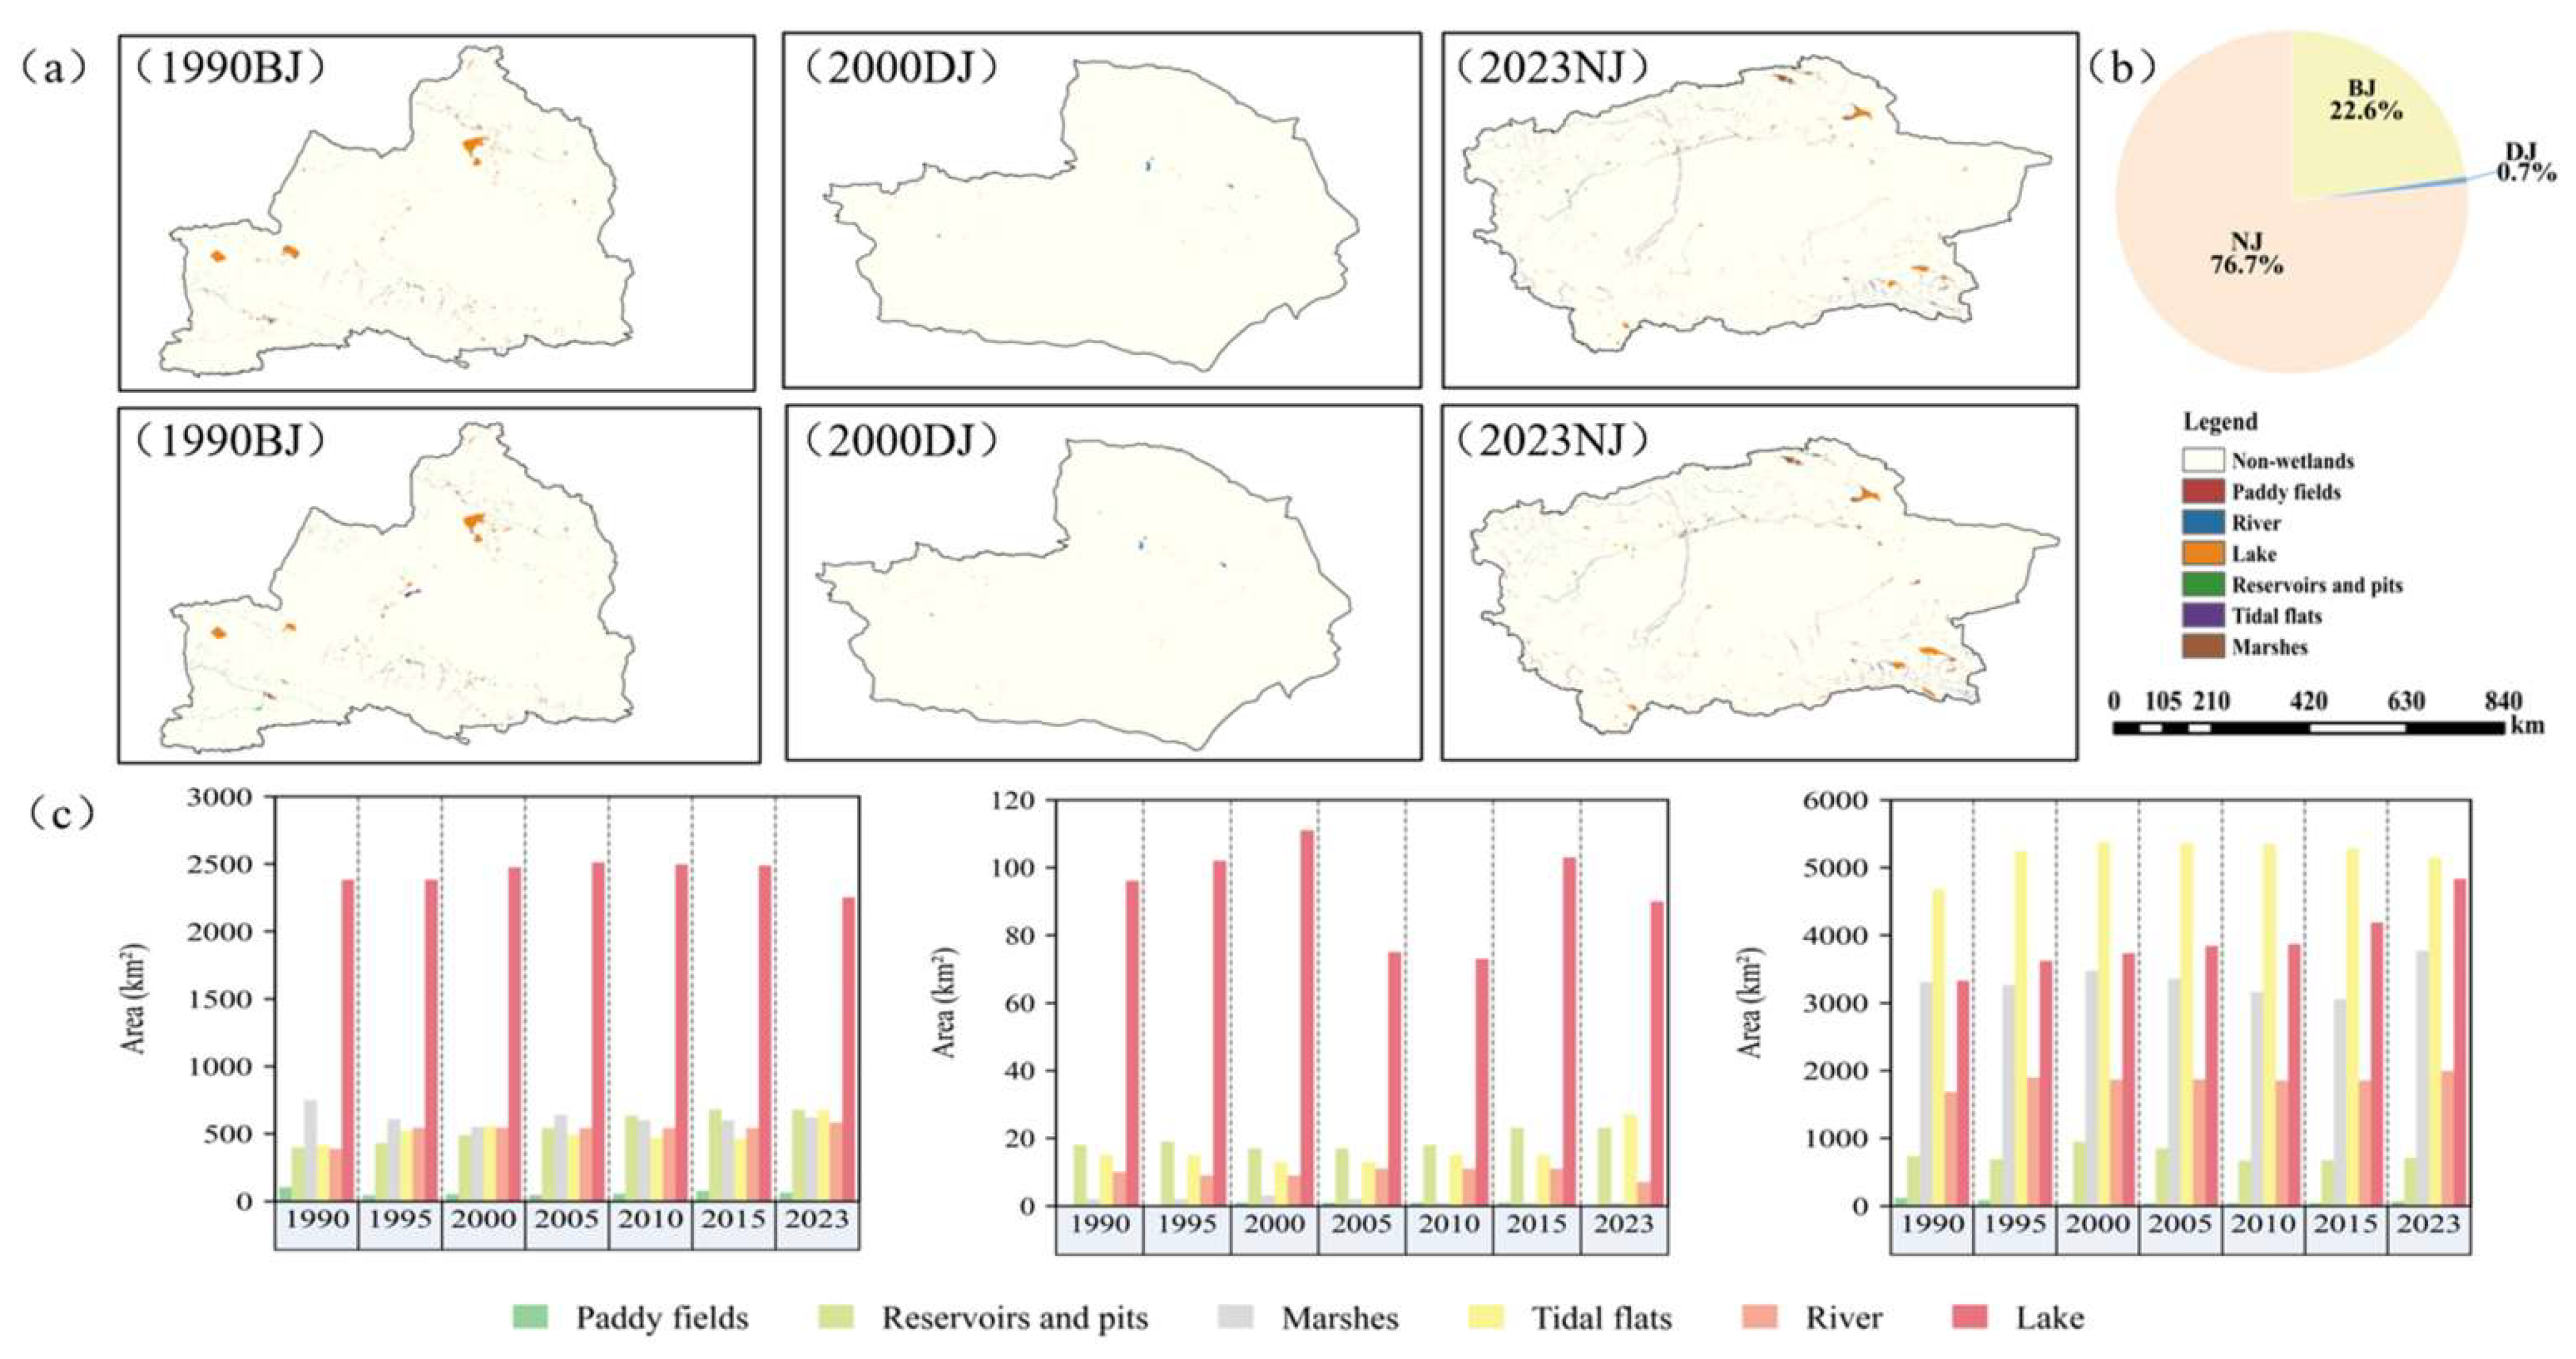
According to regional analysis, in 2023, wetland areas were primarily distributed across southern, northern, and eastern Xinjiang (Figure 4). Southern Xinjiang had the largest proportion of wetlands, accounting for approximately 76.7% of the land, primarily distributed along the Tarim River and its lakes; wetlands in northern Xinjiang accounted for 22.6% of the land, primarily concentrated around rivers and reservoirs/ponds in the Junggar Basin; and wetlands in eastern Xinjiang were more scattered, accounting for 0.7% of the land. The total area of wetlands in southern Xinjiang has expanded significantly, with lakes showing the largest increase, rising sharply from 3326 km2 to 4830 km2, an increase of 45.2%. Beaches, rivers, and marshes have also increased in area, while reservoirs, ponds, and paddy fields have decreased. The total area of wetlands in northern Xinjiang also shows an increasing trend, with heterogeneous changes observed across different wetland types. Among these, the areas of rivers have expanded significantly, increasing from 388 km2 to 583 km2, representing a growth rate of 50.3%; the areas of reservoirs and ponds have grown notably, rising from 397 km2 to 676 km2, an increase of 70.3%; and tidal flats have also seen a notable increase in area. However, the areas of lakes have decreased from 2381 km2 to 2251 km2, representing a relatively small decline; the areas of marshes have shrunk from 748 km2 to 620 km2, a reduction of 17.1%; and the areas of paddy fields have decreased by 39.4%. Wetland changes in eastern Xinjiang are not very noticeable. Among them, the area of tidal flats has increased by 80%, representing relatively rapid growth; reservoirs and ponds have increased by 27.8%; rivers have decreased from 10 km2 to 7 km2, a relatively rapid reduction of up to 30%; and lake and marsh areas are also showing a downward trend.

3.2. Changes in Wetland Landscape Pattern Indices

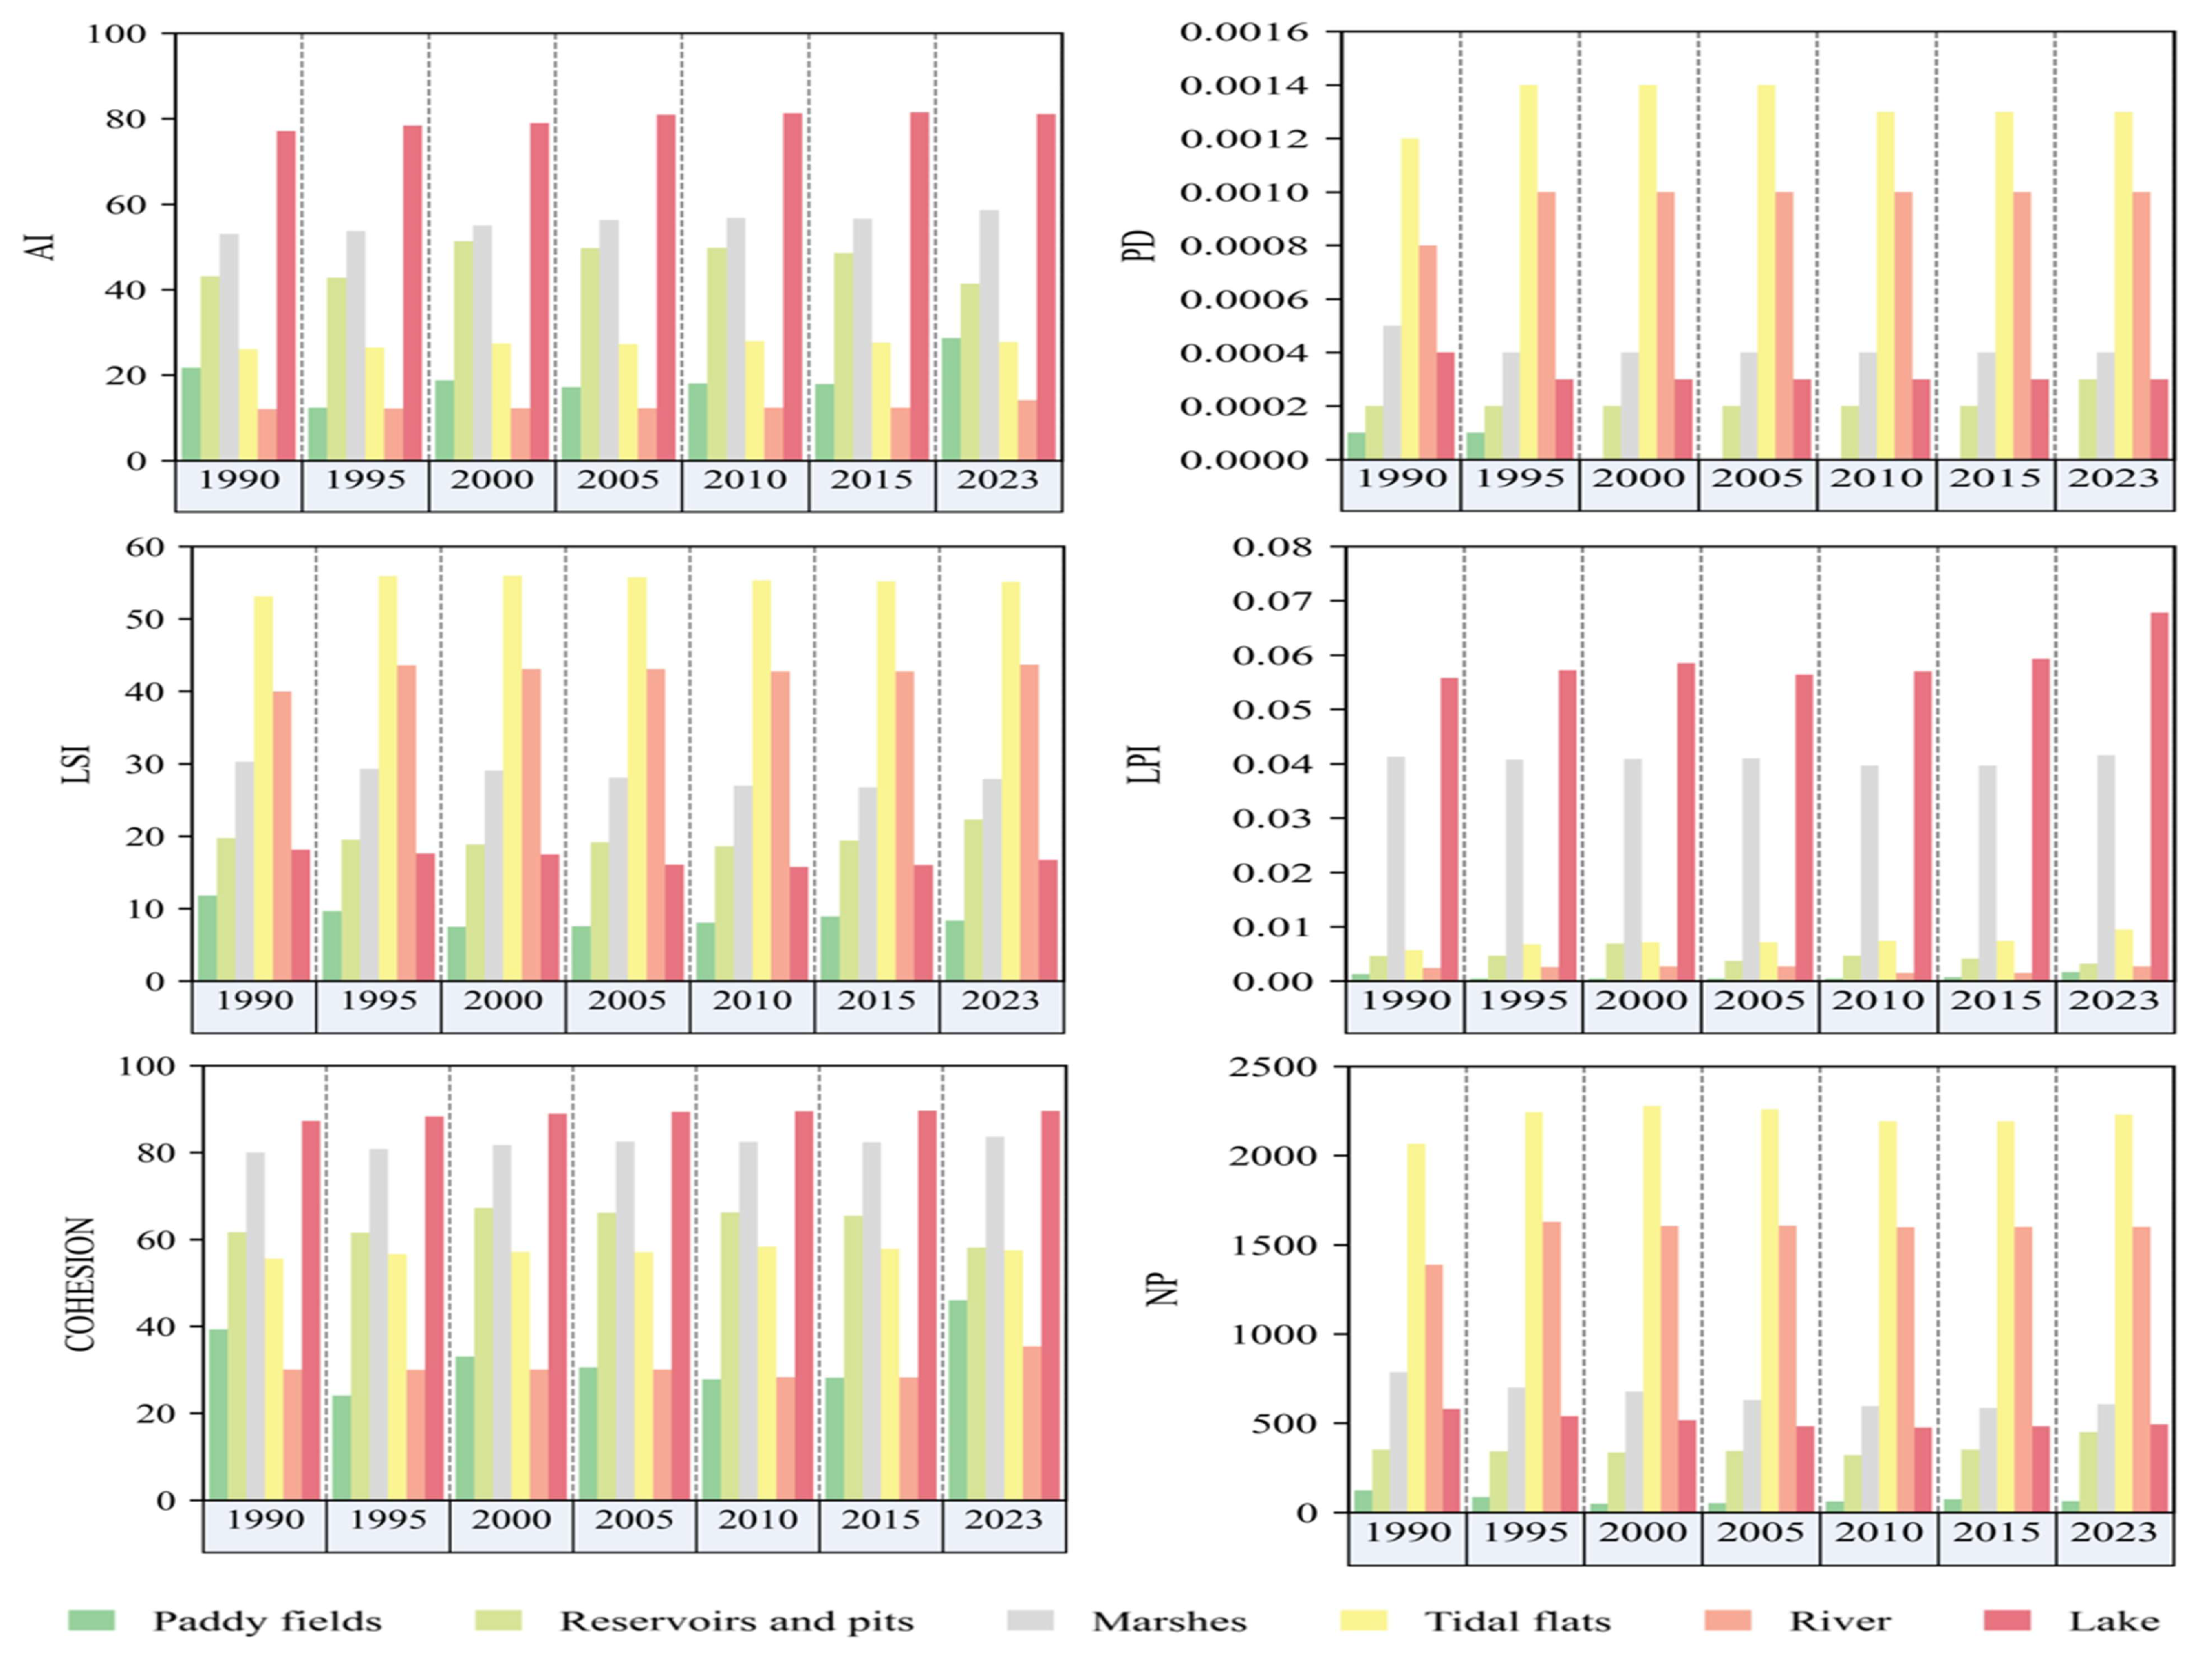
The wetland landscape pattern in Xinjiang exhibited distinct typological differences and dynamic changes between 1990 and 2023 (Figure 5). The wetland patch count rose from 4257 to 4355, exhibiting a fluctuating increase over time, the maximum patch index increased from 0.0867 to 0.0932, the landscape shape index showed a fluctuating decline, indicating that the overall landscape shape is becoming more regular, patch connectivity increased from 76.90 to 78.90, indicating that landscape connectivity is continuing to improve, and the aggregation index increased from 51.31 to 54.92, indicating that wetland patches are distributed in a more concentrated manner. Specifically, in terms of patch density indicators, tidal flats have consistently maintained high numerical values and shown a slight upward trend, while lake and river values have remained relatively stable. However, paddy fields dropped to zero after the year 2000. This change aligns with the overall fluctuating increase in wetland patch numbers, manifested in the differentiated evolution of different wetland types: the number of patches of tidal flats, marshes, and paddy fields has significantly decreased, showing a clear trend toward concentration; meanwhile, the number of patches of lakes and reservoir ponds has increased, reflecting intensified landscape fragmentation. Among these, the landscape pattern of rivers has remained relatively stable, with minimal changes in patch numbers. In terms of the maximum patch index, the values for lakes, tidal flats, and reservoir ponds increased, indicating a trend of expanding maximum patch area; in contrast, the maximum patch index value for marshes decreased, with corresponding reductions in maximum patch area. In terms of landscape shape characteristics, the landscape shape index values for floodplains, marshes, and paddy fields decreased, indicating that their shapes are becoming more regular; in contrast, the landscape shape index values for lakes, rivers, and reservoirs/ponds increased, indicating that their shapes are becoming more complex. In terms of landscape connectivity, the patch connectivity and aggregation of tidal flats, lakes, rivers, reservoirs, ponds, and paddy fields have improved, reflecting the strengthening of ecosystem connectivity and spatial integration among these wetland types. However, the patch connectivity and aggregation of marshes have shown a downward trend. Overall, patch density has remained relatively stable.

3.3. Spatial and Temporal Changes in Wetland Habitat Quality

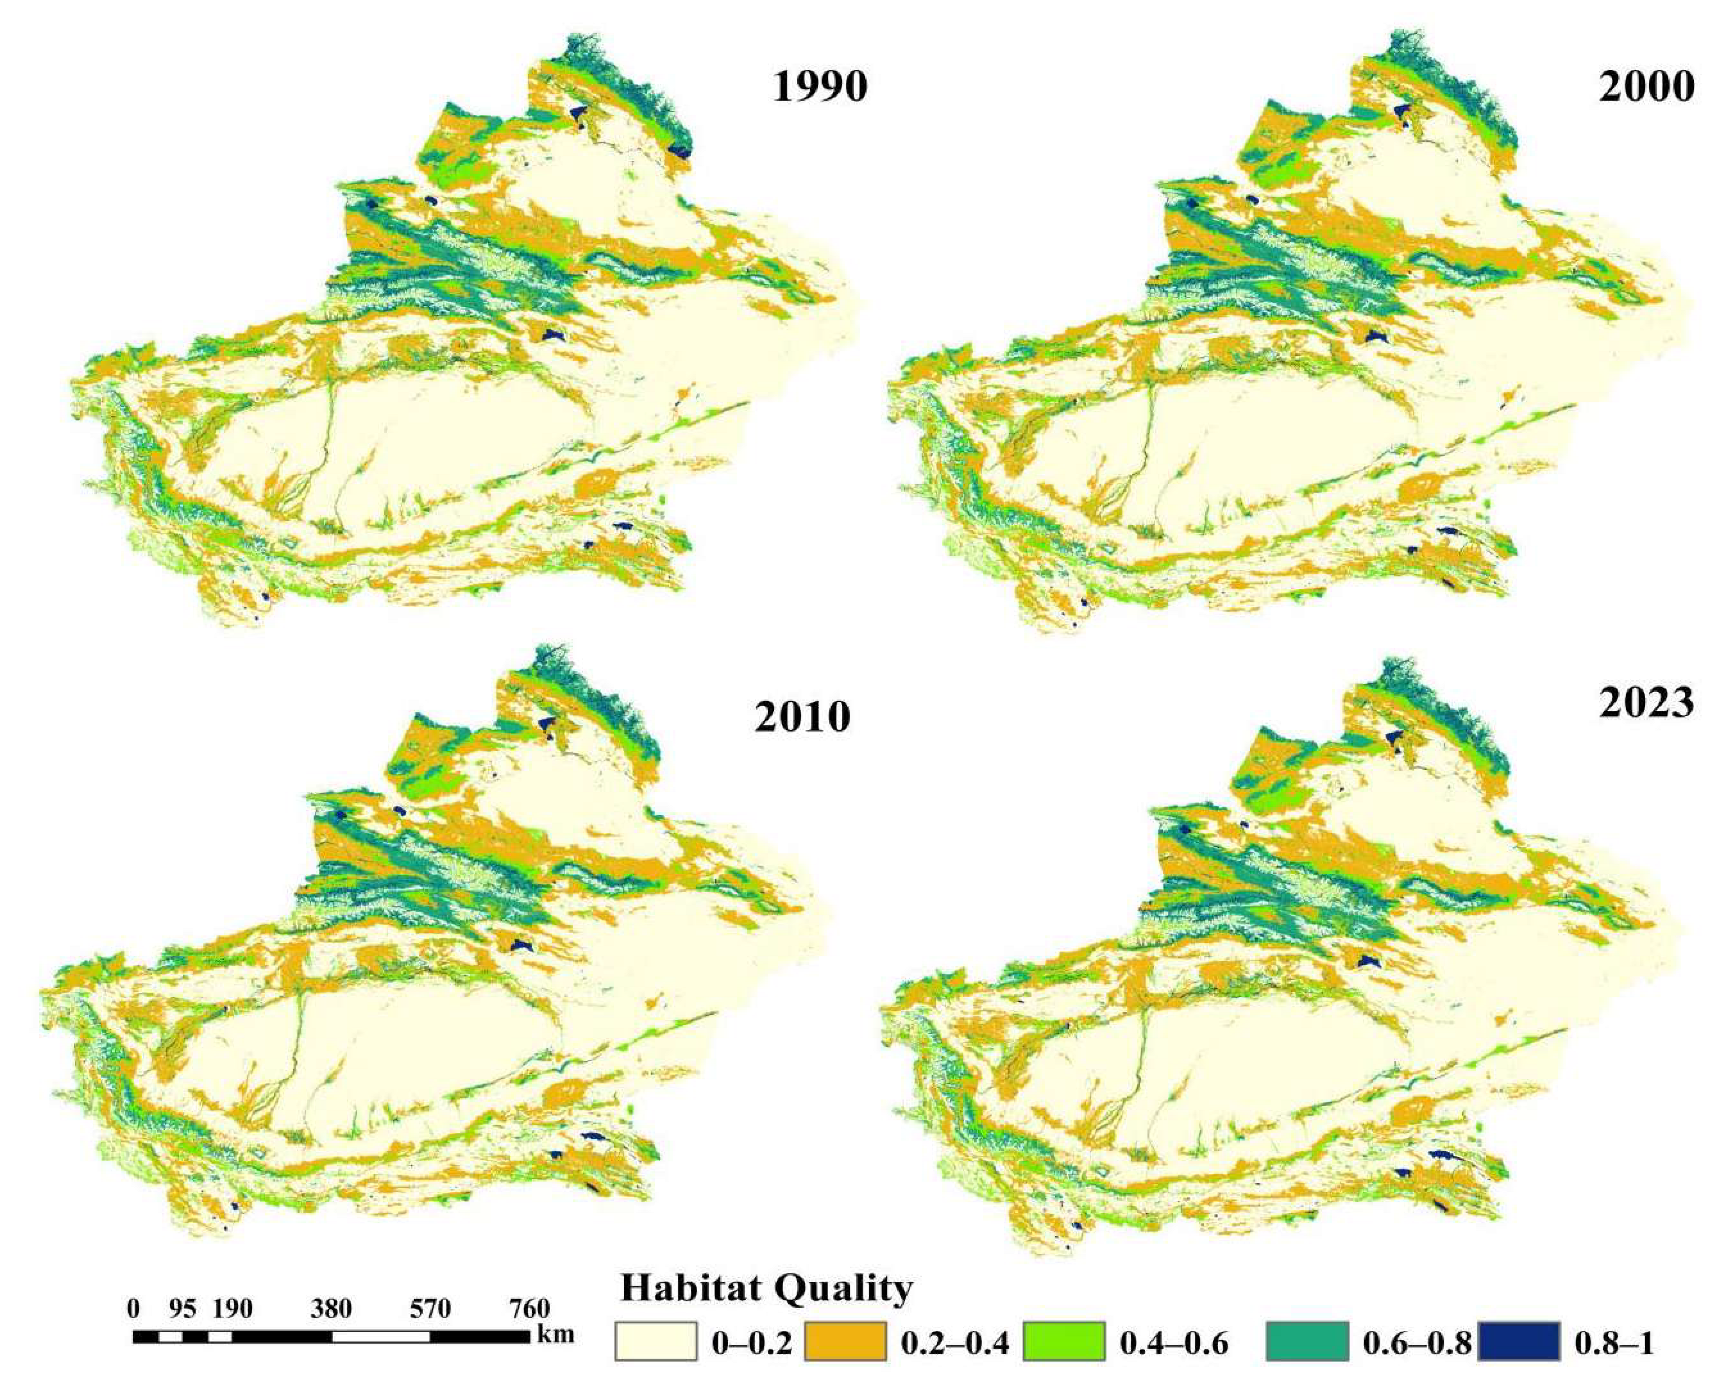
In the past three decades, the habitat quality of wetlands in Xinjiang has improved, although considerable spatial differences remain. Forest and grassland habitats exhibit better quality, while sandy and desert habitats have poorer quality. Moderate-quality habitats are distributed in mountainous areas, wetlands, and other regions (Figure 6). The habitat quality index for rivers and lakes has consistently remained at a high level, classified as “optimal”, indicating excellent ecological conditions. In contrast, the habitat quality index for reservoirs and ponds ranges from 0.750 to 0.756, classified as “high”, with relatively good ecological conditions, but slightly worse than those of natural lakes and rivers. The habitat quality index for floodplains ranges from 0.583 to 0.585, classified as “moderate”, indicating that their ecosystem functions are relatively stable. The habitat quality of paddy fields and marshes is classified as “low” (Table S4).

3.4. Analysis of Environmental Factors Affecting the Area of Each Wetland Type

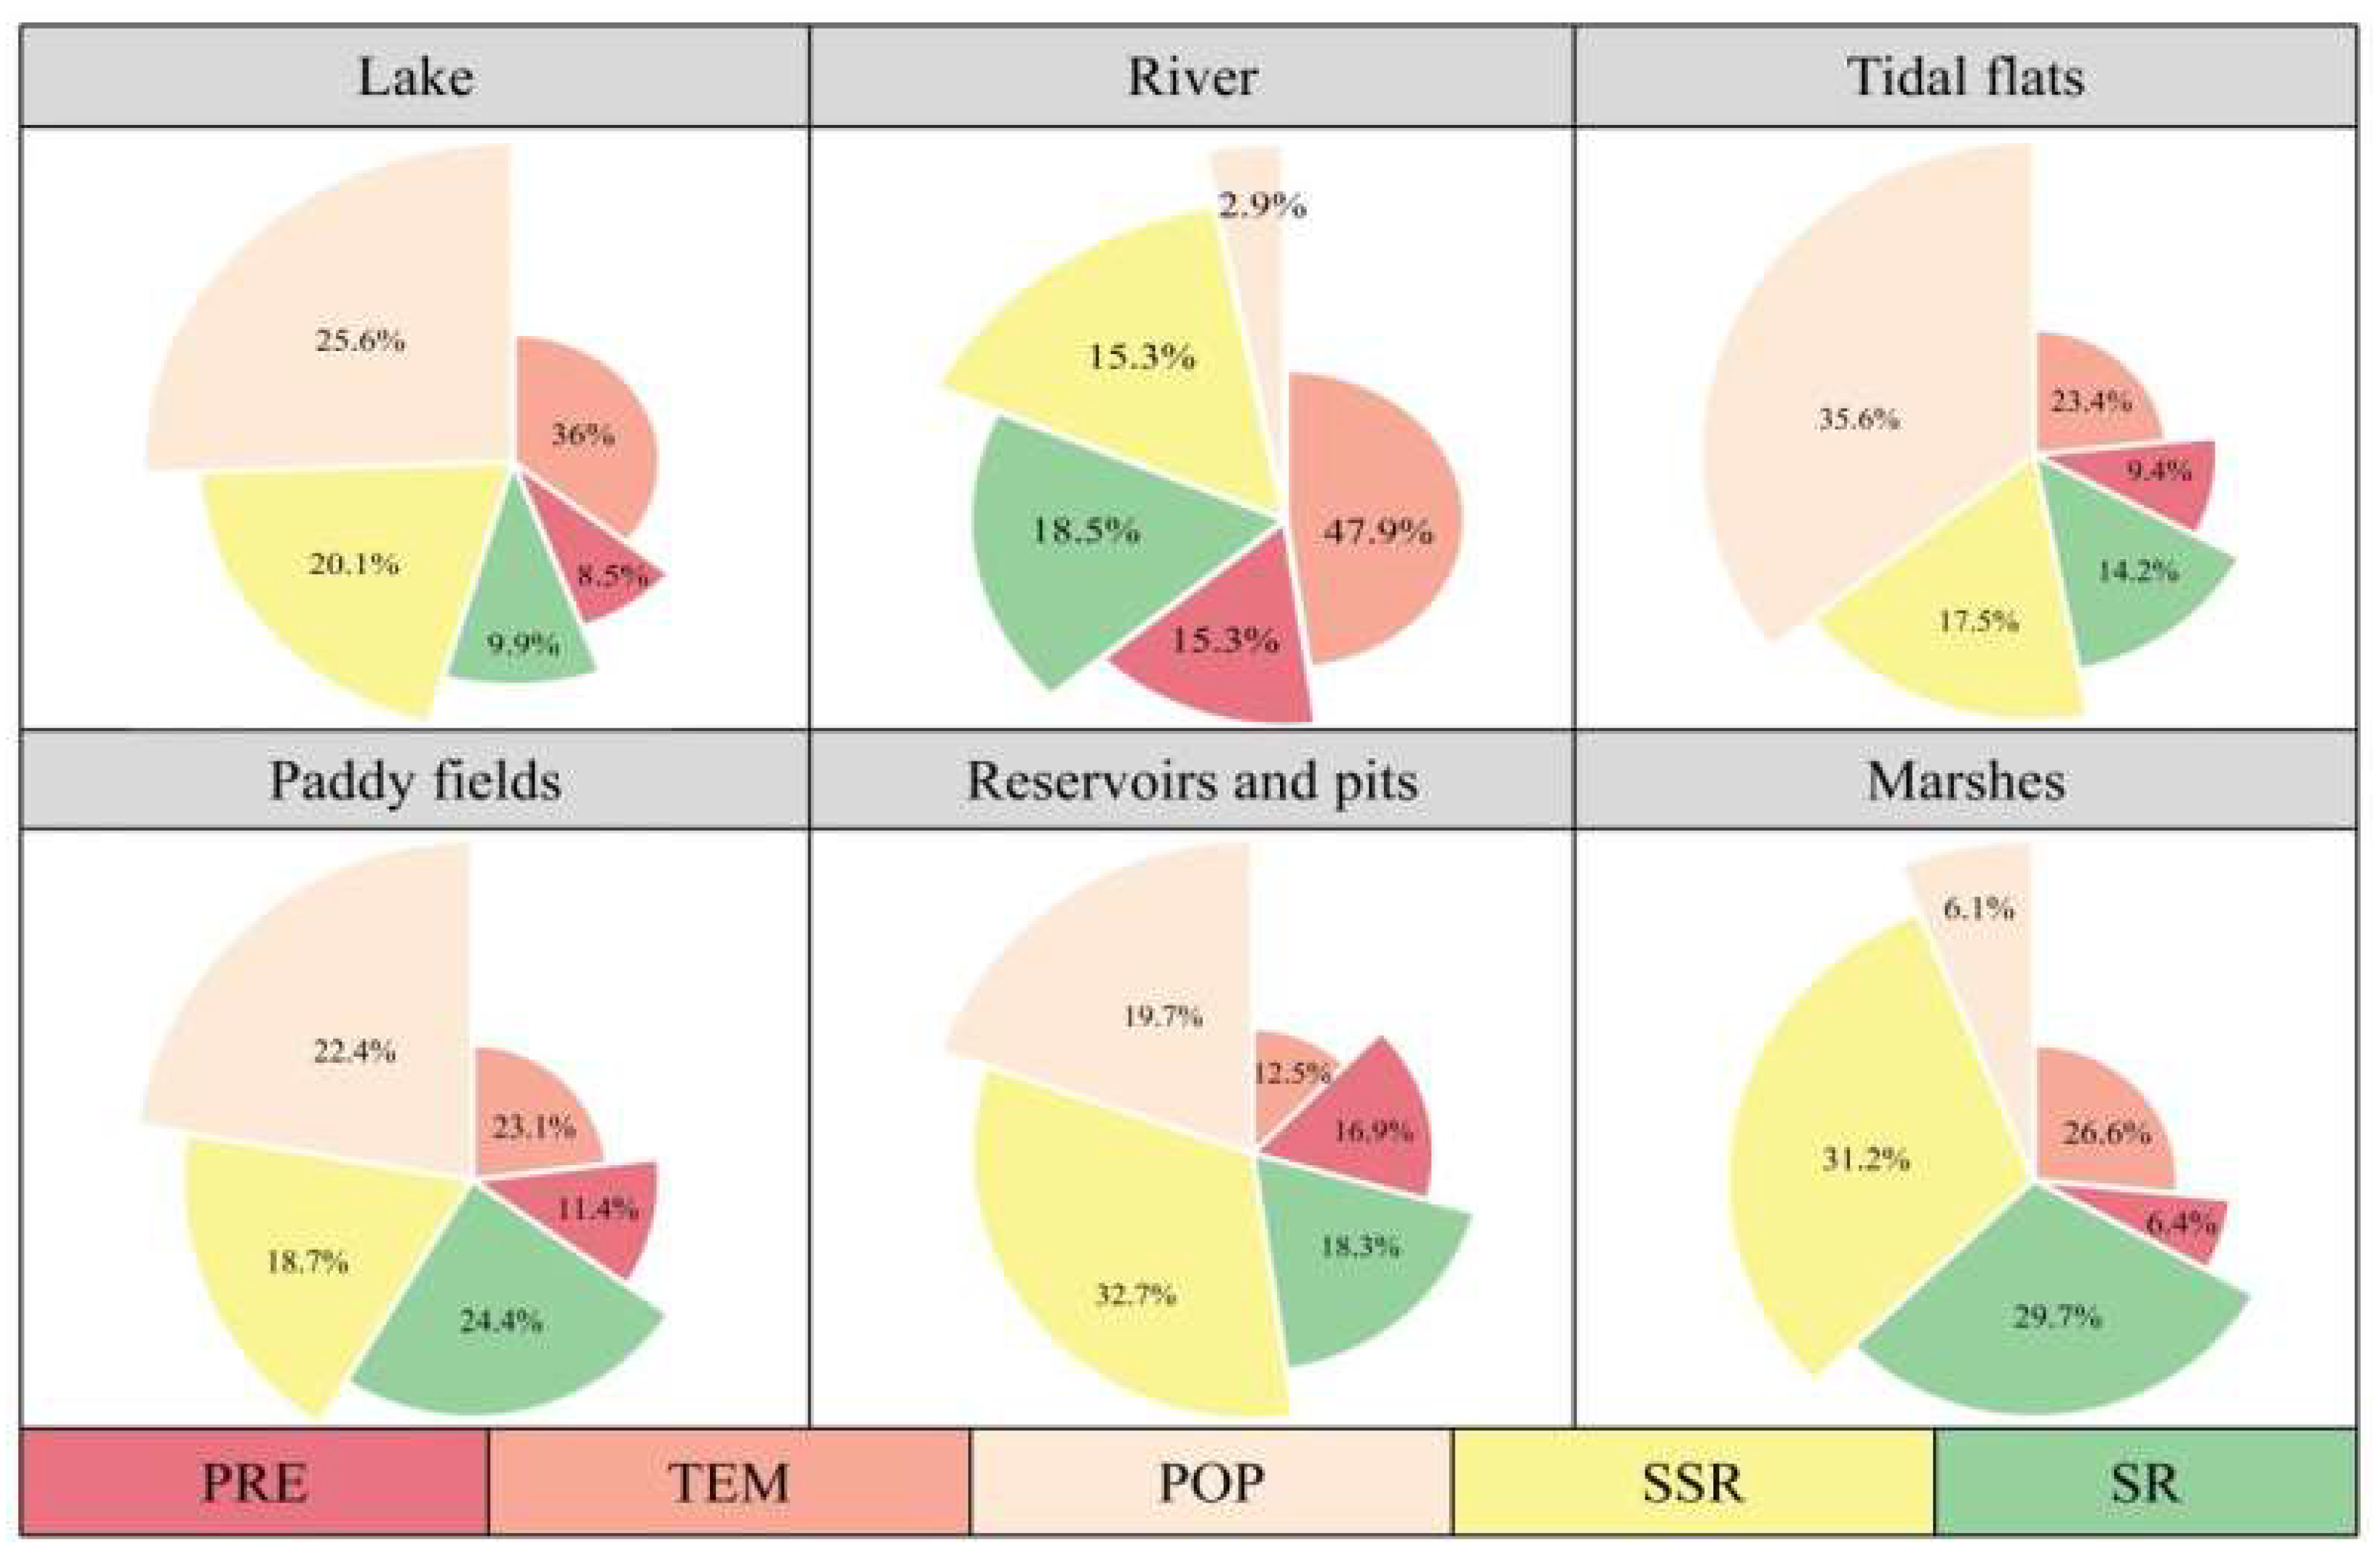
To further analyze the causes of wetland expansion, this study employed the SHAP method to quantify the relative contributions of various factors to changes in wetland areas across different wetland types (Figure 7). The results indicate that temperature exhibits the strongest explanatory power for changes in the area of natural wetlands, contributing 47.9% to river changes, 36.0% to lake changes, and 26.6% to marsh changes. Surface runoff contributes 29.7% to marsh changes, while groundwater runoff has the most significant contribution to changes in reservoir ponds, reaching 32.7%. Precipitation explains 16.9% of changes in reservoir ponds, which is significantly higher than its influence on other wetland types. Population density has the highest contribution to changes in tidal flats, reaching 35.6%, followed by lakesides at 25.6%, while its contribution to river changes is only 2.9%. For paddy fields, temperature and surface runoff are the primary drivers of changes in area, contributing 23.1% and 24.4%, respectively, while precipitation and groundwater runoff contribute relatively less, at 11.4% and 18.7%, respectively. In summary, the area of rivers is primarily regulated by temperature, that of marshes is influenced by surface runoff, and that of reservoir ponds relies primarily on groundwater runoff and precipitation. Population density is a particularly important factor influencing the area of tidal flats.

4. Discussion

4.1. Characteristics of Wetland Changes in Xinjiang and Their Driving Mechanisms

4.1.1. Wetland Expansion and Regional Differences

Between 1990 and 2023, wetlands in Xinjiang showed an overall trend of expansion, but there were significant differences in changes between the different regions [34]. Wetland expansion was primarily concentrated in the areas surrounding the Tarim Basin and Junggar Basin [26], and the primary factors driving changes in wetland areas included the transformation of grasslands, barren land, and certain forested areas. The expansion of wetlands in northern Xinjiang is primarily characterized by an increase in rivers, reservoirs, ponds, and floodplains [35], while in southern Xinjiang, it is primarily driven by the expansion of lakes, rivers, and marshes [36]. Wetland changes in the eastern region are not significant, possibly due to the arid climate and scarcity of water resources in the area. Overall, wetland changes in Xinjiang exhibit significant regional differences. Changes in wetland types also exhibit distinct characteristics. Lakes have experienced the most significant increase in area, but this growth is accompanied by a trend toward fragmentation. Rivers remain stable in structure, while marshes continue to expand, though their connectivity has decreased. The wetland landscape structure indices NP, PD, LPI, AI, and COHESION have all increased, indicating that wetland patches are becoming more concentrated and spatial integration is strengthening [26]. These changes indicate the regularization of wetland morphology, with wetland patches tending toward simpler shapes. Meanwhile, the continuous increase in wetland habitat quality indices also suggests an improvement in wetland ecological functions [1].

4.1.2. Driving Mechanisms of Wetland Changes

The mechanisms governing wetland changes in Xinjiang exhibit significant spatial and temporal variability, with both natural factors and human activities jointly driving their evolution (Figure S1). Among them, climate change has a particularly pronounced impact on lakes, especially in high-mountain glacial regions such as the Kunlun and Tianshan ranges, where expansion trends are most evident—primarily driven by sustained meltwater replenishment from high-altitude glaciers [37]. Temperature increases contribute up to 36.0% to lake changes, with meltwater from retreating glaciers serving as the key driver for lake expansion [38]. For instance, Lake Ayakku increased by 335 square kilometers between 2000 and 2014, closely aligning with the regional temperature trend of a 0.3–0.5 °C rise per decade during the same period [36]. Notably, the impacts of climate warming vary across lake types: it exerts negative effects on rain-fed lakes while positively influencing lakes primarily fed by glacial meltwater [39]. Studies indicate that the warming rate in China’s arid northwest reaches approximately 0.31 °C per decade, significantly exceeding the global average [40]. This warming trend has accelerated glacial retreat in the region, significantly increasing glacial meltwater in the short term. Particularly in the Tarim Basin and its surrounding areas, glacial meltwater can account for up to 50% of annual river runoff [41]. This increased water supply directly enhances the replenishment capacity of terminal lakes, promoting the expansion of lake-type wetlands [42].
Simultaneously, rising temperatures have altered the spatiotemporal distribution of precipitation, particularly manifested in the increasing proportion of winter and spring snowfall transitioning to rainfall [40]. This change not only leads to earlier snowmelt and earlier peak runoff, but also disrupts wetland inundation rhythms, affecting the structure and function of wetland ecosystems. Furthermore, the increasing frequency of extreme precipitation events further heightens the uncertainty of water input into wetlands, potentially causing sudden expansions in wetland patterns [43]. Temperature changes contribute up to 47.9% to river wetland evolution by influencing snowmelt and glacial melt processes in high-altitude regions [44]. Rising temperatures cause earlier spring snowmelt and increased melt intensity, thereby boosting spring river runoff [45]. This trend of increased runoff is particularly pronounced in basins such as the Kaidu River and Qing Shui River [46]. However, as glaciers continue to retreat and their regulatory role diminishes, river supply stability is becoming uncertain. Consequently, riverine wetlands experience not only increased water volume but also altered hydrological rhythms and heightened variability [42]. Additionally, water conservancy projects influence riverine wetlands in two ways: firstly, storage facilities like reservoirs reduce downstream natural channel flows, compressing the spatial extent of wetlands; secondly, ecological water diversion projects implemented in recent years, such as those in the Tarim River mainstem, have partially alleviated wetland degradation. In addition, increased regional precipitation has positively contributed to wetland expansion. For instance, significant precipitation growth in the Yarkant River basin increased its runoff by 87%, thereby driving downstream wetland expansion [47].

4.2. Wetland Conservation Policies and Restoration Measures

4.2.1. Historical Development of Wetland Conservation Policies

Human activities have been a key driving force in the evolution of wetland systems in Xinjiang. This is especially true in arid regions, where natural water resources are scarce and artificial intervention plays a critical role in adjusting hydrological processes and wetland structures. These effects are reflected in the coordinated promotion of ecological water diversion projects, agricultural irrigation scheduling, reservoir control construction, and institutionalized protection policies [48]. In 1992, China acceded to the Ramsar Convention on Wetlands, marking the emergence of national-level awareness of wetland conservation [49]. The Wetland Conservation Work Priorities issued in 2000 further promoted the implementation of wetland conservation policies and laid the foundation for the implementation of subsequent regulations. The National Wetland Conservation Project Plan (2005–2010) implemented in 2005 provided an institutional framework for national wetland conservation and paved the way for a new stage of wetland conservation [26]. Xinjiang is actively establishing wetland-type nature reserves, national wetland parks, and a list of important wetlands. It is implementing total control and graded management of wetland areas, strictly limiting wetland occupation, and strengthening engineering projects such as ecological water replenishment, vegetation restoration, and waterbird habitat restoration. In the future, continued efforts will be made to advance science-based wetland restoration, wetland monitoring informatization, ecological tourism, and science popularization in order to further enhance wetland carbon sink functions and biodiversity conservation and establish a high-quality wetland protection framework for arid regions (Figure 8).

4.2.2. Impact of Ecological Water Diversion Projects

During the implementation of the 12th and 13th Five-Year Plans, wetland protection policies and funding continued to increase. The introduction of the Xinjiang Uygur Autonomous Region Wetland Protection Regulations provided legal protection for measures such as wetland fencing, returning farmland to wetlands, and ecological water diversion [50]. Moreover, the ecological water diversion project in the lower reaches of the Tarim River has been gradually implemented, yielding significant ecological benefits [51]. The implementation of these policies and measures has facilitated the restoration and expansion of wetlands in Xinjiang’s arid regions, particularly in areas with water scarcity, where wetland conservation and restoration have achieved critical progress. Ecological water diversion projects have played a crucial role in wetland conservation [52]. Taking the lower reaches of the Tarim River as an example, the large-scale ecological water diversion projects implemented since the year 2000 have significantly raised groundwater levels, improved wetland water conditions, restored vegetation, and enhanced the stability of the regional ecosystem [53]. For example, the gradual recovery of Taite Lake from a dried-up state reflects the long-term effects of ecological water diversion projects. By 2020, cumulative ecological water diversion had reached 84.45 × 10⁸ m3, altering the spatiotemporal distribution of water resources [54]. The implementation of these water resource allocation measures has strengthened the ecological functions and stability of wetlands.

4.2.3. Impact of Agricultural Irrigation and Reservoir Construction

Changes in agricultural water use patterns directly affect groundwater levels, which in turn indirectly affect wetlands, especially marshlands. In Xinjiang, the increase in marshlands is closely related to agricultural irrigation water use and the implementation of ecological water transfer projects. With adjustments to the water used for agricultural irrigation, wetlands in some regions have received reasonable water allocation [17]. For example, in southern Xinjiang, following the implementation of the ecological water diversion project, the area of marshes around Lake Taitema increased significantly by over 20% [36]. This wetland restoration process demonstrates the important role of ecological water diversion and reservoir regulation in restoring natural wetlands. However, in the northern region, agricultural development has led to runoff interception, resulting in a reduction in marsh areas. Taking the Abai Lake basin as an example, marsh areas have decreased by approximately 15%, with most of these wetlands converted into farmland and saline–alkali land [35]. Changes in groundwater levels also have a significant impact on marshes, with changes in groundwater runoff affecting these wetlands by up to 26.3%. Between 2000 and 2010, the area of reservoirs and ponds in Xinjiang rose by 2.28% [26]. From 2010 to 2020, the construction of reservoirs accelerated, with 136 reservoirs built, representing 23.50% of the total reservoirs in the region [20]. As urbanization, population growth, and environmental awareness have increased, artificial wetlands like reservoirs and wetland parks have rapidly expanded, and this trend is expected to continue [55]. Reservoirs have played a significant role in the growth of wetland areas, not only by altering the flow of surface runoff and groundwater but also by regulating water supply. In the Tarim River Basin, the integration of reservoir water diversion and ecological transfer has notably improved wetland water conditions and facilitated marsh growth. Reservoirs have provided crucial storage for Xinjiang’s arid regions and contributed to wetland conservation by regulating water sources [56].

5. Conclusions

This study systematically examined the spatiotemporal evolution and driving mechanisms of wetlands in Xinjiang from 1990 to 2023. The total area of wetlands in Xinjiang increased significantly, rising from 18,427 km2 in 1990 to 21,532 km2 in 2023, with an average annual growth of 94 km2. Wetland expansion varies regionally, and we found that the most considerable growth occurred in southern Xinjiang, particularly around the Tarim Basin, where lakes and marshes expanded rapidly. In northern Xinjiang, wetland growth focused on the Ili River and Erqis River basins, as well as the surrounding rivers, reservoirs, and ponds. Eastern Xinjiang showed relatively minor changes. In terms of landscape patterns, the aggregation and connectivity of wetland patches improved, while the fragmentation of lakes and reservoirs increased, as indicated by a rise in the fragmentation index and a decrease in the maximum patch index. Furthermore, wetland area was strongly correlated with both the landscape uniformity and consistency indices, while it was negatively correlated with the landscape fragmentation index, suggesting an improvement in wetland habitat quality. Our results also indicate that the increased runoff caused by warming has provided an opportunity for the expansion of wetlands in Xinjiang, contributing most significantly to the expansion of lakes and rivers. At the same time, certain human activities, including wetland conservation measures and water resource management projects, have promoted wetland restoration and improvements in habitat quality. This study provides a scientific basis for the sustainable conservation and management of wetlands in the arid regions of Xinjiang, with significant implications for future wetland conservation and the rational utilization of resources.

Supplementary Materials

The following supporting information can be downloaded at: https://www.mdpi.com/article/10.3390/land14091889/s1, Figure S1: Analysis of the changing trends of driving factors; Table S1: Threat factors and their intensity; Table S2: Threat factors and their intensity; Table S3: Habitat suitability and sensitivity for each land use type; Table S4: Habitat quality index of various wetland types in different years.

Author Contributions

Conceptualization, J.Q., Y.C., Y.W. (Yonghui Wang), Y.L., Z.L. and G.F.; Methodology, J.Q., Y.L. and Z.L.; Software, J.Q.; Validation, Y.C., Z.L. and G.F.; Formal analysis, Y.C.; Investigation, Y.L. and Z.L.; Data curation, J.Q., Y.W. (Yonghui Wang), Y.L., Z.L., C.L., Y.W. (Yihan Wang) and Z.W.; Writing—original draft, J.Q.; Writing—review & editing, J.Q., Y.C. and Y.W. (Yonghui Wang); Visualization, G.F.; Project administration, Y.C. and Y.W. (Yonghui Wang); Funding acquisition, Y.C. All authors have read and agreed to the published version of the manuscript.

Funding

The authors of this study would like to express their appreciation for the funding provided by the Science and Technology Partnership Program of the Shanghai Cooperation Organization and the International Science and Technology Cooperation Program, Xinjiang Department of Science and Technology (Grant No. 2023E01005); the National Natural Science Foundation (42261051); and the Key Science and Technology Project of Xinjiang (2024A03006-4).

Data Availability Statement

The data presented in this study are available upon request from the corresponding author. Due to ethical constraints, these data are not publicly available.

Conflicts of Interest

The authors declare no conflicts of interest.

References

  1. Song, F.; Su, F.L.; Mi, C.X.; Sun, D. Analysis of driving forces on wetland ecosystem services value change: A case in Northeast China. Sci. Total Environ. 2021, 751, 141778. [Google Scholar] [CrossRef]
  2. Hu, S.J.; Niu, Z.G.; Chen, Y.F.; Li, L.F.; Zhang, H.Y. Global wetlands: Potential distribution, wetland loss, and status. Sci. Total Environ. 2017, 586, 319–327. [Google Scholar] [CrossRef]
  3. Shi, S.X.; Chang, Y.; Wang, G.D.; Li, Z.; Hu, Y.M.; Liu, M.; Li, Y.H.; Li, B.L.; Zong, M.; Huang, W.T. Planning for the wetland restoration potential based on the viability of the seed bank and the land-use change trajectory in the Sanjiang Plain of China. Sci. Total Environ. 2020, 733, 139208. [Google Scholar] [CrossRef] [PubMed]
  4. Rahimi, L.; Malekmohammadi, B.; Yavari, A.R. Assessing and modeling the impacts of wetland land cover changes on water provision and habitat quality ecosystem services. Nat. Resour. Res. 2020, 29, 3701–3718. [Google Scholar] [CrossRef]
  5. Cui, L.L.; Li, G.S.; Liao, H.J.; Ouyang, N.L.; Li, X.Y.; Liu, D. Remote sensing of coastal wetland degradation using the landscape directional succession model. Remote Sens. 2022, 14, 5273. [Google Scholar] [CrossRef]
  6. Wang, J.; Chen, J.S.; Wen, Y.; Fan, W.; Liu, Q.N.; Tarolli, P. Monitoring the coastal wetlands dynamics in Northeast Italy from 1984 to 2016. Ecol. Indic. 2021, 129, 107906. [Google Scholar] [CrossRef]
  7. Adade, R.; Nyarko, B.K.; Aheto, D.W.; Osei, K.N. Fragmentation of wetlands in the south eastern coastal savanna of Ghana. Reg. Stud. Mar. Sci. 2017, 12, 40–48. [Google Scholar] [CrossRef]
  8. Liu, S.L.; Dong, Y.H.; Deng, L.; Liu, Q.; Zhao, H.D.; Dong, S.K. Forest fragmentation and landscape connectivity change associated with road network extension and city expansion: A case study in the Lancang River Valley. Ecol. Indic. 2014, 36, 160–168. [Google Scholar] [CrossRef]
  9. Ji, J.W.; Wang, S.X.; Zhou, Y.; Liu, W.L.; Wang, L.T. Spatiotemporal change and landscape pattern variation of eco-environmental quality in Jing-Jin-Ji urban agglomeration from 2001 to 2015. IEEE Access 2020, 8, 125534–125548. [Google Scholar] [CrossRef]
  10. Danso, G.K.; Takyi, S.A.; Amponsah, O.; Yeboah, A.S.; Owusu, R.O. Exploring the effects of rapid urbanization on wetlands: Insights from the Greater Accra Metropolitan Area, Ghana. SN Soc. Sci. 2021, 1, 1–21. [Google Scholar] [CrossRef]
  11. Xu, W.H.; Fan, X.Y.; Ma, J.G.; Pimm, S.L.; Kong, L.Q.; Zeng, Y.; Li, X.S.; Xiao, Y.; Zheng, H.; Liu, J.G.; et al. Hidden loss of wetlands in China. Curr. Biol. 2019, 29, 3065–3071. [Google Scholar] [CrossRef]
  12. Jiang, W.G.; Deng, Y.; Tang, Z.H.; Lei, X.; Chen, Z. Modeling the potential impacts of urban ecosystem changes on carbon storage under different scenarios by linking the CLUE-S and the InVEST models. Ecol. Model. 2017, 345, 30–40. [Google Scholar] [CrossRef]
  13. Strzęciwilk, K.; Grygoruk, M. Restoration is an investment. Comparing restoration costs and ecosystem services in selected European wetlands. J. Water Land Dev. 2025, 64, 153–167. [Google Scholar] [CrossRef]
  14. Xiong, Y.; Mo, S.; Wu, H.; Qu, X.; Liu, Y.; Zhou, L. Influence of human activities and climate change on wetland landscape pattern—A review. Sci. Total Environ. 2023, 879, 163112. [Google Scholar] [CrossRef] [PubMed]
  15. Kleniewska, M.; Mitrowska, D.; Szporak-Wasilewska, S.; Ciężkowski, W.; Berezowski, T. Actual and reference evapotranspiration for a natural, temperate zone fen wetland—Upper Biebrza case study. J. Water Land Dev. 2024, 61, 89–103. [Google Scholar] [CrossRef]
  16. Mantyka-Pringle, C.; Leston, L.; Messmer, D.; Asong, E.; Bayne, E.M.; Bortolotti, L.E.; Sekulic, G.; Wheater, H.S.; Howerter, D.W.; Clark, R.G. Antagonistic, synergistic and direct effects of land use and climate on Prairie wetland ecosystems: Ghosts of the past or present? Divers. Distrib. 2019, 25, 1924–1940. [Google Scholar] [CrossRef]
  17. Yao, J.Q.; Chen, Y.N.; Guan, X.F.; Zhao, Y.; Chen, J.; Mao, W.Y. Recent climate and hydrological changes in a mountain-basin system in Xinjiang, China. Earth-Sci. Rev 2022, 226, 103957. [Google Scholar] [CrossRef]
  18. Jiapaer, G.; Liang, S.L.; Yi, Q.X.; Liu, J.P. Vegetation dynamics and responses to recent climate change in Xinjiang using leaf area index as an indicator. Ecol. Indic. 2015, 58, 64–76. [Google Scholar] [CrossRef]
  19. Meng, W.Q.; He, M.X.; Hu, B.B.; Mo, X.Q.; Li, H.Y.; Liu, B.Q.; Wang, Z.L. Status of wetlands in China: A review of extent, degradation, issues, and recommendations for improvement. Ocean Coast. Manag. 2017, 146, 50–59. [Google Scholar] [CrossRef]
  20. Luo, N.N.; Yu, R.; Mao, D.H.; Wen, B.L.; Liu, X.T. Spatiotemporal variations of wetlands in northern Xinjiang with relationship to climate change. Wetlands Ecol. Manag. 2021, 29, 617–631. [Google Scholar] [CrossRef]
  21. Shi, J.H.; Zhang, P.; Liu, Y.; Tian, L.; Cao, Y.Z.; Guo, Y.; Li, J.; Wang, Y.H.; Huang, J.H.; Jin, R.; et al. Study on spatiotemporal changes of wetlands based on PLS-SEM and PLUS model: The case of the Sanjiang Plain. Ecol. Indic. 2024, 169, 112812. [Google Scholar] [CrossRef]
  22. Wei, W.; Xia, J.; Hong, M.; Bo, L. The evolution of “three-zone space” in the Yangtze River Economic Belt under major functional zoning strategy from 1980 to 2018. Urban Plan. Forum 2021, 3, 28–35. [Google Scholar]
  23. Li, S.; Ma, H.; Yang, D.; Hu, W.; Li, H. The Main Drivers of Wetland Evolution in the Beig-Tian-Hebei Plain. Land 2023, 12, 480. [Google Scholar]
  24. Wang, C.; Ma, L.; Zhang, Y.; Chen, N.; Wang, W. Spatiotemporal dynamics of wetlands and their driving factors based on PLS-SEM: A case study in Wuhan. Sci. Total Environ. 2022, 806, 151310. [Google Scholar] [CrossRef]
  25. Liu, J.Y.; Kuang, W.H.; Zhang, Z.X.; Xu, X.L.; Qin, Y.W.; Ning, J.; Zhou, W.C.; Zhang, S.W.; Li, R.D.; Yan, C.Z.; et al. Spatiotemporal characteristics, patterns, and causes of land-use changes in China since the late 1980s. J. Geogr. Sci. 2014, 24, 195–210. [Google Scholar] [CrossRef]
  26. Wu, X.L.; Zhao, H.; Wang, M.H.; Yuan, Q.Z.; Chen, Z.J.; Jiang, S.Z.; Deng, W. Evolution of wetland patterns and key driving forces in China’s drylands. Remote Sens. 2024, 16, 702. [Google Scholar] [CrossRef]
  27. He, S.; Li, J.; Wang, J.; Liu, F. Evaluation and analysis of upscaling of different land use/land cover products (FROM-GLC30, GLC_FCS30, CCI_LC, MCD12Q1 and CNLUCC): A case study in China. Geocarto Int. 2022, 37, 17340–17360. [Google Scholar] [CrossRef]
  28. Shen, G.; Yang, X.C.; Jin, Y.X.; Xu, B.; Zhou, Q.B. Remote sensing and evaluation of the wetland ecological degradation process of the Zoige Plateau Wetland in China. Ecol. Indic. 2019, 104, 48–58. [Google Scholar] [CrossRef]
  29. Wang, J.X.; Abulizi, A.; Mamitimin, Y.; Mamat, K.; Yuan, L.; Bai, S.J.; Yu, T.T.; Akbar, A.; Zhang, X.F.; Shen, F. Spatiotemporal evolution of habitat quality and scenario modeling prediction in the Tuha region. Land 2024, 13, 1005. [Google Scholar] [CrossRef]
  30. Wang, R.; Zhuang, H.L.; Cheng, M.K.; Yang, H.; Wang, W.F.; Ci, H.; Yan, Z.J. Spatial and temporal variations of habitat quality and influencing factors in urban agglomerations on the north slope of Tianshan Mountains, China. Land 2025, 14, 539. [Google Scholar] [CrossRef]
  31. Karathanasopoulos, N.; Singh, A.; Hadjidoukas, P. Machine learning-based modeling, feature importance and Shapley additive explanations analysis of variable-stiffness composite beam structures. Structures 2024, 62, 106206. [Google Scholar] [CrossRef]
  32. Lundberg, S.M.; Lee, S.I. A Unified Approach to Interpreting Model Predictions. Adv. Neural Inf. Process. Syst. 2017, 30, 4768–4777. [Google Scholar]
  33. Wen, H.J.; Yan, F.Y.; Huang, J.H.; Li, Y.J. Interpretable machine learning models and decision-making mechanisms for landslide hazard assessment under different rainfall conditions. Expert Syst. Appl. 2025, 270, 126582. [Google Scholar] [CrossRef]
  34. An, X.X.; Jin, W.P.; Zhang, H.Q.; Liu, Y.; Zhang, M. Analysis of long-term wetland variations in China using land use/land cover dataset derived from Landsat images. Ecol. Indic. 2022, 145, 109689. [Google Scholar] [CrossRef]
  35. Wang, Y.J.; Gu, X.C.; Yang, G.; Yao, J.Q.; Liao, N. Impacts of climate change and human activities on water resources in the Ebinur Lake Basin, Northwest China. J. Arid Land 2021, 13, 581–598. [Google Scholar] [CrossRef]
  36. Zhang, J.D.; Li, J.L.; Bao, A.M.; Frankl, A.; Wang, H.Y.; Bai, J.; Shen, Z.F.; Li, L.H.; De Maeyer, P.; van de Voorde, T. Ecological restoration trajectory of the Taitema Lake wetland in arid northwest China: A 36-year wetland health assessment using Landsat time series data. Ecol. Indic. 2024, 161, 111956. [Google Scholar] [CrossRef]
  37. Chen, Y.N.; Li, B.F.; Fan, Y.T.; Sun, C.J.; Fang, G.H. Hydrological and water cycle processes of inland river basins in the arid region of Northwest China. J. Arid Land 2019, 11, 161–179. [Google Scholar] [CrossRef]
  38. Zheng, L.L.; Xia, Z.L.; Xu, J.H.; Chen, Y.N.; Yang, H.Q.; Li, D.H. Exploring annual lake dynamics in Xinjiang (China): Spatiotemporal features and driving climate factors from 2000 to 199. Clim. Change 2021, 166, 36. [Google Scholar] [CrossRef]
  39. Mao, D.H.; Wang, Z.M.; Wu, B.F.; Zeng, Y.; Luo, L.; Zhang, B. Land degradation and restoration in the arid and semiarid zones of China: Quantified evidence and implications from satellites. Land Degrad. Dev. 2018, 29, 3841–3851. [Google Scholar] [CrossRef]
  40. Chen, Y.; Zhang, X.; Fang, G.; Li, W.; Wang, W.; Zhang, Y. The Potential Risks and Challenges of Climate Change in the Arid Region of Northwest China. Reg. Sustain. 2021, 2, 135–143. [Google Scholar]
  41. Fang, G.; Chen, Y.; Wang, W.; Zhang, L.; Sheng, Y. Impacts of Climate Change and Human Activities on Water Resources in Arid Region of Northwest China. Water 2020, 12, 2543. [Google Scholar]
  42. Zhang, Y.; Chen, Y.; Wang, W.; Ma, X.; Shen, Y. Long-Term Drastic Spatiotemporal Changes of Drainage Areas in Multi-Type Lake Basins in Xinjiang, China. Water 2020, 12, 2092. [Google Scholar]
  43. Allen, M.R.; Dube, O.P.; Solecki, W.; Aragón-Durand, F.; Cramer, W.; Humphreys, S.; Kainuma, M.; Kala, J.; Mahowald, N.; Mulugetta, Y.; et al. Framing and Context. In Climate Change 2022: Impacts, Adaptation and Vulnerability; IPCC Sixth Assessment Report; Cambridge University Press: Cambridge, UK, 2022; pp. 121–196. [Google Scholar]
  44. Chen, Y.N.; Li, Z.; Fan, Y.T.; Wang, H.J.; Deng, H.J. Progress and prospects of climate change impacts on hydrology in the arid region of northwest China. Environ. Res. 2015, 139, 11–19. [Google Scholar] [CrossRef] [PubMed]
  45. Li, Z.X.; Feng, Q.; Li, Z.J.; Yuan, R.F.; Gui, J.; Lv, Y.M. Climate background, fact and hydrological effect of multiphase water transformation in cold regions of the Western China: A review. Earth-Sci. Rev. 2019, 190, 33–57. [Google Scholar]
  46. Immerzeel, W.W.; Kraaijenbrink, P.D.A.; Shea, J.M.; Shrestha, A.B.; Pellicciotti, F.; Bierkens, M.F.P.; de Jong, S.M. High-Resolution Monitoring of Snow and Glacier Melt in the Upper Indus Basin Using Remote Sensing. Nat. Geosci. 2020, 13, 359–367. [Google Scholar]
  47. Wang, S.S.; Zhou, K.F.; Zuo, Q.T.; Wang, J.L.; Wang, W. Land use/land cover change responses to ecological water conveyance in the lower reaches of Tarim River, China. J. Arid Land 2021, 13, 1274–1286. [Google Scholar] [CrossRef]
  48. Zhang, J.D.; Li, J.L.; Bao, A.M.; Warner, T.A.; Li, L.H.; Chang, C.; Bai, J.; Liu, T. Characterizing seasonal and long-term dynamics of a lacustrine wetland in Xinjiang, China, using dense time-series remote sensing imagery. Int. J. Remote Sens. 2022, 43, 5502–5525. [Google Scholar] [CrossRef]
  49. Gong, P.; Niu, Z.G.; Cheng, X.; Zhao, K.Y.; Zhou, D.M.; Guo, J.H.; Liang, L.; Wang, X.F.; Li, D.D.; Huang, H.B.; et al. China’s wetland change (1990–2000) determined by remote sensing. Sci. China Earth Sci. 2010, 53, 1036–1042. [Google Scholar] [CrossRef]
  50. Zhang, J.; Qin, Y.; Zhang, Y.X.; Lu, X.; Cao, J.J. Comparative assessment of the spatiotemporal dynamics and driving forces of natural and constructed wetlands in arid and semiarid areas of northern China. Land 2023, 12, 1980. [Google Scholar] [CrossRef]
  51. Jiao, A.Y.; Xu, J.; Deng, M.J.; Ling, H.B. How does ecological water conveyance promote the improvement of habitat quality in the lower reaches of inland rivers in arid regions? A ‘past-future’ perspective. J. Clean. Prod. 2025, 502, 145374. [Google Scholar] [CrossRef]
  52. Xi, H.Y.; Feng, Q.; Si, J.H.; Chang, Z.Q.; Cao, S.K. Impacts of river recharge on groundwater level and hydrochemistry in the lower reaches of Heihe River Watershed, northwestern China. Hydrogeol. J. 2010, 18, 791–801. [Google Scholar] [CrossRef]
  53. Chen, Y.N.; Chen, Y.P.; Zhu, C.G.; Wang, Y.; Hao, X.M. Ecohydrological effects of water conveyance in a disconnected river in an arid inland river basin. Sci. Rep. 2022, 12, 14524. [Google Scholar] [CrossRef]
  54. Xia, Q.Q.; Chen, Y.N.; Zhang, X.Q.; Ding, J.L.; Lv, G.H. Identifying reservoirs and estimating evaporation losses in a large arid inland basin in Northwestern China. Remote Sens. 2022, 14, 5105. [Google Scholar] [CrossRef]
  55. Wang, C.Y.; Liu, S.H.; Zhou, S.; Zhou, J.; Jiang, S.C.; Zhang, Y.K.; Feng, T.T.; Zhang, H.L.; Zhao, Y.H.; Lai, Z.Q.; et al. Spatial-temporal patterns of urban expansion by land use/land cover transfer in China. Ecol. Indic. 2023, 155, 111009. [Google Scholar] [CrossRef]
  56. Mohammed, R.; Scholz, M. Adaptation strategy to mitigate the impact of climate change on water resources in arid and semi-arid regions: A case study. Water Resour. Manag. 2017, 31, 3557–3573. [Google Scholar] [CrossRef]
Figure 1. Location of Xinjiang.
Land 14 01889 g001
Figure 2. Spatial changes in wetlands in Xinjiang in 2023 (a); expansion and contraction of wetland areas from 1990 to 2023 (b); changes in total wetland area and different types of wetlands in Xinjiang (c); the gray vertical line indicates that a significant inflection point has emerged in the trend of wetland area changes in that year. The green dotted line indicates that the wetland area is on the rise at this stage, and the red dotted line indicates that the wetland area is in a downward trend at this stage.
Land 14 01889 g002
Figure 3. Land use conversion of different wetland types in Xinjiang from 1990 to 2023.
Land 14 01889 g003
Figure 4. Spatial changes in wetlands in different regions of Xinjiang in 1990 and 2023 (a); proportions of areas composed of wetlands in different regions (b); changes in areas of different wetland types in different regions of Xinjiang (c) (BJ represents northern Xinjiang, DJ represents eastern Xinjiang, and NJ represents southern Xinjiang).
Land 14 01889 g004
Figure 5. Six landscape-level indicators for different wetland types in Xinjiang from 1990 to 2023 (AI represents aggregation index, LSI represents landscape shape index, NP represents number of patches, LPI represents largest patch index, COHESION represents patch cohesion, and PD represents patch density).
Land 14 01889 g005
Figure 6. Spatial distribution of habitats in Xinjiang and changes in wetland habitat quality index from 1990 to 2023.
Land 14 01889 g006
Figure 7. Analysis of driving factors for changes in various wetland types in Xinjiang from 1990 to 2023 (PRE represents precipitation, TEM represents temperature, SR represents surface runoff, SSR represents underground runoff, and POP represents population density).
Land 14 01889 g007
Figure 8. Wetland conservation policy.
Land 14 01889 g008
Table 1. Data sources.
DataTime RangeSpatial ResolutionData Source
Elevation (DEM)201930 mASTER GDEM (http://www.geodata.cn) (accessed on 22 April 2025)
Temperature (TEM), precipitation (PRE)1990–20234 kmTerra Climate Dataset (http://www.climatologylab.org/) (accessed on 30 April 2025)
Surface runoff (SR), subsurface runoff (SSR)1990–20230.1°FLDAS Dataset (https://disc.gsfc.nasa.gov/datasets/) (accessed on 13 May 2025)
Population (POP)1990–20231 km1990–2000: Resource and Environmental Science Data Center (RESDC), Chinese Academy of Sciences (http://www.resdc.cn/) (accessed on 20 May 2025) 2000–2023: Global Population Distribution Data, LandScan (https://landscan.ornl.gov) (accessed on 20 May 2025)
Disclaimer/Publisher’s Note: The statements, opinions and data contained in all publications are solely those of the individual author(s) and contributor(s) and not of MDPI and/or the editor(s). MDPI and/or the editor(s) disclaim responsibility for any injury to people or property resulting from any ideas, methods, instructions or products referred to in the content.