Associations Between Environmental Factors and Perceived Density of Residents in High-Density Residential Built Environment in Mountainous Cities—A Case Study of Chongqing Central Urban Area, China
Abstract
1. Introduction
1.1. Research Advances in Perceptual Density
1.1.1. Definition of Perceived Density
1.1.2. PD Measurement
1.2. Environmental Factors in High-Density Residential Built Environments of Mountainous Cities
1.3. Associations Between Sentiments of PD and Environmental Factors in RBEs
2. Materials
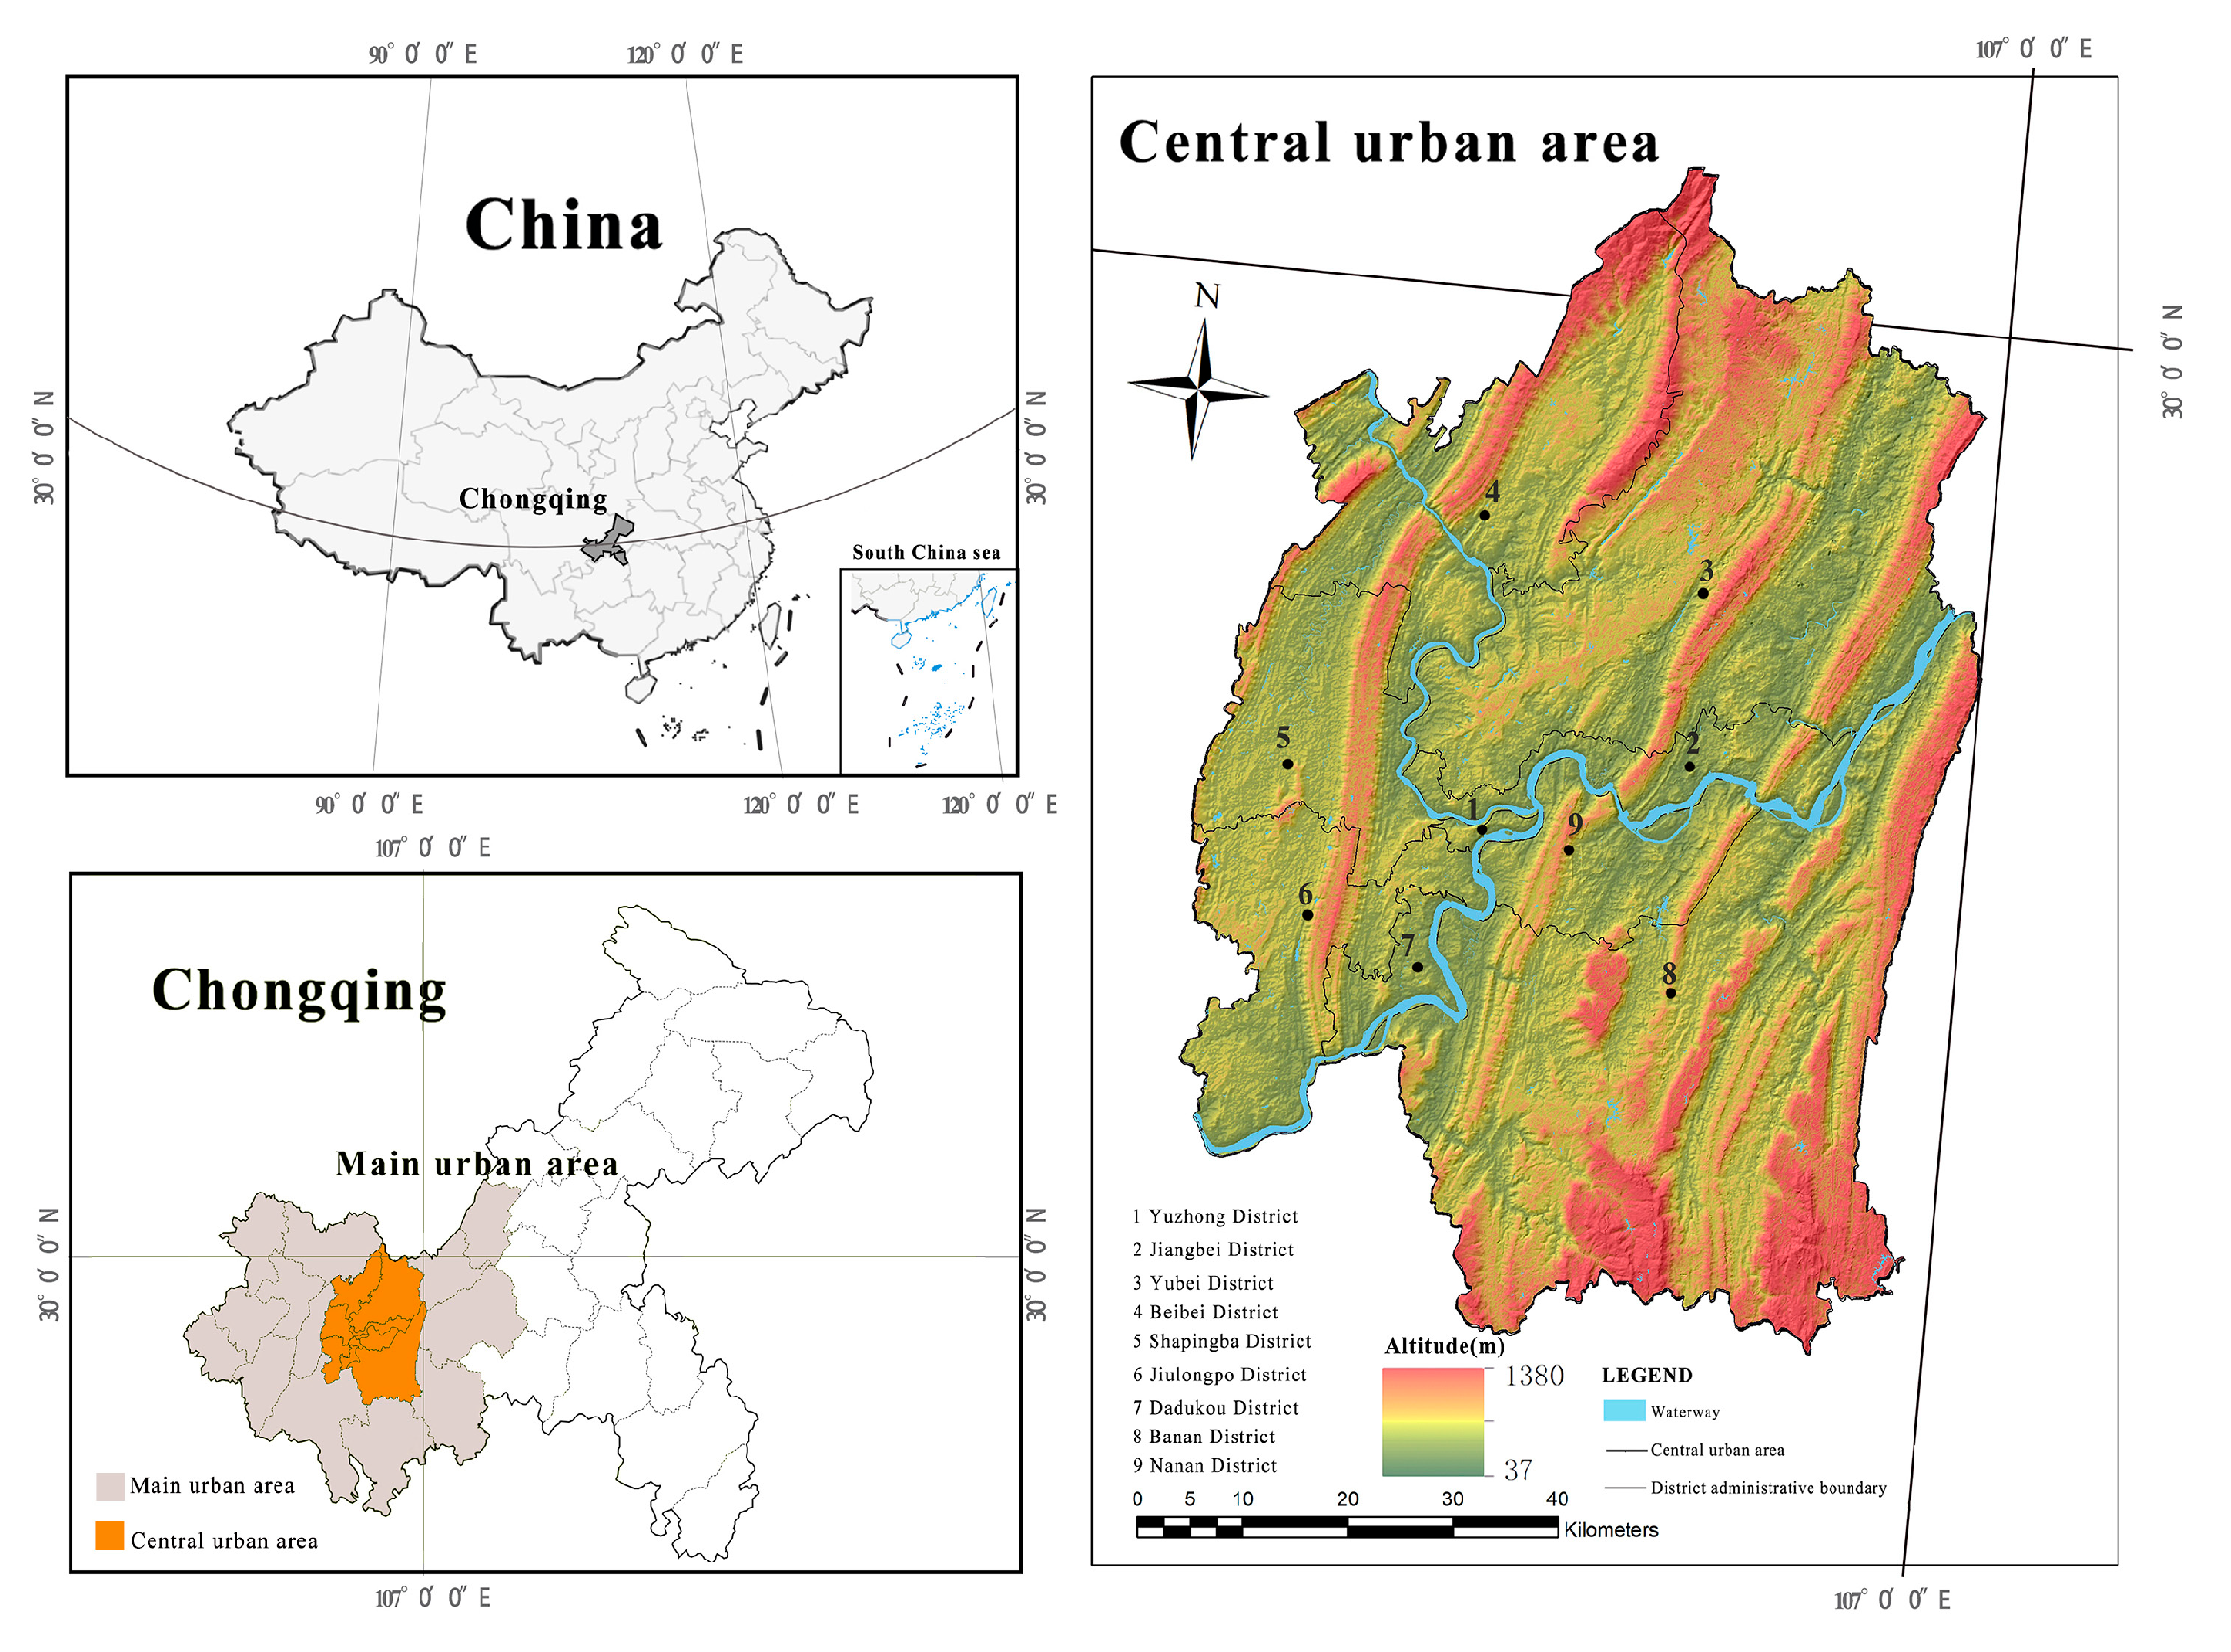
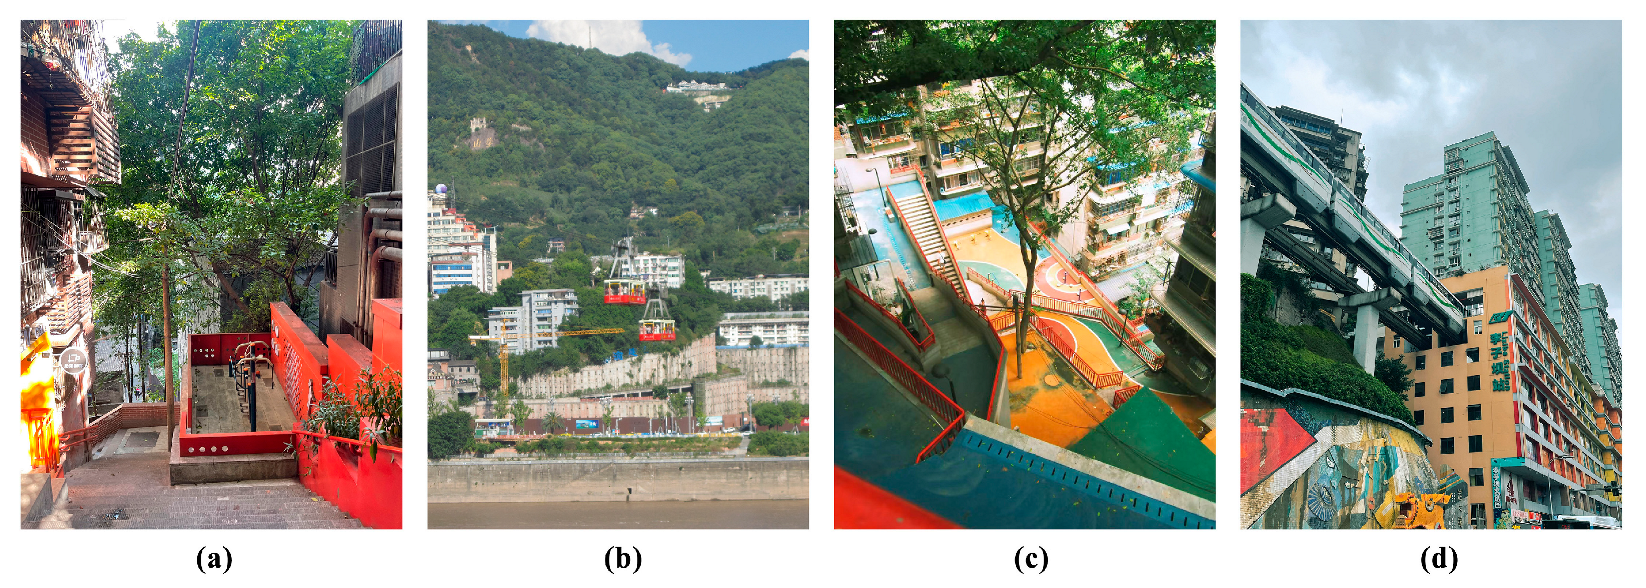
2.1. Case Study Area
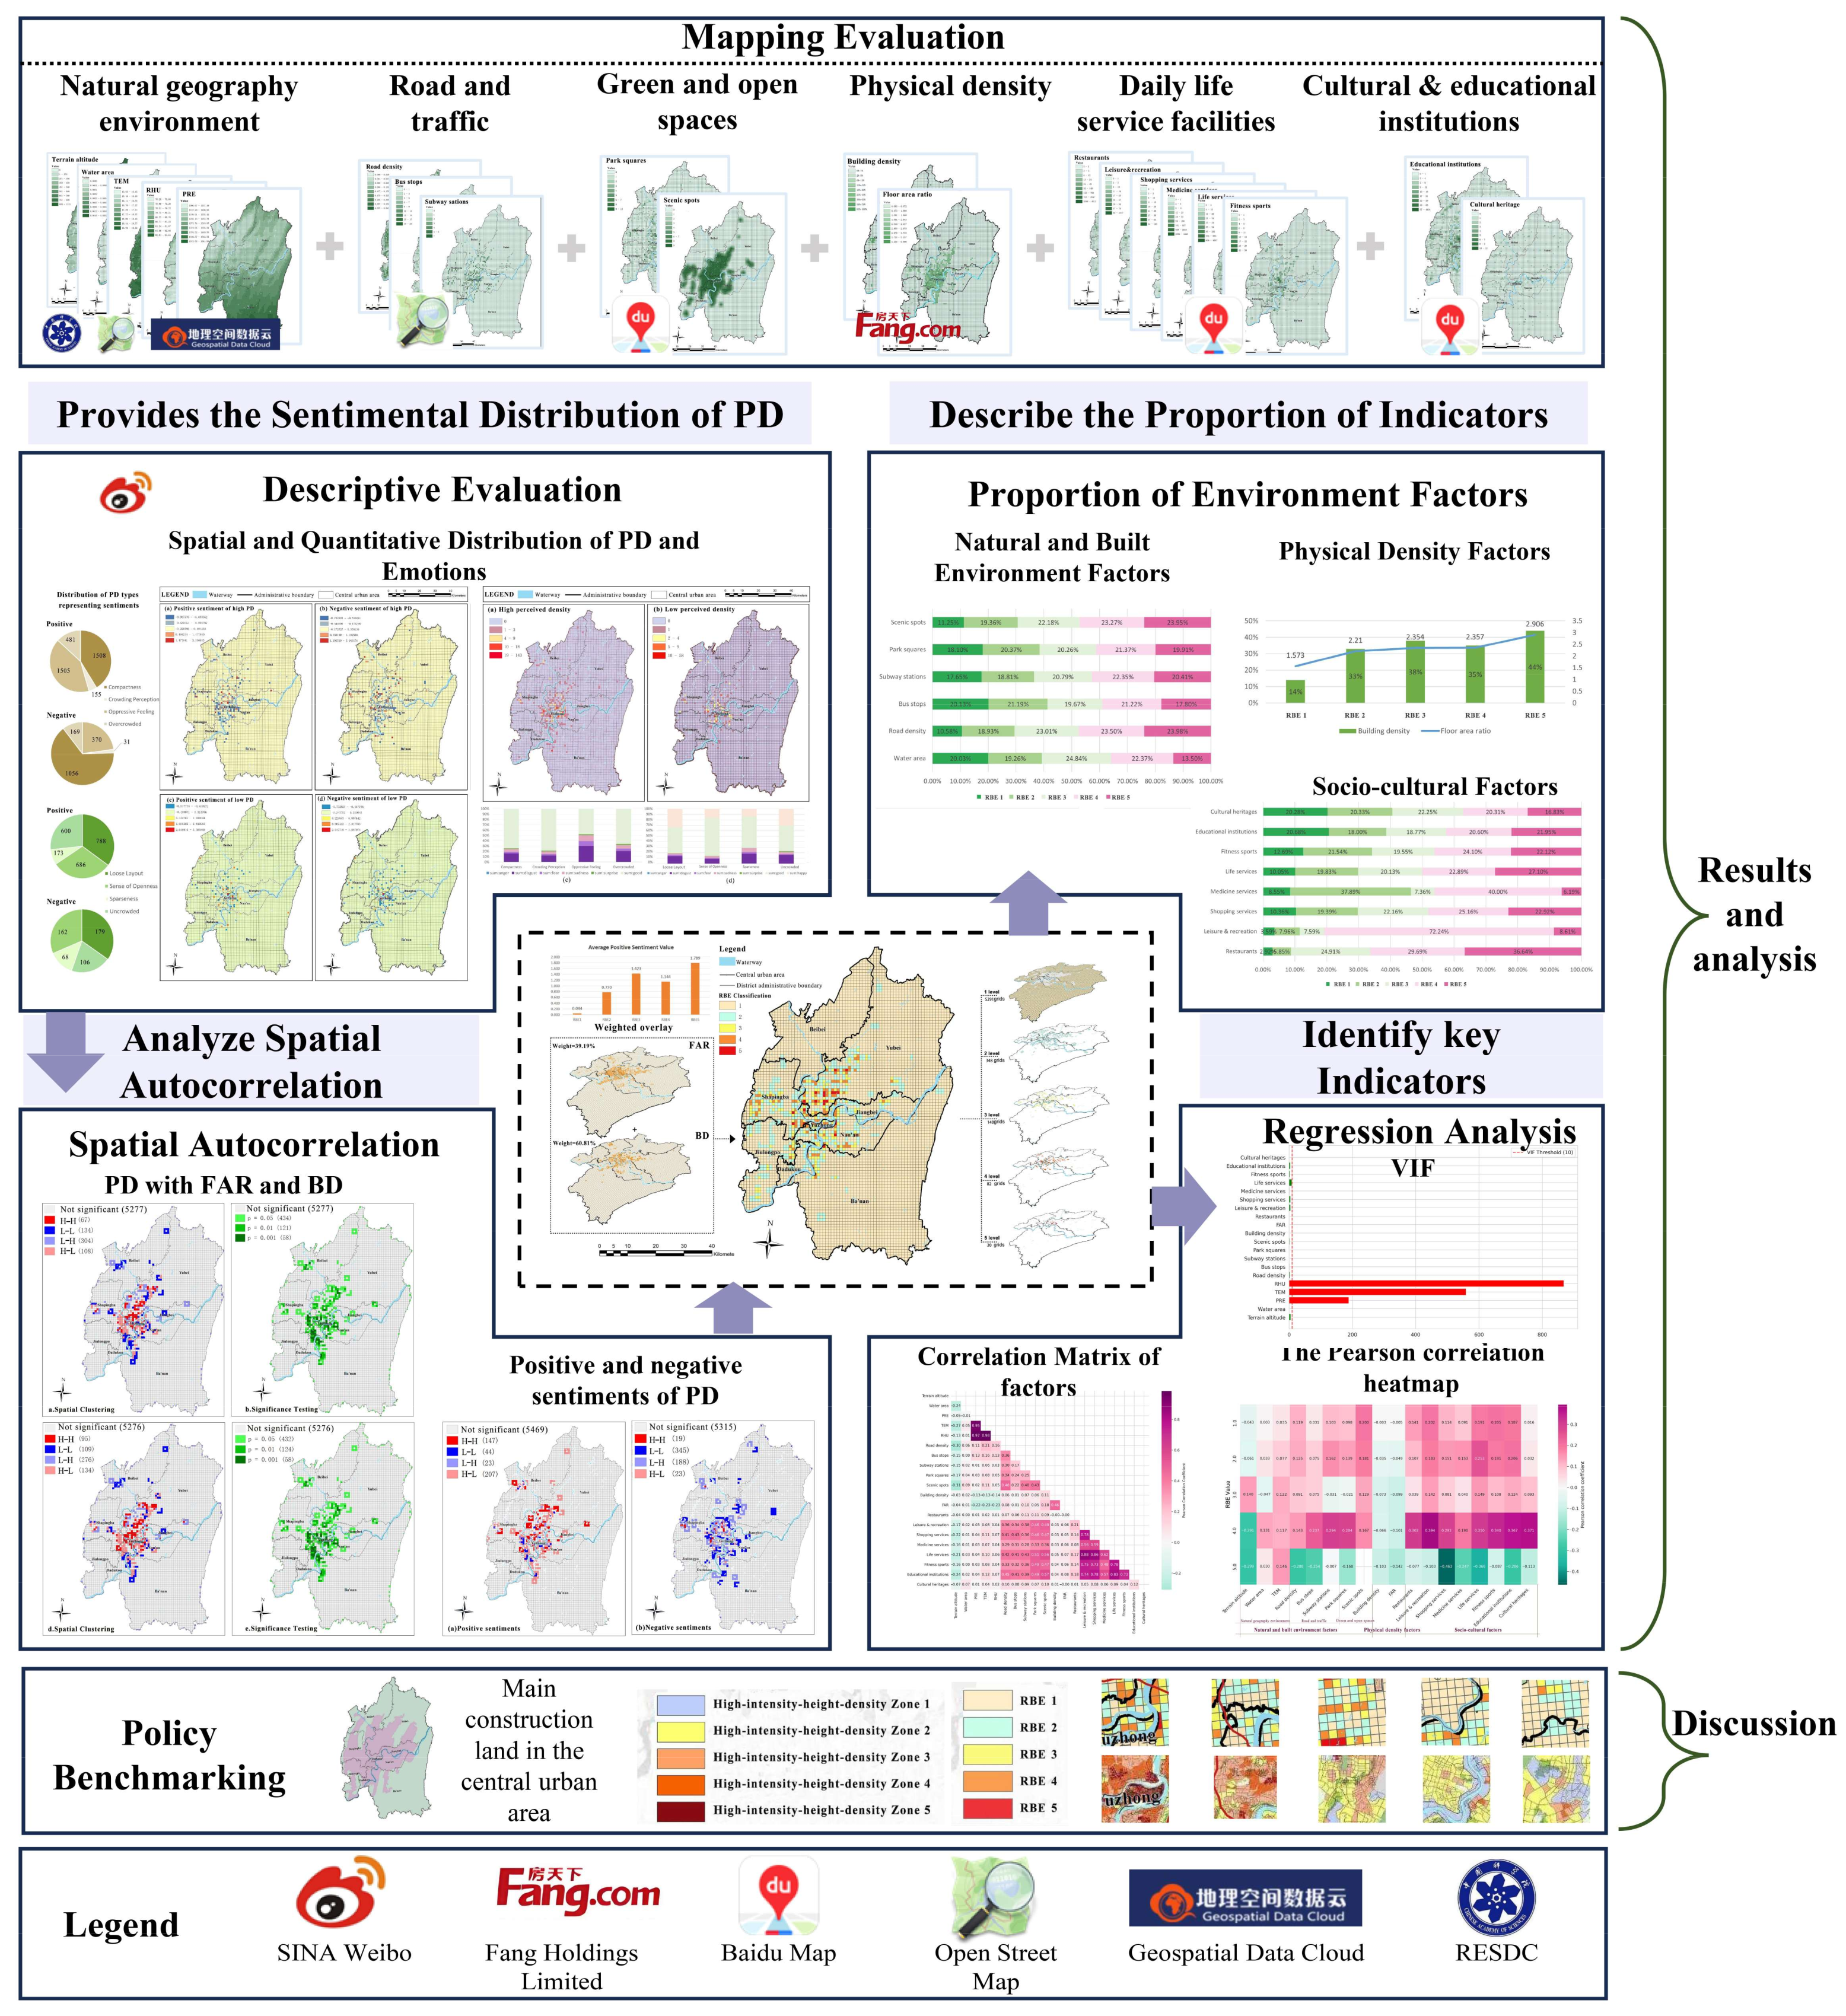
2.2. Assessment Framework
2.3. Data Preprocessing
2.4. Data Cleaning
3. Methods
3.1. PD Analysis Based on NLP and Manual Correction
3.2. Sentiments Analysis of PD Based on NLP and Sentiment Lexicon
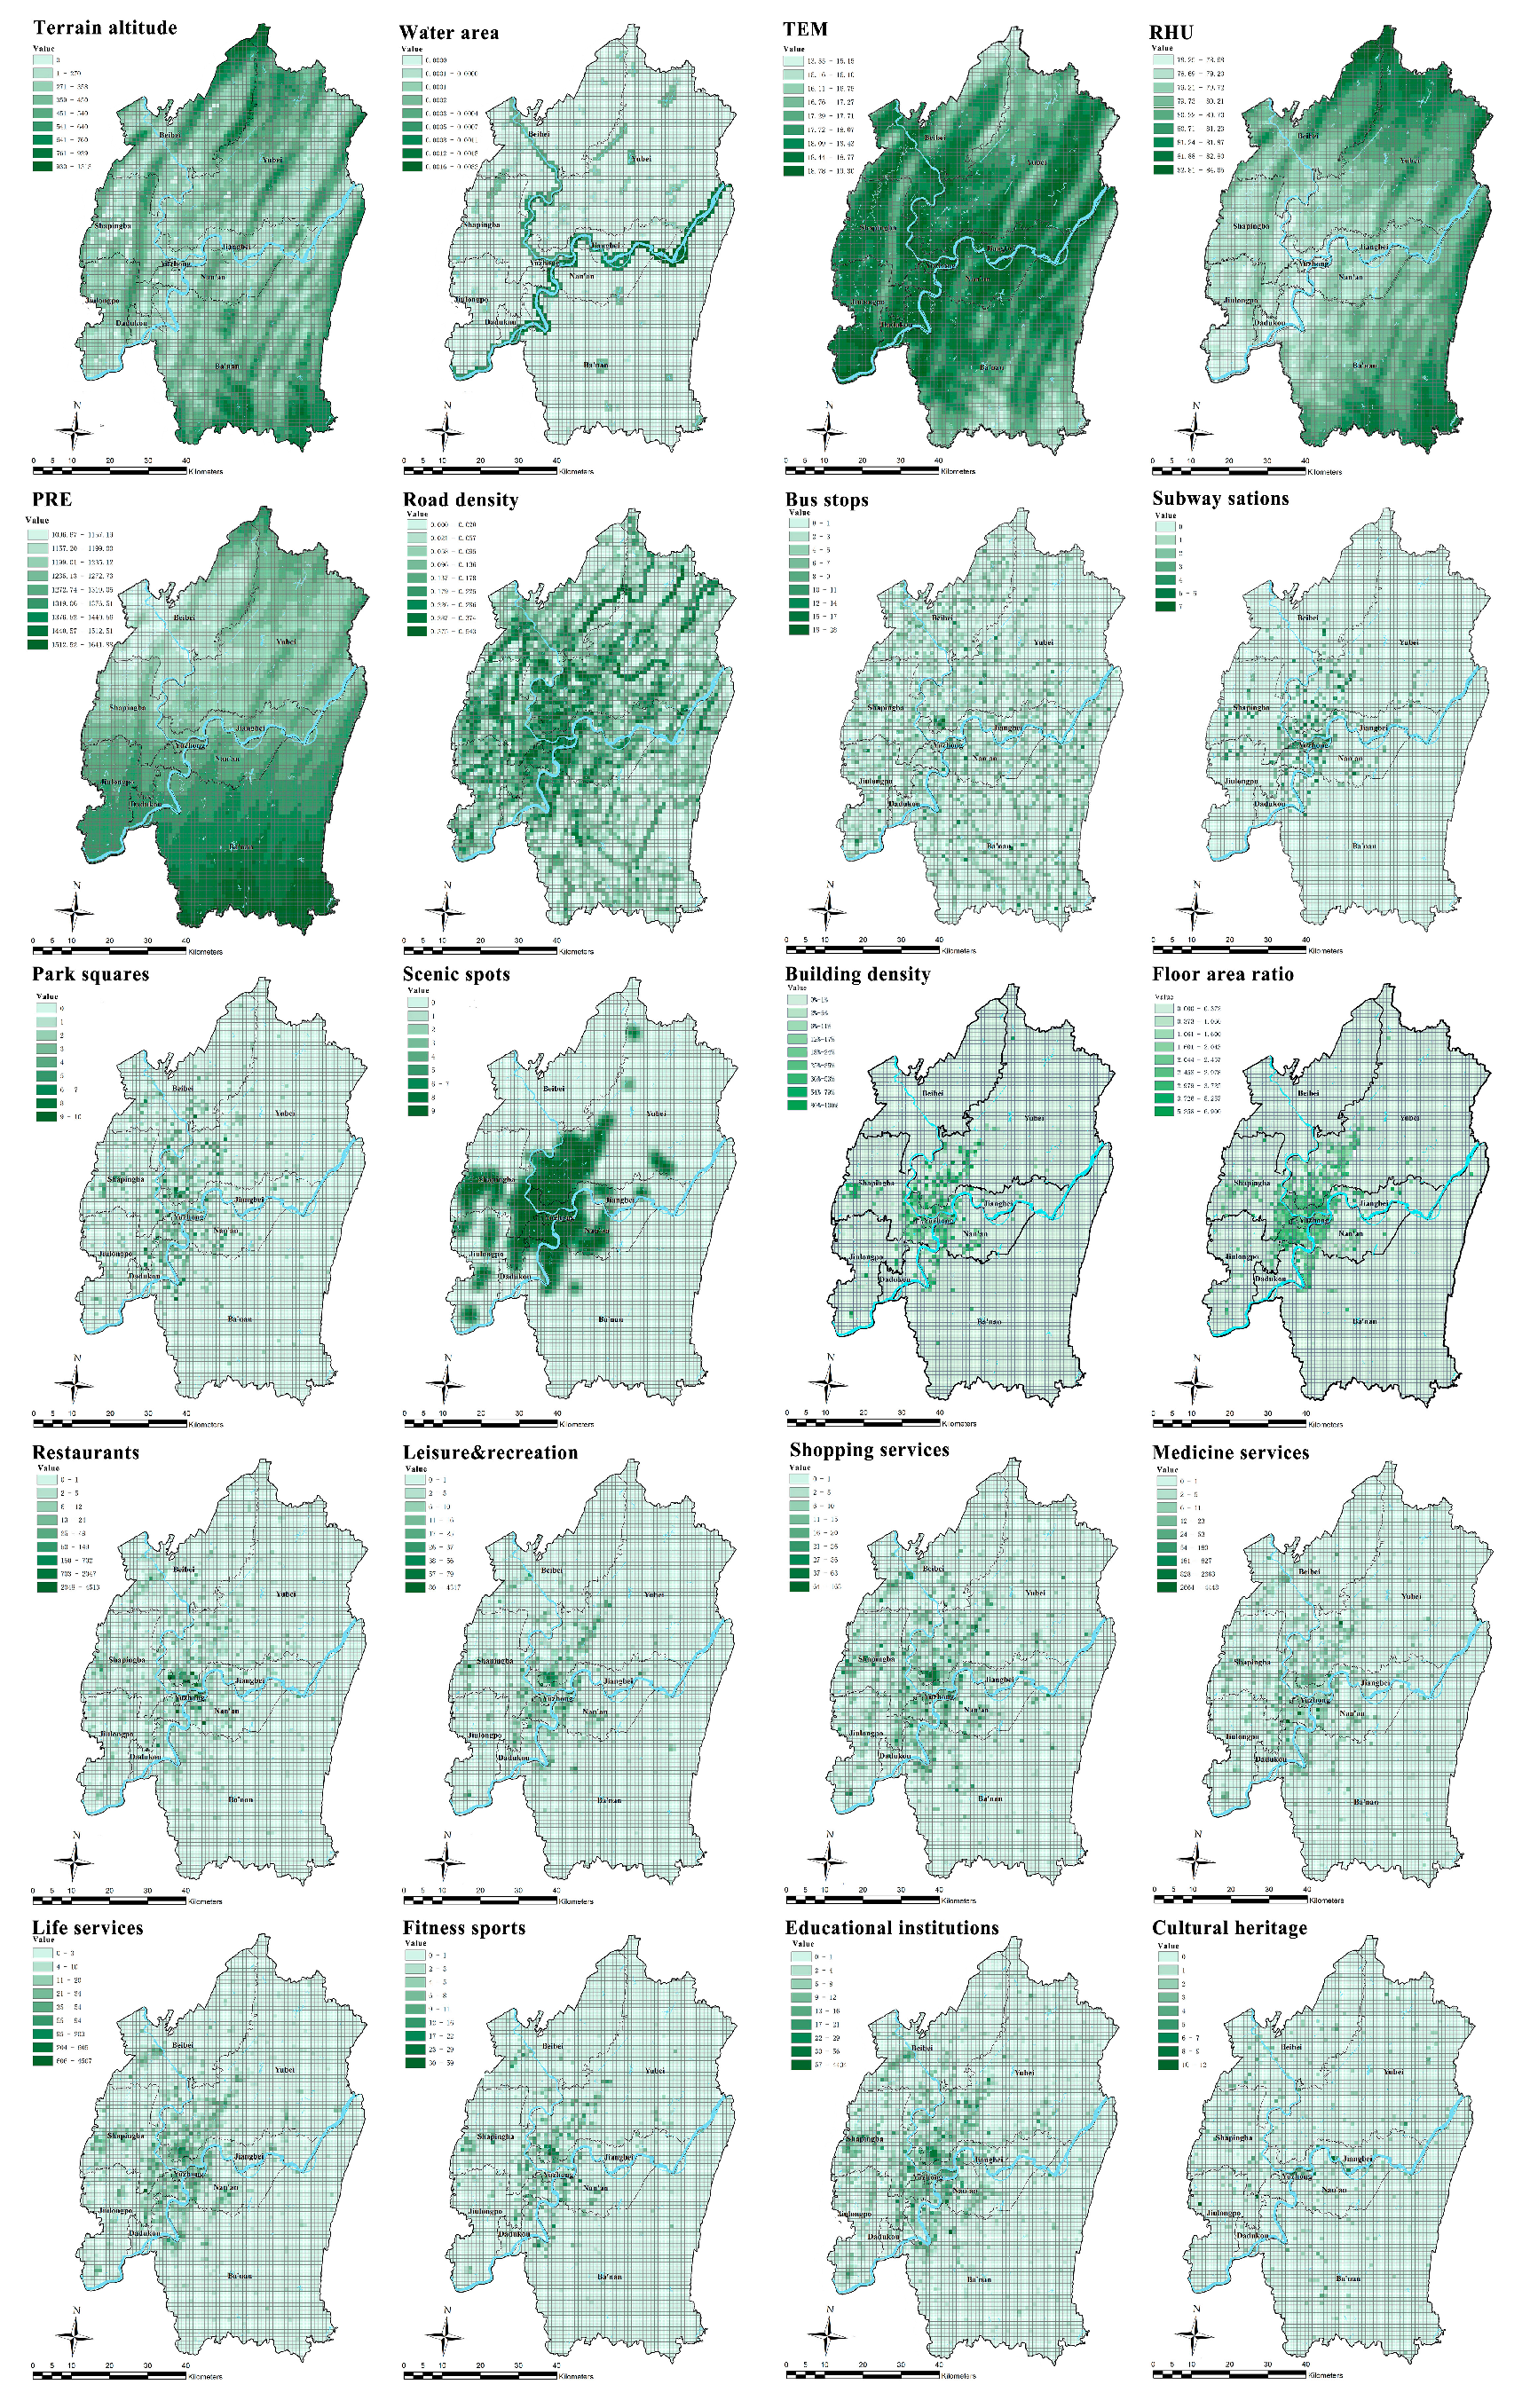
3.3. Indicator System of Environmental Factors
3.3.1. Selecting Environmental Factors
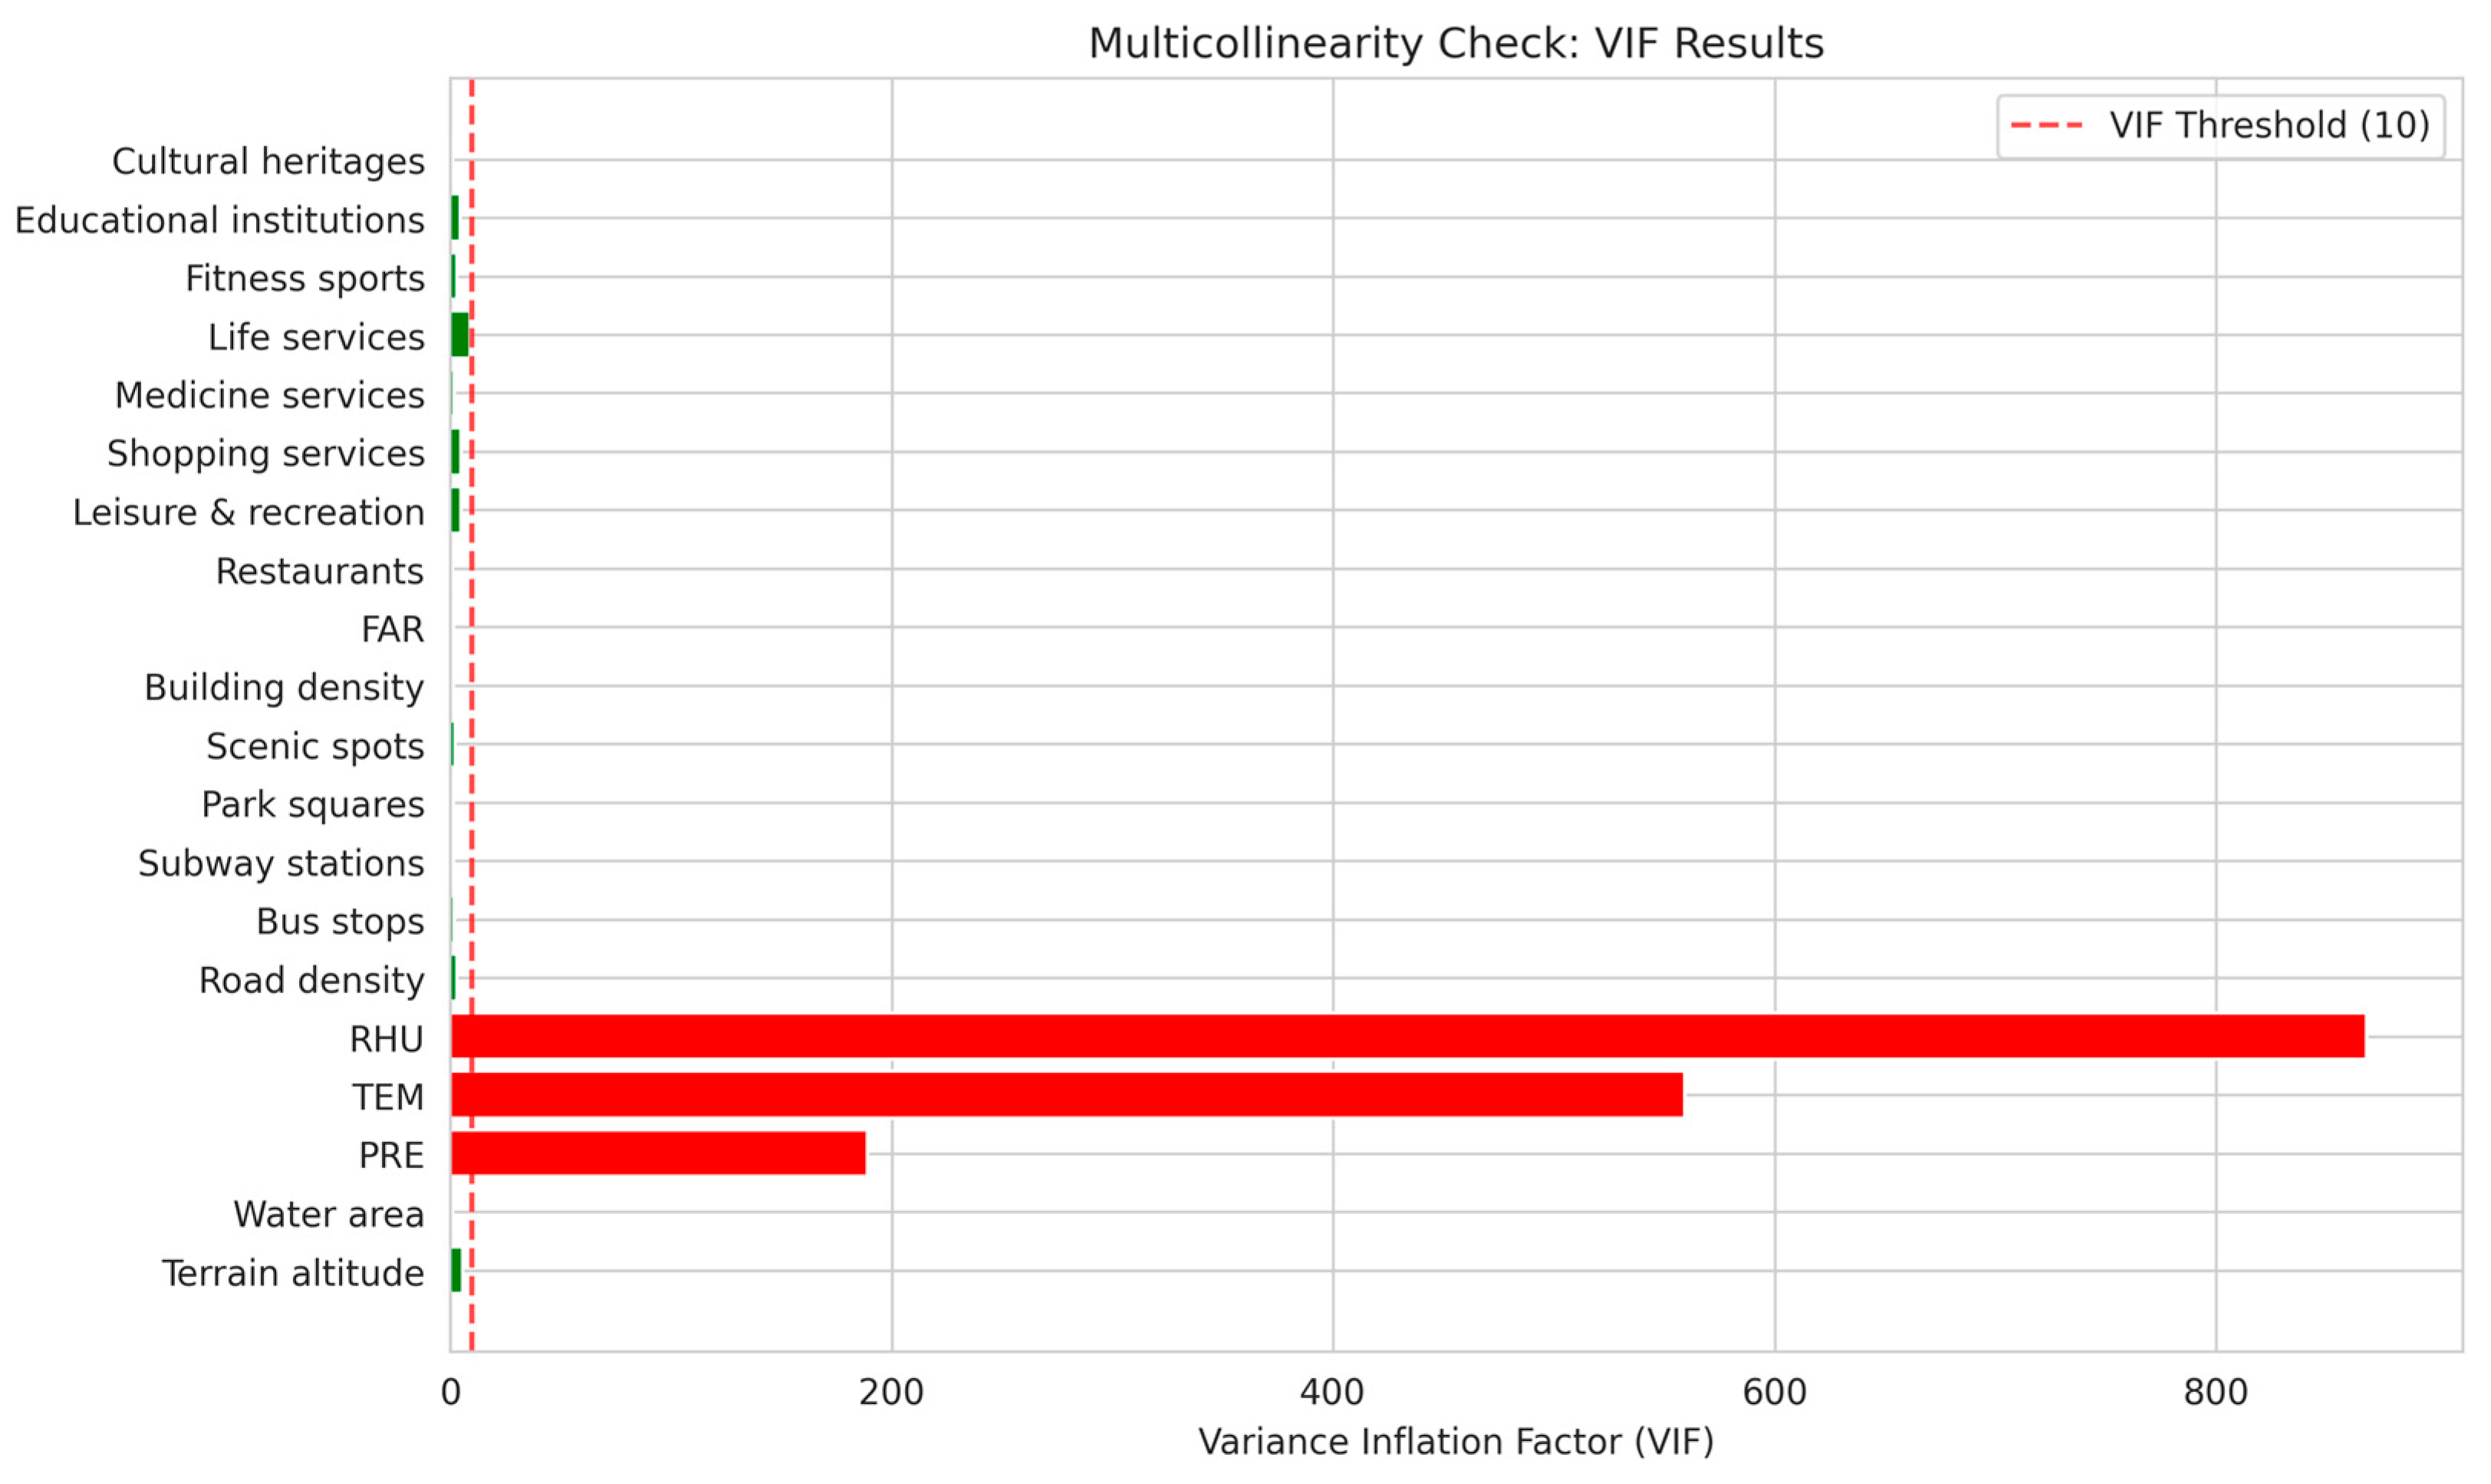
3.3.2. Avoid Multicollinearity
3.3.3. Model Architecture
4. Results
4.1. Distributions of Residents’ PD and Sentiments in the Study Area
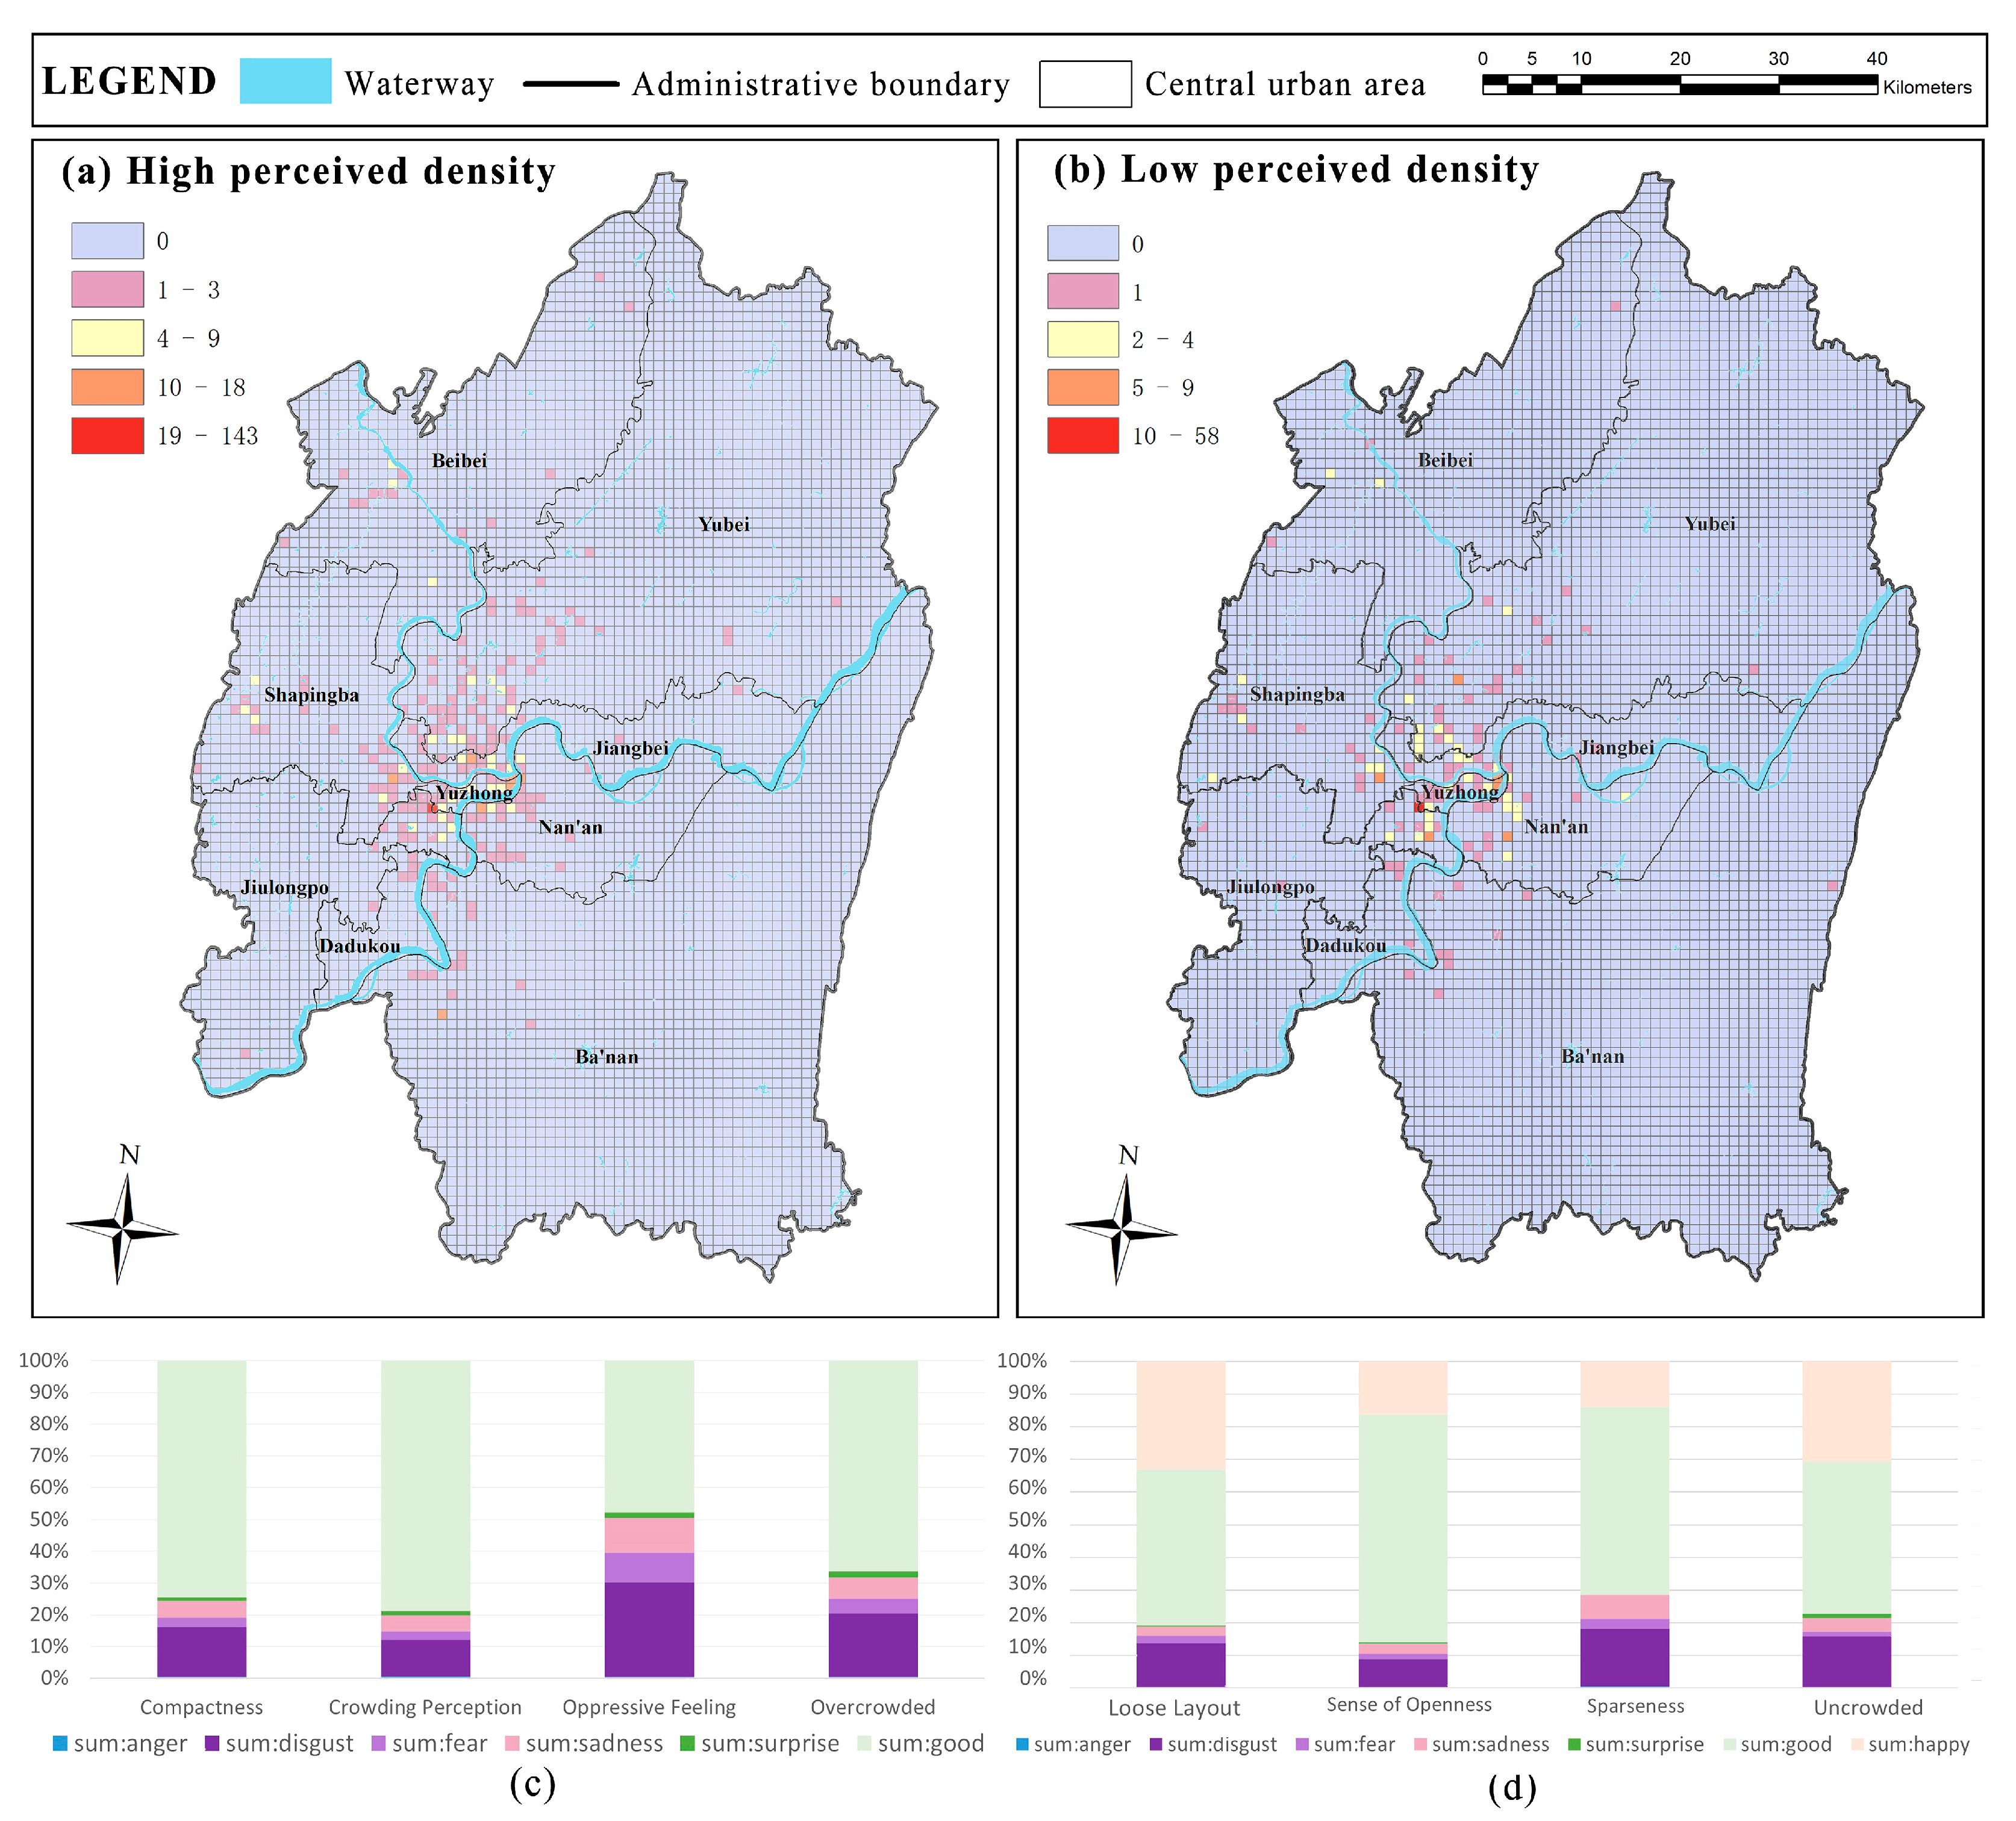
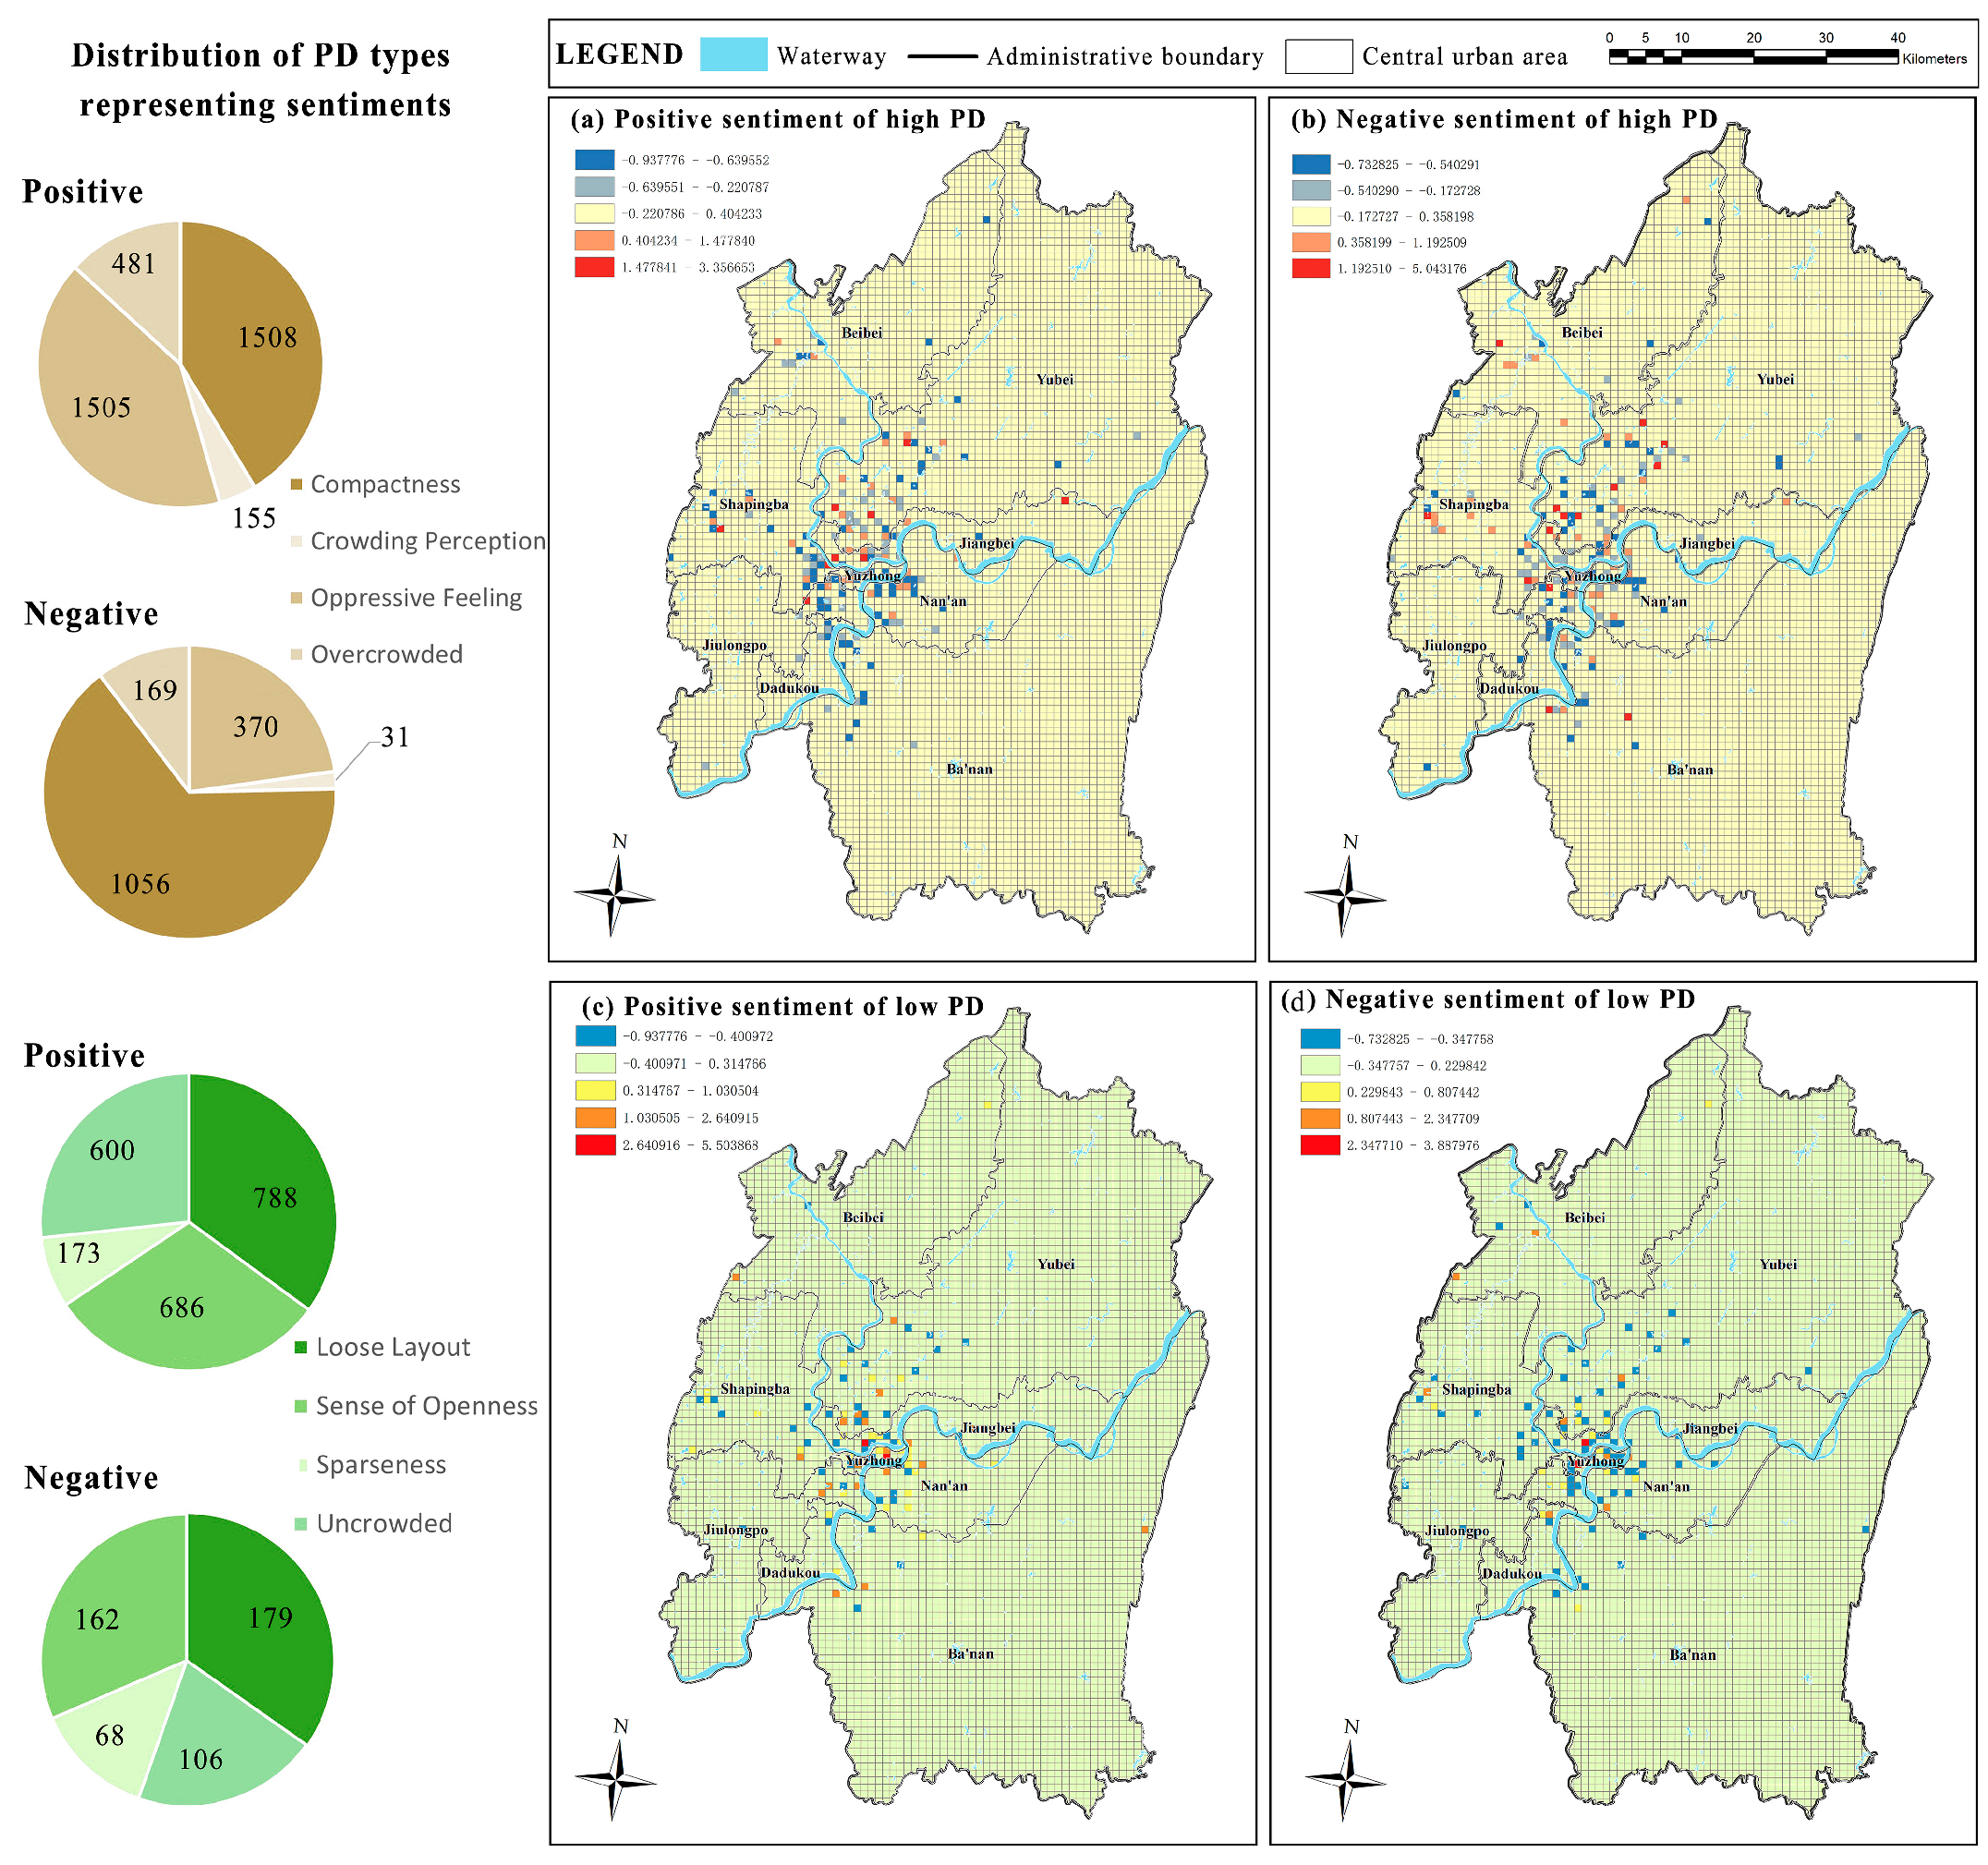
4.2. Spatial and Quantitative Distribution Characteristics of Residents’ PD and Sentiments
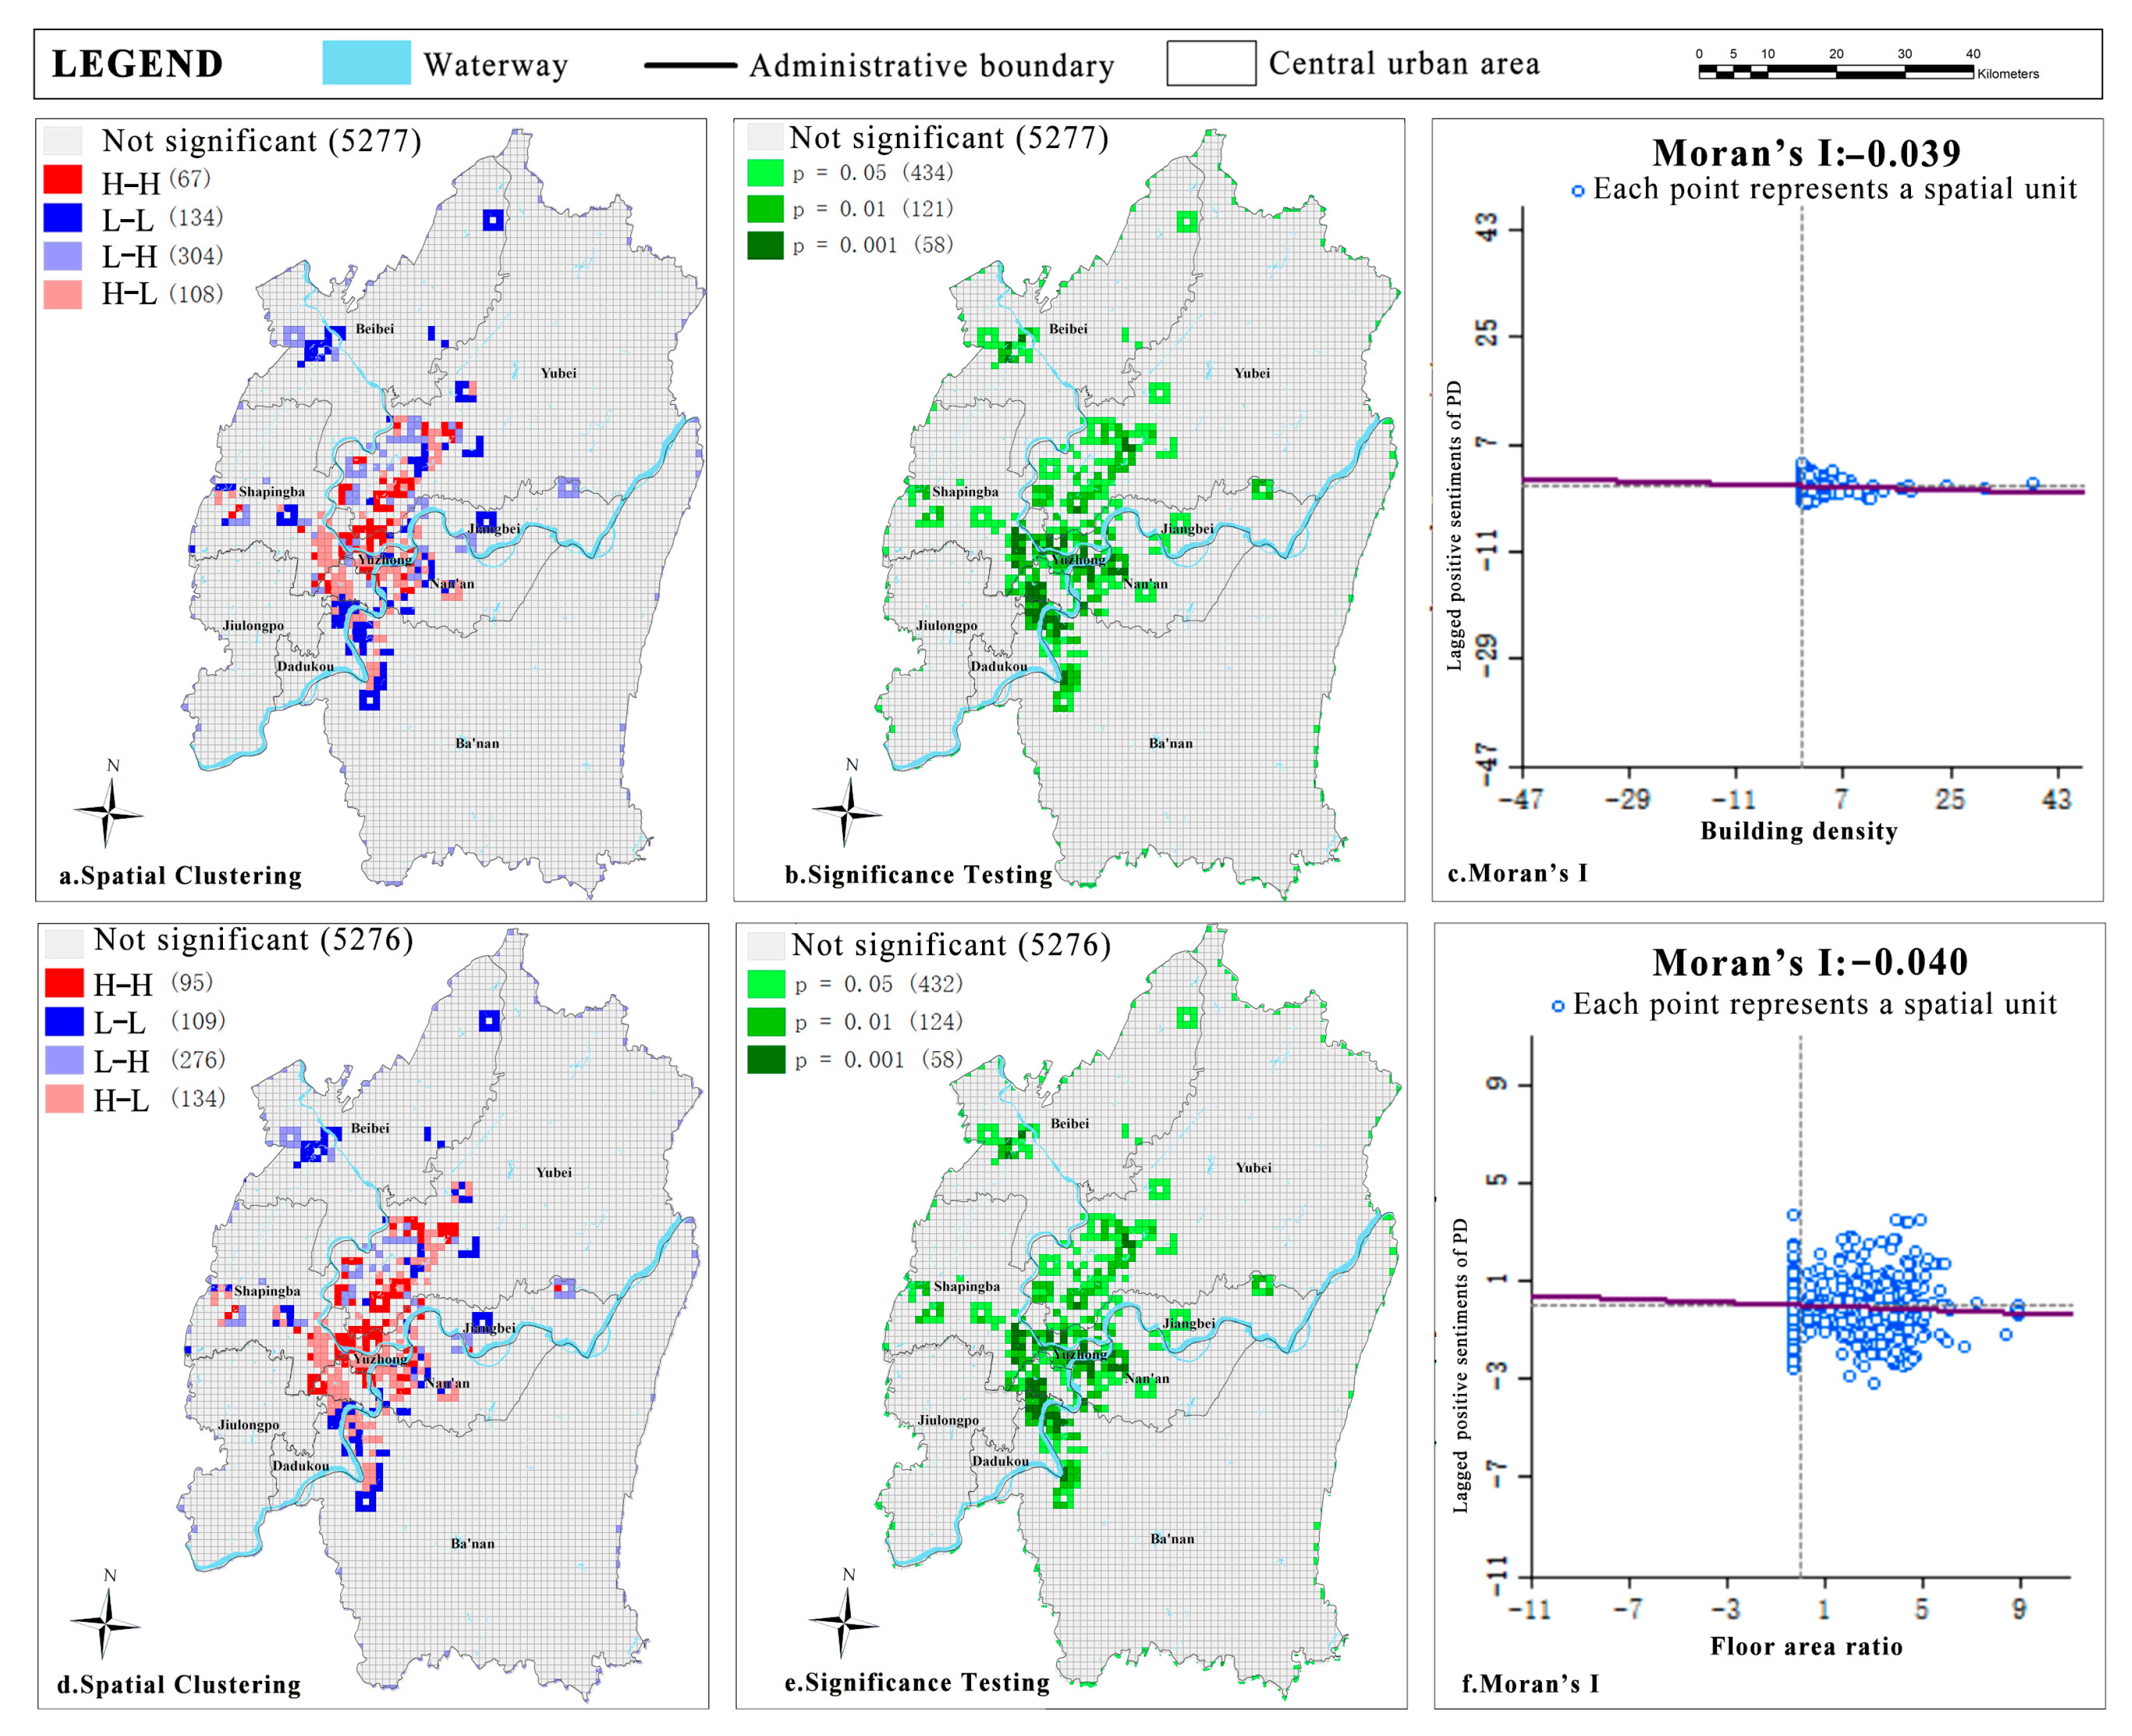
4.3. Spatial Correlation Between Residents’ Sentiments of PD and Physical Density Factors
4.3.1. Sentimental Univariate Local Spatial Autocorrelation of PD
4.3.2. Bivariate Spatial Autocorrelation Analysis Between Sentiment of PD and Physical Density
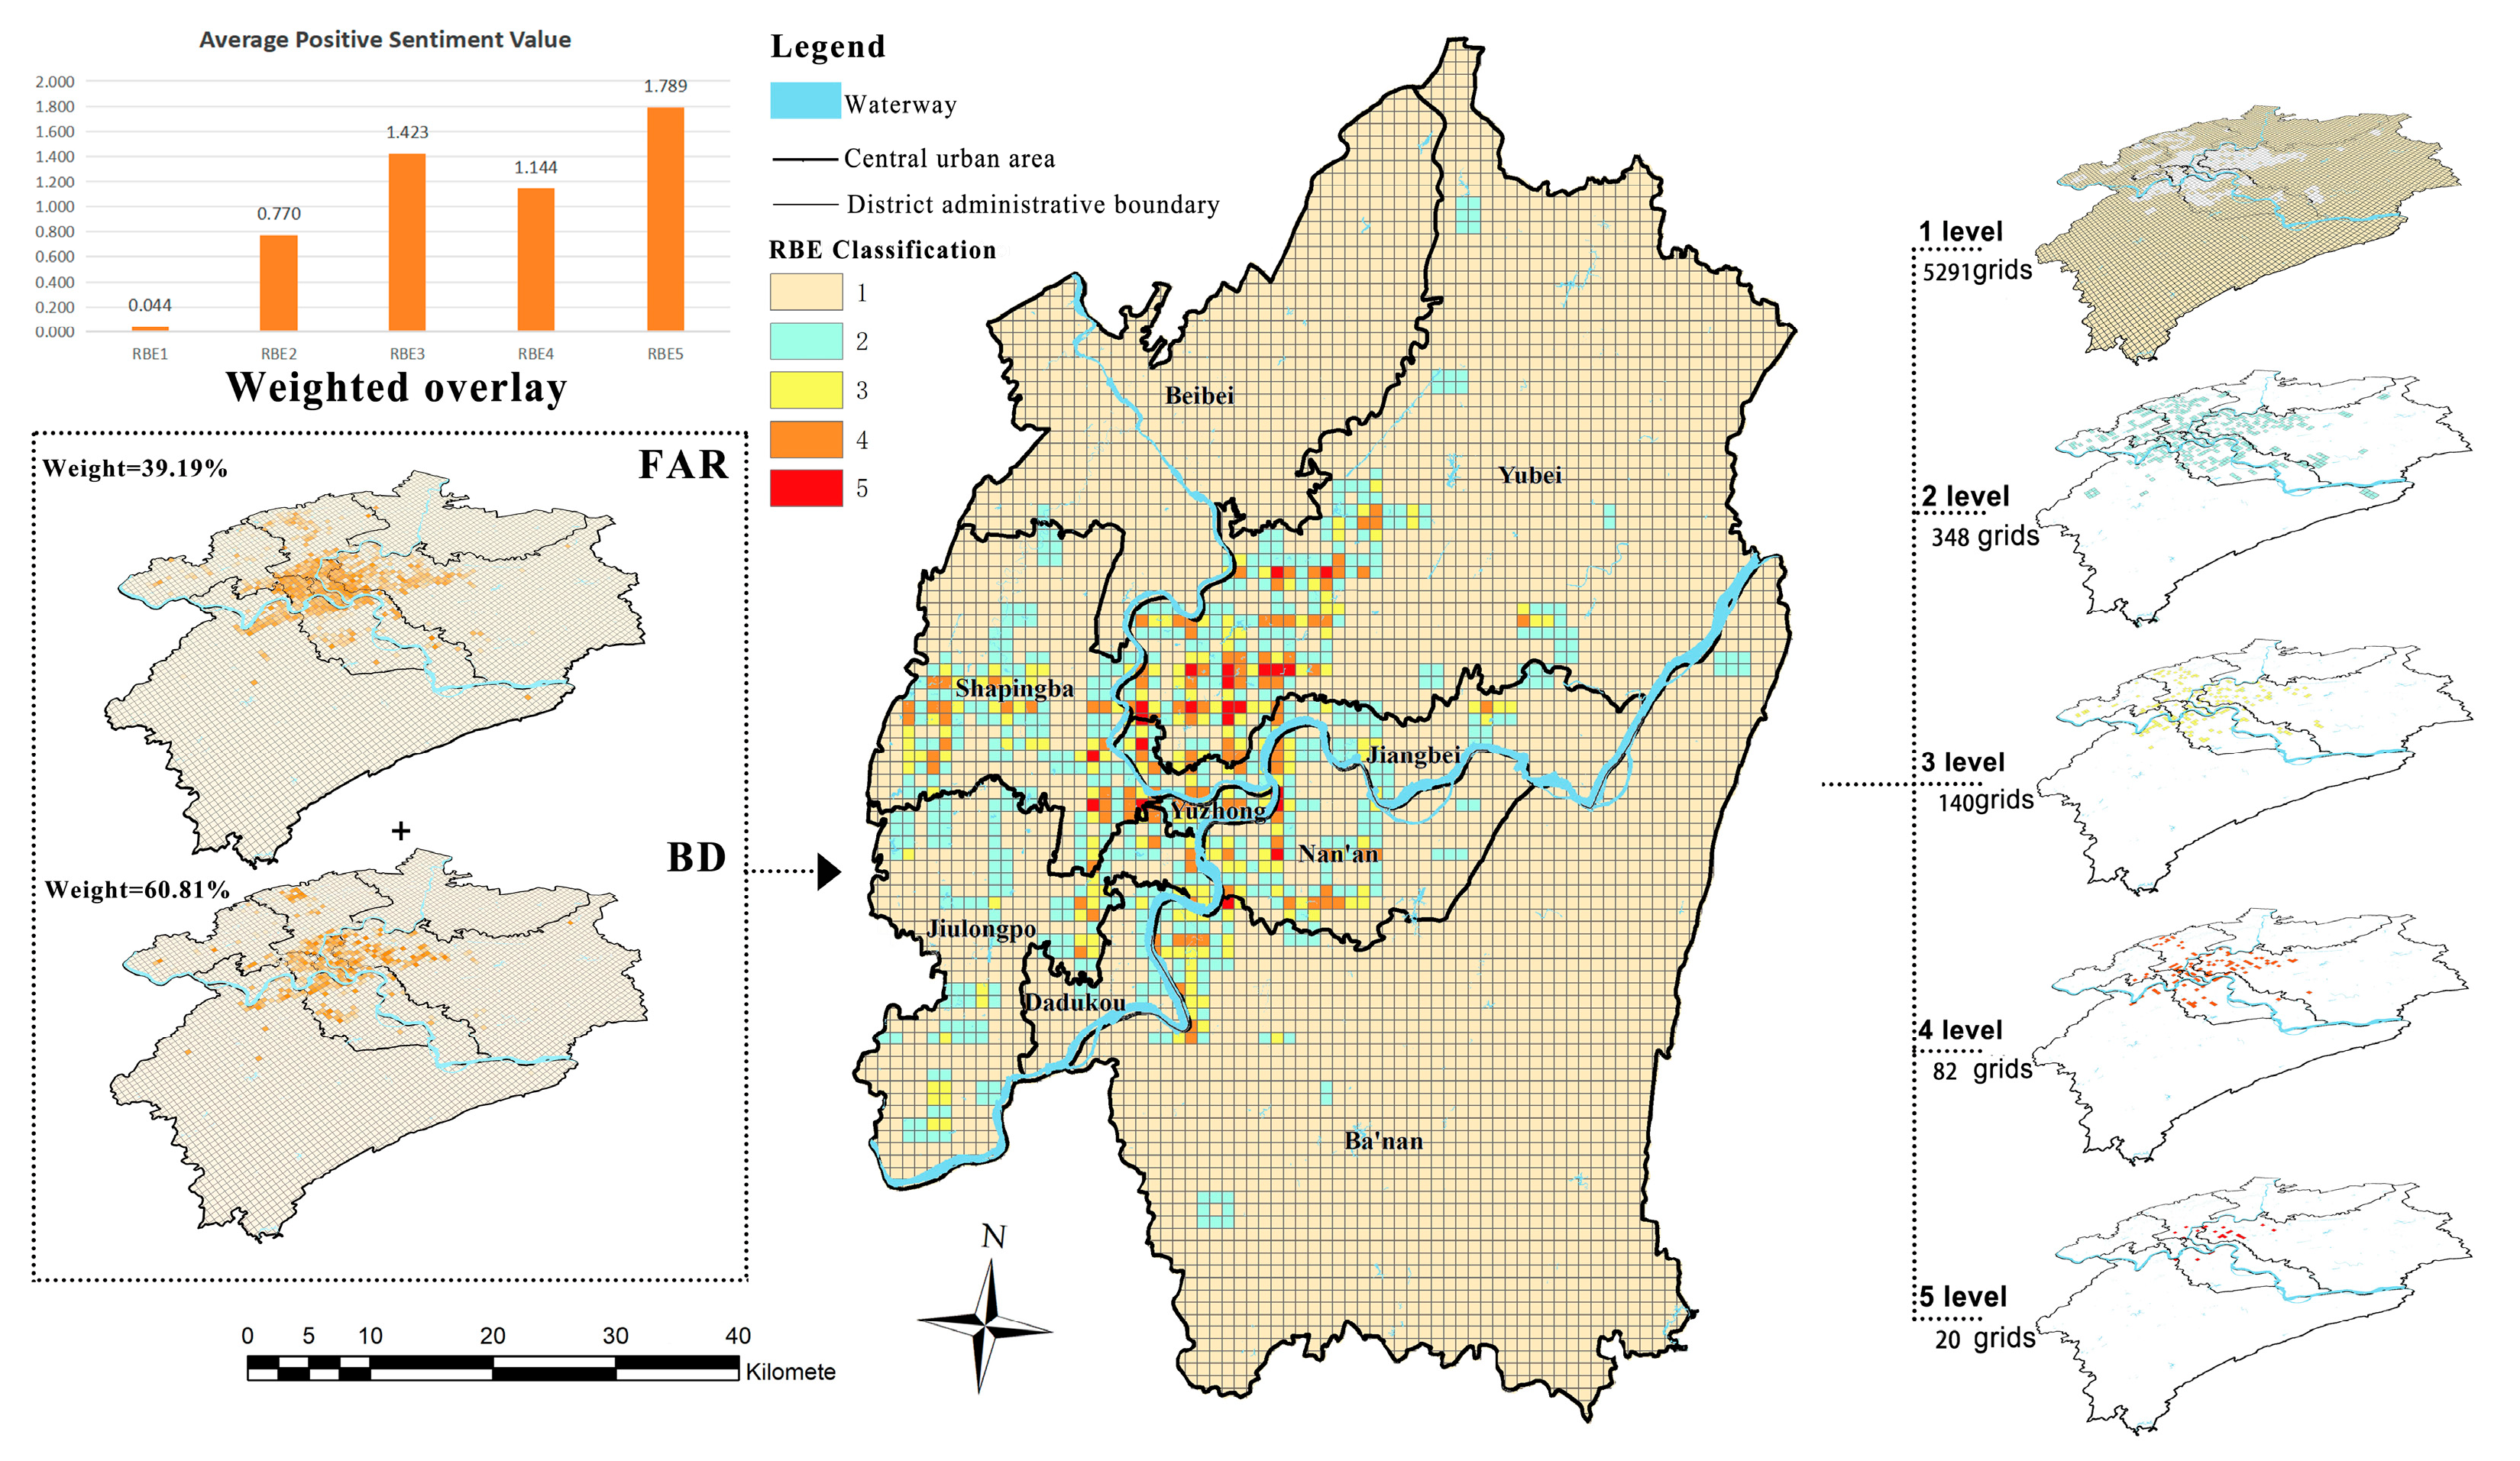
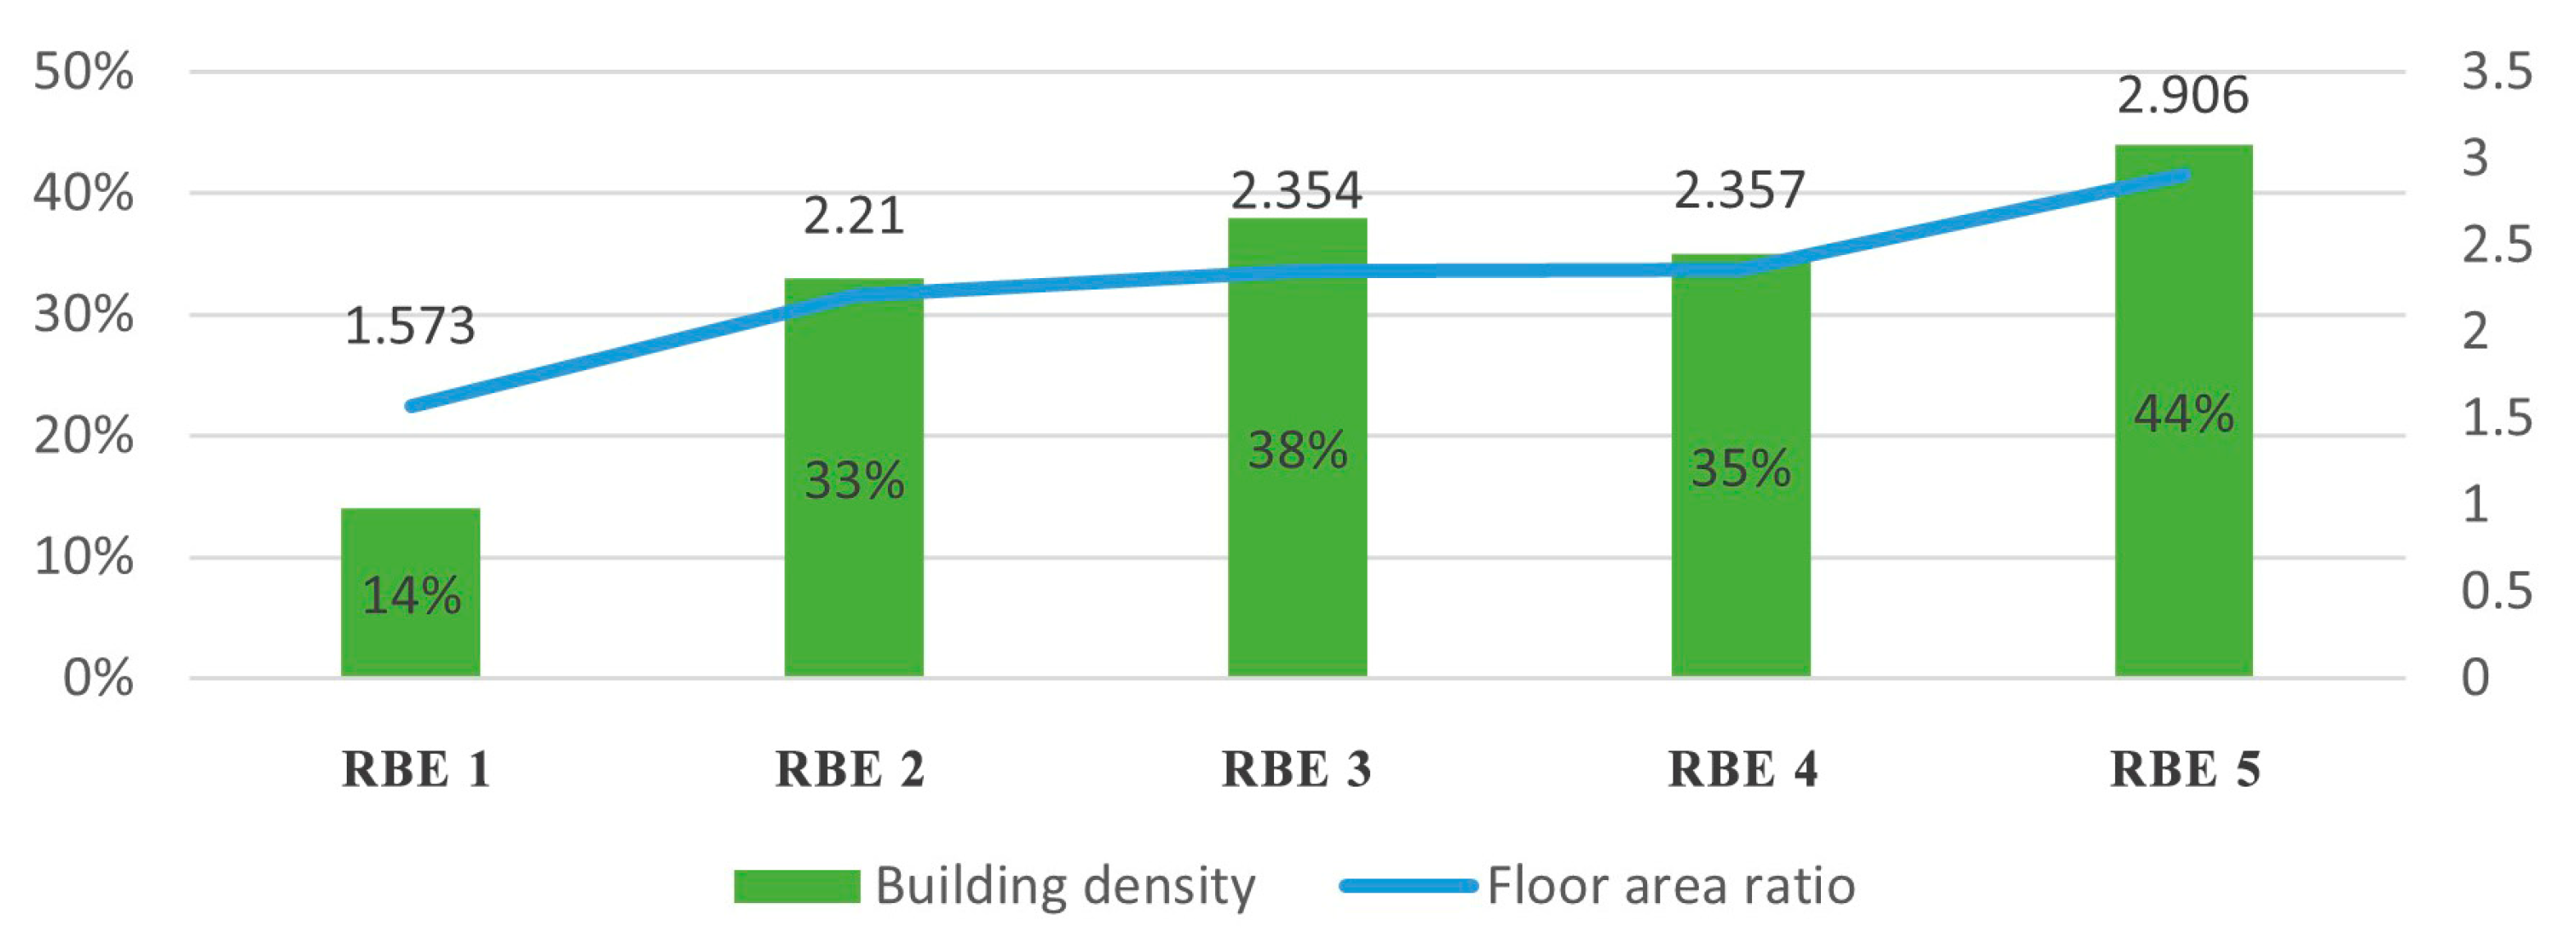
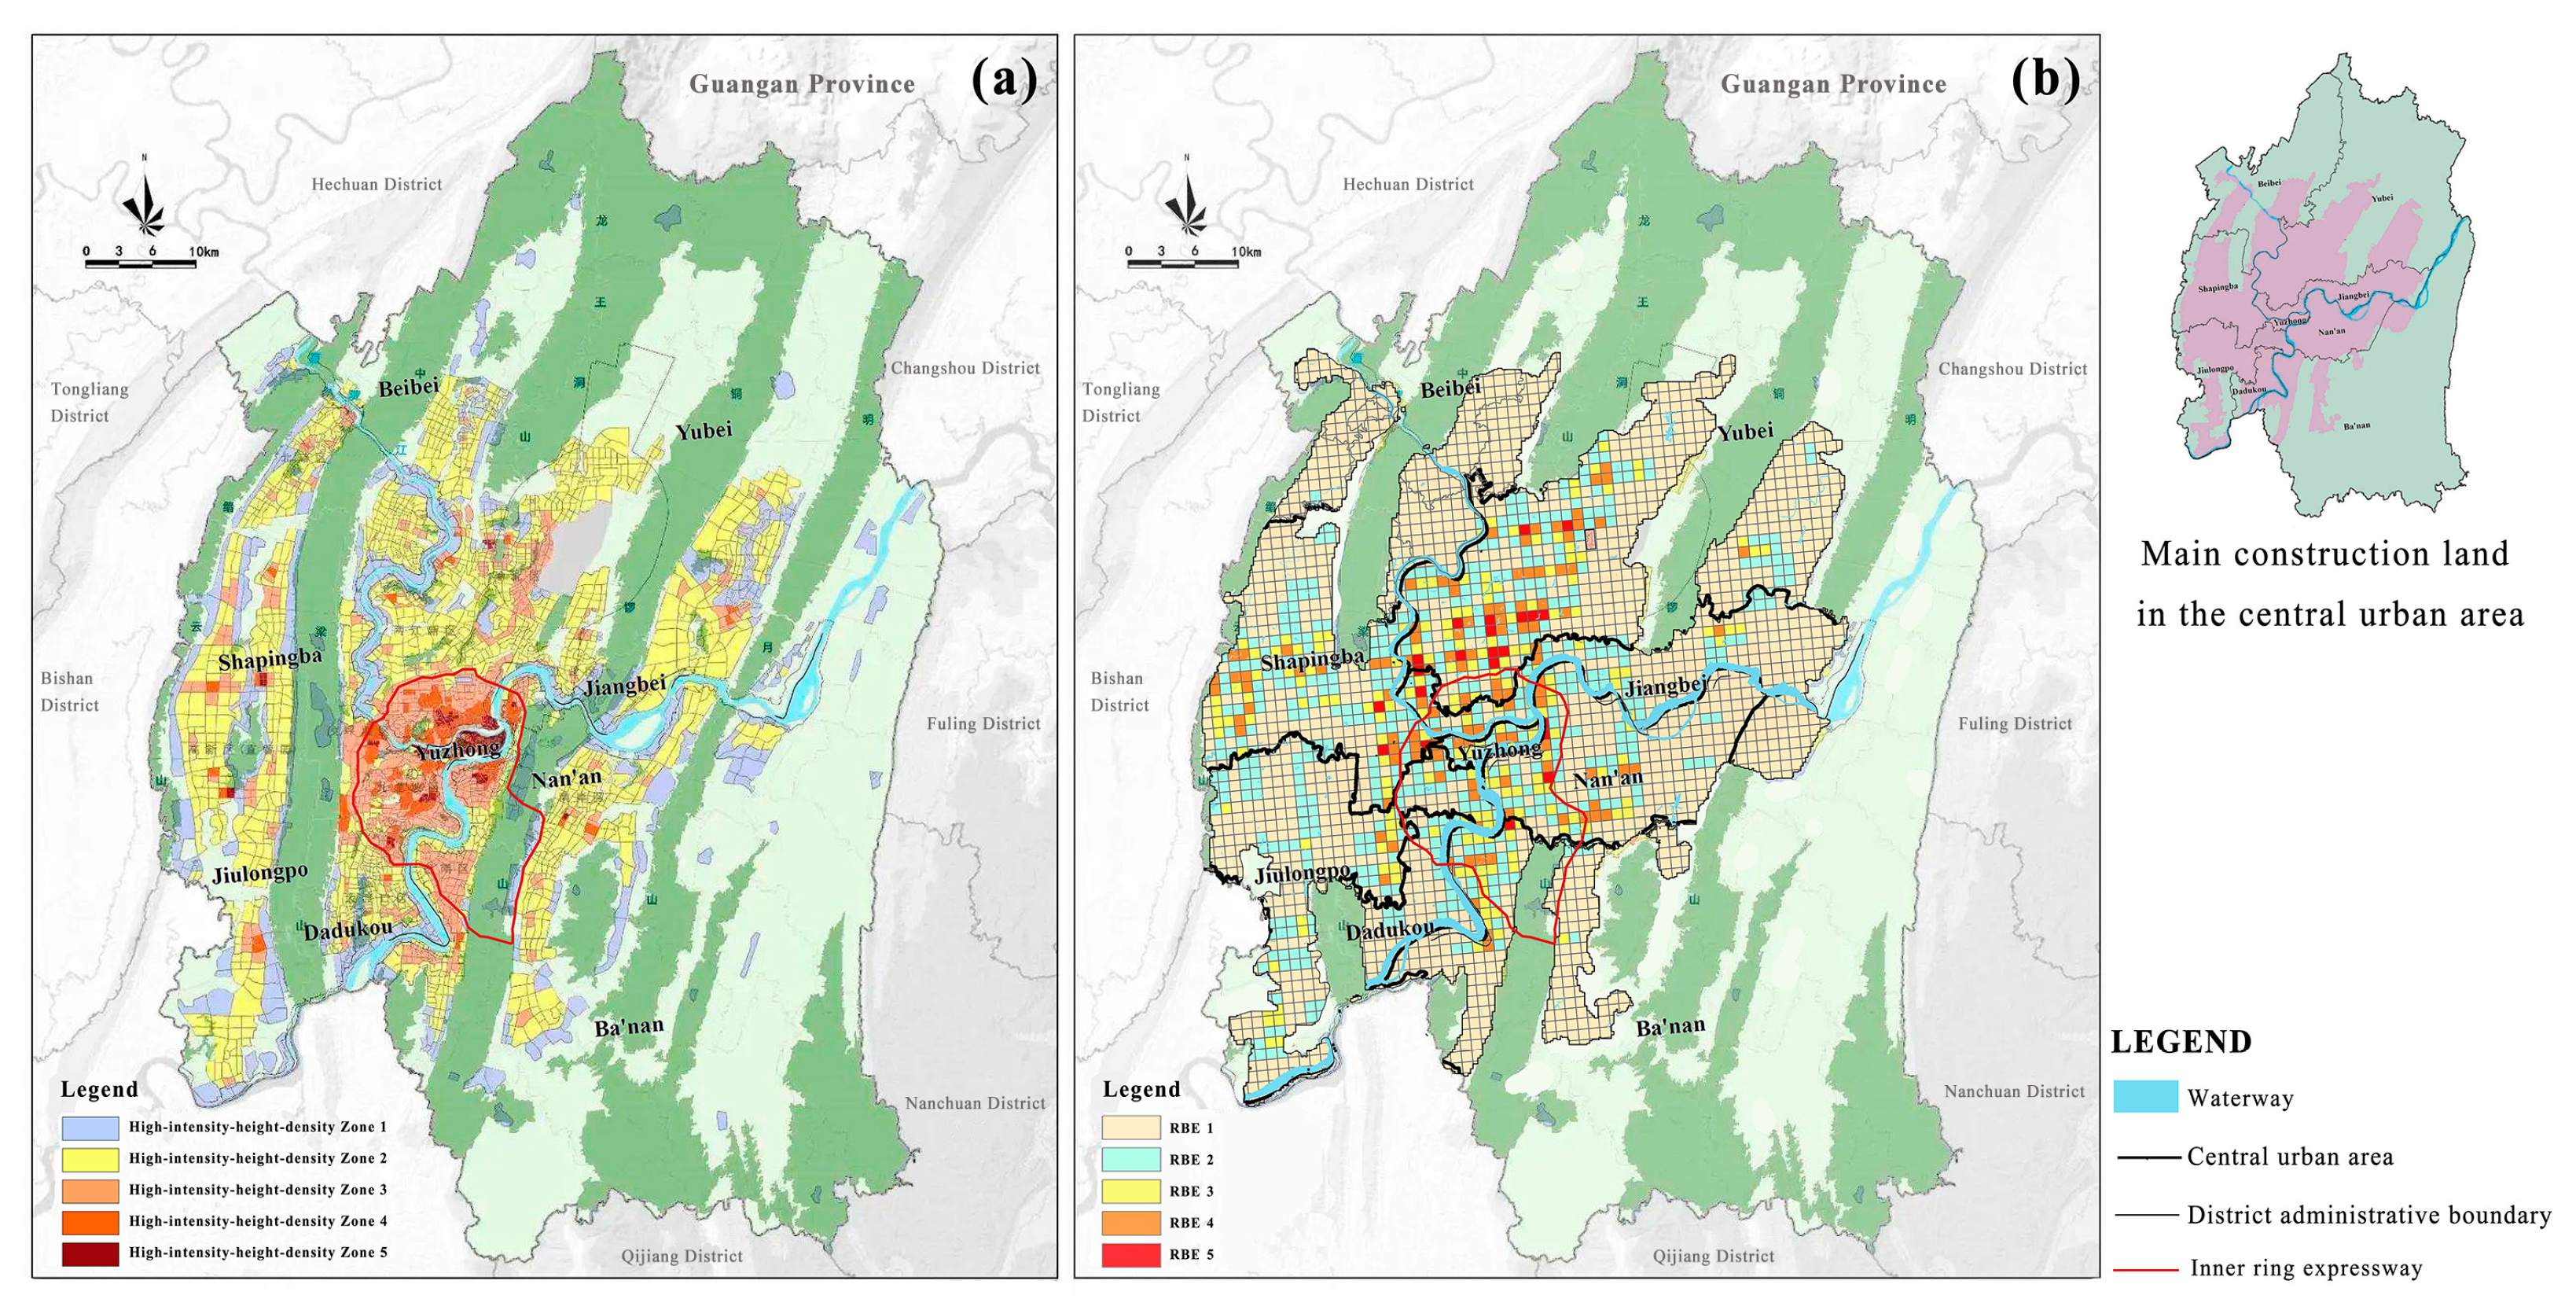
4.4. The Construction of the Five-Level RBE
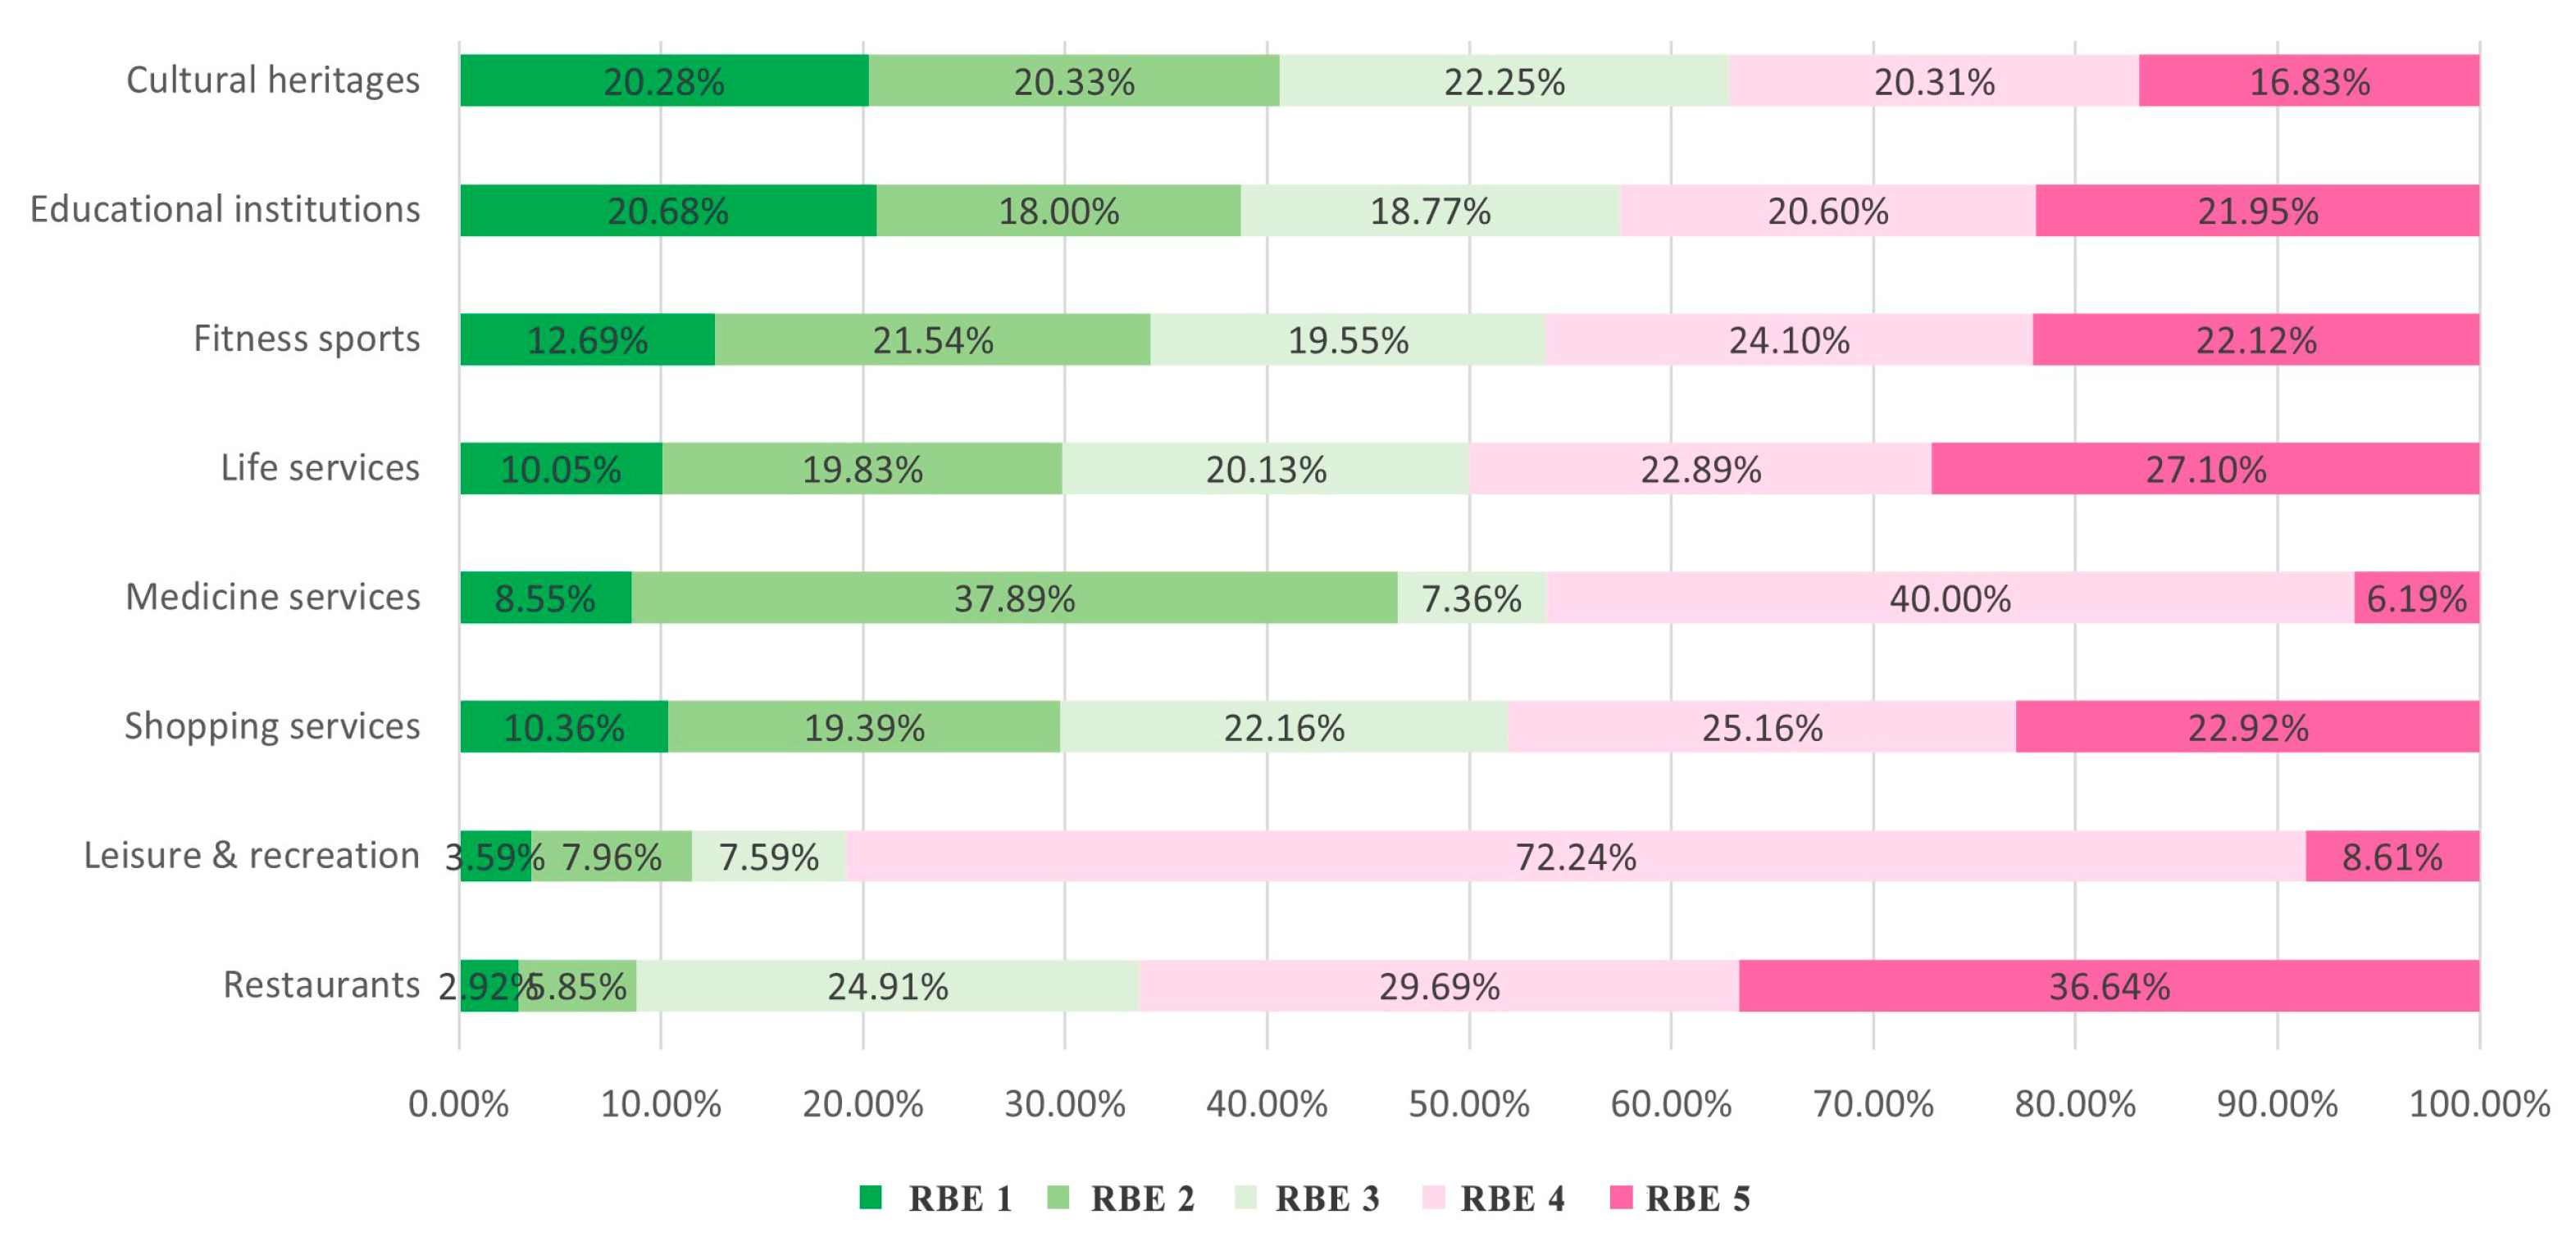
4.5. Proportion Characteristics of Environmental Factors in the Five-Level RBE
4.6. Associations Between Positive Sentiments of High PD and Environmental Factors in the Five-Level RBE
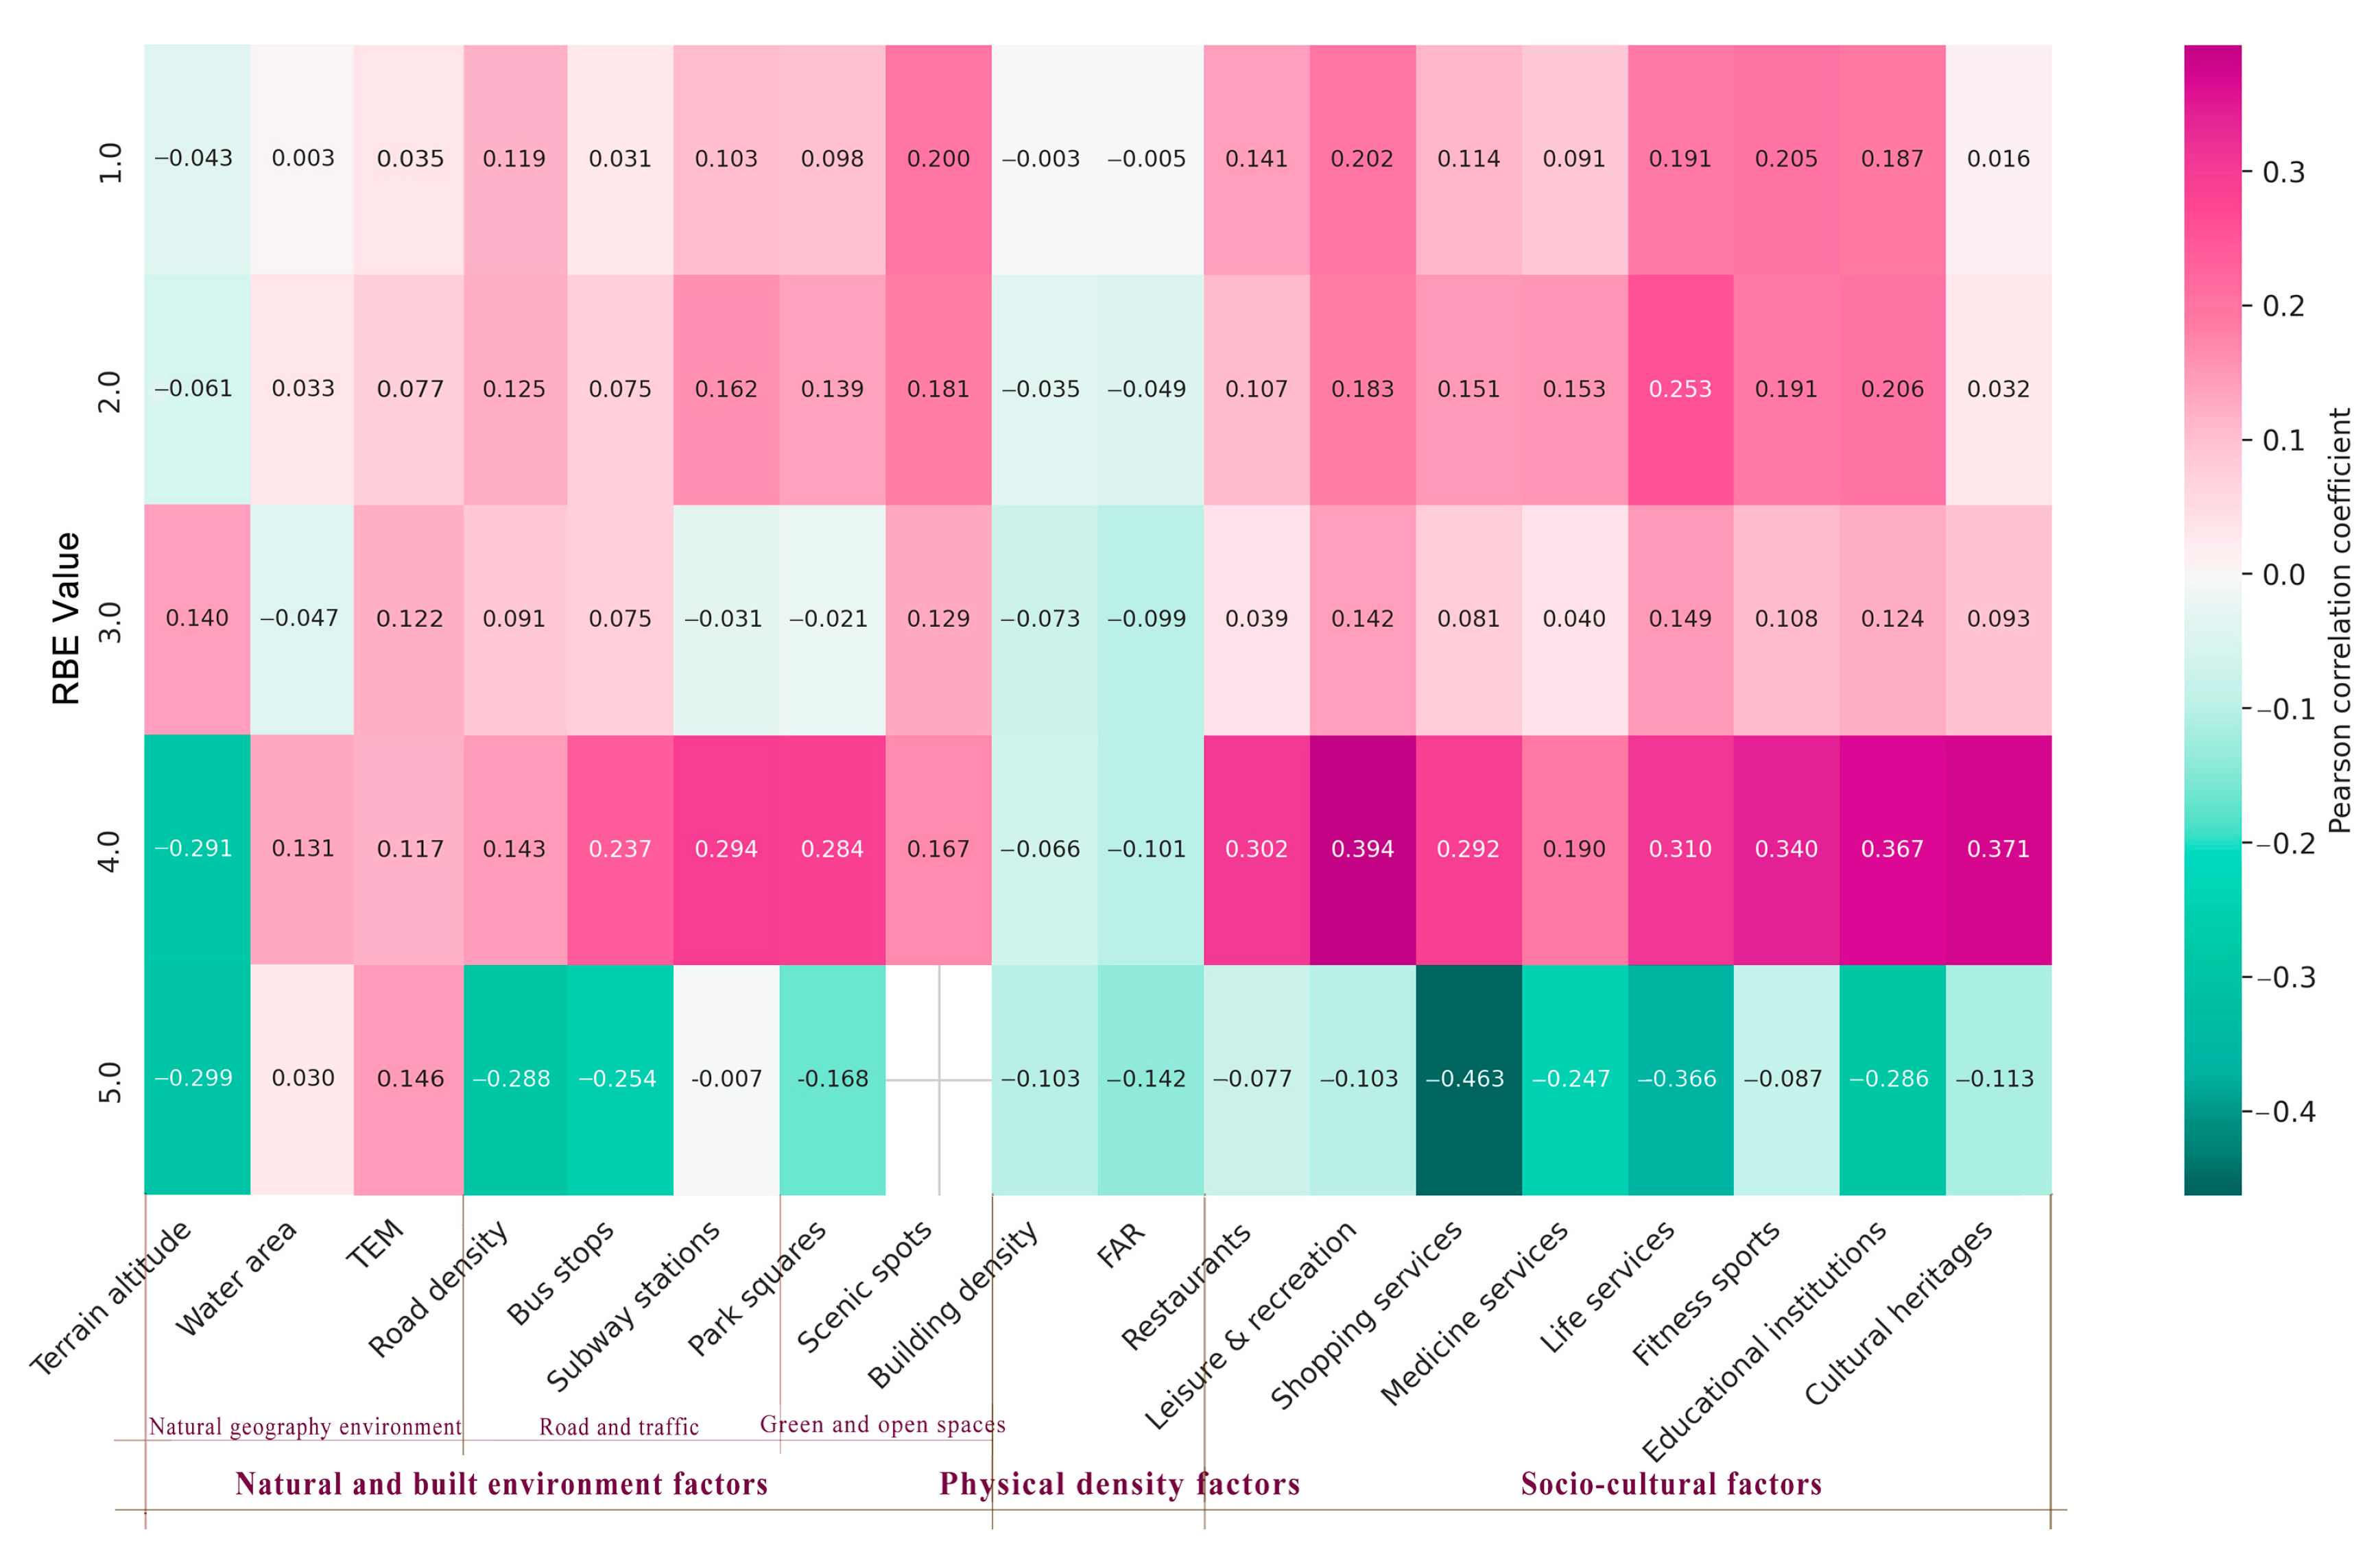
4.6.1. The Heatmap of Pearson Correlation Analysis
4.6.2. OLS Regression Analysis
5. Discussion
5.1. Residents’ PD in Hierarchical RBEs from an Affective Dimension
5.2. Influence of Environment Factors in RBEs of Mountainous Cities
5.2.1. Natural and Built Environmental Attributes
5.2.2. Physical Density’s Attributes
5.2.3. Socio-Cultural Attribute
5.3. Strategies for Urban Managers and Designers in High-Density Mountainous Cities
5.3.1. Prioritise High-Impact Amenities with Differentiated Allocation
5.3.2. Implement Density-Adaptive Emotional Buffering
5.3.3. Enhance Synergies Between Transit, Nature, and Sentiment
5.4. Limitations
6. Conclusions
Author Contributions
Funding
Data Availability Statement
Conflicts of Interest
Abbreviations
| Abbreviation | Full name |
| PD | Perceived density |
| RBE | Residential Built Environment |
| SMD | Social Media Data |
| FAR | Floor area ratio |
| BD | Building density |
Appendix A
| Feature | Significance |
|---|---|
| Active time days | 0.23123 |
| Standard deviation of posting times | 0.20661 |
| Posting frequency | 0.16354 |
| Active days | 0.13408 |
| Total posts | 0.12820 |
| Days of recent activity | 0.07953 |
| Maximum consecutive active days | 0.05191 |
| Average daily posts | 0.00491 |
| Strategy | Accuracy | Precision | Precision | Precision Recall F1 | Score Training Set | Size Test Set Size | Strategy Type |
|---|---|---|---|---|---|---|---|
| Remain active for 15 consecutive days | 0.71605 | 0.67308 | 0.85366 | 0.75269 | 20 | 80 | Maximum consecutive active days |
| Remain active for 20 consecutive days | 0.71605 | 0.67308 | 0.85366 | 0.75269 | 20 | 80 | Maximum consecutive active days |
| Remain active for 25 consecutive days | 0.71605 | 0.67308 | 0.85366 | 0.75269 | 20 | 80 | Maximum consecutive active days |
| Remain active for 30 consecutive days | 0.71605 | 0.67308 | 0.85366 | 0.75269 | 20 | 80 | Maximum consecutive active days |
| Remain active for 35 consecutive days | 0.71605 | 0.67308 | 0.85366 | 0.75269 | 20 | 80 | Maximum consecutive active days |
| Remain active for 40 consecutive days | 0.71605 | 0.67308 | 0.85366 | 0.75269 | 20 | 80 | Maximum consecutive active days |
| Remain active for 45 consecutive days | 0.71605 | 0.67308 | 0.85366 | 0.75269 | 20 | 80 | Maximum consecutive active days |
| Remain active for 50 consecutive days | 0.71605 | 0.67308 | 0.85366 | 0.75269 | 20 | 80 | Maximum consecutive active days |
| Remain active for 55 consecutive days | 0.71605 | 0.67308 | 0.85366 | 0.75269 | 20 | 80 | Maximum consecutive active days |
| Remain active for 60 consecutive days | 0.71605 | 0.67308 | 0.85366 | 0.75269 | 20 | 80 | Maximum consecutive active days |
| Total posts: 10 | 0.70370 | 0.66038 | 0.85366 | 0.74468 | 20 | 80 | Total posts |
| Total posts: 20 | 0.69136 | 0.64815 | 0.85366 | 0.73684 | 20 | 80 | Total posts |
| Total posts: 30 | 0.69136 | 0.64815 | 0.85366 | 0.73684 | 20 | 80 | Total posts |
| Total posts: 40 | 0.69136 | 0.64815 | 0.85366 | 0.73684 | 20 | 80 | Total posts |
| Total posts: 50 | 0.69136 | 0.64815 | 0.85366 | 0.73684 | 20 | 80 | Total posts |
| Total posts: 60 | 0.69136 | 0.64815 | 0.85366 | 0.73684 | 20 | 80 | Total posts |
| Total posts: 70 | 0.69136 | 0.64815 | 0.85366 | 0.73684 | 20 | 80 | Total posts |
| Total posts: 80 | 0.69136 | 0.64815 | 0.85366 | 0.73684 | 20 | 80 | Total posts |
| Total posts: 90 | 0.69136 | 0.64815 | 0.85366 | 0.73684 | 20 | 80 | Total posts |
| Total posts: 100 | 0.69136 | 0.64815 | 0.85366 | 0.73684 | 20 | 80 | Total posts |
Appendix B

References
- High-Risk Areas in the Central Urban District and Community-Acquired Infections. Available online: http://cq.people.com.cn/n2/2022/1121/c365401-40203774.html (accessed on 28 August 2025).
- Mouratidis, K. How COVID-19 Reshaped Quality of Life in Cities: A Synthesis and Implications for Urban Planning. Land Use Policy 2021, 111, 105772. [Google Scholar] [CrossRef]
- Guo, X.; Tu, X.; Huang, G.; Fang, X.; Kong, L.; Wu, J. Urban Greenspace Helps Ameliorate People’s Negative Sentiments during the COVID-19 Pandemic: The Case of Beijing. Build. Environ. 2022, 223, 109449. [Google Scholar] [CrossRef] [PubMed]
- Dai, D.; Dong, W.; Wang, Y.; Liu, S.; Zhang, J. Exploring the Relationship between Urban Residents’ Emotional Changes and Built Environment before and during the COVID-19 Pandemic from the Perspective of Resilience. Cities 2023, 141, 104510. [Google Scholar] [CrossRef]
- Sun, K.; Wang, H.; Zhang, J. The Impact Factors of Social Media Users’ Forwarding Behavior of COVID-19 Vaccine Topic: Based on Empirical Analysis of Chinese Weibo Users. Front. Public Health 2022, 10, 871722. [Google Scholar] [CrossRef]
- Yi, J.; Gina Qu, J.; Zhang, W.J. Depicting the Emotion Flow: Super-Spreaders of Emotional Messages on Weibo During the COVID-19 Pandemic. Soc. Media Soc. 2022, 8, 20563051221084950. [Google Scholar] [CrossRef]
- Central Committee of the Communist Party of China Outline of the ‘Healthy China 2030’ Plan. Available online: https://www.gov.cn/gongbao/content/2016/content_5133024.htm (accessed on 10 July 2024).
- Chen, C.; Li, H.; Luo, W.; Xie, J.; Yao, J.; Wu, L.; Xia, Y. Predicting the Effect of Street Environment on Residents’ Mood States in Large Urban Areas Using Machine Learning and Street View Images. Sci. Total Environ. 2022, 816, 151605. [Google Scholar] [CrossRef] [PubMed]
- Rapoport, A. Toward a Redefinition of Density. Environ. Behav. 1975, 7, 133–158. [Google Scholar] [CrossRef]
- Arza, C. Disentangling the Concept of Density. Available online: https://journals.sagepub.com/doi/abs/10.1177/08854129922092478 (accessed on 26 December 2024).
- Anuradha, B.; Amarpreet, D.; Jaspreet, K. Environmental Stressors and Mental Health. Indian J. Psychol. Sci. 2015, 5, 1–12. [Google Scholar]
- Hofstede, G. Culture’s Consequences: International differences in work-related values. In Beverly Hills; Sage: Thousand Oaks, CA, USA, 1980. [Google Scholar]
- Luo, S.; He, S.Y. Using Data Mining to Explore the Spatial and Temporal Dynamics of Perceptions of Metro Services in China: The Case of Shenzhen. Environ. Plan. B Urban Anal. City Sci. 2021, 48, 449–466. [Google Scholar] [CrossRef]
- Kan, Z.; Kwan, M.-P.; Ng, M.K.; Tieben, H. The Impacts of Housing Characteristics and Built-Environment Features on Mental Health. Int. J. Environ. Res. Public Health 2022, 19, 5143. [Google Scholar] [CrossRef]
- Knöll, M.; Neuheuser, K.; Cleff, T.; Rudolph-Cleff, A. A Tool to Predict Perceived Urban Stress in Open Public Spaces. Environ. Plan. B Urban Anal. City Sci. 2018, 45, 797–813. [Google Scholar] [CrossRef]
- Li, S.; Wang, Y.; Huang, H.; Zhou, Y. Study on the Rumor Detection of Social Media in Disaster Based on Multi-Feature Fusion Method. Nat. Hazards 2024, 120, 4011–4030. [Google Scholar] [CrossRef]
- Tan, L.; Hao, P. Review of Public Sentiment Experience Research for Urban Built Environment. Landsc. Archit. 2024, 31, 106–114. [Google Scholar] [CrossRef]
- Tan, L.; Schultz, D.M. Damage Classification and Recovery Analysis of the Chongqing, China, Floods of August 2020 Based on Social-Media Data. J. Cleaner Prod. 2021, 313, 127882. [Google Scholar] [CrossRef]
- Tian, H.; Chin, W.C.B.; Feng, C.-C. The Recovery from the Pandemic: A Spatial-Temporal Analysis on the Changes in Mobility and Public Attitude in Singapore. Cities 2024, 155, 105426. [Google Scholar] [CrossRef]
- Ma, S.; Wang, B.; Liu, W.; Zhou, H.; Wang, Y.; Li, S. Assessment of Street Space Quality and Subjective Well-Being Mismatch and Its Impact, Using Multi-Source Big Data. Cities 2024, 147, 104797. [Google Scholar] [CrossRef]
- Li, B.; Liu, L.; Wang, J. Study on the Perception of Ecosystem Services in Mountainous Urban Waterfront Space. Landsc. Archit. Acad. J. 2024, 41, 58–68. [Google Scholar]
- Völker, S.; Kistemann, T. Developing the Urban Blue: Comparative Health Responses to Blue and Green Urban Open Spaces in Germany. Health Place 2015, 35, 196–205. [Google Scholar] [CrossRef] [PubMed]
- Elsadek, M.; Liu, B.; Xie, J. Window View and Relaxation: Viewing Green Space from a High-Rise Estate Improves Urban Dwellers’ Wellbeing. Urban For. Urban Green. 2020, 55, 126846. [Google Scholar] [CrossRef]
- Zhang, L.; Tan, P.Y.; Richards, D. Relative Importance of Quantitative and Qualitative Aspects of Urban Green Spaces in Promoting Health. Landsc. Urban Plan. 2021, 213, 104131. [Google Scholar] [CrossRef]
- Zhou, X.; Cen, Q.; Qiu, H. Effects of Urban Waterfront Park Landscape Elements on Visual Behavior and Public Preference: Evidence from Eye-Tracking Experiments. Urban For. Urban Green. 2023, 82, 127889. [Google Scholar] [CrossRef]
- Woodbridge, R.; Sullivan, M.; Harding, E.; Crutch, S.; Gilhooly, K.; Gilhooly, M.; McIntyre, A.; Wilson, L. Use of the Physical Environment to Support Everyday Activities for People with Dementia: A Systematic Review. Dementia 2018, 17, 533–572. [Google Scholar] [CrossRef]
- Van Dyck, D.; Cerin, E.; Cardon, G.; Deforche, B.; Sallis, J.F.; Owen, N.; De Bourdeaudhuij, I. Physical Activity as a Mediator of the Associations between Neighborhood Walkability and Adiposity in Belgian Adults. Health Place 2010, 16, 952–960. [Google Scholar] [CrossRef]
- Yun, Y.; Zhao, H.; Xiong, R.; Liu, S. Research on the relationship between public transport service perception and travel happiness in mountainous cities-based on the moderating effect of sense of gain. J. Guizhou Norm. Univ. 2024, 42, 72–81. [Google Scholar] [CrossRef]
- Zhang, J.; Liu, J.; Yang, H.; Quan, J.; Wang, L.; He, Q.; Li, F. Satisfaction Evaluation for Underpass Green Spaces in Mountainous Cities under the Perspective of Environmental Perception. Buildings 2023, 13, 1489. [Google Scholar] [CrossRef]
- He, Y.; Zhao, Q.; Sun, S.; Li, W.; Qiu, W. Measuring the Spatial-Temporal Heterogeneity of Helplessness Sentiment and Its Built Environment Determinants during the COVID-19 Quarantines: A Case Study in Shanghai. ISPRS Int. J. Geo-Inf. 2024, 13, 112. [Google Scholar] [CrossRef]
- Xu, R.; Yi, J.; Qi, W.; Du, Y.; Huang, S.; Wang, N.; Qian, J.; Tu, W.; Hu, D.; Ma, T.; et al. Identifying Publicly Perceived High Temperature Thresholds across Chinese Cities Using Geotagged Social Media Data. Sustain. Cities Soc. 2025, 119, 106115. [Google Scholar] [CrossRef]
- Hierink, F.; Boo, G.; Macharia, P.M.; Ouma, P.O.; Timoner, P.; Levy, M.; Tschirhart, K.; Leyk, S.; Oliphant, N.; Tatem, A.J.; et al. Differences between Gridded Population Data Impact Measures of Geographic Access to Healthcare in Sub-Saharan Africa. Commun. Med. 2022, 2, 117. [Google Scholar] [CrossRef] [PubMed]
- Xiao, Y.; Ma, M.; Zhao, W.; Wen, J.; Ouyang, X. Analysis of Driving Mechanism of Temporal and Spatial Distribution ofSurface Temperature in Parallel Ridge Valley of East Sichuan. Remote Sens. Inf. 2021, 36, 47–54. [Google Scholar]
- Report on the Health Status of Chongqing Residents for the Year 2023. Available online: https://admin.cq.gov.cn/ywdt/jrcq/202412/t20241212_13883474.html (accessed on 19 January 2025).
- Ning, Y. Optimization Research on Urban PublicSpace of High-density Mountainous Cities—Take Yu Zhong Peninsula of Chong Qing as an Example. Master’s Thesis, Chongqing University, Chongqing, China, 2016. [Google Scholar]
- Girardin, F.; Calabrese, F.; Fiore, F.D.; Ratti, C.; Blat, J. Digital Footprinting: Uncovering Tourists with User-Generated Content. IEEE Pervasive Comput. 2008, 7, 36–43. [Google Scholar] [CrossRef]
- Qu, S.; Dong, Q.; Qin, J.; Liu, Y.; Zhang, J. Study on the Check-in Difference between Tourists and Residents inBeijing Based on Social Media Data. Geogr. Geo-Inf. Sci. 2022, 38, 37–44. [Google Scholar]
- Zhang, X.; Chen, H.; Sun, J.; Zhang, X. Predictive Models of Embodied Carbon Emissions in Building Design Phases: Machine Learning Approaches Based on Residential Buildings in China. Build. Environ. 2024, 258, 111595. [Google Scholar] [CrossRef]
- Wang, J.; Ji, F.; Liu, B.; Wang, N.; Zhang, F. Research on Mass News Classification Algorithm Based on Spark. In Proceedings of the 2020 International Conference on Big Data & Artificial Intelligence & Software Engineering (ICBASE), Bangkok, Thailand, 30 October–1 November 2020. [Google Scholar]
- Stokols, D. A Social-Psychological Model of Human Crowding Phenomena. J. Am. Inst. Plan. 1972, 38, 72–83. [Google Scholar] [CrossRef]
- Evans, G.W.; Wener, R.E. Crowding and Personal Space Invasion on the Train: Please Don’t Make Me Sit in the Middle. J. Environ. Psychol. 2007, 27, 90–94. [Google Scholar] [CrossRef]
- Mouratidis; Kostas Built Environment and Social Well-Being: How Does Urban Form Affect Social Life and Personal Relationships? Cities 2018, 74, 7–20. [CrossRef]
- Bi, X. A Discourse Analysis of Critical Commenting Online: A Study of Comments on a Self-Mockery Event. Discourse Soc. 2023, 35, 174–193. [Google Scholar] [CrossRef]
- Huang, W.; Zhu, S.; Yao, X. Destination Image Recognition and Emotion Analysis: Evidence from User-Generated Content of Online Travel Communities. Comput. J. 2021, 64, 296–304. [Google Scholar] [CrossRef]
- Ma, Y.; Yang, Y.; Jiao, H. Exploring the Impact of Urban Built Environment on Public Emotions Based on Social Media Data: A Case Study of Wuhan. Land 2021, 10, 986. [Google Scholar] [CrossRef]
- Sannigrahi, S.; Pilla, F.; Basu, B.; Basu, A.S.; Molter, A. Examining the Association between Socio-Demographic Composition and COVID-19 Fatalities in the European Region Using Spatial Regression Approach. Sustain. Cities Soc. 2020, 62, 102418. [Google Scholar] [CrossRef]
- Qiu, W.; Zhang, Z.; Liu, X.; Li, W.; Li, X.; Xu, X.; Huang, X. Subjective or Objective Measures of Street Environment, Which Are More Effective in Explaining Housing Prices? Landsc. Urban Plan. 2022, 221, 104358. [Google Scholar] [CrossRef]
- Zhao, Q.; He, Y.; Wang, Y.; Li, W.; Wu, L.; Qiu, W. Investigating the Civic Emotion Dynamics during the COVID-19 Lockdown: Evidence from Social Media. Sustain. Cities Soc. 2024, 107, 105403. [Google Scholar] [CrossRef]
- Cai, Y.; Cao, S.; Du, M.; Li, S.; Chen, S. Estimation and Analysis of Driving Factors of Total AHF in Prefecture-Level of China. J. Geo-Inf. Sci. 2021, 23, 405–418. [Google Scholar]
- Mouratidis, K. Compact City, Urban Sprawl, and Subjective Well-Being. Cities 2019, 92, 261–272. [Google Scholar] [CrossRef]
- Wang, X.; Li, F. Research on the Impact of High Density Block Built Environment on Residents Positive Emotions: A Case Study of Beijing. Res. Urban Dev. 2023, 30, 89–96+140. (In Chinese) [Google Scholar]
- Meng, Y.; Sun, D.; Lyu, M.; Niu, J.; Fukuda, H. Measuring Human Perception of Residential Built Environment through Street View Image and Deep Learning. Environ. Res. Commun. 2024, 6, 55020. [Google Scholar] [CrossRef]
- Li, C.; Yue, S.; Liu, X.; Dai, H.; Li, X. Assessment of the Coordinated Relationship between Blue-Green Space and Urbanization in Coastal Mountain Cities Based on Spatiotemporal Evolution Analysis: A Case Study in Qingdao, China. Ecol. Indic. 2025, 175, 113586. [Google Scholar] [CrossRef]
- Lu, Y.; Gao, S.; Hong, T.; Cao, Z.; Lee, H.; Cho, E.; Zhao, X. The Correlation Between Crime Frequency and Urban Spatial Hierarchy in Busan. Buildings 2025, 15, 1010. [Google Scholar] [CrossRef]
- Cao, J.; Mao, R.; Ning, H.; Shui, T. Exploring the Natural Ventilation Potential for Supertall Buildings Considering Vertical Meteorology: A Case Study in Harbin, China. Appl. Therm. Eng. 2024, 239, 122163. [Google Scholar] [CrossRef]
- Polat, A.T.; Akay, A. Relationships between the Visual Preferences of Urban Recreation Area Users and Various Landscape Design Elements. Urban For. Urban Green. 2015, 14, 573–582. [Google Scholar] [CrossRef]
- Wang, R.; Zhao, J.; Meitner, M.J.; Hu, Y.; Xu, X. Characteristics of Urban Green Spaces in Relation to Aesthetic Preference and Stress Recovery. Urban For. Urban Green. 2019, 41, 6–13. [Google Scholar] [CrossRef]
- Yang, W.; Chen, B.Y.; Cao, X.; Li, T.; Li, P. The Spatial Characteristics and Influencing Factors of Modal Accessibility Gaps: A Case Study for Guangzhou, China. J. Transp. Geogr. 2017, 60, 21–32. [Google Scholar] [CrossRef]
- Plunz, R.A.; Zhou, Y.; Carrasco Vintimilla, M.I.; Mckeown, K.; Yu, T.; Uguccioni, L.; Sutto, M.P. Twitter Sentiment in New York City Parks as Measure of Well-Being. Landsc. Urban Plan. 2019, 189, 235–246. [Google Scholar] [CrossRef]
- Zhu, J.; Xu, C. Sina Microblog Sentiment in Beijing City Parks as Measure of Demand for Urban Green Space during the COVID-19. Urban For. Urban Green. 2021, 58, 126913. [Google Scholar] [CrossRef]
- Hsieh, C.-M.; Yu, C.-Y.; Shao, L.-Y. Improving the Local Wind Environment through Urban Design Strategies in an Urban Renewal Process to Mitigate Urban Heat Island Effects. J. Urban Plann. Dev. 2023, 149, 05023003. [Google Scholar] [CrossRef]
- Liu, M.; Gou, Z. Examining the Impact of Neighborhood Environment Factors on Residents’ Emotions during COVID-19 Lockdown and Reopening: A Wuhan Study on Mediation and Moderation. Environ. Plan. B Urban Anal. City Sci. 2024, 51, 1338–1353. [Google Scholar] [CrossRef]
- Pramitasari, D.; Anggi, M.; Isnaemi, L.D.; Gultom, Y.Z. Daily Needs Stores in the Collective Memory and Living Heritage of Malioboro, Yogyakarta City, Indonesia. J. Asian Archit. Build. Eng. 2025, 24, 1–16. [Google Scholar] [CrossRef]
- Weibo Data Center. Weibo 2020 User Development Report. Sina Weibo Rep. 2021, 10, 2021. (In Chinese) [Google Scholar]
- Zhong, Y.; Yuan, N.J.; Zhong, W.; Zhang, F.; Xie, X. You Are Where You Go: Inferring Demographic Attributes from Location Check-Ins. In Proceedings of the Eighth ACM International Conference on Web Search and Data Mining, Shanghai, China, 2 February 2015; pp. 295–304. [Google Scholar]
- Mitchell, L.; Frank, M.R.; Harris, K.D.; Dodds, P.S.; Danforth, C.M. The Geography of Happiness: Connecting Twitter Sentiment and Expression, Demographics, and Objective Characteristics of Place. PLoS ONE 2013, 8, e64417. [Google Scholar] [CrossRef] [PubMed]
- Bravo-Marquez, F.; Mendoza, M.; Poblete, B. Meta-Level Sentiment Models for Big Social Data Analysis. Knowl.-Based Syst. 2014, 69, 86–99. [Google Scholar] [CrossRef]
- Kumar, A.; Garg, G. Systematic Literature Review on Context-Based Sentiment Analysis in Social Multimedia. Multimed. Tools Appl. 2020, 79, 15349–15380. [Google Scholar] [CrossRef]
- Liu, Y.; Kim, B.-O. Study on the Status Quo of Cultural Regeneration of Chongqing Bayu Culture in the Square Landscape. J. Contemp. Educ. Res. 2019, 3. [Google Scholar] [CrossRef]
- Gan, C.; Feng, Q.; Zhang, Z. Scalable Multi-Channel Dilated CNN–BiLSTM Model with Attention Mechanism for Chinese Textual Sentiment Analysis. Future Gener. Comput. Syst. 2021, 118, 297–309. [Google Scholar] [CrossRef]
- Huang, W.; Zhao, X.; Lin, G.; Wang, Z.; Chen, M. How to Quantify Multidimensional Perception of Urban Parks? Integrating Deep Learning-Based Social Media Data Analysis with Questionnaire Survey Methods. Urban For. Urban Green. 2025, 107, 128754. [Google Scholar] [CrossRef]
- Chen, S.; Liu, L.; Chen, C.; Haase, D. The Interaction between Human Demand and Urban Greenspace Supply for Promoting Positive Emotions with Sentiment Analysis from Twitter. Urban For. Urban Green. 2022, 78, 127763. [Google Scholar] [CrossRef]




| Types | Description | Data Sources | Content |
|---|---|---|---|
| Weibo text | SINA Weibo | https://weibo.com/ (accessed on 10 June 2024) | Coordinates in the WGS-84 coordinate system, review, ID |
| Housing data | Fang Holdings Limited | https://cq.esf.fang.com/https://weibo.com/ (accessed on on 11 March 2024) | Coordinates in the WGS-84 coordinate system, FAR, building type, number of households, residential type, floor area |
| Service facilities POI | Baidu Map | https://map.baidu.com/https://weibo.com/ (accessed on on 21 January 2024) | 4 categories including 12 elements |
| Water and road data | Open Street Map | https://www.openstreetmap.ie/https://weibo.com/ (accessed on 25 January 2024) | Area features, line features |
| Climate Data | Chinese Academy of Sciences Resources and Environment Cloud Platform | https://www.resdc.cn/https://weibo.com/ (accessed on 25 August 2025) | Coordinates in the WGS-84 coordinate system, precipitation, humidity, temperature |
| 30 m Digital high-range model (DEM) | Geospatial Data Cloud | http://www.gscloud.cn/https://weibo.com/ (accessed on 12 January 2024) | Line features |
| Perceived Density (PD) | Type Description | Keywords |
|---|---|---|
| High PD | Crowding Perception | Packed, Intensity, Layered |
| Oppressive Feeling | Stress, Tension or Nervousness, Emo, High Risk, Surreal, Fear, Dizziness, Danger, Depression, Oppression or Repression, Frightening or Scary, Suffocation or Choking, Horror or Terrifying, Forced, Shock or Impact, Insignificant | |
| Overcrowded | People Coming And Going, Crowded, Foot Traffic, Sea of People, Overcrowded | |
| Compactness | A Lot of, Multiple, Dense, Crammed or Tightly Packed | |
| Low PD | Uncrowded | Relaxed |
| Loose Layout | Lighthearted or At Ease, Composed, Calm or Relaxing | |
| Sparseness | Increasingly Sparse, Desolate or Spacious, Empty | |
| Sense of Openness | Open Space, Vast, Expansive, View or Visual Field or Wide View |
| Weight | Part of the Vocabulary |
|---|---|
| −1 | no, not, can’t, not much, don’t have to, didn’t, no, don’t, none, non, don’t, in vain, empty, in vain, in no way… |
| 1 | yes, affirmative, positive, can, have, do have, some, available, exist, do, have, fruitful, successfully… |
| Degree | Weight | Part of the Adverbs of Degree | Number |
|---|---|---|---|
| 1 | 3 | very, extremely, fully, absolutely, most | 69 |
| 2 | 2.1 | super, over, excessive, more than, bias, extra | 30 |
| 3 | 1.5 | quite a lot, especially, extraordinarily, greatly | 42 |
| 4 | 1.06 | more, more and more, also, further | 37 |
| 5 | 0.75 | slightly, a little, somewhat | 29 |
| 6 | 0.53 | not a little, not very, not much, relatively | 12 |
| Types of Influencing Factors | Level I Indicators | Level 2 Indicators | Unit |
|---|---|---|---|
| Natural and built environment factors | Natural geography environment | Terrain altitude | m/km2 |
| Water area | km2 | ||
| Annual average precipitation, PRE | mm | ||
| Annual average relative humidity, RHU | % | ||
| Annual average temperature, TEM | °C | ||
| Road and traffic | Road density | km/km2 | |
| Bus stops | point/km2 | ||
| Subway stations | point/km2 | ||
| Green and open spaces | Park squares | point/km2 | |
| Scenic spots | point/km2 | ||
| Physical density factors | Building density, BD | Average value of residential BD in unit grid | null |
| Floor area ratio, FAR | Average value of residential FAR in unit grid | null | |
| Socio-cultural factors | Daily life service facilities | Restaurants | point/km2 |
| Leisure and recreation | point/km2 | ||
| Shopping services | point/km2 | ||
| Medicine services | point/km2 | ||
| Life services | point/km2 | ||
| Fitness sports | point/km2 | ||
| Cultural and educational institutions | Educational institutions | point/km2 | |
| Cultural heritage | point/km2 |
| Perceived Density (PD) | Number | Proportion | Average Positive Sentiment Value | Average Negative Sentiment Value |
|---|---|---|---|---|
| High PD | 664 | 71.32% | 4.436747 | 1.986446 |
| Low PD | 267 | 28.68% | 6.985019 | 1.629213 |
| Log-Log, Sample Size 5881 | ||||
|---|---|---|---|---|
| Model | OLS | |||
| R2 | 0.206 | |||
| Adj. R2 | 0.203 | |||
| F-statistic | 79.9 | |||
| AIC | 942.8 | |||
| Moran’s I on residual | −0.0153 | |||
| p_value | 0.02281 | |||
| Evalution Index | VIF | coef | p > |t| | |
| RBE value | 2.058 | 0.0366 | *** | |
| Natural and built environment factors | Terrain altitude | 1.082 | 0.0067 | * |
| Water area | 1.032 | 0.0061 | * | |
| TEM | 1.138 | 0.0017 | ||
| Road density | 1.666 | 0.0063 | ||
| Bus stops | 1.387 | −0.0111 | ** | |
| Subway stations | 1.308 | 0.0168 | *** | |
| Park squares | 1.523 | 0.0086 | ** | |
| Scenic spots | 2.443 | 0.0178 | *** | |
| Physical density factors | BD | 1.447 | −0.0063 | |
| FAR | 1.539 | −0.0181 | *** | |
| Socio-cultural factors | Restaurants | 2.799 | 0.0396 | *** |
| Leisure and recreation | 3.796 | 0.0502 | *** | |
| Shopping services | 4.308 | −0.0376 | *** | |
| Medicine services | 3.822 | −0.008 | ||
| Life services | 5.508 | 0.0043 | ||
| Fitness sports | 2.462 | 0.0325 | *** | |
| Educational institutions | 3.501 | 0.0042 | ||
| Cultural heritage | 1.036 | 0.0109 | ** | |
| Land Use | Type | Zone 1 | Zone 2 | Zone 3 | Zone 4 | Zone 5 |
|---|---|---|---|---|---|---|
| Residential area | Base FAR | 1.2 | 1.5 | 2 | 2.5 | 2.5 |
| Upper limit of FAR | 1.8 | 2.3 | 2.5 | 3 | 3 | |
| Upper limit of BD | ≤40% | ≤35% | ≤35% | ≤30% | ≤30% |
Disclaimer/Publisher’s Note: The statements, opinions and data contained in all publications are solely those of the individual author(s) and contributor(s) and not of MDPI and/or the editor(s). MDPI and/or the editor(s) disclaim responsibility for any injury to people or property resulting from any ideas, methods, instructions or products referred to in the content. |
© 2025 by the authors. Licensee MDPI, Basel, Switzerland. This article is an open access article distributed under the terms and conditions of the Creative Commons Attribution (CC BY) license (https://creativecommons.org/licenses/by/4.0/).
Share and Cite
Tan, L.; Hao, P.; Liu, N. Associations Between Environmental Factors and Perceived Density of Residents in High-Density Residential Built Environment in Mountainous Cities—A Case Study of Chongqing Central Urban Area, China. Land 2025, 14, 1882. https://doi.org/10.3390/land14091882
Tan L, Hao P, Liu N. Associations Between Environmental Factors and Perceived Density of Residents in High-Density Residential Built Environment in Mountainous Cities—A Case Study of Chongqing Central Urban Area, China. Land. 2025; 14(9):1882. https://doi.org/10.3390/land14091882
Chicago/Turabian StyleTan, Lingqian, Peiyao Hao, and Ningjing Liu. 2025. "Associations Between Environmental Factors and Perceived Density of Residents in High-Density Residential Built Environment in Mountainous Cities—A Case Study of Chongqing Central Urban Area, China" Land 14, no. 9: 1882. https://doi.org/10.3390/land14091882
APA StyleTan, L., Hao, P., & Liu, N. (2025). Associations Between Environmental Factors and Perceived Density of Residents in High-Density Residential Built Environment in Mountainous Cities—A Case Study of Chongqing Central Urban Area, China. Land, 14(9), 1882. https://doi.org/10.3390/land14091882


