Abstract
This study proposes “Prosuming-Parks,” spatial models that integrate industrial activities with green infrastructure to revitalize South Korea’s border regions. A dataset of 2126 brownfields—including aging industrial sites, military facilities, water infrastructure, public buildings, schools, and railways—was compiled and evaluated through a Prosuming-Park Typology Index linking brownfield types with eight industrial sectors. Six models are derived and applied to fifteen municipalities, suggesting tailored strategies for industrial restructuring and ecological restoration. The framework demonstrates how brownfields can seed scalable green networks and, with future inter-Korean cooperation, evolve into transboundary ecological systems.
1. Introduction
1.1. Background and Research Objectives
On 27 July 1953, the Armistice Agreement for the Restoration of the South Korean State was signed, establishing the Military Demarcation Line (MDL). Both South Korea and North Korea subsequently withdrew two kilometers from the MDL, resulting in the creation of the Demilitarized Zone (DMZ). The border regions refer to areas that either directly adjoin the DMZ or are designated by Presidential Decree, comprising fifteen municipalities in South Korea (Figure 1).
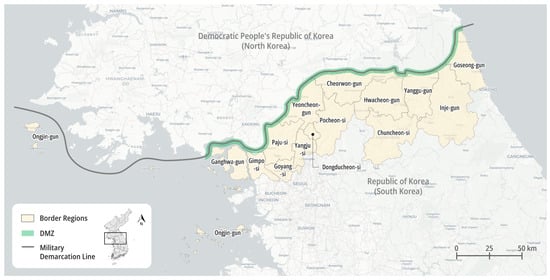
Figure 1.
Border Regions Adjacent to the DMZ in South Korea. The 15 designated municipalities include Ongjin-gun, Ganghwa-gun, Gimpo-si, Goyang-si, Paju-si, Yangju-si, Dongducheon-si, Yeoncheon-gun, Pocheon-si, Cheorwon-gun, Hwacheon-gun, Yanggu-gun, Chuncheon-si, Inje-gun, and Goseong-gun. Note: In the Korean administrative system, “-gun” refers to a county and “-si” refers to a city.
Due to their proximity to the DMZ, the border regions have long faced restrictions on land use and property rights. These constraints have impeded the development of transportation networks and other industrial infrastructure, resulting in an overall stagnation of the regional industrial structure [1]. Furthermore, the Defense Reform 2.0 initiative announced in 2018 led to the spatial reorganization of military units [2]. As a result, numerous underutilized military sites have emerged in the border regions where bases were previously concentrated [3,4]. These geopolitical conditions and policy-driven changes have contributed to the proliferation of brownfield sites in the border regions, which now pose urgent challenges requiring immediate attention.
Although their geographic proximity to North Korea once contributed to the underdevelopment of the border regions, recent policy shifts have begun to reframe these disadvantages as opportunities for regional growth. A notable example is the enactment of the Special Act on the Designation and Operation of Peace Economy Zones, which came into effect on 14 December 2023 [5]. Under this law, local governments in the border regions that engage in trade with North Korea or attract industries with ripple effects related to inter-Korean cooperation are eligible for tax incentives and financial support. Moreover, the border regions are increasingly viewed as strategic zones for joint South Korean and North Korean responses to environmental challenges, as well as for cooperation in forestry, agriculture, and water resource management [6]. It is now imperative to establish a new economic framework in these regions—one that also serves as a spatial foundation for envisioning future South Korean and North Korean relations from ecological and environmental perspectives.
This study proposes the concept of “Prosuming-Parks” as a spatial model that integrates emerging industrial structures aimed at regional economic revitalization with green infrastructure that facilitates ecological networking. “Prosuming” is a compound term derived from “producer” and “consumer,” first introduced by Toffler in The Third Wave [7]. In this study, the term is employed to encompass both the industrial diversity that spans from production to consumption within a defined spatial scope and the practical feasibility of self-sufficiency. In addition, Jones and Wills defined “park” as “a fluid concept evolving in response to changing social demands, economic pressures, political regulations, and environmental preferences” [8]. Reflecting this definition, this study employs the term “park” to refer to diverse forms of green infrastructure that are naturally integrated into the local industrial contexts.
Building on this premise, this study examines Prosuming-Park models applicable to the border regions of South Korea, thereby presenting a framework that spatially integrates industrial development with ecological connectivity. To qualify as a designated Peace Economy Zone, each of the fifteen border municipalities—spanning 248 km from east to west—must not only develop specialized industries but also cultivate distinct identities that reflect their local characteristics. This study draws on contemporary urban cases where brownfields have been transformed into key resources for industrial diversification and regional specificity, anticipating that such precedents offer meaningful insights for the border regions of South Korea.
Based on this premise, the aims of this study are threefold:
- To redefine the brownfields of South Korea’s border regions as diverse spatial resources rather than a single category.
- To develop a Prosuming-Park Typology Index that systematically links brownfield types with industrial–ecological integration.
- To apply the derived models to the fifteen border municipalities, thereby exploring tailored strategies for industrial restructuring, ecological restoration, and the potential formation of transboundary green networks.
Ultimately, this study seeks to propose pathways for brownfield utilization that integrate industrial development with ecological connectivity, positioning the border regions as testing grounds for sustainable development and future cooperation between South and North Korea.
1.2. Brownfields in Border Regions: Concepts, Utilization, and Research Gap
To further contextualize these aims, it is necessary to examine how brownfields have been conceptualized and utilized, both in academic discourse and in policy frameworks related to South Korea’s border regions. The term “brownfields” encompasses a range of site types whose categorization varies depending on the focus of the study—whether it be infrastructure deterioration, environmental contamination, or land use characteristics. Loures and Vaz identified five categories of land—Abandoned Land, Contaminated Land, Derelict Land, Underutilized Land, and Vacant Land—emphasizing distinctions based on the land’s condition and origin [9]. Kim, Miller, and Nowak presented a typology grounded in the sequential urban phenomena resulting from industrial transformation, classifying brownfields into five types: Post-industrial Sites, Derelict Sites, Unattended Sites with Vegetation, Natural Sites, and Transportation-related Sites [10]. Berger highlighted the multilayered nature of disused infrastructure within cities and proposed six categories—Waste Land of Dwelling, Waste Land of Transition, Waste Land of Infrastructure, Waste Land of Obsolescence, Waste Land of Exchange, and Waste Land of Contamination—to emphasize the concurrent transformation of urban infrastructural components in the context of urbanization [11].
Aging industrial sites, underutilized public facilities, and disused infrastructure are often markers of regional economic stagnation. However, they also signify that the area once possessed well-developed social overhead capital (SOC), including roads, ports, railways, educational institutions, and water infrastructure. Bowman and Pagano emphasize that such urban remnants can function as the most competitive resources for implementing economic development strategies and are essential assets for promoting smart growth within cities [12]. Building on their argument, this study defines brownfields as infrastructure that is either outdated and in need of improvement or no longer utilized due to population decline in the surrounding area. This includes sites that have lost locational competitiveness due to changes in transportation networks or have been abandoned following the relocation of facilities or functions to other cities.
Based on national policies and relevant legal frameworks pertaining to the border regions, this study classifies brownfields in these areas into six categories: aging industrial sites, aging water infrastructure, aging public buildings, underutilized military sites, closed schools, and disused railways (Table 1). These categories are derived from policy changes and empirical cases. First, the 2011 Comprehensive Plan for Border Region Development included proposals to repurpose underutilized military sites into facilities such as lodging, rest, and experiential spaces [13]. Subsequently, the announcement of Defense Reform 2.0 created further demands for the reuse of additional military sites. Moreover, the revised 2019 Comprehensive Plan for Border Regions Development designated the utilization of idle spaces within the region as a key task for revitalizing the local economy and creating jobs [14]. In addition, the Basic Concept for Peace Economy Zones announced by the Ministry of Unification in 2025 stipulated the use of local resources and existing industries such as agriculture and light industry as a method for ensuring the sustainable operation of the zones, which necessitates the reorganization of related facilities and infrastructure [15].

Table 1.
Classification of Brownfields in the Border Regions.
Discussions on the utilization of brownfields in South Korea’s border regions began to gain traction following the announcement of Defense Reform 2.0 in 2018 [2], which led to a reorganization of military units and the emergence of underutilized military sites [18,19,20,21]. More recently, the 2022 release of Defense Innovation 4.0 outlined plans to restructure military forces around AI-based technologies [22]. Given that this shift does not involve territorial expansion of military facilities, the need to repurpose underutilized military sites is expected to remain an ongoing issue.
In addition to military sites, other types of brownfields in the border regions—such as aging industrial sites [23], closed schools [24], disused railways [25], and deteriorating water pump stations [26]—have been addressed in reuse planning. However, most prior studies have concentrated on the redevelopment of single sites, without sufficiently exploring the integrated utilization of multiple brownfield categories occurring simultaneously. To address this gap, the present study draws on international experiences to develop a typology of diverse brownfields and to link them with industrial–ecological integration models, thereby proposing new pathways for brownfield utilization in South Korea’s border regions.
2. Materials and Methods
2.1. Study Area and Dataset
The study area consists of the fifteen municipalities adjacent to the DMZ, as described in Section 1 (Figure 1). To assess the status of brownfields, this study compiled data from multiple sources available through the Public Data Portal [27]. These include information on national industrial sites [28], aging water infrastructure and public buildings [17], closed schools [29], and disused railway sites [30]. For closed schools, additional data were provided by the Ministry of Education [31].
Since detailed information on underutilized military sites—such as their location and size—is not publicly available due to security restrictions and concerns about real estate speculation, aggregated statistics from prior research [20,21] were supplemented with data from news reports [32,33].
Through this process, a dataset of 2126 brownfield sites was established, including information on brownfield type, site name, address, land area, facility area, and original data source URLs (Table 2).
Table 2.
Sample Structure of the Brownfield Dataset in the Border Regions (Excerpt).
2.2. Case Selection Criteria
To establish the Prosuming-Park Typology Index, international and domestic cases were reviewed in which brownfields were converted into green infrastructure and combined with industrial activities. Based on the chronological park types presented by Cranz [34,35] and Jones and Wills [8], cases highlighted in their literature were prioritized. In addition, more recent cases were supplemented using articles in the journal Landscape Architecture Korea [36,37,38,39,40,41,42], relevant websites [43,44,45], and news reports [46,47].
The following criteria guided the selection of cases (see Section 3.2 for results):
- Type of industrial activity associated with green infrastructure, spanning the production–consumption spectrum (agriculture, manufacturing, energy, information technology, research and development, education, service/distribution, tourism).
- Geographic location of each case.
- Brownfield components that enabled the transformation into green infrastructure.
- Period of transformation, distinguishing between historical and contemporary trends.
These criteria facilitated the identification of interconnections between the production–consumption spectrum and the typology of brownfields, thereby providing a structured basis for case analysis.
2.3. Input–Output Linkage Analysis
To evaluate the economic interconnections of industrial sectors, this study employs the 2020 Input–Output (IO) Table provided by the Bank of Korea [48]. The 380 industries classified in the IO Table (medium classification) were regrouped into the eight industrial sectors: agriculture, manufacturing, energy, IT, R&D, education, distribution/service, and tourism).
From the IO framework, two measures of industrial linkages are calculated: the degree to which each sector induces demand from other industries (backward linkage) and the degree to which it supplies outputs to other industries (forward linkage). Both indices are normalized to a mean value of 1, and then aggregated into a composite score that reflects the relative importance of each sector within Korea’s inter-industry structure.
These composite scores provide the weighting factors for constructing the Prosuming-Park Typology Index (see Section 3.3), ensuring that the framework accounts not only for the qualitative characteristics of brownfields but also for the quantitative ripple effects of industrial interdependencies.
2.4. Spatial Analysis and Model Suitability
Spatial analysis is conducted using QGIS. Brownfield sites from the dataset are mapped and aggregated by municipality to analyze area, type, and spatial patterns. For model suitability, three indicators are applied:
- Brownfield availability (area and frequency of sites)–weight 0.5
- Conversion potential (typology score from Section 3.3)–weight 0.3
- Industrial connectivity (average IO-based score of linked sectors)–weight 0.2
The weighted scores are normalized to derive relative suitability ratios for each of the six Prosuming-Park models at the municipal-level.
To visualize model distributions, a hexagon grid is overlaid on the study area. Modal values (M1–M6) are assigned to hexagons based on intersecting points. To ensure that sites located on boundaries are included, the intersects condition is applied.
3. Results
3.1. Status and Spatial Distribution of Brownfields
Based on the compiled dataset of 2126 sites (see Section 2.1), the brownfields were categorized according to city- and county-level administrative divisions within the border regions. The results, visualized in Figure 2, were standardized by site area, revealing that the dominant types of brownfields differ across municipalities.
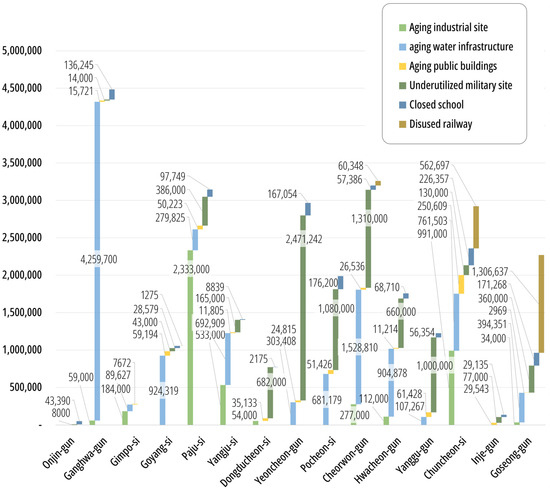
Figure 2.
Status of Brownfields by Si (City) and Gun (County) in the Border Regions.
Aging water infrastructure is particularly concentrated in Ganghwa-gun, Goyang-si, Yangju-si, Cheorwon-gun, and Hwacheon-gun, whereas aging industrial sites are predominant in Gimpo-si, Paju-si, and Chuncheon-si. In Ongjin-gun, closed schools represent the largest proportion, while disused railways are most commonly found in Goseong-gun. Notably, underutilized military sites show the highest concentration in a contiguous cluster of municipalities—Dongducheon-si, Yeoncheon-gun, Pocheon-si, Cheorwon-gun, Hwacheon-gun, and Yanggu-gun. This pattern indicates their potential as spatial hubs for decommissioned military infrastructure.
These distributional differences reflect the varying industrial structures and geographic–policy contexts of each region. For instance, Gimpo-si, Paju-si, and Chuncheon-si, which are located near the Seoul metropolitan area, are characterized by clusters of aging industrial sites due to their history of active industrial development. In contrast, Cheorwon-gun and Hwacheon-gun, situated directly along the border, exhibit concentrations of underutilized military sites due to the density of military facilities.
To further interrogate these municipality-level patterns, we next examine their spatial configuration across the region. Using QGIS, the spatial patterns and site areas of brownfields across the border regions were mapped (Figure 3). The results reveal a significant concentration of brownfields in the Seoul Capital Area, which includes Seoul, Incheon, and Gyeonggi Province. This pattern reflects the legacy of infrastructure development designed to leverage proximity effects within the capital region, suggesting that the volume of aging infrastructure has increased in proportion to the intensity of initial development.
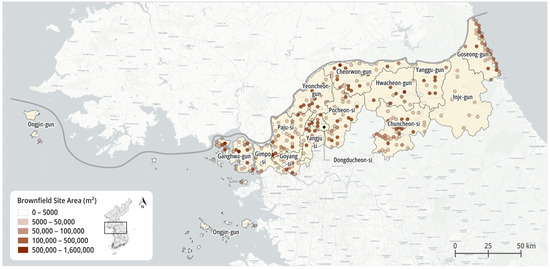
Figure 3.
QGIS-Based Mapping of Brownfield Distribution by Location and Site Area in the Border Regions.
This inference is further supported by the findings in Figure 3: except for Dongducheon-si, Yeoncheon-gun, and Pocheon-si—which are located in the eastern part of Gyeonggi Province and relatively distant from the capital core—municipalities such as Ganghwa-gun (Incheon), and Gimpo-si, Goyang-si, Paju-si, and Yangju-si (Gyeonggi-do) exhibit higher proportions of aging industrial sites and water infrastructure, rather than underutilized infrastructure.
In addition, a linear distribution of brownfields is observed in Chuncheon-si and Goseong-gun, located in Gangwon Province. These brownfields primarily follow the former railway corridors, where the disused railways have retained their spatial form. This configuration suggests their potential to serve as future hubs for regional green or mobility networks.
Such spatial arrangements go beyond a simple diagnosis of current conditions. They function as foundational data for designing future brownfield utilization strategies. In particular, the concentrated distribution near the Seoul metropolitan area indicates potential for industrial reutilization, while the linear distribution along former railway networks suggests opportunities for transformation into ecological or mobility networks. These insights provide the empirical basis for developing the “Prosuming-Park Typology Index” presented in Section 3.3.
3.2. Green Infrastructure and Case Studies of Brownfield Conversion
Green infrastructure is typically understood as vegetated, linear, and multi-purpose, encompassing traditional greenways while also exhibiting distinct characteristics. According to Natural England, a UK non-departmental public body, green infrastructure delivers a range of social, economic, and environmental benefits—such as wildlife habitats, recreational spaces, climate adaptation, environmental education, local food production, and improved public health and well-being—especially when located near where people live and work [49].
Benedict and McMahon define green infrastructure as a network of natural areas and open spaces that are interconnected and provide ecological value and a variety of human benefits [50]. Across the literature, green infrastructure is consistently described as an environmentally friendly urban network that not only offers ecological and economic advantages but also emphasizes the interconnectivity among infrastructure components.
Reflecting this networked structure, the UK Department for Levelling Up, Housing and Communities (DLUHC) includes a wide range of spaces and assets under the umbrella of green infrastructure [51]. These include parks, playing fields, open spaces, woodlands, allotments, private gardens, sustainable drainage features, green roofs and walls, street trees, and “blue infrastructure” elements such as streams, ponds, canals, and other water bodies—all of which contribute to broader environmental and societal benefits [51].
If green infrastructure is a concept that emphasizes environmentally friendly networks, then the notion of the park can be understood as a more expansive concept—one that has progressively incorporated types of green infrastructure and human activities that historically lay outside its conventional spatial domain. In response to these shifts, Cranz classifies the evolution of parks into four distinct types, based on changing patterns in social objectives, activities, scale, urban relationships, forms, elements, facilitators, and beneficiaries [34]. Later, drawing on the emergence of contemporary park practices since the 1990s, Cranz introduced a fifth category: the “Sustainable Park” (1990–present) [35]. This fifth type expands the components of parks to include sites of ecological regeneration such as historic airfields, buildings designed with ecological functions, waterways and paths, as well as designated or remnant spaces such as railways, military bases, landfills, industrial sites, decommissioned transportation infrastructure, dams, farmland, water purification ponds, water tanks, and wind turbines [35]. This phase represents a pivotal point at which various forms of green infrastructure began to merge meaningfully with the evolving concept of the park.
Jones and Wills explore the expanding scope of parks by emphasizing the diverse activities they have come to accommodate—ranging from shifting class-based user groups to emerging trends in play, scientific research, business, education, and tourism [8]. They characterize the turn of the twentieth century as a pivotal period during which park experiences broadened significantly, giving rise to a wide array of “parkscapes,” including industrial parks, research parks, and heritage or cultural parks [8]. This growing diversity is encapsulated in the term “park ecology,” which the authors use to describe how parks form adaptive ecosystems—flexibly incorporating the social values of the time while expanding their industrial functions and spatial identities [8].
In summary, the concept of the park can be understood as both intersecting with and expanding beyond green infrastructure—forming a dynamic union that continually evolves by incorporating emerging social values. These social values reflect not only the geopolitical context in which a site is situated but also the evolving agendas that such a context demands. In this study, the border regions are identified as precisely such sites, where the convergence of spatial, ecological, and societal imperatives makes the park a platform for addressing contemporary regional challenges.
Building on this conceptual foundation, we analyze representative cases in which brownfields are spatially combined with industrial activities and green infrastructure to inform the subsequent typology. A set of representative cases was analyzed in which brownfields were spatially combined with industrial activities and green infrastructure. The results are summarized in Table 3.
Table 3.
Case Studies of Brownfield-to-Green Infrastructure Transformation across the Production–Consumption Industrial Spectrum.
The selected cases are categorized into three groups according to the period in which they were developed. First, cases developed up to 1995 illustrate spatial networks in which multiple industrial activities—including energy production, manufacturing, research and development (R&D), information technology (IT), agriculture, and education—were integrated within a single form of green infrastructure. For example, the Kalundborg Eco-industrial Park (1972) formed an industrial–ecological cycle that included a coal-fired power plant, pharmaceutical and enzyme manufacturing facilities, and fish farms. Cambridge Science Park (1970) was redeveloped on an underutilized military site, while Sophia Antipolis (1972) was established on a conserved green belt—both exemplifying ways in which R&D- and IT-based sites were harmonized with existing land conditions. A representative example of the education–agriculture nexus during this period is the Edible Schoolyard (1995), which fostered community-based networks by creating jobs through urban agriculture, providing sustainability education, and incorporating locally grown organic produce into school meals. Collectively, these early cases of varied scales and forms demonstrate that green infrastructure can function as a platform for the gradual transition toward environmentally friendly industries.
Second, cases from the 2000s to 2015 show how decommissioned military, regime-related, transportation, and resource-extraction infrastructure, left behind following changes or relocations in urban industries, were repurposed as green infrastructure supporting tourism and service sectors. For instance, Crissy Field (2001) transformed a military airfield into a coastal ecological park, while Grūtas Park (2001) converted regime propaganda monuments into tourism and educational resources. Likewise, Killesberg Park (2012) and Hunter’s Point South (2013) repurposed, respectively, a quarry and a disused railway into tourism and service hubs linked to local communities. The Manhattan Project National Historical Park (2015) converted reactors and contaminated military sites into historical and tourism assets, simultaneously highlighting the transformation of energy infrastructure and the preservation of collective memory.
Third, cases developed since 2015 commonly demonstrate the transformation of decommissioned or aging infrastructure into green infrastructure through agricultural use and ecological restoration. For example, Coro Field (2015) and Chengtoushan Archaeological Park (2016) represent agriculture–education integrated models based on agricultural heritage and farmland. The Gyeongui Line Forest Park (2016) converted a disused railway into a linear park that now serves as a community and tourism resource. More recent examples include the Thammasat Urban Rooftop Farm (2019) and Miyashita Park (2020), which repurposed building rooftops and aging parking lots, respectively, into urban agriculture and mixed-use commercial services. The redevelopment of Battersea Power Station (2022) is regarded as a landmark urban regeneration project that transformed an industrial facility into a mixed-use complex of services and housing.
Particular attention was given to the interconnections between the production–consumption spectrum and the typology of brownfields. For example, cases of conversion into R&D or IT hubs represent production-oriented industrial sectors focused on manufacturing and knowledge industries, thereby demonstrating the potential reuse of production-oriented brownfields such as industrial sites or underutilized military sites. In contrast, the conversion of closed schools or railways highlights the complementary role of consumption-oriented sectors such as community culture, education, and tourism, while underscoring the social regeneration effects of aging public buildings or disused railways. In addition, energy- and agriculture-related cases demonstrate how environmentally vulnerable brownfields can be transformed into climate-responsive green infrastructure, illustrating the alternative uses of aging water infrastructure.
Thus, the selected cases serve not merely as examples of successful transformation but as illustrative cases showing where each industrial sector and brownfield type is positioned within the spectrum. Through this classification and linkage, the study establishes a basis for the Prosuming-Park Typology developed in the next subsection.
3.3. Prosuming-Park Typology Index
Drawing on the cases presented in Table 3 and the sectoral scores derived from the Input–Output analysis (see Section 2.3), this study establishes the Prosuming-Park Typology Index as a systematic framework to evaluate brownfield utilization strategies in terms of both industrial activity and green infrastructure (Table 4).
Table 4.
Prosuming-Park Typology Index.
In Table 4, when assessed according to the seven Park-forming Brownfields, the total score is highest for industrial sites (12.57), followed by military sites (7.87), water infrastructure (4.1), buildings (3.38), and schools (2.55), while railways and monuments tie for the lowest score (1.55). This indicates that, as shown in Table 3, when industrial sites are utilized as park-forming brownfield resources, they allow for transformation into green infrastructure through linkages with the greatest diversity of industrial sectors.
Although agriculture (1.41) and education (1.14) show relatively low inter-industry coefficients, their social and environmental contributions—such as human resource development and food security—remain significant. Thus, even sectors with weaker economic ripple effects can provide substantial social value when integrated with brownfield resources.
Based on these results, the park-forming brownfields are typologized into six Prosuming-Park models according to their score ranges (Table 5).
Table 5.
Typology of Six Prosuming-Park Models.
In Table 5, the Prosuming-Park types are derived by comprehensively considering both the industrial linkage effects and the spatial conditions of brownfields. First, aging industrial sites are categorized as “Convergent Prosuming-Park (Model 1),” as they are directly connected to a broad spectrum of industrial activities and thus enable multi-sectoral integration. Underutilized military sites are defined as “Energy and Knowledge Prosuming-Park (Model 2),” reflecting their strategic importance when linked with emerging industries such as energy, IT, and R&D. Water infrastructure is classified as “Aqua-Integrated Prosuming-Park (Model 3),” because it can be associated with water-related industries including agriculture, education, and tourism. Aging buildings are identified as “Adaptive Reuse Prosuming-Park (Model 4),” given their wide distribution across urban areas and their strong potential for diverse industrial linkages. Closed schools are designated as “Socio-Ecological Prosuming-Park (Model 5),” which, although limited in terms of economic ripple effects, can play a significant role in strengthening community, educational, and ecological values. Finally, disused railways and dismantled or relocated monuments are categorized as “Cultural-Tourism Prosuming-Park (Model 6),” reflecting both their direct association with tourism as a single sector and their distinctive symbolic and linear infrastructural characteristics.
3.4. Application of Prosuming-Park Models
Finally, we apply the six models to the fifteen municipalities to evaluate municipal suitability and identify spatial implications. The applicability of the Prosuming-Park models (Models 1–6) is evaluated using the brownfield dataset compiled for the fifteen border municipalities. For each region, brownfield categories are aggregated and linked to the six Prosuming-Park models. Relative suitability ratios are calculated, enabling the identification of first, second, and third priority models for each municipality.
The results are summarized in Table 6, which provides an overview of the relative suitability ratios of the Prosuming-Park models across the border municipalities.
Table 6.
Evaluation of Prosuming-Park Model Suitability by Municipality in the Border Regions.
Based on these results, directions for establishing Prosuming-Parks to promote both industrial development and ecological integration in the border regions are proposed as follows:
- Gimpo-si, Paju-si, Yangju-si, and Dongducheon-si are not only geographically adjacent but also share a common presence of aging industrial sites. These areas show high suitability with Model 1 (Convergent Prosuming-Park), which enables integration with multiple industrial sectors. By linking these regions through a wider green network, it is possible to establish a new economic zone that incorporates environmental and ecological considerations.
- Yeoncheon-gun, Pocheon-si, and Cheorwon-gun show high suitability with Model 2 (Energy and Knowledge Prosuming-Park), based on their concentration of underutilized military sites. A regional network connecting these three areas can foster specialized industrialization in the energy, IT, and R&D sectors. Moreover, if extended to include the neighboring Hwacheon-gun—which ranks second in suitability for Model 2—additional synergies can be generated. Similarly, Yanggu-gun and Inje-gun also show strong alignment with Model 2, indicating the potential to strengthen energy- and knowledge-based industries through a broader network utilizing underutilized military sites.
- Ganghwa-gun is the only municipality among the 15 that shows high suitability with Model 3 (Aqua-Integrated Prosuming-Park), which combines water infrastructure with agricultural, educational, and tourism industries. This suggests that Ganghwa-gun can leverage its water-based resources and agricultural potential to simultaneously promote ecosystem conservation and multidimensional development in education and tourism.
- Goyang-si and Chuncheon-si show high suitability with Model 4 (Adaptive Reuse Prosuming-Park), which links aging buildings with multiple industrial sectors, including agriculture, energy, distribution, and tourism. Considering that Goyang-si is a major metropolitan city in the Seoul Capital Area and Chuncheon-si is the administrative hub of Gangwon Province, the conversion of aging buildings into green infrastructure is expected to promote both community participation and urban regeneration.
- Ongjin-gun shows strong alignment with Model 2 (Energy and Knowledge Prosuming-Park) due to its underutilized military sites, but its overall brownfield scale is significantly smaller compared to other municipalities (see Figure 2). Therefore, rather than prioritizing industrial intensification centered on military sites, it is more appropriate to utilize its second-ranked model, Model 5 (Socio-Ecological Prosuming-Park), by converting closed schools into hubs for educational and ecological value enhancement, thereby seeking gradual diffusion and networking strategies.
- Goseong-gun is the only municipality to show high suitability with Model 6 (Cultural-Tourism Prosuming-Park), which is based on disused railways and dismantled monuments. Notably, Goseong-gun’s disused railway resource, the Donghae-bukbu Line, opened in 1937 to connect Samcheok-si in South Korea and Anbyeon-gun in North Korea, but was discontinued in 1967 following the division of the peninsula. Leveraging this historical railway for tourism not only fosters local revitalization but also holds potential for building cross-border cultural and tourism networks in the future.
By integrating the results shown in Table 6 and the discussion of the six models, this study presents the spatial distribution of Prosuming-Parks and their green networking strategies in Figure 4. Using QGIS, Figure 4 visualizes the application of Models 1–6 across the 15 border municipalities, intuitively illustrating the spatial arrangements of the models in relation to local brownfield resources and industrial linkages. This provides a comprehensive perspective on potential utilization strategies throughout the border regions, while also concretely identifying opportunities for inter-regional connections and the formation of broader networks.
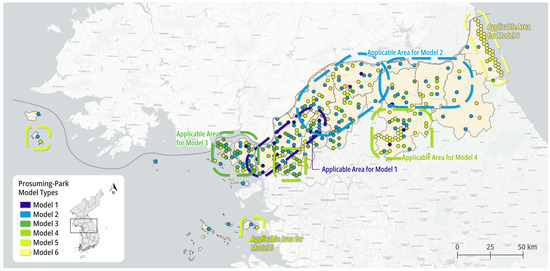
Figure 4.
QGIS-Based Visualization of Prosuming-Park Model Applications in the Border Regions.
The modal model values (M1–M6) were derived by aggregating the model values of points intersecting each hexagon. To include points located on hexagon boundaries, the intersects condition was applied. The results visualize the spatial distribution of the modal Prosuming-Park type for each hexagon using categorical symbols.
4. Discussion
This study redefines the brownfields of South Korea’s border regions through the concept of Prosuming-Parks, which integrate industrial activities with ecological networks, and presents corresponding typology indices and models. Through input–output analysis and case studies, the study confirms that the diverse brownfields in the border regions can be transformed into new economic and ecological assets.
However, as illustrated by the failure of the DMZ World Eco-Peace Park initiative, environmental and development policies in the border regions are still significantly constrained by political–military uncertainties and institutional limitations [52]. Excessive dependence on inter-Korean cooperation may undermine the feasibility of projects at any time, while differences in industrial and social conditions among regions make the uniform application of models difficult. Thus, Prosuming-Park models should not remain at the level of presenting idealized visions but instead must be approached through gradual and multi-layered strategies that internalize political and institutional risks as well as inter-regional disparities.
The contributions of this study can be summarized as follows. First, it defines the brownfields of the border regions not as a single category but as a set of diverse spatial resources and proposes a typology index that integrates them with the industrial–ecological spectrum for evaluation. Second, by quantifying the inter-industrial linkages of the regional economic structure through input–output analysis and incorporating them into the index, this study enhances the practical applicability of the framework. Third, based on this index, six Prosuming-Park models are derived and applied to the brownfield profiles of border municipalities, thereby offering tailored utilization strategies for each locality. Collectively, this approach provides a practical framework that simultaneously addresses industrial restructuring and ecological restoration in the border regions.
The Prosuming-Park models proposed in this study, while applied to the border regions, also hold the advantage of being extensible to other regions where brownfields, as defined in this study, exist. Should inter-Korean environmental cooperation become feasible in the future, these models can be extended into North Korean areas adjacent to the DMZ, thereby forming cross-border green networks. The strength of this approach lies in its ability to visualize and implement concrete strategies that address local challenges, while simultaneously leaving open the possibility of expansion in response to future shifts in inter-Korean relations.
Nevertheless, the lack of complete data on underutilized military sites due to security restrictions remains a limitation of this study. The accuracy of the analysis relies largely on publicly available data and supplementary literature, while the weighting process inevitably reflects the researchers’ judgment. Therefore, future studies should incorporate expert participation and multi-level validation procedures.
Future research is required in the following directions. First, it is necessary to quantitatively predict the diffusion pathways of Prosuming-Parks through multi-layered analysis that integrates GIS-based spatial analysis with input–output modeling. Second, potential green infrastructure resources in North Korea’s border regions should be surveyed and evaluated for hypothetical applications, taking into account possible inter-Korean cooperation. Third, institutional mechanisms for the participation of diverse stakeholders—including local governments, residents, and experts—must be established to translate theoretical models into actionable strategies. Fourth, the potential of utilizing monumental infrastructure should be further explored as a means of creating new opportunities in response to changes in inter-Korean relations.
Finally, this study proposes a phased implementation pathway for Prosuming-Park models. In the short term, pilot projects should be carried out within South Korea’s border regions to verify their feasibility. In the medium term, inter-municipal networks should be established to promote regional diffusion. In the long term, if inter-Korean cooperation becomes feasible, the models can be extended into North Korea’s border regions, thereby evolving into a transboundary green network. Such a gradual approach provides a concrete pathway to transform the border regions into a testing ground for future inter-Korean cooperation and into hubs of sustainable development through the integration of industry and ecology.
Author Contributions
Conceptualization, J.-H.A. and J.-H.P.; methodology, J.-H.A.; software, J.-H.A.; validation, Y.K. and J.-H.P.; formal analysis, J.-H.A.; investigation, J.-H.A. and J.-H.P.; resources, K.-T.K.; data curation, J.-H.A.; writing—original draft preparation, J.-H.A.; writing—review and editing, J.-H.P. and Y.K.; visualization, J.-H.A.; supervision, Y.K.; project administration, K.-T.K.; funding acquisition, K.-T.K. All authors have read and agreed to the published version of the manuscript.
Funding
This research was funded by the KICT Research Program (20250299-001, Development of Low-cost, High-efficiency Construction Technologies for North Korea) funded by the Ministry of Science and ICT.
Data Availability Statement
The data presented in this study are available on request from the corresponding author.
Conflicts of Interest
The authors declare no conflicts of interest.
References
- Jang, H.N. A Study on Problems and Revitalization Plans in the Border Area. J. Bord. Area Reun. Stud. 2021, 5, 99–129. Available online: https://kiss.kstudy.com/Detail/Ar?key=3958723 (accessed on 15 July 2025).
- National Strategy Information Portal. (Defense Reform 2.0). Available online: https://nsp.nanet.go.kr/plan/subject/detail.do?nationalPlanControlNo=PLAN0000031445 (accessed on 2 May 2025).
- Kangwon Domin Ilbo. Available online: http://www.kado.net/news/articleView.html?idxno=1074111 (accessed on 2 May 2025).
- KBS News. Available online: https://news.kbs.co.kr/news/pc/view/view.do?ncd=4193159 (accessed on 2 May 2025).
- Korean Law Information Center. Act No. 19432. Available online: https://www.law.go.kr (accessed on 15 February 2025).
- Government of The Republic of Korea (DocID. 40075). Available online: https://www.korea.kr/archive/expDocView.do?docId=40075 (accessed on 2 February 2025).
- Toffler, A. The Third Wave; Morrow: New York, NY, USA, 1980. [Google Scholar]
- Jones, K.R.; Wills, J. The Invention of the Park: From the Garden of Eden to Disney’s Magic Kingdom; Polity: Cambridge, UK; Malden, MA, USA, 2005. [Google Scholar] [CrossRef]
- Loures, L.; Vaz, E. Exploring Expert perception towards brownfield redevelopment benefits according to their typology. Habitat Int. 2018, 72, 66–76. [Google Scholar] [CrossRef]
- Kim, G.; Miller, P.A.; Nowak, D.J. Urban vacant land typology: A tool for managing urban vacant land. Sustain. Cities Soc. 2018, 36, 144–156. [Google Scholar] [CrossRef]
- Berger, A. Drosscape: Wasting Land in Urban America; Princeton Architectural Press: New York, NY, USA, 2006; Available online: https://books.google.co.kr/books/about/Drosscape.html?id=x2tS8ahhYXUC&redir_esc=y (accessed on 15 July 2025).
- Bowman, A.O.; Pagano, M.A. Terra Incognita: Vacant Land and Urban Strategies; Georgetown University Press: Washington, DC, USA, 2004; Available online: https://press.georgetown.edu/Book/Terra-Incognita (accessed on 15 July 2025).
- Korea Policy Briefing. Available online: https://www.korea.kr/archive/expDocView.do?docId=30429 (accessed on 16 August 2025).
- Korea Policy Briefing. Available online: https://www.korea.kr/briefing/pressReleaseView.do?newsId=156316383&pageIndex=15&repCodeType=&repCode=&startDate=2008-02-29&2019-02-19&srchWord= (accessed on 16 August 2025).
- Ministry of Unification. Available online: https://www.unikorea.go.kr/unikorea/news/release/?boardId=bbs_0000000000000004&mode=view&cntId=55749&category=&pageIdx= (accessed on 16 August 2025).
- Korean Law Information Center. Act No. 20318. Available online: https://www.law.go.kr (accessed on 15 February 2025).
- Status of Public Facilities Aged 30 Years or More (Provided by Korea Authority of Land and Infrastructure Safety). Available online: https://www.data.go.kr/data/15083081/fileData.do (accessed on 14 March 2025).
- Kang, M.J.; Lim, Y.H.; Choi, Y.H.; Choi, J.H.; Oh, H.Y. A Study on the Comprehensive Strategies and Practical Application for Balanced Development in the Border Areas of Northern Gyeonggi Province III; Korea Research Institute for Human Settlements: Sejong, Republic of Korea, 2020; Available online: https://nkis.re.kr/subject_view1.do?otpId=OTP_0000000000006500&otpSeq=0%20%7d&otpSeq=0 (accessed on 15 July 2025).
- Kang, C.G.; Yu, H.S. Hydrogen Industry Strategy in Northern Gyeonggi-Do. GRI Policy Brief 2022, 2022-06, 3–28. Available online: https://www.gri.re.kr/web/contents/resreport.do?schM=view&page=34&viewCount=10&schPrjType=ALL&schStartYear=&schEndYear=&schSubj1=&schSubj2=&schProjectNo=20220429&schBookResultNo=15071 (accessed on 15 July 2025).
- Bak, J.A.; Lee, S.D.; Jeong, D.Y.; Cho, J.H. Public Utilization of Abandoned Military Lands in Gyeonggi-do: Focusing on Yeoncheon-gun; Gyeonggi Research Institute: Suwon, Republic of Korea, 2022; Available online: https://www.gri.re.kr/web/contents/resreport.do?schM=view&page=39&viewCount=10&schPrjType=ALL&schStartYear=&schEndYear=&schSubj1=&schSubj2=&schProjectNo=20220051&schBookResultNo=14998 (accessed on 15 July 2025).
- Lee, N.Y. A study on the characteristics of urban regeneration in border regions using military idle facilities: Focusing on the case of Chuncheon-si, Gangwon-do. Landsc. Geogr. 2022, 32, 206–220. [Google Scholar] [CrossRef]
- National Strategy Information Portal. (Defense Innovation 4.0). Available online: https://nsp.nanet.go.kr/plan/subject/detail.do?newReportChk=list&nationalPlanControlNo=PLAN0000035393 (accessed on 2 May 2025).
- Jung, S.H.; Jung, H.Y. An analysis of types on technological difficulties for the development of spatial construction models in old industrial complexes: A case study of Chuncheon (Hupyeong) general industrial complex in Gangwon Province. Landsc. Geogr. 2017, 27, 183–192. [Google Scholar] [CrossRef]
- Lee, M.Y.; Kang, M.G.; Choi, J.Y. A study on the application of closed school through regional analysis: Focused on the Gyeonggi-do Office of Education. J. Korean Reg. Sci. Assoc. 2021, 37, 37–46. [Google Scholar] [CrossRef]
- Kang, E.; Kwon, J.; Yang, S.B. Utilizing the idle railway sites: A proposal for the location of solar power plants using cluster analysis. J. Intell. Inf. Syst. 2023, 29, 79–105. [Google Scholar] [CrossRef]
- Yoon, S.H.; Ahn, S.H.; Hwang, S.W. Reinterpretation on urban planning facilities as sustainable socio-communal infrastructure. J. Archit. Inst. Korea 2022, 38, 115–124. [Google Scholar] [CrossRef]
- Public Data Portal. Available online: https://www.data.go.kr/ (accessed on 14 March 2025).
- National Statistics on Aging Industrial Complexes (Provided by Korea Industrial Complex Corporation). Available online: https://www.data.go.kr/data/15085876/fileData.do (accessed on 14 March 2025).
- Status of Closed School Properties (Provided by the Office of Education). Available online: https://www.data.go.kr/data/15107729/standard.do (accessed on 14 March 2025).
- Status of Disused Railway Sites (Provided by Korea National Railway). Available online: https://www.data.go.kr/data/15012349/fileData.do (accessed on 14 March 2025).
- Ministry of Education. Available online: https://www.moe.go.kr/boardCnts/viewRenew.do?boardID=316&boardSeq=94873&lev=0&searchType=null&statusYN=W&page=1&s=moe&m=0302&opType=N (accessed on 14 March 2025).
- MBC East Gangwon. Available online: https://www.mbceg.co.kr/post/96411 (accessed on 9 January 2025).
- Eroun-Net. Available online: https://www.eroun.net/news/articleView.html?idxno=31386 (accessed on 9 January 2025).
- Cranz, G. The Politics of Park Design: A History of Urban Parks in America; MIT Press: Cambridge, MA, USA, 1982. [Google Scholar] [CrossRef]
- Cranz, G. Defining the Sustainable Park: A Fifth Model for Urban Parks. Landsc. J. 2004, 23, 102–120. [Google Scholar] [CrossRef]
- Rainer Schmidt Landschaftsarchitekten. Killesberg Park. Landsc. Archit. Korea 2014, 310, 48–57. [Google Scholar]
- Thomas Balsley Associates. Hunter’s Point South Waterfront Park. Landsc. Archit. Korea 2014, 313, 56–73. Available online: https://www.lak.co.kr/greenn/view.php?id=&cid=64055 (accessed on 15 July 2025).
- Architect IF. Coro Field. Landsc. Archit. Korea 2016, 342, 28–37. Available online: https://www.lak.co.kr/greenn/view.php?id=477&cid=64176 (accessed on 15 July 2025).
- Turenscape. Chengtoushan Archaeological Park. Landsc. Archit. Korea 2019, 379, 40–47. Available online: https://www.lak.co.kr/greenn/view.php?id=519&cid=65245 (accessed on 15 July 2025).
- Ahn, G.D.; Lee, N.J. Gyeongui Line Forest Park, the 3rd Phase. Landsc. Archit. Korea 2016, 340, 52–65. Available online: https://www.lak.co.kr/greenn/view.php?id=471&cid=64112 (accessed on 15 July 2025).
- Architect LANDPROCESS. Thammasat University Urban Rooftop Farm. Landsc. Archit. Korea 2020, 389, 14–25. Available online: https://www.lak.co.kr/greenn/view.php?id=533&cid=65504 (accessed on 15 July 2025).
- Sekkei, N. Miyashita Park. Landsc. Archit. Korea 2022, 406, 50–63. Available online: https://www.lak.co.kr/greenn/view.php?id=556&cid=65862 (accessed on 15 July 2025).
- Gewerbepark Dessau-Mitte. Available online: https://gewerbepark-dessau.de/ (accessed on 19 August 2025).
- Battersea Power Station. Available online: https://batterseapowerstation.co.uk/ (accessed on 19 August 2025).
- Nationale Stadtentwicklungspolitik. Available online: https://www.nationale-stadtentwicklungspolitik.de/NSPWeb/SharedDocs/Projekte/Pilotprojekt/energiestadt_baumholder_2020.html (accessed on 19 August 2025).
- The Straits Times. Available online: https://www.straitstimes.com/singapore/hdb-rooftops-to-get-more-urban-farms (accessed on 18 August 2025).
- Public News Network for TTL. Available online: https://www.ttlnews.com/news/articleView.html?idxno=3013029 (accessed on 18 August 2025).
- The Bank of Korea Economic Statistics System (ECOS). Available online: https://ecos.bok.or.kr/ (accessed on 17 August 2025).
- Green Infrastructure Framework. Available online: https://designatedsites.naturalengland.org.uk/GreenInfrastructure/WhatIsGreenInfrastructure.aspx (accessed on 19 August 2025).
- Benedict, M.A.; McMahon, E.T. Green Infrastructure: Linking Landscapes and Communities; Island Press: Washington, DC, USA, 2006; Available online: https://islandpress.org/books/green-infrastructure (accessed on 15 July 2025).
- GOV.UK. Available online: https://www.gov.uk/guidance/natural-environment#green-infrastructure (accessed on 15 May 2025).
- Lee, S.Y.; Kim, S.I. Proceeding Strategies for Establishing of the DMZ World Peace Park for the Laying of the Foundation for Unification. J. Digit. Converg. 2015, 13, 9–24. [Google Scholar] [CrossRef][Green Version]
Disclaimer/Publisher’s Note: The statements, opinions and data contained in all publications are solely those of the individual author(s) and contributor(s) and not of MDPI and/or the editor(s). MDPI and/or the editor(s) disclaim responsibility for any injury to people or property resulting from any ideas, methods, instructions or products referred to in the content. |
© 2025 by the authors. Licensee MDPI, Basel, Switzerland. This article is an open access article distributed under the terms and conditions of the Creative Commons Attribution (CC BY) license (https://creativecommons.org/licenses/by/4.0/).