1. Introduction
In a world increasingly impacted by climate change, the risk of floods is escalating, particularly in urbanized landscapes. When natural permeable landscapes are transformed into impermeable surfaces, the infiltration capacity of the landscape is reduced, and the rates and volume of runoff generated by precipitation events are increased [
1,
2]. As climate change modifies precipitation patterns and elevates sea levels in complex and often uncertain ways, there is an urgent need for adaptive, resilient, and effective flood risk management (FRM) approaches [
3].
A variety of FRM approaches are being piloted in urban areas. These can be broadly classified as resistance approaches, Nature-Based Solutions (NBSs), and community-scale transformations including managed retreat, each with a fundamentally different approach to risk reduction. Resistance approaches, such as dams and levees, provide immediate relief by physically attempting to keep water away from flood vulnerable communities. However, their static design may lead to obduracy and limit their long- term protective value, as climate change and urbanization processes continue [
4]. Studies such as Jongman [
4] have detailed the efficacy of resistance measures in providing protection against flood events. However, DiFrancesco [
5] spotlights the inflexibility of resistance approaches in the face of climate change, also calling attention to their significant maintenance costs and potential for ecological disruption.
By contrast, NBSs and other non-structural measures, including land use planning, early warning systems, and the enhancement of natural flood management features like wetlands, present a more flexible approach. Although they may require more time to implement, NBSs offer long-term benefits that resistance approaches do not, including restoration of ecosystem features, biodiversity conservation, and other community co-benefits [
6,
7,
8]. For example, Ahern [
6] and Benedict [
9] argue that NBSs are sustainable because they mitigate flood risks while also enhancing biodiversity, improving water quality, and providing recreational spaces. Mach et al. [
10] emphasize the role of NBSs in accommodating water as part of a managed retreat strategy that also reduces the pressure on drainage systems. Eriksen [
11] and Reid [
12] provide examples from low-income countries where community-based NBS strategies have successfully built resilience to flooding, underscoring the importance of local knowledge and stakeholder engagement in the planning and implementation processes.
However, and despite the growing body of evidence supporting the benefits of NBSs, challenges remain in their wider adoption. These include funding limitations, the need for interdisciplinary and cross-jurisdictional planning, and the fact that it may take a relatively long time before many NBS benefits, already difficult to quantify, will accrue. NBS research needs include the development of robust methodologies for evaluating their cost-effectiveness, integrating their operation with technological advancements, and fostering policy frameworks that support the integration of green and gray infrastructure. For instance, a critical examination by Chiu [
13] suggests that while NBSs can offer long-term resilience and ecological benefits, their effectiveness in extreme flood events can be limited without the support of structural measures. The study calls for an integrated approach, leveraging the strengths of both NBS and traditional methods to achieve optimal flood risk management.
The transformative, managed retreat approach to FRM gradually adjusts where and how people live in flood prone communities. Managed retreat refers to a sequence of actions, which ideally emerge from extensive community dialog, robust vulnerability assessments, and studies into potential changes in land use and repurposing of land that gradually move people and infrastructure away from flood hazard areas [
14]. Advocates of managed retreat suggest that it is the only adaptation option for some communities. However, this approach needs to be undertaken carefully and with extensive input for those whose homes and lives could be impacted.
Recognizing the importance of exploring trade-offs between these three approaches, the Intergovernmental Panel on Climate Change (IPCC) and other entities have highlighted the need for studies that delve into the effectiveness of different adaptation strategies. Without such analyses, there is a risk that well-intentioned FRM strategies lead to unintended tradeoffs and consequences, typically referred to as maladaptation [
3]. Cea et al. [
15] provides a comprehensive overview of urban flood risk, highlighting the multifaceted challenges cities face due to complex flood sources—such as riverine, pluvial, and tidal floods—and the exacerbating effects of urbanization and climate change. The authors discuss a range of flood modeling techniques, from 1D and 2D hydrodynamic models to GIS-based and machine learning approaches, emphasizing the need for integrated models that capture both large-scale processes and fine urban details. Traditional flood defenses are reviewed alongside NBSs, with the authors advocating for hybrid approaches that blend engineered infrastructure with natural systems to boost urban resilience. The article stresses adaptive management in the face of climate uncertainty, recommending strategies such as flexible infrastructure, continuous monitoring, and community engagement to support dynamic and sustainable flood risk management [
15].
This paper is a comparative analysis of three distinct flood risk reduction approaches in a Philadelphia community that is subject to compound flood risks. This community is ideal for this study because the leading FRM alternatives under consideration by local decision-makers and researchers include a resistance strategy (e.g., a levee that has been analyzed extensively by the US Army Corps of Engineers), an NBS strategy (e.g., watershed-scale green stormwater infrastructure that has emerged out of a watershed planning process), and a community-initiated proposal for managed retreat (e.g., a land swap proposed by members of a local community-based organization). Through computer simulations of flood exposure under historical and future climate scenarios, the study aims to compare the efficacy of each approach in mitigating flood risks. We are specifically interested in whether the newly conceptualized NBSs and managed retreat approaches offer benefits over the more extensively studied USACE levee.
2. Materials and Methods
2.1. Site Description
Eastwick, as depicted in
Figure 1, is a mostly Black environmental justice community located at the downstream end of a 205 km
2 largely suburban watershed near the confluence of the Darby and Cobbs creeks, about 5 km from their confluence with the Delaware River. It is a low-lying community that presently experiences frequent fluvial flooding and in the future also coastal flooding [
16] with most of the community within the FEMA 100- and 500-year floodplains. Eastwick meets the criteria outlined by the Environmental Protection Agency (EPA) for an Environmental Justice community, with a majority (76%) Black population, and pockets of low-income residents. Currently, there is insufficient information available on how to reduce Eastwick’s long-standing flooding problem. Situated close to the 1.2 km
2 John Heinz National Wildlife Refuge, Eastwick is also adjacent to portions of the Lower Darby Creek Superfund Site. This proximity increases the health risks associated with any flooding events in the area. The combination of environmental challenges, frequent flooding, and demographic characteristics underscores the need for comprehensive assessment and planning to address the many resilience needs of the Eastwick community.
2.2. Flooding in Eastwick Caused by Tropical Storm Isaias
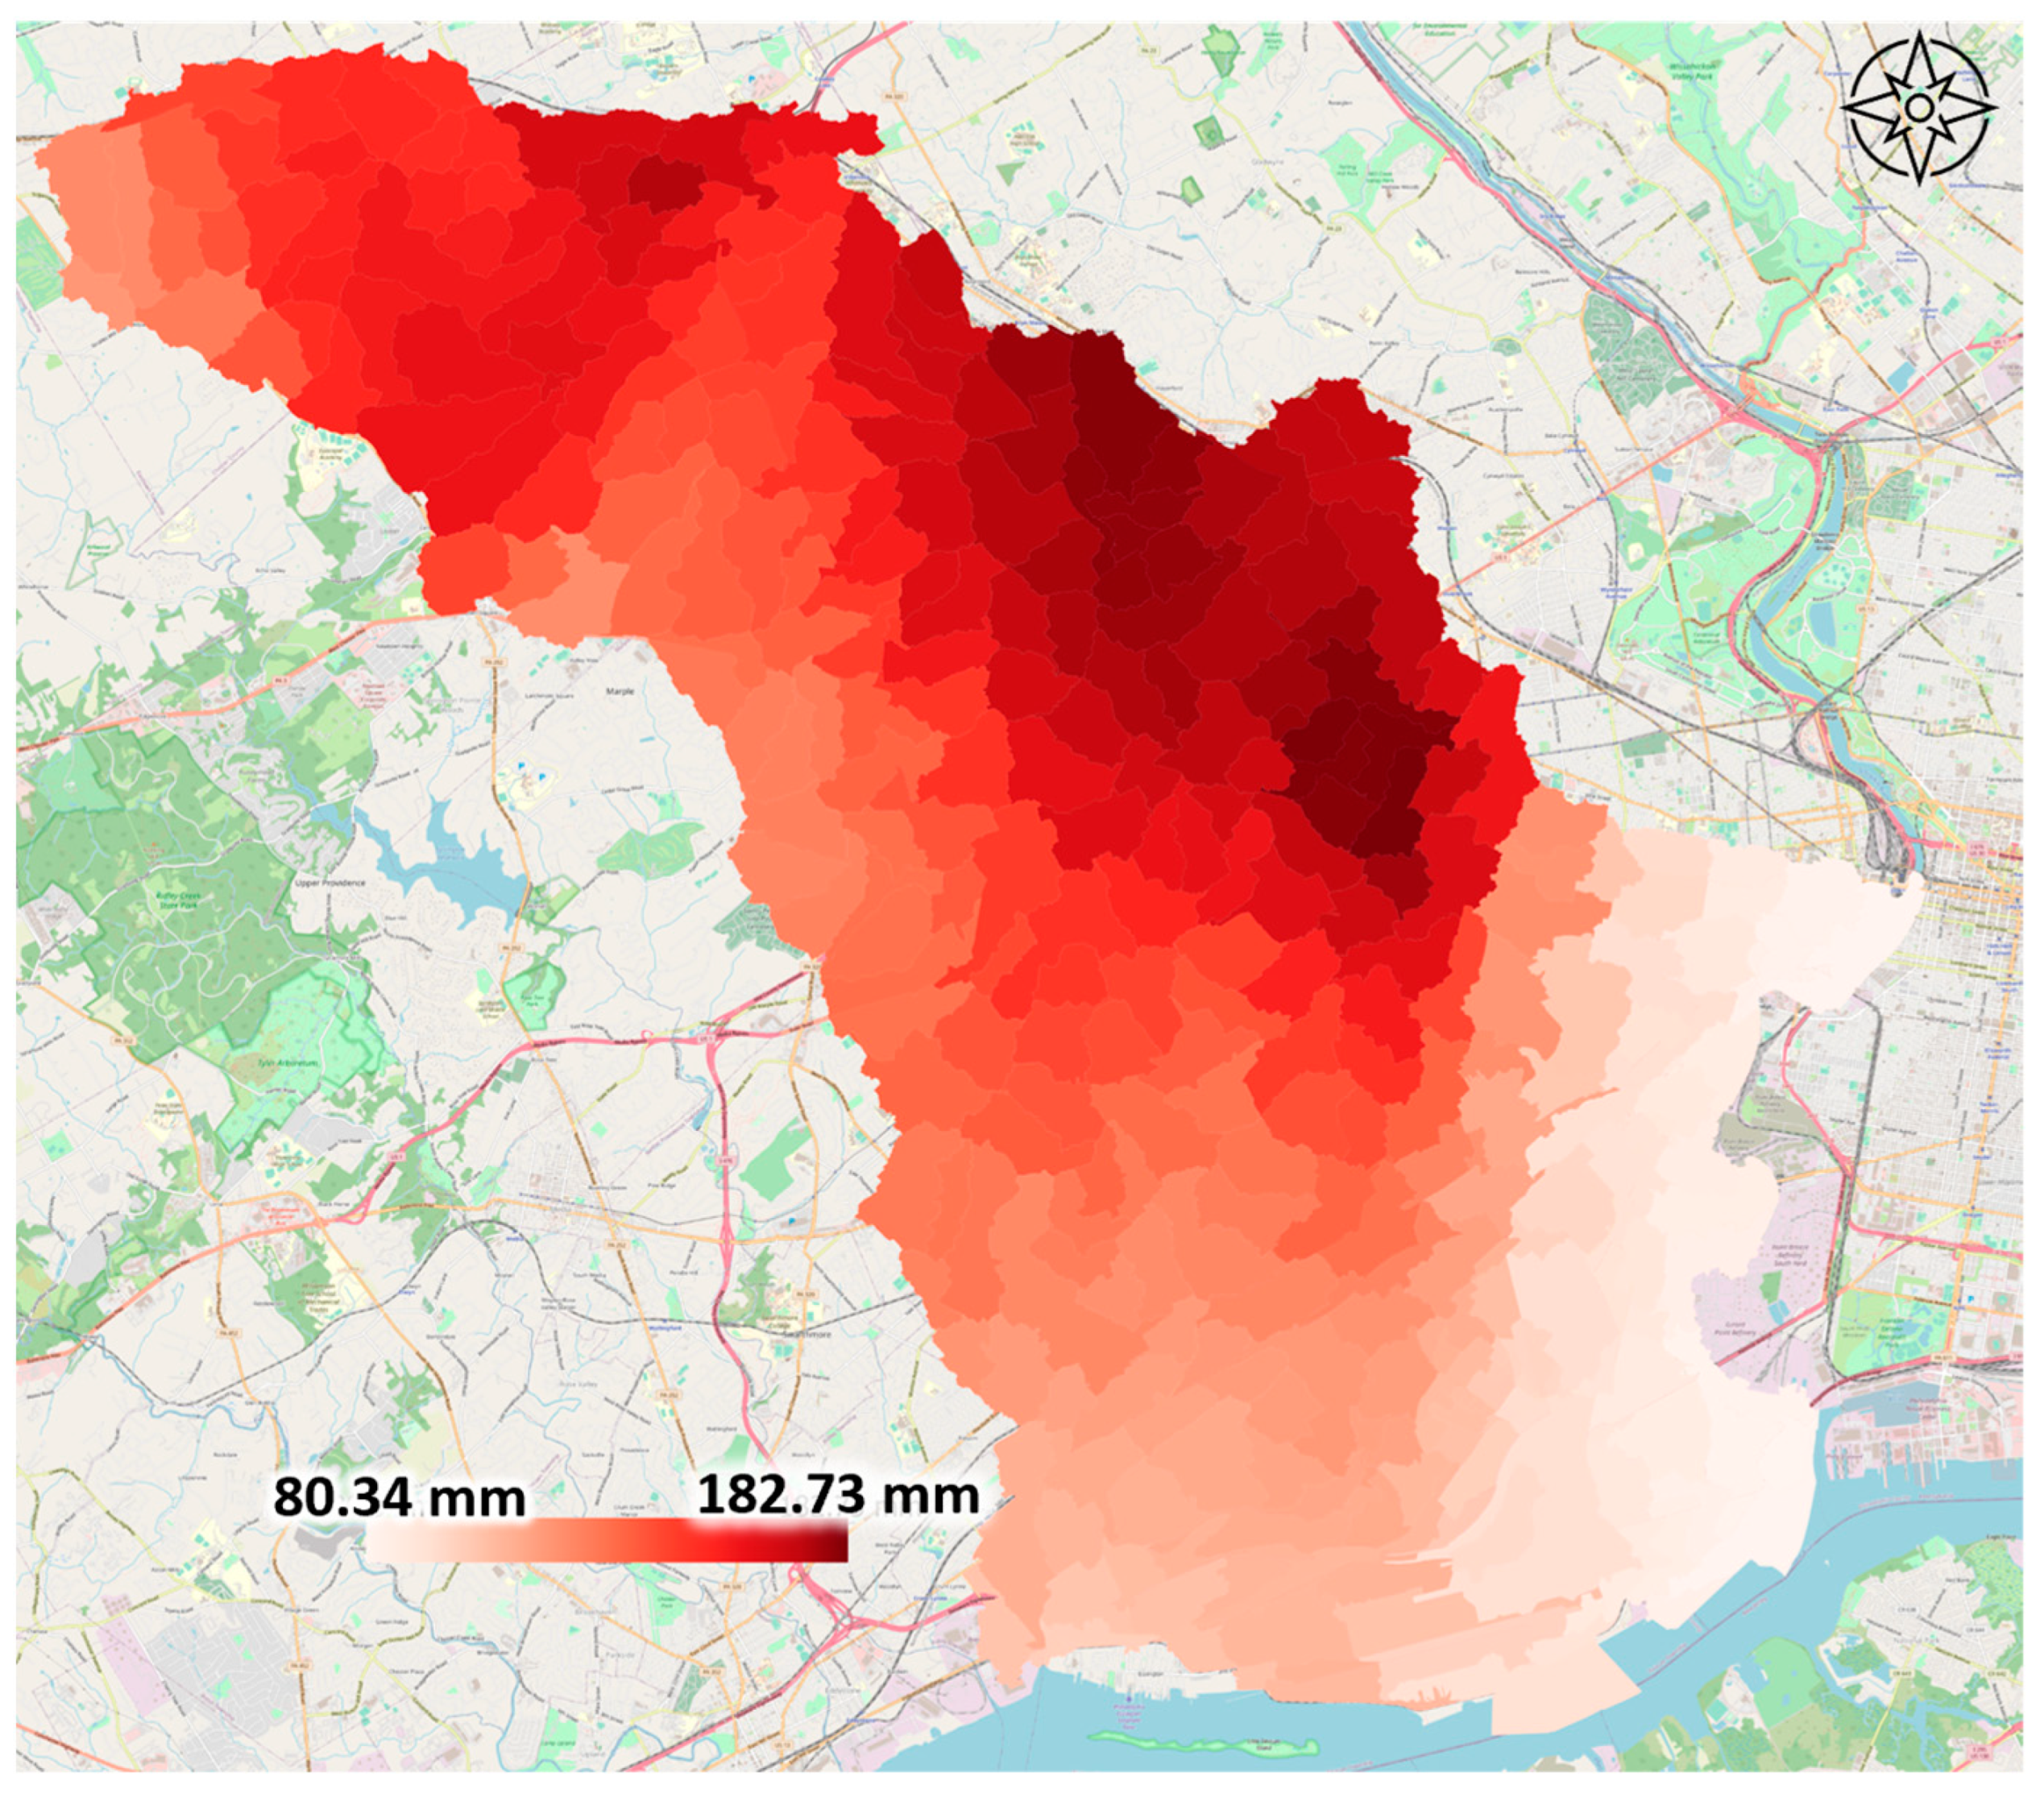
Eastwick has flooded for decades. As of this writing, the most recent extreme flood occurred in August of 2020 when extreme precipitation in the upper reaches of the watershed (
Figure 2) brought about by Tropical Storm Isaias, produced high riverine flows that persisted through two full tidal cycles. This storm inundated large parts of Eastwick under almost 1 m of water and required the evacuation of residents. When the flood waters receded, several blocks were rendered uninhabitable. Tropical Storm Isaias deposited nearly 203 mm of rain in the upper suburban portions of the watershed and only 63.5 mm in Eastwick where flooding was worst (
Figure 2). In this region, climate change is expected to exacerbate these conditions in the years to come.
2.3. Model Development
An integrated 1D-2D H&H model was developed, calibrated, and validated to represent the flooding in Eastwick. A detailed description of the model is provided elsewhere [
17,
18], with only a summary provided here.
The model was developed in PCSWMM (Guelph, Canada), a proprietary version of EPA SWMM. The model domain includes the watersheds associated with Darby and Cobbs creeks, a composite area consisting of approximately 205 km
2 of largely suburban and urban land uses. The regions upstream of Eastwick were modeled in 1D, while Eastwick itself was modeled in 2D, as described below. The model is built on a 1 m resolution LIDAR-based raster DEM (2018) merged with boat-surveyed bathymetric data from the USACE, impervious surfaces, soil types, land use, and stream centerlines from the Pennsylvania Spatial Data Archive (PASDA), and field surveying of select bridges, culverts, and storm drains. PCSWMM’s Watershed Delineation Tool was used to discretize the entire watershed into subcatchments that were between 0.936 and 342.364 ha in size. The % impervious, slope, area, and width of the subcatchments were established based on the geospatial datasets described above.
Table 1 displays the Manning’s n and depression storage values used for different surface types. Subarea routing was to the subcatchment outlet and the percent routed was 100%. Infiltration was modeled using the Green Ampt equation with capillary suction, saturated hydraulic conductivity derived from the watershed soil types (principally silty loam). Though only event-based simulations were performed, monthly average evaporation values were loaded into the model; groundwater was neglected after inspecting several recent geotechnical boring reports which suggested that water tables were significantly below existing grade. Baseflows were added to Darby and Cobbs creeks based on an analysis of several years of summer dry weather flows as reported by USGS on the two gage sites: Darby Creek, near Darby, PA (01475510), Cobbs Creek at Mt. Moriah Cemetery (01475548). Steady baseflow rates of 1.5 cms and 0.5 cms, respectively, were assumed for Darby and Cobbs creeks. Model boundary conditions include streamflow from USGS01474500 at the Schuylkill River dam, and Delaware River water levels measured by NOAA at the Ben Franklin Bridge (Gage ID: 8545249) and Marcus Hook (Gage ID: 8540433). Each 1D-2D simulation began 12 h before the target rainfall to let the various surface water bodies fill up, initializing the model.
In the larger watershed, the layout of the drainage network was based both on the PASDA stream centerline layers and flow pathways identified through the watershed delineation process. Details regarding the engineered drainage system in the larger watershed were not available to the project team. Thus, conduits used to represent upstream flow pathways were assumed to be open channels except for those representing 10 locations in the Cobbs watershed, and 9 locations in the Darby watershed where the respective creeks pass under overpasses. In these locations, the creek was represented as a rectangular culvert with dimensions based on field surveying conducted by the research team. All the inverts and slopes are based on bathymetric data made available to the project team, the DEM, and best professional judgment. Manning’s roughness values for the center, left, and right overbanks were established based on [
19,
20] with an average of 0.05 across the channels and an average of 0.085 for the banks. Cross sections of the larger streams, as the boundaries of the watershed model, and Darby Bay are imported from a HEC-RAS model shared by AKRF [
21].
Because the study involves the potential for water to back up at hydraulic constrictions, flow through the hydraulic system was modeled using a dynamic wave with 0.5 s computational time steps (per PC-SWMM recommendation for 2D modeling). Unlike the kinematic wave routing method, it allows simulation of hydraulic phenomena like backwater effects, flow reversals, pressurized flow, and energy losses at entrances and exits [
22]. The timesteps were 15 min, 10 min and 5 sec for reporting, dry/wet weather and routing, respectively. All the nodes were assigned 9.3 sqm (100 sf) of ponded area. Precipitation from a quality-controlled, gage adjusted radar rainfall (GARR) product, produced at 1 km
2 resolution by Vieux Associates, was applied to the subcatchments.
2.3.1. One-Dimensional and Two-Dimensional Flow Pathways
In the upstream sections of the watershed, the outlet of each subcatchment was set to the closest 1D node, from which it flows through the 1D drainage network until if and when it encounters a 1D–2D connection node that allows it to enter the 2D surface used to represent Eastwick.
The 2D mesh was only included in the low-lying region encompassing and surrounding Eastwick (e.g., all portions of the watershed below 6 m in elevation). The 2D hexagonal mesh had a resolution of 7.6 m, 13.7 m and 30.5 m for the water pathways (such as streams and streets), main land surface, and the open water bodies, respectively (
Figure 3).
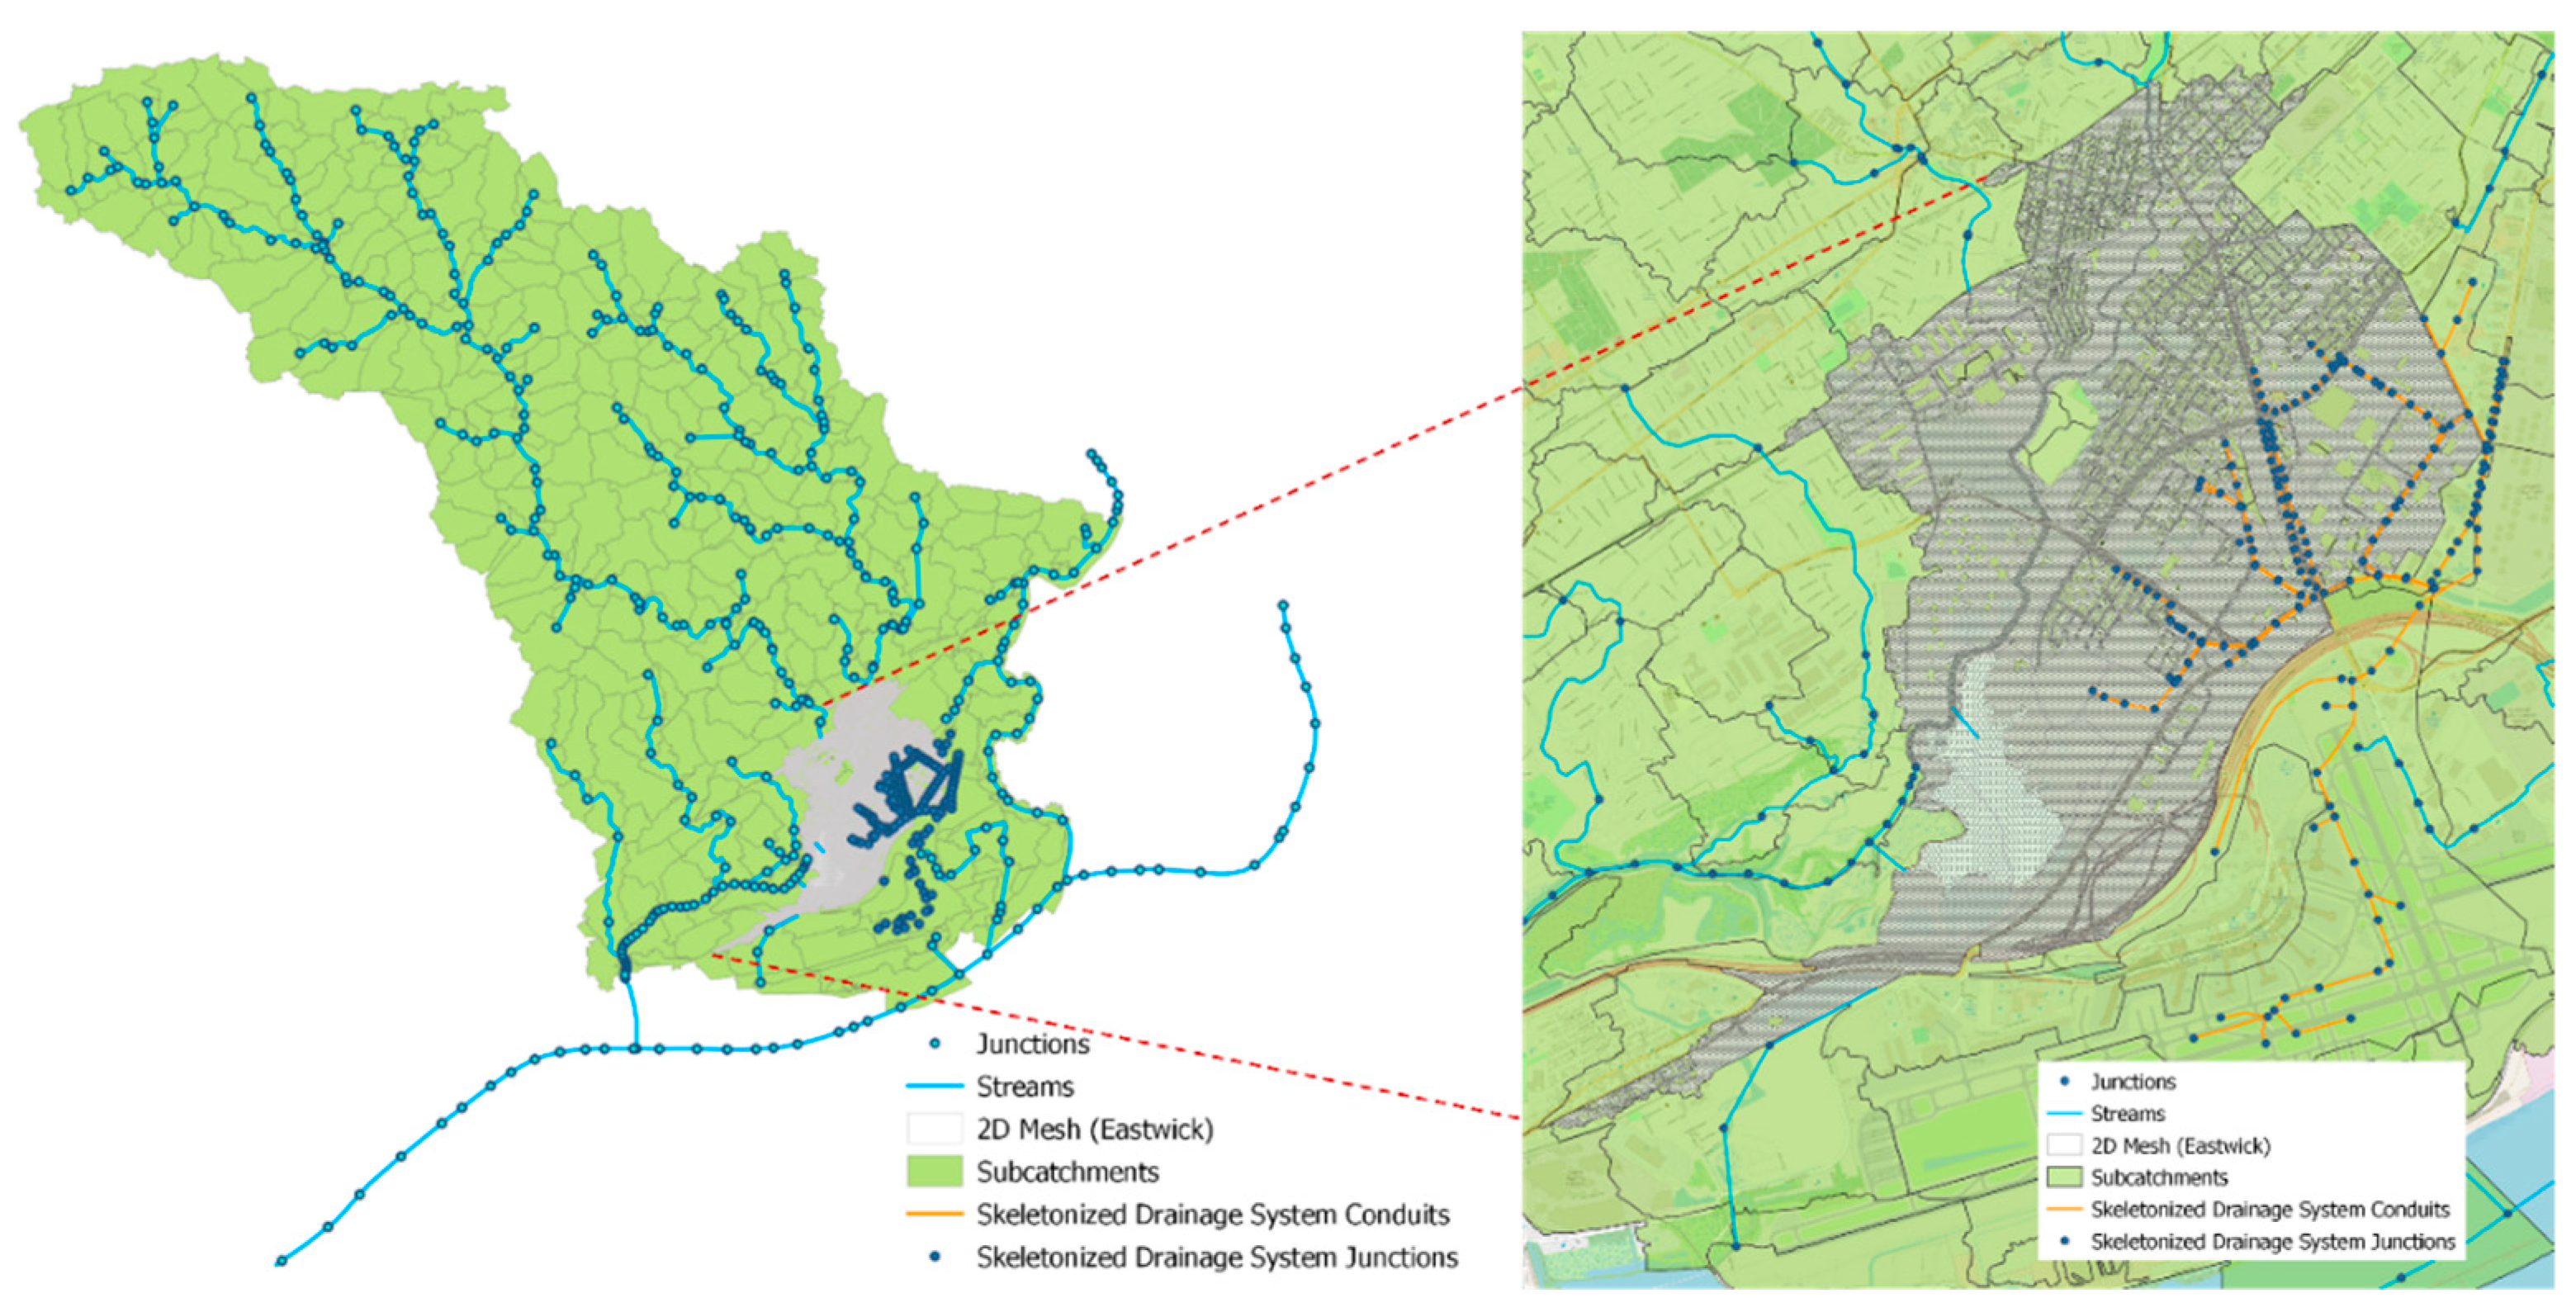
Unlike in the upstream portions of the model, in Eastwick some information about the drainage network was available. In this version of the model, only the main trunk lines of Eastwick’s drainage system were included (
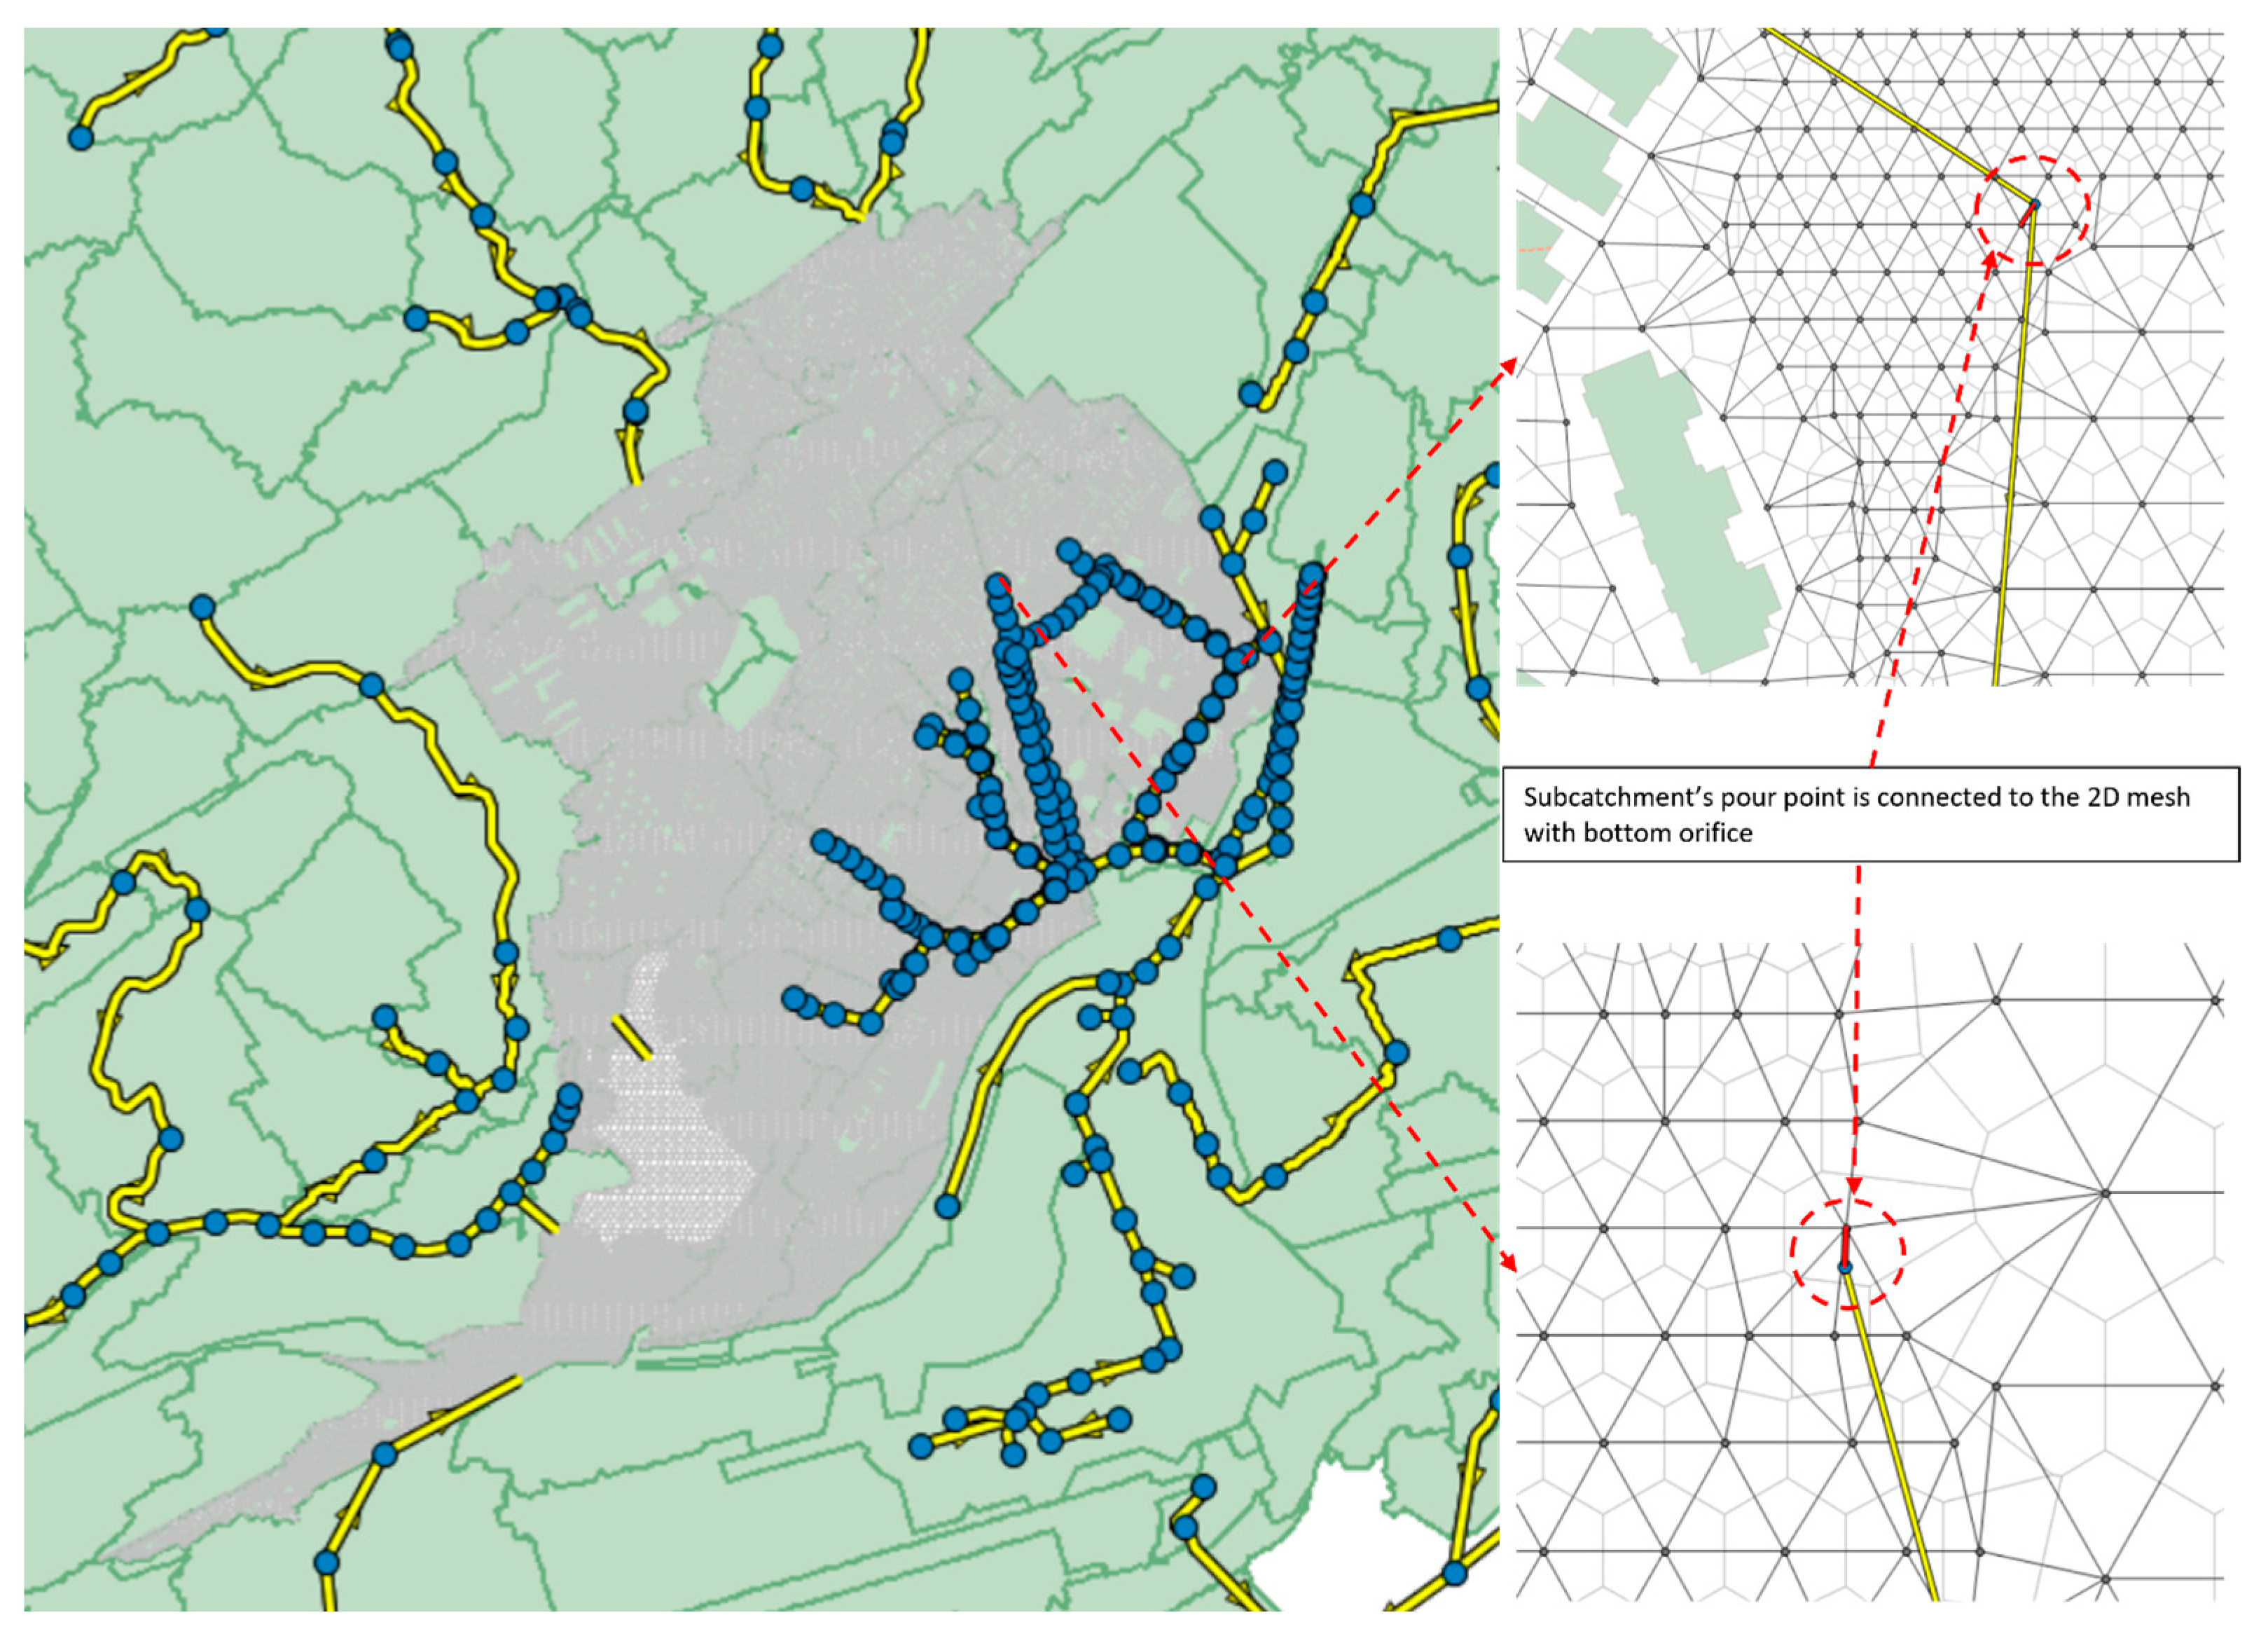
Figure 4). Other drainage flow paths were simplified, and flow could leave the mesh through the creek system, as well as through six pump stations in Mingo Creek. The pour points of subcatchments within the area covered by the mesh were set to the nearest 1D nodes. The pour points of several subcatchments that were >25 m from the nearest segment of the skeletonized drainage system were reassigned to the 2D node closest to their centroids. The 1D nodes were connected to 2D nodes through the use of the rectangular (3 m × 3 m) bottom orifices that allowed the water to move unobstructed between the 1D and 2D model elements (
Figure 5). Water on the mesh flowed through 2D conduits connecting the 2D nodes in the direction of the topographic gradient. A total of 91,378 hexagonal mesh elements were included in the model, with no seepage. The 2D conduits have a roughness of 0.06, 0.035, 0.05, 0.1 and 0.15 for streams, streets, grassland, developed and forest lands, respectively, and slopes based on the DEM. The Manning’s roughness values for the 2D mesh were established based on values suggested by Multi-Resolution Land Characteristics (MRLC) Consortium [
23]. An initial depth of 0.6 m was assigned to all the 2D nodes within the streams and a large impoundment located inside the Heinz Wildlife Refuge.
It is worth noting that determining the appropriate degree of resolution to use to represent the subcatchments and drainage system within the 2D mesh area is an ongoing area of our research, with a paper comparing low and high resolution with both skeletonized and all pipes representation of the drainage system in preparation.
2.3.2. Model Calibration and Validation
In this version of model, calibration and validation processes were used to select the proper level of resolution to use in the model design, as well as to assess the goodness of fit of the model predictions. The 2D model was calibrated using various parameterizations of the drainage network, with the skeletonized approach selected to achieve a balance between computational efficiency and accuracy [
18].
Table 2 summarizes the steps required to develop the skeletonized model from the original watershed model.
For the validation, as described in Nasrollahi et al. [
17], simulated runoff hydrographs were compared to stream stage observations at USGS gages 01475510 (Darby Creek, near Darby, PA), 01475548 (Cobbs Creek at Mt. Moriah Cemetery), and 0147553 (84th Street) for Tropical Storm Isaias (2020), as well as Hurricanes Irene and Lee (2011).
2.4. Adaptation Strategies
Three adaptation scenarios are quantified, assessed, and compared. These three approaches represent three of the leading approaches to FRM under consideration in urban areas: the NBS approach (#1), the resistance approach (#2), and managed retreat (#3). Each of these approaches is described in greater detail below.
2.4.1. Approach #1: Optimized Watershed-Scale NBS Approach Featuring Green Stormwater Infrastructure (GSI)
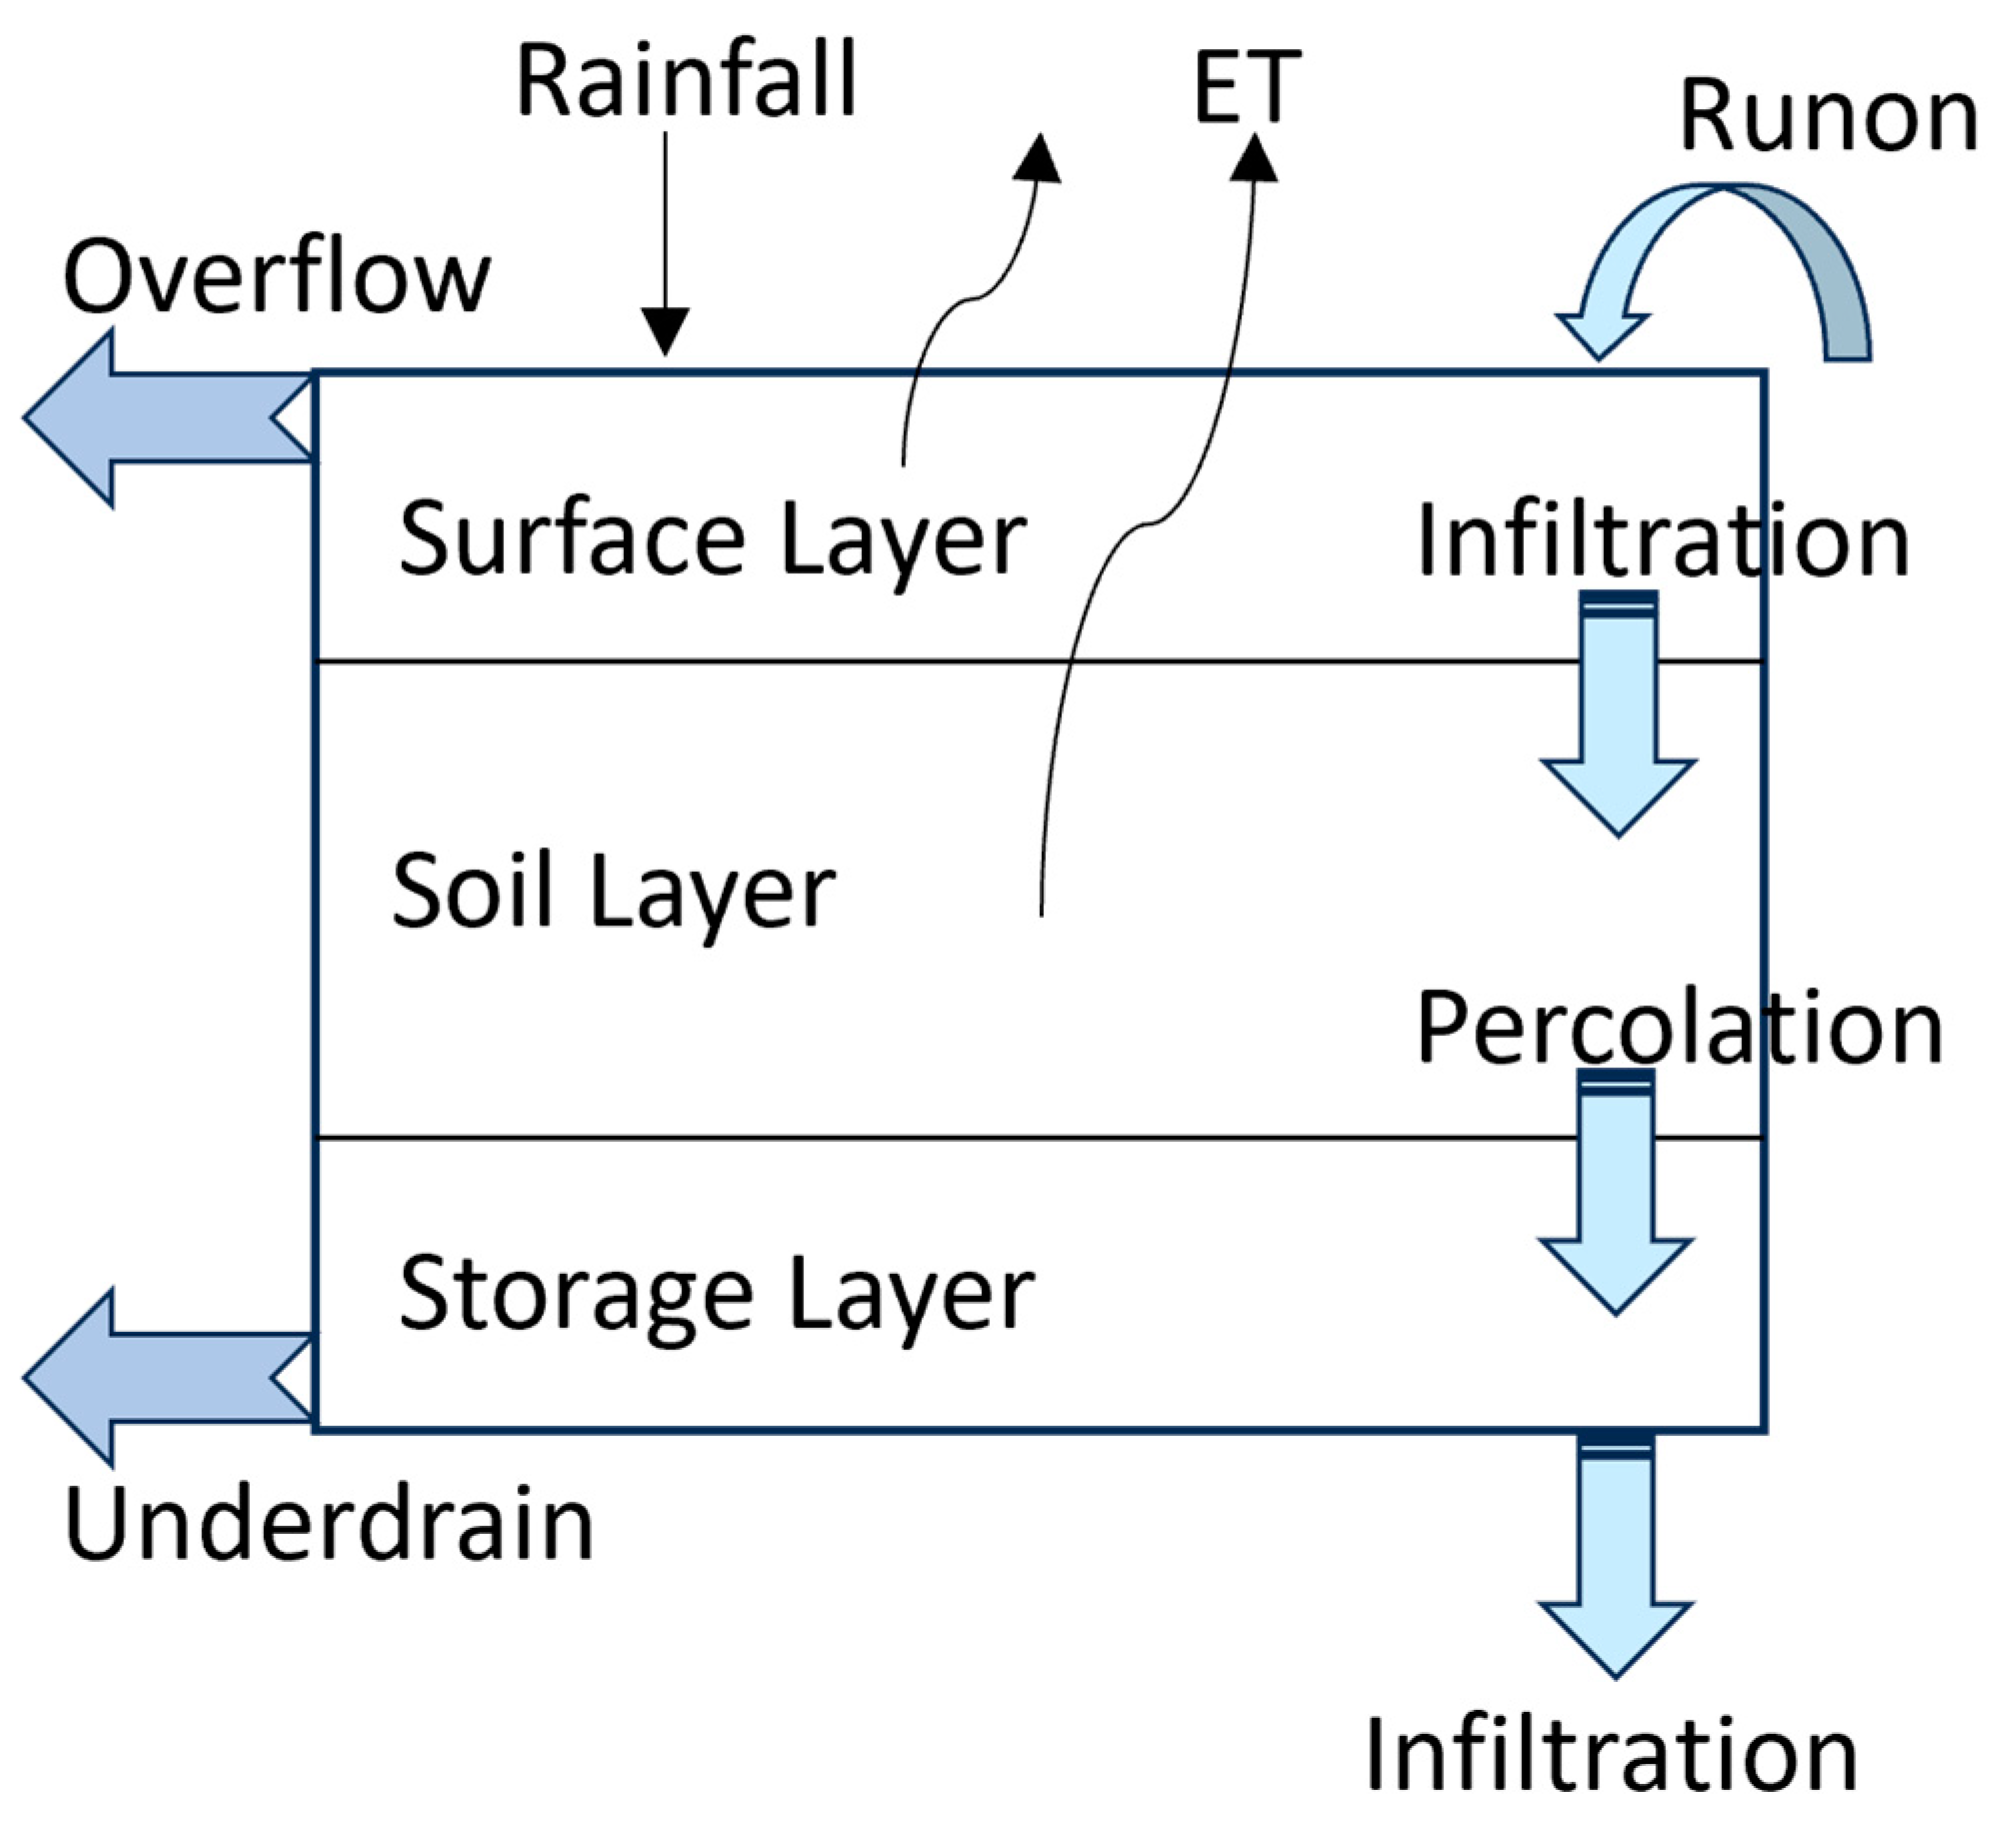
Approach #1 utilizes GSI to capture stormwater in the upstream watershed, theoretically to reduce downstream flooding in Eastwick. Since the precise level of GSI that would be required to reduce flooding was not known, the model was used to compare the effectiveness of different GSI schemes at reducing flooding associated with TS Isaias. These schemes differed from one another based on the percent of impervious area treated and the hydraulic loading ratio (HLR) (e.g., the ratio of a GSI practice’s catchment area to its own area) associated with replicate GSI facilities, each assumed to be a 28 m
2 (e.g., 300 sf) bioretention practice (
Figure 6).
This analysis, described in greater detail in Nasrollahi et al. [
24], began by contacting the 31 upstream communities to quantify the level of GSI each intends to implement as part of its ongoing effort to comply with local and federal water quality regulations. The towns are required to manage stormwater to comply with federal (e.g., Clean Water Act), state (e.g., PA Stormwater Management Act of 1978-Act 167), and county clean water regulations. Because water quality impairment of the Darby and Cobbs creeks is primarily due to sediment inputs, stormwater management goals—articulated through Pollutant Reduction Plans (PRPs)—strive to reduce sediment loading. As of this writing, 26 of the 31 municipalities have publicly made these plans, making up roughly 4/5 of the land area within the watershed. Nine of the 26 municipalities (Upper Darby, East Lansdowne, Yeadon, Darby Township, Collingdale, Morton, Sharon Hill, Darby Borough, Glenoldon) collaborated to form the Eastern Delaware County Stormwater Collective (EDCSC) and submitted one PRP. The municipalities are required to update their PRPs every five years, A total of 18 PRPs were reviewed by the authors.
Based on the type and area of stormwater best management practices (BMPs) cited in the current round of PRPs, we estimate that NBS approaches to stormwater management, including GSI, could treat, at most, 12% of the impervious areas of the watershed (or 5% of the total watershed area as shown in
Table 3. The project team conducted some preliminary model runs and concluded that this level of NBS application would be inadequate to reduce flooding in Eastwick under an event like TS Isaias.
To determine what level of NBS would provide a flood mitigation benefits, additional modeling was performed assuming that upstream GSI was in the form of replicate bioretention facilities, each 28 m
2 in area, that receive runoff from catchment areas that are between 5 and 10 times their size (e.g., their hydraulic loading ratios—or HLRs were varied to between 5 and 10. Multiple model runs were performed treating 0–40% of the total watershed (or 0–80% of the impervious areas)–see
Table 4.
We selected bioretention due to its suitability for retrofit applications in urban and suburban land uses. Key operating parameters, such as hydraulic loading ratio, berm height, soil composition, porosity, and infiltration rates, were based on industry standards for urban stormwater management and adapted to match the specific hydrologic conditions of the Darby-Cobbs watershed. Bioretention was added to the model uniformly using PCSWMM’s LID controls. This analysis revealed that if 65% of the watershed’s impervious surfaces were directed to 28 m
2 bioretention practices, each of which treated runoff from an area 5× its size (e.g., HLR = 5), fluvial flooding of Eastwick during TS Isaias would have been significantly mitigated. This scenario, which would treat stormwater flows from 25% of the total watershed area, an area roughly equivalent to all of its parking lots, rooftops, and some roadway surfaces, is defined as Approach #1.
Table 5 summarizes other parameters used to represent the GSI in the model.
2.4.2. Approach #2: Physical Protection Approach Proposing Constructing a Levee in Eastwick
Approach #2 was developed based on the Tentatively Selected Plan (TSP) of the US Army Corps of Engineers (USACE) for a FRM strategy for Eastwick [
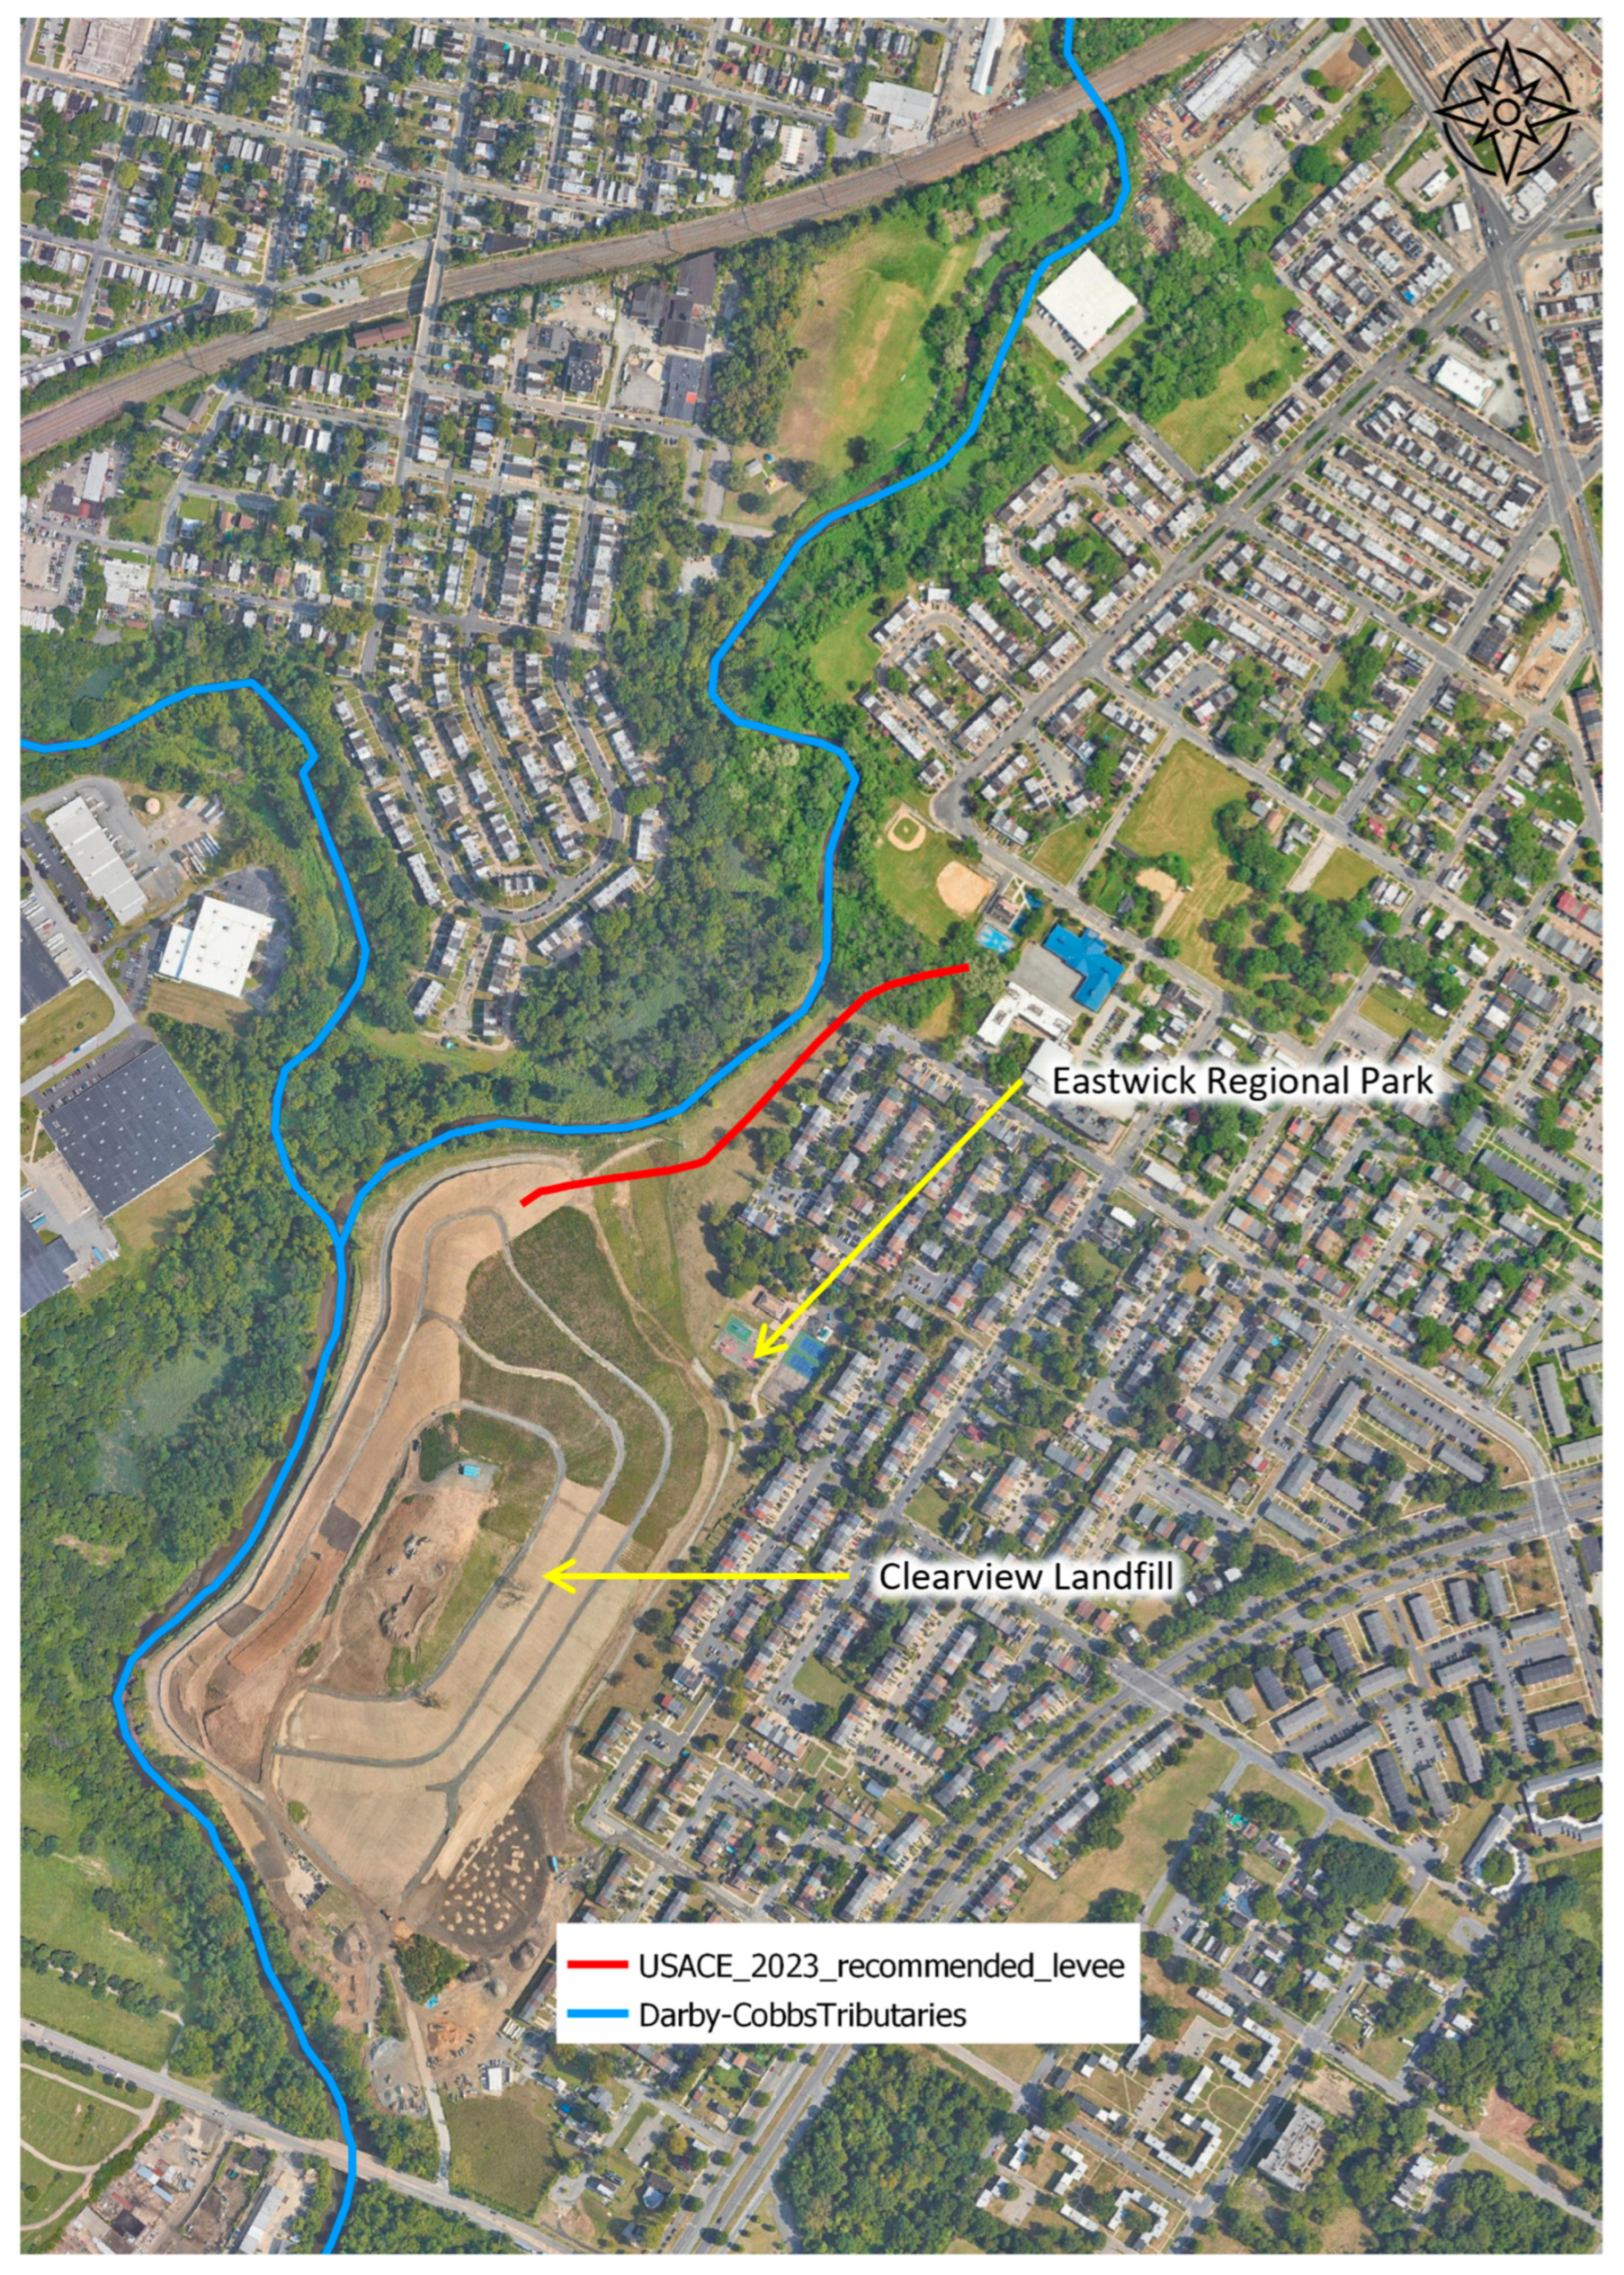
25]. In partnership with the Philadelphia Water Department (PWD), USACE has proposed a levee along the east bank of Cobbs Creek, situated within the city-owned Eastwick Regional Park and Clearview Landfill (
Figure 7). The USACE levee design is based on extensive analysis and engineering studies by the Corps. The top of the levee is proposed at an elevation of 7.5 m (24.7 feet NAVD 88), with a section designed for managed overtopping at a slightly lower elevation of 7.2 m (23.7 feet NAVD 88,
Figure 7). This TSP aims to mitigate fluvial flood risks associated with Darby and Cobbs Creek water levels up to the 1% Annual Exceedance Probability (AEP), with levee overtopping expected during more significant flood events, and additional optimization of the design expected in future project design phases.
The levee would primarily reduce fluvial flooding in Eastwick. However, as acknowledged by the USACE [
26], by keeping Cobbs Creek flows out of Eastwick, the levee would induce flooding at points upstream and downstream and on the west side of Cobbs Creek. Compared to the fluvial condition, the levee is assumed less effective at managing pluvial, coastal, and compound flood events.
To simulate Approach #2, the elevations of the 2D mesh nodes located within the proposed levee alignment were raised to the USACE top of berm elevation (
Figure 8).
2.4.3. Approach #3: Managed Retreat Approach That Would Move Eastwick Residents to Higher Elevations Through a Land Swap Proposal
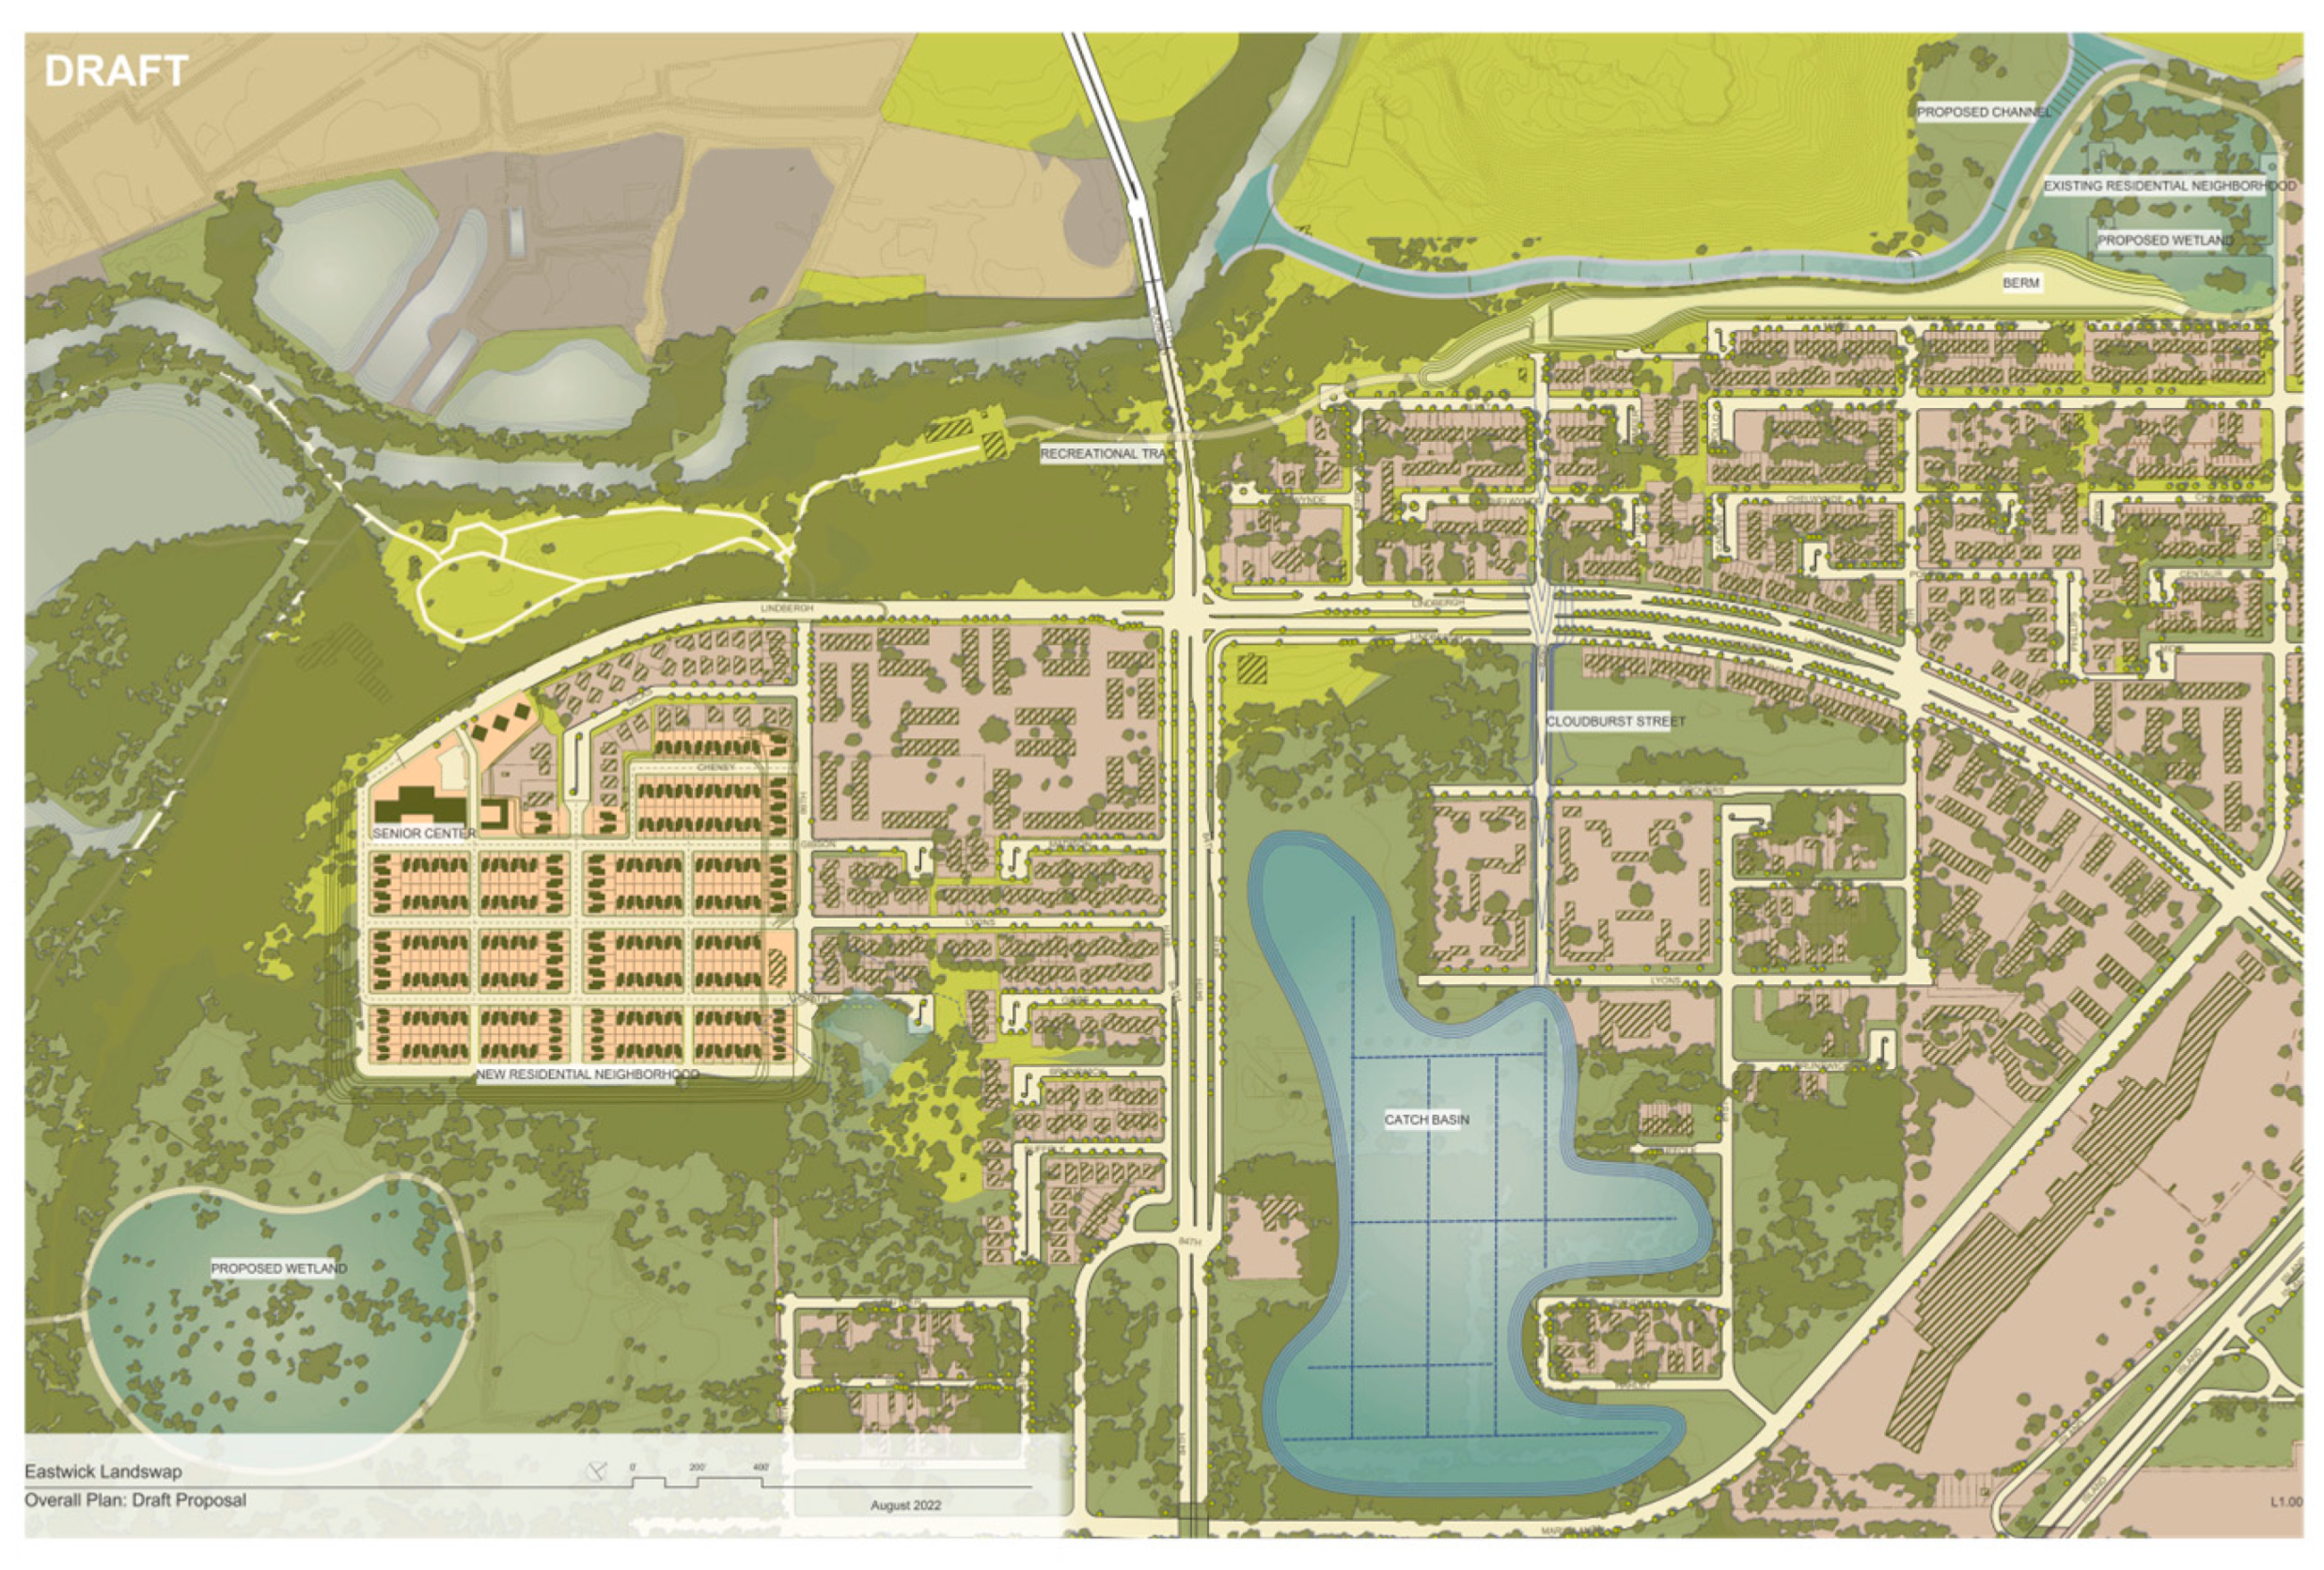
Approach #3 is a land swap concept that was conceived by Eastwick United Community Development Corporation, translated into a physical design by Drexel University design students, and eventually refined into a concept plan (
Figure 9 and
Figure 10) by a Philadelphia-based urban design firm (Olin) working with the research team. The plan is only feasible because the City of Philadelphia owns a large tract of vacant land in Eastwick, a portion of which lies above the present day 500-year flood plain. Through the proposed land swap, flood-prone Eastwick homeowners would be allowed to swap title with the City and move to new flood-resilient housing constructed at higher elevation land. The design is attractive to some Eastwick residents because it does not require participation of upstream communities (as is required by Approach #1, the NBS approach), would not require Congressional approval and funding (like Approach #2, the levee), and would enable residents to reduce their flood risk without having to permanently leave the community.
Figure 11 shows the locations of flood prone households (in orange) that would be relocated to the new development (in yellow). The vacated area would be restored to a new fluvial floodplain and ecologically restored to freshwater tidal wetlands. An earthen berm would be constructed behind the wetlands using the regraded material. The design also calls for recontouring of a second parcel of vacant land located to the NE of 84th street (e.g., the decommissioned Pepper School) so that it can serve as a detention basin for coastal flood waters entering Eastwick from the south.
To construct the land swap model a modified DEM that contained all the land swap features was utilized to regenerate the 2D mesh. The relocated houses near Cobbs Creek and the Pepper School were removed from the building layer that was used to indicate surface obstructions to flow. Once the new 2D mesh was created, the elevations of the 2D mesh junctions along the alignment of the proposed earthen berm were raised to elevations between 4.4 and 7.5 m per the proposed plan.
2.5. Climate Change Scenarios
To compare the effectiveness of the three different adaptation approaches, each model was subjected to two different climatic forcing scenarios. In Scenario #1, the models were forced with GARR precipitation and Delaware River and Schuylkill River water levels as recorded during TS Isaias. In Scenario #2, the time series representing precipitation and the tidal boundary conditions were made more severe to reflect high-end, late-century projections of compound climate change in the Philadelphia region (e.g., 50% increase in precipitation intensity and 1.2 m of sea level rise).
From a climate adaptation planning perspective, the conditions assumed in Scenario #2 are conservative, but also plausible given the latest climate projections for the Philadelphia region [
16,
27]. The use of conservative climate change projections to ensure preparedness and resilience against the increasing frequency and intensity of such events is recommended by the Philadelphia Water Department and its consultants [
27], who also estimate that 100 year, 24 h rainfall amounts could increase by 50% by end of century [
27].
The late century SLR scenario is based on the IPCC AR6 projections for Philadelphia (SSP5 8.5, 95th percentile) following [
28]. This SLR value aligns with other estimates, illustrating the consistency in SLR projections across different research efforts, even considering emission reductions in the RCP 8.5 trajectory [
29].
2.6. Metrics
Flooding associated with TS Isaias under both existing (Scenario #1) and future climate changed (Scenario #2) conditions were simulated for Adaptation Approaches #1, #2, and #3. Metrics used to compare the scenarios include:
- I.
Color coded maps of peak flood depths
- II.
Maps depicting avoided flooding associated with each approach, when compared to baseline conditions
- III.
Box plots depicting the max flood depths for 2D junctions in the streams
- IV.
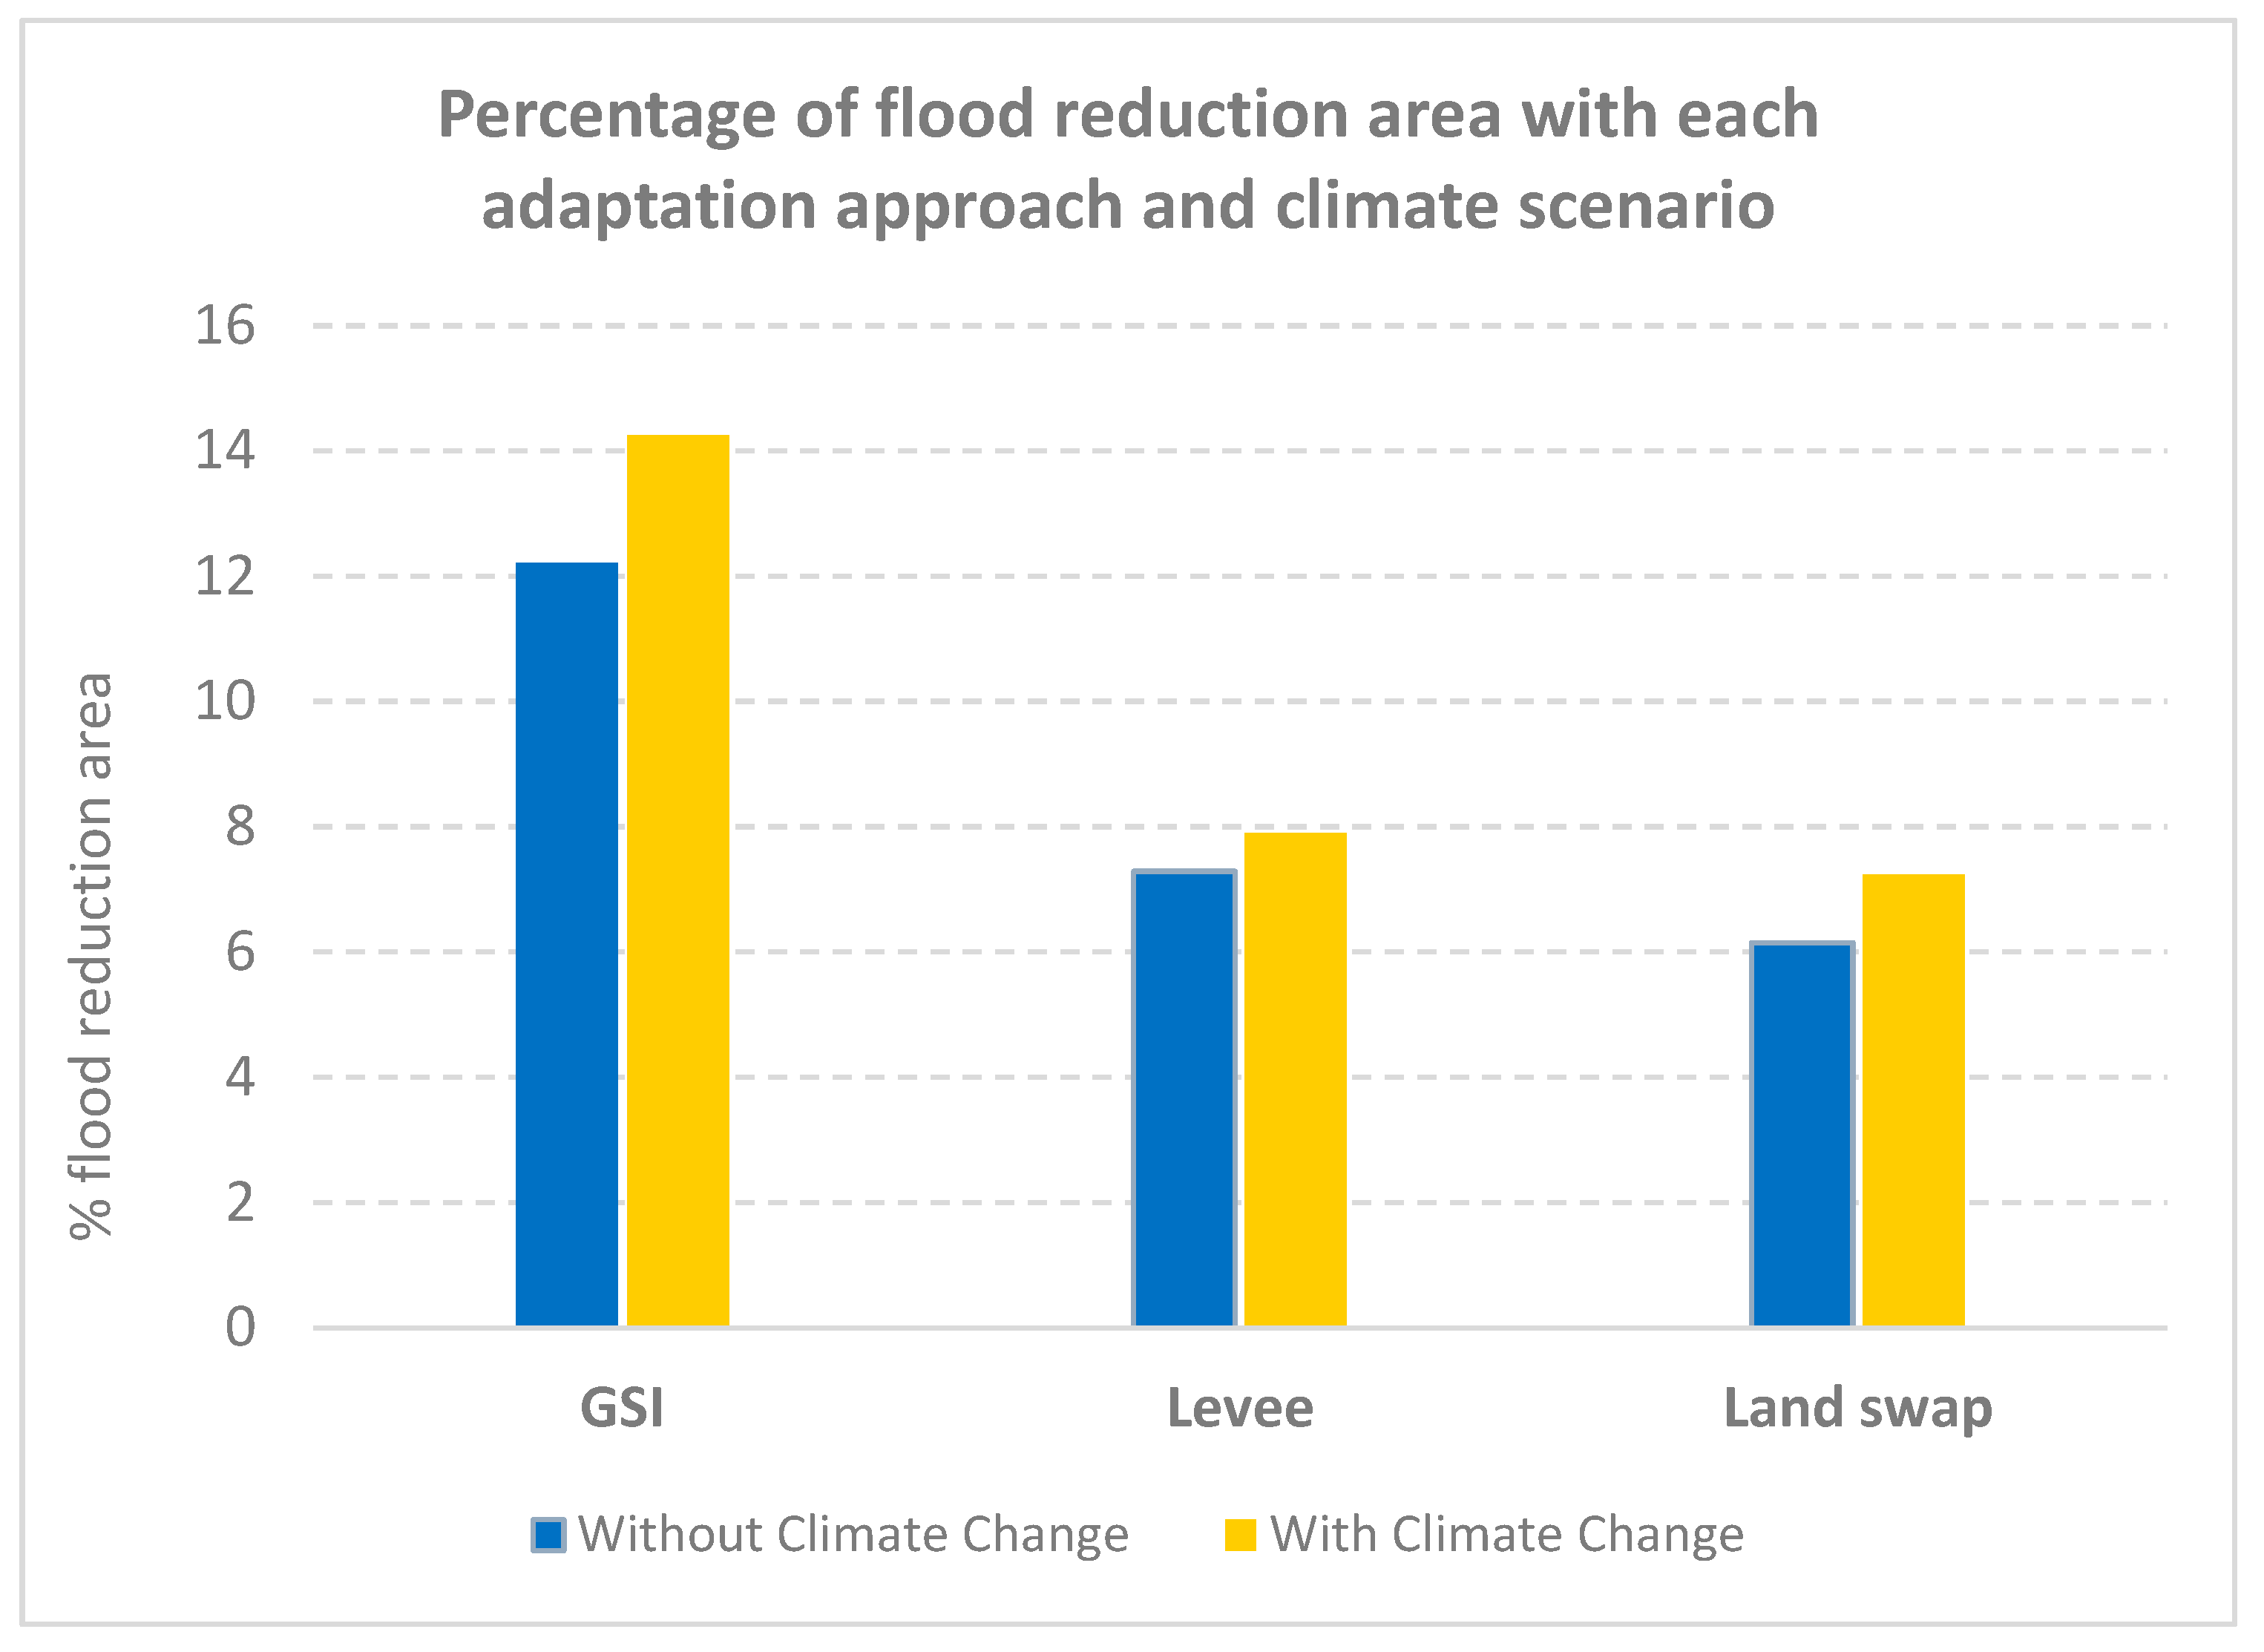
Bar chart depicting the percentage of flood reduction area
3. Results
Figure 12 includes maps that compare peak flood extent and depths simulated for baseline conditions and Adaptation Approaches #1, #2, and #3 under Climate Scenario #1. The maps use a color gradient, where red-orange denotes deep flooding of greater than 4 m, and green-blue denotes shallow flooding of less than 3 m. Compared to existing conditions, peak flood extent is reduced the most with Approach #1, followed by Approach #2, and the least by Approach #3. Note that Approach #1 is the only approach to completely eliminate flooding.
Figure 13 includes maps comparing peak flood extent and depths simulated for baseline conditions when Approaches #1, #2, and #3 are subjected to Climate Scenario #2. Comparing
Figure 12a to
Figure 13a, it is evident that without adaptation, flooding associated with a storm like TS Isaias would increase due to climate change. Under Climate Scenario #2, Approach #1 is the most effective at reducing flooding, Approach #2 is the least effective, and Approach #3 of intermediate effectiveness. It is noteworthy that while all three approaches reduce flooding, none completely eliminate flood risk under Climate Scenario #2.
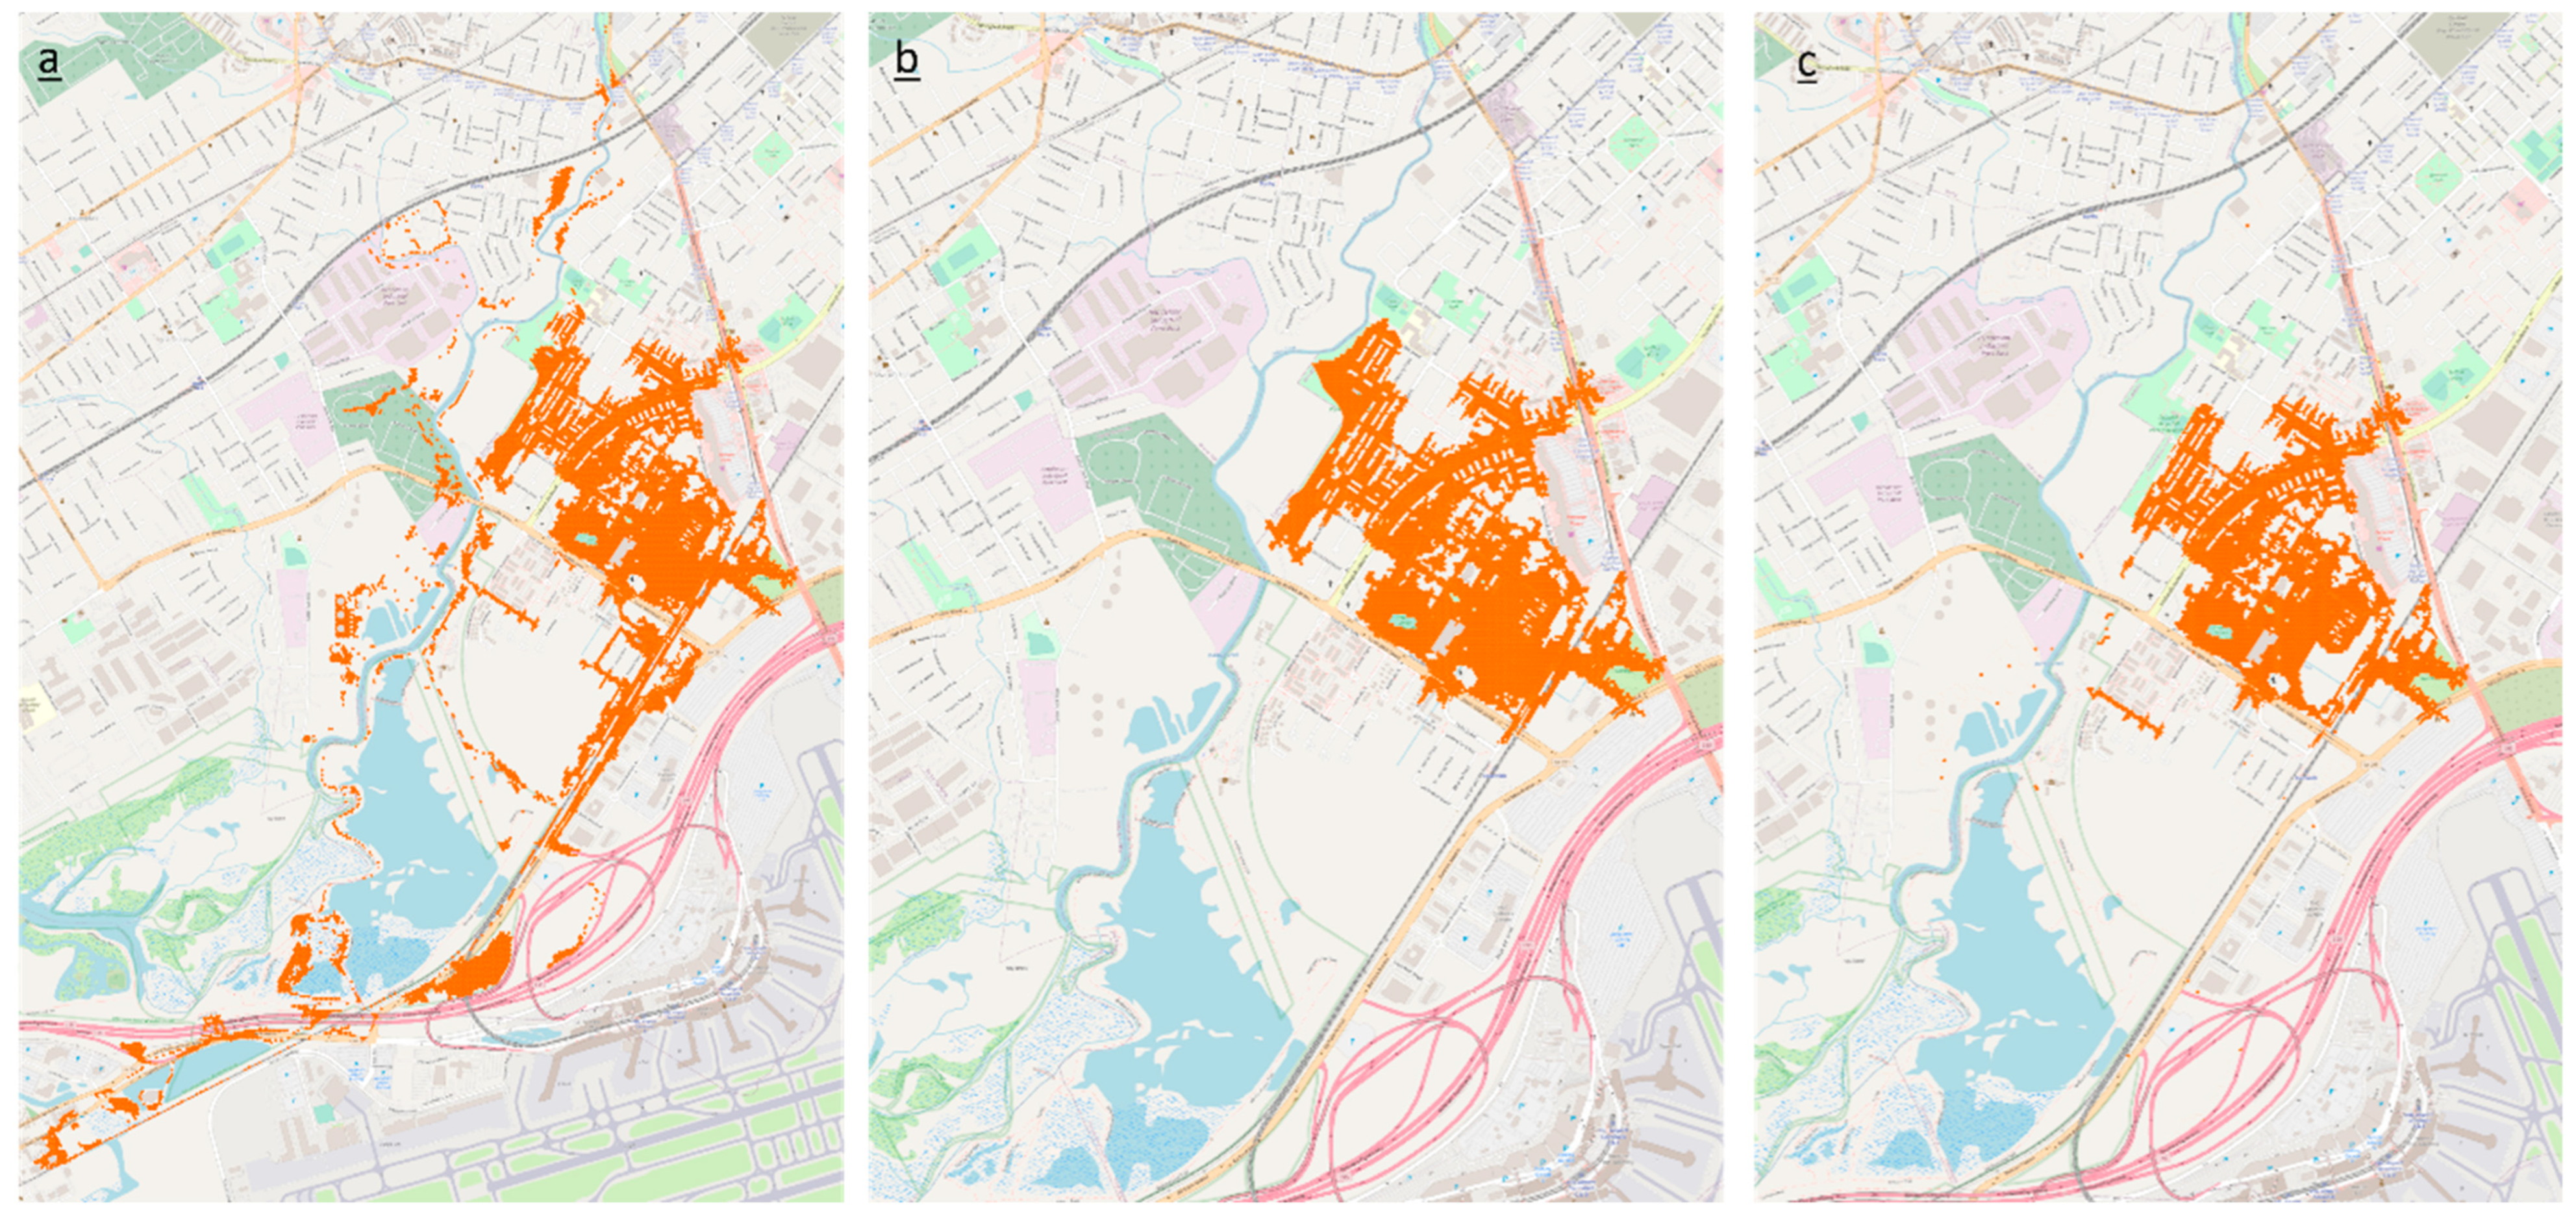
Figure 14 presents the effectiveness of different flood adaptation scenarios in eliminating flooding under Climate Scenario #1. Orange overlays depict areas that flooded under baseline conditions (e.g., no adaptation) but did not flood under each of the respective adaptation approaches. As was evident in
Figure 12b and
Figure 13b, Approach #1 eliminated the greatest amount of flooding, including in areas outside of Eastwick. Both Approach #2 and Approach #3 eliminated a significant amount of flooding in Eastwick, with #2 slightly better than #3.
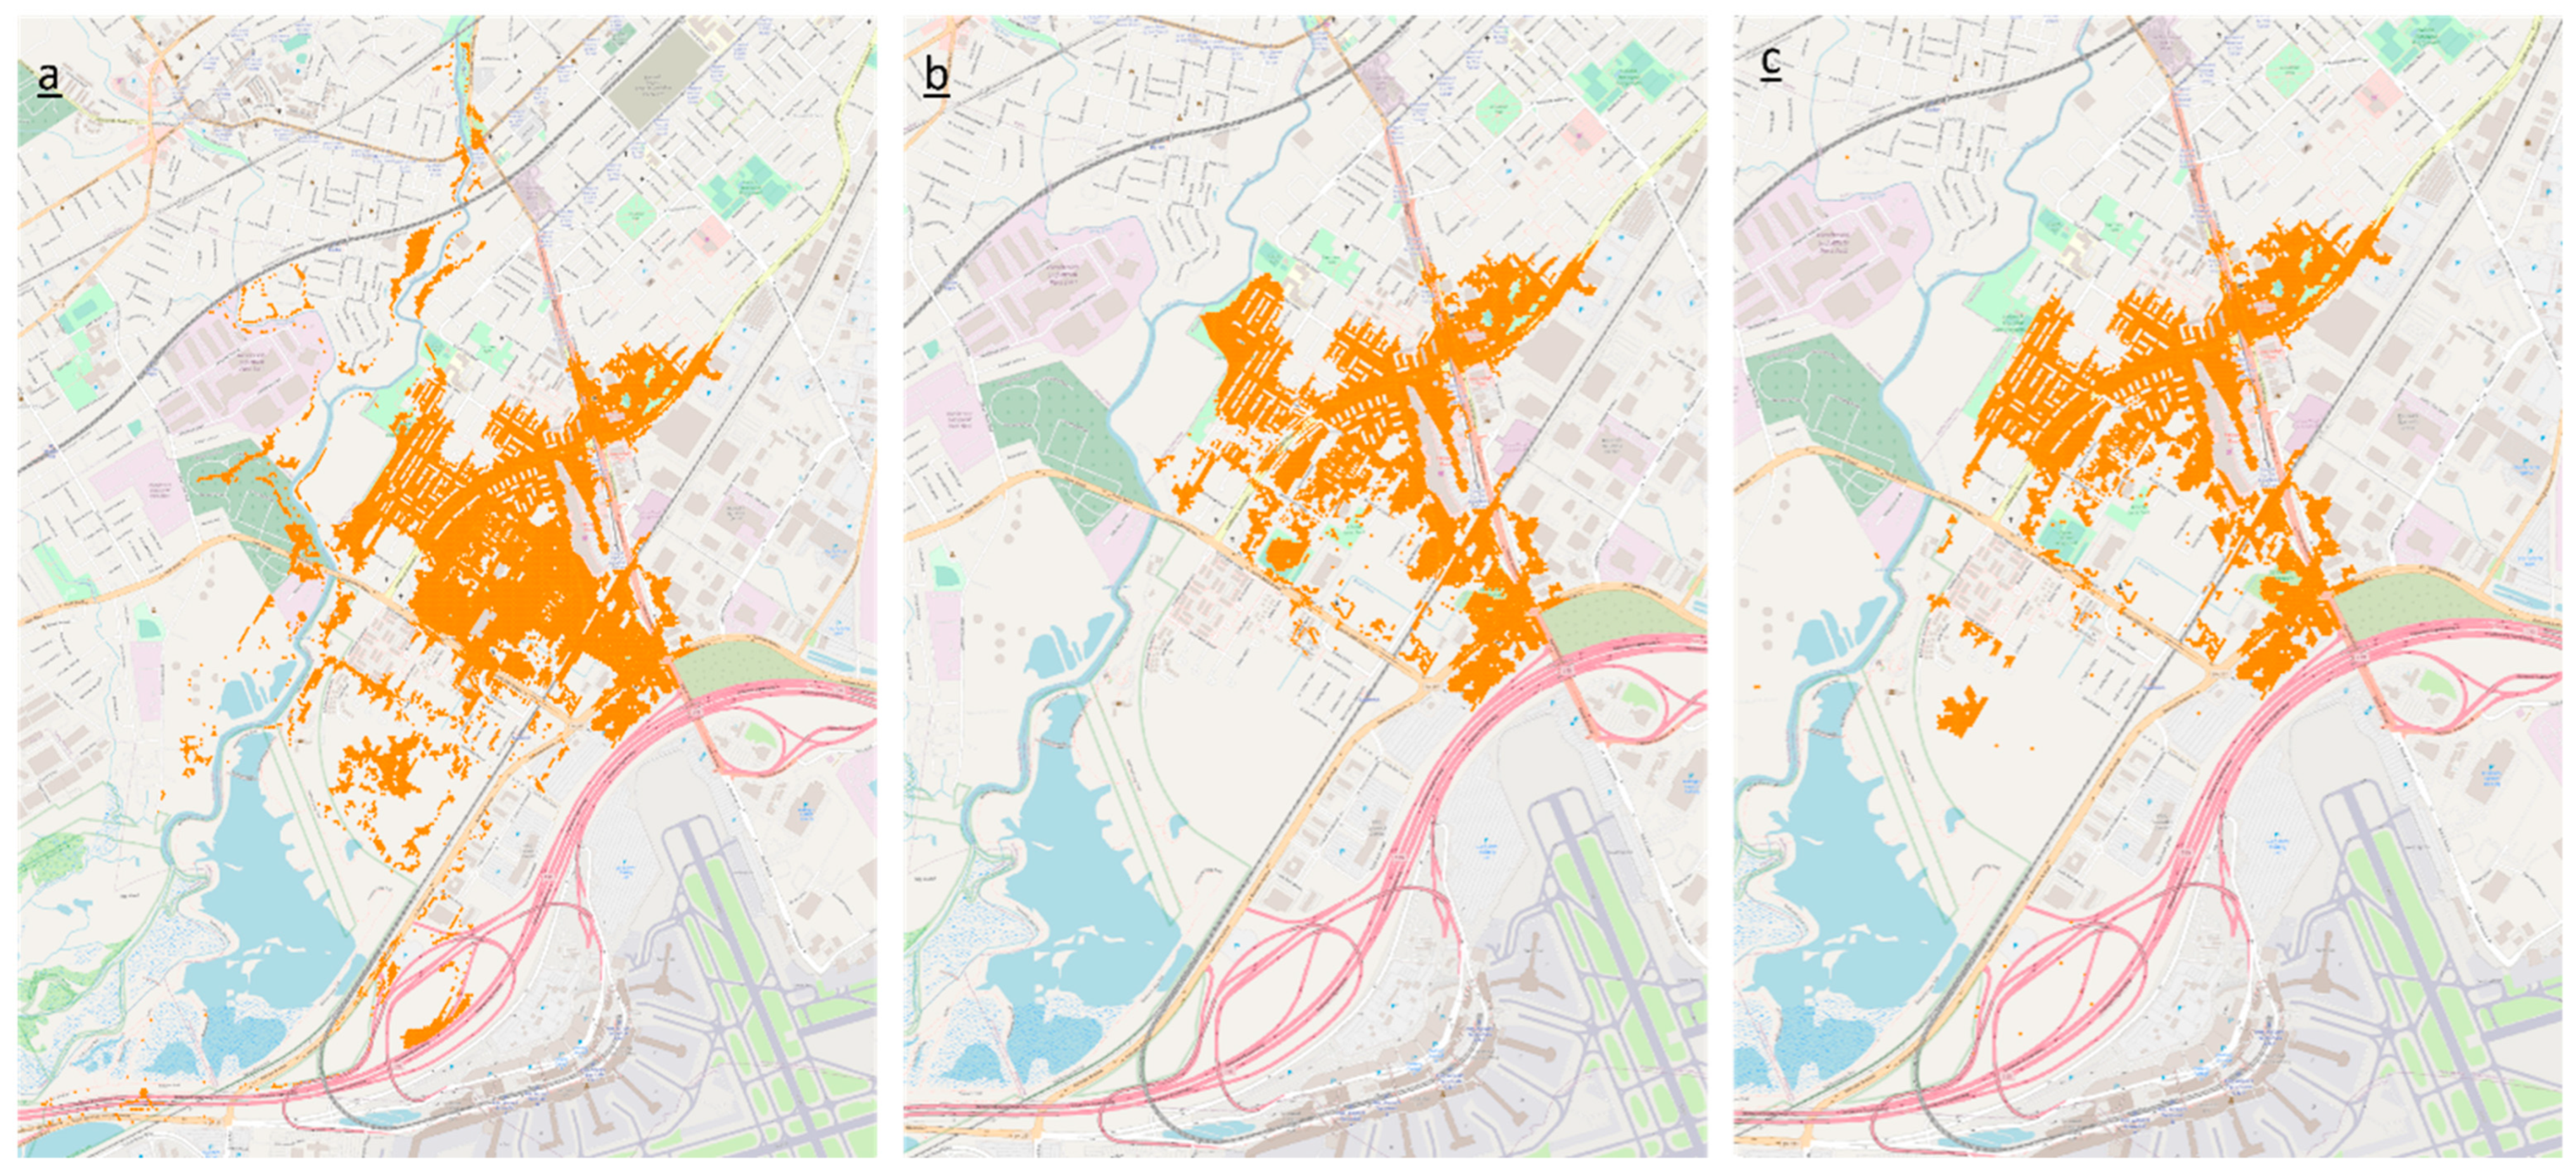
Figure 15 presents the effectiveness of different flood adaptation scenarios in eliminating flooding under Climate Scenario #2. The results are similar to those obtained with Climate Scenario #1. As was evident in
Figure 12b and
Figure 13b, Approach #1 eliminated the greatest amount of flooding, including in areas outside of Eastwick. Both Approach #2 and Approach #3 eliminated a significant amount of flooding in Eastwick, with #2 slightly better than #3.
Table 6 presents the number of flooded nodes (N) in each of the simulations under the two different climate scenarios. While the baseline (e.g., no adaptation) configuration consistently represents the highest number of flooded nodes, and all three approaches reduce the number of flooded nodes, Approach #1 has significantly lower
n compared to the two other approaches.
In the chart above (
Figure 16), the blue bars represent the percentage of flood reduction area achieved by each adaptation approach—GSI, levee, and land swap—under the existing condition (no climate change scenario). The yellow bars represent the percentage of flood reduction area with each adaptation approach under a climate change scenario.
The results indicate that GSI is the most effective in reducing flood areas under both conditions, with a higher flood reduction percentage than the levee and land swap strategies. Additionally, we can observe that, with climate change (yellow bars), each approach shows a slight increase in flood reduction compared to the existing condition. This finding suggests that all three strategies maintain some level of effectiveness in reducing flood areas under projected climate changes, though GSI remains the most impactful of the three.
To investigate whether any of the approaches transfers the flood risk from Eastwick to another portion of the model domain, the box plots presented in
Figure 17 compare the peak flood depth of all 2D flooded nodes located within the streams for each adaptation approach and climate scenario. The first pair of boxes (leftmost) represent existing conditions, without any adaptation strategy in place. The other three pairs correspond to the three adaptation approaches, comparing climate scenario #1 (light blue) and #2 (dark blue).
The box plots in
Figure 17 show a smaller increase in median flood depth from present to future with Approach #1 and the IQR remains relatively tight. This suggests better control over flood variability under future conditions with GSI. Approach #2 shows greater increase in median flood depth under future conditions. The upper whisker in the future scenario extends quite high, indicating potential vulnerability to extreme events. Approach #3 also exhibits an increase in median flood depth. The increase in the median and the presence of long upper whiskers in future scenarios across all groups highlights a vulnerability to extreme flood events. However, Approach #1 seems to cope better with the impacts of climate change on flood depths in streams, as they manage to keep the increase in median depths relatively moderate while controlling the range of outcomes.
4. Discussion
The results of this study underscore the complexities of selecting flood risk management (FRM) strategies for urban areas under shifting climate conditions. Effective FRM must address a variety of factors: effectiveness at reducing floods under both present and future climate conditions; logistical feasibility of construction; community acceptance; cost and cost-effectiveness; and ideally the ability to provide sustainability and resilience co-benefits. This study represents an initial exploration into only the first of these factors, setting the stage for more comprehensive evaluations of the options in the future.
The findings suggest that flood risk is most effectively reduced through the NBS approach, under both current and future climate scenarios. This approach, featuring the use of GSI, reduces flooding both in Eastwick and in nearby other communities. However, this approach requires significant and extensive multi-jurisdictional collaboration. If this collaboration were feasible and if upscaling of GSI significantly managed runoff from 65% of all the impervious surfaces in the watershed were possible, the face of this watershed would fundamentally and radically change for the better. Unfortunately, it is not clear that such collaboration and upscaling is feasible, or that it can be accomplished within reasonable time frames.
The levee may be less institutionally complex to construct, and it is effective in reducing fluvial flooding under current climate. However, it too carries some challenges. By diverting pluvial flow out of Eastwick, the levee could induce flooding elsewhere in the lower Cobbs Creek watershed. It also does not effectively reduce coastal flooding originating from the Heinz refuge and would need to be accompanied by pumps to remove pluvial floodwaters that could accumulate on its landward side. Once built, it will also be difficult to modify, should current projections of future climate change be underestimated.
Like the NBS strategy, the land swap involves complex coordination and consent from multiple stakeholders. Unlike the NBS strategy, the required collaboration and coordination is only within Eastwick. Initial interactions of local residents suggest that there is currently no consensus around implementation of the land swap. Some residents do not wish to move (and prefer the protection perceived from the levee); while others seek buyouts. Though it is currently owned by the city, the potential relocation area is also of interest to different stakeholders, including the Heinz wildlife refuge.
These findings are broadly consistent with recent literature that has examined the trade-offs between structural and non-structural flood adaptation strategies in urban areas. For instance, studies by Frantzeskaki et al. [
30] and Zhou et al. [
31] have highlighted the growing importance of nature-based solutions in urban resilience planning, particularly in low-lying and socioeconomically vulnerable communities. Similarly, Pinter et al. [
32] emphasize that structural protections like levees, while effective in the short term, can increase long-term vulnerability if not combined with flexible and adaptive measures such as GSI and land use planning.
Additionally, the modeling framework used here complements approaches taken in recent urban flood modeling efforts (e.g., Alves et al. [
33]; Tang et al., [
34]), which simulate compound flood risks and test adaptation strategies using 2D hydrodynamic models. Our skeletonized drainage representation balances model efficiency and accuracy, enabling tractable comparisons of large-scale interventions in complex systems—an approach aligned with current best practices in flood risk modeling.
By building on this body of work, our study contributes a localized, scenario-based evaluation of adaptation strategies under compound climate hazards, while also acknowledging the broader institutional and social challenges documented in the literature. The results reinforce the conclusion that no single solution is sufficient, and that integrated, adaptive strategies—ideally co-developed with affected communities—are more likely to provide sustainable and equitable outcomes.
Future decision-making around FRM in Eastwick requires deeper and more extensive engagement of both community and governmental stakeholders. Such efforts might also involve the development of hybrid approaches (for example, construction of a levee as Phase 1 of a long term FRM strategy that ultimately funds enough GSI to eliminate any induced flooding and/or to provide longer term, and more comprehensive flood resilience). Additional work also must involve benefit cost analyses that consider the construction and operation costs, as well as all the potential co-benefits and tradeoffs of any approach. Preliminary cost assessments by our team suggest that the levee is the least expensive project to construct, but when factoring in operation and maintenance costs and climate change, it is not clear that the long-term benefit cost ratio of the levee is superior to the other options. A comprehensive analysis (in progress by our team) would require a detailed comparison of damages with and without the projects in place, under multiple probabilistic and compound flood conditions, and all their associated co-benefits (e.g., ecosystem services associated with the NBS approach) and potential disservices (e.g., false sense of security associated with the levee). Such analyses remain necessary to more thoroughly compare the implications of each strategy.
In conclusion, while our study provides foundational insights into the viability of various FRM strategies, extensive further research is necessary to comprehensively evaluate and compare these options across the outlined criteria. Future work should aim to develop a more detailed framework that incorporates these multiple dimensions, facilitating more informed decision-making in urban flood resilience planning. This ongoing research will also benefit from integrating findings from related studies, such as those outlined in our previous work [
24], to refine and expand the strategies for managing urban flood risks under escalating climate pressures.
5. Conclusions
This study is a first step in comparing the effectiveness of three distinct flood adaptation strategies within the Eastwick community under both current and projected future climate conditions. The research uses a physically based H&H model to compare the effectiveness of GSI, a levee, and a land swap at reducing flooding in Eastwick. From a flood-risk-reduction perspective, the GSI approach is most effective. It is also the most adaptable and likely provides the greatest number of co-benefits of the three approaches considered here. However, selection of the best FRM strategy requires more work, particularly in light of the multifaceted threats posed by climate change. As urban areas like Eastwick continue to confront escalating climate-induced flood risks, the insights from this study advocate for a strategic pivot toward an integrated FRM framework. This framework, as supported by the Intergovernmental Panel on Climate Change (IPCC), should blend natural and engineered measures, thus embracing hybrid solutions that align with traditional categories yet are flexible enough to incorporate innovative adaptation strategies.
The Philadelphia Office of Sustainability (OOS) is currently undertaking a public engagement strategy to refine the selection of FRM strategies for Eastwick. It is likely that this process will ultimately lead to a hybrid strategy combining the individual strengths of the three approaches. Work in similar urban communities should focus on fostering collaborative, multi-disciplinary efforts that bring together stakeholders from across the spectrum of urban planning, environmental science, and community advocacy. By integrating the strengths of traditional and novel FRM approaches into a cohesive adaptation strategy, communities can enhance their resilience, safeguarding against present and future flood risks while advancing towards a more sustainable and equitable urban future.
Future studies could explore phased and combined strategies that integrate GSI, levee protection, and managed retreat options. A phased approach, starting with structural defenses like levees and evolving into comprehensive GSI implementation, could address both immediate and long-term flood risks while enhancing resilience. Additionally, as community perspectives are essential in determining viable flood solutions, future research should incorporate extensive community engagement to refine adaptation strategies. This could include studies that evaluate the social acceptability, economic feasibility, and long-term sustainability of different FRM options, informed directly by community input.
Further research is also needed to conduct detailed cost–benefit analyses that consider both short-term and long-term impacts. This analysis should account for not only construction and maintenance costs but also the economic, ecological, and social co-benefits of each strategy to provide a more holistic assessment of hybrid FRM approaches. Additional studies could also involve detailed hydrologic and hydraulic modeling under a broader range of climate scenarios, including extreme rainfall events and sea-level rise. This would improve the understanding of each strategy’s performance under varied conditions and help identify thresholds where hybrid approaches might be most beneficial. Establishing a long-term monitoring program to track the effectiveness of implemented strategies would provide critical data for adaptive management. By regularly assessing flood protection performance, future modifications could be made to enhance resilience as climate conditions evolve.
Author Contributions
Conceptualization, F.N. and F.M.; Methodology, F.N., P.O. and F.M.; Software, F.N.; Validation, F.M.; Data curation, F.N.; Writing—original draft, F.N.; Writing—review & editing, P.O. and F.M.; Visualization, F.N.; Supervision, F.M.; Funding acquisition, P.O. and F.M. All authors have read and agreed to the published version of the manuscript.
Funding
This research was funded by grants from the NOAA Climate Program Office Coastal and Ocean Climate Applications Program (NA19OAR4310307), the Climate Adaptation Partnerships, RISA/CAP, formerly the RISA, program (NA21OAR4310313), and the Societal Interactions Divisions Adaptation Sciences (AdSci) program (NA21OAR4310281-T1-01).
Data Availability Statement
The original contributions presented in the study are included in the article, further inquiries can be directed to the corresponding author.
Conflicts of Interest
The authors declare no conflict of interest.
References
- Paul, M.J.; Meyer, J.L. Streams in the Urban Landscape. Annu. Rev. Ecol. Syst. 2001, 32, 333–365. [Google Scholar] [CrossRef]
- McDonald, R.I.; Green, P.; Balk, D.; Fekete, B.M.; Revenga, C.; Todd, M.; Montgomery, M. Urban Growth, Climate Change, and Freshwater Availability. Proc. Natl. Acad. Sci. USA 2011, 108, 6312–6317. [Google Scholar] [CrossRef]
- IPCC. Climate Change 2022: Impacts, Adaptation and Vulnerability. In Contribution of Working Group Ii to the Sixth Assessment Report of the Intergovernmental Panel on Climate Change; Roberts, D.C., Pörtner, H.-O., Tignor, M., Poloczanska, E.S., Mintenbeck, K., Alegría, A., Craig, M., Langsdorf, S., Möller, S.V., Löschke, A., et al., Eds.; Cambridge University Press: Cambridge, UK; New York, NY, USA, 2022. [Google Scholar]
- Jongman, B. Effective Adaptation to Rising Flood Risk. Nat. Commun. 2018, 9, 1986. [Google Scholar] [CrossRef]
- DiFrancesco, K.; Gitelman, A.; Purkey, D. Bottom-up Assessment of Climate Risk and the Robustness of Proposed Flood Management Strategies in the American River, Ca. Water 2020, 12, 907. [Google Scholar] [CrossRef]
- Ahern, J. From Fail-Safe to Safe-to-Fail: Sustainability and Resilience in the New Urban World. Landsc. Urban Plan. 2011, 100, 341–343. [Google Scholar] [CrossRef]
- Hino, M.; Christopher, B.F.; Katharine, J.M. Managed Retreat as a Response to Natural Hazard risk. Nat. Clim. Change 2017, 7, 364–370. [Google Scholar] [CrossRef]
- Siders, A.R. Managed Retreat in the United States. One Earth 2019, 1, 216–225. [Google Scholar] [CrossRef]
- Benedict, M.; Edward, M.; The Fund; Lydia, B. Green Infrastructure: Linking Landscapes and Communities. In Bibliovault OAI Repository; The University of Chicago Press: Chicago, IL, USA, 2006. [Google Scholar]
- Mach, K.J.; Caroline, M.K.; Miyuki, H.; Siders, A.R.; Erica, M.J.; Christopher, B.F. Managed Retreat through Voluntary Buyouts of Flood-Prone Properties. Sci. Adv. 2019, 5, eaax8995. [Google Scholar] [CrossRef]
- Eriksen, S.H.; Brown, K.; Kelly, P.M. The Dynamics of Vulnerability: Locating Coping Strategies in Kenya and Tanzania. Geogr. J. 2005, 171, 287–305. [Google Scholar] [CrossRef]
- Reid, H.; Mozaharul, A.; Rachel, B.; Terry, C.; Saleemul, H.; Angela, M. Community-Based Adaptation to Climate Change: An Overview. Particip. Learn. Action 2009, 60, 11–60. [Google Scholar]
- Chiu, Y.-Y.; Nidhi, R.; Chen, H.-E. Evolution of Flood Defense Strategies: Toward Nature-Based Solutions. Environments 2021, 9, 2. [Google Scholar] [CrossRef]
- Haasnoot, M.; Judy, L.; Alexandre, K.M. Pathways to Coastal Retreat. Science 2021, 372, 1287–1290. [Google Scholar] [CrossRef] [PubMed]
- Cea, L.; Costabile, P. Flood Risk in Urban Areas: Modelling, Management and Adaptation to Climate Change. A Review. Hydrology 2022, 9, 50. [Google Scholar] [CrossRef]
- Drexel University. A Climate Resilience Research Agenda for the Greater Philadelphia Area. In Findings from 2021 Working Group Discussions and Updated CMIP6 Projections for the Region; Drexel University: Philadelphia, PA, USA, 2023. [Google Scholar]
- Nasrollahi, F.; Alizadehtazi, B.; Montalto, F. The Role of Spatial Rainfall Patterns in Determining Downstream Flood Risk; Drexel University: Philadelphia, PA, USA, 2024; Chapter 1. [Google Scholar]
- Nasrollahi, F.; Rockwell, J.; Montalto, F. The Role That Engineered Drainage Systems Play in Determining Predicted Flood Risk; Drexel University: Philadelphia, PA, USA, 2024; Chapter 2. [Google Scholar]
- USACE. Hec-Ras River Analysis System User’s Manual Version 6.0. In U.S. Army Corps of Engineers; USACE: Washington, DC, USA, 2021; Available online: https://www.hec.usace.army.mil/confluence/rasdocs/rasum/6.1 (accessed on 15 March 2024).
- USGS. U.S. Geological Survey; USGS: Reston, VA, USA, 2024. Available online: https://pubs.usgs.gov/wsp/2339/report.pdf (accessed on 15 March 2024).
- AKRF. Lower Eastwick Infrastructure and Flood Evaluation Hydrology and Hydraulic Modeling; AKRF: New York, NY, USA, 2021. [Google Scholar]
- Rossman, L.A. Storm Water Management Model, Quality Assurance Report: Dynamic Wave Flow Routing Water Supply and Water Resources Division; Environmental Protection Agency: Washington, DC, USA, 2006; Available online: https://www.chiwater.com/Files/SWMM5_QA.pdf (accessed on 3 June 2024).
- Multi-Resolution Land Characteristics (MRLC) Consortium. Available online: https://www.mrlc.gov/ (accessed on 15 March 2024).
- Nasrollahi, F.; Montalto, A.F. Climate Resilient Coastal Protection—Guidelines for Development of Multifunctional Infrastructure. In Towards a Nature-Positive Built Environment; Victoria, E.E., Giuliana, I.C., Eds.; Springer Nature: Cham, Switzerland, 2025. [Google Scholar]
- USACE. Eastwick Flood Risk Management Study; USACE: Washington, DC, USA, 2023; Available online: https://www.nap.usace.army.mil/Missions/Civil-Works/Eastwick-Flood-Risk-Management-Study/ (accessed on 15 March 2024).
- Eastwick Flood Risk Management Feasibility Study. Available online: https://www.nap.usace.army.mil/Portals/39/docs/Civil/Reports/Eastwick/Eastwick-Draft-Report-Engineering-Appendices-August-2023.pdf?ver=VZrvy-TWBcN14fBq3U4BgA%3d%3d (accessed on 1 April 2024).
- Maimone, M.; Malter, S.; Anbessie, T.; Rockwell, J. Three Methods of Characterizing Climate-Induced Changes in Extreme Rainfall: A Comparison Study. J. Water Clim. Change 2023, 14, 4245–4260. [Google Scholar] [CrossRef]
- Mita, K.S.; Orton, P.; Montalto, F.; Saleh, F.; Rockwell, J. Sea Level Rise-Induced Transition from Rare Fluvial Extremes to Chronic and Compound Floods. Water 2023, 15, 2671. [Google Scholar] [CrossRef]
- Strauss, B.H. Rapid Accumulation of Committed Sea-Level Rise from Global Warming. Proc. Natl. Acad. Sci. USA 2013, 110, 13699–13700. [Google Scholar] [CrossRef]
- Frantzeskaki, N.; McPhearson, T.; Collier, M.J.; Kendal, D.; Bulkeley, H.; Dumitru, A.; Walsh, C.; Noble, K.; van Wyk, E.; Ordóñez, C.; et al. Nature-Based Solutions for Urban Climate Change Adaptation: Linking Science, Policy, and Practice Communities for Evidence-Based Decision-Making. BioScience 2019, 69, 455–466. [Google Scholar] [CrossRef]
- Zhou, K.; Kong, F.; Yin, H.; Destouni, G.; Meadows, M.E.; Andersson, E.; Chen, L.; Chen, B.; Li, Z.; Su, J. Urban Flood Risk Management Needs Nature-Based Solutions: A Coupled Social-Ecological System Perspective. npj Urban Sustain. 2024, 4, 25. [Google Scholar] [CrossRef]
- Pinter, N.; Huthoff, F.; Dierauer, J.; Remo, J.W.; Damptz, A. Modeling Residual Flood Risk Behind Levees, Upper Mississippi River, USA. Environ. Sci. Policy 2016, 58, 131–140. [Google Scholar] [CrossRef]
- Alves, A.; Vojinovic, Z.; Kapelan, Z.; Sanchez, A.; Gersonius, B. Exploring Trade-Offs among the Multiple Benefits of Green-Blue-Grey Infrastructure for Urban Flood Mitigation. Sci. Total Environ. 2019, 703, 134980. [Google Scholar] [CrossRef]
- Tang, B.; Nederhoff, K.; Gallien, T. Quantifying Compound Coastal Flooding Effects in Urban Regions Using a Tightly Coupled 1d–2d Model Explicitly Resolving Flood Defense Infrastructure. Coast. Eng. 2025, 199, 104728. [Google Scholar] [CrossRef]
Figure 1.
Study area, Eastwick. The map on the left shows that most of Eastwick lies within the 100-year floodplain, with only limited areas (in orange) falling within the 500-year floodplain.
Figure 1.
Study area, Eastwick. The map on the left shows that most of Eastwick lies within the 100-year floodplain, with only limited areas (in orange) falling within the 500-year floodplain.
Figure 2.
Gage-Adjusted Radar Rainfall (GARR) map of the Darby-Cobbs Watershed during Tropical Storm Isaias. The map indicates that most precipitation occurred in the upper watershed and not Eastwick. The most significant flooding took place downstream in the watershed and in Eastwick.
Figure 2.
Gage-Adjusted Radar Rainfall (GARR) map of the Darby-Cobbs Watershed during Tropical Storm Isaias. The map indicates that most precipitation occurred in the upper watershed and not Eastwick. The most significant flooding took place downstream in the watershed and in Eastwick.
Figure 3.
Map of the 2D PC-SWMM model domain.
Figure 3.
Map of the 2D PC-SWMM model domain.
Figure 4.
PC-SWMM integrated 1D–2D watershed model with skeletonized drainage representation in Eastwick.
Figure 4.
PC-SWMM integrated 1D–2D watershed model with skeletonized drainage representation in Eastwick.
Figure 5.
The 2D mesh domain (left) and connection of the mesh elements to the pipes (right) using bottom orifice in the skeletonized drainage model.
Figure 5.
The 2D mesh domain (left) and connection of the mesh elements to the pipes (right) using bottom orifice in the skeletonized drainage model.
Figure 6.
Conceptual diagram of a bio-retention cell LID (Source: Storm Water Management Model (SWMM) User’s Manual Version 5.1. EPA [
1].
Figure 6.
Conceptual diagram of a bio-retention cell LID (Source: Storm Water Management Model (SWMM) User’s Manual Version 5.1. EPA [
1].
Figure 7.
Levee location and alignment along the east bank of Cobbs Creek, situated within the city-owned Eastwick Regional Park and Clearview Landfill.
Figure 7.
Levee location and alignment along the east bank of Cobbs Creek, situated within the city-owned Eastwick Regional Park and Clearview Landfill.
Figure 8.
Levee protection along Cobbs Creek.
Figure 8.
Levee protection along Cobbs Creek.
Figure 9.
Proposed modifications to the existing condition in land swap design.
Figure 9.
Proposed modifications to the existing condition in land swap design.
Figure 10.
Draft of land swap design.
Figure 10.
Draft of land swap design.
Figure 11.
Land swap map of city owned lands and relocated homes.
Figure 11.
Land swap map of city owned lands and relocated homes.
Figure 12.
Flood inundation maps with and without adaptation approaches and with Climate Scenario #1 (TS Isaias) (a) Existing/no approach (b) Approach #1 (GSI) (c) Approach #2 (Levee) (d) Approach #3 (Land swap).
Figure 12.
Flood inundation maps with and without adaptation approaches and with Climate Scenario #1 (TS Isaias) (a) Existing/no approach (b) Approach #1 (GSI) (c) Approach #2 (Levee) (d) Approach #3 (Land swap).
Figure 13.
Flood inundation maps with and without adaptation approaches and with Climate Scenario #2 (TS Isaias) (a) Existing/no approach (b) Approach #1 (GSI) (c) Approach #2 (Levee) (d) Approach #3 (Land swap).
Figure 13.
Flood inundation maps with and without adaptation approaches and with Climate Scenario #2 (TS Isaias) (a) Existing/no approach (b) Approach #1 (GSI) (c) Approach #2 (Levee) (d) Approach #3 (Land swap).
Figure 14.
Flooding eliminated by each of the adaptation approaches under Climate Scenario #1: (a) flooding eliminated by Approach #1; (b) flooding eliminated by Approach #2; (c) flooding eliminated by Approach #3.
Figure 14.
Flooding eliminated by each of the adaptation approaches under Climate Scenario #1: (a) flooding eliminated by Approach #1; (b) flooding eliminated by Approach #2; (c) flooding eliminated by Approach #3.
Figure 15.
Flooding eliminated by each of the adaptation approaches under Climate Scenario #2: (a) Flooding eliminated by Approach #1 (b) Flooding eliminated by Approach #2 (c) Flooding eliminated by Approach #3.
Figure 15.
Flooding eliminated by each of the adaptation approaches under Climate Scenario #2: (a) Flooding eliminated by Approach #1 (b) Flooding eliminated by Approach #2 (c) Flooding eliminated by Approach #3.
Figure 16.
Flood reduction area (%) with each adaptation approach and climate scenario.
Figure 16.
Flood reduction area (%) with each adaptation approach and climate scenario.
Figure 17.
Box plots of max flood depth in streams with and without climate change, comparing the existing condition and the adaptation approaches.
Figure 17.
Box plots of max flood depth in streams with and without climate change, comparing the existing condition and the adaptation approaches.
Table 1.
Subcatchments properties.
Table 1.
Subcatchments properties.
| Subcatchment Parameters | Source |
|---|
| Area | Per PCSWMM watershed delineation tool, vary from 0.936 to 342.364 ha |
| Width | Per PCSWMM watershed delineation tool, vary from 96.72 to 6113.68 m |
| % slope | DEM |
| % impervious | PASDA |
| Mannings values (for overland flow over the impervious and pervious sub-area) | N Imperv: 0.012
N Perv: 0.13 |
| Depression storage values | Imperv: 0.2 in, Perv: 0.3 in |
| %zero impervious | 0 |
| Subarea routing | Outlet |
| Percent routed | 100 |
| Infiltration | Green Ampt |
| Groundwater | Not included |
Table 2.
Steps required to create skeletonized model.
Table 2.
Steps required to create skeletonized model.
| Task Number | Task Description | Level of Effort (Hours, Days, or Weeks) |
|---|
| 2.1 | Insert and parameterize junctions and conduits representing a skeletonized version of the collection system into the model (provided by PWD in this case) | hours |
| 2.2 | Generate the 2D mesh from the DEM with buildings represented as obstacles | hours |
| 2.3 | Connect the 2D mesh to the broader natural drainage system and to the skeletonized drainage system using bottom orifice. Add the initial depth to 2D junctions within the streams and the impoundment | hours |
| 2.4 | Reassign the pourpoints of the existing subcatchments to junctions used to represent the collection system and/or to the nearest 2D mesh junction for subcatchments located that do not overlap spatially with the skeletonized collection system model | hours |
Table 3.
Final % treatment of the watershed and impervious surfaces based on the current round of the PRPs.
Table 3.
Final % treatment of the watershed and impervious surfaces based on the current round of the PRPs.
| WS area | 170 km2 |
| WS imp area | 65 km2 |
| GSI area | 8 km2 |
| % WS area treated | 5% |
| % imp area treated | 12% |
Table 4.
GSI Modeling Assumptions.
Table 4.
GSI Modeling Assumptions.
| Prototypical GSI Type | Prototypical GSI Area | HLR Range | % Watershed Treated | % Impervious Area Treated |
|---|
| Bioretention | 300 sf | 5–10 | 0–40% | 0–80% |
Table 5.
Bioretention area properties associated with Approach #2.
Table 5.
Bioretention area properties associated with Approach #2.
| Bioretention Parameter | Value |
|---|
| Berm height (cm) | 20.32 |
| Vegetative Cover (fraction) | 0 |
| Surface roughness (Manning’s n) | 0.1 |
| Surface slope (percent) | 1 |
| Soil Thickness (cm) | 91.44 |
| Porosity (volume fraction) | 0.52 |
| Field capacity (volume fraction) | 0.15 |
| Wilting point (volume fraction) | 0.08 |
| Soil Conductivity (cm/h) | 11.94 |
| Conductivity slope | 39.3 |
| Suction Head (cm) | 4.83 |
| Storage Height (cm) | 91.44 |
| Storage Void Ratio (voids/solids) | 0.8 |
| Seepage Rate (cm/h) | 1.27 |
| Storage Clogging Factor | 0 |
| Drain coefficient (cm/h) | 0 |
| Drain exponent | 0.5 |
| Drain offset height (cm) | 15.24 |
Table 6.
Summary of the number of flooded nodes.
Table 6.
Summary of the number of flooded nodes.
| Scenario/Adaptation Approach | Climate Scenario #1
Number of 2D Nodes with Depth > 10 cm | Climate Scenario #2
Number of 2D Nodes with Depth > 10 cm |
|---|
| Existing | 22,261 | 35,298 |
| Approach #1 | 13,577 | 20,475 |
| Approach #2 | 18,936 | 28,351 |
| Approach #3 | 20,655 | 27,164 |
| Disclaimer/Publisher’s Note: The statements, opinions and data contained in all publications are solely those of the individual author(s) and contributor(s) and not of MDPI and/or the editor(s). MDPI and/or the editor(s) disclaim responsibility for any injury to people or property resulting from any ideas, methods, instructions or products referred to in the content. |
© 2025 by the authors. Licensee MDPI, Basel, Switzerland. This article is an open access article distributed under the terms and conditions of the Creative Commons Attribution (CC BY) license (https://creativecommons.org/licenses/by/4.0/).

