Article

Long-Term Trajectory Analysis of Avocado Orchards in the Avocado Belt, Mexico

by
Jonathan V. Solórzano
1,*,
Jean François Mas
1,
Diana Ramírez-Mejía
2 and
J. Alberto Gallardo-Cruz
3,*
1
Centro de Investigaciones en Geografía Ambiental, Universidad Nacional Autónoma de México, Carretera a Pátzcuaro 8701, Morelia 58190, Mexico
2
Environmental Geography Group, Institute for Environmental Studies (IVM), Vrije Universiteit Amsterdam, De Boelelaan 1105, 1081 HV Amsterdam, The Netherlands
3
Centro Transdisciplinar Universitario para la Sustentabilidad, Universidad Iberoamericana, Prolongación Paseo de la Reforma 880, Mexico City 01219, Mexico
*
Authors to whom correspondence should be addressed.
Land 2025, 14(9), 1792; https://doi.org/10.3390/land14091792
Submission received: 10 July 2025 / Revised: 29 August 2025 / Accepted: 31 August 2025 / Published: 3 September 2025

Abstract

Avocado orchards are among the most profitable and fastest-growing commodity crops in Mexico, especially in the area known as the “Avocado Belt”. Several efforts have been made to monitor their expansion; however, there is currently no method that can be easily updated to track this expansion. The main objective of this study was to monitor the expansion of avocado orchards from 1993 to 2024, using the Continuous Change Detection and Classification (CCDC) algorithm and Landsat 5, 7, 8, and 9 imagery. Presence/absence maps of avocado orchards corresponding to 1 January of each year were used to perform a trajectory analysis, identifying eight possible change trajectories. Finally, maps from 2020 to 2023 were verified using reference data and very-high-resolution images. The maps showed a level of agreement = 0.97, while the intersection over union for the avocado orchard class was 0.62. The main results indicate that the area occupied by avocado orchards more than tripled from 1993 to 2024, from 64,304.28 ha to 200,938.32 ha, with the highest expansion occurring between 2014 and 2024. The trajectory analysis confirmed that land conversion to avocado orchards is generally permanent and happens only once (i.e., gain without alternation). The method proved to be a robust approach for monitoring avocado orchard expansion and could be an attractive alternative for regularly updating this information.

1. Introduction

Over the past century, global increases in food production have been driven mainly by the expansion or intensification of agricultural lands, often at the expense of natural habitats [1,2,3,4]. These transformations have been particularly striking in the world’s tropical and subtropical regions, resulting in significant environmental impacts, including biodiversity loss, water overuse, greenhouse gas emissions, and contamination resulting from excessive fertilizer and pesticide use, among others [5,6,7,8,9,10].
Many of these large-scale changes in the tropics have been linked to the expansion of commodity crops, such as avocado, coffee, oil palm, cotton, soy, cocoa, and rubber [11,12,13,14,15,16,17]. Due to their large-scale impacts, several international initiatives have been launched to improve production traceability and promote deforestation-free crops, such as the European Union’s Regulation on Deforestation-free Products (EUDR) [18] and Brazil’s Soy Moratorium agreement [19], in addition to national or private certifications, such as the Pro-Forest Avocado certification [20] and oil palm certification [21]. Despite these efforts, rigorous and systematic spatio-temporal analyses evaluating the expansion of commodity crops over relatively large periods (i.e., 30 years) remain scarce, particularly for products with highly concentrated production areas, such as avocado orchards in Mexico (see [22] for a global evaluation).
Mexico is the world’s leading avocado producer and exporter, accounting for approximately 46% of global exports, with 76% of these exports concentrated in an area known as the “Avocado Belt”, in the state of Michoacán [23,24,25]. Previous studies have reported exponential growth in both the area dedicated to avocado production and its market value [25,26,27,28,29,30]. The rapid expansion of avocado orchards in Michoacán has led to conflicts over illegal logging and land ownership, an increase in water and agrochemical use, and a decline in soil nutrients and connectivity of natural forests [6,23,31,32,33,34,35,36,37,38]. Although previous efforts have mapped avocado expansion in the region [27,28,29], a consistent, long-term methodological approach to monitor this expansion is still lacking.
Among the available Earth observation datasets used to monitor land use/land cover change (LULCC), Landsat is one of the most widely used due to its ability to support long-term monitoring with a moderate spatial and spectral resolution. Landsat imagery has been available at 30 m spatial resolution since 1982 [39,40,41]. Therefore, Landsat images are well-suited for long time series analyses, in which the whole image archive can be used to fit per-pixel models to detect breaks (i.e., those that correspond to LULCC) and to classify regions into different LULC types based on spectro-temporal patterns [42,43,44,45,46,47,48].
Continuous Change Detection and Classification (CCDC) is a pixel-oriented time series method with three main steps: (1) detection of breaks and stable periods, (2) fitting a harmonic regression for each stable period, using multiple bands and indices, and (3) using a supervised approach to classify each stable period into the LULC classes provided in the training data, based on its spectral–temporal similarity [49]. A key advantage of CCDC compared to other methods is that the classifications are temporally linked (i.e., not entirely independent), reducing the error when evaluating LULCC over time. This method has previously shown its potential for modeling LULCC, mapping forest degradation, and modeling aboveground biomass in different geographical contexts [42,50,51,52,53,54,55,56,57,58]. These characteristics make CCDC an appealing method to monitor avocado orchards.
Reporting area permanence or change estimates for different periods has been a common technique for evaluating LULCC (e.g., refs. [28,29]); however, this approach is unable to identify whether the pixels that sum the areas of permanence or change are consistently the same across all the evaluated periods. Newer techniques have emphasized the need to track the trajectories of individual pixels across the complete time series to retain spatio-temporal information for detecting LULC permanence, single-change pixels, and alternating LULC pixels [59,60,61,62,63]. These details are crucial for understanding the spatio-temporal dynamics of LULCC in a particular region and provide indicators of the temporal consistency of LULC throughout the entire time series.
This study aimed to map the expansion of avocado orchards in the “Avocado Belt”, Mexico’s core avocado-growing region. All available Landsat images from 1993 to 2024 (i.e., Landsat 5, 7, 8, and 9 collections) were processed using the CCDC algorithm to map LULCC. The resulting absence/presence maps of avocado orchards were validated using reference data. Finally, a trajectory analysis was applied to decompose change processes into three components: alternation, exchange, and quantity. This final analysis provided detailed insights into the spatial and temporal dynamics of avocado expansion.

2. Materials and Methods

2.1. Study Area

Although avocados are cultivated in 29 of Mexico’s 32 states, Michoacán stands out as the dominant producer, accounting for around 75% of national production [25,30]. The core avocado-producing region of Michoacán, commonly referred to as the “Avocado Belt”, is located in the central part of the country, spanning the Trans-Mexican Volcanic Belt and the Balsas River Basin (Figure 1). In this study, the “Avocado Belt” was delimited between approximately 18°54′ N, 102°53′ W and 20°3′ N, 100°9′ W. To facilitate the description of different temporal trends within the “Avocado Belt”, six main avocado production zones were defined by grouping municipal boundaries: (A) Tingüindín, Tangamandapio (municipal capital: Tarecuato), Los Reyes, Tocumbo, and Cotija; (B) Uruapan, Peribán, Tancítaro, and Nuevo Parangaricutiro; (C) Zacapu, Purépero (municipal capital: Purépero de Echáiz), and Chilchota; (D) Tacámbaro, Ario (municipal capital: Ario de Rosales), Salvador Escalante (municipal capital: Santa Clara del Cobre), Ziracuaretiro, and Tingambato; (E) Morelia, Acuitzio (municipal capital: Acuitzio del Canje), and Madero (municipal capital: Villa Madero); and (F) Zitácuaro, Tuxpan, Jungapeo, Juárez (municipal capital: Benito Juárez), Ocampo, and Susupuato (Figure 1).
The “Avocado Belt” lies at elevations ranging from 1500 to 2400 m above sea level and is characterized by a warm sub-humid climate, with an average annual precipitation of 800 to 1600 mm and yearly mean temperatures ranging from 10 °C to 24 °C [64]. The dominant landforms include mountain ranges, hills, valleys, and plateaus, and the primary soil types are Andosols and Luvisols, which, together, cover over 80% of the area [64]. Naturally occurring vegetation consists mainly of temperate forests at higher elevations, such as those dominated by pine, oak, and fir, and tropical dry forests at lower elevations. Although the “Avocado Belt” was the central region of interest, the complete study area comprised a larger area with a broader range of biophysical conditions.

2.2. Satellite Image Processing

Landsat 5, 7, 8, and 9 Level 2 Collection 2 Tier 1 surface reflectance images were used to monitor LULCC from 1993 to 2024. To reduce computational load, images were resampled from their native 30 m resolution to 90 m. This period was selected as the earliest one with the highest availability of historic Landsat data for Mexico [65]. All clouds and shadows were masked in each image using its corresponding QA_PIXEL band. Six multispectral bands were used throughout the process: blue (B), green (G), red (R), near infrared (NIR), short-wave infrared 1 (SWIR1), and short-wave infrared 2 (SWIR2) bands.

2.3. Continuous Change Detection and Classification (CCDC)

The Continuous Change Detection and Classification (CCDC) algorithm [49] was used to detect changes and classify the study area. All the CCDC processes were run inside Google Earth Engine [66] using its corresponding implementation [67]. Since CCDC is a pixel-oriented approach, all steps are performed at a pixel level, including the detection of breaks and stable segments, as well as the LULC classification.
This CCDC workflow can be divided into five main steps: (1) preprocessing, (2) temporal segmentation, (3) fitting a harmonic regression to each stable segment, (4) training the regression coefficients to predict LULC, and (5) extracting the classifications for particular dates (Figure 2). The first step removes clouds from all the images using each image’s cloud mask and a multitemporal cloud detection, while the second one temporally segments each pixel’s time series into breaks and stable segments. The third step fits a harmonic regression to each stable segment. In the fourth step, a supervised classification algorithm is trained to predict the LULC of interest, based on the spectro-temporal patterns of each stable segment and additional ancillary variables. Thus, a single pixel can be associated with different LULC classes across its stable segments. Finally, in the last step, the user selects the desired temporal resolution to analyze the complete time series. The used CCDC parameters are shown in Table 1.
In the first step, only the G, R, NIR, SWIR1, and SWIR2 bands were used in the temporal segmentation to detect breaks and stable periods. Multitemporal mask detection (iterative TMask cloud detection) was then performed using G and SWIR2 bands. CCDC analysis was run with the default settings of the CCDC implementation in Google Earth Engine (Table 1; [68]). Afterwards, for each pixel in the time series and each stable segment (i.e., with no breaks detected), a harmonic regression with three harmonics (i.e., three terms of sine and cosine) was fitted for all six bands. From the regression process, the following coefficients were extracted: phase, slope, intercept, and root mean squared error (RMSE). Additional ancillary variables were added to the predictive variables: elevation, topographic slope, topographic aspect, population, tree cover, and night lights. Topographic data were obtained from a mosaic of Shuttle Radar Topography Mission (SRTM; [69]) and Advanced Land Observing Satellite (ALOS; [70]) data, population statistics from WorldPop [71], tree cover data for the year 2000 from the Global Forest Change dataset [72], and night lights from the Visible Infrared Imaging Radiometer Suite (VIIRS; [73]). Finally, the values of the coefficients extracted from the harmonic regression and the ancillary variables were used as the predictive variables in the supervised classification process.
The training dataset used in the supervised classification consisted of 18,867 points, which were manually labeled through visual interpretation. These points were distributed based on a rough estimate of the spatial extent of avocado and non-avocado areas, informed by a preliminary LULC classification that was produced using the same visual interpretation and classification procedure but with a smaller number of points. The training dataset included 16,153 absence points and 2714 presence points for avocado orchards. During the selection of these data, different types of non-avocado covers were included in the training set (i.e., temperate forests, tropical dry forests, agricultural lands, grasslands, and human settlements). Due to the availability of very-high-resolution images, the majority of these points (80–90%) were registered in 2019, with the remaining 10–20% distributed across 2014–2023. This process was performed in QGIS by a single visual interpreter using very-high-resolution images from Google, Bing, Yandex, and ESRI, as well as a 2011 avocado census based entirely on visual interpretation [29] and a previous LULC mapping study [28]. All training areas were interpreted at a spatial resolution of 90 m to match the resolution of the images used in the analysis.
Using the training data, a random forest algorithm with 150 trees was trained using all the predictive variables and the LULC classes as the target variable. Additionally, the number of variables per split was set to the square root of the number of predictive variables, and the out-of-bag sample size was set to 50% of the observations in the training data. Once trained, the algorithm classified all the segments in the time series based on their similarity to the spectro-temporal patterns it had learned, resulting in a classified time series.
Finally, the classification for each time series on 1 January of each year was extracted to analyze changes using a one-year temporal window. Water bodies were masked from all the previous images using their maximum historical extent, as defined by the Global Surface Water maps produced by the Joint Research Centre (JRC [74]).

2.4. Verification Process

Due to the limited availability of consistent high-resolution imagery across the whole time series, the verification process focused on the 2020–2023 period. This period was selected as a representative subset for validation, based on the availability of multiple high-resolution sources, including Sentinel-2, Google Earth, Bing, ESRI basemap, Yandex, and Planet imagery.
The verification process was focused on LULC presence at specific time points, instead of change during intervals (see Section 4.4 for the discussion of certain obstacles detected in change verification). Following a stratified random sampling design [75], 1088 reference points were verified by visual interpretation. These consisted of 884 non-avocado points and 204 avocado orchard points. For each LULC class, 25% of the total points were distributed evenly across the four years in the 2020–2023 period. For example, for the non-avocado class, 221 points were allocated in each of the years 2020, 2021, 2022, and 2023. The validation results were expressed as disagreement proportions and broken down into quantity and allocation components, as well as omission and commission errors [63]. In addition, overall accuracy (OA) and intersection over union (IoU) for the avocado orchard class were calculated using Equations (1) and (2), respectively.
OA = T P + T N T P + T N + F P + F N
IoU = T P T P + F P + F N
where TP stands for true positives, TN for true negatives, FP for false positives, and FN for false negatives. Since only a single verification process was performed, it was assumed that the same accuracy could be extrapolated across the whole time series. Discrepancies between the LULC maps and the verification data were expressed in relative terms. The difference between the class assigned in the map and the reference was expressed in terms of quantity and allocation disagreement [76,77].

2.5. Trajectory Analysis

Trajectory analysis was performed using the traj analysis R package v. 1.0.3 [60]. The primary advantage of this analysis is that it allows tracking each pixel’s trajectory across the entire time series, classifying change into three components: alternation, exchange, and quantity [60]. Alternation corresponds to areas that transitioned to or from avocado at one point in time but with that change being reversed later. Exchange corresponds to areas where an increase in avocado orchards was compensated by a decrease elsewhere in the study area, or vice versa. Quantity is the net difference in the number of pixels assigned to each LULC class within a given time interval. The annual change rate for each of these three components was calculated over the whole time series, along with the net gain/loss. These rates were expressed relative to the unified size (i.e., the total area that, at any point in the time series, was classified as avocado orchards; [60]).
In addition, when working with presence/absence LULC maps, pixel trajectories can be classified into eight possible cases:
  • Loss without alternation. Pixels that were converted from avocado orchards to another LULC once and remained as such during the rest of the time series.
  • Loss with alternation. Pixels that showed an avocado orchard loss at the end of the time series but had at least one intermediate period of loss followed by a gain.
  • Gain without alternation. Pixels that were converted to avocado orchards once and remained as such during the rest of the time series.
  • Gain with alternation. Pixels that showed an avocado orchard gain at the end of the time series but had at least one intermediate period of gain followed by a loss.
  • All alternation, loss first. Pixels that had avocado orchards at the start and end of the time series but showed a loss at least once in the time series.
  • All alternation, gain first. Pixels that showed an absence of avocado orchards at the start and end of the time series but showed a gain at least once in the time series.
  • Stable presence. Pixels that showed avocado orchards throughout the entire time series.
  • Stable absence. Pixels that showed an absence of avocado orchards throughout the complete time series.
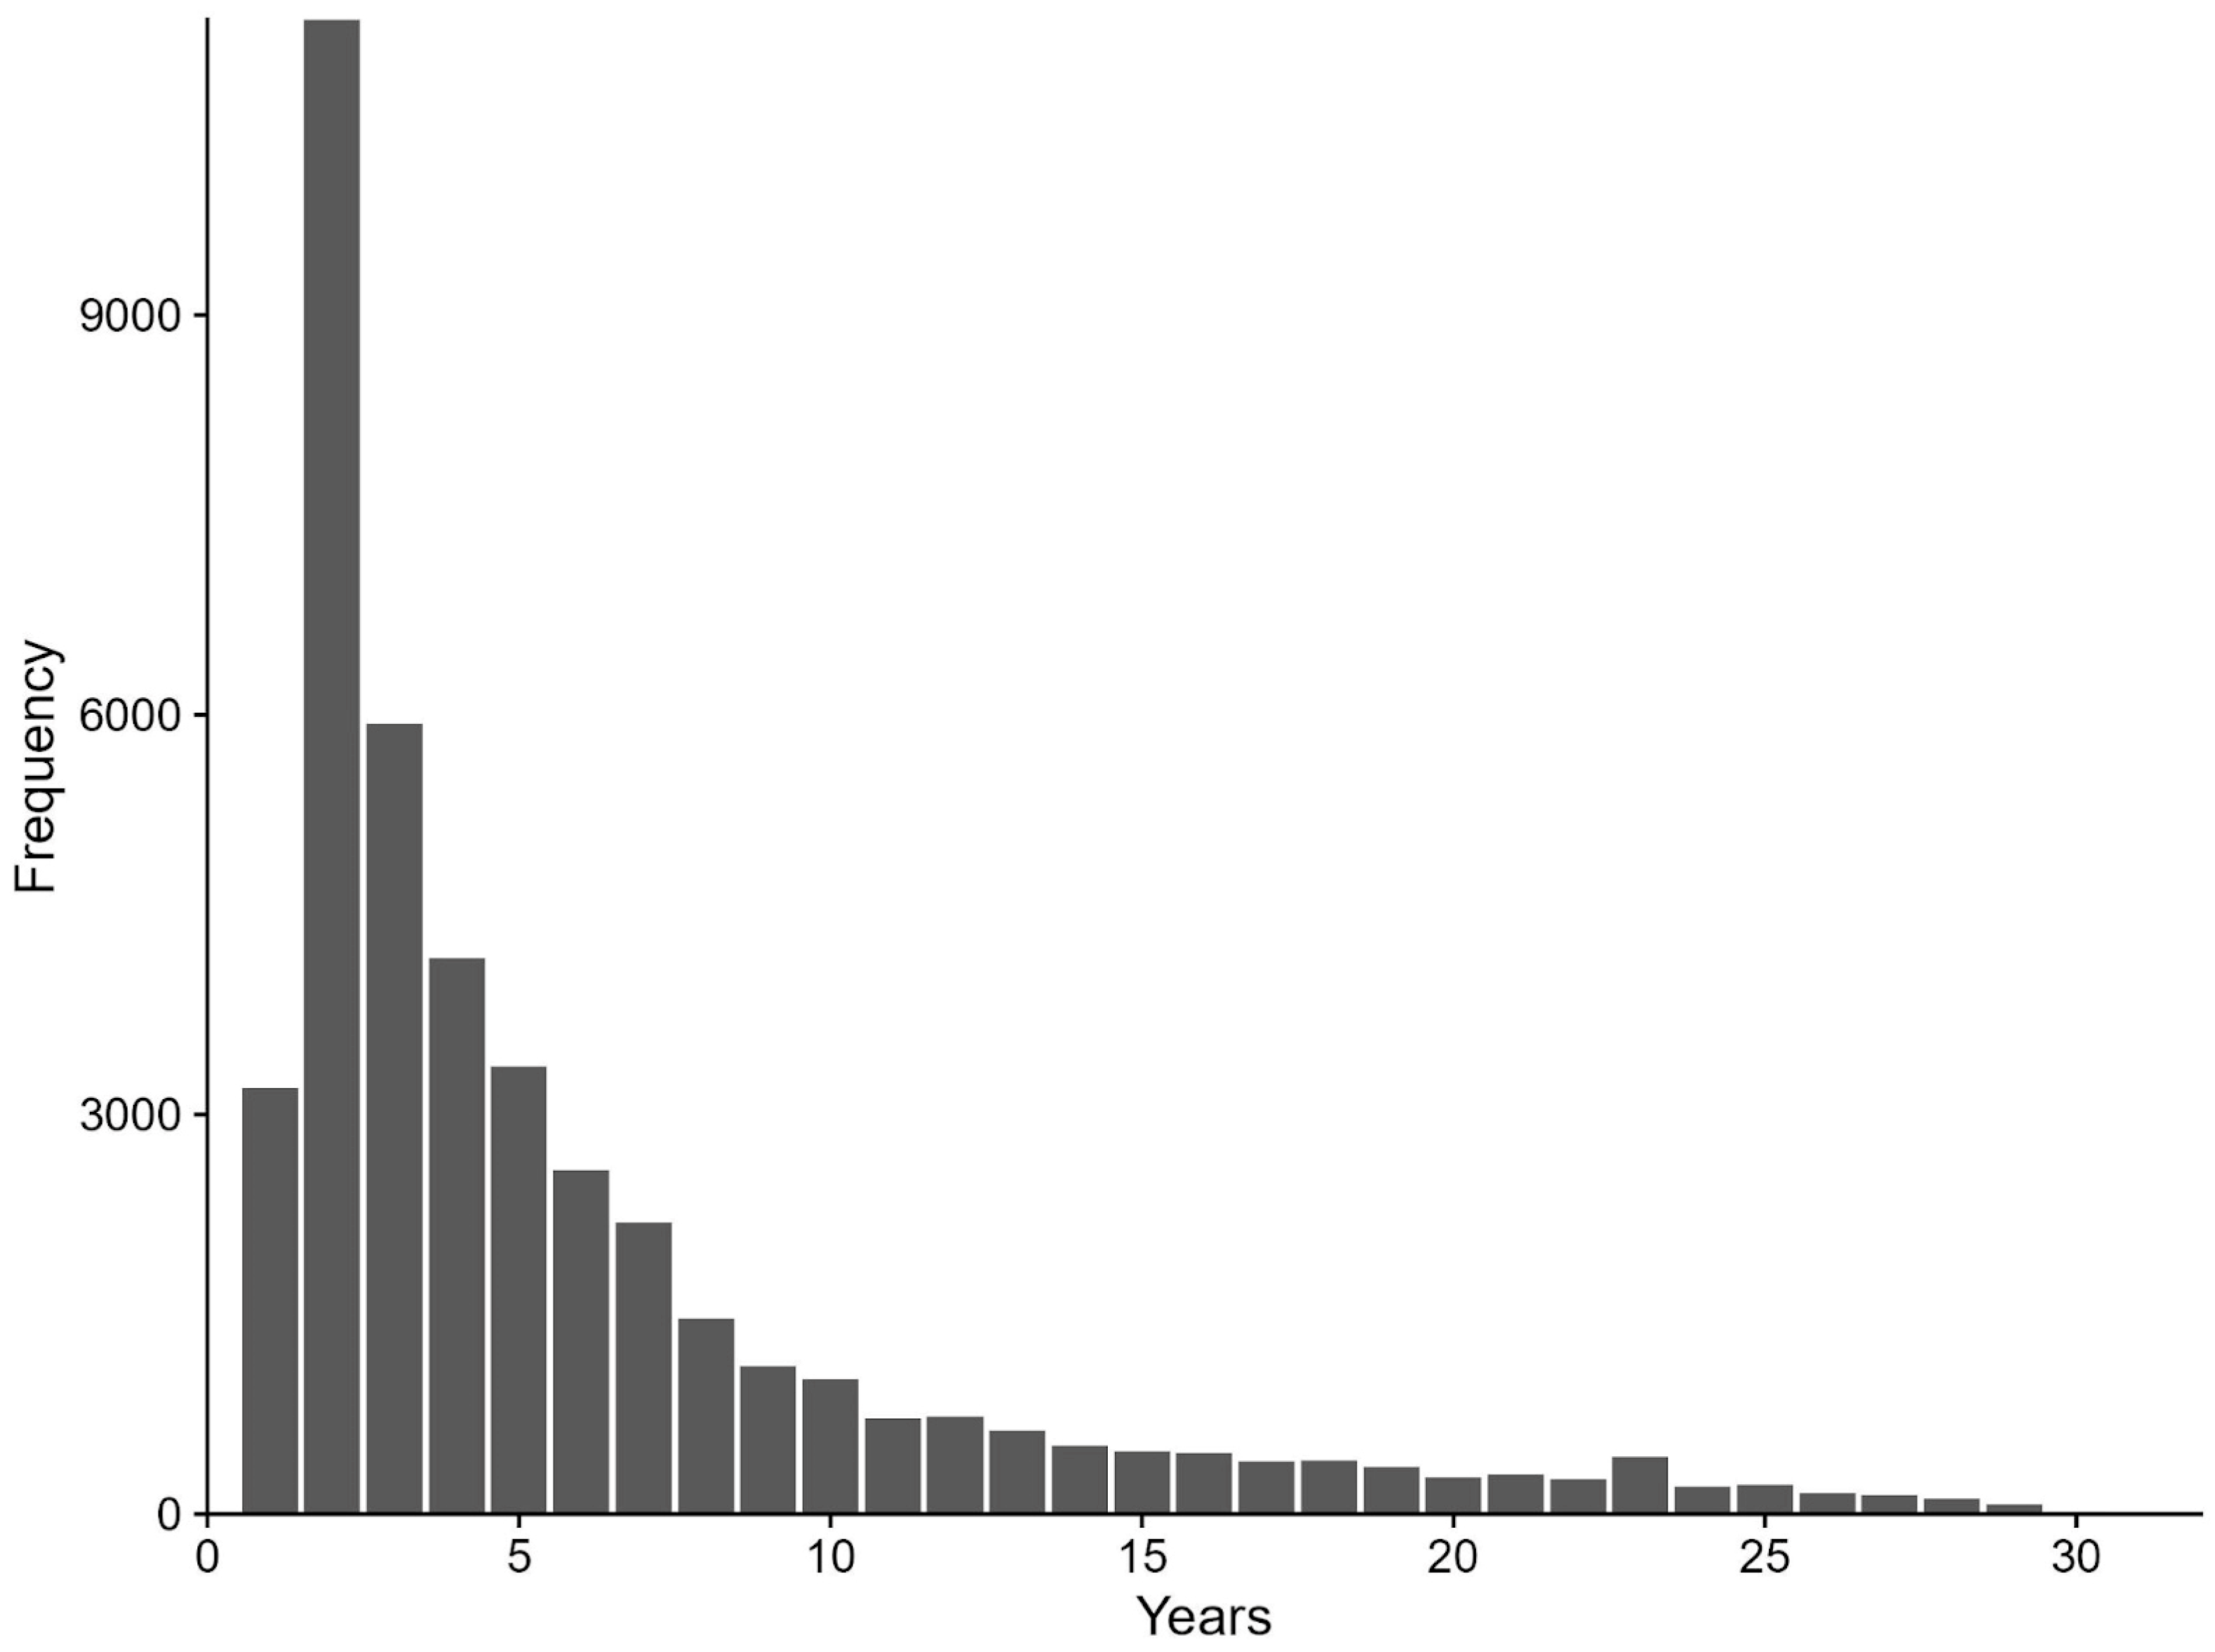
An additional analysis was conducted to analyze the duration of avocado orchard presence in trajectories that involved alternation (i.e., loss with alternation; gain with alternation; all alternation, gain first; and all alternation, loss first). In this analysis, each occurrence of avocado orchard presence in a time series was treated as a separate observation, regardless of whether it came from the same pixel, and its persistence duration (in years) was calculated. Instances in which avocado orchards were the final LULC were excluded, since their end date was unknown. These results were used as indicators of the quality of the LULC classification, as well as to characterize the typical period of avocado orchard presence in pixels with alternating trajectories.

3. Results

3.1. Verification

Resulting from the verification of the avocado presence/absence maps from 2000 to 2023, the overall accuracy or proportion of agreement was 0.97, which is equivalent to a 0.029 error. Overall accuracy is significantly influenced by the larger proportion of avocado orchard absence; hence, intersection over union (IoU = 0.62) is a more insightful metric for describing the method’s performance in detecting avocado orchards. Allocation disagreement stands for discrepancies in the location of different class pixels, while quantity disagreement stands for inconsistencies in the number of pixels of each class. Overall, the LULC maps showed a quantity disagreement of 1.11% and an allocation disagreement of 1.82%. For the absence of avocado orchards, the omission error was 0.97%, and the commission error was 2.15%, while for the presence of avocado orchards, the commission error was 15.69%, and the omission error = 29.28%. The confusion matrix can be consulted in the Supplementary Materials, expressed in simple counts (Table S1) and corrected by area proportions (Table S2).

3.2. Trajectories

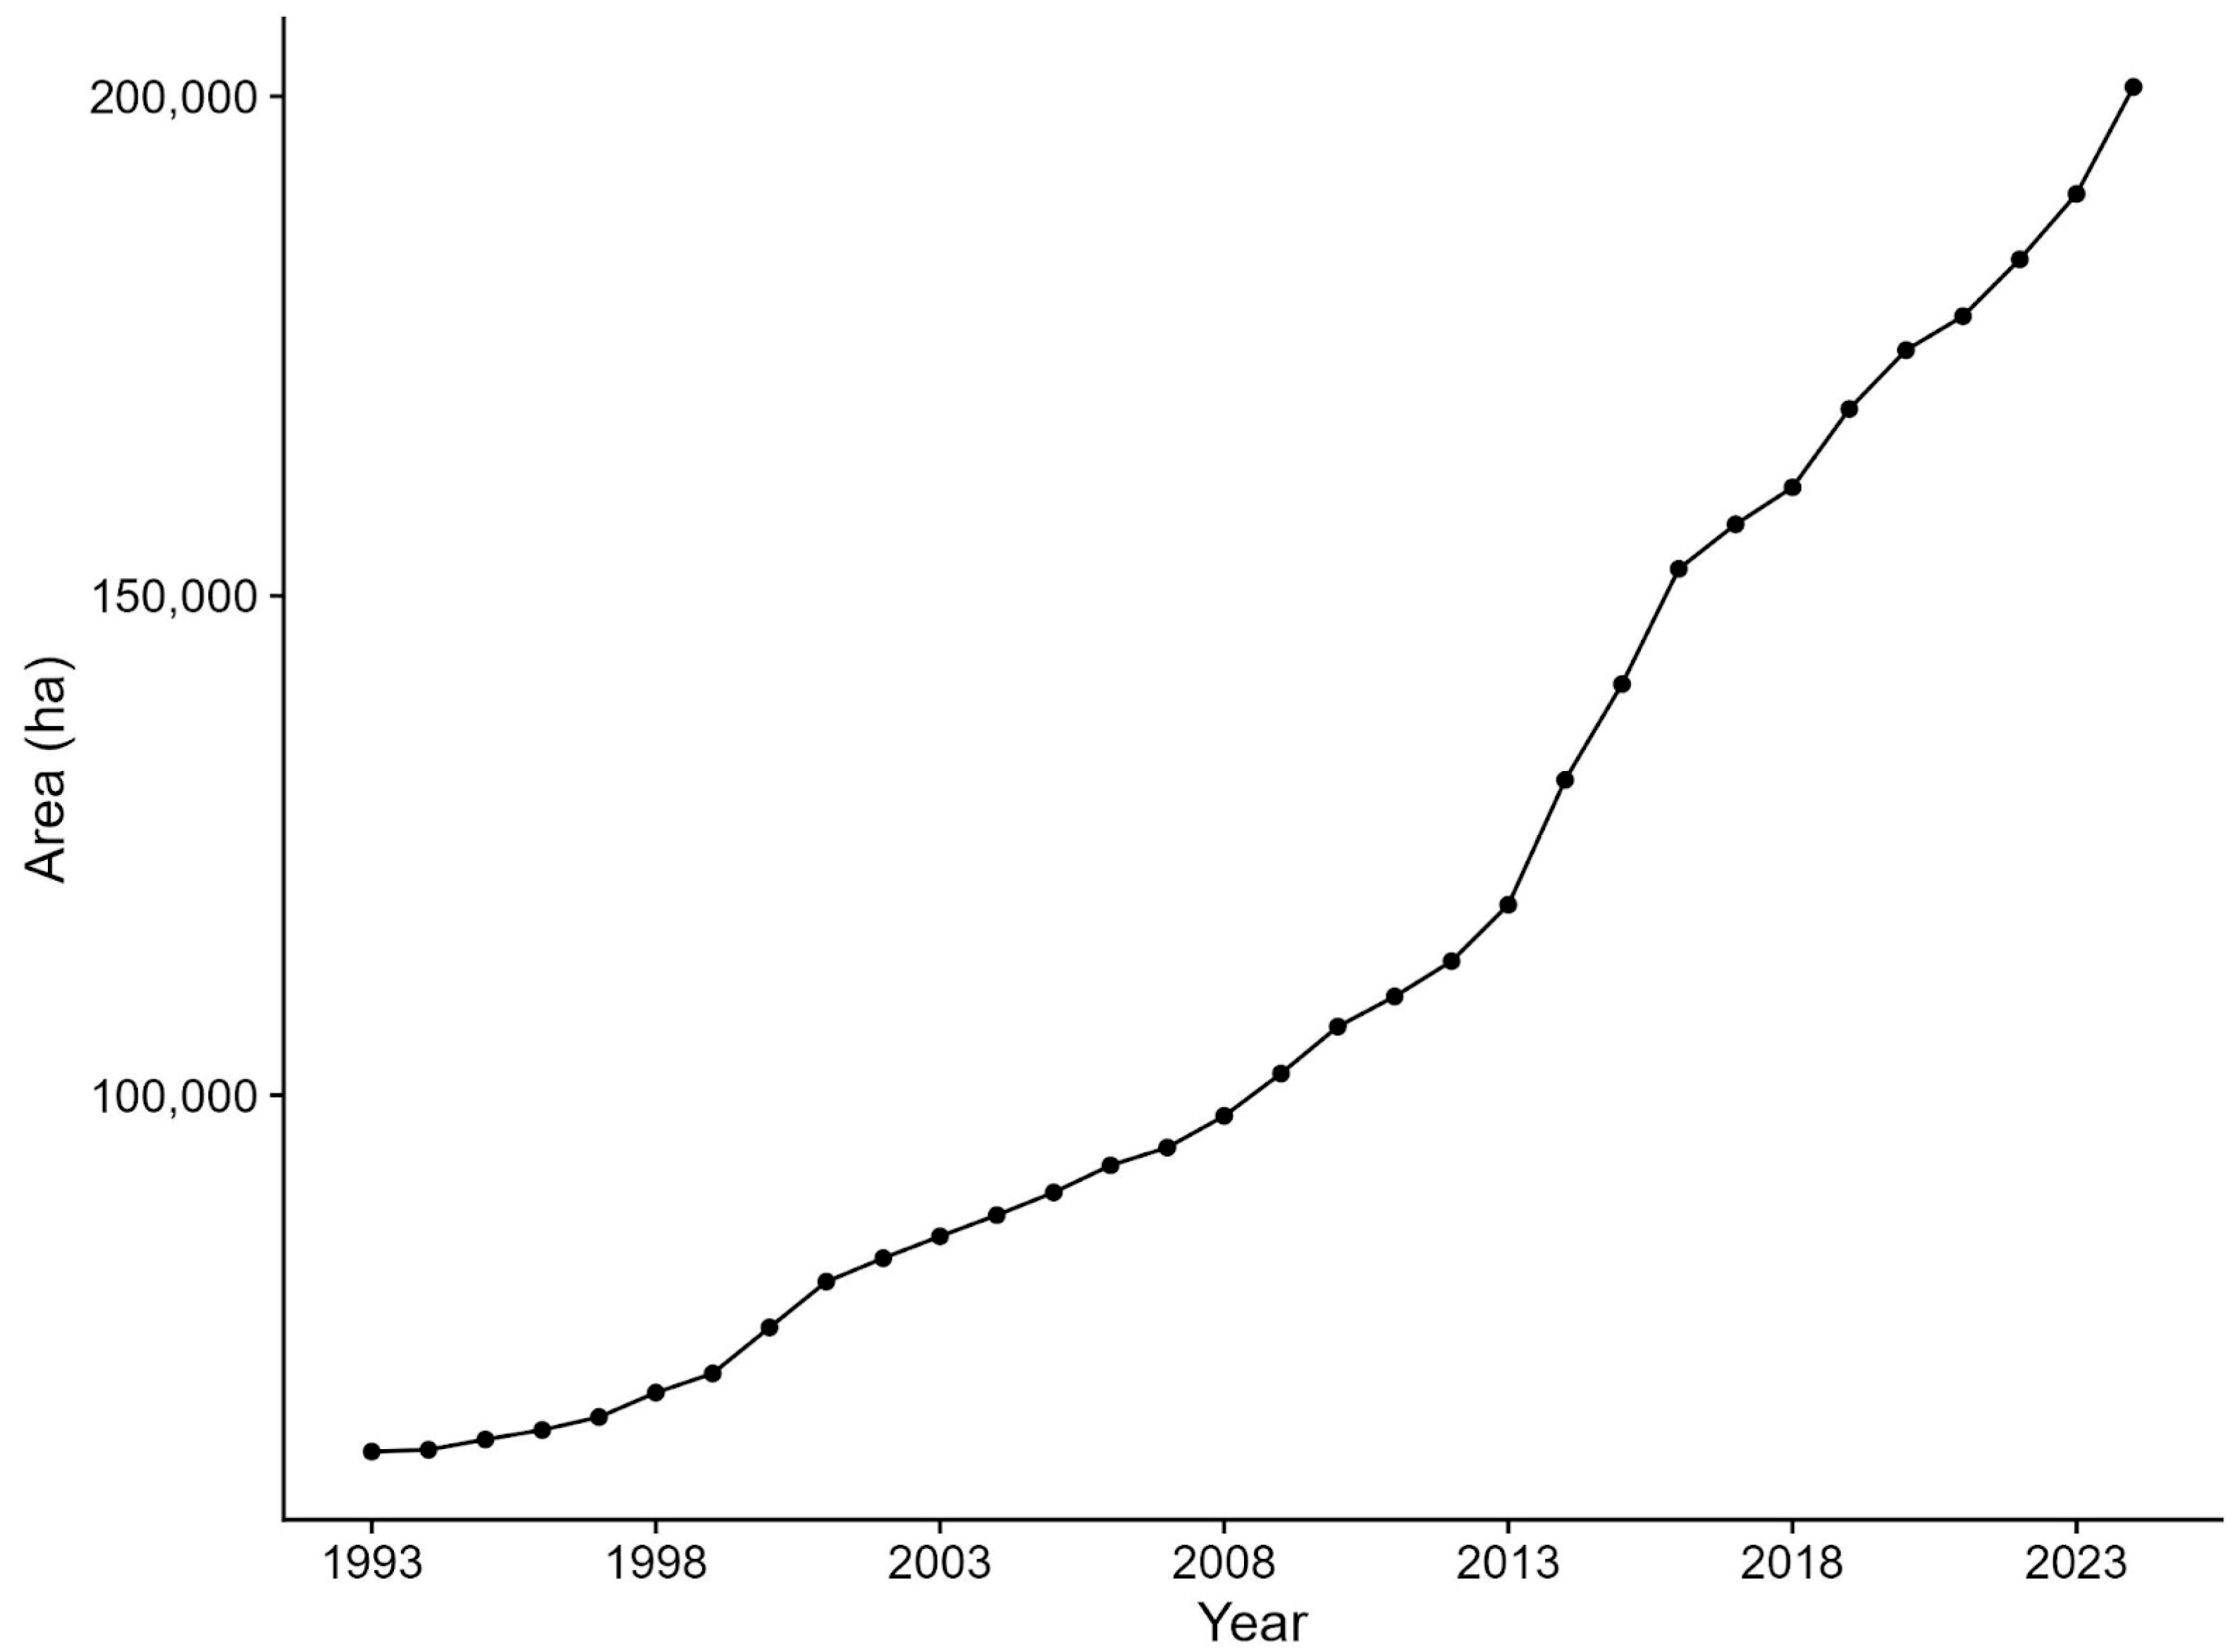
In 1993, the estimated area covered by avocado orchards was 64,304.28 ha, while at the end of the study period, this area occupied 200,938.32 ha (obtained by pixel counting; Figure 3). The general pattern showed a slower area expansion during the first half of the study period, while an accelerated expansion was particularly noticeable after 2014 (Figure 3).
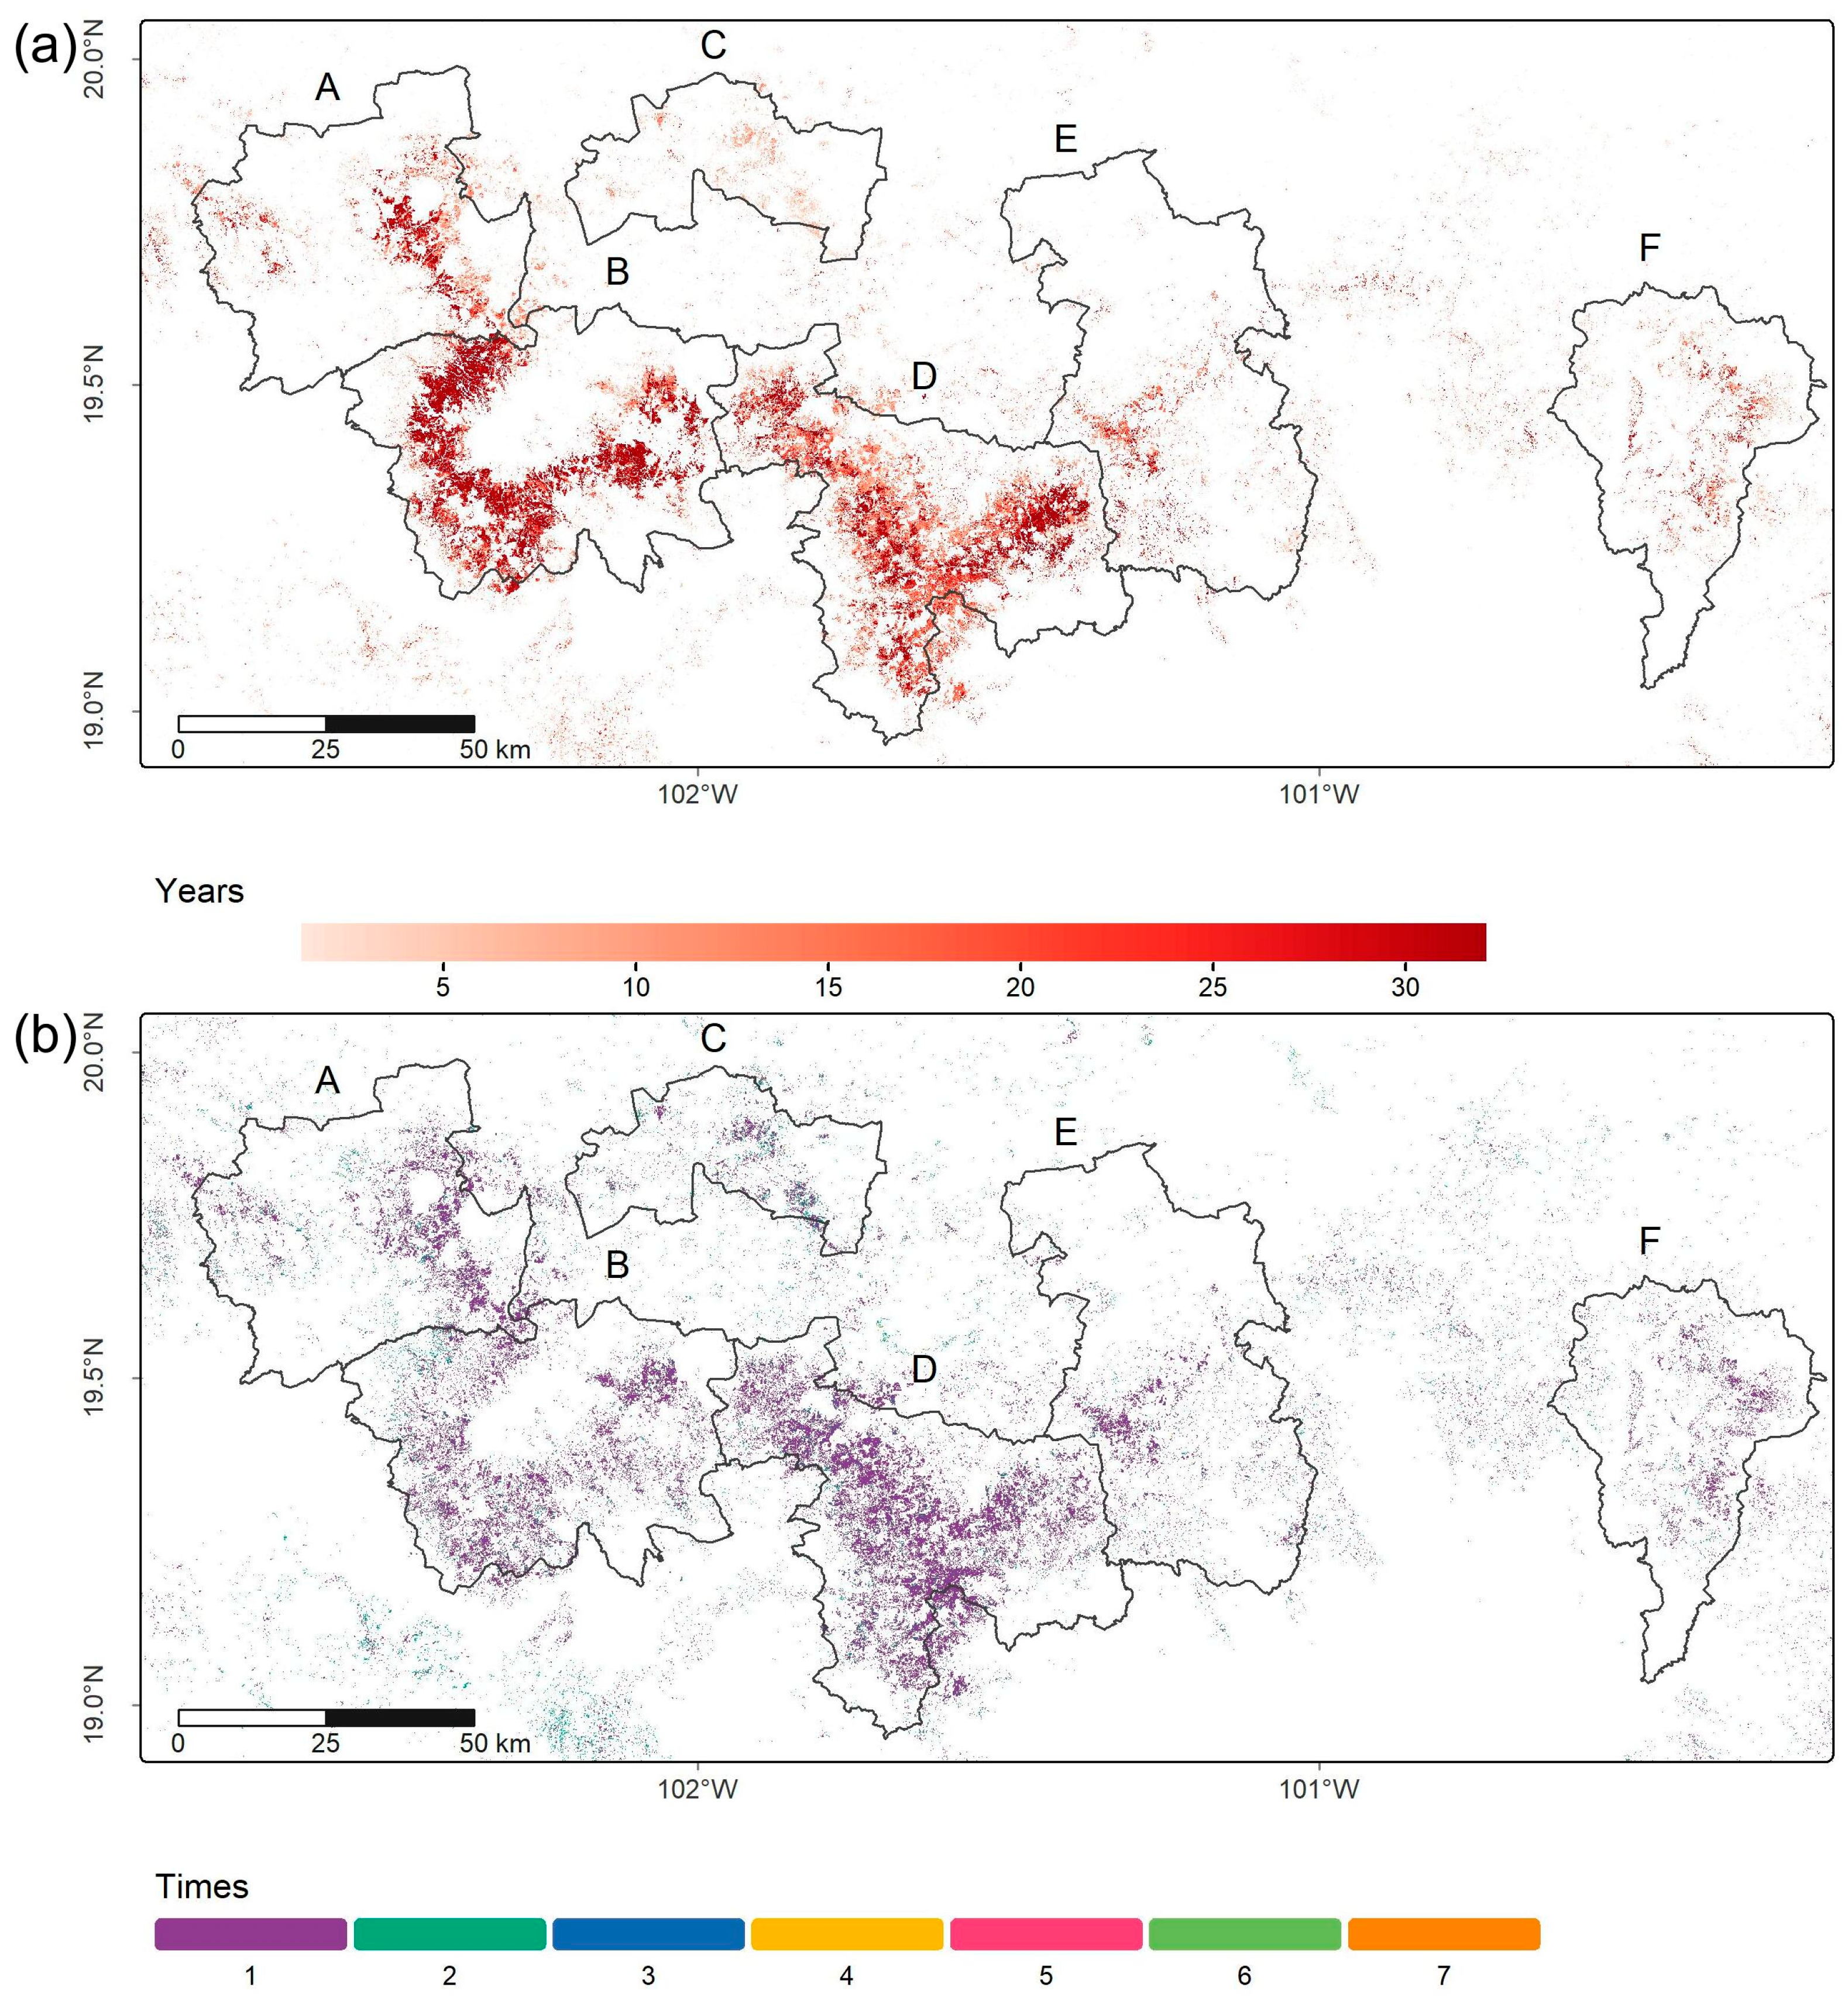
Most of the avocado orchards that were already established by 1993 remained as such during the entire time series, showing the permanent nature of areas transitioning into avocado orchards in the region and a high temporal consistency of the LULC maps (Figure 4a). Most of these orchards were present in the complete time series; thus, they showed a 32-year presence (Figure 4a). Areas that showed less than a 32-year avocado orchard presence were established during the period of analysis, regardless of whether they remained as such in the rest of the series or were lost in an intermediate year (Figure 4a). Additionally, most orchards showed a single time change, while up to seven changes were detected in the avocado orchard class (i.e., implying cycles of gain and loss, or vice versa; Figure 4b). This means that most of the avocado orchards were continuously classified as such, regardless of whether they were already established by 1993 or were planted afterwards.
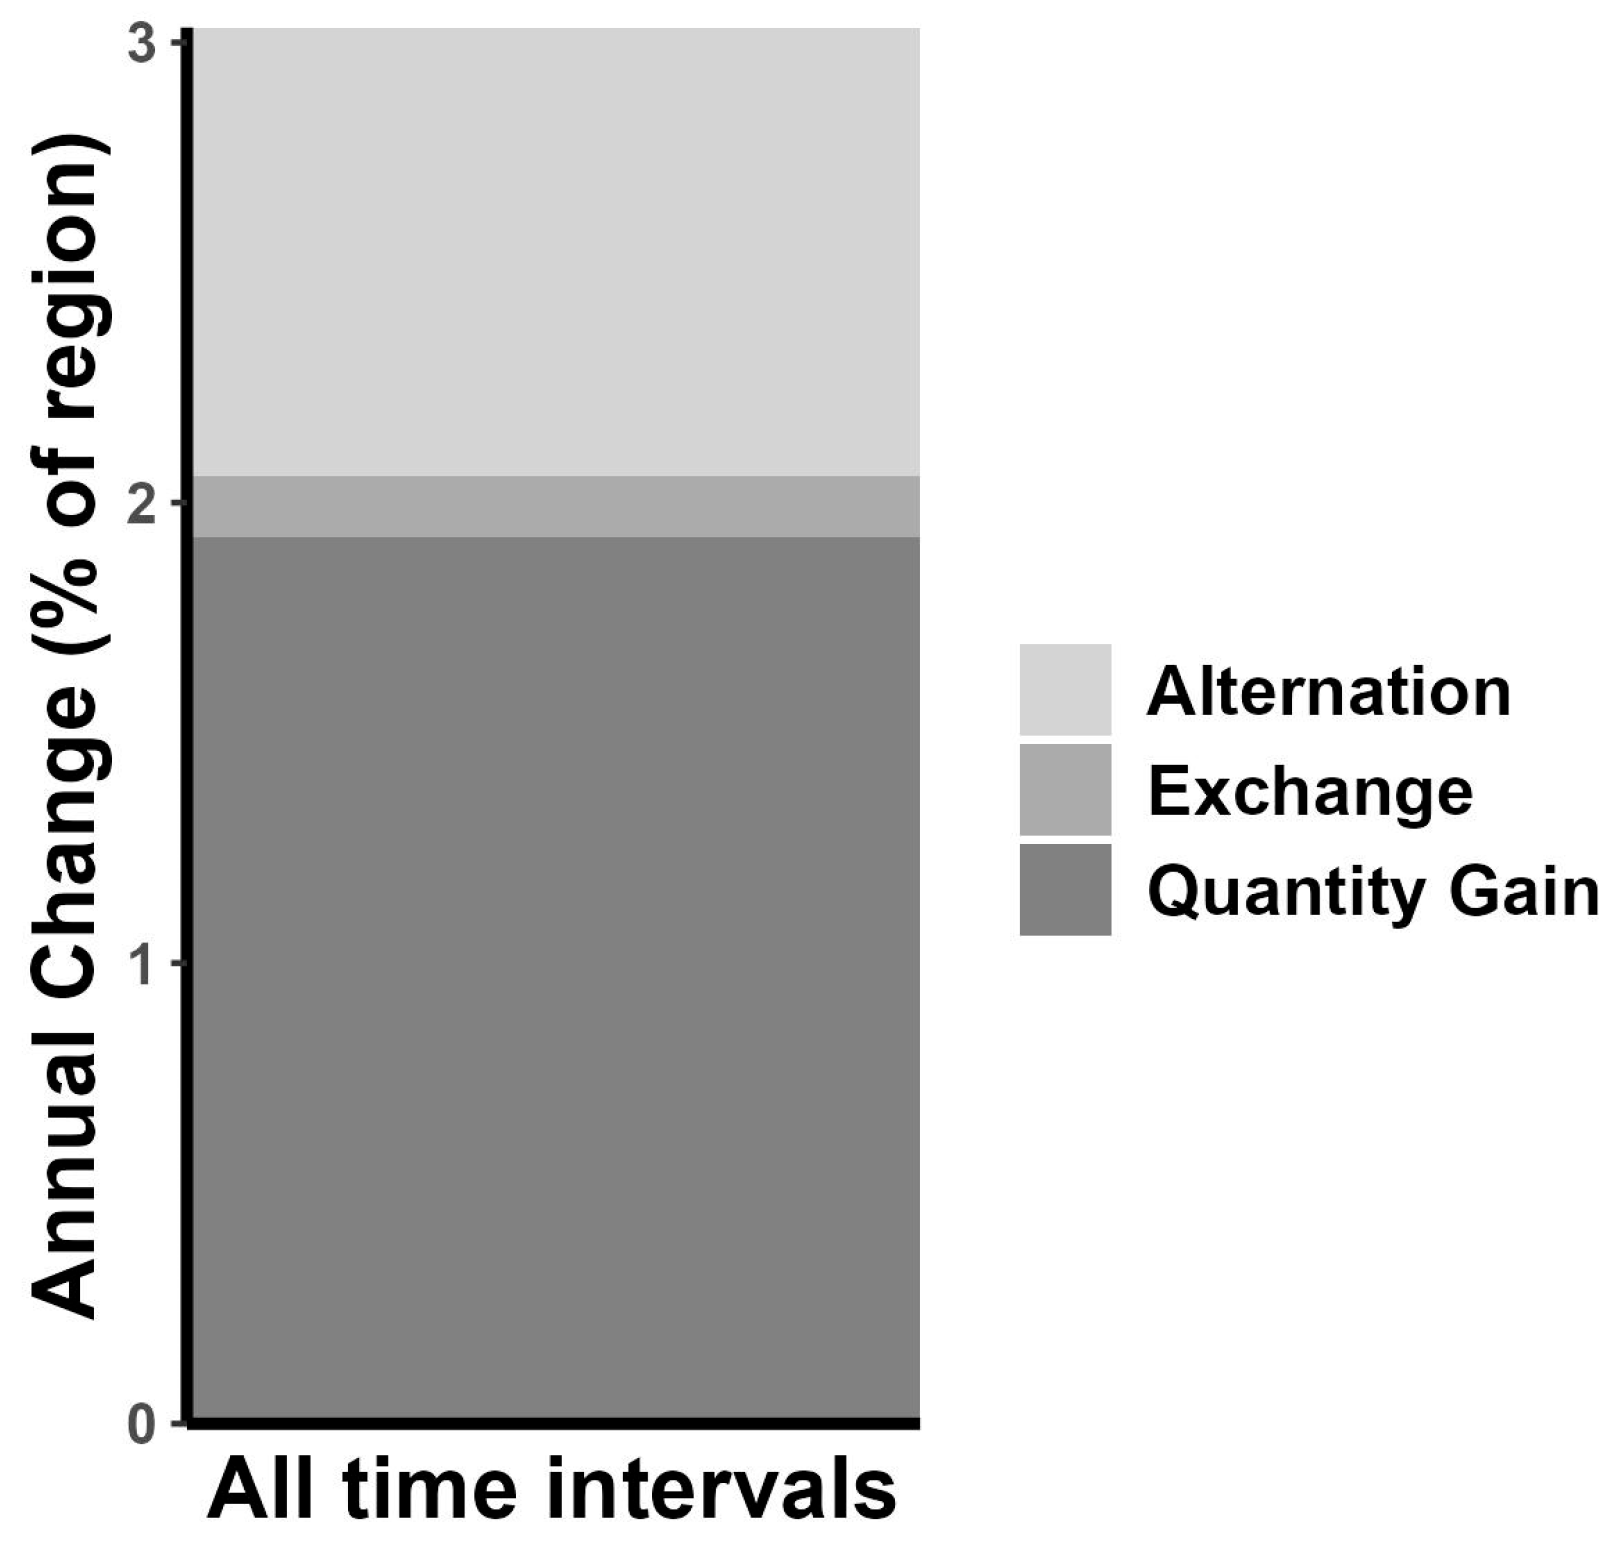
Our results show that the study area is a highly dynamic area with an average annual change of 3% of the unified size (i.e., all the places that were avocado orchards at some point in the time series; Figure 5). Since the most significant component of change was quantity gain, the absolute net change was positive, meaning that avocado orchards increased in area from 1993 to 2024 (Figure 5). The average annual rate of quantity gain in the avocado orchard area was almost 2% (1.92%) of the unified size. The following dominant process of change was alternation, which approximately corresponds to 1% of the average annual change (0.97%) of the unified size. Finally, exchange contributed to a tiny fraction of the observed change, representing almost 0.13% of the unified size.
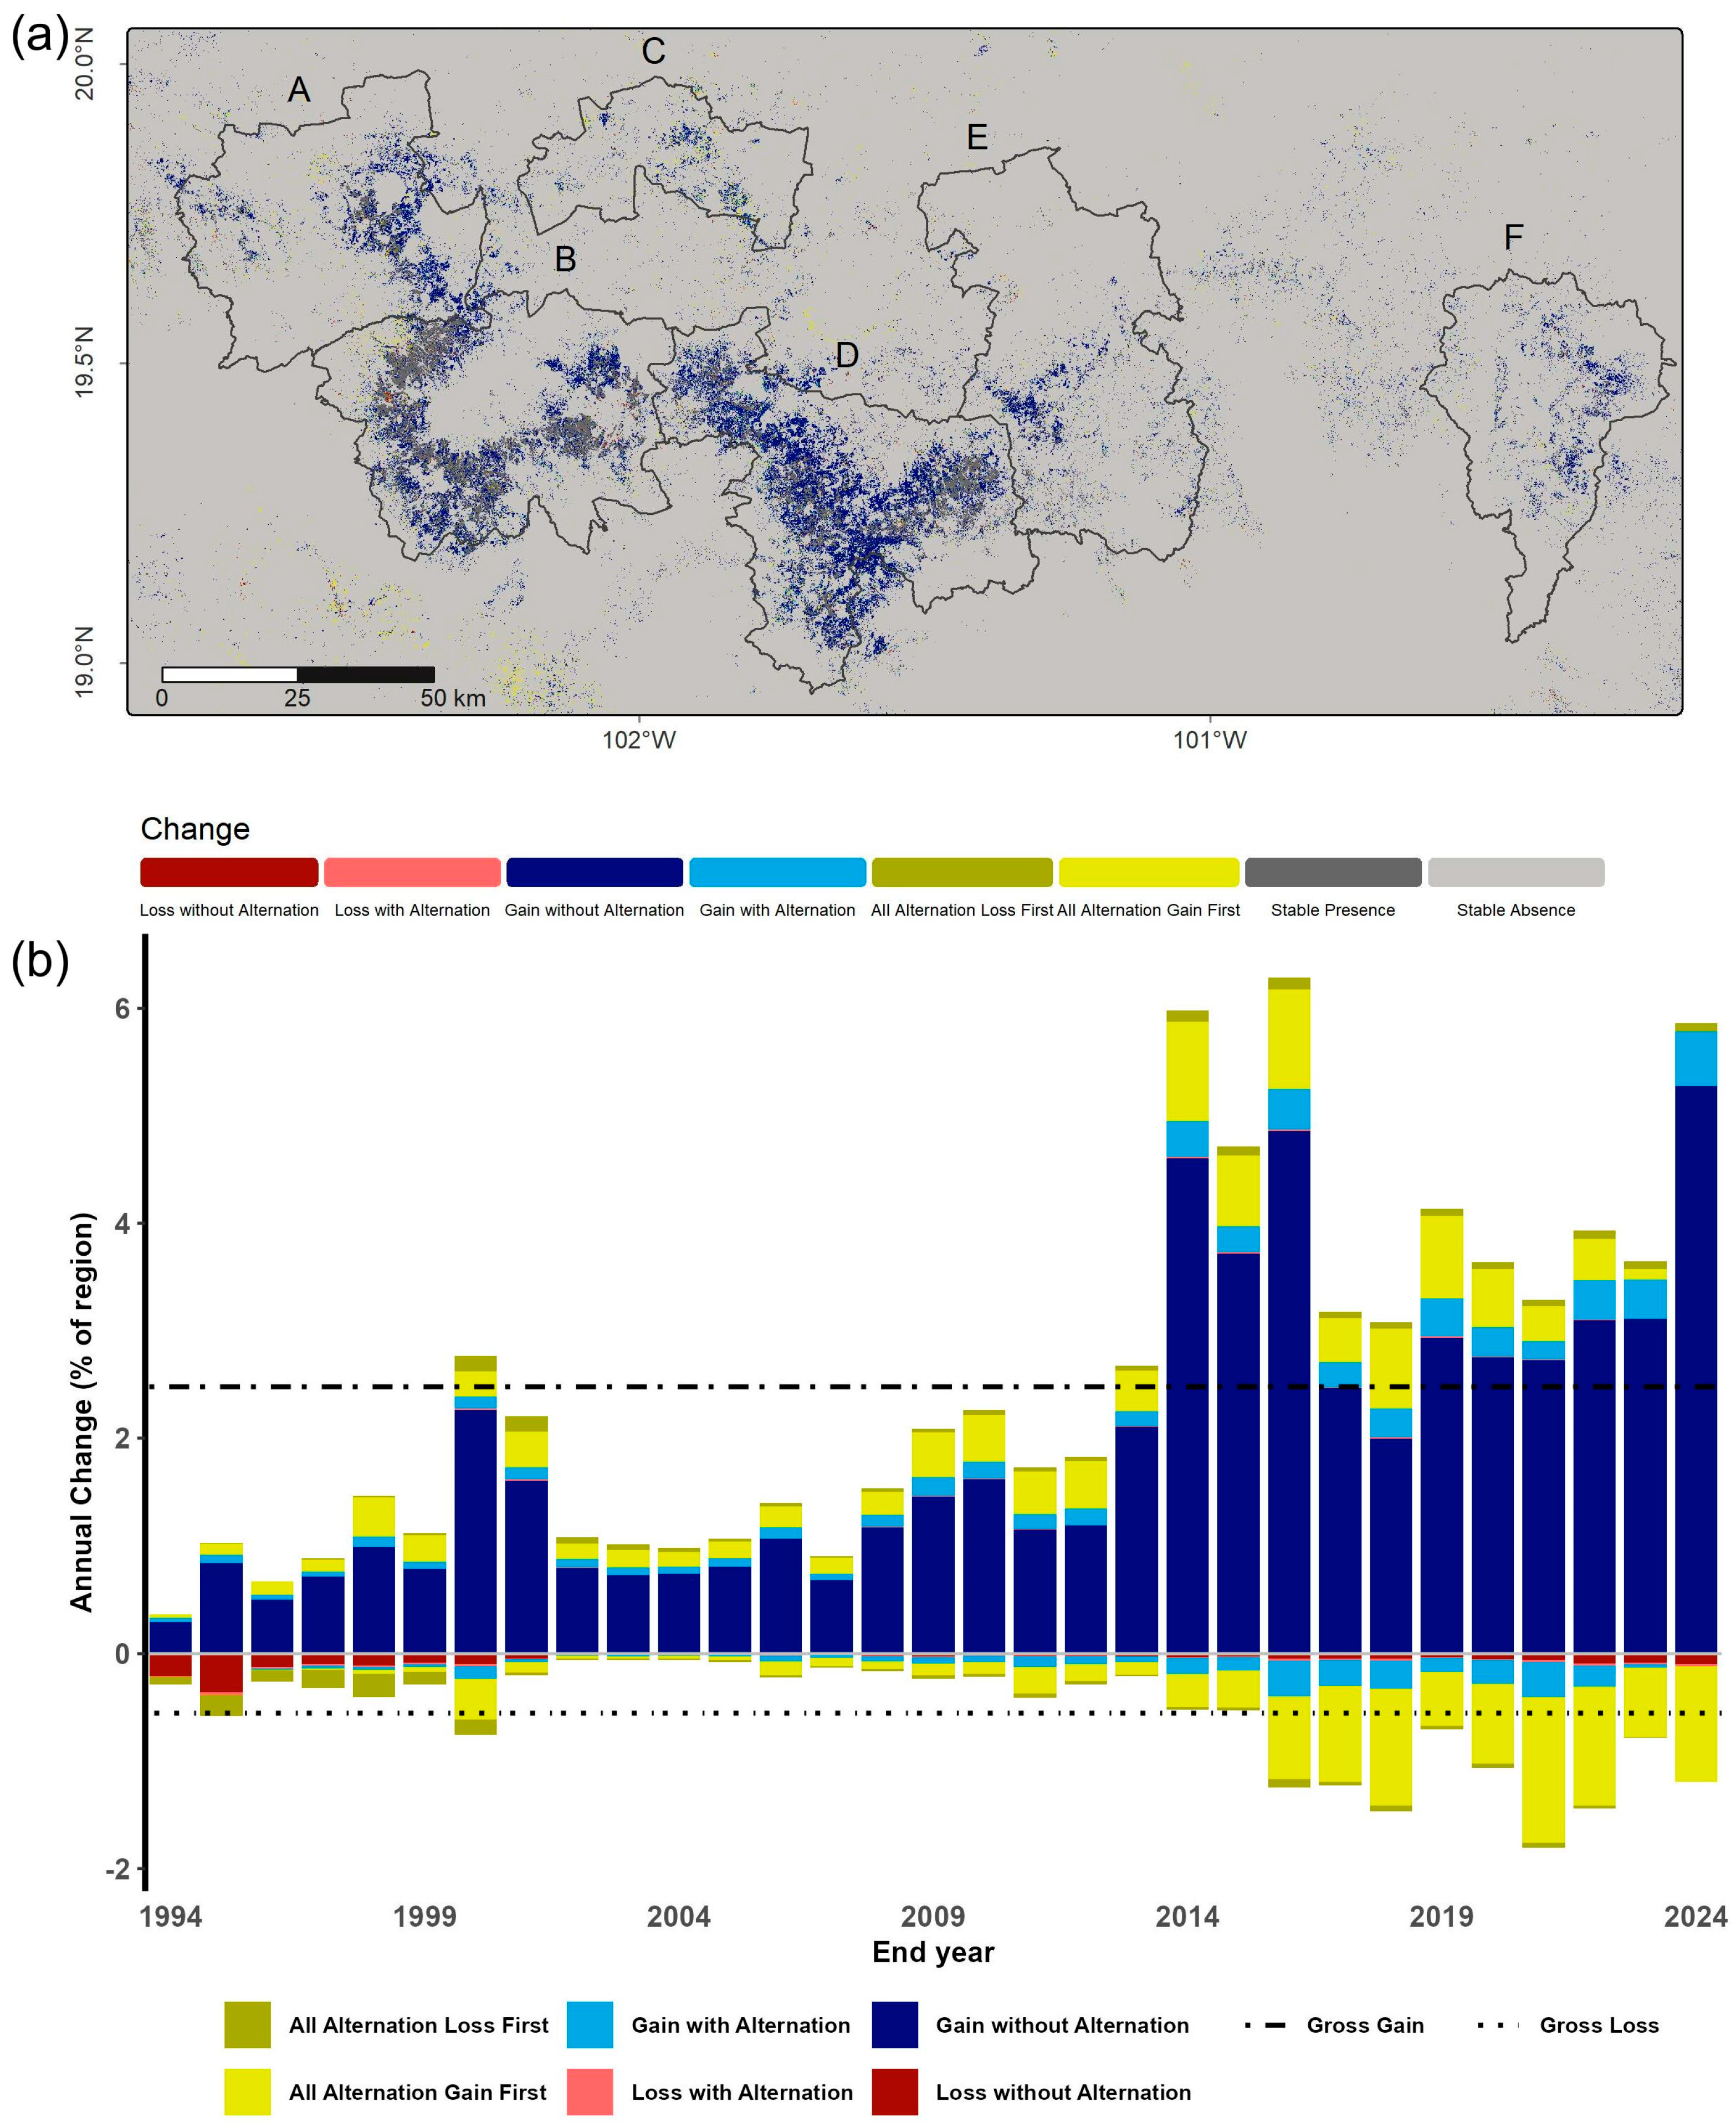
When analyzing the annual trend of the changes, gain without alternation was the dominant process in all the years (Figure 6b). This means that most of the new avocado orchards were gained once in the complete time series and remained as such during the rest of the analyzed period. The second most common process was all alternation—gain first, which corresponded to areas that started without avocado orchards, later became avocado orchards, and returned to an absence of avocado orchards in a particular year. Gain alternation was the third most common transition, representing areas that started as an absence of avocado orchards and ended as avocado orchards. Still, it showed at least one cycle of gain and loss in the time series. The fourth most common process was all alternation—loss first, which corresponded to areas that started as avocado orchards, were later lost, and returned to avocado orchards at a particular year. Loss without alternation was the fifth most common process, representing areas that started as avocado orchards and were lost by the end of the analysis (Figure 6). Finally, the mean gross gain rate was 2.48% of the unified size. In comparison, the mean gross loss was 0.55% of the unified size (Figure 6).
Most of the avocado orchards that appeared in the pixels with an alternating trajectory (i.e., loss with alternation; gain with alternation; all alternation, gain first; and all alternation, loss first) persisted for 2 years (Figure 7). This shows that a large proportion of alternating avocado orchards had a relatively short persistence, with a higher probability of being caused by mapping errors. However, at least half of the cases (median = 4 years) showed a persistence of four or more years, indicating a lower probability of being caused by mapping errors.

3.3. Spatial Patterns

Most of the avocado orchards established by 1993 were located in the western part of the study region, specifically in the surroundings of Uruapan, Peribán, and Tancítaro (zone B). Thus, the oldest avocado orchards in the study region can be found in this area (Figure 6a). In turn, a large portion of the expansion of avocado orchards between 1993 and 2024 occurred in the central part of the study region, in the vicinities of Tacámbaro, Ario, Santa Clara del Cobre, and Tingambato (zone D). This expansion can be observed by the presence of large extents covered by avocado orchards in 2024 (Figure 1) and avocado orchards of younger age (Figure 6a). Four other recent areas of avocado expansion were identified: (1) at the northwestern corner of the study area, in Tingüindín, Pamatácuaro, Tarecuato, and Cotija (zone A), (2) in the northern part of the study area, near Zacapu and Purépero (zone C), (3) in the central eastern part, mainly in the surroundings of Acuitzio del Canje and Villa Madero (zone E), and (4) in the eastern part, near Zitácuaro, and Benito Juárez (zone F, Figure 6a).

4. Discussion

This study identifies the spatio-temporal dynamics of avocado orchards’ expansion in Michoacan’s “Avocado Belt”, the world’s largest producer of avocados. Our evaluation updates the information available on the expansion of avocado orchards through to 2024, complementing previous assessments [27,29] and official data [25,30]. Furthermore, our approach stands out compared to previous studies, due to its automatic nature, ability to produce annual evaluations, and relatively high accuracy for obtaining avocado presence/absence maps (0.97).
In comparison to other methods used in the region, the main advantages of our approach can be summarized as follows [49,78]. Since CCDC is a time series method based on both change detection and classification processes, for a pixel to change its LULC class, a change must first be detected. This ability reduces false LULCC detections and temporal inconsistencies among maps of different dates. On the other hand, the classification of each pixel is based on its historical trajectory rather than a single observation, which avoids generating independent maps for each year (or setting different thresholds at different dates). These advantages have proven critical for achieving higher accuracies in other systems compared to other threshold-based methods [52]. Finally, CCDC is capable of classifying the entire time series; thus, it enables increasing the temporal resolution with which the LULCC can be analyzed. These characteristics make our methodological approach especially attractive because it can be updated in the future with relative ease.
The trajectory analysis enabled the identification of areas that underwent different processes, such as gain, loss, alternation, and exchange. Identifying these processes provided more profound insights into the results and the LULCC that occurred in the region. For example, our results show that, in 2024, avocado orchards covered more than three times the area occupied in 1993 (200,938.32 ha vs. 64,304.28 ha, obtained by pixel counting). Most of these avocado area gains occurred a single time (i.e., gain without alternation), revealing the permanent nature of this transformation and high temporal consistency among maps.

4.1. Temporal Patterns

Our main results indicate that avocado orchard expansion accelerated in the most recent period (2014–2024), exhibiting high gain rates compared to the average annual rate of change of the unified size (i.e., all the areas that corresponded to avocado orchards at some point in the time series). This finding agrees with previous studies that report a higher expansion of avocado orchards in the second and third decades of the 21st century. For example, ref. [29] report a higher expansion rate in the final periods of their evaluation (2005–2007 and 2007–2011), which partially aligns with our findings [29,64]. In addition, official reports also identify an acceleration in the area occupied by avocado orchards in Michoacán, especially after 2012 [30].
U.S. avocado demand has frequently been reported as a critical factor for understanding avocado expansion in Mexico as a telecoupled system [64,79,80,81]. In 2024, approximately 91% of the avocados consumed in the U.S. were produced in Mexico, and 90% of Mexico’s avocado exports were directed toward the U.S. [24,82]. One of the most significant agreements related to avocado international trade is the North American Free Trade Agreement (NAFTA), which came into legal effect in 1994 and was superseded by the United States–Mexico–Canada Agreement (USMCA) in 2020. Therefore, practically, the complete time lapse studied in this work corresponds to the NAFTA period, during which the largest avocado expansion occurred [64]. The detected increase in avocado orchard expansion coincides with the lifting of the avocado phytosanitary ban in 2001 and, subsequently, with a surge in U.S. avocado demand, particularly after 2010 [82]. In contrast, apparent domestic consumption in Mexico has increased at a lower rate than avocado production in the last decade [26]. Although the U.S.’s avocado demand may help explain the expansion of avocado orchards after 2010, an exact time agreement cannot be observed, as a time lag is expected due to the delay between demand and production, as well as a lag in the detection of avocado orchards (see Section 4.4).
Our results are similar to the avocado orchard extent shown in previous reports. For example, our results appear conservative since we mapped a total of 200,938 ha in 2024, whereas previous evaluations reported 244,705 ha in 2019 (vs. 168,703 ha in 2019; [27]). Although our approach could have outperformed this latter study due to the difference in the algorithms used (CCDC vs. random forest classification on a multitemporal composite), our results might have missed smaller avocado orchards that the Sentinel-2 images could have identified. Compared to an avocado orchard census conducted in 2011, our study reports a smaller area in that year compared to the latter (109,882 ha vs. 153,018 ha). This disagreement can be attributed to the difference in the methods and images employed in the two studies [29]. While our study employed a completely automatic approach using Landsat images resampled to a 90 m resolution, the other research identified avocado orchards exclusively by visually interpreting WorldView-2 images with 0.5 m pixel size. In this case, very small avocado orchards or very young ones could have been missed by our method (although these latter were probably identified in subsequent dates). Finally, our surface estimates are similar to other official reports of avocado production in Michoacán: 190,237 ha in our study vs. 186,713 ha in 2023 [30] or 200,938 ha in our study vs. 175,012 ha in 2024 [25].

4.2. Spatial Patterns

Our results show that avocado has not only expanded in areas where avocado orchards have been “traditionally” cultivated (i.e., around 1993) but also into new regions. This expansion likely occurred at the expense of both crop substitution and deforestation [23,28,35,38,83,84]. Furthermore, from 1993 to 2024, the area with the highest avocado orchard cover transitioned from Uruapan and Tancítaro (i.e., zone B) to the central part of the study area (i.e., zone D). The main spatial patterns evident in our results align with those of previous studies and future avocado expansion models [11,27,64,85].
Based on previous research, avocado expansion has been primarily related to bioclimatic and geophysical conditions (e.g., precipitation, temperature, soil, and terrain slope), as well as social and accessibility factors (e.g., land tenure and distance to settlements) [11,23,64]. Nonetheless, recent avocado expansion has occurred in suboptimal environmental conditions [23,64], which can have critical consequences for future production and its profitability, especially under climate change scenarios [11,32,85]. In a scenario where global avocado demand is expected to continue growing [23,24], avocado orchards are likely to expand into these areas.

4.3. Trajectories

The trajectory analysis enabled the identification of components of change, such as alternation and exchange, which were completely overlooked by only analyzing the area estimates for each year (Figure 2). In fact, this study is the first one to perform trajectory analysis of avocado orchards in the region, which can bring more profound insights into the LULCC in the “Avocado Belt” with a relatively high temporal resolution (i.e., annual windows).
Most of the change in avocado orchards corresponded to quantity gain (about 2% of the 3% of annual change in the unified size), while alternation represented the remaining 1%, and exchange accounted for the smallest part. This pattern indicates that most of the observed change corresponds to gross quantity gain in the complete time series, which is also confirmed by the increase in surface occupied by avocado orchards (Figure 3, Figure 4 and Figure 6). The almost 1% consisting of alternation represented areas that changed to/from avocado on one date but where the transition was reversed at some other point. Several alternations can occur for a single pixel in the complete time series; nonetheless, our results demonstrate that most alternations occurred only once (Figure 4b). Finally, exchange was shown in areas where an increase in avocado orchards was compensated by a loss in another part of the region, or vice versa.
Our results showed that most of the new avocado orchards remained as such from 1993 to 2024, which can be an indicator of the irreversibility of this transformation and the relatively high coherence among the LULC maps on different dates. Since avocado orchards consist of a perennial agricultural crop, it was expected that most of the orchards present in the study area would remain as such in the years to come. Additionally, since avocado is one of the most profitable agricultural products in the region, it is a very appealing activity for producers to establish and then maintain [24,25,26]. These two aspects help explain the permanence of the transformation of other uses into avocado orchards.
The second most common trajectory was all alternation—gain first, which can be translated into areas that started the analysis as non-avocado, later became avocado orchards, and then were transformed again into non-avocado. Due to the permanent nature of avocado orchard gains, we first thought this could be an artifact caused mainly by mapping errors. Nonetheless, at least half of the avocado orchards in alternating trajectories persisted for four years or more, which might correspond to cases where avocado orchards were removed to implement other crops (Figure 7). Although avocado might be a very attractive product for its economic revenue, it requires a longer term to obtain high revenues (i.e., plant maturation) compared to other perennial agricultural products such as berries. Furthermore, other areas that exhibit this transition may include abandoned avocado orchards due to low yields (i.e., those established outside the ecological niche of avocado), extortion, or other illegal activities prevalent in the region [32,35].
The third most common trajectory was gain with alternation. These areas represent pixels where avocado orchards were established, then lost, and finally returned to the avocado orchard class. This case may correspond to areas where avocado orchards were established, which then suffered an accidental loss due to fires or plagues and were subsequently re-established. Part of these pixels may also represent trajectories related to mapping errors; however, due to the temporal distribution of these changes (i.e., similar to the all alternation—gain first case, Figure 7), most of these changes were interpreted as real rather than a product of errors.

4.4. Limitations

In the first and last years, an increase was observed in the classes with alternation, mainly all alternation—gain first, all alternation—loss first, loss without alternation, and gain with alternation. This change in alternation is likely associated with an increase in areas with the unclassified class in the final period, due to errors in the early periods, mainly related to the lack of identification of stable segments in the last years, or the identification of less robust stable segments at the start of the time series. In the first case, late periods may include a higher presence of unclassified pixels as the method is unable to find a stable segment for more pixels, to which a LULC can be associated. These unclassified pixels might be caused by very noisy areas (presence of artifacts or fast transitions) or recently changed areas where a stable segment could not be identified. These unclassified areas occupied an area of 89,308 ha in 2024. Therefore, at least part of these unclassified areas could correspond to avocado orchards in the future, when stable segments can be identified in the years to come. In the second and third cases, this is an expected outcome of the CCDC algorithm, since observations before the start of the time series or after the end are not available to fit the spectro-temporal models [55]. In this case, nothing else can be done to reduce this error; however, the LULC maps with higher confidence should correspond to the intermediate years (i.e., around 2008) where the classes with alternation are among the lowest in the complete time series.
Another limitation of our study is that the verification process corresponds to presence at specific time points, rather than verifying changes over time. Although verifying change could have been the optimal approach to evaluate this work [76], it was challenging to discriminate between a transition of different non-avocado covers to avocado covers (e.g., agricultural lands or grasslands into avocado orchards) and a transition from non-avocado covers to other non-avocado ones (e.g., particular crops into other crops or grasslands). Even when avocado orchards were detected in the high-resolution images, their establishment date was uncertain, since the date of detection was several years after these orchards were planted. Our future efforts will focus on determining methodological procedures to overcome this obstacle.
The periods of highest avocado expansion may show a time lag of a few years, due to an expected delay between the establishment of avocado orchards and the date when the CCDC is capable of identifying them. In the first years of an avocado orchard, its reflectance pattern is dominated by bare soil, with a tiny fraction caused by the small avocado trees. Therefore, there is likely a lag of a few years before the avocado trees become large enough for the CCDC to detect them and classify that area as an avocado orchard. Consideration of this lag would certainly shift the period of highest avocado expansion by a few years.
We acknowledge that verifying the 2000–2023 period and assuming all the time series showed that a similar error can entail particular bias. However, we were unable to access very-high-resolution images for previous dates, which were crucial for identifying avocado orchards. Therefore, this decision was primarily taken on pragmatic terms. Specific periods may obtain slightly higher or lower accuracies, especially in the first and last periods (i.e., 1993 and 2024), where fewer observations are available to find stable segments and fit a spectro-temporal model. Nonetheless, similar to previous reports, the reported overall accuracy might be a suitable indicator for the entire time series [52].
Another potential limitation of our mapping approach was that using a water mask could have removed potential areas of interest, which was again a pragmatic decision. Since the primary aim of this study was to map the expansion of avocado orchards, the changes associated with growing or retracting water bodies were ignored. Thus, since these areas typically exhibited a very dramatic reflectance change, they were excluded using the JRC data with the maximum extent of water bodies. Additionally, since some agricultural flooded areas were mistaken for avocado orchards, this masking process helped us limit these errors.
Finally, the decision to process Landsat at a 90 m resolution was mainly based on reducing the computation load and minimizing processing errors in GEE. We are aware that this downscaling might reduce the potential to detect avocado orchards that cover small extents (i.e., smaller than 0.81 ha). Nonetheless, we consider that these small-scale orchards can have negligible environmental impacts compared to large-scale plantations that occur throughout the “Avocado Belt”.

4.5. Future Directions

Future research should analyze these results, but with a more detailed LULC classification system to provide further insights into the main LULC classes on which avocado orchards are being expanded, in particular, whether they are established following deforestation or not. Trajectory analysis tools for working with multiclass LULC maps are already available, making their implementation relatively straightforward [63]. These analyses are particularly useful for detecting trajectories that do not necessarily result in a forest-to-avocado orchard transition but that might include an intermediate stage.
This study can provide the first step towards better understanding the spatial determinants and impacts of avocado orchard expansion in the “Avocado Belt”. Therefore, forthcoming studies should also be focused on relating the main spatio-temporal patterns of avocado orchard expansion found in this study to potential causes (e.g., market demand, international free trade agreements, climate conditions, and political incentives), as well as its environmental (e.g., biodiversity, fragmentation, and water use), social (e.g., land management practices, land tenure, and governance) and economic (e.g., activity diversification and revenue) impacts [6,11,27,31,32,34,35,36,37,38,83,84,86]. Furthermore, our data will be helpful to increase the temporal resolution available for avocado orchard expansion, which can help improve the quality of future LULCC model estimations [23,85,87]. Additionally, similar studies should also be developed in countries with a rapidly growing avocado industry (e.g., Kenya, Israel, and South Africa) or other relevant avocado exporters (e.g., Peru and Chile [24]).
Finally, the presented method can be used to update future evaluations of avocado orchard expansion. The frequent update of information is crucial for informing potential land management decisions or policies, ensuring they align with the current changes and trends [88,89,90]. Thus, the utility of this research has the potential to evolve into a formal monitoring strategy for avocado expansion in Mexico with an annual time frame. The current results could be further improved by including new training data from different time windows and geographical contexts, as well as testing various sets of CCDC parameter configurations.

5. Conclusions

This study showed that CCDC is capable of monitoring avocado orchard expansion in the “Avocado Belt” from 1993 to 2024. The main advantages of this method are its temporally linked LULC maps and the ability to use spectro-temporal information to detect LULCC and assign a particular LULC to each stable segment. This analysis revealed that in the “Avocado Belt”, avocado orchards expanded more than threefold in the studied period, with a faster expansion rate during the last period (i.e., 2014–2024). Trajectory analysis identified that most of the avocado orchards became established only once, underscoring the permanence of this change. The dominant component of change in the analyzed period was quantity gain, representing almost a 2% annual change of the area occupied by avocado orchards at any point in the time series. The methodological approach proved to be a robust alternative for monitoring avocado orchard expansion, while trajectory analysis offered more profound insights into single-pixel trajectories throughout the entire time series. Future studies could benefit from using the presented method to update avocado orchard expansion estimates and relate the detected spatio-temporal patterns with different drivers and impacts.

Supplementary Materials

The following supporting information can be downloaded at: https://www.mdpi.com/article/10.3390/land14091792/s1, Table S1: Count confusion matrix resulting from the verification process; Table S2: Population confusion matrix resulting from the verification process corrected by each class proportion in the 2024 map.

Author Contributions

Conceptualization, J.V.S. and J.F.M.; methodology, software, validation, formal analysis, investigation, data curation, visualization, and writing—original draft preparation, J.V.S.; resources, J.F.M.; writing—review and editing, D.R.-M., J.F.M. and J.A.G.-C.; funding acquisition, J.F.M. and J.A.G.-C. All authors have read and agreed to the published version of the manuscript.

Funding

This research was funded by CONACyT “Persona ayudante SNI 3” (grant number I1200/051/2023) and Universidad Iberoamericana (División de Investigación—Convocatoria 17).

Data Availability Statement

The data and scripts supporting this study are available at: https://github.com/JonathanVSV/AvocBelt_Trajectory (accessed on 30 August 2025).

Acknowledgments

We would like to thank the Centro de Investigaciones en Geografía Ambiental, Universidad Nacional Autónoma de México (CIGA-UNAM) for their support.

Conflicts of Interest

The authors declare no conflicts of interest. The funders had no role in the design of this study, in the collection, analyses, or interpretation of the data, in the writing of the manuscript, or in the decision to publish the results.

Abbreviations

The following abbreviations are used in this manuscript:
LULCCLand use/land cover change
LULCLand use/land cover
CCDCContinuous Change Detection and Classification
BBlue
GGreen
RRed
NIRNear infrared
SWIR1Short-wave infrared 1
SWIR2Short-wave infrared 2
SRTMShuttle Radar Topography Missions
ALOSAdvanced Land Observing Satellite
VIIRSInfrared Imaging Radiometer Suite
JRCJoint Research Centre

References

  1. Curtis, P.G.; Slay, C.M.; Harris, N.L.; Tyukavina, A.; Hansen, M.C. Classifying Drivers of Global Forest Loss. Science 2018, 361, 1108–1111. [Google Scholar] [CrossRef] [PubMed]
  2. Laso Bayas, J.C.; See, L.; Georgieva, I.; Schepaschenko, D.; Danylo, O.; Dürauer, M.; Bartl, H.; Hofhansl, F.; Zadorozhniuk, R.; Burianchuk, M.; et al. Drivers of Tropical Forest Loss between 2008 and 2019. Sci. Data 2022, 9, 146. [Google Scholar] [CrossRef] [PubMed]
  3. Masolele, R.N.; De Sy, V.; Herold, M.; Marcos Gonzalez, D.; Verbesselt, J.; Gieseke, F.; Mullissa, A.G.; Martius, C. Spatial and Temporal Deep Learning Methods for Deriving Land-Use Following Deforestation: A Pan-Tropical Case Study Using Landsat Time Series. Remote Sens. Environ. 2021, 264, 112600. [Google Scholar] [CrossRef]
  4. Sims, M.; Stanimirova, R.; Raichuk, A.; Neumann, M.; Richter, J.; Follett, F.; Maccarthy, J.; Lister, K.; Randle, C.; Sloat, L.; et al. Global Drivers of Forest Loss at 1 Km Resolution. Environ. Res. Lett. 2024, 20, 074027. [Google Scholar] [CrossRef]
  5. Carlson, K.M.; Curran, L.M.; Asner, G.P.; Pittman, A.M.; Trigg, S.N.; Marion Adeney, J. Carbon Emissions from Forest Conversion by Kalimantan Oil Palm Plantations. Nat. Clim. Change 2013, 3, 283–287. [Google Scholar] [CrossRef]
  6. Fuerte-Velázquez, D.J.; Gómez-Tagle, A. Water Footprint and Water Sustainability of Agroindustrial Avocado Production in a Warm Tropical Climate Municipality: A Case Study in the Michoacan Avocado Belt in Central México. Water 2024, 16, 1719. [Google Scholar] [CrossRef]
  7. Kehoe, L.; Romero-Muñoz, A.; Polaina, E.; Estes, L.; Kreft, H.; Kuemmerle, T. Biodiversity at Risk under Future Cropland Expansion and Intensification. Nat. Ecol. Evol. 2017, 1, 1129–1135. [Google Scholar] [CrossRef]
  8. Niyogi, D.; Mahmood, R.; Adegoke, J.O. Land-Use/Land-Cover Change and Its Impacts on Weather and Climate. Bound.-Layer Meteorol. 2009, 133, 297–298. [Google Scholar] [CrossRef]
  9. Singh, D.; Slik, J.W.F.; Jeon, Y.-S.; Tomlinson, K.W.; Yang, X.; Wang, J.; Kerfahi, D.; Porazinska, D.L.; Adams, J.M. Tropical Forest Conversion to Rubber Plantation Affects Soil Micro- & Mesofaunal Community & Diversity. Sci. Rep. 2019, 9, 5893. [Google Scholar] [CrossRef]
  10. Wilson, C.O. Land Use/Land Cover Water Quality Nexus: Quantifying Anthropogenic Influences on Surface Water Quality. Environ. Monit. Assess. 2015, 187, 424. [Google Scholar] [CrossRef]
  11. Denvir, A. Avocado Expansion and the Threat of Forest Loss in Michoacán, Mexico under Climate Change Scenarios. Appl. Geogr. 2023, 151, 102856. [Google Scholar] [CrossRef]
  12. Kalischek, N.; Lang, N.; Renier, C.; Daudt, R.C.; Addoah, T.; Thompson, W.; Blaser-Hart, W.J.; Garrett, R.; Schindler, K.; Wegner, J.D. Cocoa Plantations Are Associated with Deforestation in Côte d’Ivoire and Ghana. Nat. Food 2023, 4, 384–393. [Google Scholar] [CrossRef]
  13. Kastens, J.H.; Brown, J.C.; Coutinho, A.C.; Bishop, C.R.; Esquerdo, J.C.D.M. Soy Moratorium Impacts on Soybean and Deforestation Dynamics in Mato Grosso, Brazil. PLoS ONE 2017, 12, e0176168. [Google Scholar] [CrossRef]
  14. Meyfroidt, P.; Vu, T.P.; Hoang, V.A. Trajectories of Deforestation, Coffee Expansion and Displacement of Shifting Cultivation in the Central Highlands of Vietnam. Glob. Environ. Change 2013, 23, 1187–1198. [Google Scholar] [CrossRef]
  15. Ordway, E.M.; Naylor, R.L.; Nkongho, R.N.; Lambin, E.F. Oil Palm Expansion and Deforestation in Southwest Cameroon Associated with Proliferation of Informal Mills. Nat. Commun. 2019, 10, 114. [Google Scholar] [CrossRef] [PubMed]
  16. Ordway, E.M.; Asner, G.P.; Lambin, E.F. Deforestation Risk Due to Commodity Crop Expansion in Sub-Saharan Africa. Environ. Res. Lett. 2017, 12, 044015. [Google Scholar] [CrossRef]
  17. Wang, Y.; Hollingsworth, P.M.; Zhai, D.; West, C.D.; Green, J.M.H.; Chen, H.; Hurni, K.; Su, Y.; Warren-Thomas, E.; Xu, J.; et al. High-Resolution Maps Show That Rubber Causes Substantial Deforestation. Nature 2023, 623, 340–346. [Google Scholar] [CrossRef] [PubMed]
  18. EU Regulation (EU) 2023/1115 of the European Parliament and of the Council of 31 May 2023 on the Making Available on the Union Market and the Export from the Union of Certain Commodities and Products Associated with Deforestation and Forest Degradation and Repealing Regulation (EU) No 995/2010 2023. Available online: https://eur-lex.europa.eu/legal-content/EN/TXT/?uri=CELEX%3A32023R1115&qid=1687867231461 (accessed on 2 July 2025).
  19. Heilmayr, R.; Rausch, L.L.; Munger, J.; Gibbs, H.K. Brazil’s Amazon Soy Moratorium Reduced Deforestation. Nat. Food 2020, 1, 801–810. [Google Scholar] [CrossRef]
  20. Michoacán State Government Pro-Forest Avocado. Available online: https://forestavo.com/ (accessed on 3 July 2025).
  21. RSPO (Roundtable on Sustainable Palm Oil). RSPO Certification Systems for Principles & Criteria and RSPO Independent Smallholder Standard 2020. Available online: https://rspo.org/wp-content/uploads/RSPO_Certification_Systems_Document_-_November_2020-ENG-1.pdf (accessed on 1 July 2025).
  22. Bourgoin, C.; Verhegghen, A.; Carboni, S.; Degrève, L.; Ameztoy Aramendi, I.; Ceccherini, G.; Colditz, R.; Achard, F. Global Forest Maps for the Year 2020 to Support the EU Regulation on Deforestation-Free Supply Chains—Improved Map of Global Forest Cover (GFC2020) and Preliminary Map of Global Forest Types (GFT2020); Publications Office of the European Union: Luxembourg, 2025. [Google Scholar]
  23. Arima, E.Y.; Denvir, A.; Young, K.R.; González-Rodríguez, A.; García-Oliva, F. Modelling Avocado-Driven Deforestation in Michoacán, Mexico. Environ. Res. Lett. 2022, 17, 034015. [Google Scholar] [CrossRef]
  24. FAO. Major Tropical Fruits Market Review. Preliminary Results 2024; FAO: Rome, Italy, 2024; pp. 1–31. [Google Scholar]
  25. SIAP; SADER. Escenario Mensual de Productos Agroalimentarios. Aguacate; SIAP; SADER: Mexico City, Mexico, 2024. [Google Scholar]
  26. FIRA. Panorama Agroalimentario|Aguacate 2024; FIRA: Morelia, Mexico, 2024. [Google Scholar]
  27. Latorre-Cárdenas, M.C.; González-Rodríguez, A.; Godínez-Gómez, O.; Arima, E.Y.; Young, K.R.; Denvir, A.; García-Oliva, F.; Ghilardi, A. Estimating Fragmentation and Connectivity Patterns of the Temperate Forest in an Avocado-Dominated Landscape to Propose Conservation Strategies. Land 2023, 12, 631. [Google Scholar] [CrossRef]
  28. Mas, J.F.; Lemoine-Rodríguez, R.; González, R.; López-Sánchez, J.; Piña-Garduño, A.; Herrera-Flores, E. Evaluación de Las Tasas de Deforestación En Michoacán a Escala Detallada Mediante Un Método Híbrido de Clasificación de Imágenes SPOT. Madera Bosques 2017, 23, 119–131. [Google Scholar] [CrossRef]
  29. Morales, L.M.; Cuevas, G. Inventarios 1974–2007, y Evaluación Del Impacto Ambiental Regional Del Cultivo Del Aguacate En El Estado de Michoacán; Centro de Investigaciones en Geografía Ambiental, UNAM: Morelia, Mexico, 2011; p. 139. [Google Scholar]
  30. SENASICA Estadística de La Producción de Aguacate. Available online: https://dj.senasica.gob.mx/SIAS/Statistics/Transversal/EstadisticaProduccionAguacate (accessed on 7 May 2025).
  31. Bravo-Espinosa, M.; Mendoza, M.E.; Carlón Allende, T.; Medina, L.; Sáenz-Reyes, J.T.; Páez, R. Effects of Converting Forest to Avocado Orchards on Topsoil Properties in the Trans-Mexican Volcanic System, Mexico. Land Degrad. Dev. 2014, 25, 452–467. [Google Scholar] [CrossRef]
  32. Denvir, A.; Arima, E.Y.; González-Rodríguez, A.; Young, K.R. Ecological and Human Dimensions of Avocado Expansion in México: Towards Supply-Chain Sustainability. Ambio 2022, 51, 152–166. [Google Scholar] [CrossRef]
  33. Figueroa-Figueroa, D.K.; Ramírez-Dávila, J.F.; Antonio-Némiga, X.; Huerta, A.G. Cartografía Del Aguacate En El Sur Del Estado de México Mediante Tratamiento Digital de Imágenes Sentinel-2. Rev. Mex. Cienc. Agríc. 2020, 11, 865–879. [Google Scholar] [CrossRef]
  34. Pérez-Llorente, I.; Ramírez, M.I.; Paneque-Gálvez, J.; Orozco, C.G.; González-López, R. Unraveling Complex Relations between Forest-Cover Change and Conflicts through Spatial and Relational Analyses. Ecol. Soc. 2019, 24, 3. [Google Scholar] [CrossRef]
  35. Subercaseaux-Ugarte, D.; Bocco, G.; Cumana, I.; Moreno-Calles, A.I.; Astier, M.; Navarrete, A. Cambio de Uso Del Suelo e Implicaciones de La Expansión Agroindustrial Aguacatera En El Occidente de México. Rev. Geogr. Norte Gd. 2025, 90, 1–27. [Google Scholar] [CrossRef]
  36. Baca-Patiño, B.; González-Rodríguez, A.; García-Oliva, F.; García, A.; Lara-De La Cruz, I.; Garibay-Orijel, R.; Poret-Peterson, A.; Maldonado-López, Y.; Cuevas-Reyes, P.; Gómez-Tagle, A.; et al. Land-Use Change from Native Forest to Avocado Orchards: Effects on Soil Nutrient Transformation and Microbial Communities. Appl. Soil Ecol. 2025, 205, 105748. [Google Scholar] [CrossRef]
  37. Pérez-Solache, A.; Vaca-Sánchez, M.S.; Maldonado-López, Y.; De Faria, M.L.; Borges, M.A.Z.; Fagundes, M.; Oyama, K.; Méndez-Solórzano, M.I.; Aguilar-Peralta, J.S.; Hernández-Guzmán, R.; et al. Changes in Land Use of Temperate Forests Associated to Avocado Production in Mexico: Impacts on Soil Properties, Plant Traits and Insect-Plant Interactions. Agric. Syst. 2023, 204, 103556. [Google Scholar] [CrossRef]
  38. De la Vega-Rivera, A.; Merino-Pérez, L. Socio-Environmental Impacts of the Avocado Boom in the Meseta Purépecha, Michoacán, Mexico. Sustainability 2021, 13, 7247. [Google Scholar] [CrossRef]
  39. Hansen, M.C.; Loveland, T.R. A Review of Large Area Monitoring of Land Cover Change Using Landsat Data. Remote Sens. Environ. 2012, 122, 66–74. [Google Scholar] [CrossRef]
  40. Hemati, M.; Hasanlou, M.; Mahdianpari, M.; Mohammadimanesh, F. A Systematic Review of Landsat Data for Change Detection Applications: 50 Years of Monitoring the Earth. Remote Sens. 2021, 13, 2869. [Google Scholar] [CrossRef]
  41. Wulder, M.A.; White, J.C.; Loveland, T.R.; Woodcock, C.E.; Belward, A.S.; Cohen, W.B.; Fosnight, E.A.; Shaw, J.; Masek, J.G.; Roy, D.P. The Global Landsat Archive: Status, Consolidation, and Direction. Remote Sens. Environ. 2016, 185, 271–283. [Google Scholar] [CrossRef]
  42. De Souza, A.A.; Galvão, L.S.; Korting, T.S.; Almeida, C.A. On a Data-Driven Approach for Detecting Disturbance in the Brazilian Savannas Using Time Series of Vegetation Indices. Remote Sens. 2021, 13, 4959. [Google Scholar] [CrossRef]
  43. Fu, Y.; Zhu, Z.; Liu, L.; Zhan, W.; He, T.; Shen, H.; Zhao, J.; Liu, Y.; Zhang, H.; Liu, Z.; et al. Remote Sensing Time Series Analysis: A Review of Data and Applications. J. Remote Sens. 2024, 4, 0285. [Google Scholar] [CrossRef]
  44. Hamunyela, E.; Rosca, S.; Mirt, A.; Engle, E.; Herold, M.; Gieseke, F.; Verbesselt, J. Implementation of BFASTmonitor Algorithm on Google Earth Engine to Support Large-Area and Sub-Annual Change Monitoring Using Earth Observation Data. Remote Sens. 2020, 12, 2953. [Google Scholar] [CrossRef]
  45. Kennedy, R.E.; Yang, Z.; Cohen, W.B. Detecting Trends in Forest Disturbance and Recovery Using Yearly Landsat Time Series: 1. LandTrendr—Temporal Segmentation Algorithms. Remote Sens. Environ. 2010, 114, 2897–2910. [Google Scholar] [CrossRef]
  46. Simoes, R.; Camara, G.; Queiroz, G.; Souza, F.; Andrade, P.R.; Santos, L.; Carvalho, A.; Ferreira, K. Satellite Image Time Series Analysis for Big Earth Observation Data. Remote Sens. 2021, 13, 2428. [Google Scholar] [CrossRef]
  47. Souza, C.M.; Shimbo, J.Z.; Rosa, M.R.; Parente, L.L.; Alencar, A.A.; Rudorff, B.F.T.; Hasenack, H.; Matsumoto, M.; Ferreira, L.G.; Souza-Filho, P.W.M.; et al. Reconstructing Three Decades of Land Use and Land Cover Changes in Brazilian Biomes with Landsat Archive and Earth Engine. Remote Sens. 2020, 12, 2735. [Google Scholar] [CrossRef]
  48. Verbesselt, J.; Zeileis, A.; Herold, M. Near Real-Time Disturbance Detection Using Satellite Image Time Series. Remote Sens. Environ. 2012, 123, 98–108. [Google Scholar] [CrossRef]
  49. Zhu, Z.; Woodcock, C.E. Continuous Change Detection and Classification of Land Cover Using All Available Landsat Data. Remote Sens. Environ. 2014, 144, 152–171. [Google Scholar] [CrossRef]
  50. Bullock, E.L.; Woodcock, C.E.; Holden, C.E. Improved Change Monitoring Using an Ensemble of Time Series Algorithms. Remote Sens. Environ. 2020, 238, 111165. [Google Scholar] [CrossRef]
  51. Chen, S.; Woodcock, C.E.; Bullock, E.L.; Arévalo, P.; Torchinava, P.; Peng, S.; Olofsson, P. Monitoring Temperate Forest Degradation on Google Earth Engine Using Landsat Time Series Analysis. Remote Sens. Environ. 2021, 265, 112648. [Google Scholar] [CrossRef]
  52. Demarquet, Q.; Rapinel, S.; Gore, O.; Dufour, S.; Hubert-Moy, L. Continuous Change Detection Outperforms Traditional Post-Classification Change Detection for Long-Term Monitoring of Wetlands. Int. J. Appl. Earth Obs. Geoinf. 2024, 133, 104142. [Google Scholar] [CrossRef]
  53. Jiang, N.; Li, P.; Feng, Z. Detecting Tropical Freshly-Opened Swidden Fields Using a Combined Algorithm of Continuous Change Detection and Support Vector Machine. Int. J. Appl. Earth Obs. Geoinf. 2025, 136, 104403. [Google Scholar] [CrossRef]
  54. Nguyen, T.H.; Jones, S.; Soto-Berelov, M.; Haywood, A.; Hislop, S. Landsat Time-Series for Estimating Forest Aboveground Biomass and Its Dynamics across Space and Time: A Review. Remote Sens. 2020, 12, 98. [Google Scholar] [CrossRef]
  55. Pasquarella, V.J.; Arévalo, P.; Bratley, K.H.; Bullock, E.L.; Gorelick, N.; Yang, Z.; Kennedy, R.E. Demystifying LandTrendr and CCDC Temporal Segmentation. Int. J. Appl. Earth Obs. Geoinf. 2022, 110, 102806. [Google Scholar] [CrossRef]
  56. Zhou, M.; Li, G.; Lu, D.; Xu, C.; Li, Z.; Li, D. Spatiotemporal Patterns of Annual Clear-Cutting Distribution in Tropical and Subtropical Regions of China with Time Series Landsat and CCDC. Geo-Spat. Inf. Sci. 2025; 1–18. [Google Scholar] [CrossRef]
  57. Zhou, Q.; Wang, L.; Tang, F.; Zhao, S.; Huang, N.; Zheng, K. Mapping Spatial and Temporal Distribution Information of Plantations in Guangxi from 2000 to 2020. Front. Ecol. Evol. 2023, 11, 1201161. [Google Scholar] [CrossRef]
  58. Zhu, Z.; Zhang, J.; Yang, Z.; Aljaddani, A.H.; Cohen, W.B.; Qiu, S.; Zhou, C. Continuous Monitoring of Land Disturbance Based on Landsat Time Series. Remote Sens. Environ. 2020, 238, 111116. [Google Scholar] [CrossRef]
  59. Aldwaik, S.Z.; Pontius, R.G. Intensity Analysis to Unify Measurements of Size and Stationarity of Land Changes by Interval, Category, and Transition. Landsc. Urban Plan. 2012, 106, 103–114. [Google Scholar] [CrossRef]
  60. Bilintoh, T.M.; Pontius, R.G.; Zhang, A. Methods to Compare Sites Concerning a Category’s Change during Various Time Intervals. GIScience Remote Sens. 2024, 61, 2409484. [Google Scholar] [CrossRef]
  61. Mas, J.-F.; Nogueira de Vasconcelos, R.; Franca-Rocha, W. Analysis of High Temporal Resolution Land Use/Land Cover Trajectories. Land 2019, 8, 30. [Google Scholar] [CrossRef]
  62. Pontius, R.G.; Krithivasan, R.; Sauls, L.; Yan, Y.; Zhang, Y. Methods to Summarize Change among Land Categories across Time Intervals. J. Land Use Sci. 2017, 12, 218–230. [Google Scholar] [CrossRef]
  63. Pontius, R.G.; Santacruz, A. Quantity, Exchange, and Shift Components of Difference in a Square Contingency Table. Int. J. Remote Sens. 2014, 35, 7543–7554. [Google Scholar] [CrossRef]
  64. Ramírez-Mejía, D.; Levers, C.; Mas, J.F. Spatial Patterns and Determinants of Avocado Frontier Dynamics in Mexico. Reg. Environ. Change 2022, 22, 28. [Google Scholar] [CrossRef]
  65. Solórzano, J.V.; Gallardo-Cruz, J.A.; Peralta-Carreta, C. Potencial Del Acervo de Imágenes Landsat Disponible En Google Earth Engine Para El Estudio Del Territorio Mexicano. Investig. Geográficas 2020, 101, e59821. [Google Scholar] [CrossRef]
  66. Gorelick, N.; Hancher, M.; Dixon, M.; Ilyushchenko, S.; Thau, D.; Moore, R. Google Earth Engine: Planetary-Scale Geospatial Analysis for Everyone. Remote Sens. Environ. 2017, 202, 18–27. [Google Scholar] [CrossRef]
  67. Arévalo, P.; Bullock, E.L.; Woodcock, C.E.; Olofsson, P. A Suite of Tools for Continuous Land Change Monitoring in Google Earth Engine. Front. Clim. 2020, 2, 576740. [Google Scholar] [CrossRef]
  68. Bullock, E.L.; Arévalo, P. Google Earth Engine Tools for CCDC. Available online: https://gee-ccdc-tools.readthedocs.io/en/latest/index.html (accessed on 20 May 2025).
  69. Farr, T.G.; Rosen, P.A.; Caro, E.; Crippen, R.; Duren, R.; Hensley, S.; Kobrick, M.; Paller, M.; Rodriguez, E.; Roth, L.; et al. The Shuttle Radar Topography Mission. Rev. Geophys. 2007, 45, RG2004. [Google Scholar] [CrossRef]
  70. Tadono, T.; Ishida, H.; Oda, F.; Naito, S.; Minakawa, K.; Iwamoto, H. Precise Global Dem Generation By Alos Prism. In Proceedings of the ISPRS Annals of the Photogrammetry, Remote Sensing and Spatial Information Sciences, Suzhou, China, 14 May 2014; Volume II–4, pp. 71–76. [Google Scholar]
  71. Worldpop. WorldPop Global Project Population Data: Estimated Residential Population per 100x100m Grid Square. 2020. Available online: https://developers.google.com/earth-engine/datasets/catalog/WorldPop_GP_100m_pop (accessed on 30 August 2025).
  72. Hansen, M.C.; Potapov, P.V.; Moore, R.; Hancher, M.; Turubanova, S.A.; Tyukavina, A.; Thau, D.; Stehman, S.V.; Goetz, S.J.; Loveland, T.R.; et al. High-Resolution Global Maps of 21st-Century Forest Cover Change. Science 2013, 342, 850–853. [Google Scholar] [CrossRef] [PubMed]
  73. Elvidge, C.D.; Zhizhin, M.; Ghosh, T.; Hsu, F.C.; Taneja, J. Annual time series of global VIIRS nighttime lights derived from monthly averages: 2012 to 2019. Remote Sens. 2021, 13, 922. [Google Scholar] [CrossRef]
  74. Pekel, J.-F.; Cottam, A.; Gorelick, N.; Belward, A.S. High-Resolution Mapping of Global Surface Water and Its Long-Term Changes. Nature 2016, 540, 418–422. [Google Scholar] [CrossRef]
  75. Card, D.H. Using Known Map Category Marginal Frequencies to Improve Estimates of Thematic Map Accuracy. Photogramm. Eng. Remote Sens. 1982, 48, 431–439. [Google Scholar]
  76. Pontius, R.G.; Francis, T.; Millones, M. A Call to Interpret Disagreement Components during Classification Assessment. Int. J. Geogr. Inf. Sci. 2025, 39, 1373–1390. [Google Scholar] [CrossRef]
  77. Pontius, R.G.; Millones, M. Death to Kappa: Birth of Quantity Disagreement and Allocation Disagreement for Accuracy Assessment. Int. J. Remote Sens. 2011, 32, 4407–4429. [Google Scholar] [CrossRef]
  78. Yan, J.; Wang, L.; Song, W.; Chen, Y.; Chen, X.; Deng, Z. A Time-Series Classification Approach Based on Change Detection for Rapid Land Cover Mapping. ISPRS J. Photogramm. Remote Sens. 2019, 158, 249–262. [Google Scholar] [CrossRef]
  79. Liu, J.; Hull, V.; Batistella, M.; DeFries, R.; Dietz, T.; Fu, F.; Hertel, T.W.; Izaurralde, R.C.; Lambin, E.F.; Li, S.; et al. Framing Sustainability in a Telecoupled World. Ecol. Soc. 2013, 18, 26. [Google Scholar] [CrossRef]
  80. Sun, J.; TONG, Y.; Liu, J. Telecoupled Land-Use Changes in Distant Countries. J. Integr. Agric. 2017, 16, 368–376. [Google Scholar] [CrossRef]
  81. Orozco-Ramírez, Q.; Astier, M.; Barrasa, S. Agricultural Land Use Change after NAFTA in Central West Mexico. Land 2017, 6, 66. [Google Scholar] [CrossRef]
  82. USDA Economic Research Service Fruit and Tree Nut U.S. Supply and Availability: Fresh, Canned, Juice, Dried; per Capita Availability, U.S. Population 2025. Available online: https://www.ers.usda.gov/data-products/fruit-and-tree-nuts-data/fruit-and-tree-nuts-yearbook-tables (accessed on 25 August 2025).
  83. Cho, K.; Goldstein, B.; Gounaridis, D.; Newell, J.P. Where Does Your Guacamole Come from? Detecting Deforestation Associated with the Exports of Avocados from Mexico to the United States. J. Environ. Manag. 2021, 278, 111482. [Google Scholar] [CrossRef] [PubMed]
  84. Olivares-Martinez, L.D.; Gomez-Tagle, A.; Pérez-Salicrup, D.R. Regional Drivers behind the Burning of Remanent Forests in Michoacán Avocado Belt, Central Mexico. Fire 2023, 6, 81. [Google Scholar] [CrossRef]
  85. Charre-Medellín, J.F.; Mas, J.-F.; Chang-Martínez, L.A. Potential expansion of Hass avocado cultivation under climate change scenarios threatens Mexican mountain ecosystems. Crop Pasture Sci. 2021, 72, 291–301. [Google Scholar] [CrossRef]
  86. Meyfroidt, P.; de Bremond, A.; Ryan, C.M.; Archer, E.; Aspinall, R.; Chhabra, A.; Camara, G.; Corbera, E.; DeFries, R.; Díaz, S.; et al. Ten Facts about Land Systems for Sustainability. Proc. Natl. Acad. Sci. USA 2022, 119, e2109217118. [Google Scholar] [CrossRef]
  87. Izaguirre-Toriz, V.; Aguirre-Liguori, J.A.; Latorre-Cárdenas, M.C.; Arima, E.Y.; González-Rodríguez, A. Local Adaptation of Pinus Leiophylla under Climate and Land Use Change Models in the Avocado Belt of Michoacán. Mol. Ecol. 2024, 33, e17424. [Google Scholar] [CrossRef]
  88. Xie, H.; Zhang, Y.; Zeng, X.; He, Y. Sustainable Land Use and Management Research: A Scientometric Review. Landsc. Ecol. 2020, 35, 2381–2411. [Google Scholar] [CrossRef]
  89. Ncube, M.M.; Ngulube, P. Enhancing Environmental Decision-Making: A Systematic Review of Data Analytics Applications in Monitoring and Management. Discov. Sustain. 2024, 5, 290. [Google Scholar] [CrossRef]
  90. Diniz, C.G.; Souza, A.A.D.A.; Santos, D.C.; Dias, M.C.; Luz, N.C.D.; Moraes, D.R.V.D.; Maia, J.S.A.; Gomes, A.R.; Narvaes, I.D.S.; Valeriano, D.M.; et al. DETER-B: The New Amazon Near Real-Time Deforestation Detection System. IEEE J. Sel. Top. Appl. Earth Obs. Remote Sens. 2015, 8, 3619–3628. [Google Scholar] [CrossRef]
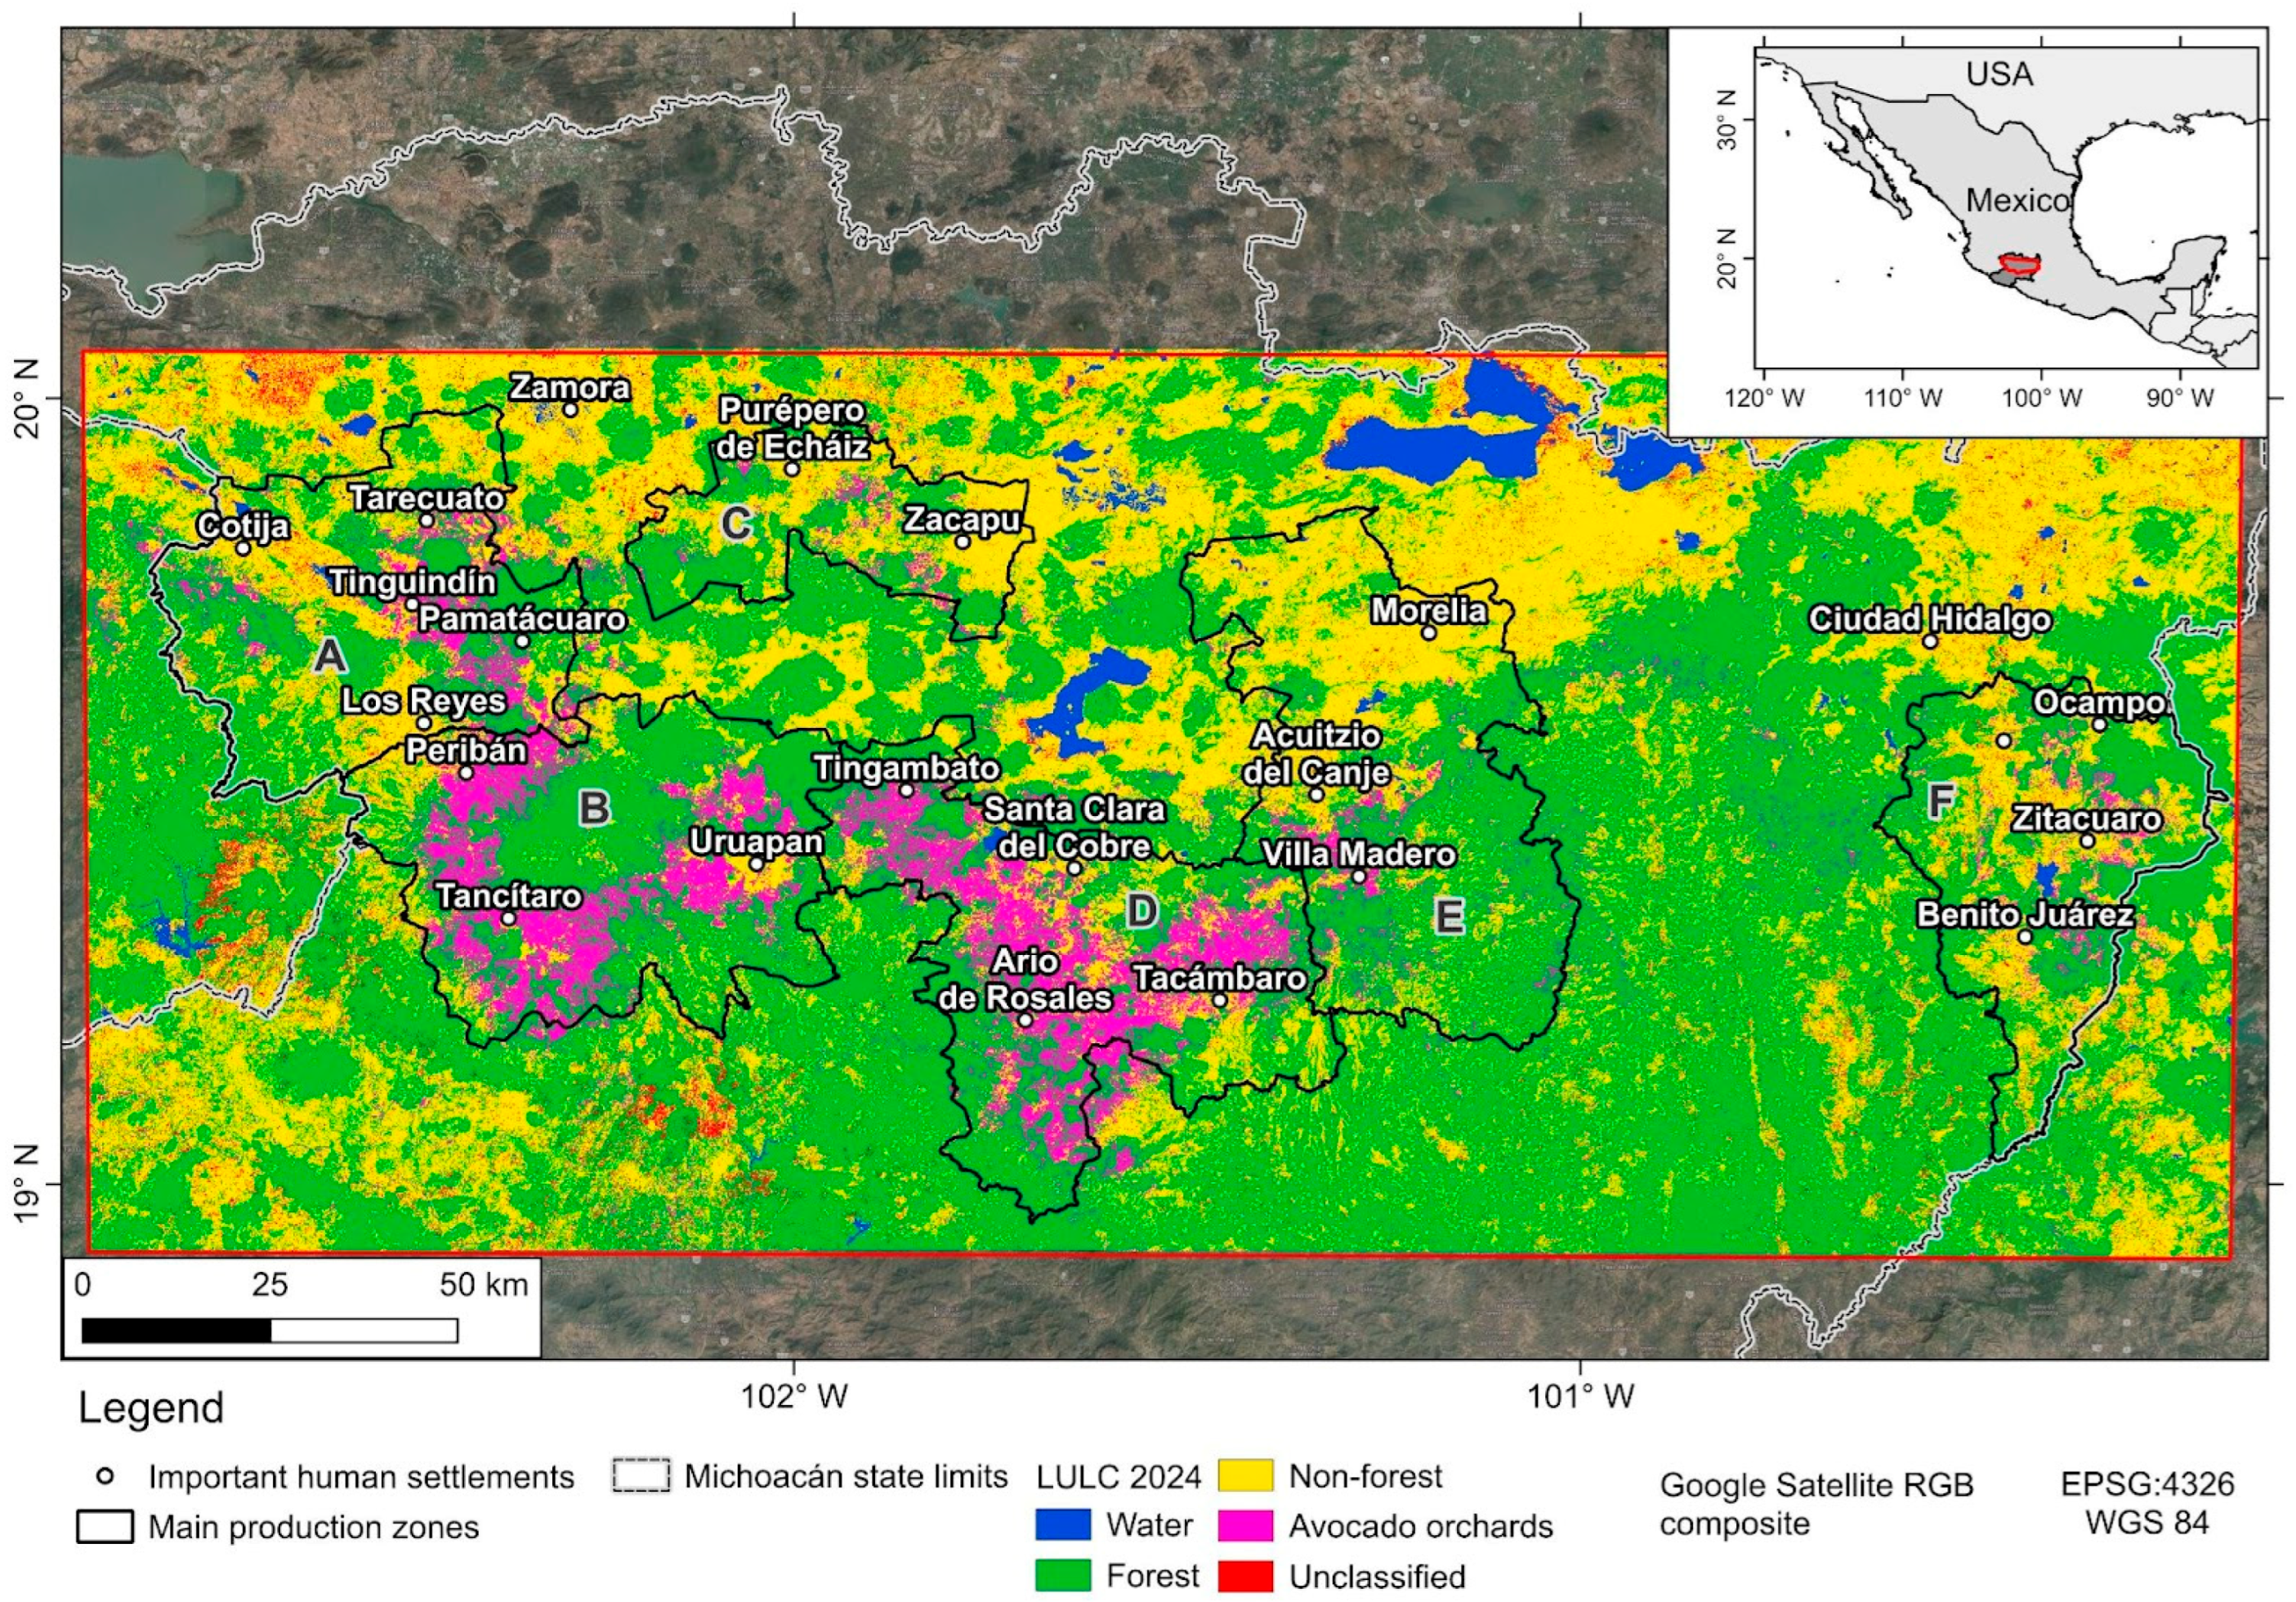
Figure 1. The “Avocado Belt” is located in the Trans-Mexican Volcanic Belt and the Balsas River Basin. In addition, the 2024 LULC map is shown along with the main avocado production zones (indicated by A–F uppercase letters). The red rectangle indicates the extent of the study area.
Land 14 01792 g001
Figure 2. Diagram representing the complete analysis workflow.
Land 14 01792 g002
Figure 3. Avocado orchard area growth from 1993 to 2024.
Land 14 01792 g003
Figure 4. (a) The number of years an area showed avocado orchard presence in the 1993–2024 period. (b) The number of times an area showed a change in the avocado orchard class. Areas that show a one-time presence correspond to orchards that were already established by 1993 or that were converted to avocado orchards once and remained as such. The main avocado production zones are indicated by A–F uppercase letters.
Land 14 01792 g004
Figure 5. Annual average components of change of the avocado expansion from 1993 to 2024.
Land 14 01792 g005
Figure 6. (a) Map of the eight classes of permanence/change. (b) Temporal trajectories of avocado orchards from 1993 to 2024. Additionally, the net gross gain and loss rates are shown in dotted lines. The main avocado production zones are indicated by A–F uppercase letters.
Land 14 01792 g006
Figure 7. Histogram of avocado orchards’ presence duration in pixels with a trajectory showing alternation (i.e., loss with alternation; gain with alternation; all alternation, gain first; and all alternation, loss first). Frequency reflects the number of times the state of the avocado orchard appeared in the complete set of pixels with an alternating trajectory. Thus, frequency accounts for a higher number than pixels with an alternating trajectory (i.e., since a single pixel could contribute to up to seven times where the avocado orchard state appeared).
Land 14 01792 g007
Table 1. CCDC parameters.
StepParameterValue
Temporal segmentationMin observations6
Chi-square probability0.99
Lambda0.002
Max iterations10,000
Min years for new fitting1.33
ClassificationNumber of harmonics (sin and cos terms)3
Random forest trees150
Disclaimer/Publisher’s Note: The statements, opinions and data contained in all publications are solely those of the individual author(s) and contributor(s) and not of MDPI and/or the editor(s). MDPI and/or the editor(s) disclaim responsibility for any injury to people or property resulting from any ideas, methods, instructions or products referred to in the content.