Article

Multi-Scenario Simulation of Land Use/Land Cover Change in a Mountainous and Eco-Fragile Urban Agglomeration: Patterns and Implications

1
School of Design, Southwest Jiaotong University, Chengdu 611756, China
2
School of Architecture, Southwest Jiaotong University, Chengdu 611756, China
*
Authors to whom correspondence should be addressed.
Land 2025, 14(9), 1787; https://doi.org/10.3390/land14091787
Submission received: 12 August 2025 / Revised: 28 August 2025 / Accepted: 29 August 2025 / Published: 2 September 2025

Abstract

Rapid urbanization within ecologically fragile mountainous regions exacerbates tensions between development needs and land use sustainability, yet few studies have systematically quantified long-term land use/land cover (LULC) dynamics in large-scale mountainous urban agglomerations. Focusing on the Chengdu–Chongqing Urban Agglomeration (CCUA) in Southwest China—an archetypal mountainous megaregion undergoing accelerated development—this study analyzed LULC evolution from 1985 to 2019 using multi-period data, identified dominant driving factors through logistic regression, and projected future LULC patterns under various scenarios via the Future Land Use Simulation (FLUS) model. The outcomes indicate that (1) over the past decades, construction land expanded by over 4000 km2, an increase of about 318%, while cultivated land decreased by nearly 8600 km2, a reduction of 6.86%; (2) the dominant transformation type was the conversion of cultivated land to forest, followed by its conversion to construction land; (3) elevation, slope, and average annual temperature emerged as significant predictors of LULC change, highlighting the critical influence of topographical and climatic conditions; and (4) natural development scenarios (NDS) and ecology and cultivated protection scenarios (ECPS) represent suitable development pathways. These findings contribute to evidence-based spatial governance and provide policy guidance for ecological protection in the CCUA and other similarly vulnerable areas.

1. Introduction

Over the past decades, China has undergone rapid urbanization, leading to the rise of numerous mega-cities [1,2,3,4,5,6]. Following this trajectory, urban agglomerations (UAs) emerged as a distinctive model for urban growth [7,8,9,10]. Defined as clusters of cities with varying sizes and functions, UAs are characterized by concentrated populations and accelerated economic growth [11,12]. Chinese UAs play a pivotal role in socioeconomic development and have the potential to become world-class UAs. As of 2022, there were 19 officially designated UAs, forming a macro-scale urban development framework in China. The establishment of these UAs is intended to create growth poles that drive regional development, reflecting their role as a typical outcome of urbanization reaching an advanced stage [8,13].
Land use/land cover (LULC) is a critical foundation for urban socioeconomic development, as land types reflect the ways in which human exploitation and transform the land use [14], which is also a crucial driver of habitat change [15,16]. LULC research has received much attention since the beginning of the century [14,17,18,19,20]. Currently, most studies focus on land use and concentrate on topics such as land use efficiency, ecosystem services, and sustainability [21,22,23,24,25]. Scholars seem to believe that land use efficiency is more important for promoting economic development than land use type and structure [26,27]. However, prior research has found that different urban development patterns will result in various degrees and scales of change in LULC types and structures over time, which has important implications for sustainable urban development [18,28,29,30]. History has shown that the traditional rough-and-ready development approach can induce many severe ecological problems (e.g., urban heat islands, geological disasters, and soil erosion) while promoting economic development [31]. Therefore, LULC modeling and forecasting are essential for helping planners and policymakers in making informed decisions [32,33]. Accurate monitoring and prediction of LULC can aid in addressing ecological and environmental challenges [34,35]. However, most existing literature on LULC has mainly focused on specific cities and less on UAs [9,36], especially in the regions with intricate terrain and vulnerable ecosystems. Mountainous UAs are generally ecologically fragile areas, where human activities tend to exert more pronounced disturbances on natural ecosystems [37]. Consequently, the intensified conflicts between protecting the environment and promoting economic development are becoming more and more apparent in these areas [38,39].
The Chengdu–Chongqing urban agglomeration (CCUA), one of China’s four major UAs (Beijing–Tianjin–Hebei urban agglomeration, BTHUA; Yangtze River Delta urban agglomeration, YRDUA; Pearl River Delta urban agglomeration, PRDUA; and CCUA) [7,40], holds strategic importance in China’s present-day economic planning. Since the beginning of the 21st century, the region’s socioeconomic development has been significantly accelerated with urban-rural integration and the western development strategy. Recent studies have documented pronounced urban sprawl in Chengdu and Chongqing over recent decades [7,10,41]. During 2000–2015, the built-up areas of Chongqing and Chengdu increased by 151.5% and 84%, respectively, relative to their initial extents [10]. In the context of such rapid urban expansion, the type and structure of LULC have undoubtedly changed dramatically. The complex mountainous terrain, fragile ecology, and scarce land resources are determinants that should be considered for sustainable development. Unfortunately, some typical big-city diseases have emerged, including urban heat island (UHI), urban congestion, and geological disasters [7,38]. In the face of such a situation, it is necessary to reflect on whether such a development model is sustainable and whether the pursuit of economic growth has led to excessive urban sprawl.
To address the issue, this study takes CCUA as a case and explores its future rational utilization pathway by examining the features of LULC transformations constrained by multiple complex factors (e.g., mountainous terrain, integrated development, and ecology protection). The findings aim to provide empirical insights for similar UAs with mountainous characteristics. The spatiotemporal dynamics of LULC from 1985 to 2019 in the CCUA were first examined through a transition matrix analysis. Subsequently, logistic regression was applied to examine the driving factors of LULC in four dimensions: natural, social, economic, and ecological. Then, the FLUS–Markov model was employed to project the LULC patterns in 2025 and 2035 under three scenarios combining the above drivers, respectively. Finally, relevant recommendations are proposed. The study’s main objectives are (1) to reveal the spatiotemporal evolution of LULC in the CCUA over the past decades; (2) to predict the patterns of future LULC under different scenarios; and (3) to propose relevant recommendations.

2. Materials and Methods

2.1. Study Area

Encompassing the upper reaches of the Yangtze River in southwest China, the CCUA region spans 27°39′–33°02′ N and 101°05′–110°12′ E (Figure 1), covering approximately 184,000 km2. Elevations range from 87 to 5363 m, with a mean altitude of 666 m. The landform type is complex, surrounded by hills and mountains, with plains and shallow hilly areas in the center [42]. The complex topography significantly constrains socioeconomic development [10] by limiting construction land expansion, increasing infrastructure and transportation costs, and heightening exposure to geological disasters. The CCUA experiences a subtropical humid monsoon climate [40], with a mean annual temperature of 17 °C and mean annual precipitation around 1109 mm [10]. As of 2019, the region was home to about 96 million inhabitants, with a regional GDP nearing 6.3 trillion Chinese yuan (CNY), corresponding to 6.9% and 6.3% of the respective national aggregates (www.stats.gov.cn (accessed on 12 July 2025)).
The CCUA has an important strategic economic position [12,38]. Back in 2016, the Chinese government formally approved the Chengdu–Chongqing Urban Agglomeration Development Plan (https://www.sc.gov.cn/ (accessed on 12 July 2025)), highlighting the CCUA as a key platform for the Western Development Strategy (WDS, Xibu Da Kaifa) and a strategic hub within the Yangtze River Economic Belt Strategy (YREBS, Changjiang Jingji Dai zhanlue). Since 2000, the region has experienced rapid socioeconomic growth driven by the WDS. In 2020, the Chinese government promulgated the Outline of the Construction Plan of the Chengdu–Chongqing Economic Circle (CCEC), again raising the importance of CCUA’s strategic position and emphasizing the transformation of the development mode and aiming for high-quality development. Nonetheless, rapid urban expansion in recent years has intensified the competition between construction and cultivated land, posing significant challenges to LULC optimization.

2.2. Datasets

This study used multi-source datasets covering land use/land cover, topography, climate, and socioeconomic variables. All rasters were aligned to a 1 km × 1 km grid under Krasovsky 1940 Albers; LULC maps at 30 m were resampled to 1 km for model integration. Table 1 summarizes data sources, years, resolutions, and usage.

2.3. Methods

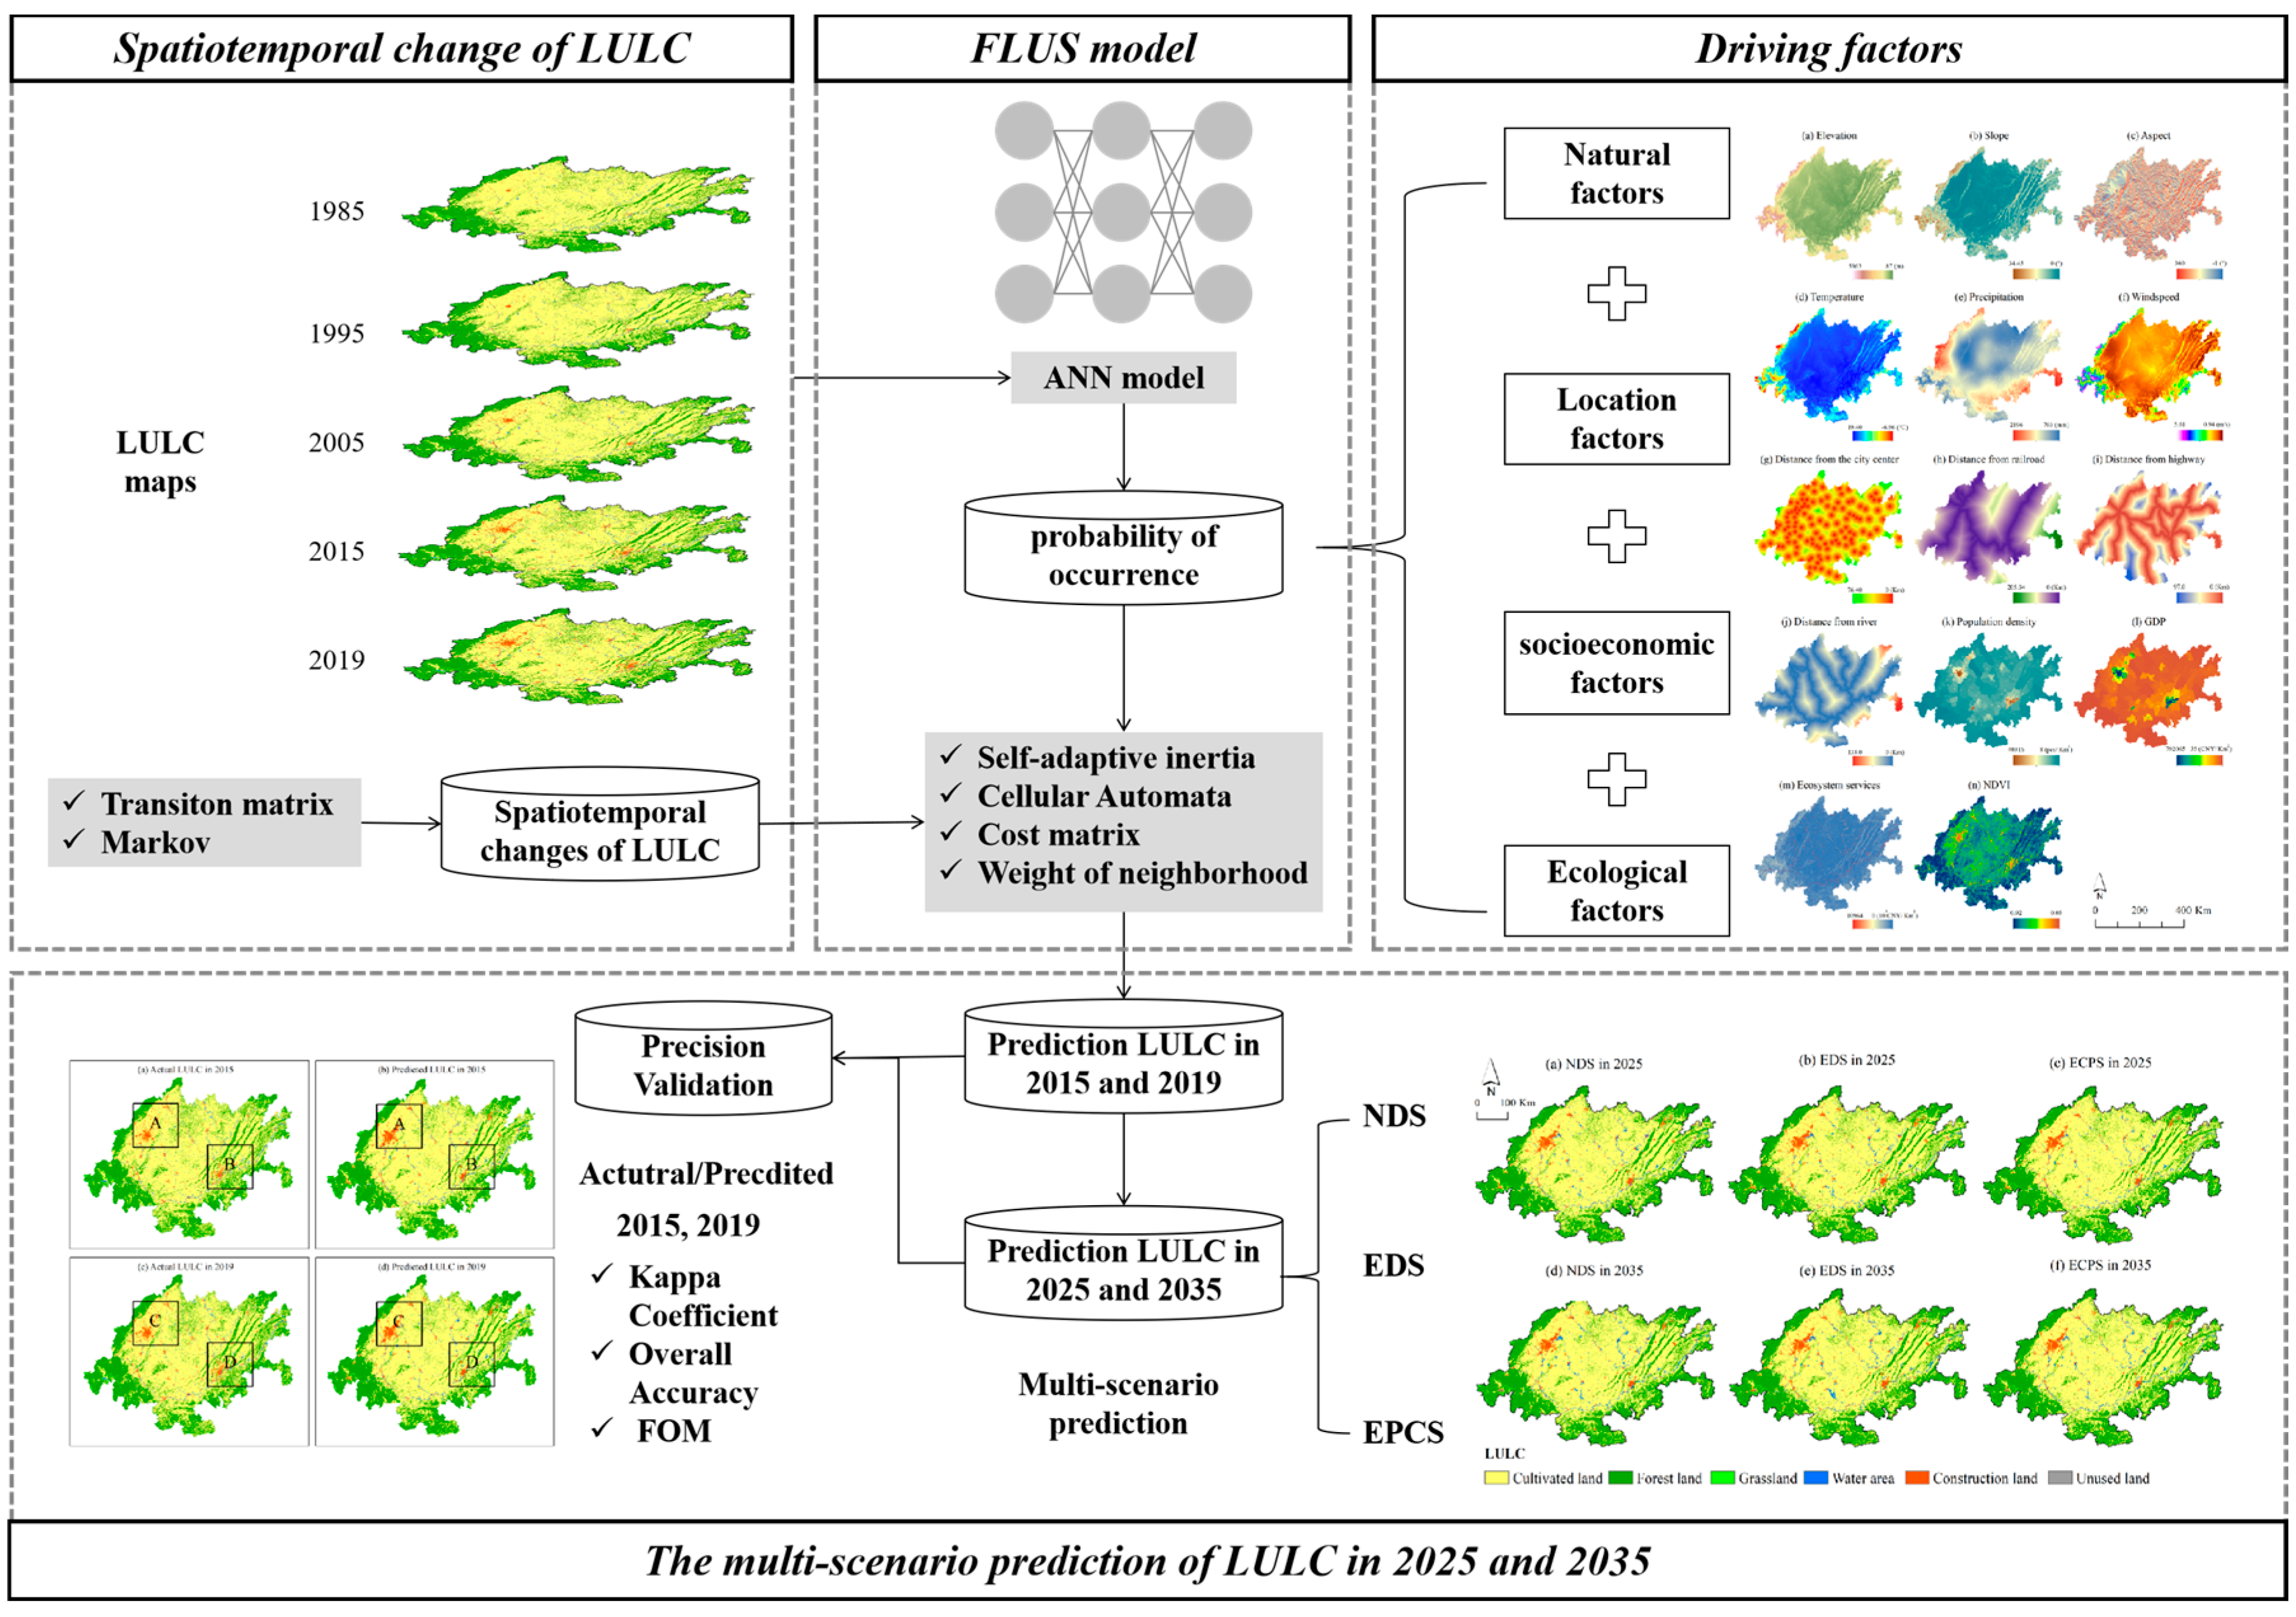
This study examined LULC change in the CCUA through three stages. Firstly, the LULC change from 1985 to 2019 was analyzed using the transfer matrix method. Secondly, the relationship between the driving factors of LULC was explored using logistic regression. Thirdly, informed by previous research [44,45,46,47], the FLUS model was applied to predict the LULC for the years 2025 and 2035 under three scenarios: natural development scenarios (NDS), economic development scenarios (EDS), and ecology and cultivated protection scenarios (ECPS). The period of 1985–2019 was chosen to ensure temporal consistency across LULC data and all selected drivers. This period also enables the identification of long-term and stage-specific change patterns without interference from the anomalous period after 2020. The Markov chain model posits that the likelihood of a land use type converting to another is determined solely by its present state and a transition probability matrix, which is estimated from historical LULC change observations [45,46]. The model was combined with the FLUS framework to simulate spatial allocation [48]. Inputs included CLCD maps, socioeconomic variables (GDP, population density), and natural factors (elevation, slope, climate). Model validation was performed by simulating LULC for 2015 and 2019 and comparing results with actual maps using the Kappa coefficient. The workflow is depicted in Figure 2.

2.3.1. LULC Change Detection

LULC changes are analyzed using the Markov model, a commonly applied approach for representing land use transitions through a transition probability matrix [23,28]. The prediction of LULC can be computed by Equation (1). The projections of the probability of occurrence of LULC can be calculated by Equation (2).
P i j = P 11 P 1 n P n 1 P n n
S t + 1 = P i j S t
where P i j denotes the probability of transformation from land type i in the beginning phase to land type j in the end phase during the study period, 0 P i j < 1 and i ,   j   = 1 , 2 , 3 , ,   n . Here, n denotes the total number of LULC types. S t + 1 is the LULC at time t + 1 , and S t is the LULC at time t .

2.3.2. Driving Variables Selection and Logistic Regression Specification

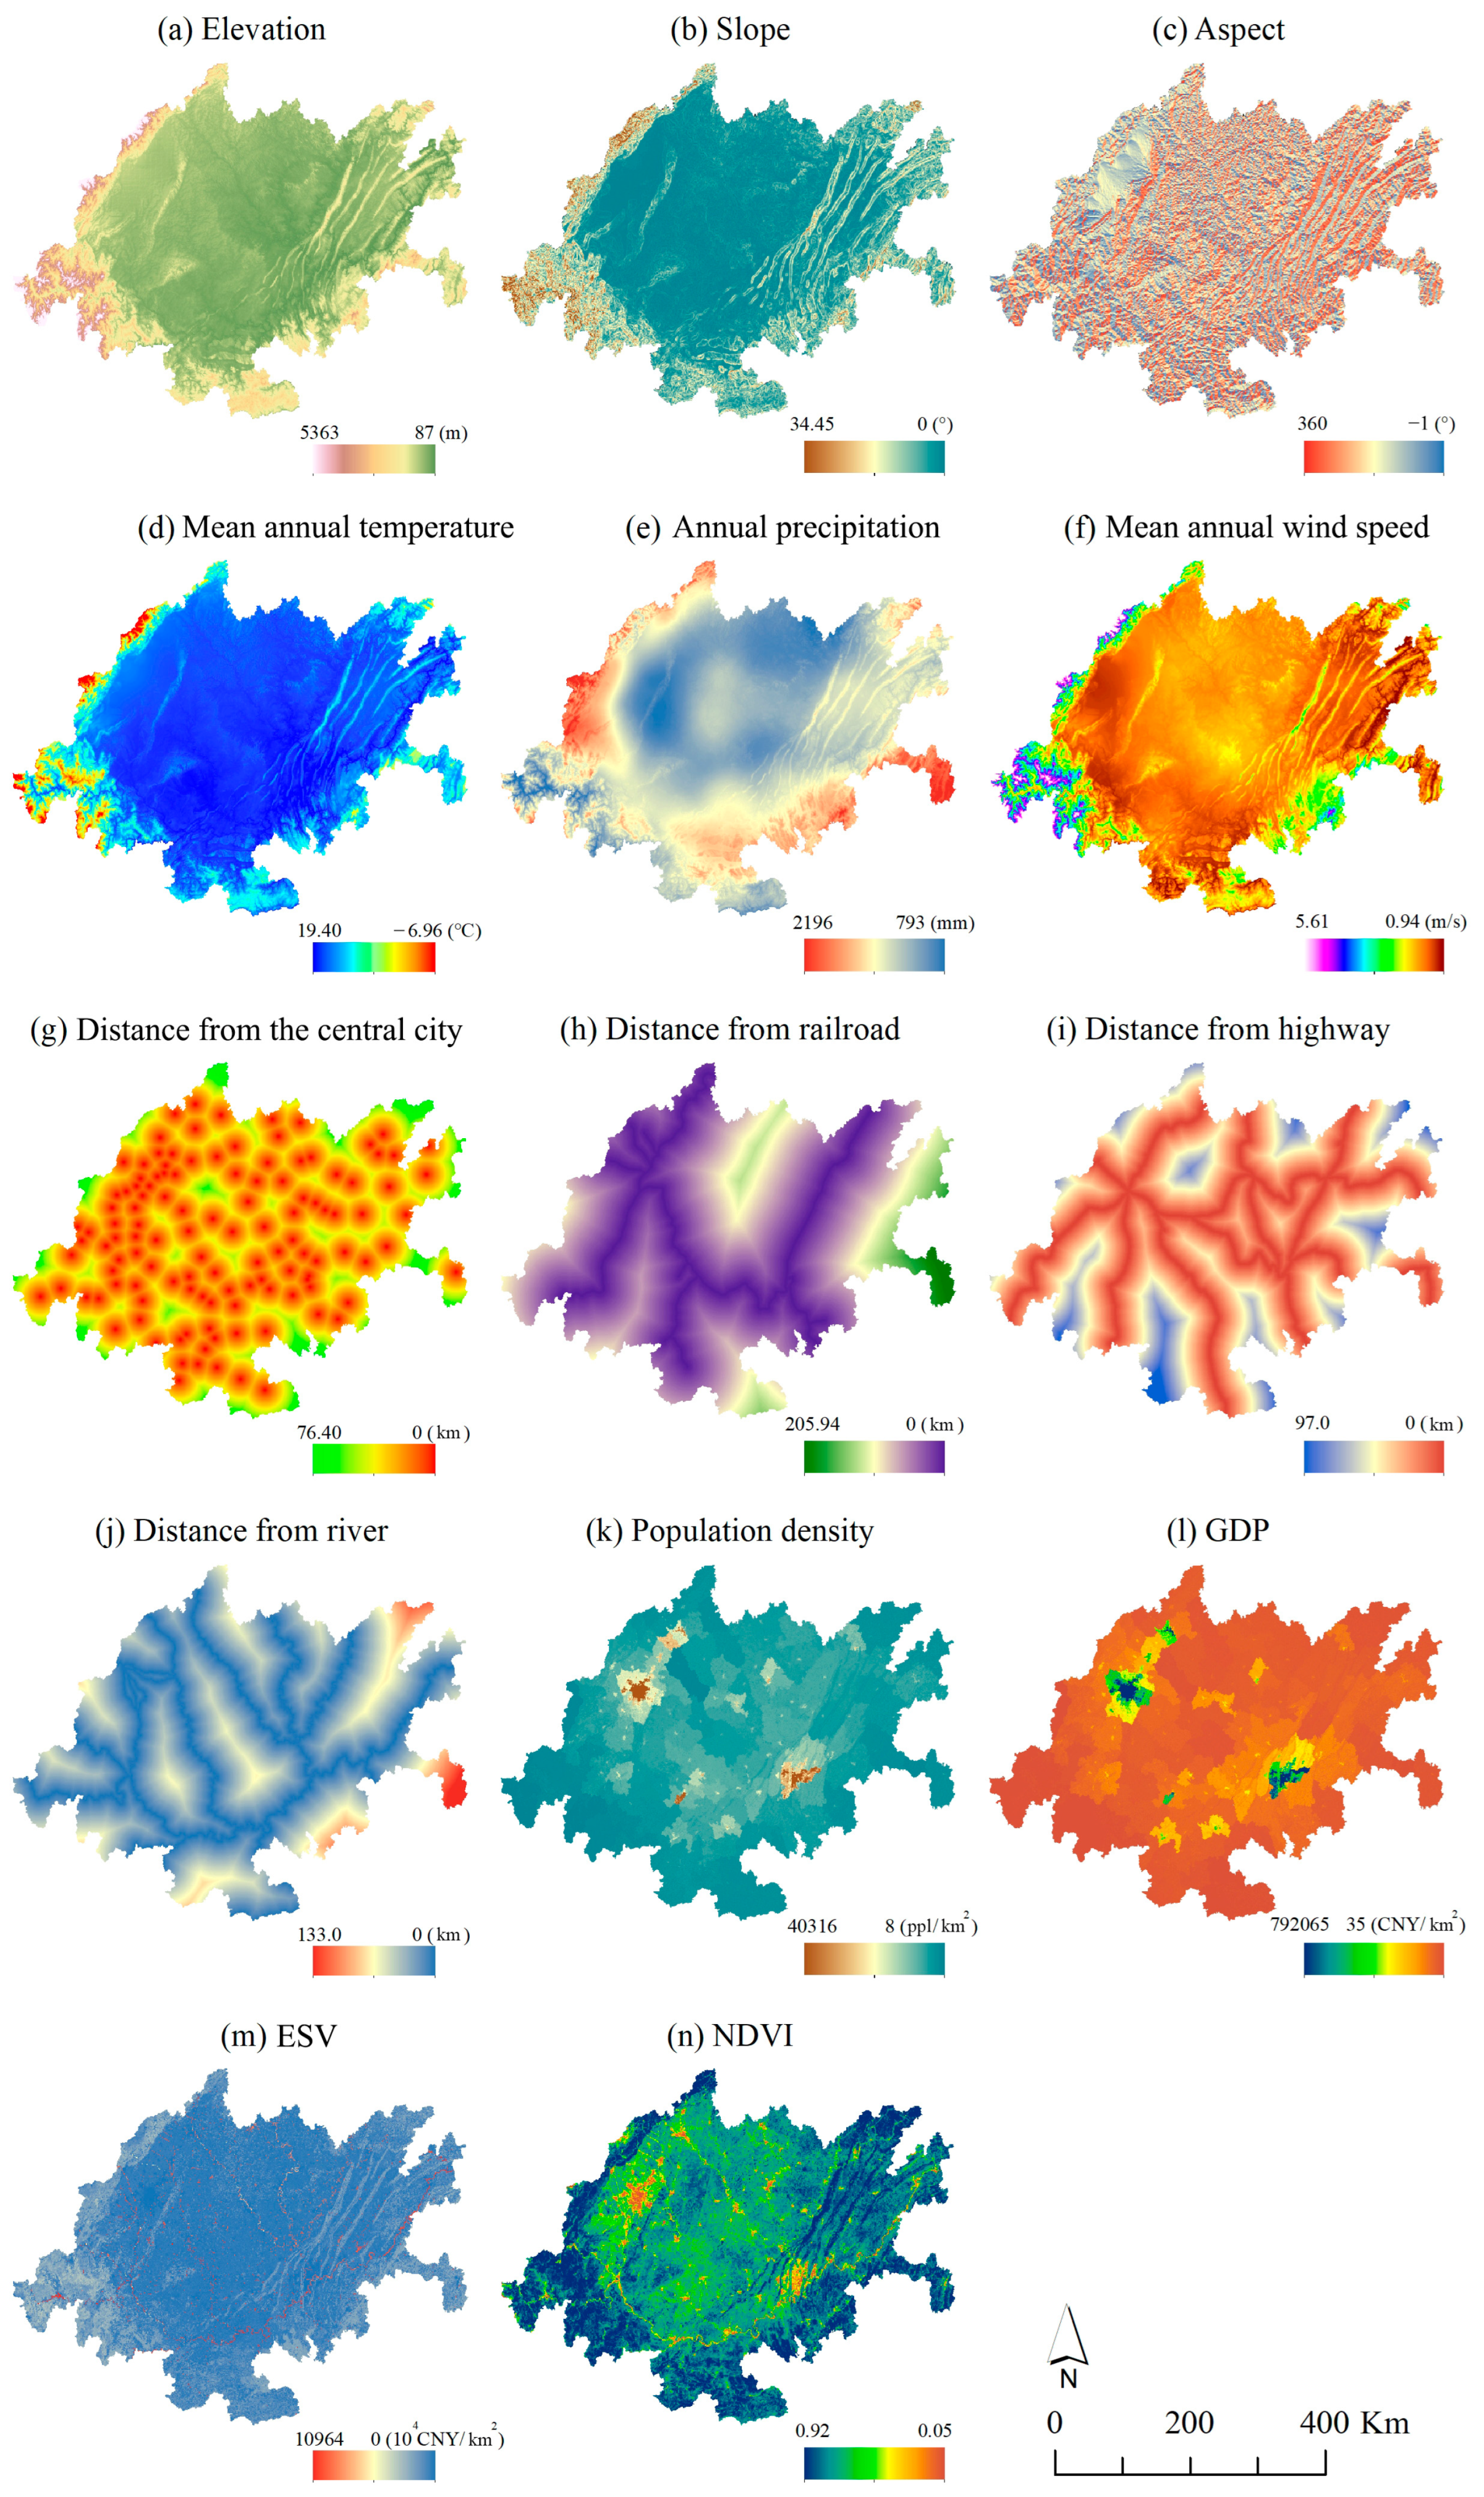
Following prior studies [14,48,49], 14 independent variables were selected to predict LULC and were divided into 4 dimensions: natural, socioeconomic, locational, and ecological. Table 2 and Figure 3 listed an enumeration of driving factors and their sources.
Natural factors. The natural environment, including various factors such as topography and climate, is the basis of land use. Topographic relief influences LULC type and distribution. On the other hand, climate affects vegetation cover and human behavioral activities. Therefore, elevation, slope, aspect, annual precipitation, mean annual wind speed, and mean annual temperature were selected as the representatives of the natural environment influencing factors, where the annual precipitation, mean annual wind speed, and annual temperature were spatially interpolated from the daily meteorological station observations.
Socioeconomic factors. Rapid population growth and frequent socioeconomic activities are critical driving factors leading to changes in LULC. Therefore, population density and GDP were adopted as key indicators of anthropogenic perturbations [20,50].
Locational factors. These describe the spatial configuration of infrastructure within a region. For example, road network density demonstrates the level of regional road supply, and construction sites are often characterized by their proximity to roads. Therefore, distance from the central city, distance from railroads, distance from highways, and distance from rivers were used as proxies for locational factors. All the above distances were calculated in ArcMap (Version 10.5) by Euclidean distance [23,51].
Ecological factors. The influence of ecological protection on LULC dynamics, often overlooked in related studies, was explicitly considered in this analysis. As the study area lies within the upper reaches of the Yangtze River, a critical ecological protection zone, ecological safeguards exert substantial influence on LULC. Therefore, ecosystem service value (ESV) and Normalized Difference Vegetation Index (NDVI) were chosen as ecological indicators [52].
The distribution and change of LULC types are the result of multiple factors. To better understand these factors, the logistic regression model was used to analyze the driving force of land use change [41,53,54,55]. The equation is as follows:
l o g ( P i 1 P i ) = β 0 + β 1 X 1 + β 2 X 2 + β 3 X 3 + + β n X n
where P i is the probability of the possible occurrence of land use type i in each region; X 1 ,   X 2 ,   X 3 ,   X 4 ,   ,   X n are the drivers, β 1 ,   β 2 ,   β 3 ,   β 4 ,   ,   β n are the regression coefficients between land use type i and each driver; and β 0 is a constant.
Before logistic regression analysis, the normalization of each variable and the Variance Inflation Factor (VIF) test are necessary operations [56,57]. As a result, only the VIF value of the variable population density was greater than 10, and all other indicators passed the covariance test. Therefore, the population density factor was excluded from the logistic regression analysis. The statistical significance of each driving factor was assessed using the Wald z-test, with p < 0.05 as the threshold. In addition, the discriminative ability of the logistic regression model was evaluated using the Receiver Operating Characteristic (ROC) curve and the area under the curve (AUC) [56,58], where values between 0.5 and 1.0 indicate predictive ability, with higher values suggesting stronger model performance.
Table 3 displays the results of the binary logistic regression analysis for each driving factor. With the exception of unused land, each driving factor significantly affected the probability of LULC occurrence, in which the regression coefficients of the probability of occurrence of cultivated land, forest land, and construction land with each driving factor passed the significance test (p < 0.05). The probability of cultivated land occurrence was subject to several key factors, namely, mean annual temperature, elevation, slope, annual precipitation, and GDP, and it was positively correlated with temperature and negatively correlated with elevation, slope, annual precipitation, and GDP. The probability of occurrence of forest land was influenced by mean annual temperature, NDVI, slope, and elevation, which were positively correlated with NDVI and slope. Grassland probability was associated with mean annual wind speed, mean annual temperature, and annual precipitation, exhibiting a positive correlation with mean annual wind speed. The occurrence probability of water area was strongly linked to elevation, mean annual temperature, and slope, among which it was negatively associated with elevation and positively related to mean annual temperature and slope. The occurrence probability of construction land was mainly influenced by mean annual temperature, elevation, NDVI, and distance from the central city, among which it was positively correlated with elevation and mean annual temperature. However, it was negatively correlated with distance from the central city and NDVI. The occurrence probability of unused land showed an insignificant pattern and was only influenced by mean annual temperature and GDP. In summary, the effects of different drivers on the chance of each LULC type occurring showed significant variability. Overall, natural factors were more influential, among which the impacts of mean annual temperature on the likelihood of all LULC type occurrence were significant.
Table 2. Factors driving LULC change.
CategoriesDriving FactorsUnitsReferences
Natural factorsElevationm[14,21,51,54,59]
Slope°
Aspect°
Annual precipitationmm[49]
Mean annual wind speedm/s[51]
Mean annual temperature°C[25,49]
Locational factorsDistance from the central citykm[21,54]
Distance from railroadkm[14,21,54,59]
Distance from riverkm[10,20,51,54]
Distance from highwaykm[14,21,51,59]
Socioeconomic factorsPopulation densityppl/km2[19,20,25,49]
GDP104 CNY/km2[19,20,49]
Ecological factorsNDVI[14]
ESV104 CNY/km2[49]

2.3.3. LULC Multi-Scenario Projection Using the FLUS–Markov Model

Future LULC simulations are performed by coupling the Markov chain model with the FLUS framework [48,60]. In this approach, the Markov model estimates the quantity of each LULC type from historical transition probabilities, while the FLUS model allocates these quantities spatially based on suitability analysis and cellular automata.
Model principles: The Markov chain assumes that the probability of a land use type converting to another depends solely on its current state. The Markov component estimates land use demands from historical transition probabilities derived from two observed intervals: 2005–2015 and 2015–2019. These probabilities are annualized and then extrapolated to the target years. The FLUS model incorporates an Artificial Neural Network (ANN) [23] to estimate suitability probabilities for each LULC class, integrating these with neighborhood effects, conversion rules, and a roulette selection mechanism for spatial allocation.
Input data and parameters: The dataset comprised CLCD maps (30 m resolution), socioeconomic drivers (GDP, population density), and natural factors (elevation, slope, climate variables). For ANN training, 20% of the pixels from the base year map (2005) were randomly selected as training samples, with a hidden layer size of 12, to obtain the probability distribution of each LULC type (Appendix A Figure A1). The cellular automata were run for 300 iterations, ecological reserves were defined as restricted zones, and the transfer cost matrix and driver parameters were calibrated through iterative testing and reference to previous studies (Appendix A Table A1 and Table A2).
Scenario settings: Three simulation scenarios were developed for the CCUA. The NDS assumed that land use demand for 2025 and 2035 was obtained by extrapolating the annualized transition probabilities observed during 2005–2015 and 2015–2019, which were kept constant throughout the projection period. The EDS builds on the same historical transition information but emphasizes the continuation of construction land expansion, extrapolating this trend into 2025 and 2035 to reflect sustained urban growth under development-oriented policies. The ECPS, also based on the historical transition probabilities, imposes restrictions on the conversion of cropland and forest land to safeguard ecological security in the projections for 2025 and 2035.
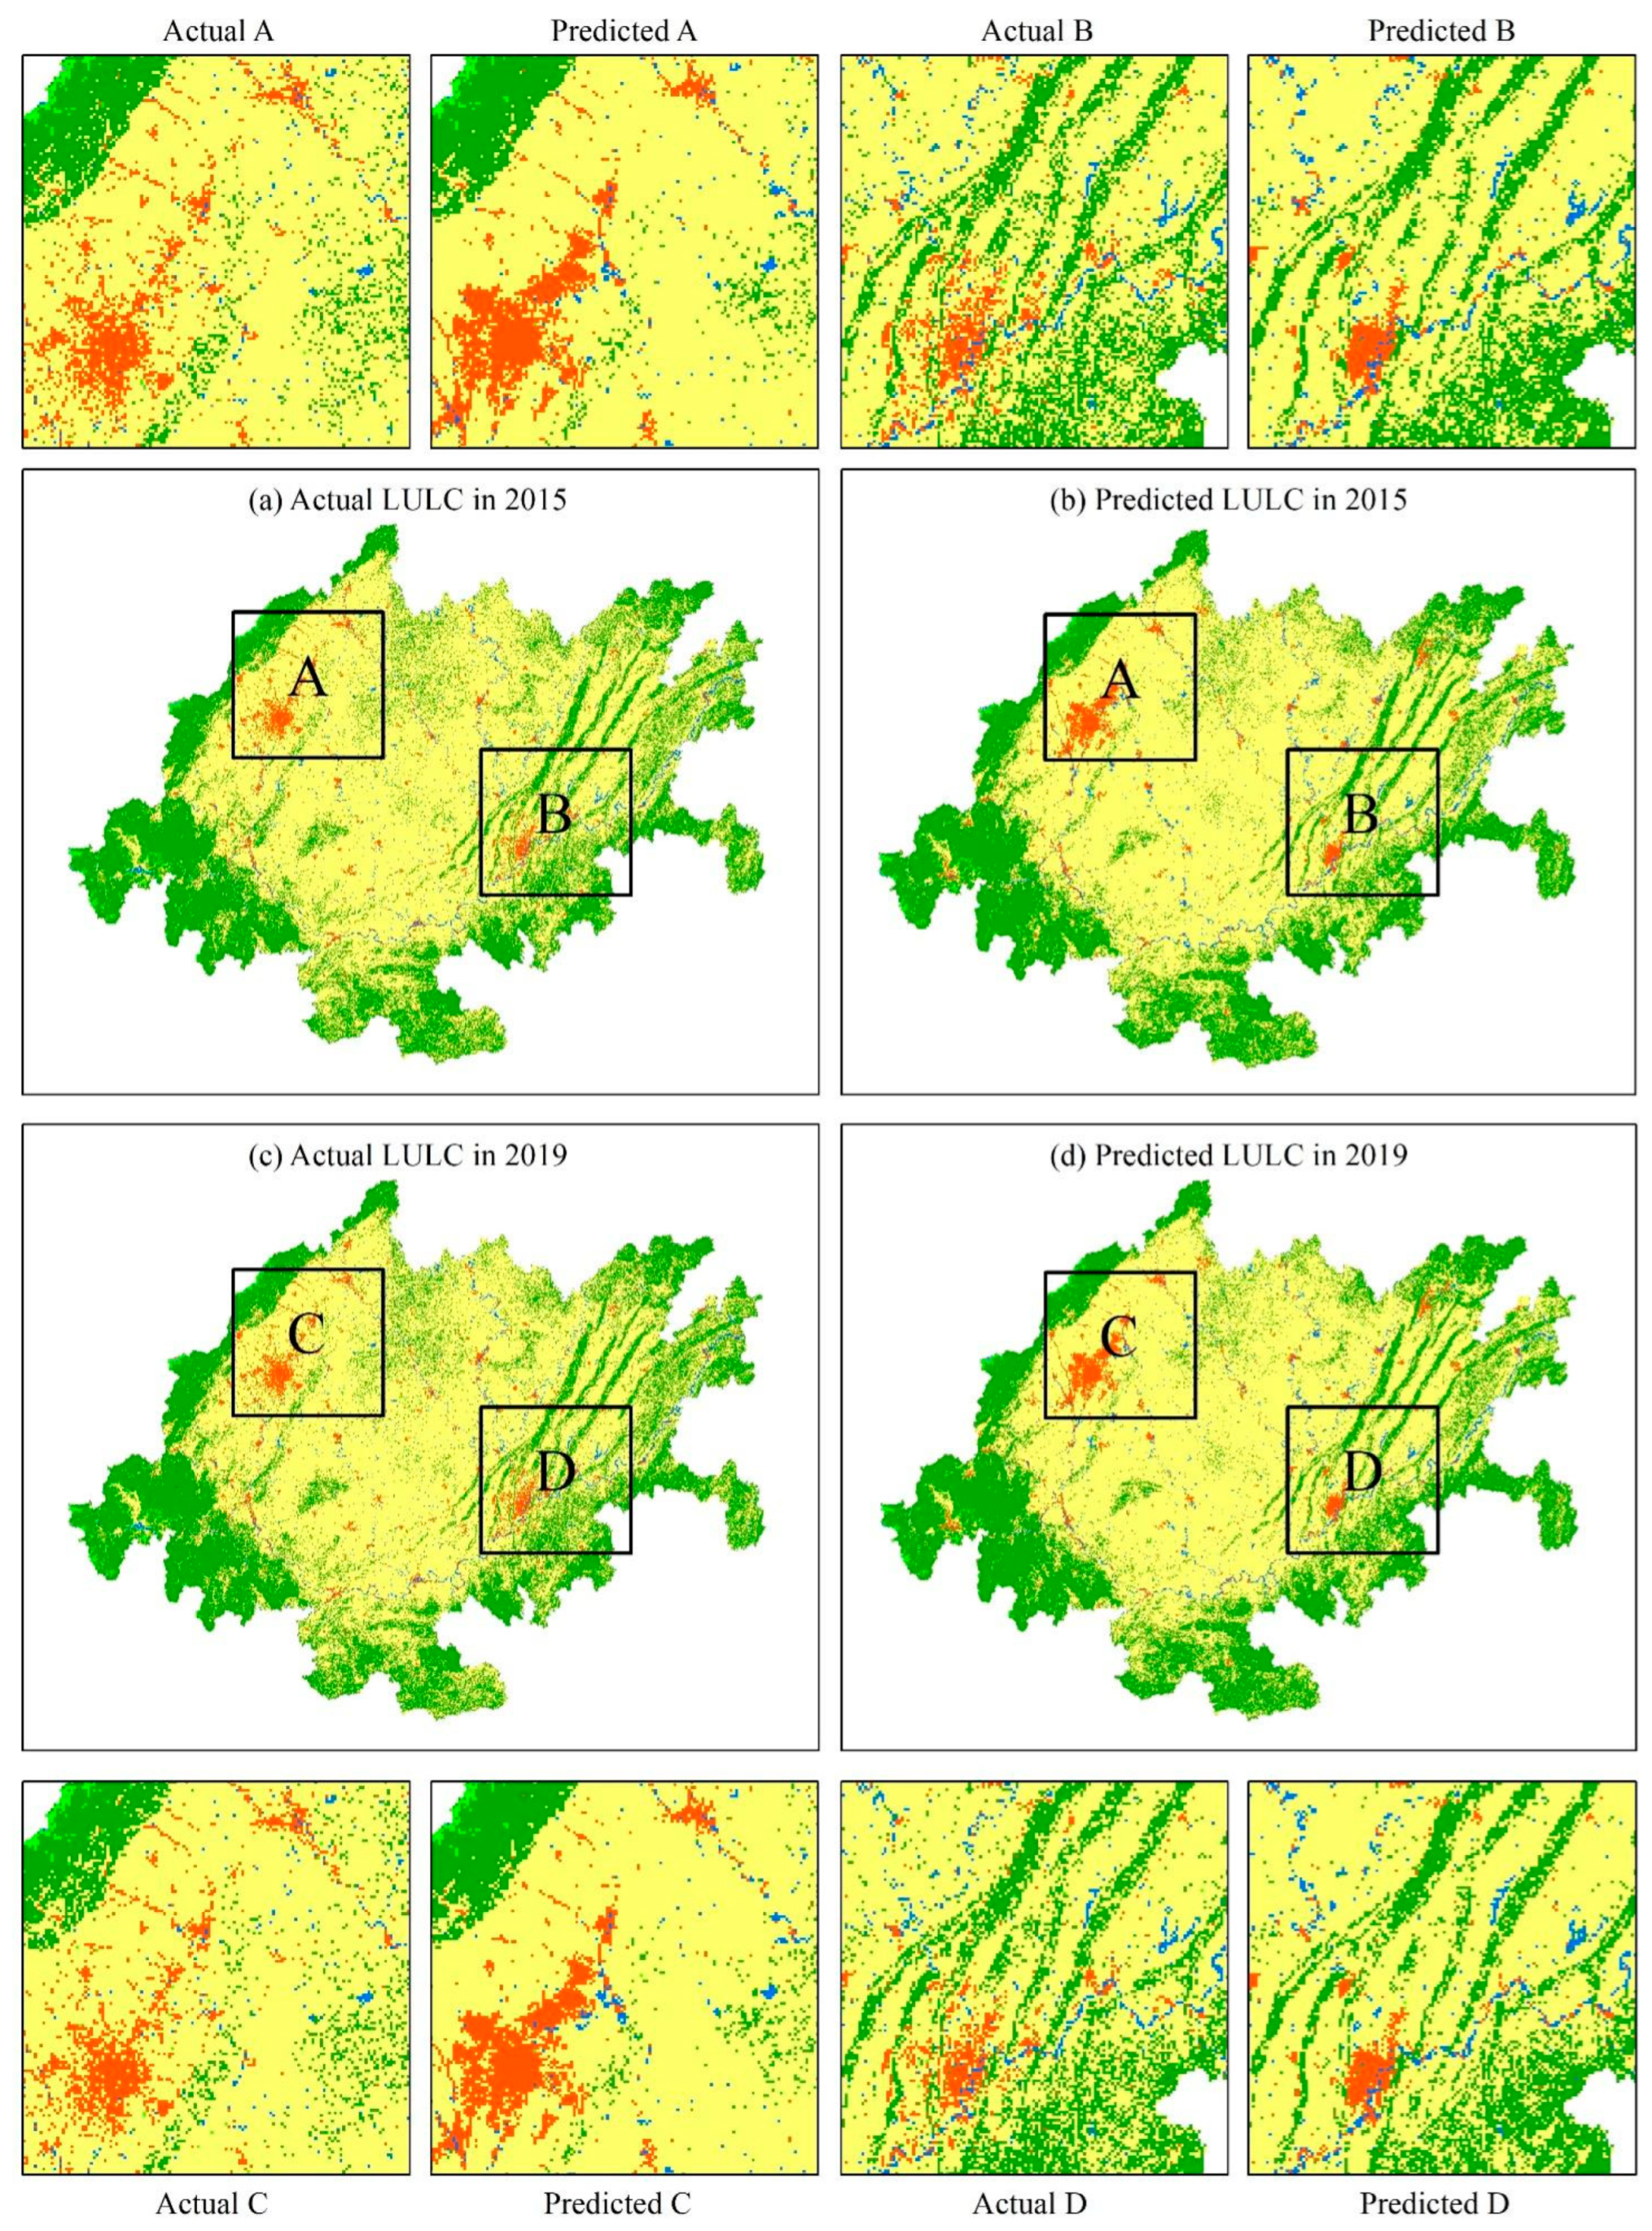
Model validation: The model simulated LULC for 2015 and 2019 to validate performance, comparing predictions with actual maps (Appendix A Figure A2) using the Kappa coefficient, Overall Accuracy, and Figure of Merit (FOM) [48,61,62,63]. The Kappa values (0.75 and 0.72) and Overall Accuracies (87.79% and 86.27%) indicate reliable predictive performance, supporting its application for 2025 and 2035 projections.

3. Results

3.1. Spatiotemporal Changes in LULC

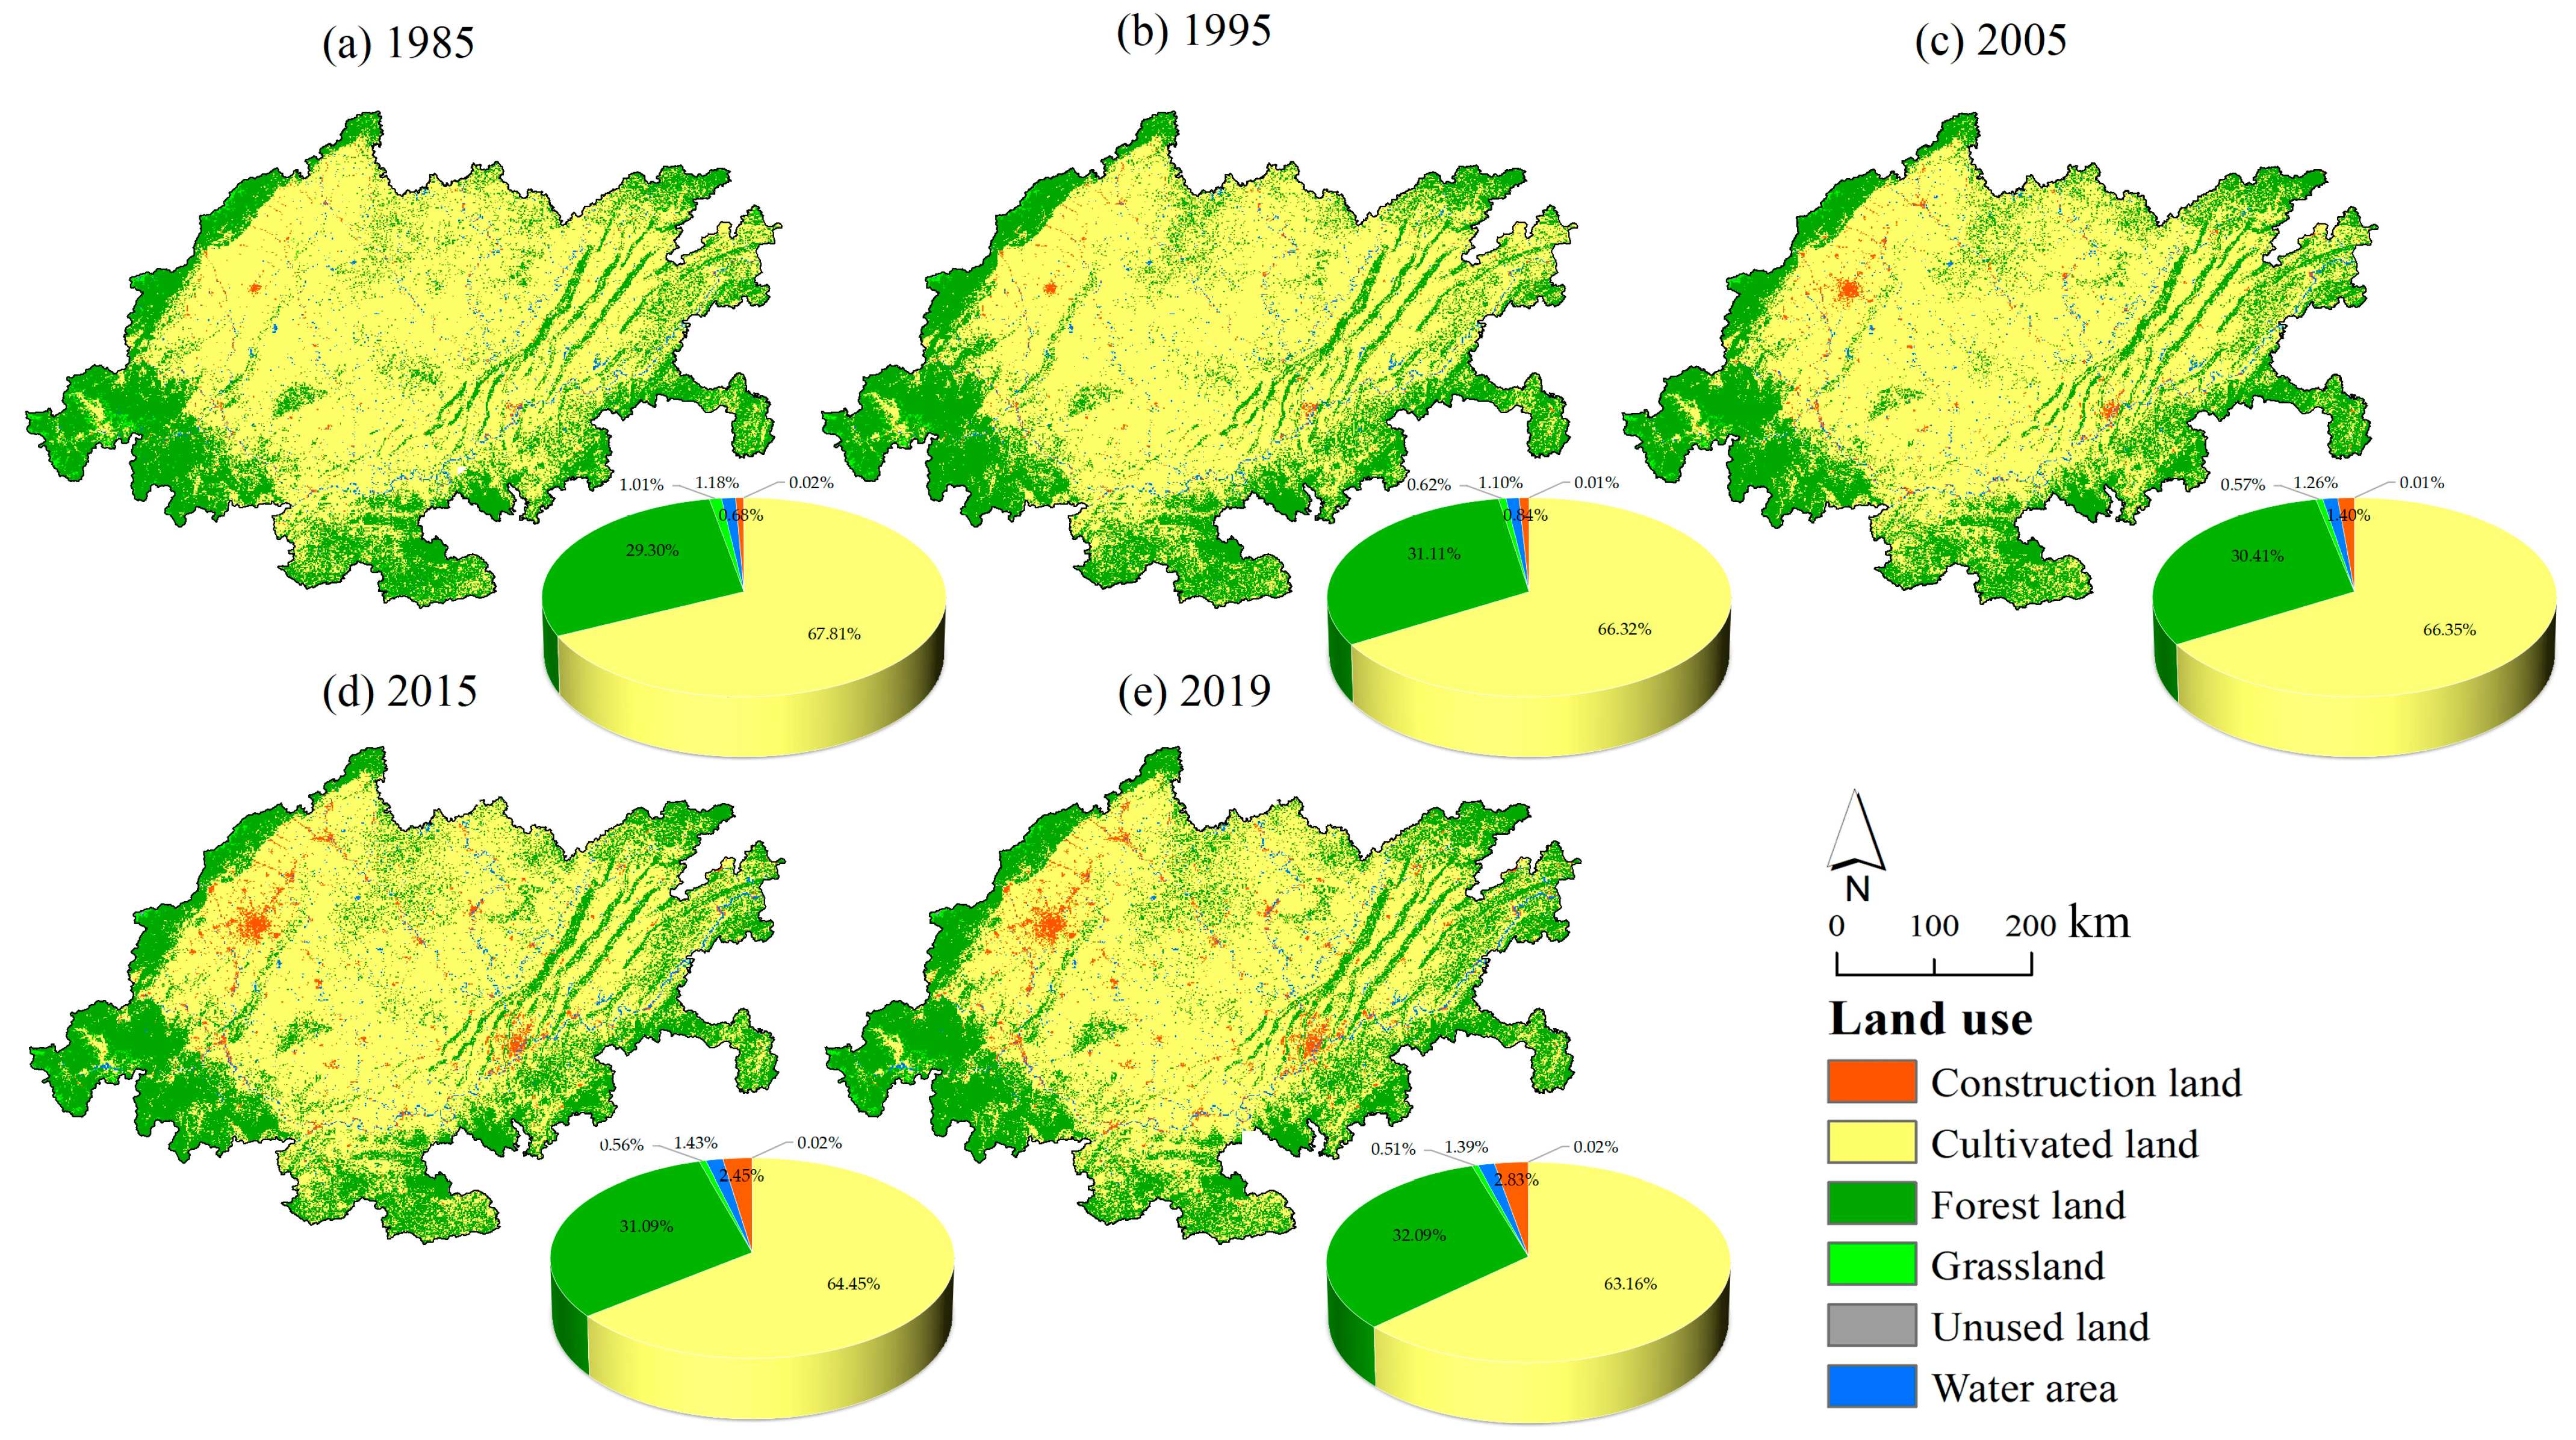
The spatiotemporal evolution of LULC is shown in Figure 4 and Table 3. The peripheral mountainous areas of the CCUA region are dominated by grassland and forest land. In contrast, the central plains and the hilly areas are dominated by agricultural lands, with an apparent geographical transition. On the other hand, the construction land is primarily distributed in the primary urban regions of Chengdu and Chongqing. Although the area of cultivated land declined over the study period, it is still the primary LULC type in the CCUA region. In 2019, the cultivated land covered an area of approximately 116,586.48 km2, accounting for 63.16%, the highest share of the total area, followed by the forest land covering an area of 59,231.50 km2, accounting for 32.09%. The grassland, water area, construction land, and unused land cover only 8768.33 km2, accounting for 4.75%.
Table 3. Area (km2) and proportion (%) for LULC in the CCUA region from 1985 to 2019.
LULC198519952005201520191985–20052005–20191985–2019
Area
(km2)
Proportion
(%)
Area
(km2)
Proportion
(%)
Area
(km2)
Proportion
(%)
Area
(km2)
Proportion
(%)
Area
(km2)
Proportion
(%)
Change
(km2/%)
Change
(km2/%)
Change
(km2/%)
Cultivated land125,166.8167.81122,424.6066.32122,476.4766.35118,960.4464.45116,586.4863.16−2690.34/−2.15−5889.99/−4.81−8580.33/−6.86
Forest land54,078.0729.3057,431.3131.1156,131.5630.4157,379.1031.0959,231.5032.092053.49/3.803099.93/5.525153.43/9.53
Grassland1868.821.011139.920.621050.950.571040.790.56938.010.51−817.86/−43.76−112.94/−10.75−930.81/−49.81
Water area2178.841.182027.451.102320.451.262647.311.432558.561.39141.62/6.50238.11/10.26379.72/17.43
Construction land1251.030.681541.90 0.842581.351.404521.492.455231.912.831330.32/106.342650.56/102.683980.88/318.21
Unused land42.740.0221.080.0125.510.0137.180.0239.850.02−17.23/−40.3114.34/56.19−2.89/−6.77
Total area184,586.31100.00184,586.31100.00184,586.31100.00184,586.31100.00184,586.31100.00---
The LULC in the CCUA has undergone considerable changes over the past four decades (Figure 4 and Table 3). Among them, the increase in construction land was very substantial, from 1251.03 km2 in 1985 to 5231.91 km2 in 2019, with an expansion rate of 318.21%. This is followed by the water area, which expanded from 2178.84 km2 (1985) to 2558.56 km2 (2019), with an expansion rate of 17.43%. Meanwhile, the forest land expanded from 54,078.07 km2 to 59,231.50 km2. In contrast, cultivated land and grassland areas continuously decreased from 1985 to 2019, with 8580.33 km2 and 930.81 km2, respectively. Regarding spatial distribution, the decrease in arable land was mainly due to its encroachment caused by the expansion of construction land. In addition, the change in land use types was more significant during 2005–2019 than during 1985–2005. In addition, the LULC had significant spatial aggregation characteristics, i.e., cultivated land occupying the vast majority, and it was surrounded by forest land. Second, urban expansion was more significant, especially in the principal urban areas of Chengdu and Chongqing, where land use changed dramatically, forming two apparent agglomeration clusters (see Figure 4). From the LULC maps, it can be observed that the leading core role of both Chengdu City and Chongqing City has been strengthening. The agglomeration feature of the urban core is significant, which is in line with the policy implementation purpose. Meanwhile, it can also be foreseen that with the implementation of the CCEC, the leading core role of Chengdu–Chongqing will continue to be highlighted, and the radiation-driving effect of these two poles on the surrounding area will be further amplified. Whether urban expansion will continue to cause encroachment on arable land is a matter of concern and reflection. Consequently, it is essential to simulate and forecast the future LULC under multiple scenarios.

3.2. Spatiotemporal Transition in LULC

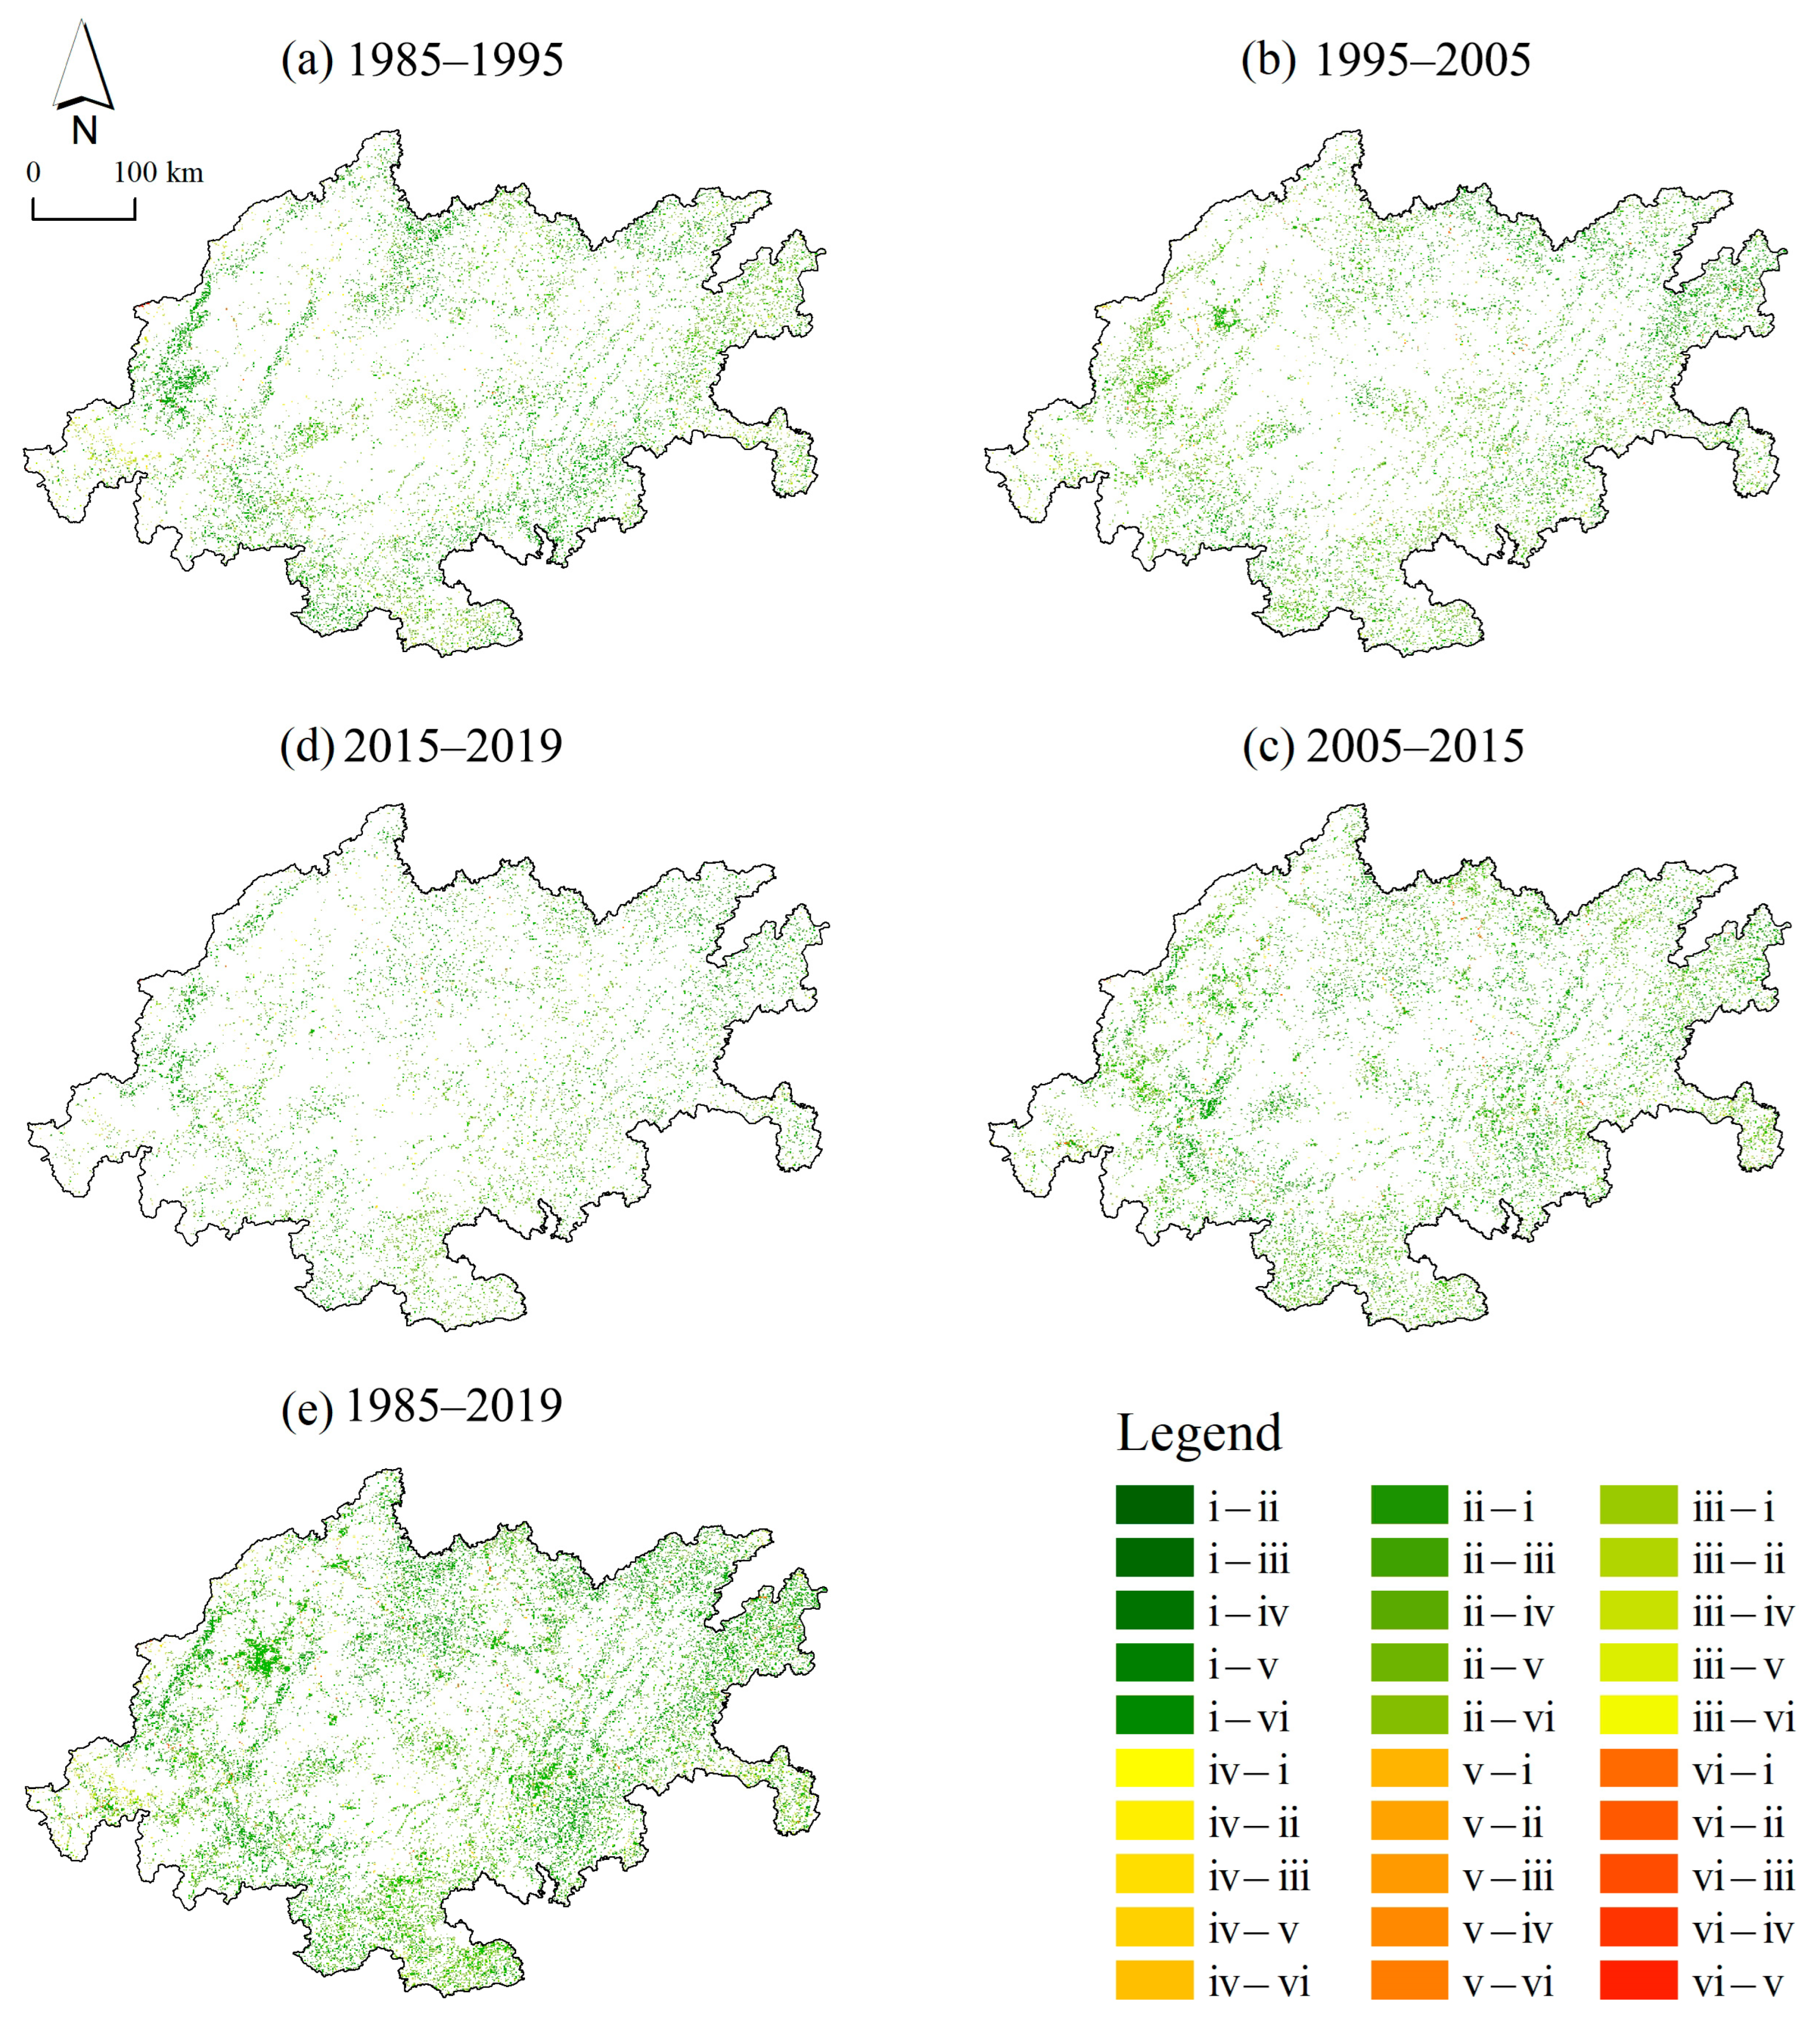
Figure 5 and Table 4 depict the transfer of LULC in the CCUA. From 1985 to 2019, the LULC changed dramatically, primarily showing the mutual transfer between cultivated land and forest land, followed by the conversion of cultivated land to construction land. The cultivated land area transferred out was 17,628.62 km2, mainly shifted to forest land and construction land. In contrast, the area of cultivated land transferred in was 9048.29 km2, mainly from the transfer of forest land. The forest land area transferred out was 8746.77 km2, specifically shifted to cultivated land (8533.24 km2), and the transferred-in area of forest land was 13,900.20 km2. It deserves to be mentioned that the transferred-in area of construction land was 4225.35 km2, and the transferred-out area was 244.47 km2, mainly from cultivated land (4085.60 km2). Changes involving grassland, water area, and unused land were negligible. Overall, the conversion of cultivated land to forest was effective, leading to a substantial increase in forest cover, although construction land continues to expand at the expense of cultivated land.

3.3. Driving Factors of LULC Occurrence

Table 5 displays the results of the binary logistic regression analysis for each driving factor. With the exception of unused land, each driving factor significantly affected the probability of LULC occurrence, in which the regression coefficients of the probability of occurrence of cultivated land, forest land, and construction land with each driving factor passed the significance test (p < 0.05). The probability of cultivated land occurrence was subject to several key factors, namely, mean annual temperature, elevation, slope, annual precipitation, and GDP, and it was positively correlated with temperature and negatively correlated with elevation, slope, annual precipitation, and GDP. The probability of occurrence of forest land was influenced by mean annual temperature, NDVI, slope, and elevation, which were positively correlated with NDVI and slope. Grassland probability was associated with mean annual wind speed, mean annual temperature, and annual precipitation, exhibiting a positive correlation with mean annual wind speed. The occurrence probability of water area was strongly linked to elevation, mean annual temperature, and slope, among which it was negatively associated with elevation and positively related to mean annual temperature and slope. The occurrence probability of construction land was mainly influenced by mean annual temperature, elevation, NDVI, and distance from the central city, among which it was positively correlated with elevation and mean annual temperature. However, it was negatively correlated with distance from the central city and NDVI. The occurrence probability of unused land showed an insignificant pattern and was only influenced by mean annual temperature and GDP. In summary, the effects of different drivers on the chance of each LULC type occurring showed significant variability. Overall, natural factors were more influential, among which the impacts of mean annual temperature on the likelihood of all LULC type occurrence were significant.

3.4. The Multi-Scenario Prediction of LULC

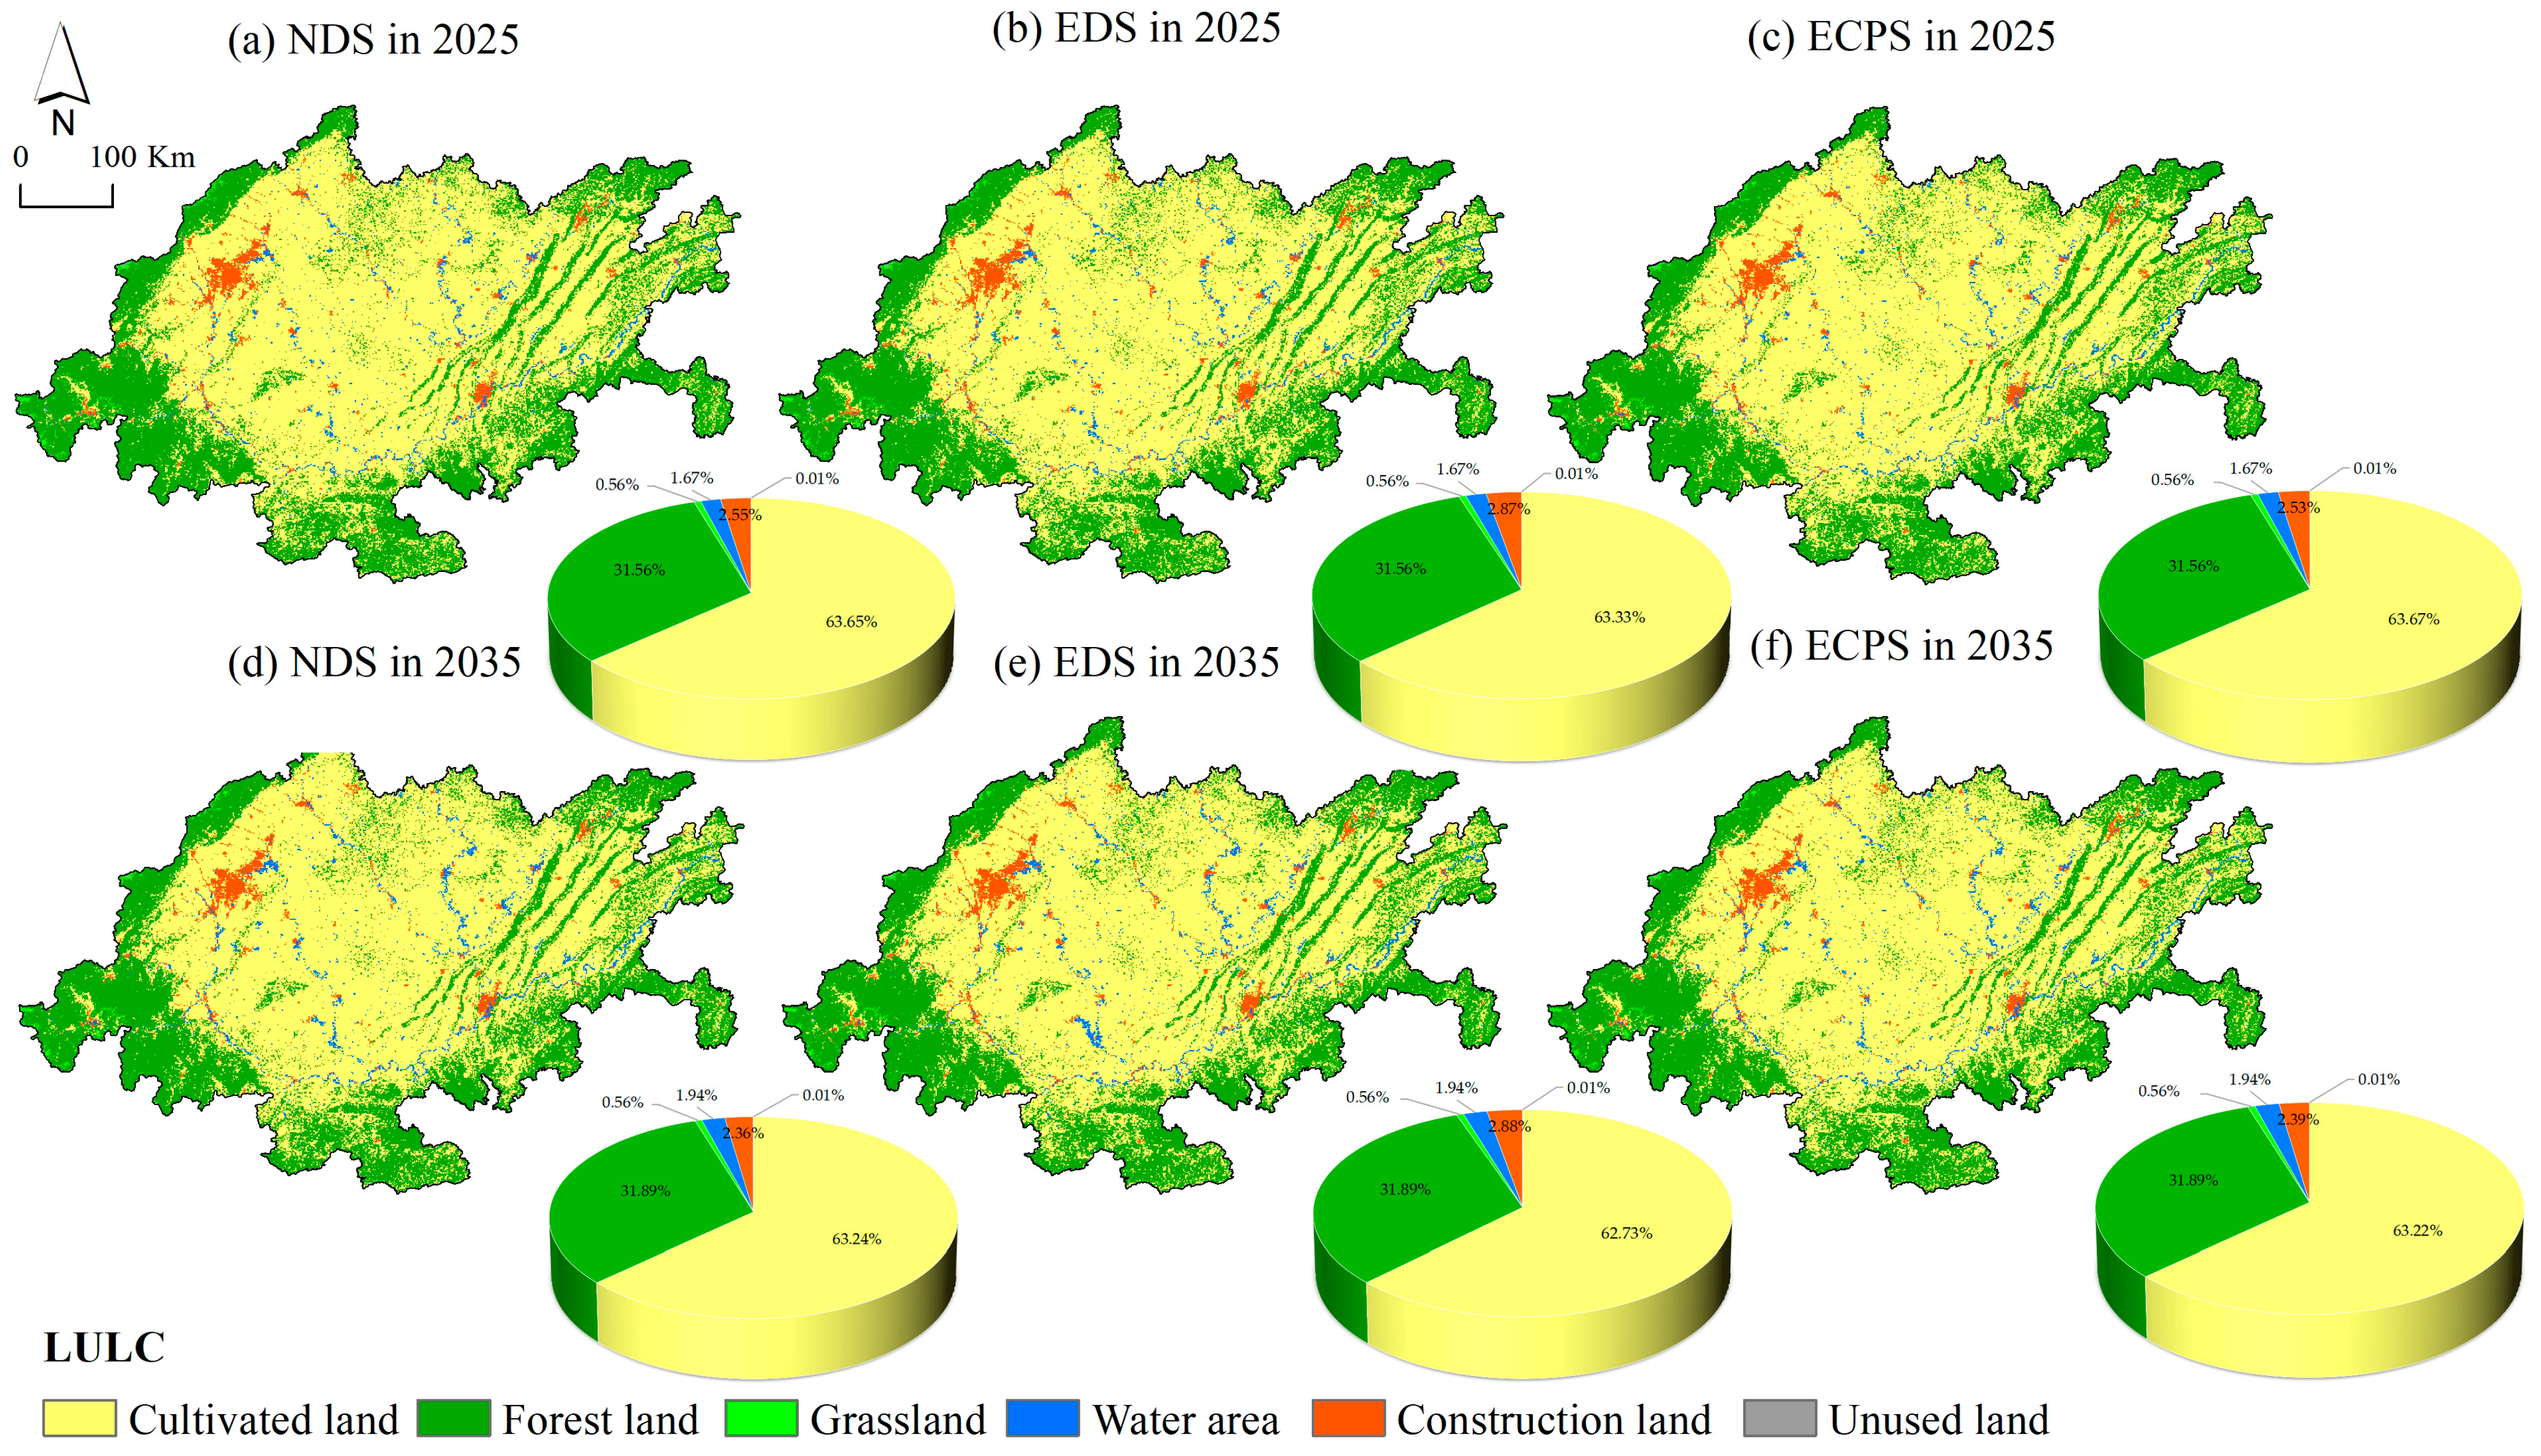
Based on the FLUS–Markov model, the LULC of CCUA in 2025 and 2035 was projected under the three scenarios of NDS, EDS, and ECPS. The simulation outputs are presented in Table 6 and Figure 6.
Figure 6 and Table 6 show the LULC of NDS, EDS, and ECPS of CCUA in 2025 and 2035. The simulation outcomes for the three scenarios indicate cultivated land is still the main type of LULC of the CCUA region, followed by forest land, and the structure of LULC did not significantly change. Projected cultivated land areas are 117,494.46 km2, 116,901.34 km2, and 117,520.12 km2, accounting for 63.65%, 63.33%, and 63.67%, respectively. The construction land areas are 4699.54 km2, 5293.49 km2, and 4674.49 km2, accounting for 2.55%, 2.87%, and 2.53%, respectively. There was no significant change in forest land, grassland, water area, and unused land.
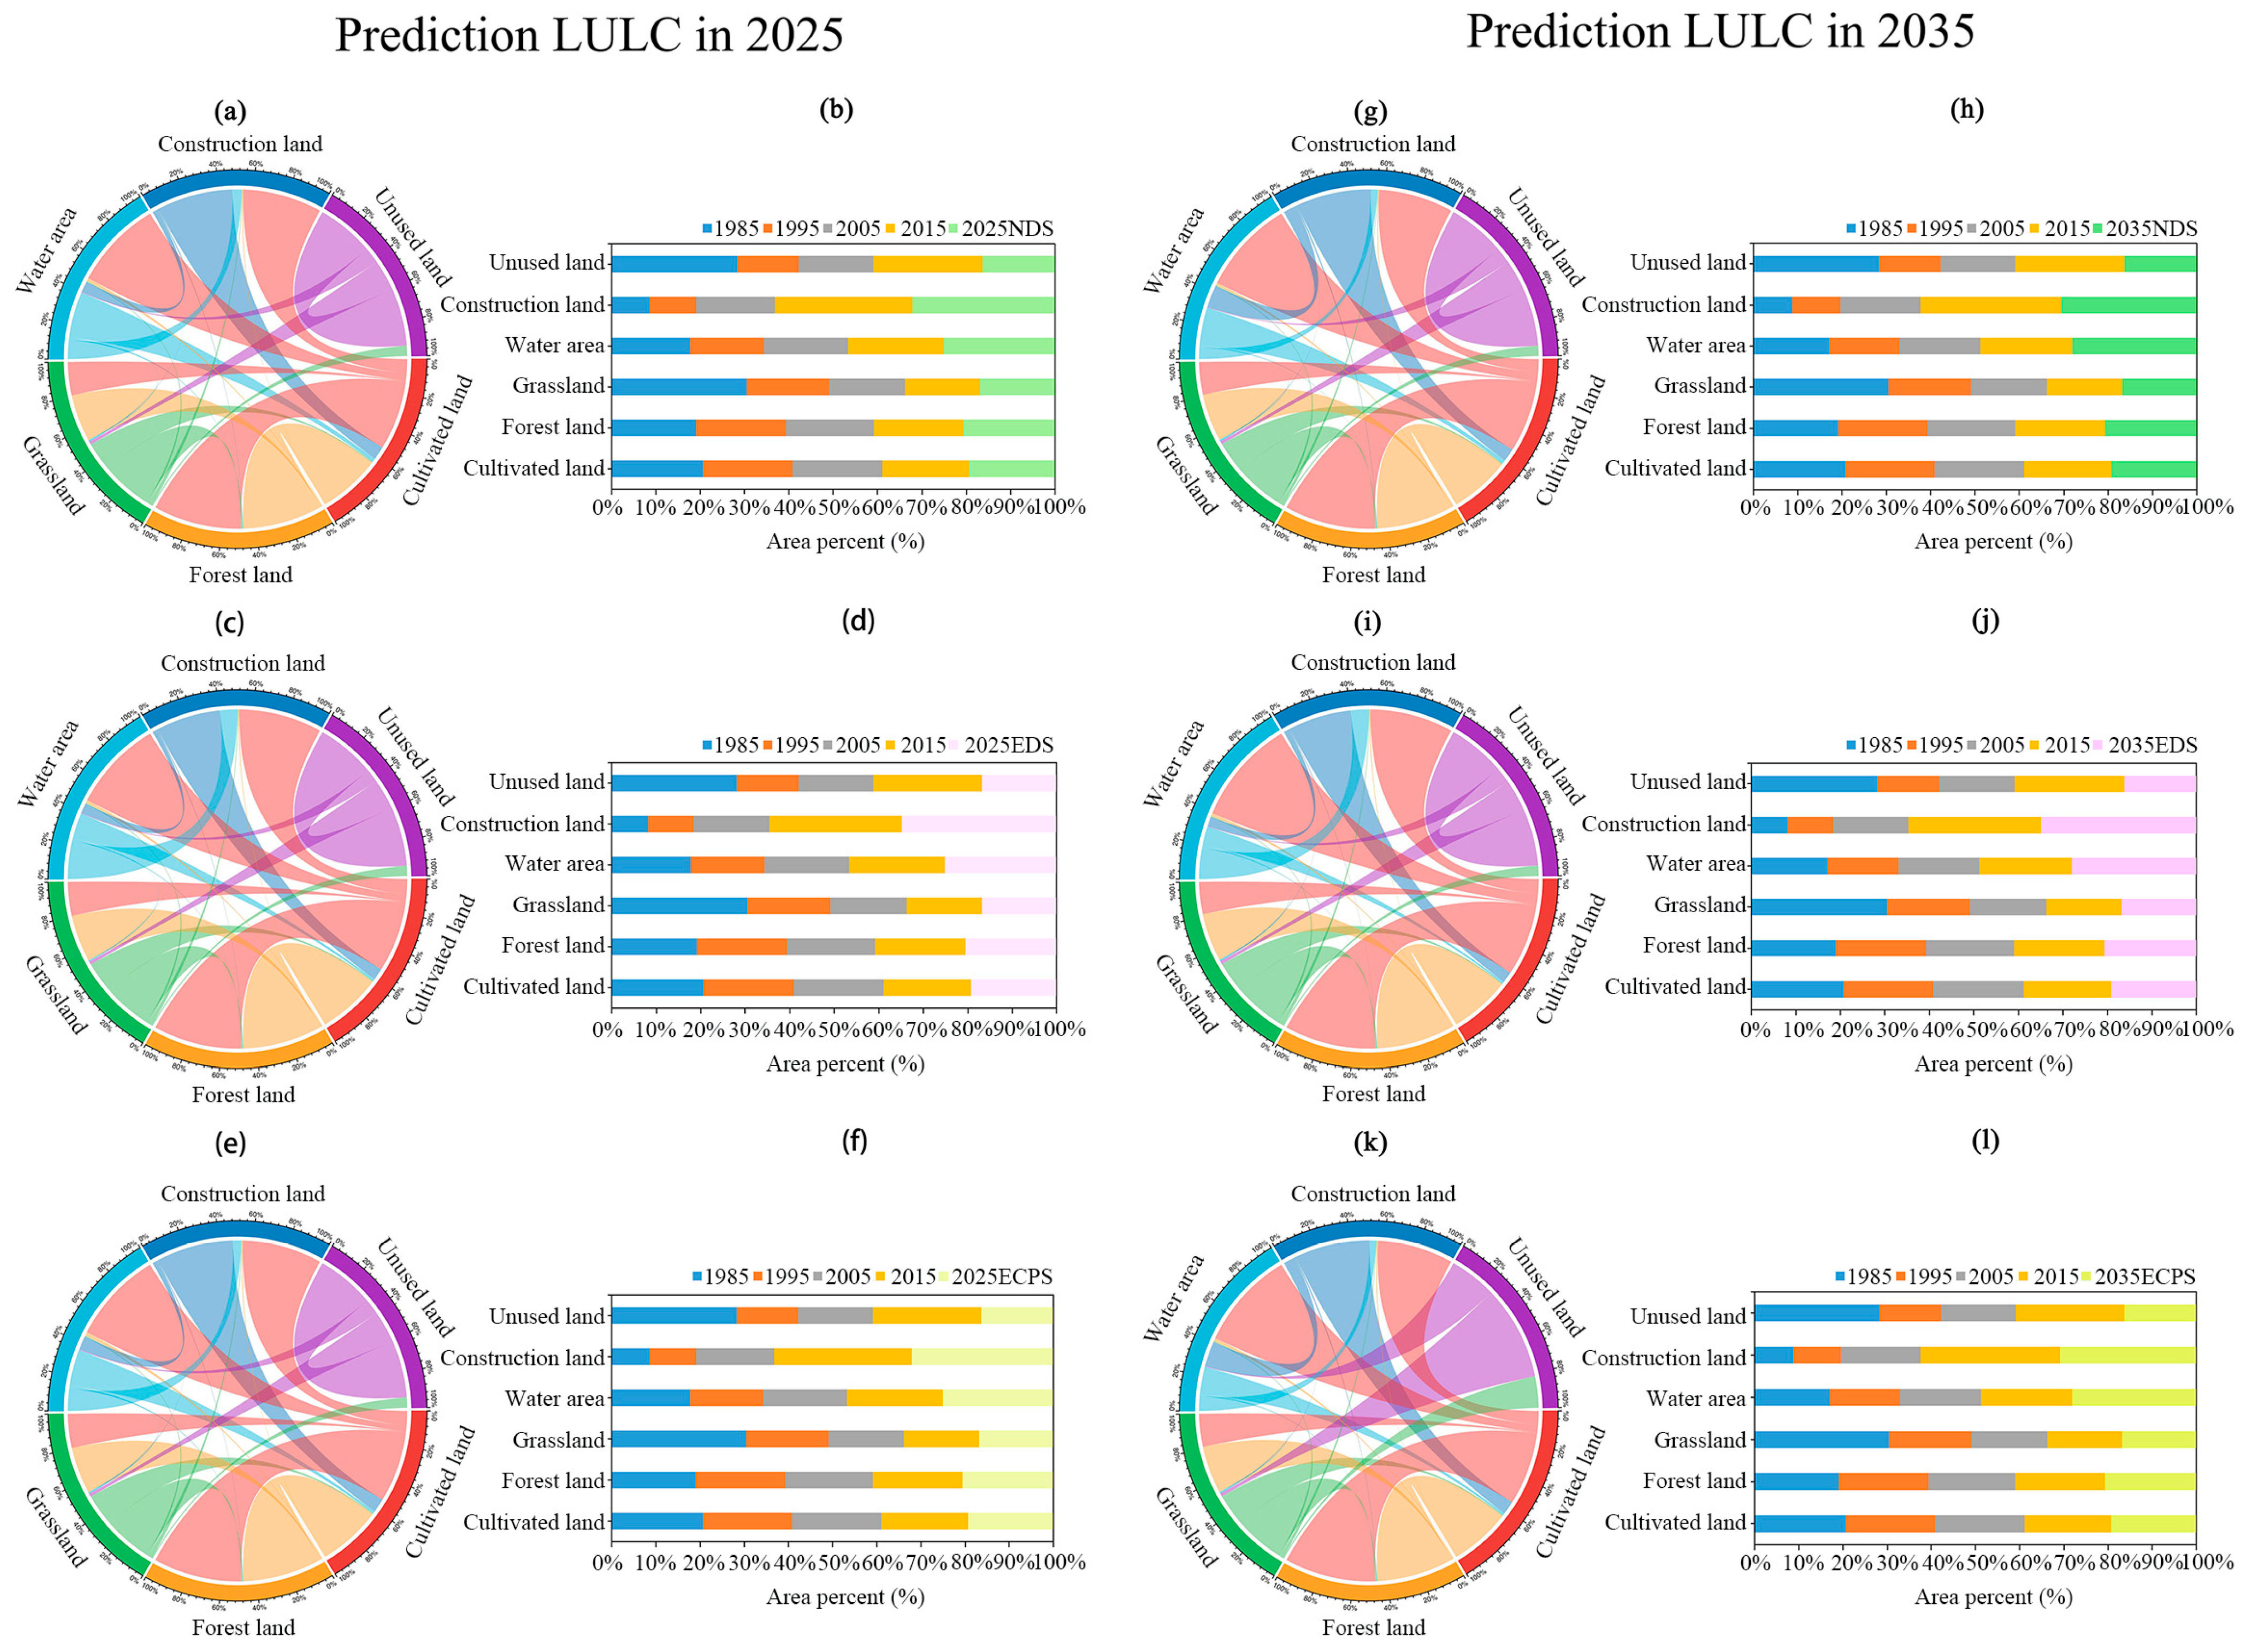
Compared to the LULC in 2025, the LULC structure in 2035 is similar (see Figure 7a–f and Figure 7g–l). The cultivated land is gradually decreasing over time. Construction land is increasing under EDS, whereas it is decreasing under NDS and ECPS compared to 2025. The forest land, grassland, and unused land remain approximately the same in 2025 and 2035 under three scenarios. Notably, water bodies show an upward trend. The possible reason is that under the strict environmental protection policy, some cultivated land is converted to wetlands, which were previously categorized as water area. Comparing the LULC under the three scenarios, NDS and ECPS are more in line with the CCUA region’s development trend.

4. Discussion

4.1. Rapid Change of LULC and Its Impact

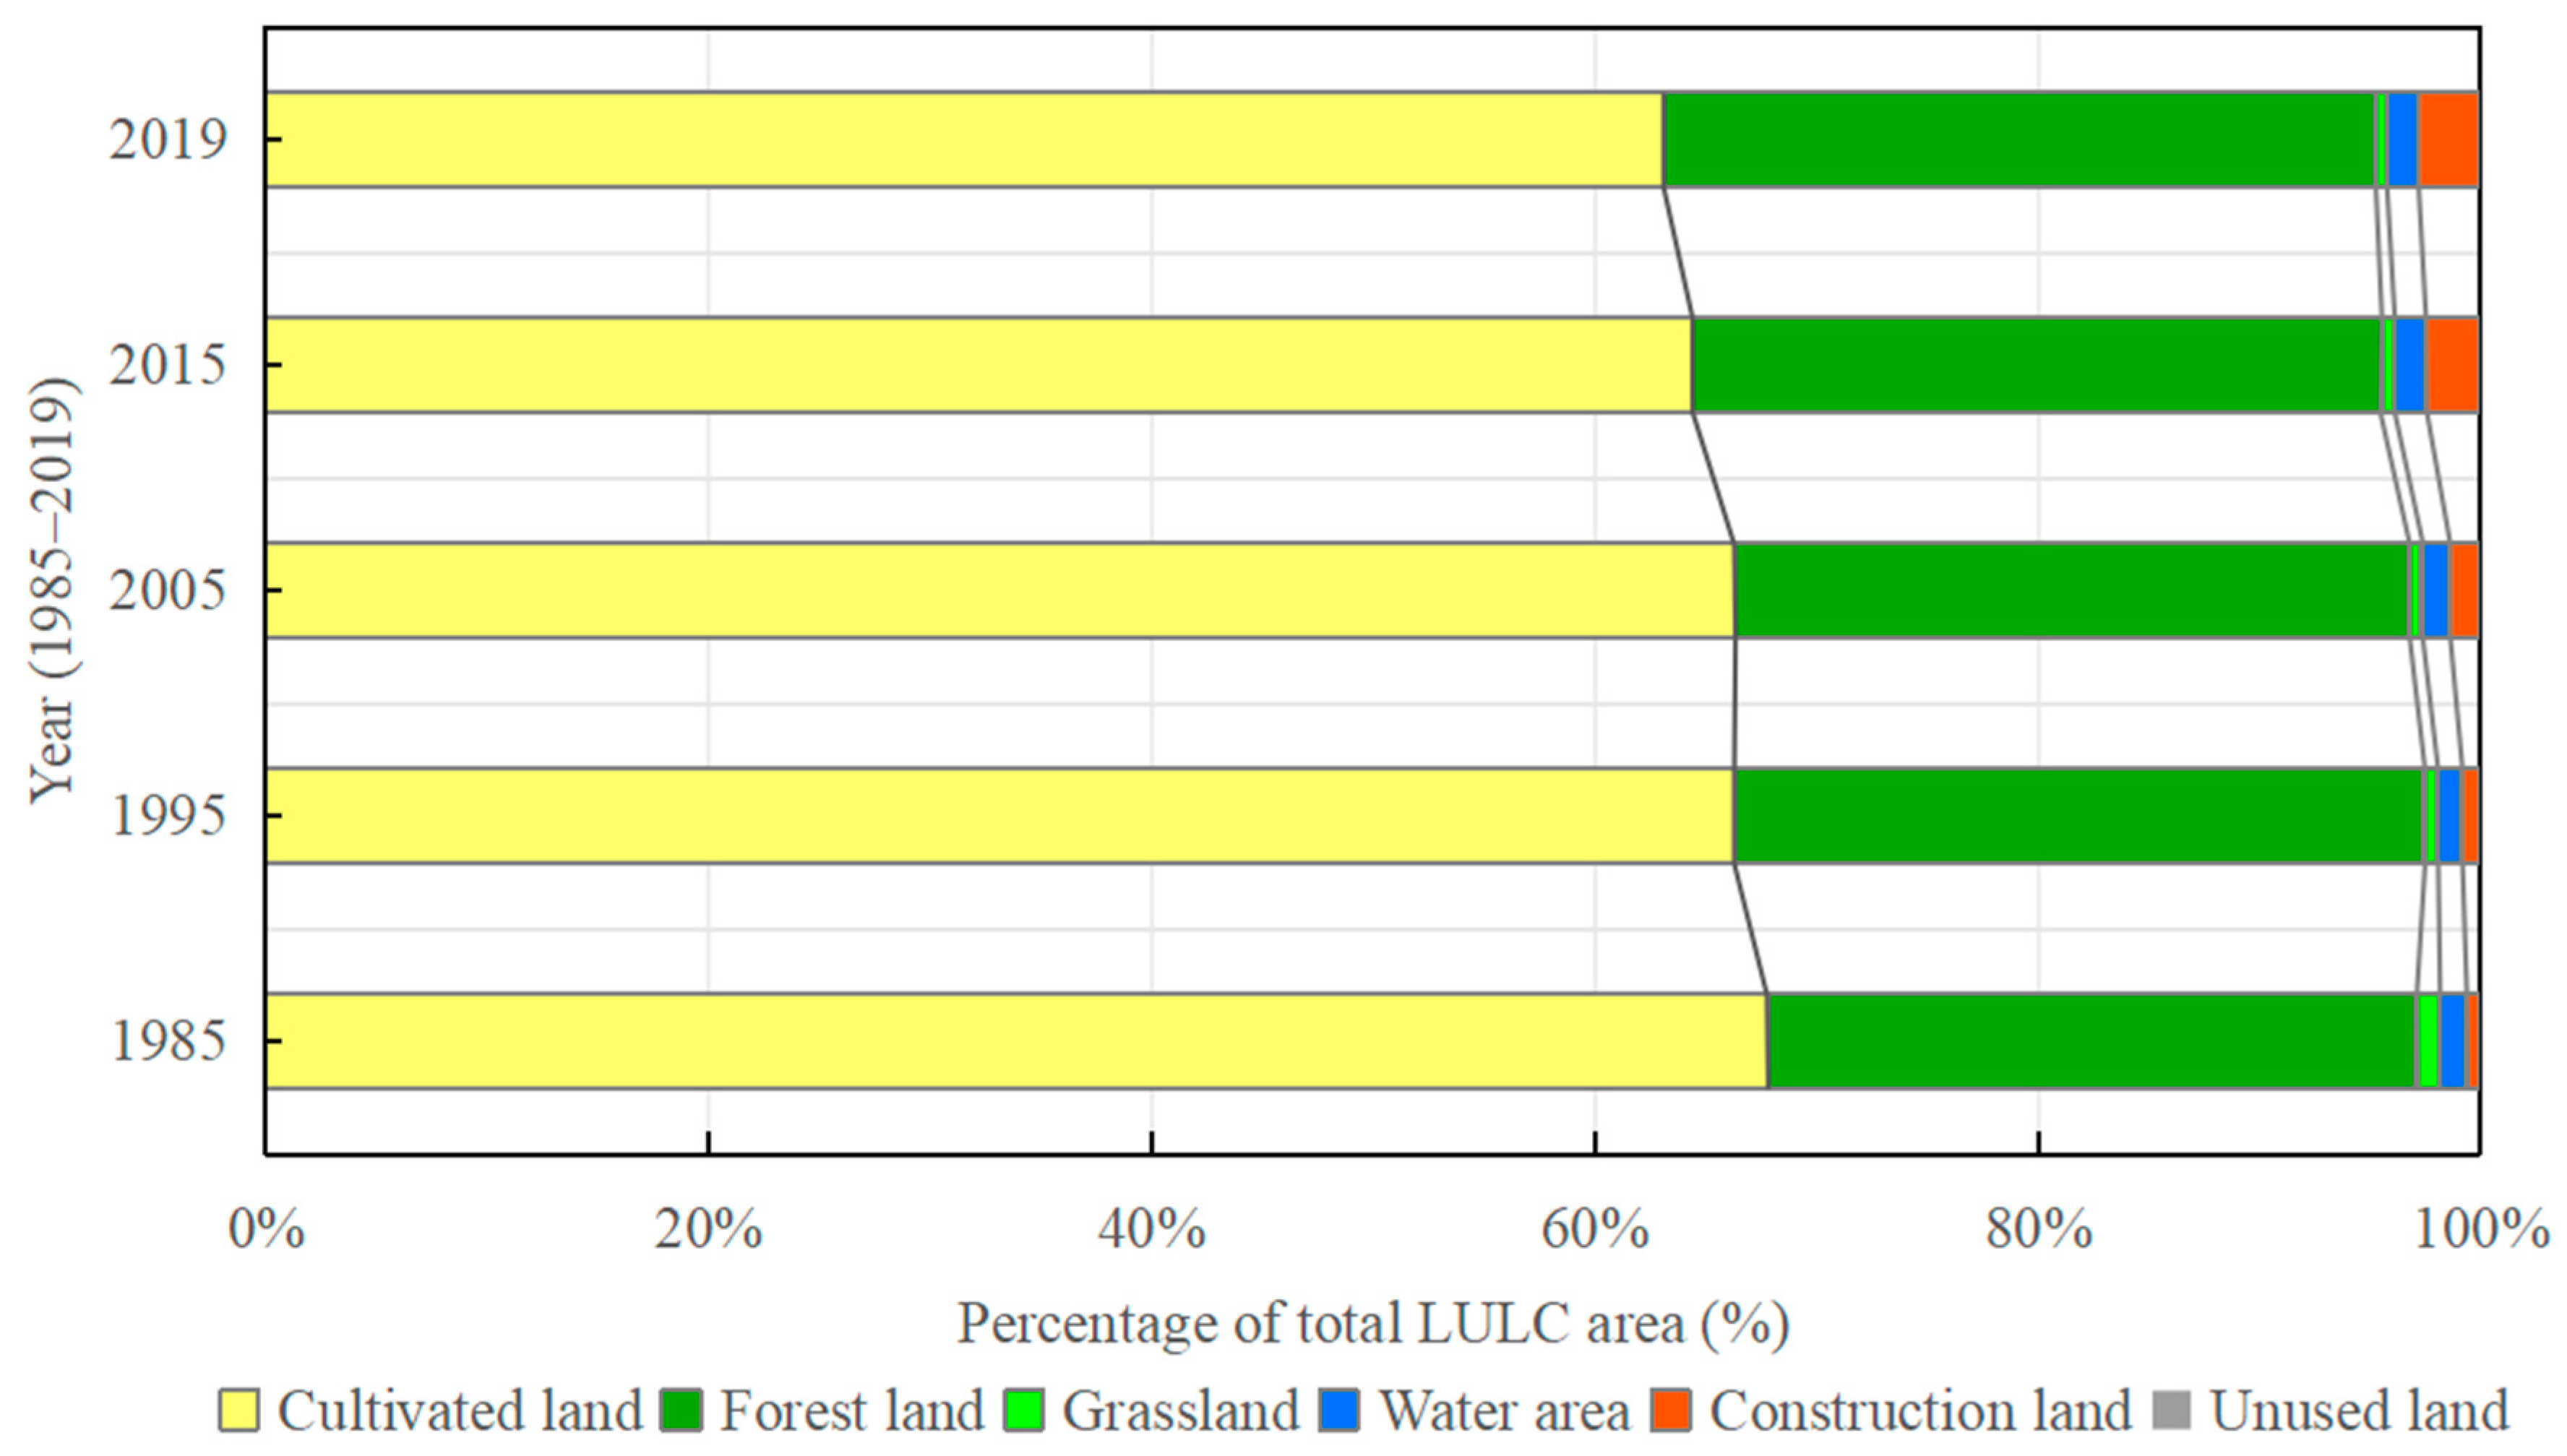
China has experienced remarkable development in recent decades, with rapid urbanization driving population migration to megacities in pursuit of better living conditions and employment opportunities [1,64,65]. This process has led to notable increases in urban population and significant urban sprawl [18,66]. The rapid expansion of urban areas has profoundly altered land use patterns, with substantial conversion of ecological spaces into construction land, triggering a range of environmental challenges [67,68], including the loss of cultivated land, fragmentation of ecological habitats, increased flood and water resource pressures, and greater susceptibility to geological disasters in mountainous regions. From 1985 to 2019, forest land increased by 5153.43 km2 (+9.53%), while construction land grew by 3980.88 km2 (+318.21%), consistent with policy-driven restoration and rapid urban expansion, respectively (Table 4, Figure 8). Such a pattern has characterized the development of many Chinese megacities throughout recent decades. However, the rapid and incongruous urban expansion usually accelerates the LULC change and results in the loss of cultivated and forest land [69]. This widespread problem poses a serious challenge to the region’s ecological protection and sustainable development. Currently, the Chinese government has adopted a coordinated development model of the three functions of LULC types, i.e., Production–Living–Ecological Space (PLES, Sansheng Kongjian) [37,49,66].
Cultivated land remains the dominant land use type in the CCUA, followed by forest land and grassland. This aligns with the findings of a previous study that investigated the LULC changes from 2000 to 2015 in the CCUA [39]. By extending the study period by 19 years, the structure of land use types has mostly stayed the same, despite the significant increase in construction land and decreased cultivated land. However, the reduction of cultivated land is due to the encroachment of the uncontrolled expansion of construction land; on the one hand, the other reason is the strict protection of the ecological environment. Since 1999, the Chinese government has implemented the Returning Farmland to Forest Program (RFFP, Tuigeng Huanlin Gongcheng) to safeguard the ecosystems. Consequently, the cultivated land decreased from 122,476.47 km2 in 2005 to 116,586.48 km2 in 2019—a 4.81% reduction, while forest land increased by 3099.93 km2 (5.52%) over the same period, highlighting the significant impact of RFFP (Figure 8). The program has substantially increased forest coverage and delivered notable ecological benefits [70,71], particularly in ecologically fragile slope areas. Sustaining these ecological gains will require moderately increasing subsidy standards, strengthening policy enforcement, and prioritizing implementation in areas of high ecological sensitivity.

4.2. Driving Factors of LULC Change

LULC driving force analysis is a hot topic in land use research. Currently, the main research methods are the analytic hierarchy process [19], principal component analysis, logistic regression model [41], Random Forest [15], etc. Influencing factors mainly include physical geographic conditions, demographic characteristics, industrial structure, and policy [32,54]. Natural geographic conditions exert a direct and evident influence on land use, yet in recent years, growing insights into the drivers and mechanisms of LULC change have brought greater attention to the role of human socioeconomic activities. Some scholars even believe that human activities and decision-making play a leading role in the LULC transition [54,72]. However, it is essential to note that LULC change results from a combination of the above factors. This effect varies at specific times in specific regions. Therefore, comprehensive analyses of LULC should incorporate the effects of various driving factors, as evidence suggests that jointly accounting for natural and socioeconomic influences improves the predictive accuracy of future land use change simulations [19]. In addition, optimizing land use patterns is facilitated by human intervention in key factors [20,36].
Additionally, logistic regressions reveal that the effects of different drivers on the probability of occurrence show significant variability across land use types [54,55,73]. The conversion rate of cultivated land was mainly influenced by mean annual temperature, elevation, slope, annual precipitation, and GDP. In contrast, forest land was affected by mean annual temperature, NDVI, slope, and elevation. In contrast, the occurrence probability of grassland was mainly influenced by mean annual wind speed, mean annual temperature, and annual precipitation, while the occurrence probability of water area was closely related to elevation, mean annual temperature, and slope. The occurrence probability of construction land was mainly influenced by mean annual temperature, elevation, distance from the central city, and mean annual wind speed. This finding is supported by several previous studies [13,74].
Arguably, unlike findings from flat-terrain urban agglomerations such as the YRDUA and BTHUA, where socioeconomic drivers are often reported as the dominant determinants of LULC change [8,13,59,75], the results for the CCUA revealed a markedly different pattern. In this mountainous context, topographic and climatic constraints—particularly elevation, slope, and mean annual temperature—exert a more decisive influence on land use transitions. This distinction underscores the necessity of tailoring LULC management strategies to the unique biophysical constraints of mountainous UAs.

4.3. Prediction of LULC

There are many methods of prediction of LULC, such as CA, Multi-agent system (MAS), Conversion of Land Use and its Effects (CLUE), FLUS, and Patch-generating Land Use Simulation (PLUS). Using ANN-based CA models (ANN-CA), Mohammad et al. [51] predicted the LULC of Ahmedabad city and found that the increase in construction land and decrease in cultivated land and grassland would impact urban green structure and ecosystem service balance in the future.
The CA models can also be integrated with Markov (also known as Markov-CA or CA-Markov), which merits for predicting LULC change at different scales [19,76,77]. For predictive LULC simulations, accuracy checks are essential. The accuracy depends on the simulation model, the prediction’s duration, and the driving factors [78]. Related studies have shown that FLUS has higher simulation accuracy than the above models [59,79]. In this study, LULC in 2015 and 2019 were simulated and subsequently compared with the actual LULC with the Kappa Coefficients of 0.75 and 0.72; the Overall Accuracies of 87.79% and 86.27%; and the FOMs of 6.66% and 8.59%, respectively. Compared to other studies [15], the accuracy of this simulation is not very high but is in the acceptable range. The commonly accepted threshold for high-precision simulation is a Kappa of 0.75 [80]. The observed differences may be attributable to the following factors: (1) The elusive influence of policies on land use development. In recent years, the Chinese government has implemented many policies in the CCUA region to promote regional development, e.g., the outline of the construction plan of CCEC and the western development strategy. (2) Most of our study area is mountainous compared to other studies. Land use is significantly influenced by topography, and the intervention of more topographic factors may lead to higher simulation accuracy. (3) Our simulation period is shorter (in 2025 and 2035), and related studies have shown that the simulation accuracy is higher for long-time projections [59]. In addition, our study area is an urban agglomeration, and there are relatively few studies on this macro-scale. Related studies show that larger-scale simulation predictions are less accurate because of more significant regional variability [48].

4.4. Recommendations and Limitations

The scenario analysis indicates that compact urban expansion along designated development corridors, combined with slope-threshold growth boundaries (e.g., restricting new construction on slopes exceeding 15°), can effectively reconcile development demands with the protection of ecological and cultivated land resources in mountainous urban agglomerations. Such strategies, rarely addressed in existing LULC planning literature, are transferable to other eco-fragile mountainous regions undergoing rapid urbanization.
The CCUA region is typically mountainous (more than 77% of the area is mountainous) [10], with the scarcity of land resources, complex topography, and urban expansion inevitably encroaching on ecological land. However, it should be emphasized that both the large-scale conversion of arable land to construction land and the reclamation of forest land for construction purposes represent unsustainable development models, which can trigger a series of ecological and environmental problems, such as soil erosion, geological disasters, and desertification. Studies have shown that infinitely expanding urban development patterns are not sustainable [67]. China is predominantly mountainous, with such areas accounting for approximately 67% of its total land territory. Therefore, mountainous regions’ land use development pattern is significant for the sustainable development of Chinese cities and towns [68,81]. Several recommendations are proposed to guide the future optimization of land use in the CCUA. The first priority is to change the development concept and innovate the urban development model. Currently, the Chinese government has placed considerable emphasis on addressing this issue and advocates promoting the transformation of cities from a crude expansion model to high-quality connotative development, implementing strict controls on urban expansion, and safeguarding ecological and agricultural resources. Secondly, there is the attempt to avoid urban sprawl, especially in the main urban areas of the two cities. Thirdly, for the spatial distribution of construction land, it is obviously clustered in the urban core of Chengdu and Chongqing, respectively. This indicates that the economic development pattern shows a dumbbell structure. Balanced and synergistic development needs to be emphasized.
The paper has some limitations that will serve as future research directions. First, the accuracy of our simulation predictions is low but within an acceptable range. Previous studies have suggested that the FLUS model may outperform the PLUS model in simulating multiple LULC types [36,82], a finding that warrants further validation in the context of this study. If the accuracy is further improved, it will be a better reference for the land use optimization of the CCUA region. Secondly, although this study projects LULC patterns for 2025, it should be noted that the complete 2025 land use dataset from RESDC has been released but is not publicly accessible. This limitation constrained our ability to incorporate actual 2025 data. Nevertheless, the 2025 prediction offers methodological insights and early references for planning the 2025–2035 horizon. Importantly, once the official 2025 dataset becomes fully available, it will provide an opportunity to validate and refine our model, thereby strengthening the robustness of long-term scenario projections. Thirdly, parameterization of the transformation matrix and domain weights for multi-scenario simulations is undertaken with caution, drawing selectively on previous research to ensure contextual relevance. After many attempts and comparative analysis of results, there still needs to be more basics in setting the parameters. This will also be a point of interest for future research. Finally, as stated in the purpose of the study, LULC research has received widespread attention in recent years because the drastic changes in LULC have posed specific threats to the human social and ecological environment. Therefore, revealing the changes of LULC is only a previous study, and exploring the mechanism of its impact on socioeconomic and ecological systems and countermeasures is the more important significance of the study [21,83].

5. Conclusions

Using the FLUS–Markov model, this study examined the spatiotemporal patterns, driving factors, and multi-scenario prediction of LULC in the CCUA. From 1985 to 2019, the region experienced significant transformations: forest land, construction land, and water areas increased, while cultivated land, grassland, and unused land declined. The interconversion between cultivated and forest land has been the primary type of LULC transition, followed by cultivated land transfer to construction land. The effects of different drivers on the probability of occurrence of each LULC type show significant variability. The impacts of mean annual temperature on the probability of occurrence of all LULC types are significant. Based on the above analysis results, LULC in 2025 and 2035 are projected under multiple scenarios, and the results indicate that NDS and ECPS represent the most suitable development pathways for the CCUA region.
The contribution of this paper is threefold: First, the FLUS–Markov framework was integrated with explicit ECPS to simulate multiple land use scenarios, representing a configuration not previously applied to mountainous urban agglomerations. Second, the dominant role of topographic and climatic factors (elevation, slope, and temperature) in shaping LULC change in a mountainous UA was identified, in clear contrast to patterns reported for flat-terrain UAs in earlier studies. Third, targeted spatial governance strategies, including corridor-based compact expansion and slope-threshold growth boundaries, are proposed to address the specific challenges of eco-fragile mountainous urban regions.

Author Contributions

Conceptualization, Y.C. and M.A.-B.; methodology, Y.C.; software, Y.C. and L.D.; validation, Y.C., L.D. and M.A.-B.; formal analysis, Y.C.; investigation, Y.C. and M.A.-B.; data curation, Y.C.; writing—original draft preparation, Y.C. and M.A.-B.; writing—review and editing, Y.C.; visualization, Y.C. and L.D.; supervision, M.A.-B.; funding acquisition, Y.C. and M.A.-B. All authors have read and agreed to the published version of the manuscript.

Funding

This research was supported by the National Natural Science Foundation of China (Grant No. 52308081), the Philosophy and Social Science Foundation in Chengdu City (Grant No. 2024BS059), the Key Research Base for Humanities and Social Sciences in Higher Education Institutions of Sichuan Province: Yangtze River Key Ecological Functional Area Protection Policy Research Center (Grant No. YREPC2024-YB001), and the Fundamental Research Funds for the Central Universities (Grant No. 2682024CX126).

Data Availability Statement

The data presented in this study are available from the corresponding author upon request.

Conflicts of Interest

The authors have no relevant financial or non-financial interests to disclose.

Abbreviations

ANNArtificial Neural Network
AUCArea Under the Curve
BTHUABeijing–Tianjin–Hebei Urban Agglomeration
CACellular Automata
CCUAChengdu–Chongqing Urban Agglomeration
CLCDChina Land Cover Dataset
DEMDigital Elevation Model
ECPSEcology and Cultivated Protection Scenarios
EDSEconomic Development Scenario
ESVEcosystem Service Value
FLUSFuture Land Use Simulation
FOMFigure of Merit
GDPGross Domestic Product
KappaKappa Coefficient
LULCLand Use/Land Cover
MarkovMarkov Chain Model
NDVINormalized Difference Vegetation Index
NDSNatural Development Scenario
OAOverall Accuracy
PLESProduction–Living–Ecological Space
PRDUAPearl River Delta Urban Agglomeration
ROCReceiver Operating Characteristic curve
RFFPReturning Farmland to Forest Program
VIFVariance Inflation Factor
YRDUAYangtze River Delta Urban Agglomeration

Appendix A

Table A1. Weight of neighborhood of LULC.
ScenariosCultivated LandForest LandGrasslandWater AreaConstruction LandUnused Land
NDS0.30.20.40.21.00.2
EDS0.30.20.40.21.00.2
ECPS0.20.30.50.21.00.2
Figure A1. Probability-of-occurrence estimation of LULC types in the CCUA. (a) Cultivated land, (b) Forest land, (c) Grassland, (d) Water area, (e) Construction land, and (f) Unused land. Probability values range from 0 (low suitability) to 1 (high suitability).
Land 14 01787 g0a1
Table A2. Cost matrix of multi-scenario.
ScenarioNDSEDSECPS
iiiiiiivvviiiiiiiivvviiiiiiiivvvi
i111111111111111110
ii111111111111111110
iii111111111111111111
iv111111000110000100
v111111000010111111
vi111111111111111111
Note: i, ii, iii, iv, v, and vi represent cultivated land, forest land, grassland, water area, construction land, and unused land, respectively. 0 means conversion is not allowed, while 1 means conversion is permitted.
Figure A2. The actual and predicted LULC in 2015 and 2019. (a) Actual LULC in 2015, (b) Predicted LULC in 2015, (c) Actual LULC in 2019, and (d) Predicted LULC in 2019. Panels A–D represent enlarged views of selected regions to highlight detailed spatial differences between actual and predicted LULC.
Land 14 01787 g0a2

References

  1. Chen, C.; LeGates, R.; Zhao, M.; Fang, C. The Changing Rural-Urban Divide in China’s Megacities. Cities 2018, 81, 81–90. [Google Scholar] [CrossRef]
  2. Kuang, W.; Chi, W.; Lu, D.; Dou, Y. A Comparative Analysis of Megacity Expansions in China and the U.S.: Patterns, Rates and Driving Forces. Landsc. Urban Plan. 2014, 132, 121–135. [Google Scholar] [CrossRef]
  3. You, H. Quantifying Megacity Growth in Response to Economic Transition: A Case of Shanghai, China. Habitat Int. 2016, 53, 115–122. [Google Scholar] [CrossRef]
  4. Zeng, C.; Deng, X.; Xu, S.; Wang, Y.; Cui, J. An Integrated Approach for Assessing the Urban Ecosystem Health of Megacities in China. Cities 2016, 53, 110–119. [Google Scholar] [CrossRef]
  5. Yang, L.; Chau, K.W.; Szeto, W.Y.; Cui, X.; Wang, X. Accessibility to Transit, by Transit, and Property Prices: Spatially Varying Relationships. Transport. Res. Part D-Transport. Environ. 2020, 85, 102387. [Google Scholar] [CrossRef]
  6. Yu, J.; Ye, C. A New Conceptual Framework and Case Analysis of Rural Environmental Cross-Boundary Governance in Megacities of China. Habitat Int. 2025, 156, 103258. [Google Scholar] [CrossRef]
  7. Lu, H.; Zhang, C.; Jiao, L.; Wei, Y.; Zhang, Y. Analysis on the Spatial-Temporal Evolution of Urban Agglomeration Resilience: A Case Study in Chengdu-Chongqing Urban Agglomeration, China. Int. J. Disaster Risk Reduct. 2022, 79, 103167. [Google Scholar] [CrossRef]
  8. Yang, Y.; Yang, M.; Zhao, B.; Lu, Z.; Sun, X.; Zhang, Z. Spatially Explicit Carbon Emissions from Land Use Change: Dynamics and Scenario Simulation in the Beijing-Tianjin-Hebei Urban Agglomeration. Land Use Policy 2025, 150, 107473. [Google Scholar] [CrossRef]
  9. Yu, J.; Zhou, K.; Yang, S. Land Use Efficiency and Influencing Factors of Urban Agglomerations in China. Land Use Policy 2019, 88, 104143. [Google Scholar] [CrossRef]
  10. Zhang, H.; Deng, W.; Zhang, S.; Peng, L.; Liu, Y. Impacts of Urbanization on Ecosystem Services in the Chengdu-Chongqing Urban Agglomeration: Changes and Trade-Offs. Ecol. Indic. 2022, 139, 108920. [Google Scholar] [CrossRef]
  11. Chen, Y.; Lu, H.; Yan, P.; Qiao, Y.; Xia, J. Spatial-Temporal Collaborative Relation among Ecological Footprint Depth/Size and Economic Development in Chengyu Urban Agglomeration. Sci. Total Environ. 2022, 812, 151510. [Google Scholar] [CrossRef] [PubMed]
  12. Sun, J.; Zhou, T.; Wang, D. Relationships between Urban Form and Air Quality: A Reconsideration Based on Evidence from China’s Five Urban Agglomerations during the COVID-19 Pandemic. Land Use Policy 2022, 118, 106155. [Google Scholar] [CrossRef] [PubMed]
  13. Yang, R.; Chen, H.; Chen, S.; Ye, Y. Spatiotemporal Evolution and Prediction of Land Use/Land Cover Changes and Ecosystem Service Variation in the Yellow River Basin, China. Ecol. Indic. 2022, 145, 109579. [Google Scholar] [CrossRef]
  14. Zhang, S.; Yang, P.; Xia, J.; Wang, W.; Cai, W.; Chen, N.; Hu, S.; Luo, X.; Li, J.; Zhan, C. Land Use/Land Cover Prediction and Analysis of the Middle Reaches of the Yangtze River under Different Scenarios. Sci. Total Environ. 2022, 833, 155238. [Google Scholar] [CrossRef]
  15. Liu, Y.; Wu, G.; Fan, X.; Gan, G.; Wang, W.; Liu, Y. Hydrological Impacts of Land Use/Cover Changes in the Lake Victoria Basin. Ecol. Indic. 2022, 145, 109580. [Google Scholar] [CrossRef]
  16. Rahnama, M.R. Forecasting Land-Use Changes in Mashhad Metropolitan Area Using Cellular Automata and Markov Chain Model for 2016–2030. Sustain. Cities Soc. 2021, 64, 102548. [Google Scholar] [CrossRef]
  17. Fondevilla, C.; Àngels Colomer, M.; Fillat, F.; Tappeiner, U. Using a New PDP Modelling Approach for Land-Use and Land-Cover Change Predictions: A Case Study in the Stubai Valley (Central Alps). Ecol. Modell. 2016, 322, 101–114. [Google Scholar] [CrossRef]
  18. Bhat, P.A.; ul Shafiq, M.; Mir, A.A.; Ahmed, P. Urban Sprawl and Its Impact on Landuse/Land Cover Dynamics of Dehradun City, India. Int. J. Sustain. Built Environ. 2017, 6, 513–521. [Google Scholar] [CrossRef]
  19. Guan, D.; Li, H.; Inohae, T.; Su, W.; Nagaie, T.; Hokao, K. Modeling Urban Land Use Change by the Integration of Cellular Automaton and Markov Model. Ecol. Modell. 2011, 222, 3761–3772. [Google Scholar] [CrossRef]
  20. Kavhu, B.; Eric Mashimbye, Z.; Luvuno, L. Characterising Social-Ecological Drivers of Landuse/Cover Change in a Complex Transboundary Basin Using Singular or Ensemble Machine Learning. Remote Sens. Appl. Soc. Environ. 2022, 27, 100773. [Google Scholar] [CrossRef]
  21. Li, B.; Yang, Z.; Cai, Y.; Xie, Y.; Guo, H.; Wang, Y.; Zhang, P.; Li, B.; Jia, Q.; Huang, Y.; et al. Prediction and Valuation of Ecosystem Service Based on Land Use/Land Cover Change: A Case Study of the Pearl River Delta. Ecol. Eng. 2022, 179, 106612. [Google Scholar] [CrossRef]
  22. Qiu, J.; Huang, T.; Yu, D. Evaluation and Optimization of Ecosystem Services under Different Land Use Scenarios in a Semiarid Landscape Mosaic. Ecol. Indic. 2022, 135, 108516. [Google Scholar] [CrossRef]
  23. Xiang, S.; Wang, Y.; Deng, H.; Yang, C.; Wang, Z.; Gao, M. Response and Multi-Scenario Prediction of Carbon Storage to Land Use/Cover Change in the Main Urban Area of Chongqing, China. Ecol. Indic. 2022, 142, 109205. [Google Scholar] [CrossRef]
  24. Yang, T.; Zhou, K.; Zhang, C. Spatiotemporal Patterns and Influencing Factors of Green Development Efficiency in China’s Urban Agglomerations. Sustain. Cities Soc. 2022, 85, 104069. [Google Scholar] [CrossRef]
  25. Zhang, X.; Ren, W.; Peng, H. Urban Land Use Change Simulation and Spatial Responses of Ecosystem Service Value under Multiple Scenarios: A Case Study of Wuhan, China. Ecol. Indic. 2022, 144, 109526. [Google Scholar] [CrossRef]
  26. Chen, Y.; Chen, Z.; Xu, G.; Tian, Z. Built-up Land Efficiency in Urban China: Insights from the General Land Use Plan (2006–2020). Habitat Int. 2016, 51, 31–38. [Google Scholar] [CrossRef]
  27. Zhou, X.; Wu, D.; Li, J.; Liang, J.; Zhang, D.; Chen, W. Cultivated Land Use Efficiency and Its Driving Factors in the Yellow River Basin, China. Ecol. Indic. 2022, 144, 109411. [Google Scholar] [CrossRef]
  28. Chu, M.; Lu, J.; Sun, D. Influence of Urban Agglomeration Expansion on Fragmentation of Green Space: A Case Study of Beijing-Tianjin-Hebei Urban Agglomeration. Land 2022, 11, 275. [Google Scholar] [CrossRef]
  29. Chen, Y.; Shu, B.; Zhang, R.; Amani-Beni, M. LST Determination of Different Urban Growth Patterns: A Modeling Procedure to Identify the Dominant Spatial Metrics. Sustain. Cities Soc. 2023, 92, 104459. [Google Scholar] [CrossRef]
  30. Booker, K.; White, I.; Fu, X.; Wilson, M. Modelling Urban Growth for Long-Term Planning under Future Climate Uncertainty: A Systematic Review and Decision Pathway. Cities 2025, 167, 106310. [Google Scholar] [CrossRef]
  31. Verstegen, J.A.; van der Laan, C.; Dekker, S.C.; Faaij, A.P.C.; Santos, M.J. Recent and Projected Impacts of Land Use and Land Cover Changes on Carbon Stocks and Biodiversity in East Kalimantan, Indonesia. Ecol. Indic. 2019, 103, 563–575. [Google Scholar] [CrossRef]
  32. Magesh, N.S.; Chandrasekar, N. Driving Forces behind Land Transformations in the Tamiraparani Sub-Basin, South India. Remote Sens. Appl. Soc. Environ. 2017, 8, 12–19. [Google Scholar] [CrossRef]
  33. Puertas, O.L.; Henríquez, C.; Meza, F.J. Assessing Spatial Dynamics of Urban Growth Using an Integrated Land Use Model. Application in Santiago Metropolitan Area, 2010–2045. Land Use Policy 2014, 38, 415–425. [Google Scholar] [CrossRef]
  34. Wang, J.; Chen, J.; Wen, Y.; Fan, W.; Liu, Q.; Tarolli, P. Monitoring the Coastal Wetlands Dynamics in Northeast Italy from 1984 to 2016. Ecol. Indic. 2021, 129, 107906. [Google Scholar] [CrossRef]
  35. Zhang, S.; Zhang, R.; Guo, D.; Han, Y.; Song, G.; Yang, F.; Chen, Y. Molecular Mechanism of Pulmonary Diseases Caused by Exposure to Urban PM2.5 in Chengdu-Chongqing Economic Circle, China. Environ. Int. 2022, 165, 107292. [Google Scholar] [CrossRef] [PubMed]
  36. Yang, X.; Chen, X.; Qiao, F.; Che, L.; Pu, L. Layout Optimization and Multi-Scenarios for Land Use: An Empirical Study of Production-Living-Ecological Space in the Lanzhou-Xining City Cluster, China. Ecol. Indic. 2022, 145, 109577. [Google Scholar] [CrossRef]
  37. Wang, D.; Fu, J.; Jiang, D. Optimization of Production–Living–Ecological Space in National Key Poverty-Stricken City of Southwest China. Land 2022, 11, 411. [Google Scholar] [CrossRef]
  38. Tan, S.; Xie, D.; Ni, C.; Zhao, G.; Shao, J.; Chen, F.; Ni, J. Spatiotemporal Characteristics of Air Pollution in Chengdu-Chongqing Urban Agglomeration (CCUA) in Southwest, China: 2015–2021. J. Environ. Manag. 2023, 325, 116503. [Google Scholar] [CrossRef] [PubMed]
  39. Yang, L.; Lu, Y.; Cao, M.; Wang, R.; Chen, J. Assessing Accessibility to Peri-urban Parks Considering Supply, Demand, and Traffic Conditions. Landsc. Urban Plan. 2025, 257, 105313. [Google Scholar] [CrossRef]
  40. He, J.; Hu, S. Ecological Efficiency and Its Determining Factors in an Urban Agglomeration in China: The Chengdu-Chongqing Urban Agglomeration. Urban Clim. 2022, 41, 101071. [Google Scholar] [CrossRef]
  41. Liu, X.; Tian, G.; Feng, J.; Wang, J.; Kong, L. Assessing Summertime Urban Warming and the Cooling Efficacy of Adaptation Strategy in the Chengdu-Chongqing Metropolitan Region of China. Sci. Total Environ. 2018, 610–611, 1092–1102. [Google Scholar] [CrossRef]
  42. Luo, T.; Zeng, J.; Chen, W.; Wang, Y.; Gu, T.; Huang, C. Ecosystem Services Balance and Its Influencing Factors Detection in China: A Case Study in Chengdu-Chongqing Urban Agglomerations. Ecol. Indic. 2023, 151, 110330. [Google Scholar] [CrossRef]
  43. Yang, J.; Huang, X. 30 m Annual Land Cover and Its Dynamics in China from 1990 to 2019. Earth Syst. Sci. Data Discuss. 2021, 2021, 1–29. [Google Scholar] [CrossRef]
  44. Wang, M.; Jiang, Z.; Li, T.; Yang, Y.; Jia, Z. Analysis on Absolute Conflict and Relative Conflict of Land Use in Xining Metropolitan Area under Different Scenarios in 2030 by PLUS and PFCI. Cities 2023, 137, 104314. [Google Scholar] [CrossRef]
  45. Zhang, Y.; Yu, P.; Tian, Y.; Chen, H.; Chen, Y. Exploring the Impact of Integrated Spatial Function Zones on Land Use Dynamics and Ecosystem Services Tradeoffs Based on a Future Land Use Simulation (FLUS) Model. Ecol. Indic. 2023, 150, 110246. [Google Scholar] [CrossRef]
  46. Zhu, K.; Cheng, Y.; Zang, W.; Zhou, Q.; El Archi, Y.; Mousazadeh, H.; Kabil, M.; Csobán, K.; Dávid, L.D. Multiscenario Simulation of Land-Use Change in Hubei Province, China Based on the Markov-FLUS Model. Land 2023, 12, 744. [Google Scholar] [CrossRef]
  47. Domingo, D.; Palka, G.; Hersperger, A.M. Effect of Zoning Plans on Urban Land-Use Change: A Multi-Scenario Simulation for Supporting Sustainable Urban Growth. Sustain. Cities Soc. 2021, 69, 102833. [Google Scholar] [CrossRef]
  48. Liu, X.; Liang, X.; Li, X.; Xu, X.; Ou, J.; Chen, Y.; Li, S.; Wang, S.; Pei, F. A Future Land Use Simulation Model (FLUS) for Simulating Multiple Land Use Scenarios by Coupling Human and Natural Effects. Landsc. Urban Plan. 2017, 168, 94–116. [Google Scholar] [CrossRef]
  49. Wu, J.; Zhang, D.; Wang, H.; Li, X. What Is the Future for Production-Living-Ecological Spaces in the Greater Bay Area? A Multi-Scenario Perspective Based on DEE. Ecol. Indic. 2021, 131, 108171. [Google Scholar] [CrossRef]
  50. Wang, Q.; Ren, Q.; Liu, J. Identification and Apportionment of the Drivers of Land Use Change on a Regional Scale: Unbiased Recursive Partitioning-Based Stochastic Model Application. Agric. Ecosyst. Environ. 2016, 217, 99–110. [Google Scholar] [CrossRef]
  51. Mohammad, P.; Goswami, A.; Chauhan, S.; Nayak, S. Machine Learning Algorithm Based Prediction of Land Use Land Cover and Land Surface Temperature Changes to Characterize the Surface Urban Heat Island Phenomena over Ahmedabad City, India. Urban Clim. 2022, 42, 101116. [Google Scholar] [CrossRef]
  52. Zhang, D.; Wang, X.; Qu, L.; Li, S.; Lin, Y.; Yao, R.; Zhou, X.; Li, J. Land Use/Cover Predictions Incorporating Ecological Security for the Yangtze River Delta Region, China. Ecol. Indic. 2020, 119, 106841. [Google Scholar] [CrossRef]
  53. Park, S.; Jeon, S.; Kim, S.; Choi, C. Prediction and Comparison of Urban Growth by Land Suitability Index Mapping Using GIS and RS in South Korea. Landsc. Urban Plan. 2011, 99, 104–114. [Google Scholar] [CrossRef]
  54. Tian, G.; Ma, B.; Xu, X.; Liu, X.; Xu, L.; Liu, X.; Xiao, L.; Kong, L. Simulation of Urban Expansion and Encroachment Using Cellular Automata and Multi-Agent System Model—A Case Study of Tianjin Metropolitan Region, China. Ecol. Indic. 2016, 70, 439–450. [Google Scholar] [CrossRef]
  55. Tian, G.; Ouyang, Y.; Quan, Q.; Wu, J. Simulating Spatiotemporal Dynamics of Urbanization with Multi-Agent Systems—A Case Study of the Phoenix Metropolitan Region, USA. Ecol. Modell. 2011, 222, 1129–1138. [Google Scholar] [CrossRef]
  56. Chen, Y.; Yu, B.; Su, B.; Yang, L.; Wang, R. Exploring the Spatiotemporal Patterns and Correlates of Urban Vitality: Temporal and Spatial Heterogeneity. Sust. Cities Soc. 2023, 91, 104440. [Google Scholar] [CrossRef]
  57. Cemiloglu, A.; Zhu, L.; Mohammednour, A.B.; Azarafza, M.; Nanehkaran, Y.A. Landslide Susceptibility Assessment for Maragheh County, Iran, Using the Logistic Regression Algorithm. Land 2023, 12, 1397. [Google Scholar] [CrossRef]
  58. Yang, L.; Ao, Y.; Ke, J.; Lu, Y.; Liang, Y. To Walk or not to Walk? Examining Non-linear Effects of Streetscape Greenery on Walking Propensity of Older Adults. J. Transp. Geogr. 2021, 94, 103099. [Google Scholar] [CrossRef]
  59. Yang, L.; Liu, J.; Lu, Y.; Ao, Y.; Guo, Y.; Huang, W.; Zhao, R.; Wang, R. Global and Local Associations Between Urban Greenery and Travel Propensity of Older Adults in Hong Kong. Sust. Cities Soc. 2020, 63, 102442. [Google Scholar] [CrossRef]
  60. Feng, D.; Bao, W.; Fu, M.; Zhang, M.; Sun, Y. Current and Future Land Use Characters of a National Central City in Eco-Fragile Region—A Case Study in Xi’an City Based on FLUS Model. Land 2021, 10, 286. [Google Scholar] [CrossRef]
  61. Zhao, L.; Liu, X.; Xu, X.; Liu, C.; Chen, K. Three-Dimensional Simulation Model for Synergistically Simulating Urban Horizontal Expansion and Vertical Growth. Remote Sens. 2022, 14, 1503. [Google Scholar] [CrossRef]
  62. Zhang, D.; Liu, X.; Lin, Z.; Zhang, X.; Zhang, H. The Delineation of Urban Growth Boundaries in Complex Ecological Environment Areas by Using Cellular Automata and a Dual-Environmental Evaluation. J. Clean. Prod. 2020, 256, 120361. [Google Scholar] [CrossRef]
  63. Zhang, D.; Liu, X.; Wu, X.; Yao, Y.; Wu, X.; Chen, Y. Multiple Intra-Urban Land Use Simulations and Driving Factors Analysis: A Case Study in Huicheng, China. GISci. Remote Sens. 2019, 56, 282–308. [Google Scholar] [CrossRef]
  64. Zhao, Y.; Gao, Y. Spatial Patterns and Trends of Inter-City Population Mobility in China—Based on Baidu Migration Big Data. Cities 2024, 151, 105124. [Google Scholar] [CrossRef]
  65. Gu, X.; Tang, X.; Chen, T.; Liu, X. Predicting the Network Shift of Large Urban Agglomerations in China Using the Deep-Learning Gravity Model: A Perspective of Population Migration. Cities 2024, 145, 104680. [Google Scholar] [CrossRef]
  66. Gong, Q.; Guo, G.; Li, S.; Liang, X. Decoupling of Urban Economic Growth and Water Consumption in Chongqing and Chengdu from the “Production-Living-Ecological” Perspective. Sustain. Cities Soc. 2021, 75, 103395. [Google Scholar] [CrossRef]
  67. He, C.; Okada, N.; Zhang, Q.; Shi, P.; Li, J. Modelling Dynamic Urban Expansion Processes Incorporating a Potential Model with Cellular Automata. Landsc. Urban Plan. 2008, 86, 79–91. [Google Scholar] [CrossRef]
  68. Li, W.; Wang, Y.; Xie, S.; Cheng, X. Coupling Coordination Analysis and Spatiotemporal Heterogeneity between Urbanization and Ecosystem Health in Chongqing Municipality, China. Sci. Total Environ. 2021, 791, 148311. [Google Scholar] [CrossRef] [PubMed]
  69. Chen, W.; Zhao, H.; Li, J.; Zhu, L.; Wang, Z.; Zeng, J. Land Use Transitions and the Associated Impacts on Ecosystem Services in the Middle Reaches of the Yangtze River Economic Belt in China Based on the Geo-Informatic Tupu Method. Sci. Total Environ. 2020, 701, 134690. [Google Scholar] [CrossRef]
  70. Wen, X.; Wang, J.; Han, X. Impact of Land Use Evolution on the Value of Ecosystem Services in the Returned Farmland Area of the Loess Plateau in Northern Shaanxi. Ecol. Indic. 2024, 163, 112119. [Google Scholar] [CrossRef]
  71. Zhang, Y.; Yang, Z.; Liu, F.; Xu, M.; Zhang, J. Impact of the Project of Returning Farmland to Forest on Promoting Forest Coverage Rates in Mountainous Areas: An Empirical Analysis Based on Remote Sensing in Yunnan. Forests 2024, 15, 1956. [Google Scholar] [CrossRef]
  72. Le, Q.; Park, S.J.; Vlek, P.L.G.; Cremers, A.B. Land-Use Dynamic Simulator (LUDAS): A Multi-Agent System Model for Simulating Spatio-Temporal Dynamics of Coupled Human–Landscape System. I. Structure and Theoretical Specification. Ecol. Inform. 2008, 3, 135–153. [Google Scholar] [CrossRef]
  73. Jokar Arsanjani, J.; Helbich, M.; Kainz, W.; Darvishi Boloorani, A. Integration of Logistic Regression, Markov Chain and Cellular Automata Models to Simulate Urban Expansion. Int. J. Appl. Earth Obs. Geoinf. 2013, 21, 265–275. [Google Scholar] [CrossRef]
  74. Wang, Y.; Li, X.; Zhang, Q.; Li, J.; Zhou, X. Projections of Future Land Use Changes: Multiple Scenarios-Based Impacts Analysis on Ecosystem Services for Wuhan City, China. Ecol. Indic. 2018, 94, 430–445. [Google Scholar] [CrossRef]
  75. Sheng, S.; Huang, J. Spatiotemporal Dynamics and Driving Mechanisms of Ecosystem Services in the Beijing–Tianjin–Hebei Urban Agglomeration: Implications for Sustainable Land Use Planning. Land 2025, 14, 969. [Google Scholar] [CrossRef]
  76. Anand, J.; Gosain, A.K.; Khosa, R. Prediction of Land Use Changes Based on Land Change Modeler and Attribution of Changes in the Water Balance of Ganga Basin to Land Use Change Using the SWAT Model. Sci. Total Environ. 2018, 644, 503–519. [Google Scholar] [CrossRef] [PubMed]
  77. Halmy, M.W.A.; Gessler, P.E.; Hicke, J.A.; Salem, B.B. Land Use/Land Cover Change Detection and Prediction in the North-Western Coastal Desert of Egypt Using Markov-CA. Appl. Geogr. 2015, 63, 101–112. [Google Scholar] [CrossRef]
  78. Mas, J.; Kolb, M.; Paegelow, M.; Camacho Olmedo, M.T.; Houet, T. Inductive Pattern-Based Land Use/Cover Change Models: A Comparison of Four Software Packages. Environ. Model. Softw. 2014, 51, 94–111. [Google Scholar] [CrossRef]
  79. Liu, X.; Wei, M.; Li, Z.; Zeng, J. Multi-Scenario Simulation of Urban Growth Boundaries with an ESP-FLUS Model: A Case Study of the Min Delta Region, China. Ecol. Indic. 2022, 135, 108538. [Google Scholar] [CrossRef]
  80. Yang, X.; Bai, Y.; Che, L.; Qiao, F.; Xie, L. Incorporating Ecological Constraints into Urban Growth Boundaries: A Case Study of Ecologically Fragile Areas in the Upper Yellow River. Ecol. Indic. 2021, 124, 107436. [Google Scholar] [CrossRef]
  81. Wang, P.; Li, R.; Liu, D.; Wu, Y. Dynamic Characteristics and Responses of Ecosystem Services under Land Use/Land Cover Change Scenarios in the Huangshui River Basin, China. Ecol. Indic. 2022, 144, 109539. [Google Scholar] [CrossRef]
  82. Liang, X.; Guan, Q.; Clarke, K.C.; Liu, S.; Wang, B.; Yao, Y. Understanding the Drivers of Sustainable Land Expansion Using a Patch-Generating Land Use Simulation (PLUS) Model: A Case Study in Wuhan, China. Comput. Environ. Urban Syst. 2021, 85, 101569. [Google Scholar] [CrossRef]
  83. Wang, Z.; Liu, S.; Li, J.; Pan, C.; Wu, J.; Ran, J.; Su, Y. Remarkable Improvement of Ecosystem Service Values Promoted by Land Use/Land Cover Changes on the Yungui Plateau of China during 2001–2020. Ecol. Indic. 2022, 142, 109303. [Google Scholar] [CrossRef]
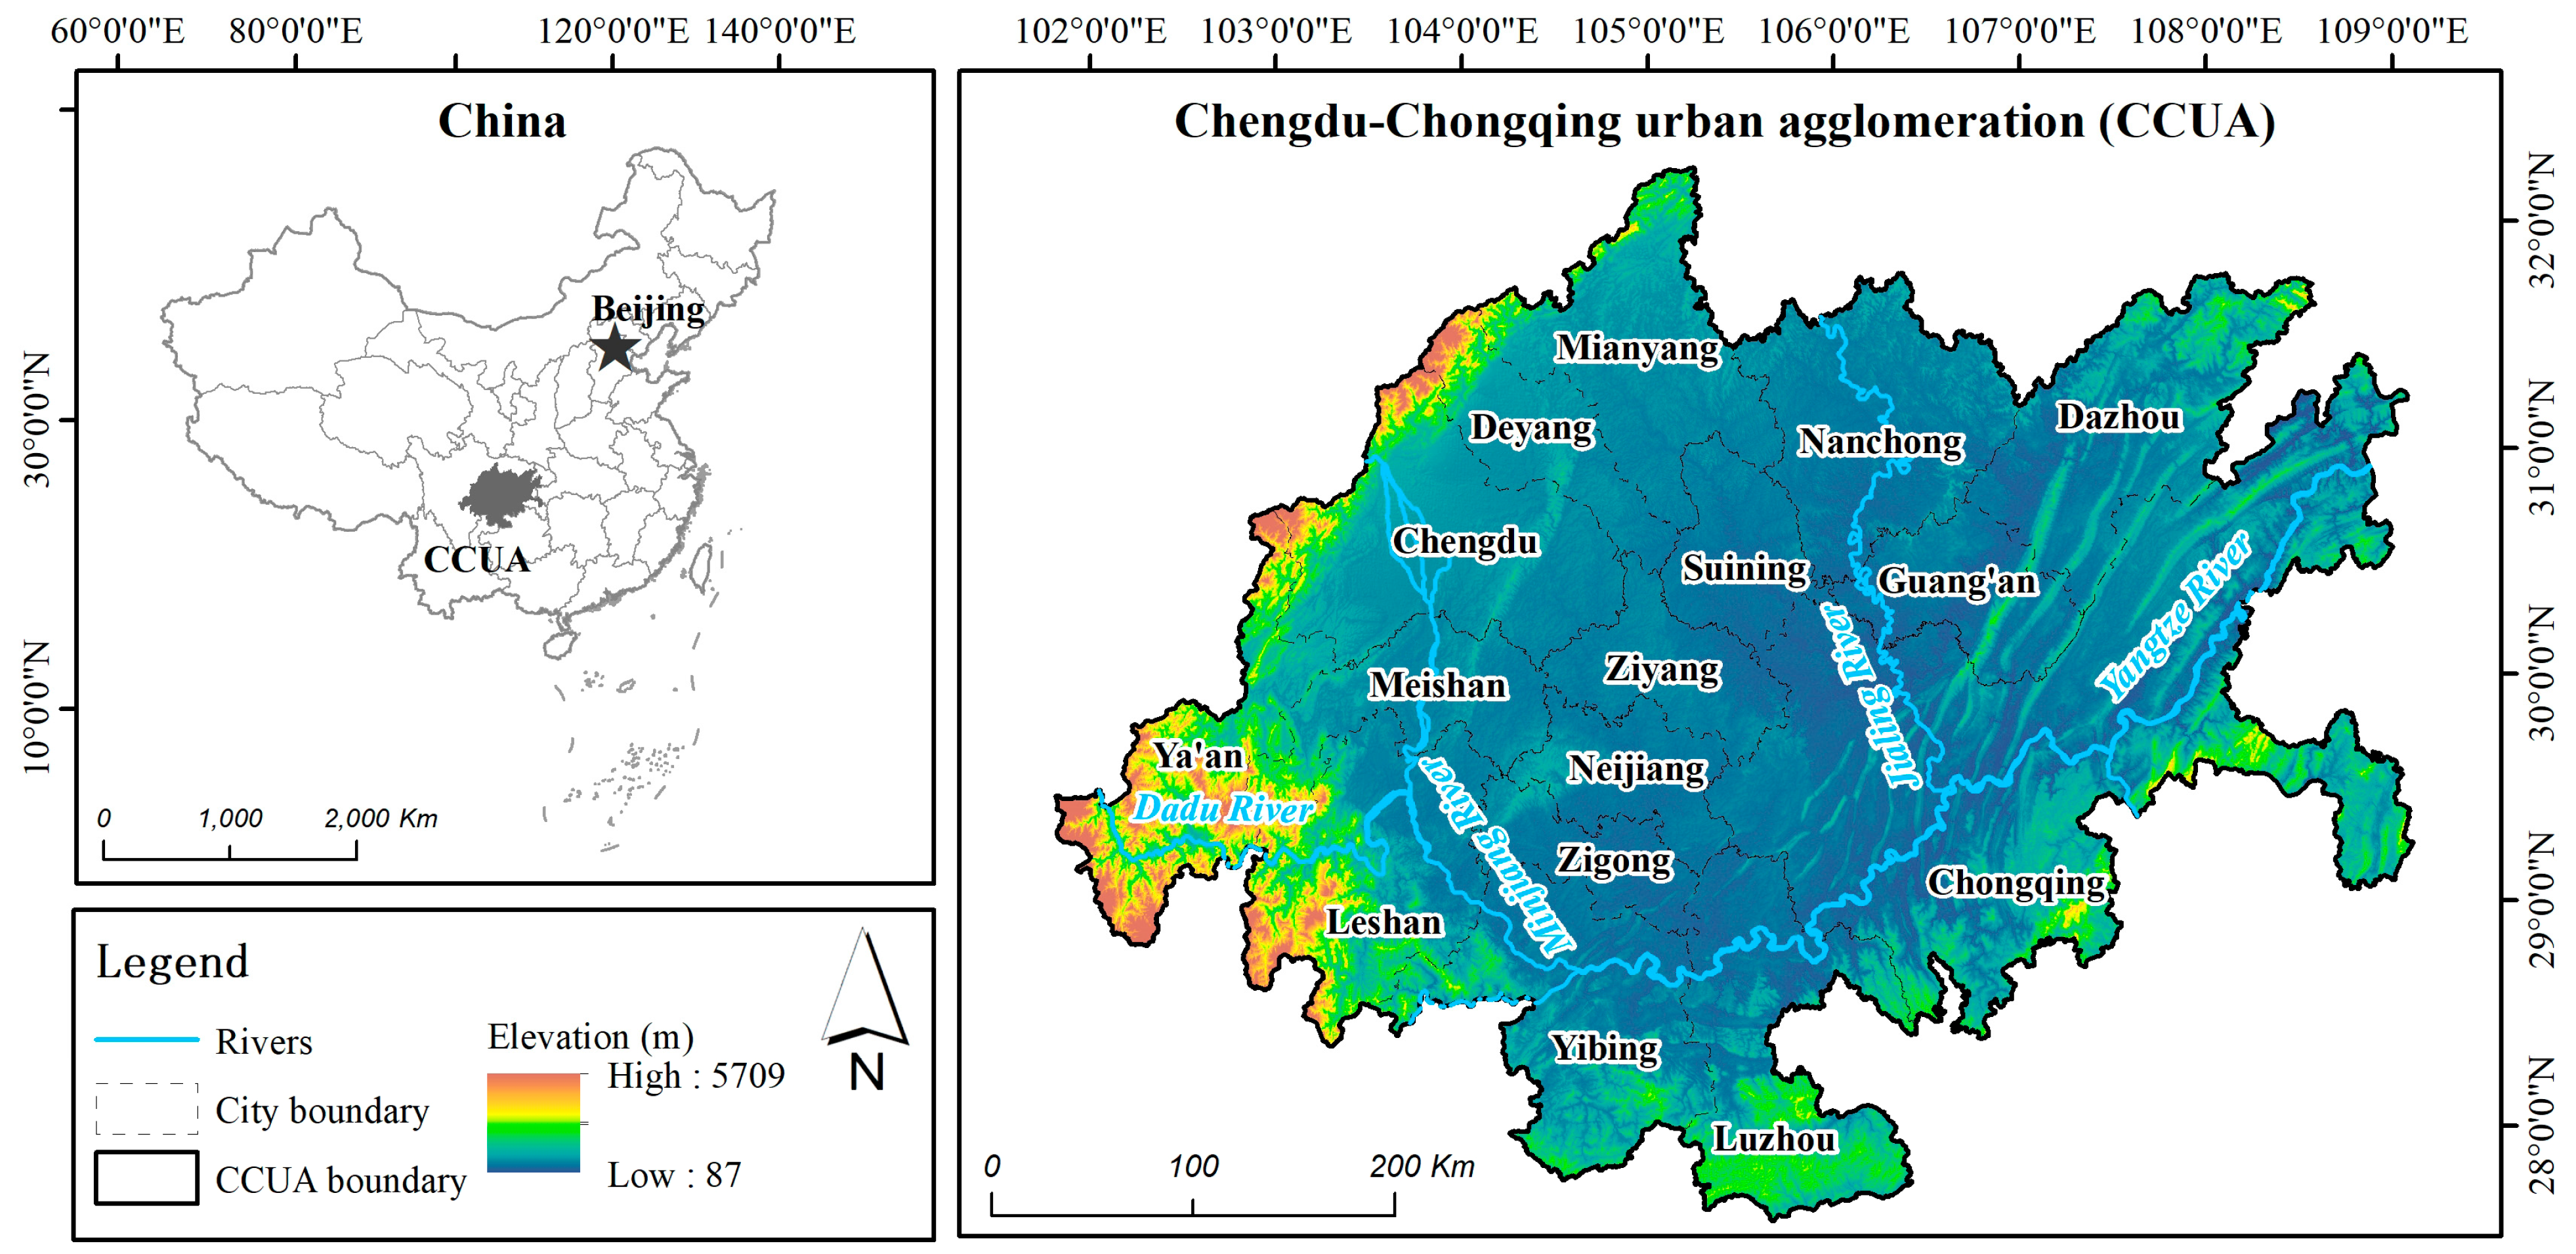
Figure 1. Location of the CCUA.
Land 14 01787 g001
Figure 2. Study flowchart.
Land 14 01787 g002
Figure 3. Factors driving LULC in the CCUA. (a) Elevation, (b) Slope, (c) Aspect, (d) Mean annual temperature, (e) Mean annual precipitation, (f) Mean annual wind speed, (g) Distance from the central city, (h) Distance from railroad, (i) Distance from highway, (j) Distance from river, (k) Population density, (l) GDP, (m) Ecosystem services, (n) NDVI.
Land 14 01787 g003
Figure 4. LULC in the CCUA from 1985 to 2019. (a) 1985, (b) 1995, (c) 2005, (d) 2015, and (e) 2019. Colors in the maps correspond to land-use categories: red = construction land, yellow = cultivated land, green = forest land, light green = grassland, gray = unused land, and blue = water area. The pie charts show the proportion of each LULC type in the corresponding year.
Land 14 01787 g004
Figure 5. Land use transfer matrix and major conversion flows from 1985 to 2019 in the CCUA. (a) 1985–1995, (b) 1995–2005, (c) 2005–2015, (d) 2015–2019, and (e) 1985–2019. Cultivated land is represented by ‘i’, forest land by ‘ii’, grassland by ‘iii’, water area by ‘iv’, construction land by ‘v’, and unused land by ‘vi’. The transition from cultivated land to forest land is represented by ‘i–ii’, and so on.
Land 14 01787 g005
Figure 6. The three scenario predictions of LULC in 2025 and 2035. (a) NDS in 2025, (b) EDS in 2025, (c) ECPS in 2025, (d) NDS in 2035, (e) EDS in 2035, and (f) ECPS in 2035. Colors in the maps correspond to land-use categories: red = construction land, yellow = cultivated land, green = forest land, light green = grassland, gray = unused land, and blue = water area. The pie charts show the proportion of each LULC type in the corresponding year.
Land 14 01787 g006
Figure 7. Chord diagrams illustrating LULC transitions between 2015 and 2035 under three different scenarios. (ac) Predicted LULC in 2025 under NDS, EDS, and ECPS; (df) Area percentages of each LULC type in 2025; (gi) Predicted LULC in 2035 under NDS, EDS, and ECPS; (jl) Area percentages of each LULC type in 2035. The arcs of varying colors represent the percentage of the area occupied by different LULC types. When the chord and the arc are the same color, it indicates that the land use has been transferred in. If they are different colors, it indicates that the land use has been transferred out.
Land 14 01787 g007
Figure 8. Temporal changes in LULC types in the CCUA from 1985 to 2019. Colors in the maps correspond to land-use categories: red = construction land, yellow = cultivated land, green = forest land, light green = grassland, gray = unused land, and blue = water area. Note that the proportion of unused land is extremely small (<0.1%), making the gray bars almost invisible in the figure.
Land 14 01787 g008
Table 1. Summary of datasets used in this study.
Data TypeSourceYearsResolutionUsage
LULCChina Land Cover Dataset [43]1985, 1995, 2005, 2015, 201930 m (resampled to 1 km)LULC evolution; scenario inputs
Digital Elevation Model (DEM)Geospatial Data Cloud (http://www.gscloud.cn/)Product V330 mElevation, slope, and aspect derivation
Climate data (temperature, precipitation)Resources and Environmental Sciences Data platform (RESDC)
(doi: 10.12078/2017121301)
2005, 2015, 20191 kmEnvironmental drivers
Socioeconomic data (GDP, population)RESDC
(doi: 10.12078/201712110;
doi: 10.12078/2017121102)
2005, 2015, 20191 kmSocioeconomic drivers
Locational factors (distance from central city/rail/highway/river)Derived in ArcMap (Version 10.5)Matching above1 kmAccessibility/location drivers
Table 4. LULC transition matrix in the CCUA region from 1985 to 2019 (km2).
LULC Types2019
Cultivated LandForest
Land
GrasslandWater
Area
Construction
Land
Unused LandTotal
1985Cultivated land107,538.1912,893.59111.51532.924085.605.00125,166.81
Forest land8533.2445,331.30164.3712.1637.0054,078.07
Grassland232.37940.35648.7520.0715.0012.271868.82
Water area253.6866.264.611765.5185.783.002178.84
Construction land28.00216.471006.561251.03
Unused land1.008.7611.441.9719.5842.74
Total116,586.4859,231.50938.012558.565231.9139.85184,586.31
Notes: Bold numbers indicate areas that remained unchanged within each LULC type, while non-bold values indicate conversions between different types.
Table 5. Logistic regression results of driving factors in 2019.
Driving FactorsCultivated LandForest LandGrasslandWater AreaConstruction LandUnused Land
β 1Exp
(β)
Std. Errorβ 1Exp
(β)
Std. Errorβ 1Exp
(β)
Std. Errorβ 1Exp
(β)
Std. Errorβ 1Exp
(β)
Std. Errorβ 1Exp
(β)
Std. Error
Elevation−0.318 0.7280.020−0.3010.7400.0190.1831.2000.034−1.1140.3280.0890.8722.3910.069
Slope−0.6490.5230.0100.6071.8350.0100.1391.1490.0290.4161.5160.037−0.3260.7220.041
Aspect−0.0860.9180.0060.1101.1160.007−0.1050.9000.035−0.2140.8070.022−0.0680.9340.018
Annual precipitation−0.3360.7150.0070.2371.2670.008−0.3110.7330.044−0.1910.8260.0280.1581.1720.021
Mean annual wind speed−0.1840.8320.014−0.2580.7720.0140.4771.6120.038−0.2560.7740.052−0.4140.6610.045
Mean annual temperature1.0202.7740.014−1.5450.2130.015−0.3960.6730.0370.8502.3400.0441.4384.2120.062−1.5510.2120.140
Distance from the central city−0.0760.9260.0070.1131.1190.007−0.7530.4710.027
Distance from highway −0.0960.9090.0060.1011.1060.007−0.2710.7630.038−0.2400.7870.021
Distance from railroad −0.0870.9160.0060.0381.0380.0070.1081.1140.022−0.1420.8680.022
Distance from river0.0401.0410.007−0.0360.9640.0070.2591.2960.048−0.6170.5400.037−0.1330.8760.025
GDP−0.3160.7290.011−0.4620.6300.037−0.3520.7030.0470.2481.2820.0130.1371.1470.074
NDVI0.0891.0920.0080.9042.4690.013−0.2580.7730.029−0.4230.6550.017−0.7870.4550.013
Ecosystem services−0.1560.8550.0050.1611.1740.0070.1671.1820.0370.1621.1760.010−0.0640.9380.011
Constant0.4211.5230.007−1.0440.3520.008−6.5900.0010.065−5.4210.0040.048−5.0840.0060.039−12.5820.0000.775
ROC0.8430.8880.9330.8180.9010.923
Notes: 1 β coefficients significant at 0.05 level. The corresponding Exp(β) values share the same significance. “−” represents no significance.
Table 6. Area (km2) and proportion (%) of LULC in multi-scenario predictions for 2025 and 2035.
LULC20252035
NDSEDSECPSNDSEDSECPS
Area (km2)Proportion
(%)
Area (km2)Proportion
(%)
Area (km2)Proportion
(%)
Area (km2)Proportion
(%)
Area (km2)Proportion
(%)
Area (km2)Proportion
(%)
Cultivated land117,494.4663.65116,901.3463.33117,520.1263.67116,740.9963.24115,786.0262.73116,687.5363.22
Forest land58,259.0331.5658,257.5731.5658,258.7831.5658,855.9231.8958,859.1231.8958,856.3431.89
Grassland1031.950.561031.950.561031.950.561028.950.561028.950.561028.950.56
Water area3076.741.673076.441.673076.381.673573.371.943573.141.943573.371.94
Construction land4699.542.555293.492.874674.492.534362.492.365314.492.884415.542.39
Unused land24.580.0125.510.0124.580.0124.580.0124.580.0124.580.01
Total area184,586.31100.00184,586.31100.00184,586.31100.00184,586.31100.00184,586.31100.00184,586.31100.00
Disclaimer/Publisher’s Note: The statements, opinions and data contained in all publications are solely those of the individual author(s) and contributor(s) and not of MDPI and/or the editor(s). MDPI and/or the editor(s) disclaim responsibility for any injury to people or property resulting from any ideas, methods, instructions or products referred to in the content.