Article

Identifying Drivers of Wetland Damage and Their Impact on Primary Productivity Dynamics in a Mid-High Latitude Region of China

1
Northeast Institute of Geography and Agroecology, Chinese Academy of Sciences, Changchun 130102, China
2
School of Geographical Sciences and Tourism, Jilin Normal University, Siping 136000, China
*
Author to whom correspondence should be addressed.
Land 2025, 14(9), 1770; https://doi.org/10.3390/land14091770
Submission received: 6 August 2025 / Revised: 23 August 2025 / Accepted: 26 August 2025 / Published: 30 August 2025
(This article belongs to the Section Land Use, Impact Assessment and Sustainability)

Abstract

Wetlands located in mid-to-high latitudes have undergone significant changes in recent years, compromising their patterns and functions. To understand these alterations in wetland functions, it is crucial to identify the patterns of wetland degradation and the mechanisms based on the conceptual framework of “pattern-process-function.” Our study developed a wetland damage index to analyze changes by calculating the wetland decline rate, remote sensing ecological index, and human pressure index from remote sensing images. We utilized the geographic detectors model to conduct a quantitative analysis of the driving mechanisms. Furthermore, we applied the coupling coordination model to evaluate the relationship between wetland damage and functional changes in the Greater Khingan region. The findings revealed that the wetland damage index increased by 9.86% during 2000–2023, with the damage concentrated in the central area of the study region. The primary explanatory factor for wetland damage was soil temperature during 2000–2010, but population density had become the dominant factor by 2023. The interactive explanatory power of soil temperature and population density on wetland damage was relatively high in the early stage, while the interactive explanatory power of surface temperature and population density on wetland damage was the highest in the later stage. The coupling coordination degree between the Wetland Damage Index (WDI) and Net Primary Productivity (NPP) significantly increased during 2010–2023, rising from 0.19 to 0.23. The increase in the coupling coordination degree between the WDI and Gross Primary Productivity (GPP) exhibited a trend of gradual diffusion from the center to the edge. Our research offers a scientific basis for implementing wetland protection and restoration strategies in mid-to-high latitudes wetlands.

1. Introduction

Wetlands situated in mid-to-high latitudes comprise approximately 64% of the global natural wetlands area and are essential for maintaining regional ecological security with crucial ecological functions, such as water conservation, hydrological regulation, preservation of biodiversity and habitats, carbon sequestration, and climate regulation [1,2]. Wetlands are the most sensitive terrestrial ecosystems and are particularly vulnerable to damage from environmental factors and human activities, especially in mid-to-high latitudes [3,4]. Research into the emergence and loss of wetlands has been increasing due to their significance and the current threats they face, including wetland mapping [5,6,7], the evolution and driving forces of wetland landscape patterns [8,9,10], wetland structure and function changes [11], wetland species habitat changes, and wetland restoration and management [12,13]. The damage to wetland patterns and the alteration of their functions in mid-to-high latitudes underscore the importance of wetland evolution and ecological processes, thus necessitating significant attention.
Wetland damage is typically manifested through changes in wetland area, landscape, type, and function, which reflect the evolution of wetlands and their interaction with ecological processes [14,15]. Previous studies have applied the methods of ecological risk assessment [16] and vulnerability assessment [17] to exploring the ecological damage of wetlands [18]. Historical research has established a wetland risk index for assessing wetlands by calculating the hazard and vulnerability indices, which utilized land use, landscape, and remote sensing indices specific to the Zoige Wetland in China [19]. Landsat images and the Markov transition matrix have been utilized to analyze wetland damage and its correlation with urban development [18,20]. Previous studies utilized trend analysis to examine the damage to wetland vegetation, water, and soil moisture at various stages and constructed a remote sensing model for recognizing wetland damage [21]. Remote sensing interpretation, spatial analysis of geographic information systems, and landscape pattern indices were utilized to analyze changes and the extent of damage in wetland landscapes [22]. Most studies have focused on identifying wetland degradation from a single perspective, such as changes in wetland area, type, and landscape, with less attention paid to exploring the damage of mid-to-high latitude wetlands through a comprehensive consideration of changes in wetland area, the ecological environment, and human activities.
Various mechanisms of wetland damage exist across different regions. The direct driving factors included the physical mechanisms, material flows, and structural changes of wetlands, which have diverse impacts on different types of wetlands [23,24,25]. Indirect driving factors encompassed socio-economic elements such as land use and population, as well as natural elements (including temperature and precipitation) [26,27,28]. Historical studies have revealed the impact of climate change and human activities on the evolution of wetlands in Northeast China [29]; it was mainly related to the agricultural population, increased per capita GDP, and the decline in wetland landscape settlements in Northeast China’s Red River region after 1989 [30]. The dramatic loss of wetlands was largely associated with increased population in two areas of the northeastern United States [31]. Wetland damage was primarily due to the conversion of paddy fields and tidal flats into non-wetland areas in the Beijing–Tianjin–Hebei region of China [32]. Sea level rise was considered a major cause of damage to coastal wetlands, directly influenced by land use policies aimed at regional economic development in the Mekong Delta of Vietnam [33]. Quantitative analysis of the driving mechanisms behind wetland damage has been less prevalent in mid-high latitudes; however, it is significant for the protection and management of wetlands in these regions.
Wetlands in the mid-high latitudes have ecological functions [34]. Wetland damage was usually accompanied by vegetation community destruction or hydrological or soil condition changes, thus affecting function changes [35,36]. The assessment of functional changes was primarily based on sample surveys, remote sensing inversion, and model evaluation methods [37,38]. In these, sample measurement and remote sensing inversion were predominantly utilized to estimate functional changes across various scales [39]. Model evaluation methods increasingly focused on the importance of considering the impact of ecological processes on services [40]. A large number of models based on ecosystems, ecological processes, or empirical models have been used to assess carbon storage, such as (Social Values for Ecosystem Services, SolVES), (Multiscale Integrated Models of Ecosystem Services, MIMES), (Carbon Exchange in the Vegetation–Soil–Atmosphere System for Ecosystem Services, CEVSA-ES) and (Integrated Valuation of Ecosystem Services and Tradeoffs, InVEST) model [41,42]. Recent studies have focused more on the carbon sequestration function of wetlands in mid-to-high latitudes [43,44]. However, there has been less attention given to the dynamic changes in the primary productivity in these regions with wetland degradation.
The Greater Khingan Mountains region is located in the mid-high latitudes, and the wetlands have been damaged under environmental changes. Therefore, we selected this region as the study area to explore the following three scientific questions: 1) How to identify wetland damage by combining wetland structure and function; 2) How to conduct a quantitative driving mechanism for wetland damage process; and 3) Exploring the primary productivity dynamics with wetland damage in the Greater Khingan Mountains.

2. Materials and Methods

2.1. Materials

2.1.1. Study Area

The Greater Khingan Mountains region is the northernmost prefecture of China (50°10′ N–53°33′ N, 121°12′ E–127°00′ E), bordering the Lesser Khingan Mountains to the east, the Hulunbuir Grassland to the west, the fertile Songnen Plain to the south, and Russia to the north [45]. The study area mainly includes Mohe City, Tahe County, Huma County, and Oroqen Autonomous Banner (Figure 1) referring to the No. GS (2024) 0650 Administrative Division Data of China (Beijing Basic Geographic Information Center: China, Beijing, 2024). The Great Khingan Mountains exhibit a northeast-to-southwest orientation, contributing to the complex physiographic and geographic conditions of the study area, including topography, climate, hydrology, soil, and forest vegetation. The soil types primarily consist of brown coniferous forest soil, dark brown soil, meadow soil, coarse skeletal soil, and swamp soil. The coldest month is January at approximately −28 °C, and the warmest month is July at around 18 °C. Annual precipitation varies between 240 and 442 mm, predominantly occurring in July and August, which account for over 40% of the yearly total. The Greater Khingan Mountains region constitutes China’s largest forested area and serves as a crucial ecological security barrier in northern China, characterized by its typical climatic features. The intricate interplay between extensive hydrological features, characterized by a dense river network, and region-specific climatic dynamics fosters a wetland ecosystem exhibiting expansive geographical distribution, remarkable biodiversity, and sophisticated ecological complexity [46].

2.1.2. Data Sources and Processing

The datasets and their sources were shown in Table 1 in our study. The wetlands for 2000 and 2010 were extracted from land cover datasets with a resolution of 30 m. The 2023 land cover data were interpreted based on high-resolution imagery (Gaofen-2 and Gaofen-6), achieving an overall accuracy of 0.85. Remote Sensing Ecological Index (RSEI) was downloaded from the Google Earth Engine platform. Environmental factors relate to population density, roads and railways, elevation, temperature and precipitation data, surface temperature and humidity, soil temperature, etc. All raster data were resampled to a consistent spatial resolution of 500 m.

2.2. Methods

2.2.1. Constructing the Wetland Damage Index

We constructed the wetland damage index (WDI) through the wetland decline rate (W), Remote Sensing-based Ecological Index (RESI), and Human Pressure Index (HPI), referring to previous studies [47]. W was the absolute value of the percentage change of wetland area in the grid. W represents the absolute value of the percentage change of wetland area in the grid approximately every ten years. RESI was used to detect and analyze the temporal and spatial changes of regional ecological environment quality. HPI characterized the degree of human activity stress on wetlands and potentially measured the environmental stress on wetlands. We selected land use (construction land and farmland), population density, night lighting, roads, railways, and waterways to comprehensively assess the human footprint in the Greater Khingan Mountains, referring to previous studies [47]. Each indicator was assigned a score between 0 and 10 referring to relevant reference, with higher scores indicating more intense human activity [47]. We calculated the HPI for 2010, 2020, and 2023 in the Greater Khingan Mountains region.
We utilized W, RESI, and HPI to construct the Wetland Damage Index referring to the methods of identifying wetland damage [47]. The formula is as follows:
W D I T 1 = O P O P max = W 2 + H P I 2 + ( 1 R S E I ) 2 3 = ( W T 1 W T 0 ) 2 + H P I T1 2 + ( 1 R S E I T 1 ) 2 3
where T0 and T1 are the beginning and end of the period respectively. WT0 and WT1 are the proportion of wetland area in the grid at the beginning and end of the period, respectively. If the wetland area in the grid increases (WT1 > WT0) or remains unchanged (WT1 = WT0) for a period, WT1 WT0 is regarded as 0. HPIT1 is the disturbance of human activity at the end of the period. 1−RSEIT1 is the ecological environment status at the end of the period. This formula represents the damage status of wetlands, and the larger the WDI, the more damaged the wetland in the grid, and vice versa.

2.2.2. Spatial Autocorrelation Analysis

Spatial autocorrelation reflects the spatial aggregation trend or spatial heterogeneity of geographical phenomena. We used the Local Moran’s I index to investigate the spatial agglomeration characteristics of wetland damage. The formula for calculating the Local Moran’s I is:
I i = y i y ¯ 1 n y i y ¯ 2 j 1 n W i j y i y ¯
where I i is Local Moran’s I; W i j is the spatial weight value; n is the total number of research units; y i is the wetland damage rate of each research unit; y ¯ is the average wetland damage rate of all units.
Spatial autocorrelation significance was measured using standardized statistics, and the calculation formula was as follows:
Z ( I ) = I E ( I ) V ( I )
where, E(I) is the expected value of I; V(I) is the variance of I. According to the results of local Moran’s I and significance, the distribution of wetland damage rate would be divided into five spatial correlation patterns, namely “high-high” (H-H) cluster, “high-low” (H-L) cluster, “low-high” (L-H) cluster, “low-low” (L-L) cluster, and “non-significant” region, respectively, where H-H indicates that the WDI of the spatial grid and the surrounding grid were both high, and the risk of wetland damage was relatively high. L-L indicates that the WDI of the spatial grid and the surrounding grid were low, and the risk of wetland damage in these areas was low. L-H indicates that an area with a lower wetland damage degree was surrounded by an area with a high wetland damage degree. H-L indicated that an area with more severe wetland damage was surrounded by an area with less damage.

2.2.3. Geographic Detector

Single factor detection explains the extent to which the variables differ spatially. We analyzed the relative importance of each environmental factor for wetland damage through single factor detection of WDI and each driving factor layer in the Greater Khingan Mountains. The formula is as follows:
q = 1 1 n σ 2 h = 1 L n h σ h 2
where q is the explanation degree of driving factors for wetland damage, n is the number of regions, L is the total number of layers of driving factors, n h and σ2 are the sample size of layer h and the variance of wetlands in the Greater Khingan Mountains, respectively. The specific driving factors are shown in Table 2. The value range of q is [0, 1]. A larger value of q indicates that the independent variable X has a stronger explanatory power for attribute Y and vice versa [48,49].
Interaction detection was mainly used to assess whether two driving factors acting together increase or decrease the degree of explanation of wetland damage, or whether the driver factors’ influence on wetland damage was independent of each other (Table 3). We applied the factors’ interaction detection to investigate the interaction of driving factors of wetland damage.

2.2.4. Coupling Coordination Model

Coupling degree refers to the extent to which two or more interactions occur in a system. The degree of coordination is a quantitative elemental indicator that measures the coordination state or level of various elements in a system. This means that the coupling coordination degree not only considers the degree of interaction among the various elements in the system but also reflects the coordination level among the various elements in the system [50,51]. Based on the concept of coupling in physics, a coupling degree model was constructed.
C = 2 × U 1 × U 2 U 1 + U 2 2
where U is the comprehensive evaluation index of the subsystem; C represents the coupling degree; and the values of U and C are within the range of 0 to 1. In order to evaluate the coordination degree of the interactive coupling between WDI and NPP and GPP in the study area, the coupling coordination degree model is constructed as follows:
D = C × T
T = i = 1 n a i U i
where D represents the coupling coordination degree of the system; C represents the coupling degree of the system; T is the inter-system comprehensive coordination index, reflecting the contribution of the comprehensive development level of subsystems to the coordination degree; the total contribution of U i is made to system i ; and a i is an undetermined weight, reflecting the degree of importance of the system. The coupling coordination degree value D ∈ [0, 1]. When D = 1, the coupling coordination degree is the maximum, a benign resonant coupling is achieved within the system, and the system tends towards a new ordered structure. When D = 0, the coupling degree is extremely small, the system is in an independent state, and the system will develop disorderly [3,4]. The evaluation criteria for coupling coordination degree are shown in Table 4.

3. Results

3.1. Wetland Changes and Damage Identification

3.1.1. Spatio-Temporal Variation of Wetland

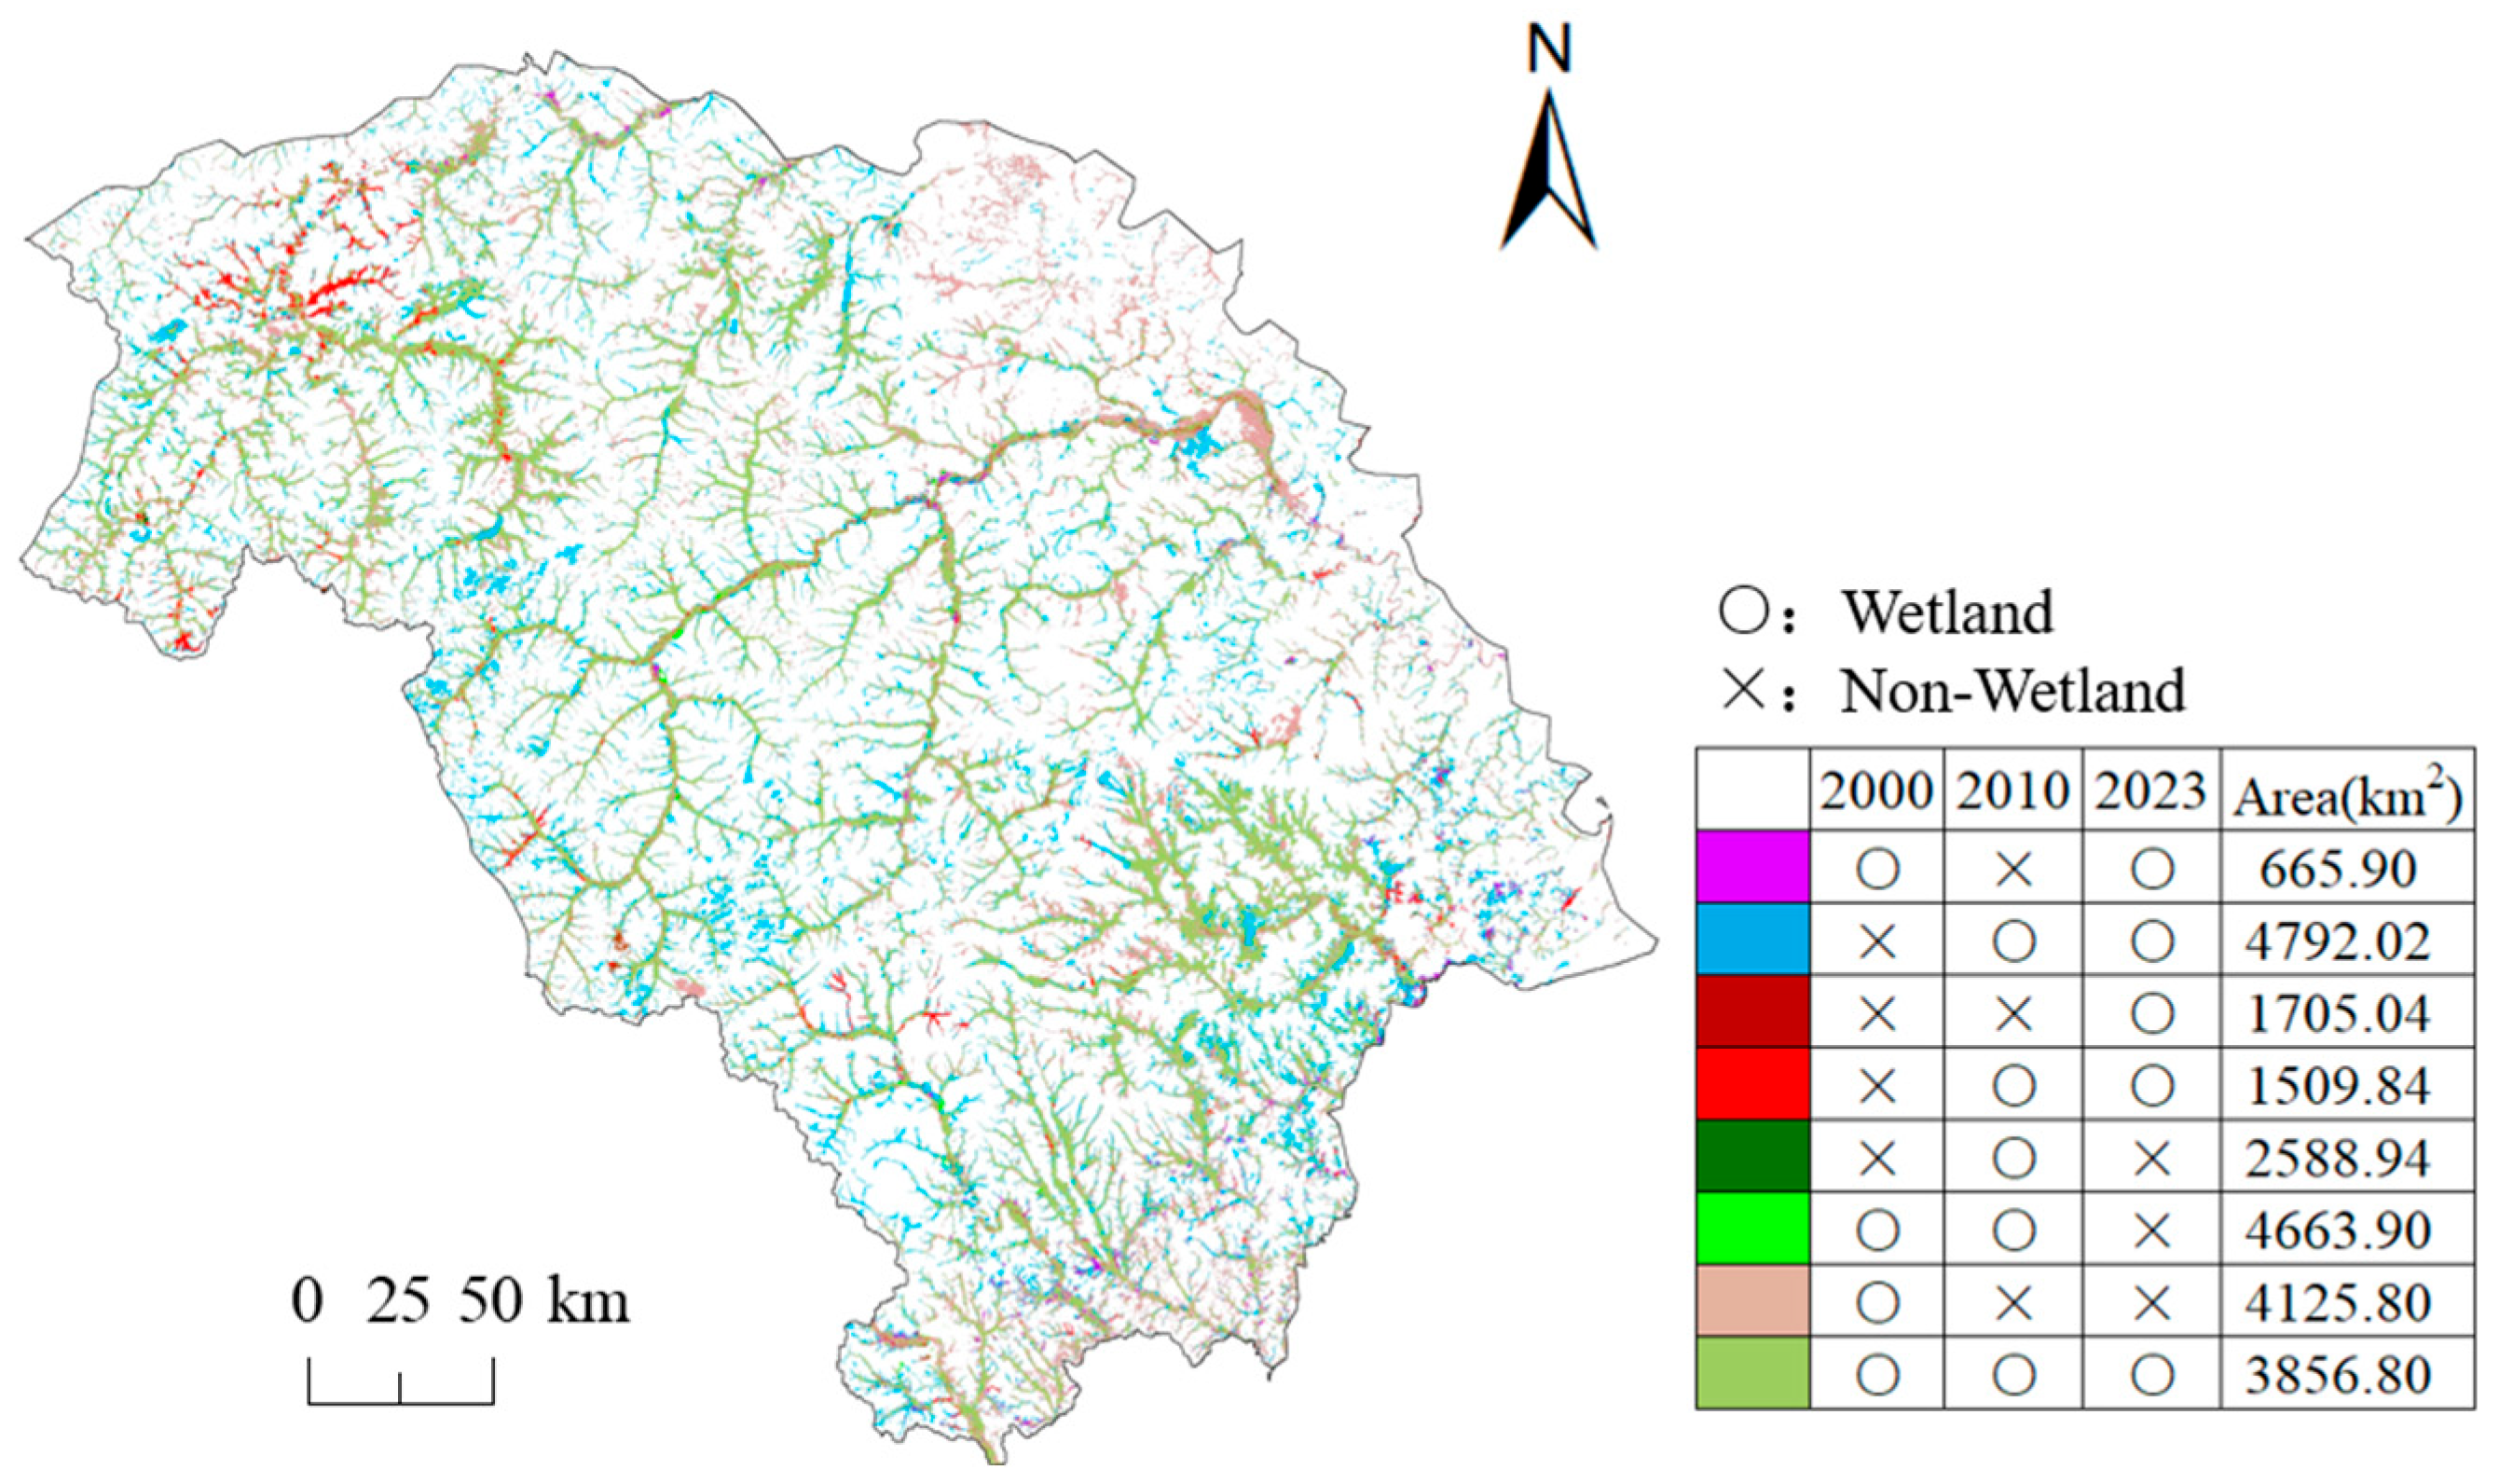
Wetland areas showed a significant decreasing trend with a decrease of 41.86%, and they were 13,311.28 km2, 12,614.99 km2, and 7739.35 km2 in 2000, 2010, and 2023, respectively. Specifically, we separated the detailed changes at different changes during 2000–2023. Serious losses mainly occurred at the southern and western edges, and 4792.02 km2 were wetland in 2000, but they were lost during 2010–2023. Posteriorly, there had been 4663.90 km2 that were wetlands during 2000–2010, but they disappeared in 2023 (Figure 2). The wetlands had not only vanished but also increased in the Greater Khingan Mountains, while 1705.04 km2 were non-wetlands during 2000–2010 and transformed into wetlands in 2023, and they mostly covered the northern and eastern edges of the study area (Figure 2). The wetland remained stable throughout the entire stage (2010–2023), covering approximately 3856.8 km2.

3.1.2. The Factors for Wetland Damage Index Constructing

The wetland decline rate (W) showed spatial heterogeneity during various periods at the grid scale, and its maximum value was decreasing. W2000 with high value was located at the southeast and northwest of the study area (Figure 3). The variation trend of W2010 was similar to W2000, with the maximum value of 0.51 in the southeast region (Figure 3). W2023 changes were relatively scattered, and it had high values dispersed in the middle and northern parts of the entire study area (Figure 3).
Human activities had a certain spatial relationship with the distribution of rivers seemingly, and average HPI exhibited an upward trend with an increase of 11.16% during 2000–2023 (Figure 4). Specifically, the proportion of grids with increased HPI accounted for 22.62% of the total number of grids, and most of these grids were distributed near rivers (Figure 4). The maximum value of HPI showed small fluctuations, and high HPI values were scattered in the center of the study area during 2000–2023 (Figure 4).
The quality of the regional ecological environment varied spatially as it evolved over time. RSEI with high value was located in the middle and the north, and the ecological environment quality was not well around the southeast in 2000 (Figure 5). The RESI in the west increased significantly, while the ecological environment quality at the eastern and southern edges was relatively poor in 2010 (Figure 5). However, the RSEI had increased in the south and northeast by 2023.

3.1.3. Wetland Damage Analysis

The damage to wetlands was sporadically distributed throughout the study area during 2000–2023. The WDI results constructed by using W, HPI, and RSEI showed that the average value of WDI increased by 9.86% during 2000–2023. WDI with high value was distributed along the eastern and southeastern edges of the Greater Khingan Mountains region during 2000–2010 (Figure 6).
LISA aggregation of the WDI displayed how the H-H cluster of WDI decreased from 19.14% in 2000 to 15.39% in 2023 in the eastern part of the study area. The L-L cluster of WDI decreased from 46.74% in 2000 to 9.35% in 2023, mostly distributed in the western region of the study area. The L-H cluster of WDI decreased from 2.01% in 2000 to 1.07% in 2023, and the H-L cluster of WDI increased from 0.39% in 2000 to 1.14% in 2023, showing a dot distribution in the Greater Khingan Mountains (Figure 7).

3.2. Driving Mechanism Analysis of Wetland Damage

3.2.1. Environmental Factors for WDI

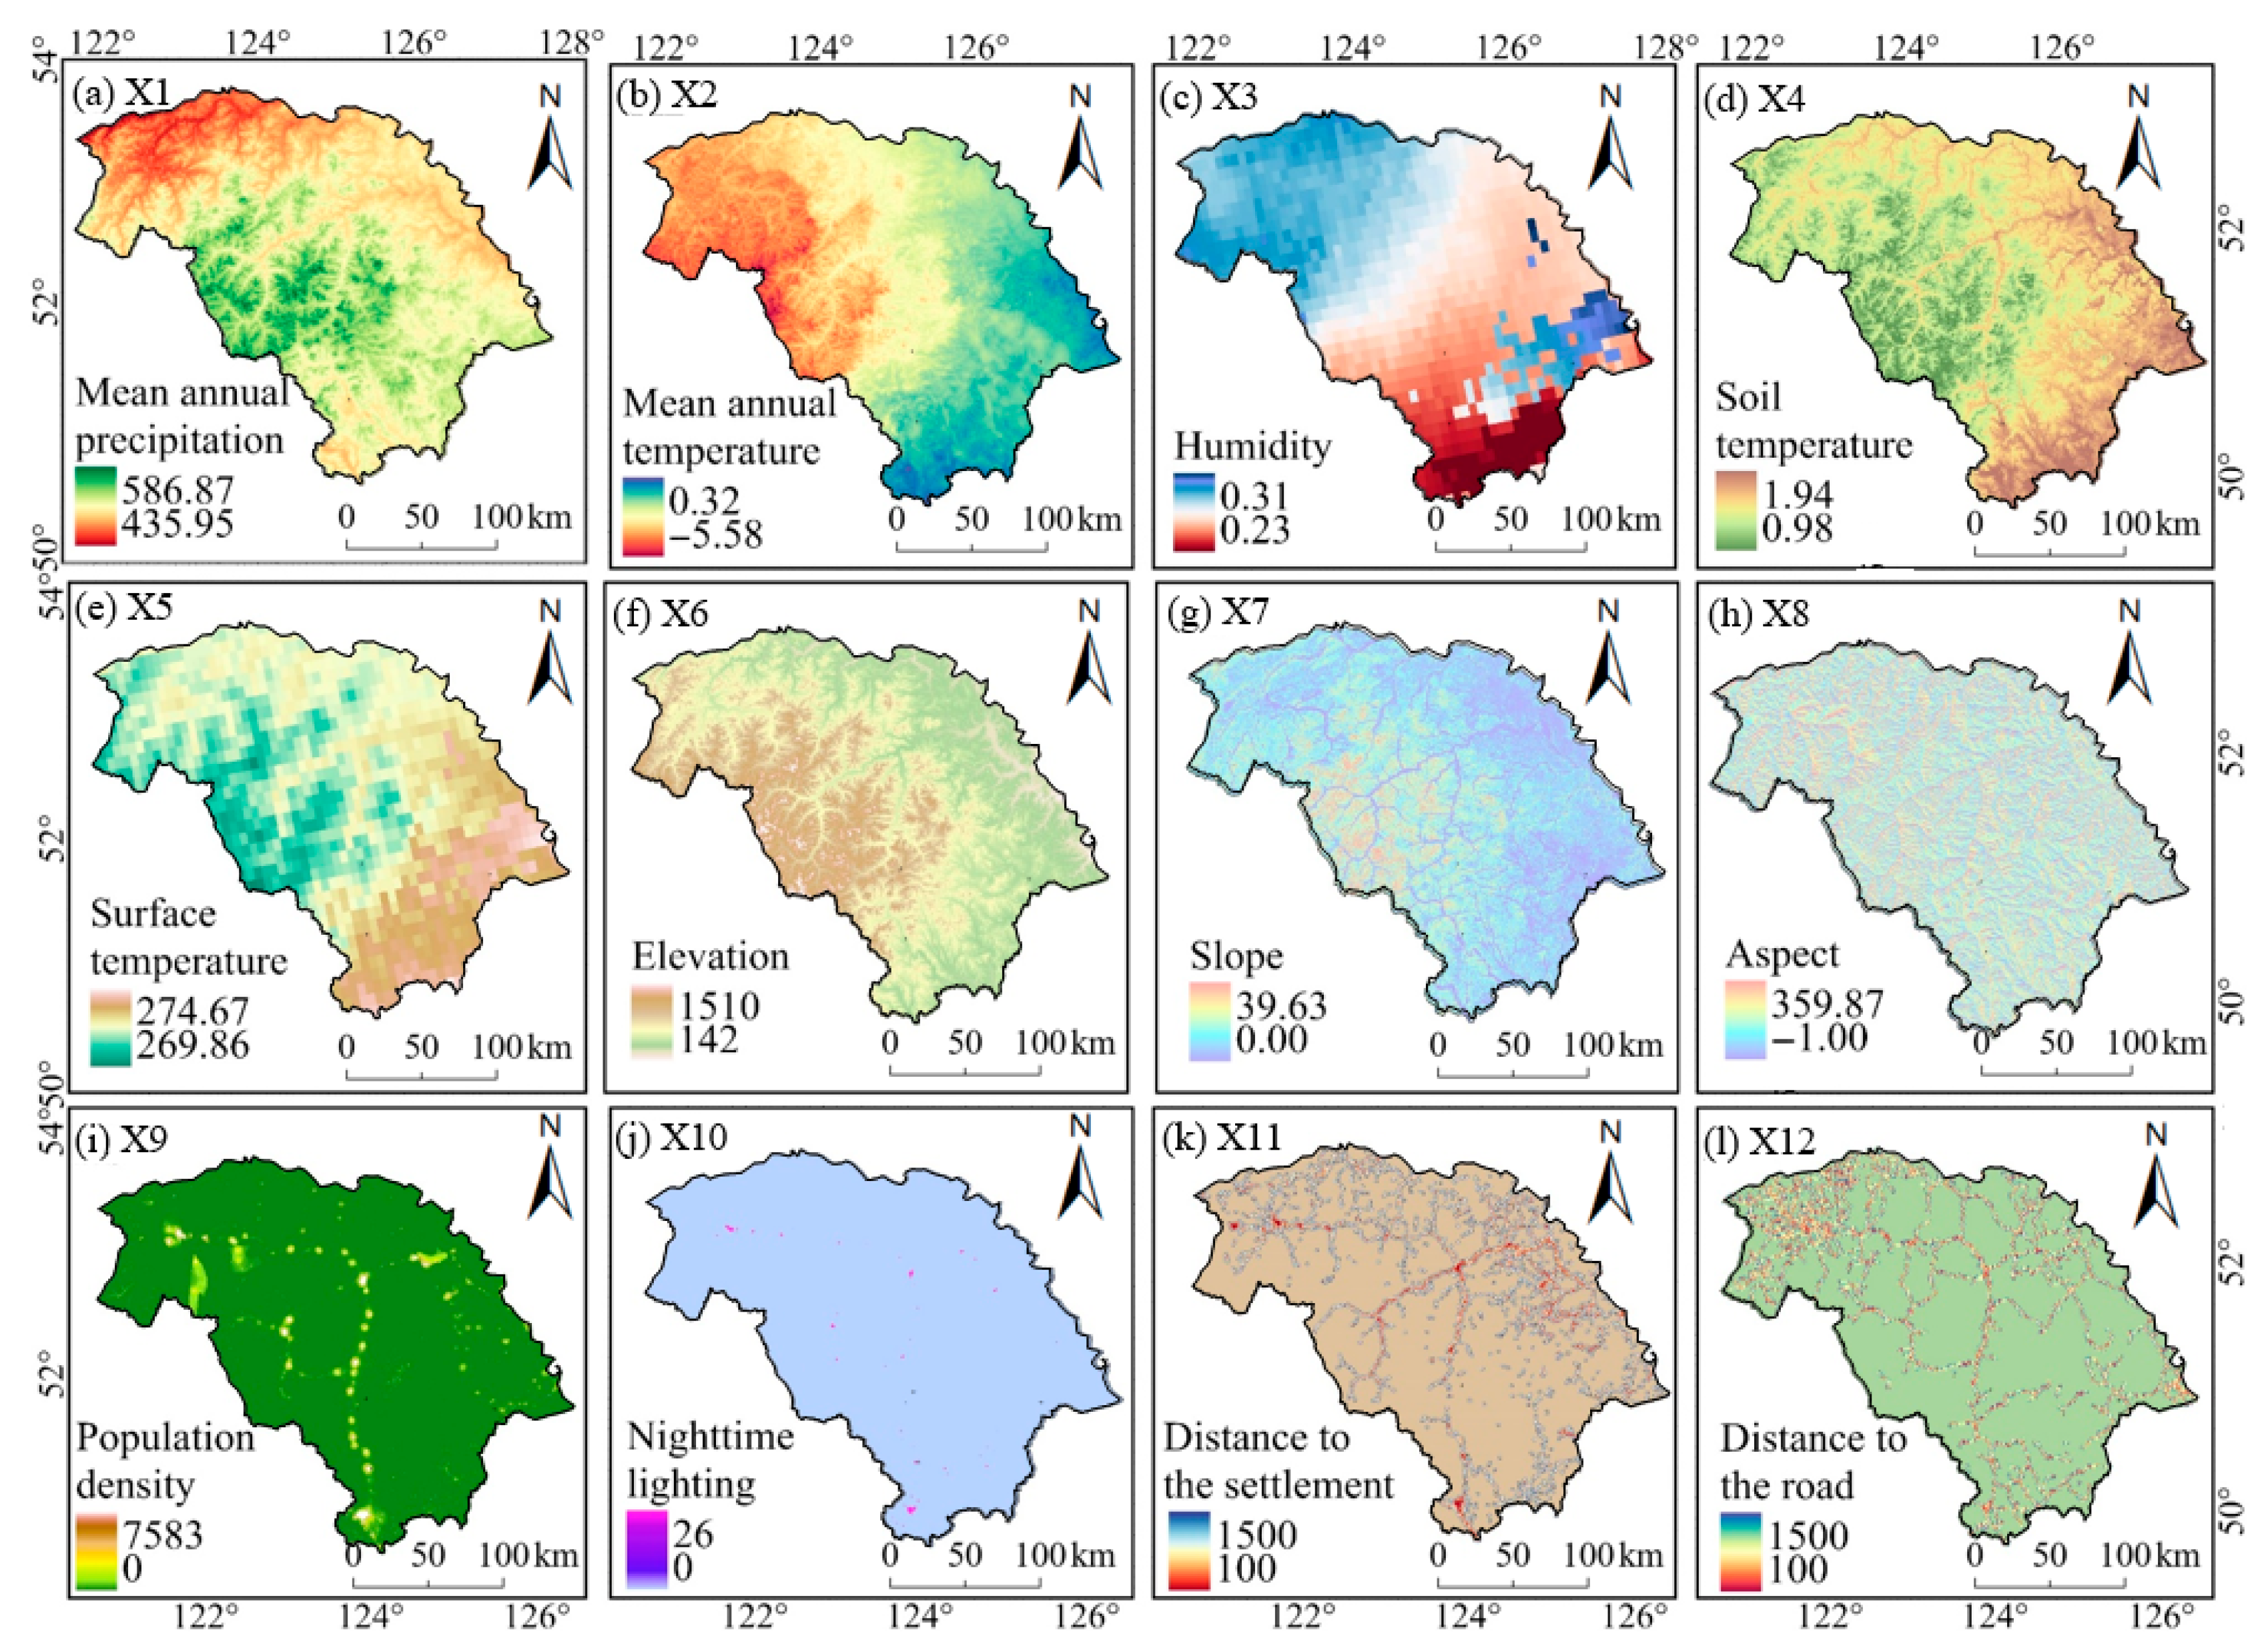
Wetlands damage was influenced by natural and humanistic factors. Climate affected the hydrological and biogeochemical cycles of wetlands, etc. Topography controlled the hydrology and heat of wetlands. Human social and economic activities may interfere with wetlands. Taking the above factors into consideration, we selected mean annual precipitation, mean annual temperature, humidity, soil temperature, surface temperature, elevation, slope, aspect, population density, nighttime lighting, distance to the settlement, and distance to the road to perform the single factor detection and factors’ interaction detection for WDI (Figure 8). The Greater Khingan Mountains region is located in the mid-high latitude region, with mean annual temperature ranging from −0.58 °C to 0.32 °C and the altitude ranging from 142 m to 1510 m. The soil temperature varied from 0.98 to 1.94. Nighttime lighting and population density reflected that the population was relatively sparse in this study area.

3.2.2. Single Factor Detection for WDI

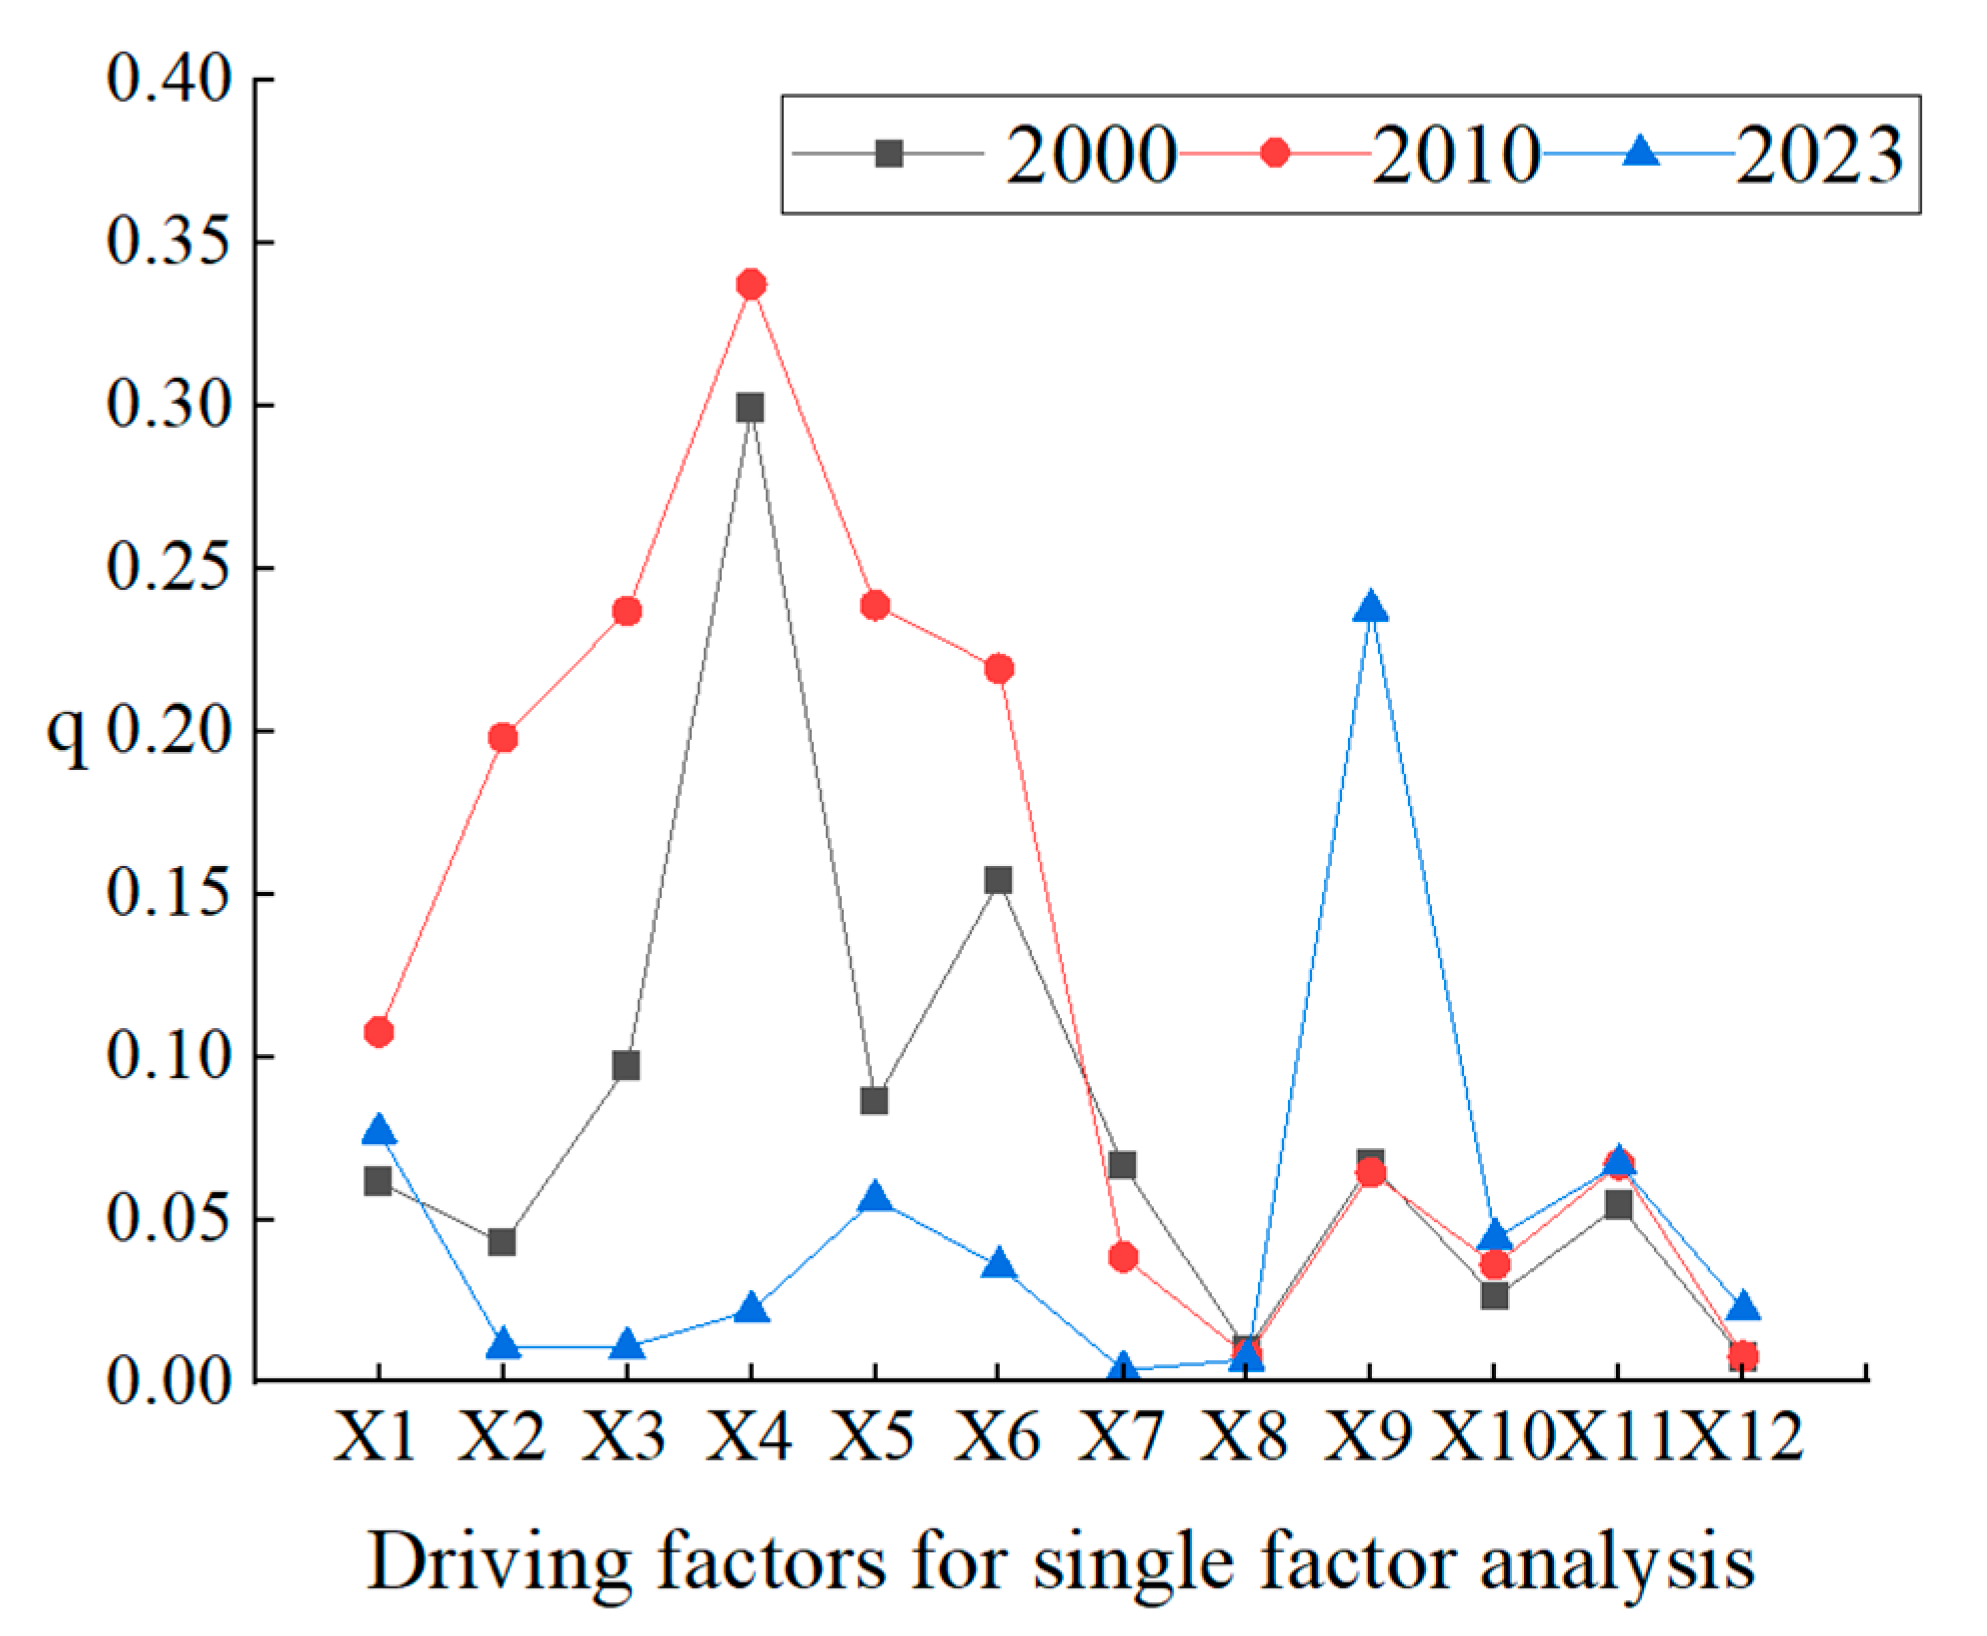
The impact of different environmental factors on wetland damage varied in different years. Results showed that all factors passed the hypothetical test at the 1% level (p < 0.01). Soil temperature was the most significant explanatory factor among various environmental variables in 2000, with a q value of 0.299. In contrast, aspect and distance to the road were the weakest factors. The contribution rates of factors in 2000 were as follows: X4 > X6 > X3 > X5 > X9 > X7 > X1 > X11 > X2 > X10 > X8 > X12 (Figure 9). Soil temperature still had the strongest explanatory power for WDI in 2010, and factors’ contribution rates from high to low in turn were: X4 > X5 > X3 > X6 > X2 > X1 > X11 > X9 > X7 > X10 > X8 > X12 (Figure 9). In 2023, the explanatory power of population density on WDI was significantly enhanced, and it became the first leading factor. The factors’ contribution rates from high to low were as follows: X9 > X1 > X11 > X5 > X10 > X6 > X12 > X4 > X2 > X3 > X8 > X7 (Figure 9).

3.2.3. Factors’ Interaction Detection for WDI

Factors’ interaction detection for WDI was different from that of the single factor detection. Results exhibited that the interaction between soil temperature and population density had the largest explanatory power on WDI with the q of 0.401, and X4∩X5, X1∩X4, and X3∩X4 pointed to relatively strong interactive interpretation power on WDI in 2000 (Figure 10). Factors’ interaction on WDI increased overall by 2010 (Figure 10). Factors’ interaction on WDI decreased and the interaction between surface temperature and population enacted the largest explanatory power on WDI with the q of 0.324 in 2023 (Figure 10). Meanwhile, the interaction between population density and other factors became more prominent in 2023 (Figure 10).

3.3. The Response of Primary Productivity to Wetland Damage

3.3.1. Primary Productivity Dynamics

The NPP showed an overall increasing trend in space in the Greater Khingan Range region during 2000–2023; the changing trend ranged from −11.85 to 21.47 gC·m−2·a−1, with an average value of 3.55 gC·m−2·a−1 (Figure 11). The area where the significant increase in NPP area accounted for more than 90% and showed a decreasing trend (slope < 0) accounted for only 0.72% of the total area, among which the proportion of the significantly reduced area was only 0.25% (Figure 11). The GPP overall showed an increasing trend, and the spatial variation trend values ranged −32.13–47.16 gC·m−2·a−1, with an average value of 8.89 gC·m−2·a−1. The proportion of the area with a significant increase in GPP exceeded 61.98% throughout the study area (Figure 11). The area where NPP exhibited a decreasing trend (slope < 0), accounting for just 5.12% of the total area, with the significantly reduced area comprising only 0.54% (Figure 11).

3.3.2. The Coupling Relationship Between Wetland Damage and Primary Productivity

The damage to wetlands was gradually coupled with the NPP changes. The coupling coordination degree between NPP and the wetland damage index showed significant spatial heterogeneity characteristics during 2000–2010 (Figure 12). Some areas were in a state of mild imbalance, while other areas were in a stage of severe imbalance or moderate coordination, with the coupling coordination degree ranging from [0.02, 0.81]. The coupling coordination degree has significantly increased during 2010–2023 compared with the period 2000–2010, which increased from 0.19 to 0.23, and the coupling coordination degree is between [0.06, 0.77] (Figure 12). The regions with a relatively high degree of coupling coordination have gradually exhibited an agglomeration trend, and the coupling coordination degree of NPP and WDI in most areas has evolved from a previously barely coordinated state to a primarily coordinated state (Figure 12).
The increase in the coupling coordination degree between WDI and GPP showed a trend of gradual diffusion from the center to the edge. The coupling coordination degree of GPP and WDI was relatively high in the eastern region while the peripheral regions were mostly in a slightly disordered or even severely disordered state, with the coupling coordination degree between [0, 0.79] during 2000–2010. The overall increase in the coupling coordination degree was not significant from 2010 to 2023; the average level rose from 0.52 to 0.55, with the coupling coordination degree ranging from 0 to 0.71. The central area further transformed into a primary coordinated state, while the peripheral areas also changed from mild imbalance to barely coordinated or even primary coordination.

4. Discussion

4.1. Analysis for Wetland Damage

Studies on the identification of wetland distribution and changes in wetland areas have been conducted due to the influence of global warming and permafrost degradation in mid-to-high latitudes, where wetlands are abundant [52,53]. Compared with previous wetland degradation studies [54,55], our study considered not only changes in wetland area but also the ecological environment and human activity interference, which can overcome the limitations of evaluating the area change index of a single wetland [47]. In particular, RSEI integrated remote sensing indicators such as greenness, humidity, dryness, and heat through principal component analysis [50], objectively reflecting the ecological background quality of wetlands. Furthermore, HPI accurately depicted the spatial gradient of perceived stress by comprehensively considering factors such as night lighting and road density [47]. Therefore, the construction of WDI reveals the scientific nature of wetland damage.
Our results indicated that the spatial distribution of wetlands showed a greater loss of wetland area in the central and southern regions of the Greater Khingan Mountains from 2000 to 2023, aligning with the changing trends observed in previous research [46]. The high value of WDI was scattered across the central and southern regions on the grid scale from 2000 to 2023. This might be attributed to the extensive distribution of farmland in the southern part of the study area, which could have been affected by human activities. Meanwhile, this overlapped with the high-value area of HPI in our research results. Previous studies have also focused on the response of future wetland damage to climate change, and we will continue to pay attention to wetland damage in mid-to-high latitudes in the future [56].

4.2. Analysis of the Driving Mechanism of Wetland Damage

Our research revealed that elevation ranked second in the single-factor explanatory power for wetland damage in 2000, which was consistent with previous studies. The distribution of meadows and other types of wetlands were the most sensitive to topographic factors in the northern part of the Greater Khingan Mountains in previous studies [57] and this study area was basically the same as the Greater Khingan Mountains in our administrative division. The altitude factor affected topographic water retention and surface runoff, contributing to wetland damage [58,59]. The driving factors influencing wetland distribution were examined through categorization in historical studies in the Greater Khingan Mountains and it was determined that slope and aspect significantly contributed to the distribution of shrub and herbaceous wetlands [46]. Slope and aspect can influence water movement, regulate erosion intensity and affect energy distribution as key elements of topography, thereby impacting wetland damage [60,61,62].
Additionally, the interactive explanatory power of soil temperature and population density on wetland damage was higher during 2000–2010, because human activities (e.g., deforestation, road construction) could damage the surface insulation layer and affect soil temperature easily [63,64]. However, higher soil temperature might lead to thinning of permafrost or prolonged melting time, which affected the hydrological conditions of wetlands in the mid-high latitudes [65,66]. The interaction between surface temperature and population density had a high explanatory power for wetland damage by 2023 because the significant warming of the climate and increasing surface temperature led to the permafrost melting in the mid-high latitudes in recent years [67]. Disruption of wetland hydrological connectivity could lead to the drying out of certain areas due to reduced water infiltration [68]. Meanwhile, the upper layer water infiltrated after the permafrost thawing, resulting in the decrease of surface water level and the shrinkage of wetlands [69,70]. The interaction between population density and environmental factors increased by 2023, indicating that human activities such as grazing and reclamation disturbed the wetland state in the Greater Khingan Mountains [71]. Therefore, the interaction among factors can better reflect which specific factor interactions have a more significant impact on wetland damage.

4.3. Primary Productivity Dynamics with Wetland Damage Changes

The research paradigm of landscape ecology—the “pattern-process-service-sustainability” paradigm—is emerging [72]. Therefore, our research analyzed the study of mid-to-high latitude wetlands from the framework of wetland damage pattern—quantitative driving mechanism process—functional changes, and we will probe the sustainability of wetland functions. We found that both NPP and GPP showed an increasing trend. This might be due to the fact that climate warming has prolonged the growing season and thus led to more photosynthesis [73]. Additionally, a moderate increase in temperature directly promoted the physiological activities of plants (such as photosynthetic rate and enzyme activity), enhancing growth efficiency [74,75]. Our results indicated that the area of NPP constituted over 90% with a significant increase. This was due to the positive response of high-latitude ecosystems to climate warming, which was evident in the acceleration of forest growth, expansion of vegetation, and enhanced carbon sinks [76]. The core driving force might be that permafrost degradation was gradually transforming from a “nutrient provider” to a “carbon release source.” [77]. Therefore, continuous monitoring of the state of permafrost and changes in carbon fluxes was key to predicting ecological transitions.
We observed that the coupling coordination degree between WDI and GPP exhibited a pattern of gradual diffusion from the center to the periphery. This indicated that the relationship between wetland degradation and changes in GPP became increasingly apparent towards the edges of the study area because wetlands damage (such as drainage, intensified permafrost melting, vegetation destruction, etc.) could significantly change the structure and function of the wetland ecosystem and have a greater impact on the GPP [78,79]. Results demonstrated that the average level of the coupling coordination degree increased from 0.52 to 0.55, which explained that the wetland damages were associated with an increase in GPP changes to a certain extent. Shrub invasion occurred in the permafrost wetlands in the mid-high latitudes, which might have led to a temporary increase in the community’s GPP to a certain extent [80].
Deficiencies existed in our research. It might affect the accuracy and bring uncertainties to some extent by resampling the different data resolution to 500 m. The RESI data of 2000 might have a synergy effect due to the sensor system error and the transition period of the data source during the data fusion process; it is inevitable that the results also have stripe noise in the process of calculating WDI. Additionally, we would continue to explore the impact of wetland damage on more ecological functions in the next stage of research.

5. Conclusions

The study explored the patterns of wetland damage and process changes in the Greater Khingan Mountains region of China. We found that the degradation of wetlands has progressively worsened and was primarily concentrated in the central portion of the study area during 2000–2023. Soil temperature shifted to the population density as the primary contributing factor for wetland damage during 2000–2023. Soil temperature and population density had a relatively high interactive explanatory power for wetland damage in the early stage, whereas surface temperature and population density exhibited the greatest interactive explanatory power for wetland damage in the later stage. Wetlands damage affected the structure and functions of wetland ecosystems, leading to a certain degree of coupling with GPP and NPP.

Author Contributions

Conceptualization, D.Z., H.W. and J.L.; methodology, W.H. and J.W.; software, W.H. and J.W.; validation, D.Z. and J.L.; formal analysis, J.W.; investigation, J.W.; resources, H.W.; data curation, W.H. and J.L.; writing—original draft preparation, D.Z. and W.H.; writing—review and editing, D.Z. and H.W.; visualization, H.W. and J.L.; supervision, H.W. and J.L.; project administration, H.W. and J.L.; funding acquisition, D.Z. All authors have read and agreed to the published version of the manuscript.

Funding

This research was funded by the National Natural Science Foundation of China, grant number 42301133.

Data Availability Statement

The original contributions presented in this study are included in the article.

Acknowledgments

The authors would like to acknowledge the helpful support received from research group.

Conflicts of Interest

The authors declare no conflicts of interest.

References

  1. Song, Y.Y.; Song, C.C. An Introduction to National Key Research and Development Project: “Research on the Response of Wetland Ecosystems in Mid-high Latitudes to Climate Change”. (No. 2016 YFA 0602300). Wetl. Sci. 2016, 14, 750–754. [Google Scholar] [CrossRef]
  2. Rouse, W.R. The energy and water balance of high-latitude wetlands: Controls and extrapolation. Glob. Change Biol. 2000, 6, 59–68. [Google Scholar] [CrossRef]
  3. Li, X.J.; Peng, X.Q.; Sun, H.; Frauenfeld, O.W.; Chen, G.Q.; Huang, Y.; Wei, G.; Du, J. The biogeophysical impacts of land cover changes in Northern Hemisphere permafrost regions. Catena 2024, 243, 108209. [Google Scholar] [CrossRef]
  4. Murray, N.J. Extent and drivers of global wetland loss. Nature 2023, 614, 234–235. [Google Scholar] [CrossRef]
  5. Mao, D.H.; Wang, M.; Wang, Y.Q.; Jiang, M.; Yuan, W.P.; Luo, L.; Feng, K.D.; Wang, D.R.; Xiang, H.X.; Ren, Y.X.; et al. The trajectory of wetland change in China between 1980 and 2020: Hidden losses and restoration effects. Sci. Bull. 2024, 70, 587–596. [Google Scholar] [CrossRef]
  6. Rebelo, L.M.; Finlayson, C.M.; Nagabhatla, N. Remote sensing and GIS for wetland inventory, mapping and change analysis. J. Environ. Manag. 2008, 90, 2144–2153. [Google Scholar] [CrossRef]
  7. Zheng, Y.M.; Niu, Z.G.; Gong, P.; Wang, J. A database of global wetland validation samples for wetland mapping. Sci. Bull. 2015, 60, 428–434. [Google Scholar] [CrossRef]
  8. Hu, Y.; Huang, J.L.; Du, Y.; Han, P.P.; Wang, J.L.; Huang, W. Monitoring wetland vegetation pattern response to water-level change resulting from the Three Gorges Project in the two largest freshwater lakes of China. Ecol. Eng. 2015, 74, 274–285. [Google Scholar] [CrossRef]
  9. Li, S.N.; Wang, G.X.; Deng, W.; Hu, Y.M.; Hu, W.W. Influence of hydrology process on wetland landscape pattern: A case study in the Yellow River Delta. Ecol. Eng. 2009, 35, 1719–1726. [Google Scholar] [CrossRef]
  10. Xiong, R.W.; Li, Y.; Gao, X.F.; Li, N.; Lou, R.T.; Saeed, L.; Huang, J.Q. Effects of a long-term operation wetland for wastewater treatment on the spatial pattern and function of microbial communities in groundwater. Environ. Res. 2023, 228, 115929. [Google Scholar] [CrossRef] [PubMed]
  11. Bao, T.; Jia, G.S.; Xu, X.Y. Weakening greenhouse gas sink of pristine wetlands under warming. Nat. Clim. Change 2023, 13, 462–469. [Google Scholar] [CrossRef]
  12. Hou, X.J.; Xie, D.H.; Feng, L.; Shen, F.; Nienhuis, J.H. Sustained increase in suspended sediments near global river deltas over the past two decades. Nat. Commun. 2024, 15, 3319. [Google Scholar] [CrossRef]
  13. Li, J.L.; Bu, Z.J.; Huang, X.Y.; Zeng, L.H.; Chen, X. The effects of environmental, climatic and spatial factors on diatom diversity in Sphagnum peatlands in central and northeastern China. Hydrobiologia 2023, 850, 565–575. [Google Scholar] [CrossRef]
  14. Avis, C.A.; Weaver, A.J.; Meissner, K.J. Reduction in areal extent of high-latitude wetlands in response to permafrost thaw. Nat. Geosci. 2011, 4, 444–448. [Google Scholar] [CrossRef]
  15. Vanderhoof, M.K.; Christensen, J.; Beal, Y.J.G.; Devries, B.; Lang, M.W.; Hwang, N.; Mazzarella, C.; Jones, J.W. Isolating anthropogenic wetland loss by concurrently tracking inundation and land cover disturbance across the Mid-Atlantic region, U.S. Remote Sens. 2020, 12, 1464. [Google Scholar] [CrossRef]
  16. Bai, J.H.; Cui, B.S.; Chen, B.; Zhang, K.J.; Deng, W.; Gao, H.F.; Xiao, R. Spatial distribution and ecological risk assessment of heavy metals in surface sediments from a typical plateau lake wetland, China. Ecol. Model. 2011, 222, 301–306. [Google Scholar] [CrossRef]
  17. Osland, M.J.; Enwright, N.; Day, R.H.; Doyle, T.W. Winter climate change and coastal wetland foundation species: Salt marshes vs. mangrove forests in the southeastern United States. Glob. Change Biol. 2013, 19, 1482–1494. [Google Scholar] [CrossRef]
  18. Zhang, Z.; Hu, B.Q.; Jiang, W.G.; Qiu, H.H. Identification and scenario prediction of degree of wetland damage in Guangxi based on the CA-Markov model. Ecol. Indic. 2021, 127, 107764. [Google Scholar] [CrossRef]
  19. Jiang, W.G.; Lv, J.X.; Wang, C.C.; Chen, Z.; Liu, Y.H. Marsh wetland degradation risk assessment and change analysis: A case study in the Zoige Plateau, China. Ecol. Indic. 2017, 82, 316–326. [Google Scholar] [CrossRef]
  20. Mondal, B.; Dolui, G.; Pramanik, M.; Maity, S.; Biswas, S.S.; Pal, R. Urban expansion and wetland shrinkage estimation using a GIS-based model in the East Kolkata Wetland, India. Ecol. Indic. 2017, 83, 62–73. [Google Scholar] [CrossRef]
  21. Lv, J.X.; Jiang, W.G.; Wang, W.J.; Wu, Z.F.; Liu, Y.H.; Wang, X.Y.; Li, Z. Wetland loss identification and evaluation based on landscape and remote sensing indices in Xiong’an new area. Remote Sens. 2019, 11, 2834. [Google Scholar] [CrossRef]
  22. Yu, B.W.; Xie, Y.L.; Ma, X.Y.; Cui, B.S. Wetland landscape pattern change and its damage degree in Guangdong-Hong Kong-Macau Bay Area in recent 40 years. Environ. Ecol. 2022, 4, 59–68. [Google Scholar]
  23. Lee, S.Y. Mangrove outwelling: A review. Hydrobiologia 1995, 295, 203–212. [Google Scholar] [CrossRef]
  24. Öövel, M.; Tooming, A.; Mauring, T.; Mander, Ü. Schoolhouse wastewater purification in a LWA-filled hybrid constructed wetland in Estonia. Ecol. Eng. 2007, 29, 17–26. [Google Scholar] [CrossRef]
  25. Sánchez-Carrillo, S.; Álvarez-Cobelas, M.; Angeler, D.G. Sedimentation in the semi-arid freshwater wetland Las Tablas de Daimiel (Spain). Wetlands 2001, 21, 112–124. [Google Scholar] [CrossRef]
  26. Brazner, J.C.; Danz, N.P.; Niemi, G.J.; Regal, R.R.; Trebitz, A.S.; Howe, R.W.; Hanowski, J.M.; Johnson, L.B.; Ciborowski, J.J.H.; Johnston, C.A.; et al. Evaluation of geographic, geomorphic and human influences on Great Lakes wetland indicators: A multi-assemblage approach. Ecol. Indic. 2007, 7, 610–635. [Google Scholar] [CrossRef]
  27. Osland, M.J.; Enwright, N.M.; Day, R.H.; Gabler, C.A.; Stagg, C.L.; Grace, J.B. Beyond just sea-level rise: Considering macroclimatic drivers within coastal wetland vulnerability assessments to climate change. Glob. Change Biol. 2016, 22, 1–11. [Google Scholar] [CrossRef]
  28. Owen, C.R. Hydrology and history: Land use changes and ecological responses in an urban wetland. Wetl. Ecol. Manag. 1998, 6, 209–219. [Google Scholar] [CrossRef]
  29. Mao, D.H.; Wang, Z.M.; Luo, L.; Ren, C.Y.; Jia, M.M. Monitoring the evolution of wetland ecosystem pattern in northeast China from 1990 to 2013 based on remote sensing. J. Nat. Resour. 2016, 31, 1253–1263. [Google Scholar] [CrossRef]
  30. Cui, L.J.; Gao, C.J.; Zhou, D.M.; Mu, L. Quantitative analysis of the driving forces causing declines in marsh wetland landscapes in the Honghe region, northeast China, from 1975 to 2006. Environ. Earth Sci. 2014, 71, 1357–1367. [Google Scholar] [CrossRef]
  31. Gibbs, J.P. Wetland loss and biodiversity conservation. Conserv. Biol. 2000, 14, 314–317. [Google Scholar] [CrossRef]
  32. Lv, J.X.; Jiang, W.G.; Wang, W.J.; Chen, K.; Deng, Y.; Chen, Z.; Li, Z. Wetland landscape pattern change and its driving forces in Beijing-Tianjin-Hebei region in recent 30 years. Acta Ecol. Sin. 2018, 38, 4492–4503. [Google Scholar] [CrossRef]
  33. Dang, A.T.N.; Kumar, L.; Reid, M.; Nguyen, H. Remote sensing approach for monitoring coastal wetland in the Mekong Delta, Vietnam: Change trends and their driving forces. Remote Sens. 2021, 13, 3359. [Google Scholar] [CrossRef]
  34. Mastepanov, M.; Sigsgaard, C.; Dlugokencky, E.J.; Houweling, S.; Ström, L.; Tamstorf, M.P.; Christensen, T.R. Large tundra methane burst during onset of freezing. Nature 2008, 456, 628–630. [Google Scholar] [CrossRef]
  35. Mulatu, D.W.; Ahmed, J.; Semereab, E.; Arega, T.; Yohannes, T.; Akwany, L.O. Stakeholders, institutional challenges and the valuation of wetland ecosystem services in south Sudan: The case of Machar Marshesand Sudd Wetlands. Environ. Manag. 2022, 69, 666–683. [Google Scholar] [CrossRef]
  36. Xue, Z.S.; Jiang, M.; Zhang, Z.S.; Wu, H.T.; Zhang, T.T. Simulating potential impacts of climate changes on distribution pattern and carbon storage function of high-latitude wetland plant communities in the Xing’anling Mountains, China. Land Degrad. Dev. 2021, 32, 2704–2714. [Google Scholar] [CrossRef]
  37. Hayes, M.A.; Jesse, A.; Hawke, B.; Baldock, J.; Tabet, B.; Lockington, D.; Lovelock, C.E. Dynamics of sediment carbon stocks across intertidal wetland habitats of Moreton Bay, Australia. Glob. Change Biol. 2017, 23, 4222–4234. [Google Scholar] [CrossRef] [PubMed]
  38. Rogers, K.; Kelleway, J.J.; Saintilan, N.; Megonigal, J.P.; Adams, J.B.; Holmquist, J.R.; Lu, M.; Schile-Beers, L.; Zawadzki, A.; Mazumder, D.; et al. Wetland carbon storage controlled by millennial-scale variation in relative sea-level rise. Nature 2019, 567, 91–95. [Google Scholar] [CrossRef]
  39. Lewis, D.B.; Feit, S.J. Connecting carbon and nitrogen storage in rural wetland soil to groundwater abstraction for urban water supply. Glob. Change Biol. 2015, 21, 1704–1714. [Google Scholar] [CrossRef] [PubMed]
  40. Zhang, W.J.; Xiao, H.A.; Tong, C.L.; Su, Y.; Xiang, W.S.; Huang, D.Y.; Syers, J.K.; Wu, J.S. Estimating organic carbon storage in temperate wetland profiles in Northeast China. Geoderma 2008, 146, 311–316. [Google Scholar] [CrossRef]
  41. Coletti, J.Z.; Hinz, C.; Vogwill, R.; Hipsey, M.R. Hydrological controls on carbon metabolism in wetlands. Ecol. Model. 2013, 249, 3–18. [Google Scholar] [CrossRef]
  42. Kayranli, B.; Scholz, M.; Mustafa, A.; Hedmark, Å. Carbon storage and fluxes within freshwater wetlands: A critical review. Wetlands 2009, 30, 111–124. [Google Scholar] [CrossRef]
  43. BuserYoung, J.Z.; Peck, E.K.; Chace, P.; Lapham, L.L.; Vizza, C.; Colwell, F.S. Biogeochemical dynamics of a glaciated high-latitude wetland. J. Geophys. Res. Biogeosci. 2022, 127, e2021JG006584. [Google Scholar] [CrossRef]
  44. Wang, P.T.; Ouyang, W.; Zhu, W.H.; Geng, F.; Tulcan, R.X.S.; Lin, C.Y. Wetland soil carbon dioxide emission dynamics with external dissolved organic matter in mid–high-latitude forested watershed. Agric. For. Meteorol. 2023, 333, 109381. [Google Scholar] [CrossRef]
  45. Hu, L.; Fan, W.J.; Ren, H.Z.; Liu, S.H.; Cui, Y.K.; Zhao, P. Spatiotemporal dynamics in vegetation GPP over the Great Khingan Mountains using GLASS products from 1982 to 2015. Remote Sens. 2018, 10, 488. [Google Scholar] [CrossRef]
  46. Zhao, D.D. The Change of Wetland Distribution and the Simulated Response to Climatic Change in the Great Xing’ an Mountains. Ph.D. Thesis, Northeast Normal University, Changchun, China, 2019. [Google Scholar]
  47. Huang, X.J.; Wu, Z.F.; Zhang, Q.F.; Cao, Z. How to measure wetland destruction and risk: Wetland damage index. Ecol. Indic. 2022, 141, 109126. [Google Scholar] [CrossRef]
  48. Chen, W.X.; Yang, L.Y.; Wu, J.H.; Wu, J.H.; Wang, G.Z.; Bian, J.J.; Zeng, J.; Liu, Z.L. Spatio-temporal characteristics and influencing factors of traditional villages in the Yangtze River Basin: A Geodetector model. Herit. Sci. 2023, 11, 111. [Google Scholar] [CrossRef]
  49. Wang, H.Y.; Qin, F.; Xu, C.D.; Li, B.; Guo, L.P.; Wang, Z. Evaluating the suitability of urban development land with a geodetector. Ecol. Indic. 2021, 123, 107339. [Google Scholar] [CrossRef]
  50. Yu, T.H.; Zhang, Y.; Jia, S.S.; Cui, X.F. Spatio-temporal evolution and drivers of coupling coordination between digital infrastructure and inclusive green growth: Evidence from the Yangtze River economic belt. J. Environ. Manag. 2025, 376, 124416. [Google Scholar] [CrossRef]
  51. Zhu, E.Y.; Li, W.; Chen, L.S.; Sha, M. Spatiotemporal coupling analysis of land urbanization and carbon emissions: A case study of Zhejiang Province, China. Land Degrad. Dev. 2023, 34, 4594–4606. [Google Scholar] [CrossRef]
  52. Ding, S.S.; Zou, Y.C.; Yu, X.F. Freeze-thaw cycles alter the growth sprouting strategy of wetland plants by promoting denitrification. Commun. Earth Environ. 2023, 4, 57. [Google Scholar] [CrossRef]
  53. Nitta, T.; Yoshimura, K.; Abe-Ouchi, A. Impact of arctic wetlands on the climate system: Model sensitivity simulations with the MIROC5 AGCM and a Snow-Fed wetland scheme. J. Hydrometeorol. 2017, 18, 2923–2936. [Google Scholar] [CrossRef]
  54. Cui, L.L.; Li, G.S.; Liao, H.J.; Ouyang, N.L.; Zhang, Y. Integrated approach based on a regional habitat succession model to assess wetland landscape ecological degradation. Wetlands 2015, 35, 281–289. [Google Scholar] [CrossRef]
  55. Khaznadar, M.; Vogiatzakis, I.N.; Griffiths, G.H. Land degradation and vegetation distribution in Chott El Beida wetland, Algeria. J. Arid Environ. 2009, 73, 369–377. [Google Scholar] [CrossRef]
  56. Huang, X.J. Evaluation of wetland damage and simulation of wetland future changes in the Guangdong-HongKong-Macao Greater Bay Area. Master’s Thesis, Guangzhou University, Guangzhou, China, 2023. [Google Scholar]
  57. Zhou, H.; Bu, R.C.; Hu, Y.M.; Yan, H.W.; Liu, H.J.; Leng, W.F.; Xu, S.L. Correlations between potential distribution of wetlands in Greathing’ an Mountains and environmental variables. Chin. J. Ecol. 2007, 26, 1533–1541. [Google Scholar]
  58. Hagani, J.S.; Takekawa, J.Y.; Skalos, S.M.; Casazza, M.L.; Riley, M.K.; Estrella, S.A.; Barthman-Thompson, L.M.; Smith, K.R.; Buffington, K.J.; Thorne, K.M. Application of lidar to assess the habitat selection of an endangered small mammal in an estuarine wetland environment. Ecol. Evol. 2024, 14, e10894. [Google Scholar] [CrossRef]
  59. Turnbull, A.; Soto-Berelov, M.; Coote, M. Delineation and classification of wetlands in the northern Jarrah Forest, western Australia using remote sensing and machine learning. Wetlands 2024, 44, 52. [Google Scholar] [CrossRef]
  60. Mayora, G.; Sagardoy, M.E.; Repetti, M.R.; Paira, A.; Frau, D.; Gutierrez, M.F. Spatiotemporal patterns of multiple pesticide residues in central Argentina streams. Sci. Total Environ. 2024, 906, 167014. [Google Scholar] [CrossRef]
  61. Xiang, H.X.; Yu, F.D.; Bai, J.L.; Shi, X.Y.; Wang, M.; Yan, H.Q.; Xi, Y.B.; Wang, Z.M.; Mao, D.H. SHAP-DNN approach advances remote sensing mapping of forested wetlands. IEEE J. Sel. Top. Appl. Earth Obs. Remote Sens. 2025, 18, 6859–6869. [Google Scholar] [CrossRef]
  62. Zhang, S.L.; Aurangzeib, M.; Xiao, Z.L.; Wang, H.; Xu, W.T. Spatiotemporal heterogeneity of soil available nitrogen during freeze-thaw cycles in a watershed: A 3-year investigation. Land Degrad. Dev. 2024, 35, 1381–1396. [Google Scholar] [CrossRef]
  63. Mgelwa, A.S.; Ngaba, M.J.Y.; Hu, B.; Gurmesa, G.A.; Mwakaje, A.G.; Nyemeck, M.P.B.; Zhu, F.F.; Qiu, Q.Y.; Song, L.L.; Wang, Y.Y.; et al. Meta-analysis of 21st century studies shows that deforestation induces profound changes in soil characteristics, particularly soil organic carbon accumulation. For. Ecosyst. 2025, 12, 46–55. [Google Scholar] [CrossRef]
  64. Parhizkar, M.; Lucas-Borja, M.E.; Denisi, P.; Tanaka, N.; Zema, D.A. Comparing the effects of hydromulching and application of biodegradable plastics on surface runoff and soil erosion in deforested and burned lands. J. Hydrol. Hydromech. 2024, 72, 422–435. [Google Scholar] [CrossRef]
  65. Gao, J.Q.; Ouyang, H.; Lei, G.C.; Xu, X.L.; Zhang, M.X. Effects of temperature, soil moisture, soil type and their interactions on soil carbon mineralization in Zoigê Alpine Wetland, Qinghai-Tibet Plateau. Chin. Geogr. Sci. 2011, 21, 27–35. [Google Scholar] [CrossRef]
  66. Wang, D.; Lv, Y.L.; Xu, L.; Zhang, H.X.; Wang, R.M.; He, N.P. The effect of moisture and temperature on soil C mineralization in wetland and steppe of the Zoige region, China. Acta Ecol. Sin. 2013, 33, 6436–6443. [Google Scholar] [CrossRef]
  67. Wang, X.W.; Song, C.C.; Sun, X.X.; Wang, J.Y.; Zhang, X.H.; Mao, R. Soil carbon and nitrogen across wetland types in discontinuous permafrost zone of the Xiao Xing’an Mountains, northeastern China. Catena 2013, 101, 31–37. [Google Scholar] [CrossRef]
  68. Connon, R.F.; Quinton, W.L.; Craig, J.R.; Hayashi, M. Changing hydrologic connectivity due to permafrost thaw in the lower Liard River valley, NWT, Canada. Hydrol. Process. 2014, 28, 4163–4178. [Google Scholar] [CrossRef]
  69. Ala-Aho, P.; Autio, A.; Bhattacharjee, J.; Isokangas, E.; Kujala, K.; Marttila, H.; Menberu, M.; Meriö, L.-J.; Postila, H.; Rauhala, A.; et al. What conditions favor the influence of seasonally frozen ground on hydrological partitioning? A systematic review. Environ. Res. Lett. 2021, 16, 043008. [Google Scholar] [CrossRef]
  70. Scherler, M.; Hauck, C.; Hoelzle, M.; Stähli, M.; Völksch, I. Meltwater infiltration into the frozen active layer at an alpine permafrost site. Permafr. Periglac. Process. 2011, 21, 325–334. [Google Scholar] [CrossRef]
  71. Liu, M.X. Assessing Land Cover and Ecological Quality Changes in the Forest-Grass Ecotone of Greater Khingan Mountains During the Period 1990–2018. Master’s Thesis, Nanjing Forestry University, Nanjing, China, 2021. [Google Scholar]
  72. Fu, B.J.; Liu, Y.X.; Zhao, W.W.; Wu, J.G. The emerging “pattern-process-service-sustainability” paradigmin landscapeecology. Landscpae Ecol. 2025, 40, 54. [Google Scholar] [CrossRef]
  73. Han, J.J.; Tan, C.W.; Ru, J.Y.; Song, J.; Hui, D.F.; Wan, S.Q. Coinciding spring and autumn frosts have a limited impact on carbon fluxes in a grassland ecosystem. Nat. Commun. 2025, 16, 4431. [Google Scholar] [CrossRef]
  74. Meacham-Hensold, K.; Cavanagh, A.P.; Sorensen, P.; South, P.F.; Fowler, J.; Boyd, R.; Jeong, J.; Burgess, S.; Stutz, S.; Dilger, R.N.; et al. Shortcutting photorespiration protects potato photosynthesis and tuber yield against Heatwave Stress. Glob. Change Biol. 2024, 30, e17595. [Google Scholar] [CrossRef] [PubMed]
  75. Tian, W.; Su, C.F.; Zhang, N.; Zhao, Y.W.; Tang, L. Simulation of the physiological and photosynthetic characteristics of C3 and C4 plants under elevated temperature and CO2 concentration. Ecol. Model. 2024, 495, 110805. [Google Scholar] [CrossRef]
  76. Zhang, J.; He, J.N.; Ren, S.H.; Zhou, P.; Guo, J.; Song, M.Y. Research on vehicle scheduling for forest fires in the northern Greater Khingan Mountains. Sci. Rep. 2025, 15, 1725. [Google Scholar] [CrossRef] [PubMed]
  77. Sun, J.M.; Shan, W.; Zhang, C.C. Effects of permafrost stability changes on vegetation dynamics in the middle part of the Greater Khingan Mountains. Environ. Res. Commun. 2025, 7, 015018. [Google Scholar] [CrossRef]
  78. Sun, B.Y.; Ping, J.Y.; Jiang, M.; Xia, J.Y.; Xia, F.Y.; Han, G.X.; Yan, L.M. Climate warming intensifies plant–soil causal relationships in a coastal wetland. J. Plant Ecol. 2024, 18, rtae107. [Google Scholar] [CrossRef]
  79. Wu, J.J.; Zhang, H.; Cheng, X.L.; Liu, G.H. Ecosystem-atmosphere exchange of methane in global upland and wetland ecosystems. Agric. For. Meteorol. 2025, 361, 110325. [Google Scholar] [CrossRef]
  80. Liu, L.; Zhao, G.; Yao, D.J.; Zong, N.; He, Y.L.; Wu, W.C.; Jiang, Q.X.; Zhang, Y.J. Precipitation regulates soil organic carbon affected by shrub encroachment along the altitude gradient. Catena 2025, 249, 108616. [Google Scholar] [CrossRef]
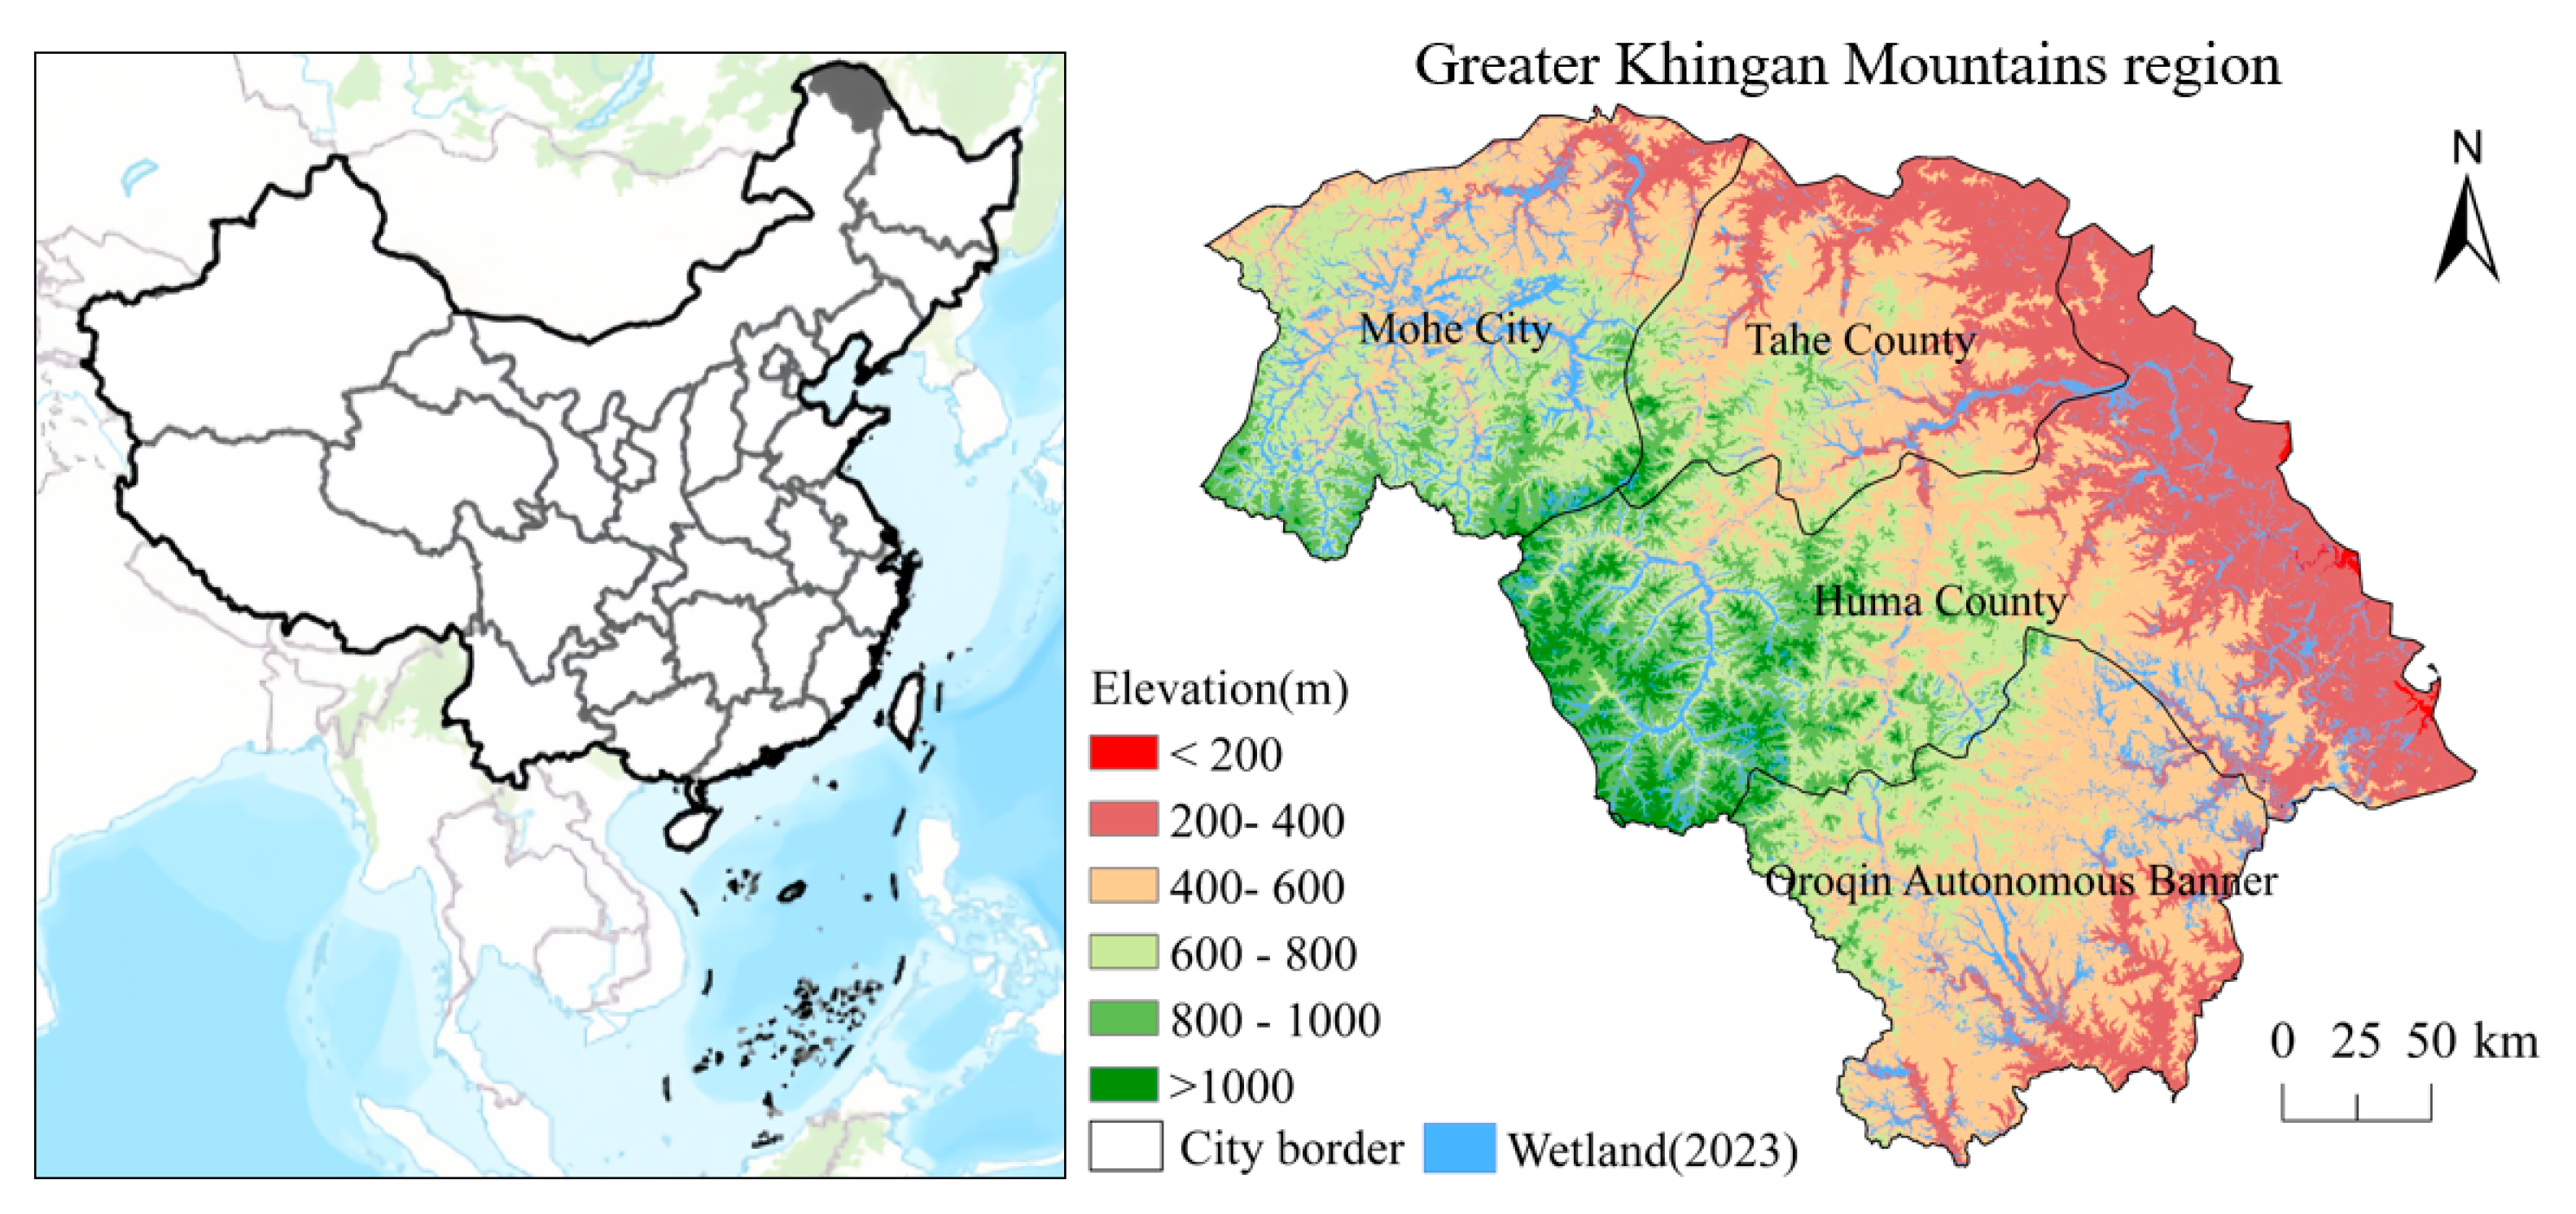
Figure 1. Location of the Greater Khingan Mountains region.
Land 14 01770 g001
Figure 2. Wetland evolution in the Greater Khingan Mountains region during 2000–2023.
Land 14 01770 g002
Figure 3. Spatio-temporal variations of W in the Greater Khingan Mountains region.
Land 14 01770 g003
Figure 4. Spatio-temporal variations of HPI in the Greater Khingan Mountains region.
Land 14 01770 g004
Figure 5. Spatial distribution of RSEI in the Greater Khingan Mountains region.
Land 14 01770 g005
Figure 6. Spatial distribution of WDI in the Greater Khingan Mountains region.
Land 14 01770 g006
Figure 7. LISA cluster of WDI in the Greater Khingan Mountains region.
Land 14 01770 g007
Figure 8. Spatial distribution of driving factors of wetland damage.
Land 14 01770 g008
Figure 9. Driving single factor analysis detection on WDI.
Land 14 01770 g009
Figure 10. Driving factors for interaction analysis detection on WDI ((A)-2000, (B)-2010, (C)-2023).
Land 14 01770 g010
Figure 11. Slope of NPP and GPP change and St (significance test) during 2000–2023.
Land 14 01770 g011
Figure 12. (a) Coupled coordination degree between WDI and NPP (2000–2010); (b) Coupled coordination degree between WDI and NPP (2010–2023); (c) Coupled coordination degree between WDI and GPP (2000–2010); (d) Coupled coordination degree between WDI and GPP (2010–2023).
Land 14 01770 g012
Table 1. Brief description and data source of datasets.
Data DescriptionTime FrameResolution AttributeData Source
LUCC2010–202330 m2010, 2020 was obtained National Earth System Science Data Center (http://www.geodata.cn), 2023 interpretation based on Remote sensing images
Wetland2000–202330 mNational Earth System Science Data Center (http://www.geodata.cn)
RSEI2000–202330 mGoogle Earth Engine
(https://developers.google.com) [10]
Nighttime lights2000–2023500 mNational Earth System Science Data Center, National Science & Technology Infrastructure of China (http://www.geodata.cn)
Population density2000–2023100 mWorldPop (https://hub.worldpop.org)
Roads and railways2023Vector dataPublic map (OSM)
(https://www.openstreetmap.org/)
DEM202030 mGeospatial Data Cloud (https://www.gscloud.cn)
Temperature and precipitation2000–20231 kmInstitute of Tibetan Plateau Research Chinese Academy of Sciences (https://data.tpdc.ac.cn/home)
Surface temperature and humidity2000–2023About 11.1 kmFLDAS datasets
(https://disc.gsfc.nasa.gov/datasets/ (accessed on 23 December 2023))
Soil temperature2000–20230.1°(https://disc.gsfc.nasa.gov/datasets/ (accessed on 23 December 2023))
Net Primary Productivity2001–2023500 mNASA-EARTHDATA
(https://www.earthdata.nasa.gov/data (accessed on 25 June 2024))
Gross Primary Productivity2000–2023500 mGoogle Earth Engine
(https://developers.google.com); NASA-EARTHDATA
(https://www.earthdata.nasa.gov/data/ accessed on 15 July 2024)
Table 2. Driving factors for wetland damage in the Greater Khingan Mountains region.
CategoryNameUnitFactors
Meteorological and soil factorsMean annual precipitationmm·a−1X1
Mean annual temperature°C·a−1X2
Humidity-X3
Soil temperature°CX4
Surface temperatureKX5
Geographical factorsAltitudemX6
Slope°X7
Aspect°X8
Socioeconomic factorsPopulation densityTen thousand people/km2X9
Nighttime lightingnW/cm2/srX10
Distance to the settlementmX11
Distance to the roadmX12
Table 3. Brief description and data source of datasets.
Relations of q-ValueType of Interaction
q X 1 X 2 < M i n q X 1 , q X 2 Non-linear weakening
M i n q X 1 , q X 2 < q X 1 X 2 < M a x q X 1 , q X 2 Single-factor non-linear weakened
q X 1 X 2 > M a x q X 1 , q X 2 Bivariable enhanced
q X 1 X 2 = q X 1 + q X 2 Independent
q X 1 X 2 > q X 1 + q X 2 Nonlinear enhanced
Table 4. Brief description and data source of datasets.
Coupled Coordination DegreeType
0.8 < D ≤ 1High-quality coordination
0.6 < D ≤ 0.8Good coordination
0.5 < D ≤ 0.6Moderate coordination
0.3 < D ≤ 0.5Mild imbalance
0 < D ≤ 0.3Severe imbalance
Disclaimer/Publisher’s Note: The statements, opinions and data contained in all publications are solely those of the individual author(s) and contributor(s) and not of MDPI and/or the editor(s). MDPI and/or the editor(s) disclaim responsibility for any injury to people or property resulting from any ideas, methods, instructions or products referred to in the content.