Article

Analysis of the Layering Characteristics and Value Space Coupling Coordination of the Historic Landscape of Chaozhou Ancient City, China

School of Architecture, South China University of Technology, Guangzhou 510641, China
*
Author to whom correspondence should be addressed.
Land 2025, 14(9), 1767; https://doi.org/10.3390/land14091767
Submission received: 31 July 2025 / Revised: 26 August 2025 / Accepted: 28 August 2025 / Published: 30 August 2025

Abstract

The historic landscape and the value of the ancient city in the stock era present a diversified and mixed problem; as such, this study explores a quantifiable spatial correlation method for landscape layering characteristics and value space, in order to provide support for the urban renewal paths that integrate historical and contemporary needs. Taking as an example Chaozhou Ancient City, a renowned historical and cultural city in China, this study draws on the theory of historical urban landscape layering and comprehensively uses historical graphic interpretation, GIS spatial quantitative analysis, the single-land-use dynamic degree model, the Analytic Network Process, and the Delphi method to quantitatively analyze and evaluate the landscape layering characteristics and value space of the ancient city. Meanwhile, it explores the relationship between the historical landscape layering characteristics and value space of ancient cities using the spatial autocorrelation model and the coupling coordination modulus model. The key findings are as follows: (1) The high-layer space (66.1%) and high-value space (31.1%) of the historic landscape of Chaozhou Ancient City show significant mismatch and imbalance. Spatially, layer spaces increase from the city center toward the periphery, whereas value spaces decrease from the center outward, demonstrating marked spatial heterogeneity. (2) The layer–value space shows a spatial distribution of agglomeration, with Moran’s I index values of 0.2712 and 0.6437, respectively. The agglomeration degree of the value space is much higher than that of the layer space, and both show significant non-equilibrium and associative coupling. (3) Coupling coordination: basically balanced (D = 0.56) indicates a transition toward a more integrated state, although 48% of the region remains in a state of severe dysfunction, mainly consisting of two types of spaces: “high-layer–high-value” and “low-layer–low-value.” These two dysfunctional types should be prioritized in future conservation and renewal strategies. This study provides a more comprehensive quantitative analysis path for identifying and evaluating the landscape layer–value space of the ancient city, providing visualization tools and decision-making support for the future protection and renewal of Chaozhou Ancient City and the declaration of the World Heritage.

Graphical Abstract

1. Introduction

As an important carrier of the diversity of human civilization, the preservation and inheritance of urban heritage is of great significance to the maintenance of collective memory and the promotion of cross-civilization dialog. As the core component of urban heritage, ancient cities have accumulated historical imprints and the spirit of civilization, and their preservation and revitalization are not only related to the continuation of cultural lineage but are also of great importance to the sustainable development of the region. However, rapid urbanization around the world is reshaping human settlements with unprecedented force. Many historic towns, such as the Marais district in Paris, the old city of Cairo, and Mexico City, are facing serious challenges such as the fragmentation of historic spaces, the decline of traditional communities, and the disappearance of heritage elements. Since the establishment of Historical and Cultural Cities System in 1982, China has formed a protection system of 142 national and nearly 200 provincial historical and cultural cities [1]. However, under the process of high-speed urbanization, the protection of ancient cities also faces severe challenges [2]. A core dilemma lies in the fact that heritage spaces and the diverse values they embody are becoming increasingly complex, mixed, and even conflicting. This “mixing” is specifically manifested in the following ways: unclear historical spatial cognition leads to disorder in spatial order; conflicts in the recognition of values among diverse stakeholders trigger disputes over protection goals and practices; and high-intensity fragmented development disrupts spatial connection networks, damaging the integrity and sustainability of ancient cities.
The “Historic Urban Landscape (HUL)” is an innovative concept put forward by UNESCO in its 2011 Recommendation on Historic Urban Landscapes, which aims to respond to the impact of rapid global urbanization on the regional culture of historic cities and towns. As a new paradigm in the field of urban renewal and heritage conservation [3], HUL regards cities as a stratified landscape system formed by the long-term interaction of natural, economic and human factors [4], and its core feature is to emphasize the dynamics and value relevance of historical layers [5]. This concept is highly consistent with the current value-oriented trend in heritage protection [6]. Therefore, effectively exploring the relationship between the layering characteristics of urban historical landscapes and the value spaces they embody is consistent with the current trend in world heritage protection, which emphasizes integrity, dynamism, and value connectivity. It is also key to addressing the challenges of “mixing” mentioned earlier.
Adopting this perspective, both academic and practical fields have conducted fruitful research. In terms of layering characteristics, scholars have focused on specific domains such as ecosystem services [7] and heritage feature identification [8] or introduced theoretical frameworks like landscape narrative [9], anchoring–layering [10], and landscape features [11], as well as developing assessment tools such as Landscape Character Assessment (LCA) [12] and Historical Land-Use Assessment (HLA) [13] to interpret layering characteristics. In the realm of value space, research priorities encompass value assessment [13], value recognition [14], and value connotation [15], extensively utilizing mature assessment methods including the Delphi method, Analytic Hierarchy Process (AHP), and Analytic Network Process (ANP). These studies have deepened our understanding of layering characteristics or value space within their respective domains, yet few scholars have directly explored the relationship between layering characteristics and value space, systematically analyzing the spatial correlation mechanism between them. Although the widespread adoption of GIS and RS technologies has facilitated the separate application of spatial analysis in the identification of layering characteristics and value evaluation [16,17], attempts to thoroughly investigate the spatial correlation between the two based on GIS technology remain insufficient. More critically, existing achievements mostly focus on theoretical discussions of conservation principles, with the evaluation process heavily reliant on qualitative descriptions [13], and researchers have yet to construct a spatially explicit, quantitative, and operable spatial correlation analysis model.
The Coupling Coordination Degree Model provides significant insights into exploring the “layer–value” space correlation. Originating from systems science, this model effectively quantifies the degree of interaction and interdependence between two or more systems, as well as their level of coordinated development [18]. Its advantage lies in the ability to transcend subjective qualitative descriptions and objectively reveal the degree of correlation and coordination status between systems in terms of spatial location, intensity, and structure through quantitative analysis. Introducing it into the study of urban historical landscapes is expected to objectively reveal the space distribution of layering characteristics and multiple values of complex historical landscapes through spatial data, allowing for the accurate detection of the coupling intensity and level of coordination between the two, thereby promoting the transformation of heritage conservation from conceptual advocacy to scientific decision-making based on spatial dimensions.
As a renowned historical and cultural city in China and a significant commercial hub on the southeast coast of ancient China, Chaozhou Ancient City, shaped by over a thousand years of development, boasts a spatial layout where “mountains, water, and the city” blend harmoniously, and there is a rich historical landscape layering. It is regarded as a valuable example for the study of the spatial evolution and value inheritance of Chinese historical cities. Compared to existing research that primarily focuses on large inland ancient capitals such as Beijing and Xi’an, the unique coastal commercial ancient city of Chaozhou, with its well-preserved spatial layout, provides a new empirical basis for exploring the layer and value space of ancient city landscapes. In the context of the current World Heritage nomination, its conservation practice is faced with a double challenge: (1) the destruction of landscape integrity by high-intensity urban construction activities; and (2) the new requirements of cultural industry upgrading on the interpretation of heritage values. This highlights the urgency of conducting correlation research and the synergistic optimization of the region’s historical layering and value space, while existing research has not yet established a corresponding quantitative analysis framework.
In view of this, this study takes Chaozhou Ancient City as a research case, draws on the theory of historic urban landscape layering, and constructs a two-dimensional evaluation system of “layer–value”. It comprehensively applies the interpretation of historical documents, the spatial quantitative analysis of GIS, the single-land-use dynamic degree model, the Analytic Network Process (ANP), and the Delphi method to carry out a quantitative analysis and value assessment of the historical layer space and value space of the ancient city historical landscapes. Furthermore, the spatial correlation coordination strength and spatial heterogeneity of the two are explored using the spatial autocorrelation model and coupling coordination degree model. The research aims to provide a decision-making foundation based on spatial evidence for the refined protection, adaptive renewal, and sustainable development of Chaozhou Ancient City. At the same time, the explored “quantitative spatial correlation” method model is expected to provide a generalizable scientific reference for the overall protection and living inheritance of regional cultural heritage with complex layering characteristics.

2. Study Area and Data Source

2.1. Study Area

Chaozhou is one of the second batch of Historical and Cultural Cities in China, located in the eastern part of Guangdong Province. Historically, it served as an important commercial and trade hub city along China’s southeast coast. This study focuses on its ancient city district, which is the core protected area of Chaozhou, a renowned historical and cultural city, covering a total area of approximately 2.33 square kilometers. The unique value of Chaozhou Ancient City lies in its over 1600-year history of city construction, whereby the location of the city and its core spatial layout have remained largely unchanged. The ancient city district has clearly preserved significant historical layering imprints from the Tang and Song dynasties, through the Yuan, Ming, Qing, and Republic of China, and up to the present day. What is particularly noteworthy is that, unlike ancient cities that have been “museumized” or “theme-parkized,” Chaozhou Ancient City still maintains a strong atmosphere of daily life and vitality, serving as the living center for many indigenous residents. The rich traditional handicrafts and folk activities endow the ancient city with a unique “living culture” trait and authentic historical ambiance. The study area encompasses the complete urban development from the historical city center to modern urban areas, with its significant historical accumulation and heritage value, providing an ideal research case for exploring the correlation mechanism of the layering characteristics and value space of historical landscapes.
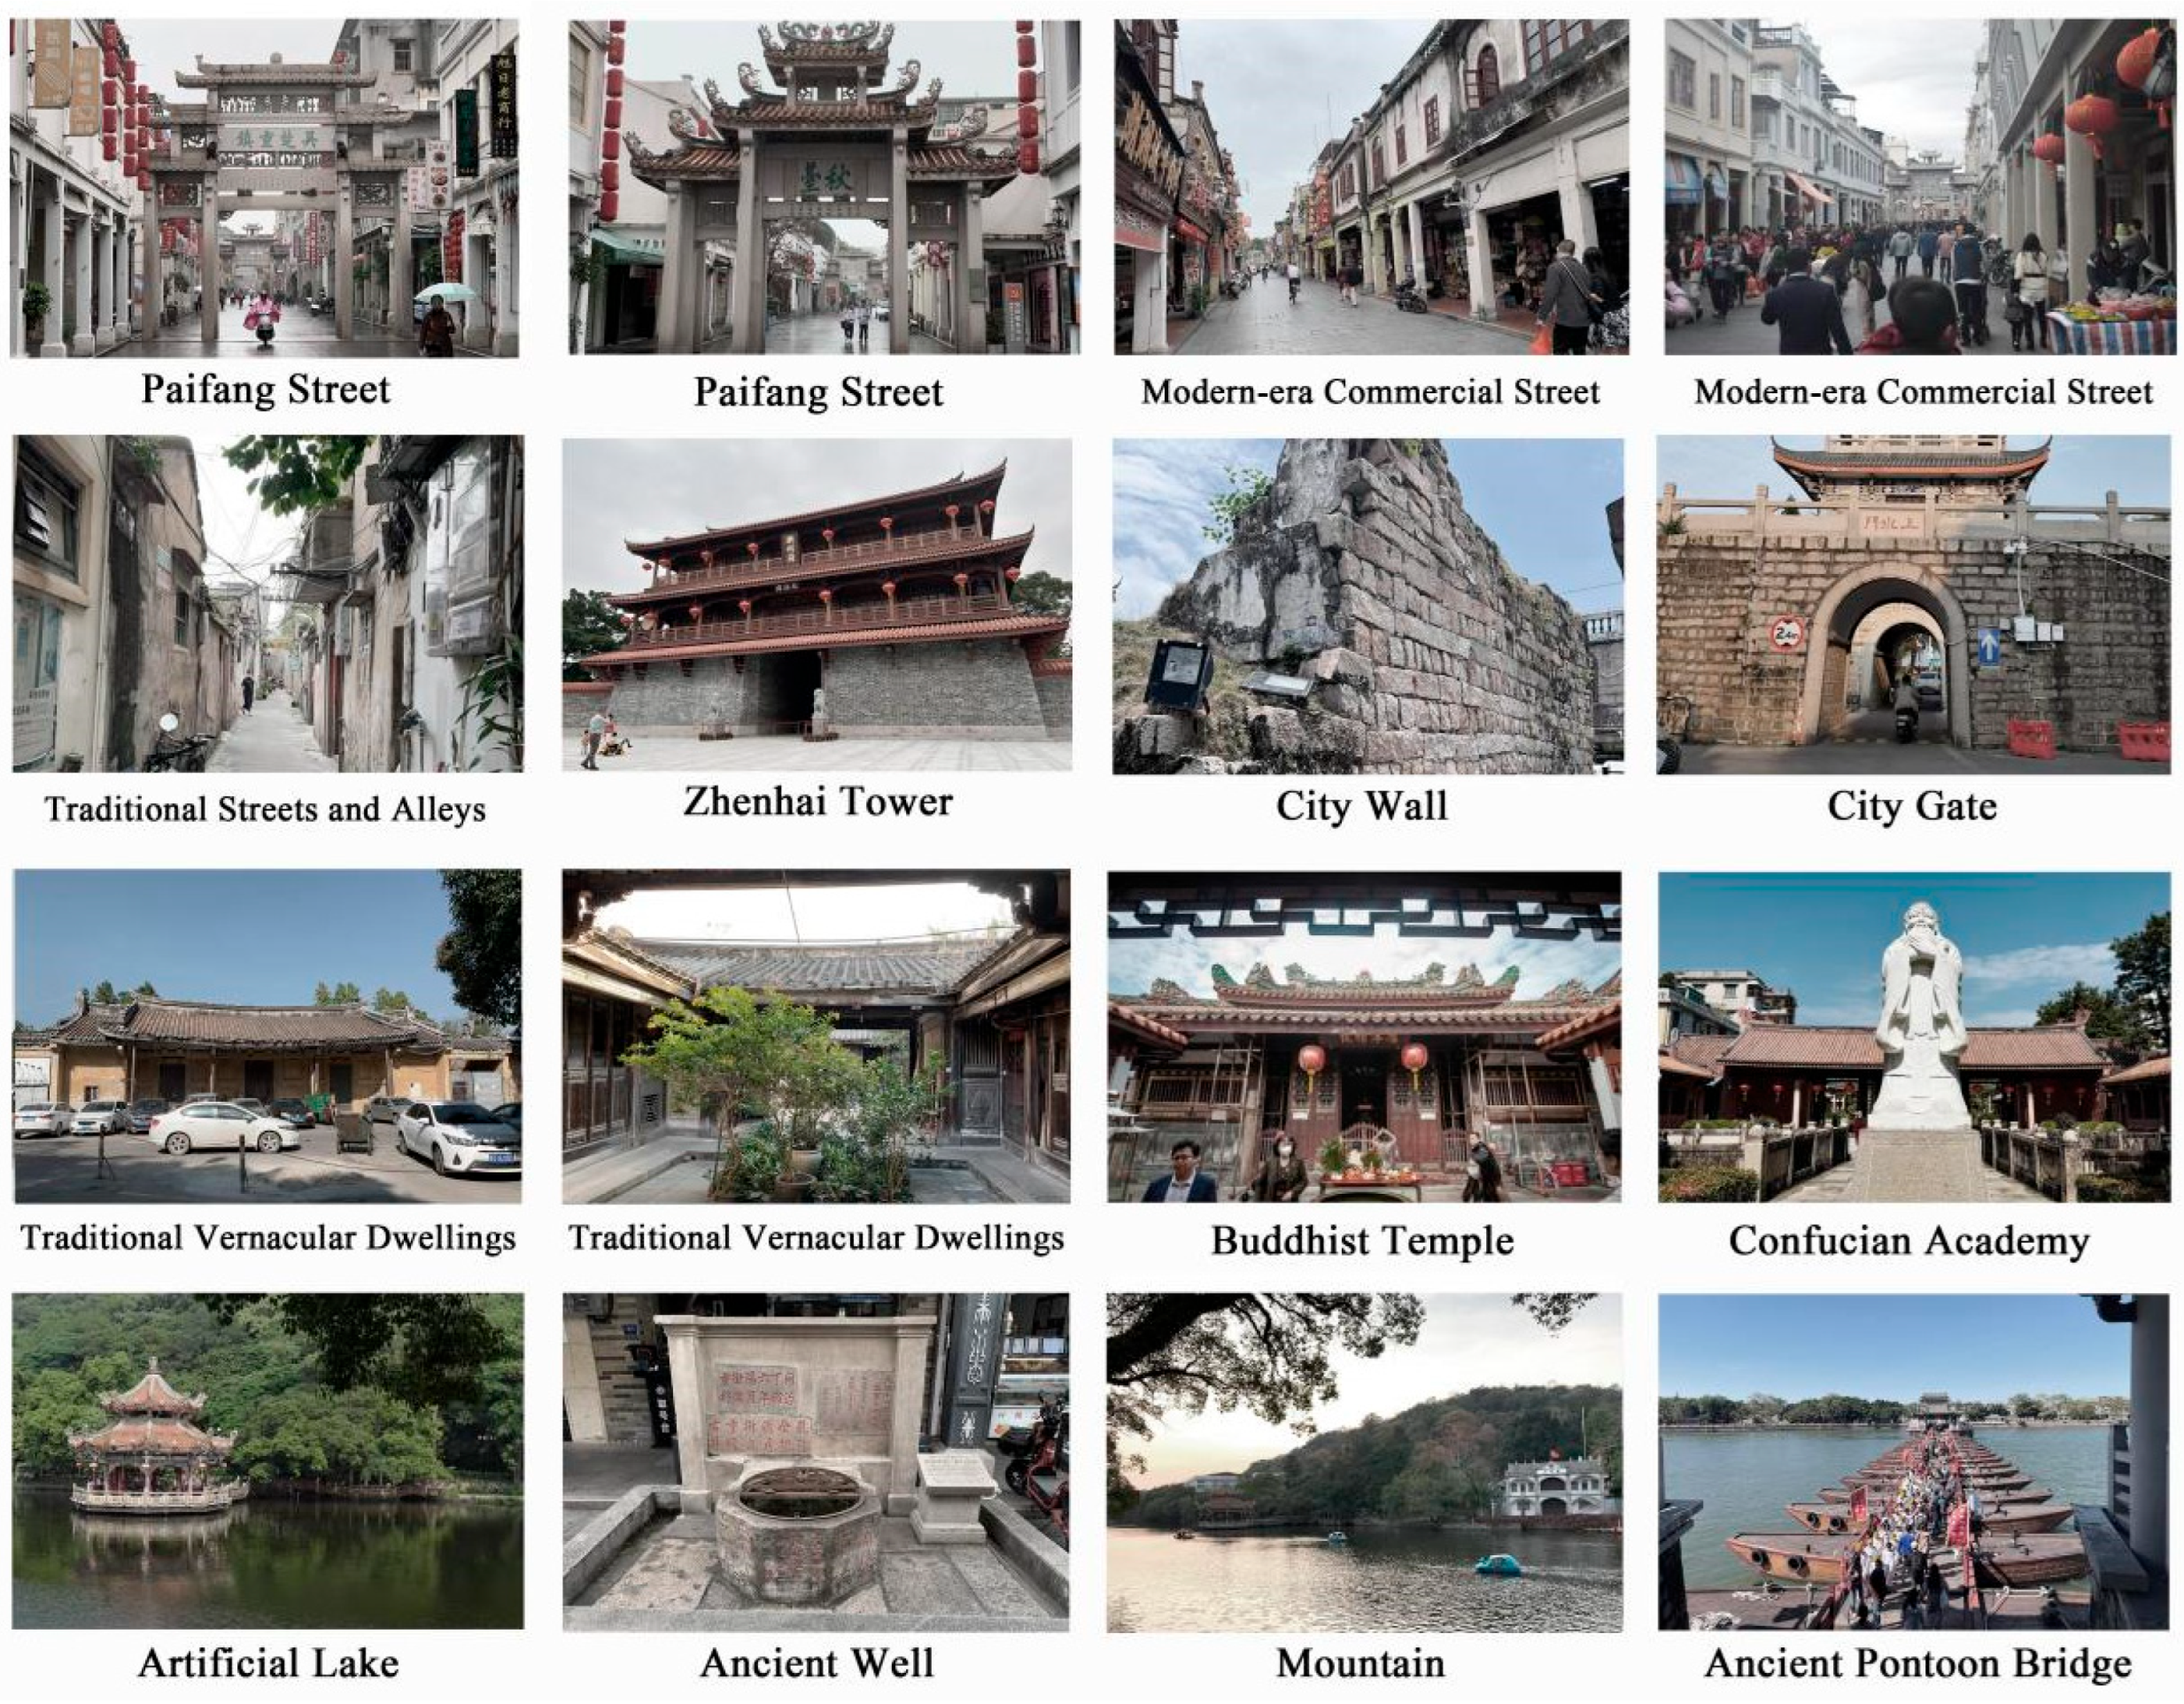
To gain a deeper understanding of the layering characteristics and value space distribution of the historical landscapes in the ancient city, this study divides the internal space of the ancient city into 112 units based on the existing historical street network and functional blocks. These streets are not only transportation arteries but also serve as key boundaries and axes for the division of historical spatial structures, the delineation of functional zones, and the organization of community life. On this basis, spaces that are too small in area and lack independent characteristics were merged, and spaces containing remains from significantly different historical periods were subdivided, ultimately obtaining 115 units (Figure 1 and Figure 2).

2.2. Data Collection and Processing

The data used in the study primarily originate from several sources: Digital Elevation Models (DEMs) are all sourced from open datasets. Topographic elevation difference data are derived from DEM data through ArcGIS Pro 3.3.1 software mapping. The landscape pattern and cultural resource points of the ancient city are based on historical maps and modern documents of Chaozhou and were formed from multiple field surveys, inspections, and corrections. Data on building quality, building age, cultural relic distribution points, and land-use within the region are based on the newly published “Chaozhou Historical and Cultural City Protection Plan (2021–2035)” and were produced based on on-site surveys and corrections. Spatial crowd vitality data and POI data are sourced from public data provided by the Chinese Baidu Map application software (Table 1).

3. Research Methodology

3.1. Theoretical Basis and Development of “Layering”

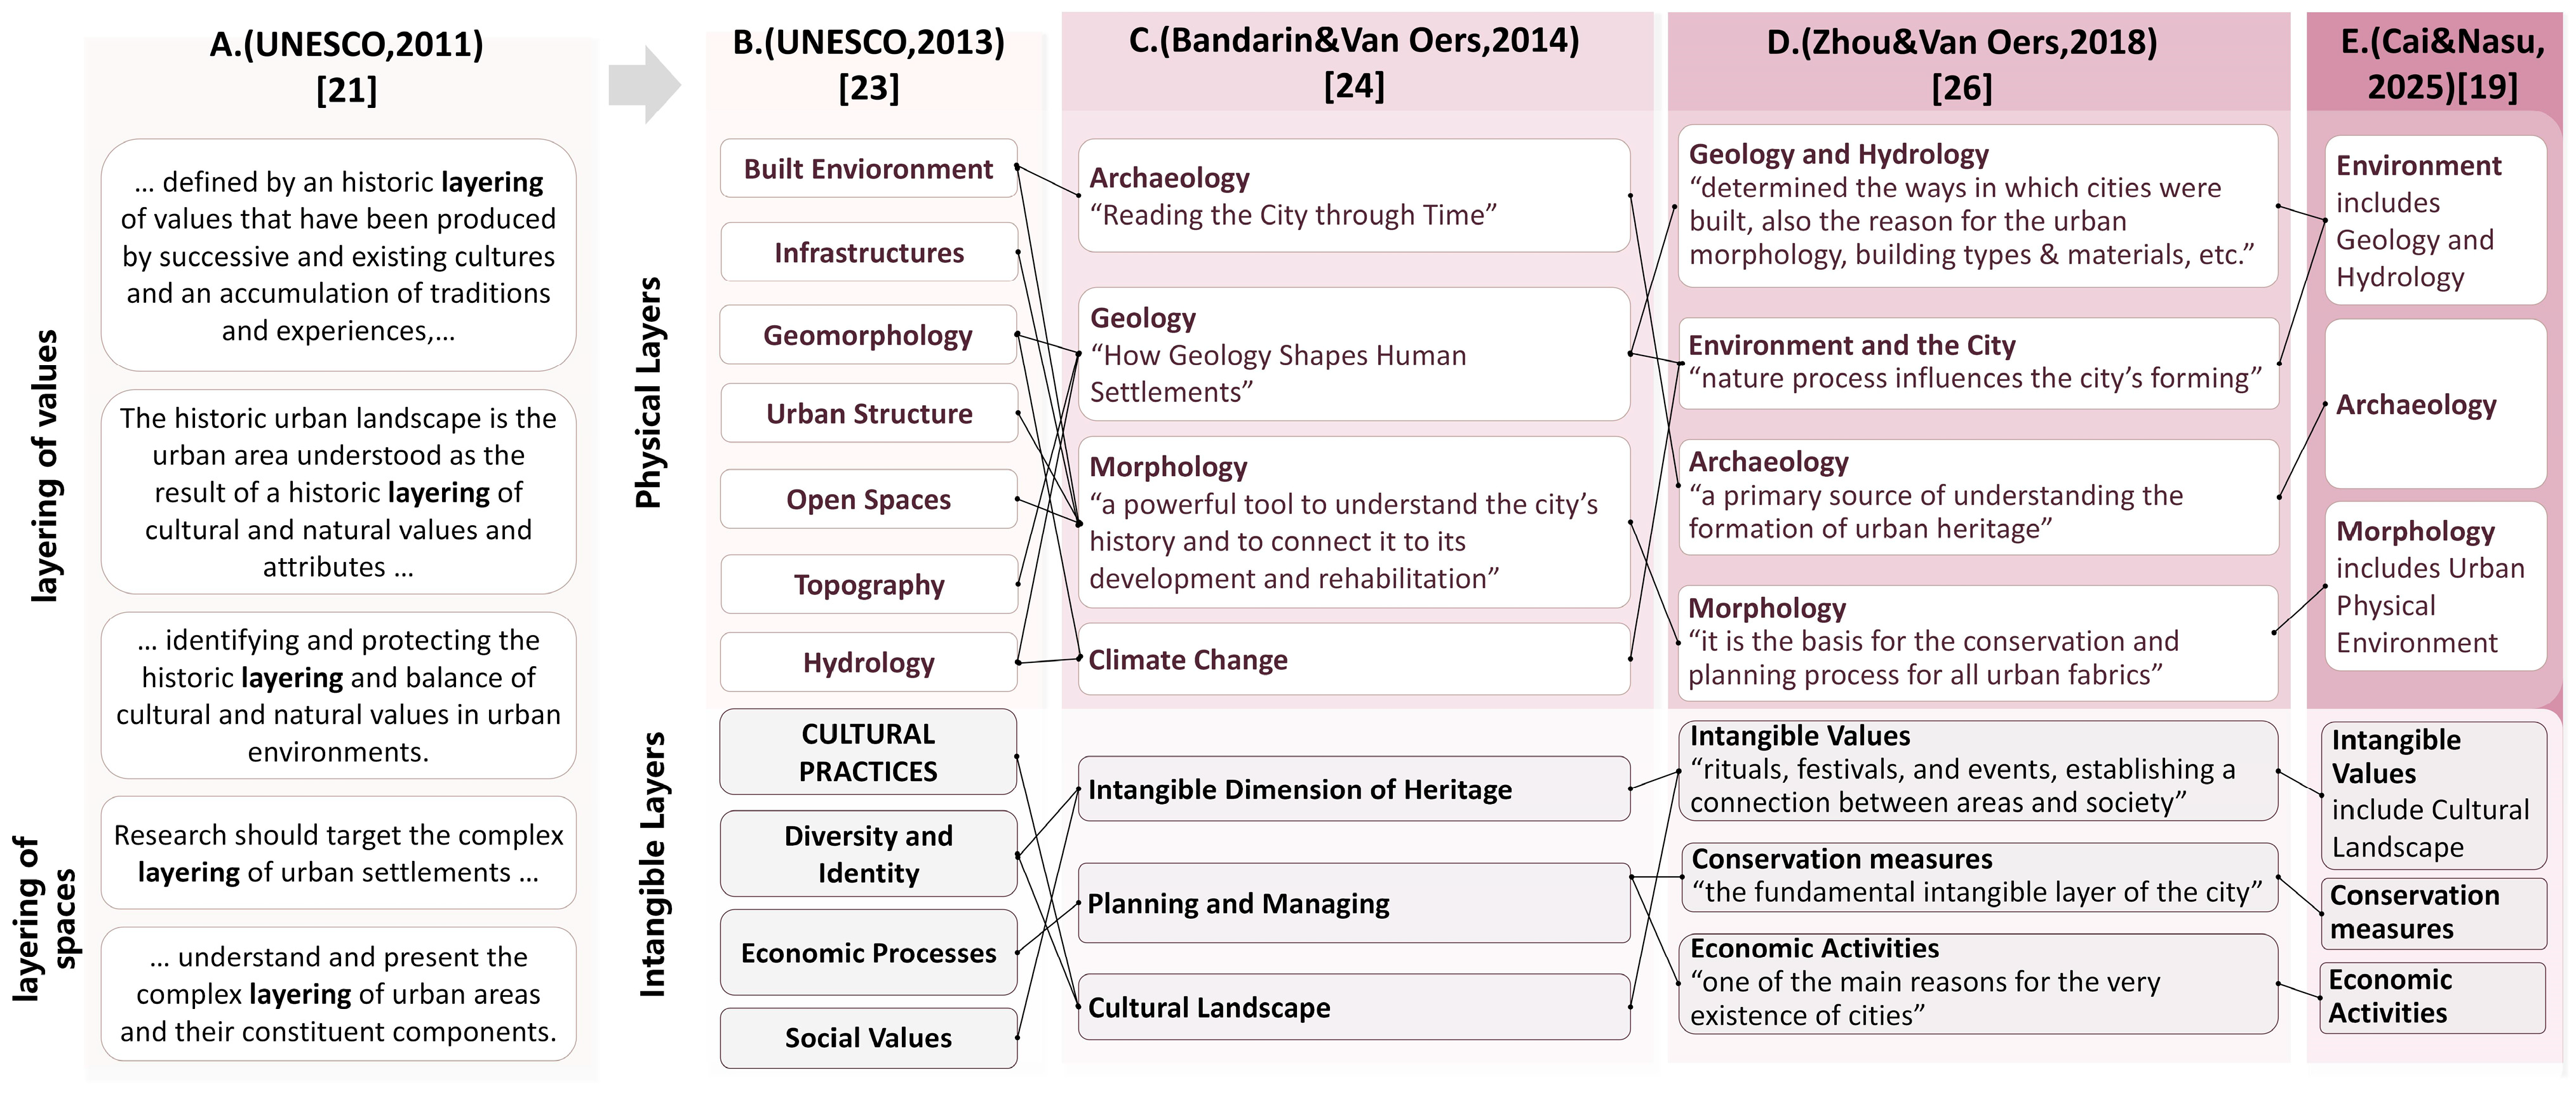
“Layering”, as a core perspective for understanding the formation and evolution of cities, has become an important theoretical concept in the field of urban heritage conservation in recent years [19]. Its core idea originates from the concept of the Historic Urban Landscape (HUL) proposed in the “Recommendation on the Historic Urban Landscape” issued by the United Nations Educational, Scientific and Cultural Organization (UNESCO) in 2011, emphasizing that urban heritage is the result of the dynamic accumulation and superposition of natural and cultural values over time [20,21]. This concept can be traced back to Ian McHarg’s “layer-cake” model proposed in ecological planning [21], which advocates viewing the city as a complex system composed of multi-dimensional and multi-layered elements interacting with each other, including environment, archaeology, morphology, intangible values, planning processes, and economic activities [22]. To emphasize the importance of the “layer” concept, UNESCO issued “New Life for Historic Cities: The Historic Urban Landscape Approach Explained” in 2013, which once again reinforced the “layer” concept and highlighted how cultural relics from different periods continue to be superimposed, accumulated, and integrated on specific spatial objects, forming a complex spatiotemporal collage [23]. The layer theory transcends the limitation of focusing solely on individual buildings or the “historic center”, extending the protection perspective to a broader urban environment and its geographical context. It serves as a foundation for understanding the interrelationships of complex urban elements and formulating effective conservation strategies [24]. Advocates of the historic urban landscape theory, Ron van Oers and Bandarin, further expanded the concept of “layering”. They contend that the layering process should encompass multiple dimensions, i.e., the material level is regarded as the “stratigraphy” of the city, while the non-material level is the core of the social dimension [25], which should include consideration of the value dimension [26]. Therefore, after reviewing previous research, it can be concluded that “layering” should include six core components [19]: environment, archaeology, morphology, intangible values, conservation measures, and economic activities, with each layer potentially containing more detailed content (Figure 3).
In practice, the concept of layers has been applied in multiple contexts. First, it serves as a framework for urban planning to guide future decisions. For instance, the city of Ballarat has adopted the layer concept to construct an open information layer database, enabling the visualization of different historical data, thereby integrating multi-source data to guide future urban conservation [27,28]. The city of Cuenca has also adopted a similar approach, establishing an urban historical layer database based on GIS and public surveys [28], which decomposes complex urban documents to facilitate a more detailed analysis of the city. Second, it serves as a tool for analyzing historical evolution by tracing the development and evolution of spatial forms and values through ancient maps, archives, and other sources. It is used in conjunction with GIS technology to explore the connections between different historical layers of the city, revealing the inherent logic of urban dynamic transformation. These applications demonstrate the potential and value of the layer concept in understanding the dynamism, complexity, and multi-scale nature of urban heritage. However, there are significant deficiencies in current applications. First, there is a lack of a systematic methodology. Although the official definition emphasizes the importance of “layers”, specific guidance and evaluation methods still need to be improved [29]. Second, the interaction between layers is often overlooked, and existing conservation plans often treat each layer in isolation, which can easily lead to fragmented conservation strategies. Third, while depicting the layering process reveals the “deposition thickness” and structural complexity of history in space, it fails to address the issue of “value realization” in the contemporary context.
Given this theoretical foundation and current development status, especially the deficiencies in existing research regarding the systematic integration of spatial elements, in-depth quantification of layering spatial correlation and its dynamic evolution, as well as the unveiling of layering characteristics and heritage value space distribution, it is necessary to propose a “layer–value spatial coupling co-ordination analysis” method. At the same time, the spatial dimension attributes inherent in the theory of urban historical landscape layering, combined with the mature application of spatial analysis technologies such as GIS, provide appreciable theoretical support and technical feasibility for constructing such a coupling coordination analysis method.

3.2. Research Framework

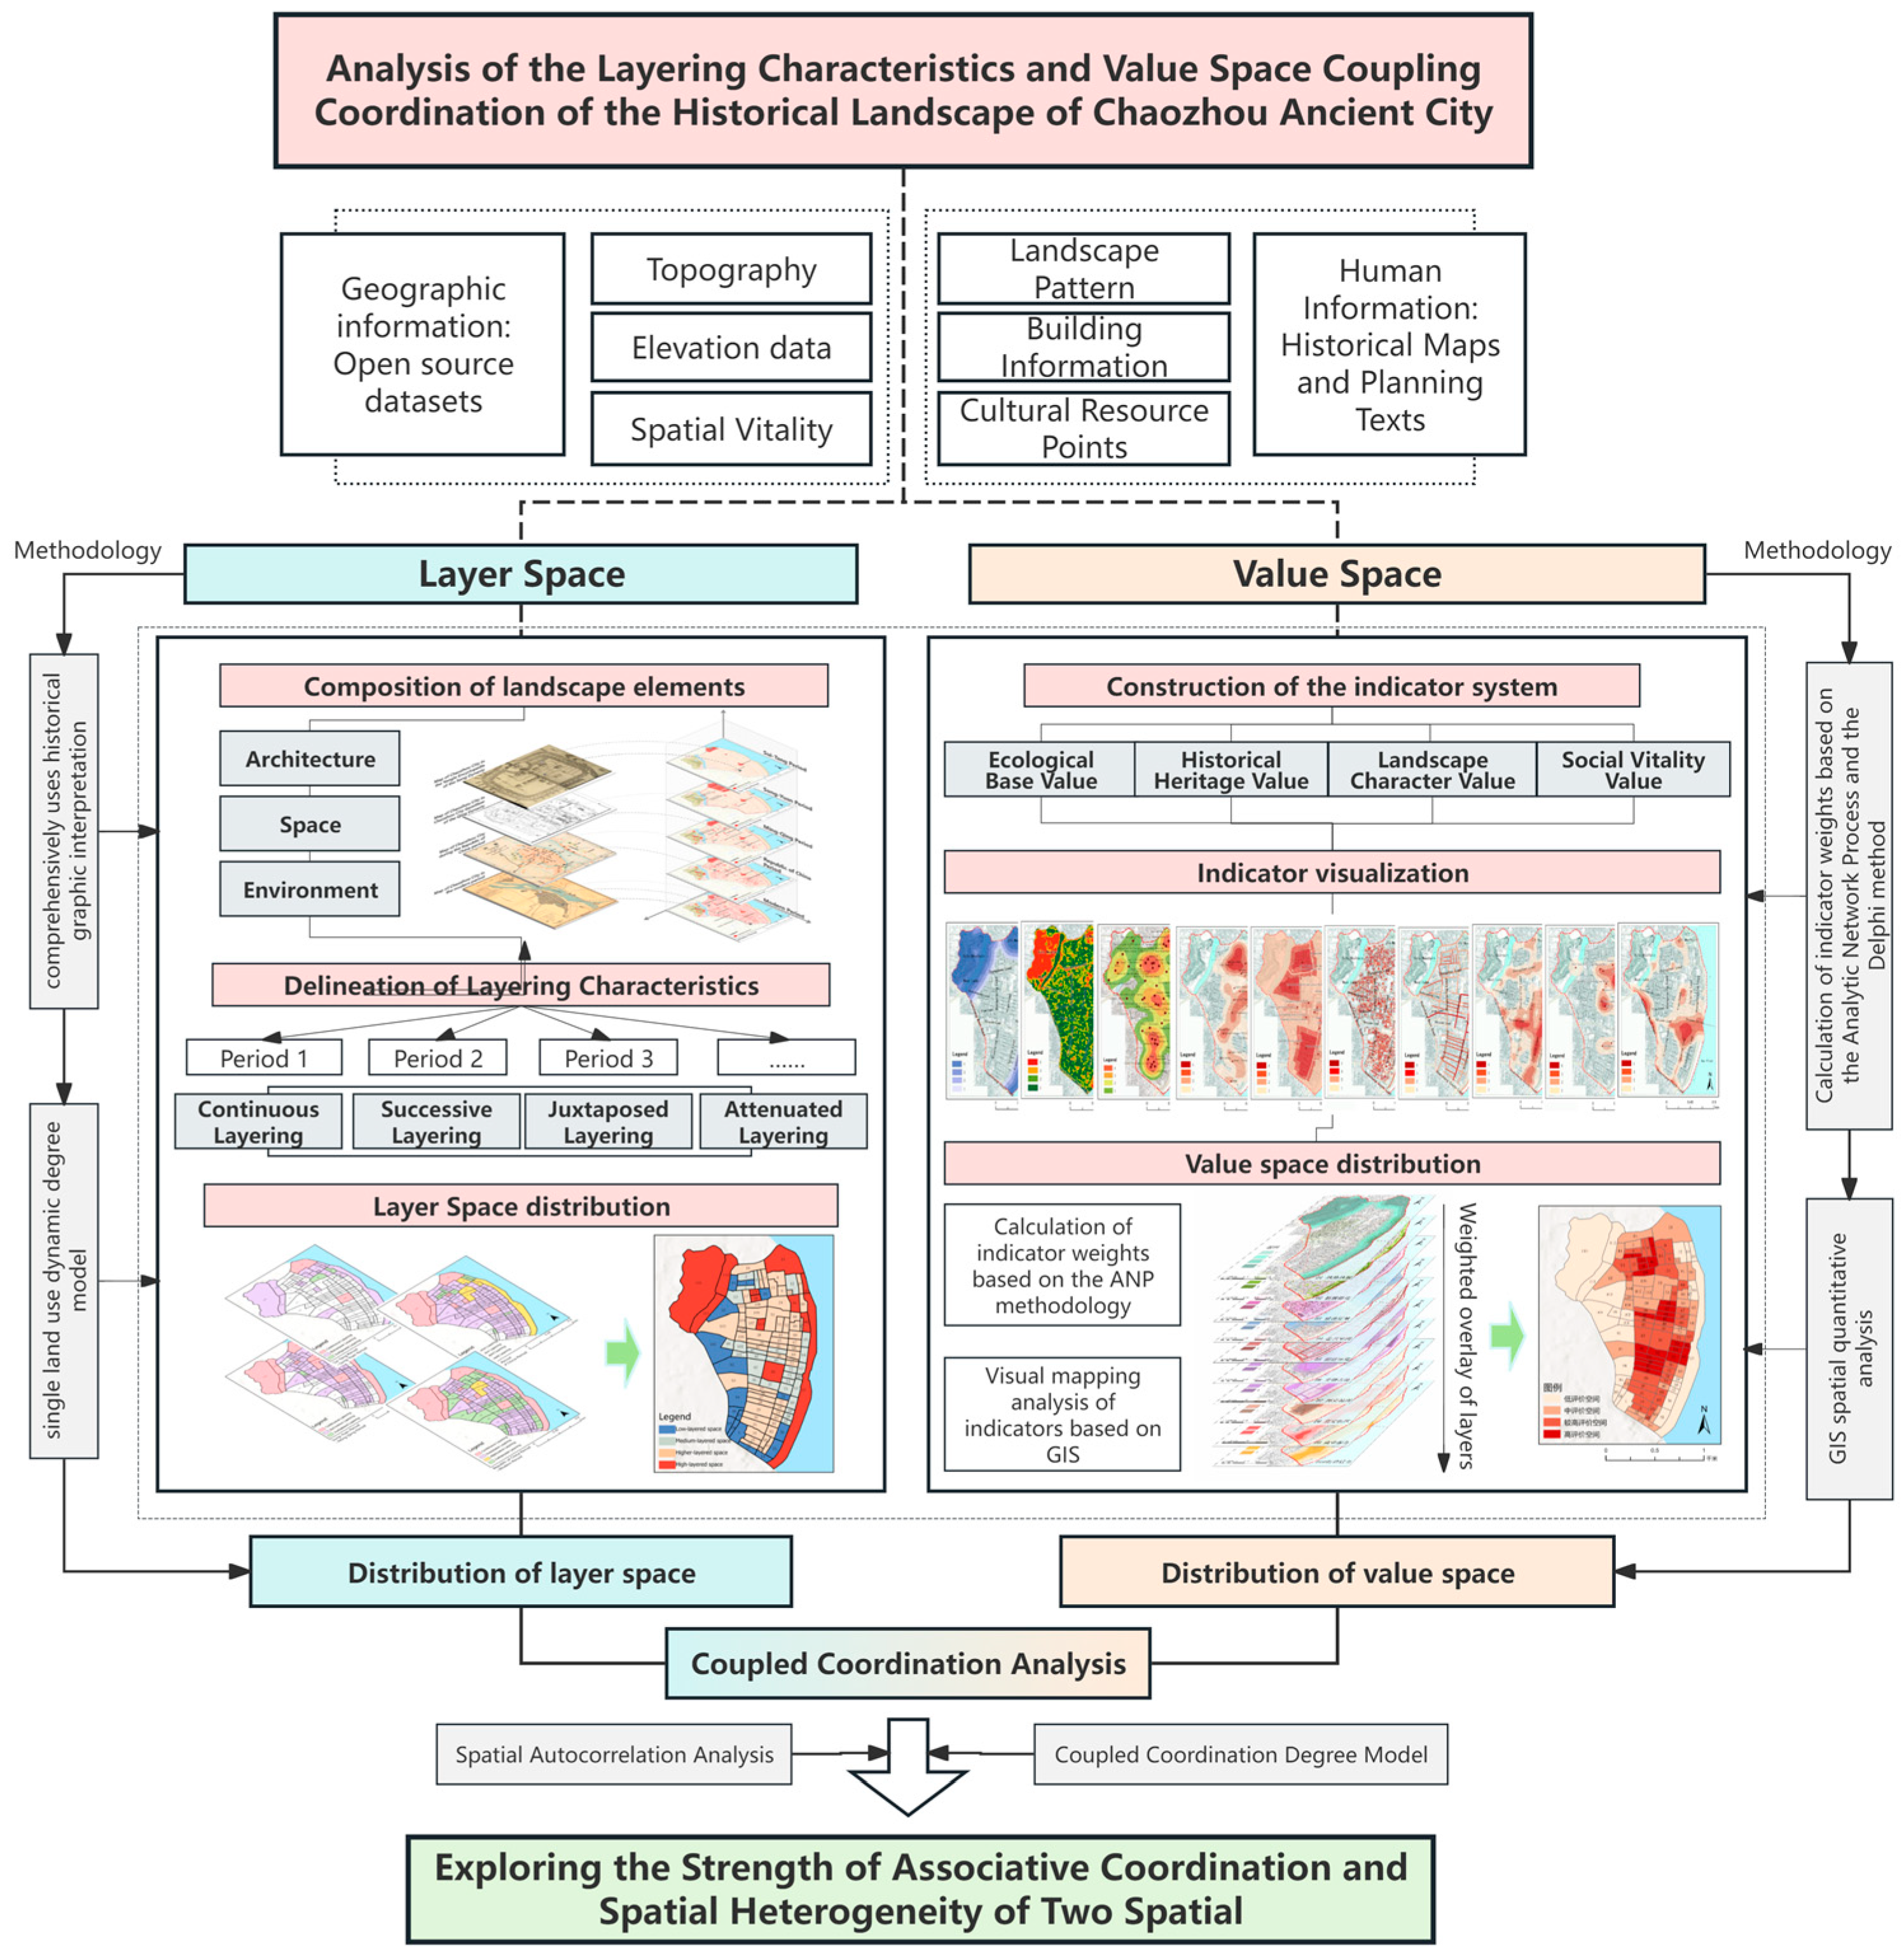
This study constructs an analytical framework for interpreting and evaluating the layering characteristics and value space of historic landscapes (Figure 4). On the one hand, historic elements are extracted from historical documents and maps to systematically analyze the spatial distribution of historic landscapes; the single-land-use dynamic degree model is then applied to examine their evolution, thereby revealing the distribution patterns of stratified space. On the other hand, a historic landscape value assessment system is established: the Delphi method is used to score the indicators, and the Analytic Network Process is adopted to determine indicator weights. Building on this, GIS is employed to achieve spatial quantification and visualization of the indicators, and value-space distribution patterns are identified through weighted overlay analysis. Finally, spatial autocorrelation and coupling coordination degree models are employed to investigate the correlation, coordination level and spatial heterogeneity between the layer space and value space, so as to provide a scientific basis for the sustainable planning and management of the historic city in the future.

3.3. Method of Layering Characteristics of Historic Landscapes

3.3.1. Composition of Landscape Elements and Division of Layering Periods

The layering of urban historical landscapes mainly unfolds along the temporal and spatial dimensions, and the collected information should not be viewed in isolation; usually, it is necessary to explore their interconnections [24]. Therefore, it should include two key axes: the distribution of landscape elements in the horizontal spatial dimension and the superposition of landscape elements in the vertical temporal dimension.
Regarding the distribution of landscape elements in the horizontal spatial dimension, according to the “layer composition” framework mentioned above (Figure 3), spatial dimension elements should include urban buildings, streets, open spaces, and other elements. Drawing on the classification of scholars such as Li Heping [30], and based on morphology and typology, the elements of ancient cities’ historic landscapes are divided into three categories: the architectural landscape, spatial place, and environmental landscape. The architectural landscape is subdivided into three types: public buildings, residential buildings, and commercial buildings. The spatial place is subdivided into two types: streets and alley spaces, and squares and courtyards. The environmental landscape is subdivided into two types: mountain forms and terrains, and water conservancy and water systems. Based on this classification system, this study places historical landscape elements on modern maps through the interpretation of historical texts and images, aiming to establish a unified spatial benchmark and lay the foundation for subsequent diachronic comparative analysis.
In terms of the superposition of landscape elements in the vertical temporal dimension, attention should be paid to the evolution and superposition relationship of the selected elements in the time series. This involves the issue of time division in different layering stages, generally using the “life-cycle method” and “chronological dating method”. Due to the influence of changes in state power and political systems on the development of ancient Chinese cities, which exhibit significant chronological characteristics, it is more appropriate to adopt the chronological dating method when specifically dividing the layering stages of historic landscapes, taking into account the political background and construction realities of specific eras.

3.3.2. Division of Landscape Layering Characteristics

The superposition of landscape elements in the vertical temporal dimension can reveal the relationship patterns among various layers. Unlike previous studies that relied heavily on subjective judgments to identify such changes, this study further attempts to refer to the “single-land-use dynamic degree” calculation model. This model is an indicator used to measure the speed and magnitude of the area change of a certain region in a specific time period, which is used to reflect the degree of spatial type change [31]. The specific formula is as follows:
K i = U b i U a i U a i × 1 T × 100 %
In Formula (1), K i denotes the dynamic degree of layering type, U a i and U b i denote the area changes in different periods in the region, and T is the study period. When K i > 0, the layer space is in an expanding state. Conversely, when K i < 0, the layer space is in an attenuated state. The greater the absolute value of K i , the more intense the change.
Based on the results of the K i calculation, the data were divided using the natural breakpoint method. At the same time, this study summarizes the existing research [32] and further refines four typical historical layering patterns: continuous layering, coverage layering, juxtaposed layering, and attenuated layering (Figure 5). The continuous type shows that the core landscape elements maintain the stability of ontological attributes and spatial correlations during the development, and the rate of change in K i is lowest. The coverage type reflects that the landscape elements have been completely replaced with new forms, and the rate of change in K i value is highest. Finally, the juxtaposed type is a small-scale fusion of the previous two types, which reflects the spatial coexistence and collage of landscape elements in multiple periods, such that the rate of change in K i is moderate. The attenuated type is characterized by the physical destruction and cultural rupture of landscape elements due to a lack of maintenance or functional failure; in this case, the K i is negative. This analysis aids our understanding of the evolutionary development of historical environments and facilitates the precise identification of layer spaces that exhibit significant historical depth and complexity.

3.4. Value Assessment Model of Historic Landscapes

3.4.1. Construction of Evaluation System

Values are defined by social relationships that produce a full variety of typologies [33]. As the origin of the Principles for the Conservation of Heritage Sites in China, the Burra charter plays an important role in contemporary heritage value research. The Burra Charter’s original four-value typology—aesthetic, historic, scientific and social—initially suits the complexity of the heritage city. But this typology lacks the proper acknowledgement of cultural or economic values, which are a fundamental part of the living condition of the city today [34]. Starting from a landscape perspective, the HUL approach broadens the focus from architectural monuments to include social, cultural and economic processes for conserving urban values. Therefore, it provides a good complement in terms of cultural and economic value.
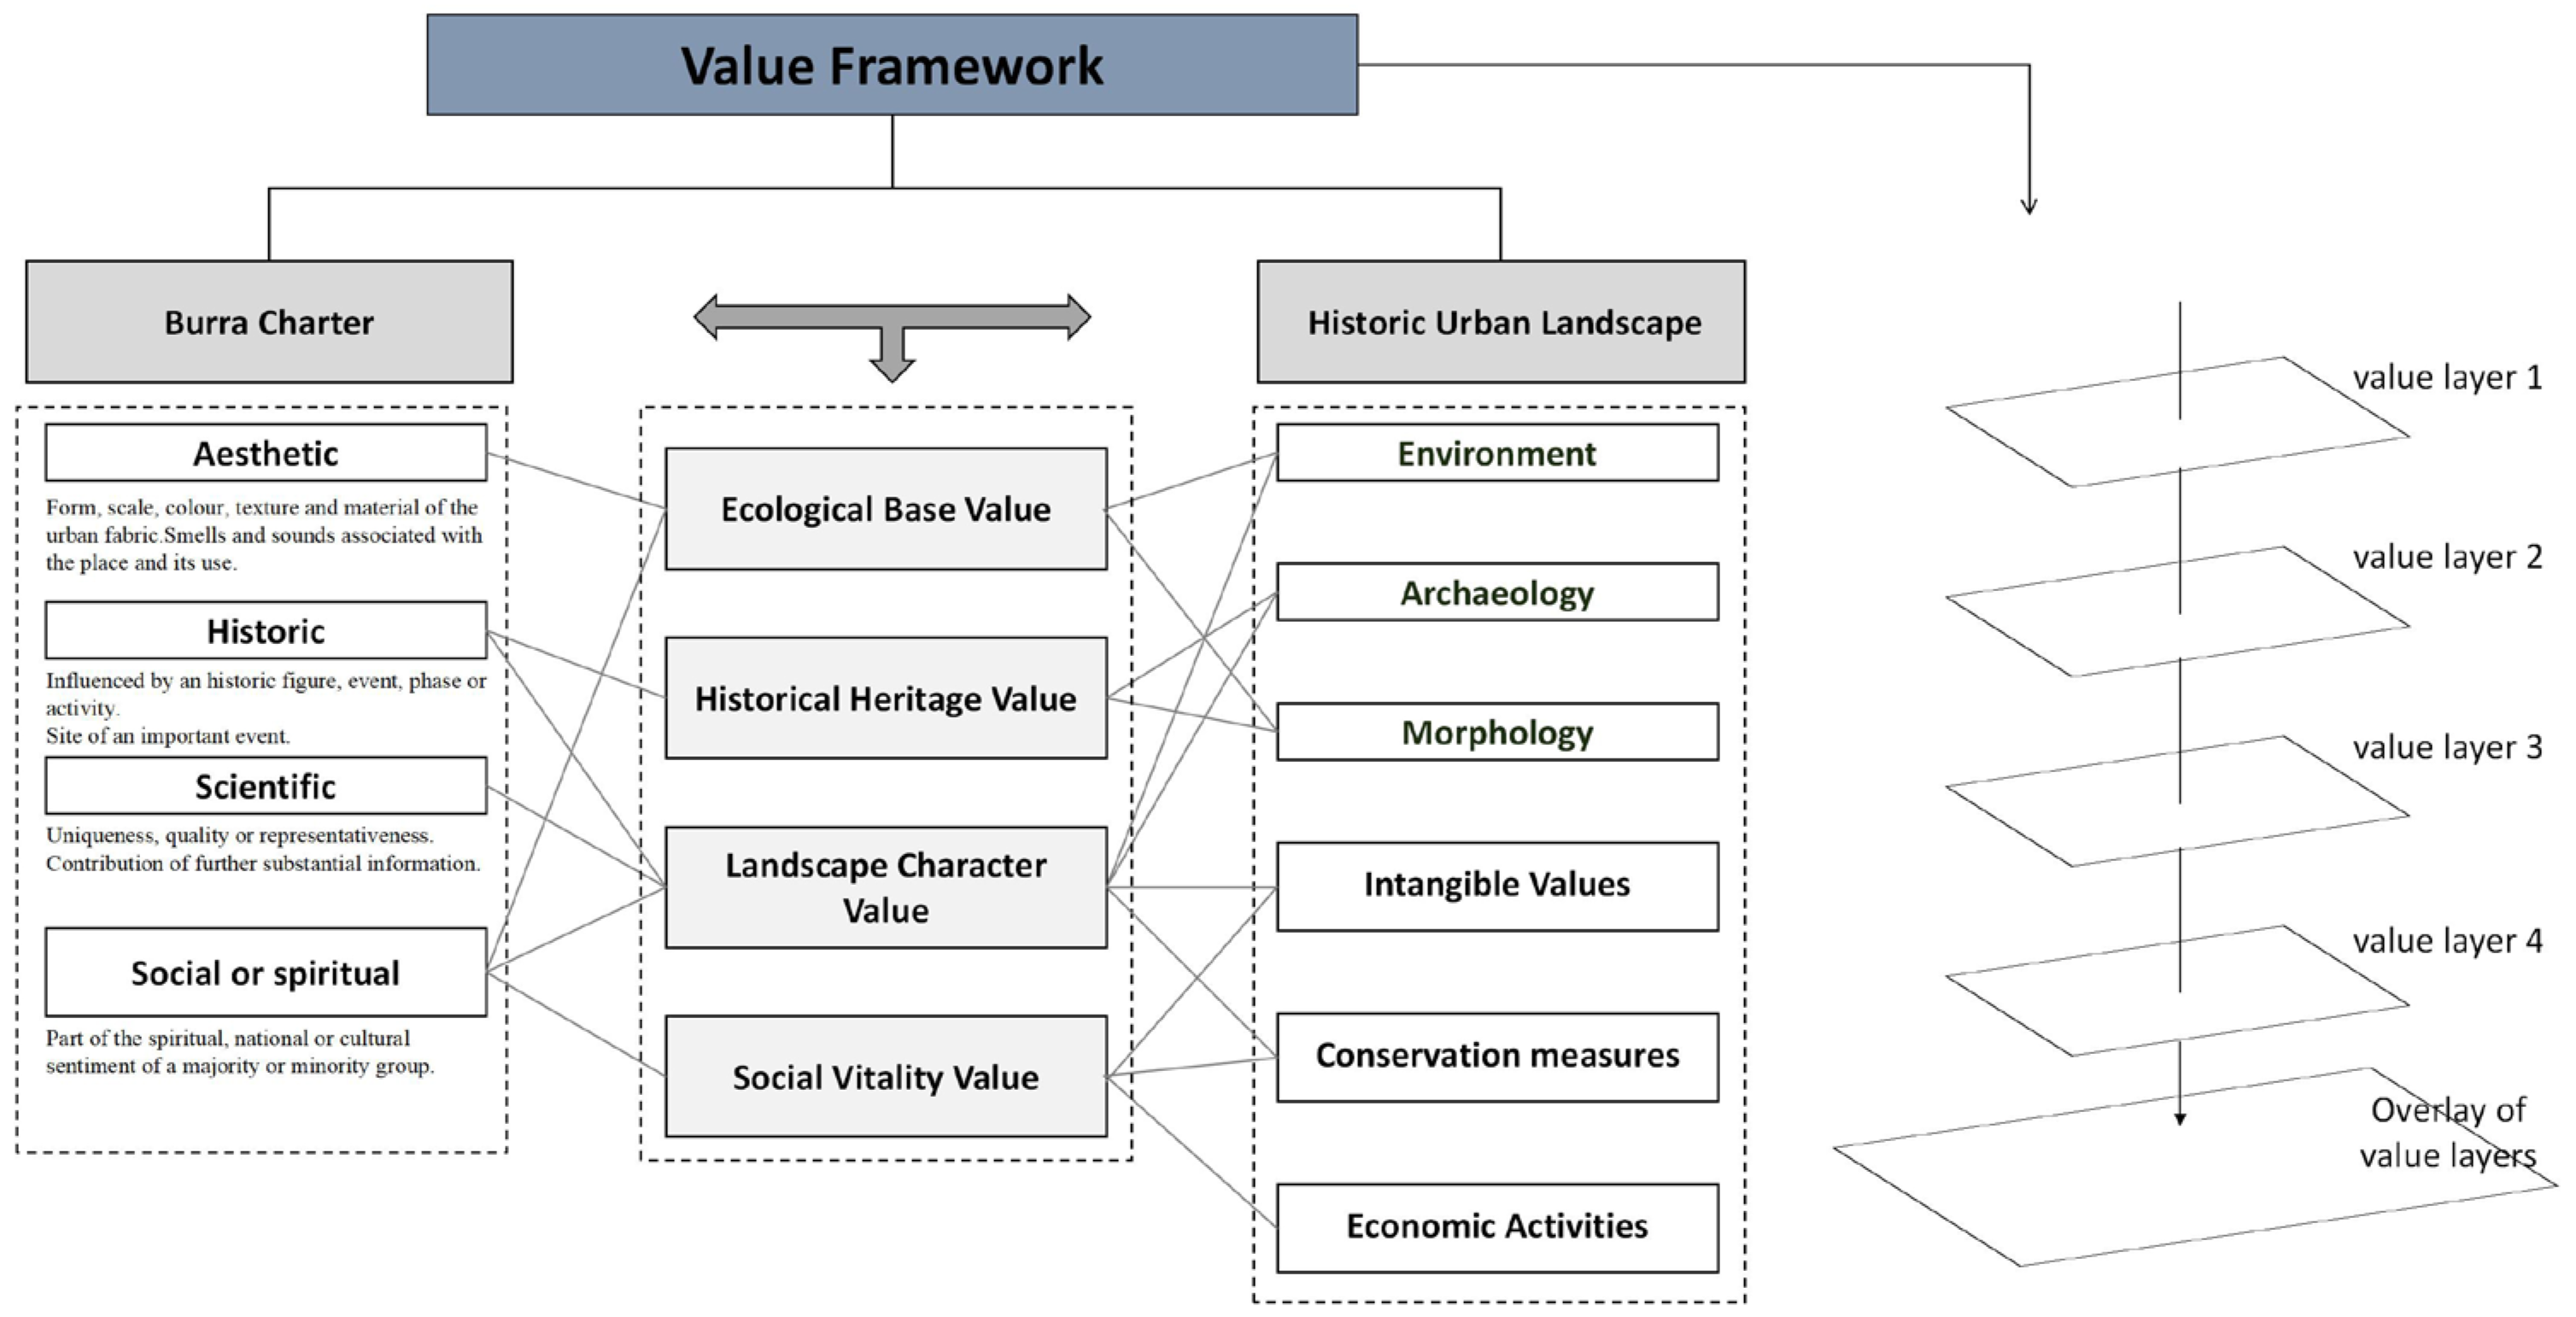
This study synthesizes the aesthetic, historical, scientific, and social value classifications of “The Burra Charter” [35], combined with the conceptual composition of “layering” outlined above, and draws on previous research on the value of urban heritage [36,37]. Based on these, a value assessment system is proposed, which includes four types of value, namely Ecological Base Value, Historical Heritage Value, Landscape Character Value, and Social Vitality Value (Figure 6); this is further subdivided into 10 assessment factors (Table 2). Among them, the Ecological Base Value is the natural foundation of the development of the ancient city, which refers to the role of the natural environment, such as mountains, topography, vegetation and water systems, in supporting the historic landscape; it determines the basic spatial pattern and ecological adaptability of the ancient city. The Historical Heritage Value is embedded in the old buildings and districts of the ancient city, which is the irreplaceable core value of the ancient city based on physical carriers such as cultural relics and monuments, historical places, etc., which carry the real historical memory and cultural identity. The Landscape Character Value arises from the interactive experience between people and the space of the ancient city, through the appearance of traditional buildings, the scale of streets and alleys, and other visual features, so that today’s people can feel the historical atmosphere and realize the connection between ancient and modern emotions. The Social Vitality Value reflects the practical function of the ancient city in contemporary life, which manifests in the ability of cultural facilities to serve the people and the economic power brought about by commercial activities. The framework aims to expand and deepen the understanding of the value of historical urban landscape, and to build a comprehensive value assessment system that connects history and the present, integrating the objective environment and the subject’s cognition.
To further determine the weight coefficients between indicators, this study used the Delphi method to score the indicators and utilized the Analytic Network Process (ANP) to determine the weights of each level of indicators. The Delphi method systematically integrates and quantifies the professional judgments and preferences of experts and relevant stakeholders through structured multi-round expert consultation to enhance the objectivity and consensus of weight assignment [38]. Analytic Network Process is an analytical method for multi-objective and multi-criteria problems, developed based on the traditional Analytic Hierarchy Process (AHP), and its effectiveness has been widely verified in the fields of urban construction and environmental studies [39]. For the specific steps of ANP model construction, supermatrix calculation, and limit supermatrix solution, refer to the literature [40]. In this study, the weight calculation was conducted with the help of SuperDecision V3.2 software.

3.4.2. Visualization of the Indicator System

The study is based on the ArcGIS Pro 3.3.1 platform, primarily utilizing two spatial analysis methods (raster reclassification and spatial kernel density analysis) to visualize the spatial distribution characteristics of assessment indicator elements. Raster re-classification is based on existing multi-source information data and transforms raw data into comparable and interpretable spatial information by raster visualization layers. Kernel density analysis is used to calculate the density of the element points in the region [41], which can reflect the discrete and clustering characteristics of the element points in the specified space, and explore their distribution trends in the space [42]. The calculation formula is as follows:
f ( x ) = 1 n h i = 1 n K x x i h
In Formula (2), f ( x ) denotes the estimated kernel density at point x ; h ( h > 0) denotes the bandwidth; n is the number of samples; ( x x i ) denotes the distance between the element point x i and the estimated point x ; and K denotes the kernel function [35]. A larger value of f ( x ) indicates a higher density of points.

3.5. Spatial Autocorrelation Analysis Model

Spatial autocorrelation is a measure of urban spatial clustering (positive correlation) and spatial discretization (negative correlation) [43], which is important for assessing the linkage and its degree between layer space and value space. In this study, the global Moran’s I index and local Moran’s I index were calculated with the help of GeoDa 1.22 software [44], and Local Indicators of Space Association (LISA) was further adopted to characterize the degree of local spatial correlation and difference between a certain assessment unit and its neighboring spaces [45,46]. Different clustering patterns of the spatial distribution of the two can be identified through the LISA clustering analysis diagram: positive spatial correlation results in high- or low-value clustering, while negative spatial correlation results in high–low clustering or low–high clustering [47]. The formula is as follows:
M o r a n s   I = n i = 1 n j = 1 n w i j i = 1 n j = 1 n w i j ( x i x ¯ ) ( x j x ¯ ) i = 1 n ( x i x ¯ ) 2
L I S A i = ( x i x ¯ ) 1 n j = 1 n ( x j x ¯ ) 2 j = 1 n w i j ( x j x ¯ )
In Formulas (3) and (4), n denotes the geographic unit; W i j denotes the spatial weight; x i and x j , respectively, denote the observations of the i or j spatial unit; and Moran’s I index ranges from −1 to 1, where a positive value indicates spatial clustering, a negative value indicates spatial discretization, and a value of zero indicates the absence of spatial autocorrelation.
In addition, selecting an appropriate spatial weight matrix is crucial for determining spatial relationships. There is currently no uniform standard for selecting spatial weight matrices. Several conceptualization methods are available, including distance-based methods (fixed distance, inverse distance, zone of indifference), contiguity-based methods (queens and rooks), etc. [48]. Queen Contiguity defines which regions are considered neighbors of a particular region based on shared boundaries, corners, or vertices. This means that two regions are considered adjacent or contiguous if they touch at any point, whether it is along an edge (side), a corner, or a single point [49]. In this study, the basic spatial unit is the internal space of the ancient city, which is mostly irregularly shaped areas. Therefore, we specifically opted for the ‘Queen Contiguity’ spatial weight metric due to its superior fit compared to other weight techniques, such as Rook Contiguity and inverse distance [50]. The relevant calculations are implemented using GeoDa 1.22 software.

3.6. Coupling Coordination Degree Model

The Coupling Coordination Degree Model is based on the physical concept of the coupling degree. It can distinguish between coupling interactions or mutual feed-forward relationships between subsystems [51]. In recent years, this model has been widely used and validated in urban spatial studies [52,53]. First, the study standardizes the data for each indicator using the extreme difference method [54] and then introduces the model to measure the degree of coordination between the historic landscape layer space and the value space in the study area. The specific formula is as follows [55]:
C = 2 f ( a ) × f ( b ) [ f ( a ) + f ( b ) ] 2
T = α f ( a ) + β f ( b )
D = C × T
In Formulas (5)–(7), C refers to the coupling degree; f ( a ) and f ( b ) refer to the composite indices of layer space and value spaces; T represents the composite index between the two systems; and the weights α and β are undetermined coefficients, and their sum should be 1. This study contends that the two subsystems of layer space and value space are equally important in ancient cities, hence α = β = 0.5; D denotes the coupling coordination degree, with a higher value indicating a higher degree of coordination. It is determined by the difference between the composite indices of the two indicators to define the three dimensions of coupling coordination type (Table 3) [56].

4. Results

4.1. Layer Characteristics of Historic Landscapes of Chaozhou Ancient City

4.1.1. Evolution of Landscape Elements

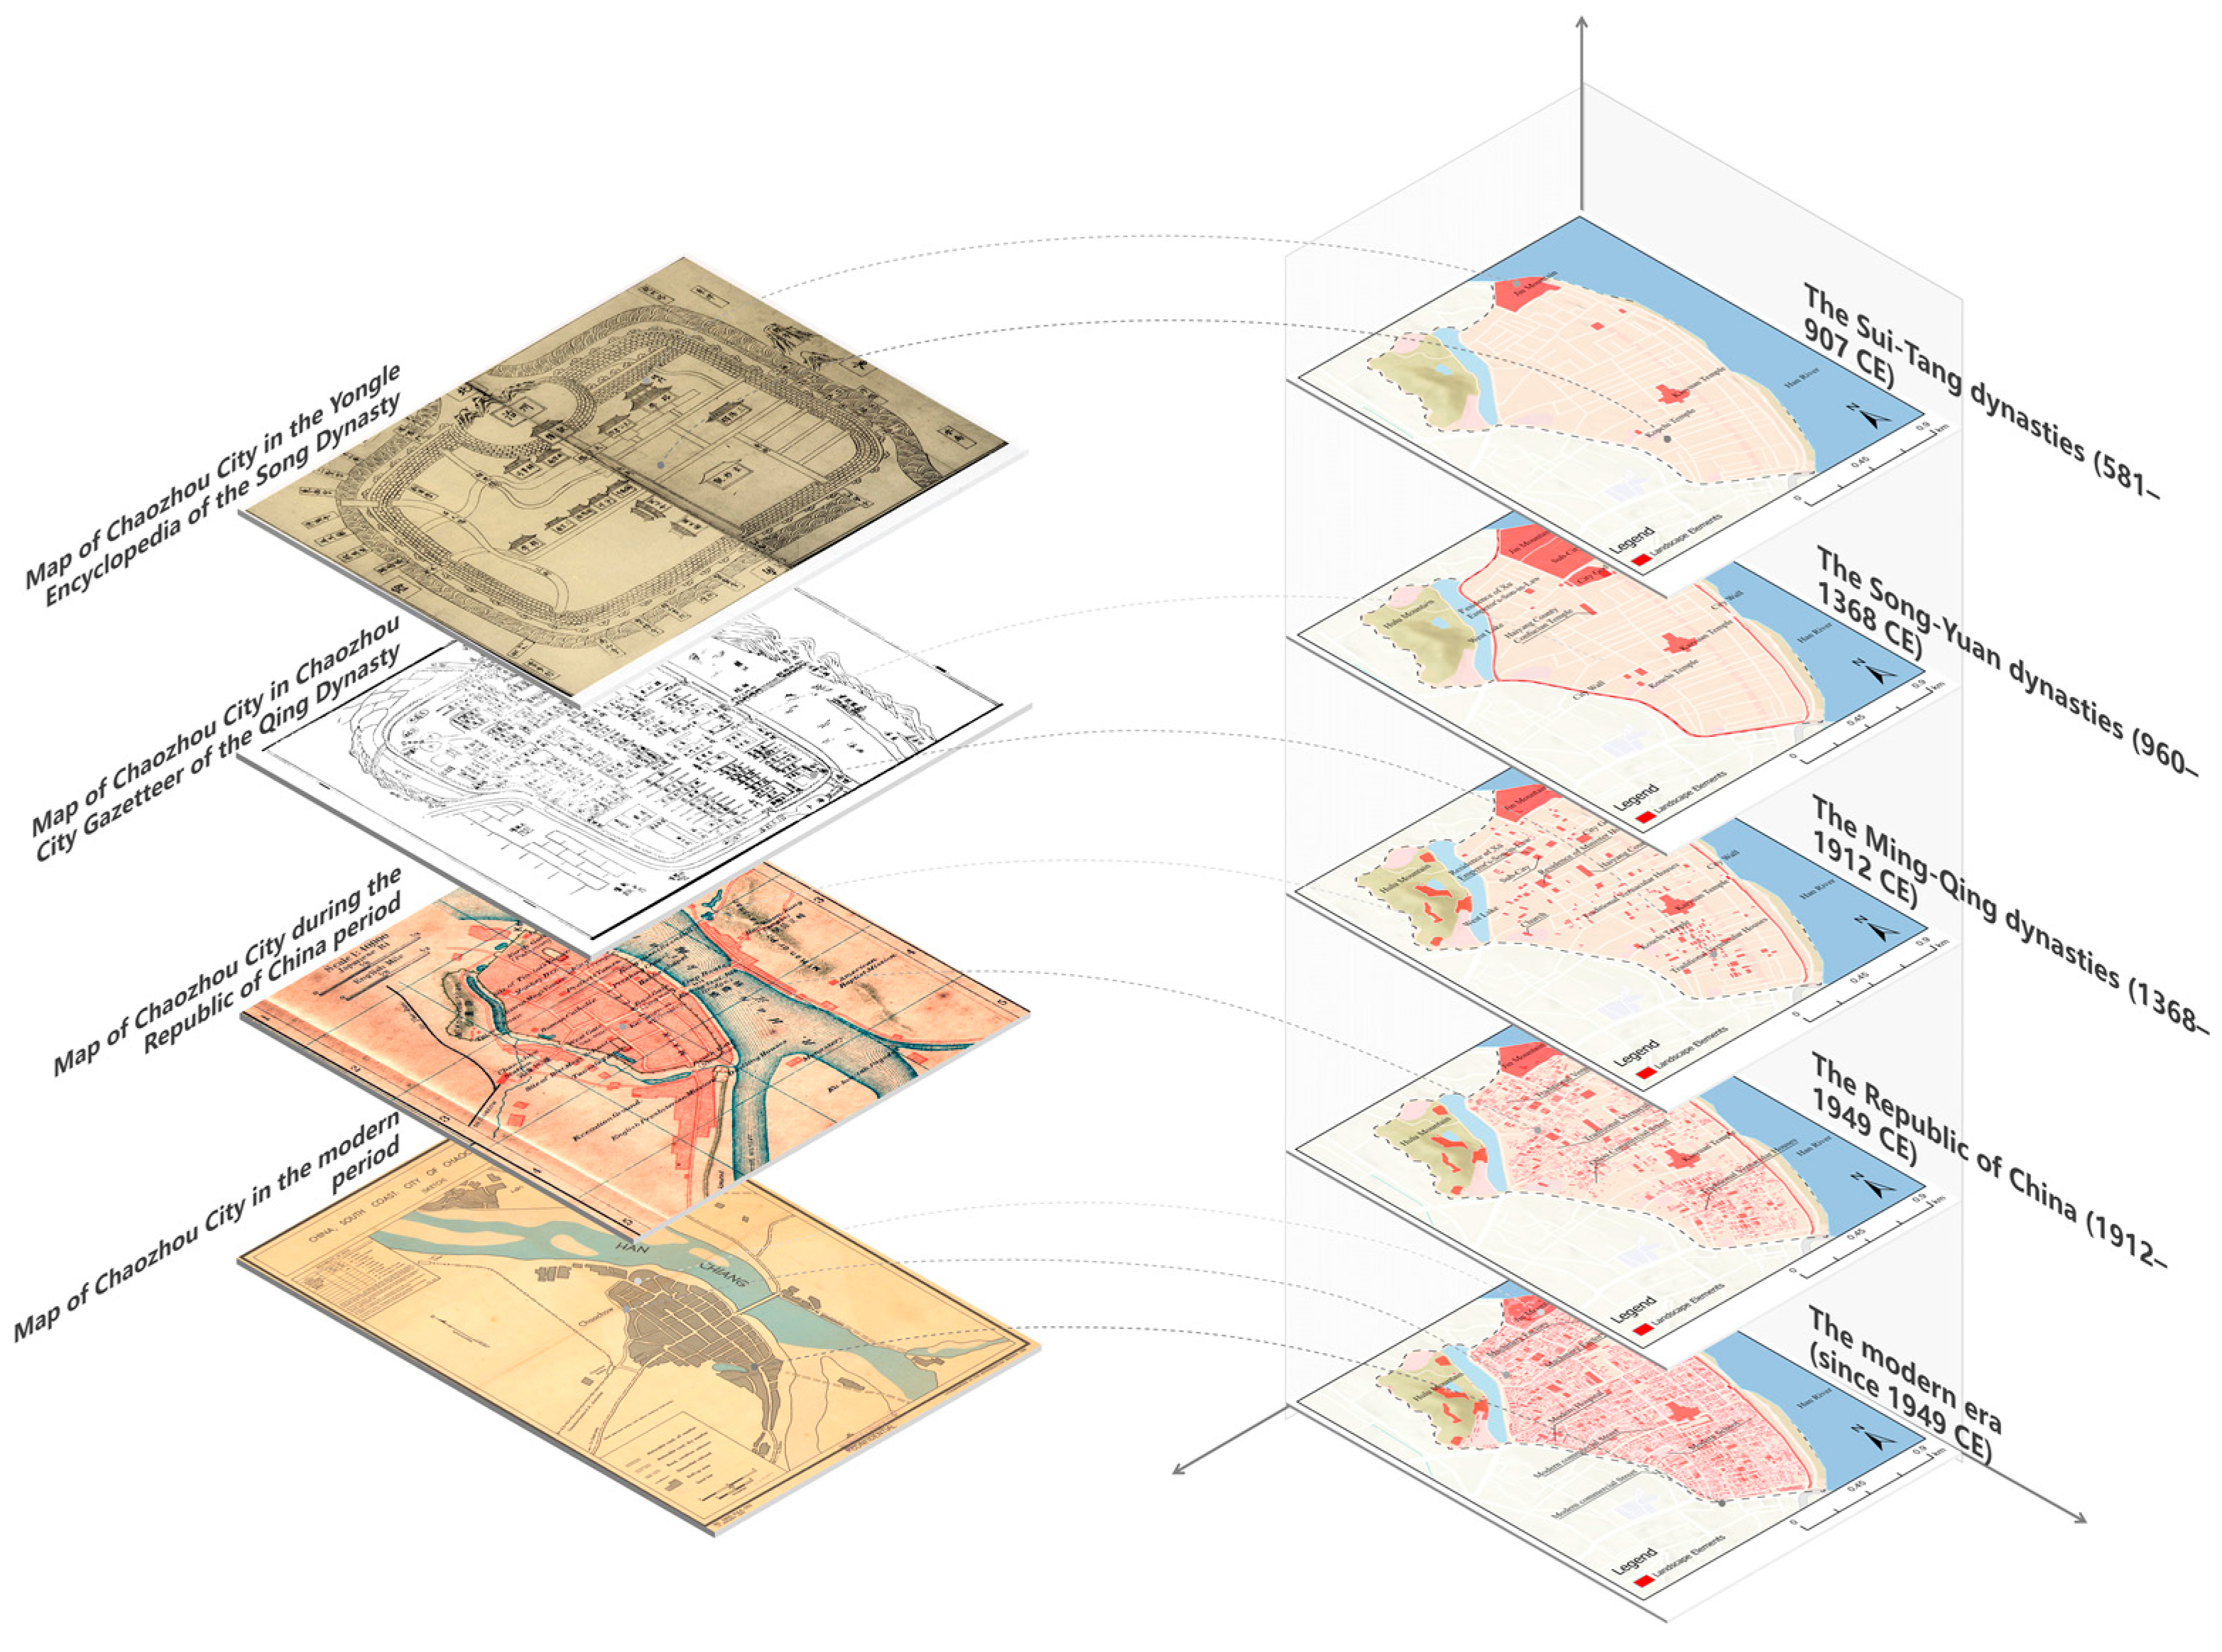
Based on historical evidence and current research, the evolution of the historic landscape layering of Chaozhou Ancient City is divided into five phases according to the development cycle: the Sui–Tang dynasties (581–907 CE), the Song-Yuan dynasties (960–1368 CE), the Ming–Qing dynasties (1368–1912 CE), the Republic of China (1912–1949 CE), and the modern era (since 1949 CE). The study of the first three periods is based on ancient historical maps, and that of the last two periods is based on satellite images. The spatial distribution of landscape elements in each period was visualized using ArcGIS Pro 3.3.1 (Figure 7). It is important to note that the approximately 53-year interval between the Sui–Tang dynasties and the Song–Yuan dynasties was a period of intense political fragmentation and warfare, known as the Five Dynasties and Ten Kingdoms period (907–960 CE). This period was marked by political instability and frequent warfare, resulting in few surviving ancient buildings and extremely limited historical records, making it difficult to establish an independent and clear research framework comparable to other periods. Therefore, this study does not include this transitional period within its scope. To clearly illustrate the superposition and evolution of key landscape elements within a relatively stable spatial framework across different periods, the base maps in the figure all use the core area of modern Chaozhou Ancient City as a unified spatial reference.
The city site of Chaozhou was located at the southern foot of Jinshan during the Sui-Tang dynasties (581–907 CE). During the Kaiyuan Era of the Tang Dynasty, the Kaiyuan Temple was built by imperial edict, which changed the monotonous urban pattern previously ruled by the ritual order and practical ideas, and this time was the Inception Period. During the Song–Yuan dynasties (960–1368 CE), the city took on a nested structure with an outer wall and an inner city, and the number of buildings such as pavilions, temples, monasteries, and Taoist temples increased significantly. The establishment of the North and South Street made it the core axis, linking key nodes such as the Kaiyuan Temple, the Drum Tower, and the state government, and this time was the Development Period. The Ming–Qing dynasties (1368–1912 CE) marked the Heyday Period, when the city formed “north noble, south wealthy, east rich, west poor” functional zoning, and the peripheral contours followed the natural meandering of the mountains and rivers, forming the spatial layout of “four horizontal and three vertical, curved outside and square inside”. Social unrest and space saturation during the Republic of China (1912–1949 CE) triggered the “demolition of the old to build a new” climax; coupled with the introduction of Western architectural culture, the ancient city began to transform into a combination of Chinese and Western landscape style, characterized as the Transition Period. After the founding of the People’s Republic of China (since 1949 CE), the city basically maintained the ancient spatial layout and integrated diverse cultures, leading to a stable urban landscape, marking the Maturity Period.

4.1.2. Layering Characteristics and Spatial Distribution

According to the above four layering characteristics of the historic landscape, the “single-land-use dynamic degree model” was used to analyze the degree of change in the historic landscape elements from the Sui–Tang dynasties to the Song–Yuan dynasties, from the Song–Yuan dynasties to the Ming–Qing dynasties, from the Ming–Qing dynasties to the Republic of China, and from the Republic of China to the modern era in combination with the division of land parcels in the study area (Figure 8). To further clarify the scope of the landscape layer spaces of the Chaozhou Ancient City, the types of continuous, juxtaposed, coverage, and attenuated layering were assigned scores of 4, 3, 2, and 1, respectively, from highest to lowest (Table 4). After grid overlay, a historical landscape layering degree classification map is obtained, reflecting the continuity of historic landscapes in different spaces along the time dimension (Figure 9). The results showed that the high-layer space and the relatively high-layer space accounted for 66.1% of the total area of the ancient city, exhibiting the strongest spatiotemporal continuity and the most significant layering characteristics, and these were the core areas of Chaozhou Ancient City’s historic landscape. The medium-layer space was mainly distributed along Kaiyuan Road in the central part of the ancient city and in some spaces in the north, accounting for 18.5% of the total area. The low-layer space was mainly distributed along the Huancheng West Road in the south, accounting for 15.4% of the total area.

4.2. Value Characteristics of Historic Landscapes of Chaozhou Ancient City

4.2.1. Determination of Assessment Indicator Weights

The study invited contributions from five university professors specialising in architecture and urban planning, three full-time heritage conservation personnel from Chaozhou Ancient City, and nine doctoral candidates majoring in architecture and landscape architecture. Using the 1–9 scale method [57] (Table 5), after three rounds of questionnaire feedback and the adjustment of judgment matrices, all judgment matrices passed the consistency check (CR value < 0.1). According to the operational steps of the ANP model [40], the comprehensive weight values of various indicators were finally calculated (Table 6). The relevant calculations were carried out using SuperDecision V3.2 software.

4.2.2. Value Assessment and Spatial Distribution

In order to ensure the comparability of different indicators in the same dimension, the quantitative interval of each indicator was set as one to four levels, forming four levels of quantitative criteria for assessing the value of the historic landscapes of Chaozhou Ancient City (Table 7). Among them, the terrain and topography and historical district were assigned ordered variables; vegetation greening, architectural landscape, street and alley landscape were assigned graded variables according to the research judgment of the research group; and cultural relics protection units, historical places, cultural spaces, and business vitality are assigned variables based on the natural breakpoint method. Space vitality data were collected from Baidu heat maps during two time periods: 20–22 June 2024 (Summer Solstice) and 19–21 December 2024 (Winter Solstice), excluding interference factors such as extreme weather to ensure that the data reflect normal activity patterns. The time window for heat map data collection was set from 9:00 to 20:00 every day, and the heat maps were continuously acquired at 120 min intervals; their mean values were used to represent the space vitality. It should be clarified that this study focuses on the popularity and spatial distribution characteristics of all types of pedestrian flow in the region and has not yet defined a vitality index for specific groups. Baidu’s heat map data can effectively represent the popularity and spatial distribution characteristics of pedestrian flow in the aforementioned region.
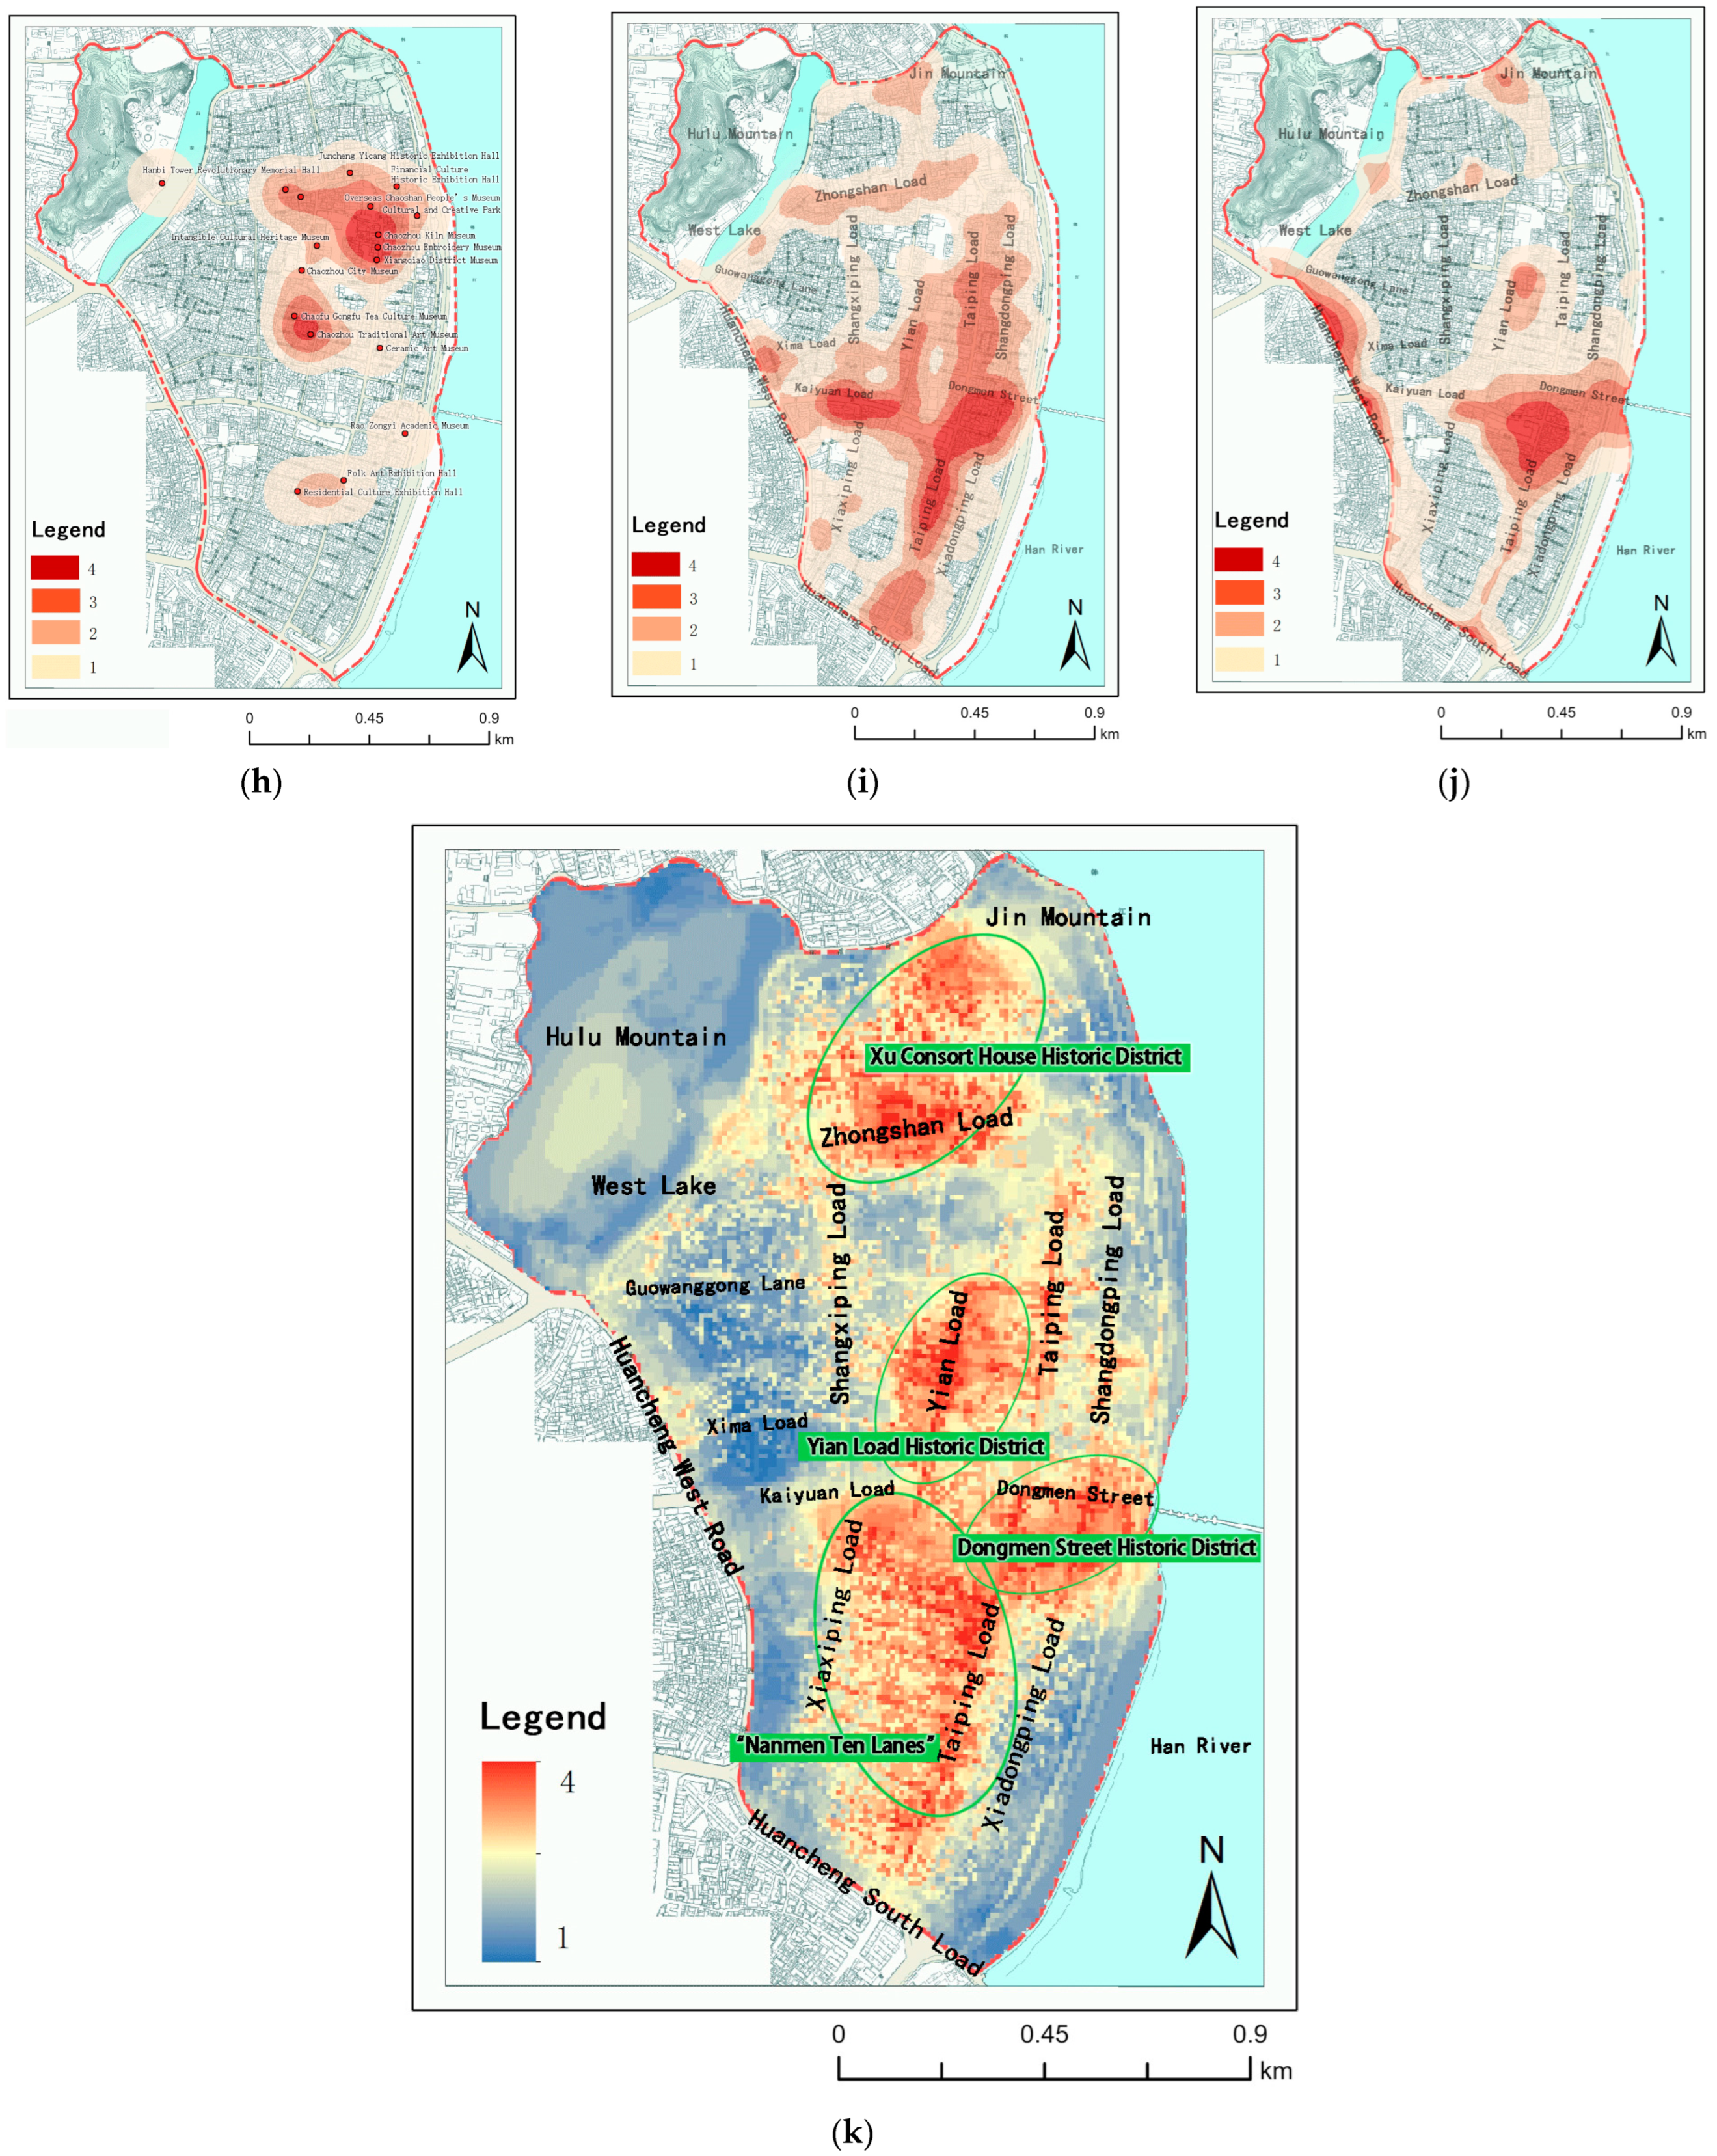
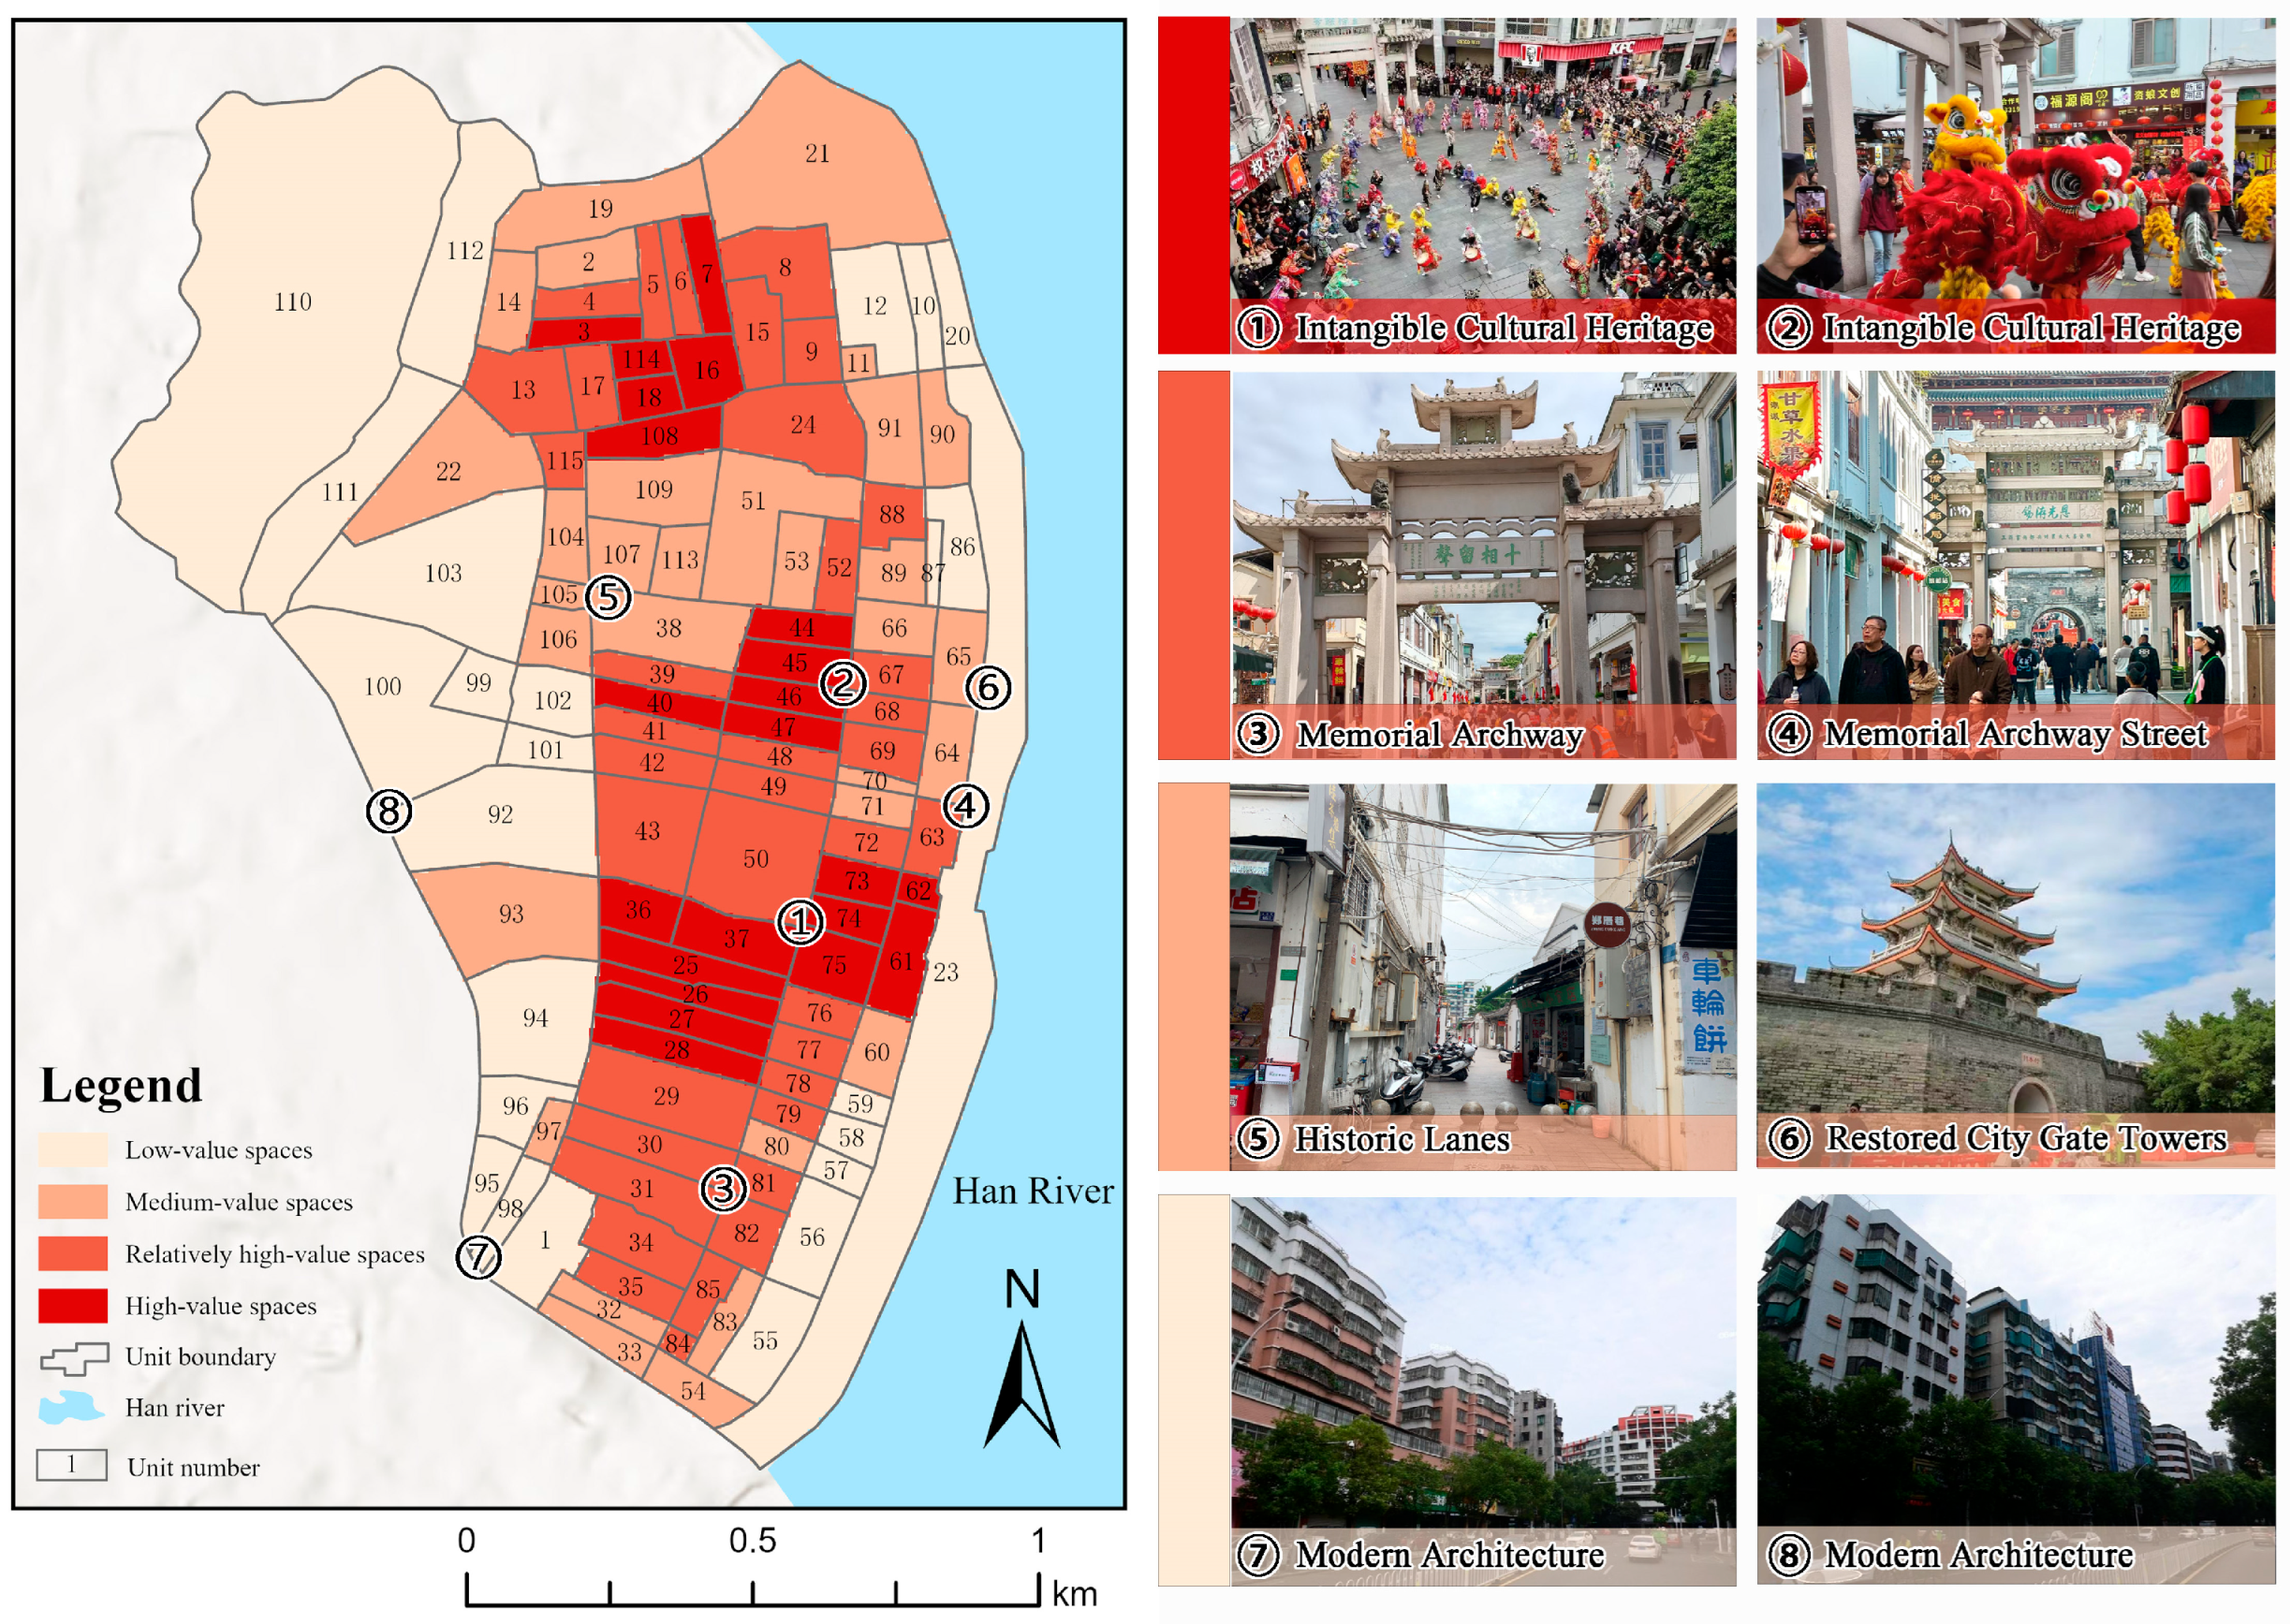
Finally, the visualization results of each indicator were weighted and superimposed on the map to obtain the distribution pattern of the value space of the historic landscapes of Chaozhou Ancient City (Figure 10), which was classified into four classes based on the road network with the mean value processing method (Figure 11).
The results showed that the value space distribution of the historical landscape of Chaozhou Ancient City exhibits an overall pattern of “high inside and low outside”. The high-value and relatively high-value spaces in Chaozhou Ancient City account for 31.1% of the total area, which are mainly reflected in the core axis of Taiping Road and the spatial clusters such as the “Ten Lanes of the South Gate”, the historic area of Dongmen Street, the historic area of Yi’an Road, and the historical and cultural district of Xu Fuma Mansion. The medium-value spaces in Chaozhou Ancient City account for 25.0% of the total area. Comparatively speaking, the spaces represented by Hulu Mountain, West Lake, and Huancheng West Road on the west side of the ancient city and the riverbank on the east side of the ancient city scored lower in the assessment, accounting for about 43.9% of the total area. This result shows that the distribution of the historic landscapes value space of Chaozhou Ancient City is biased towards the east of the central part of the city, forming a spatial distribution feature centered on Taiping Road, superimposed through a number of clusters, and the overall presentation is characterized as the typical pattern of “one axis and multiple clusters”, “high inside and low outside”, and “high east and low west”. This not only reflects the core position of Taiping Road in Chaozhou Ancient City but also reveals the potential deficiencies in the protection and utilization of the value of the western part and the edge area of the ancient city.

4.3. Coupling Analysis of Layer-Value Space

4.3.1. Spatial Correlation Analysis

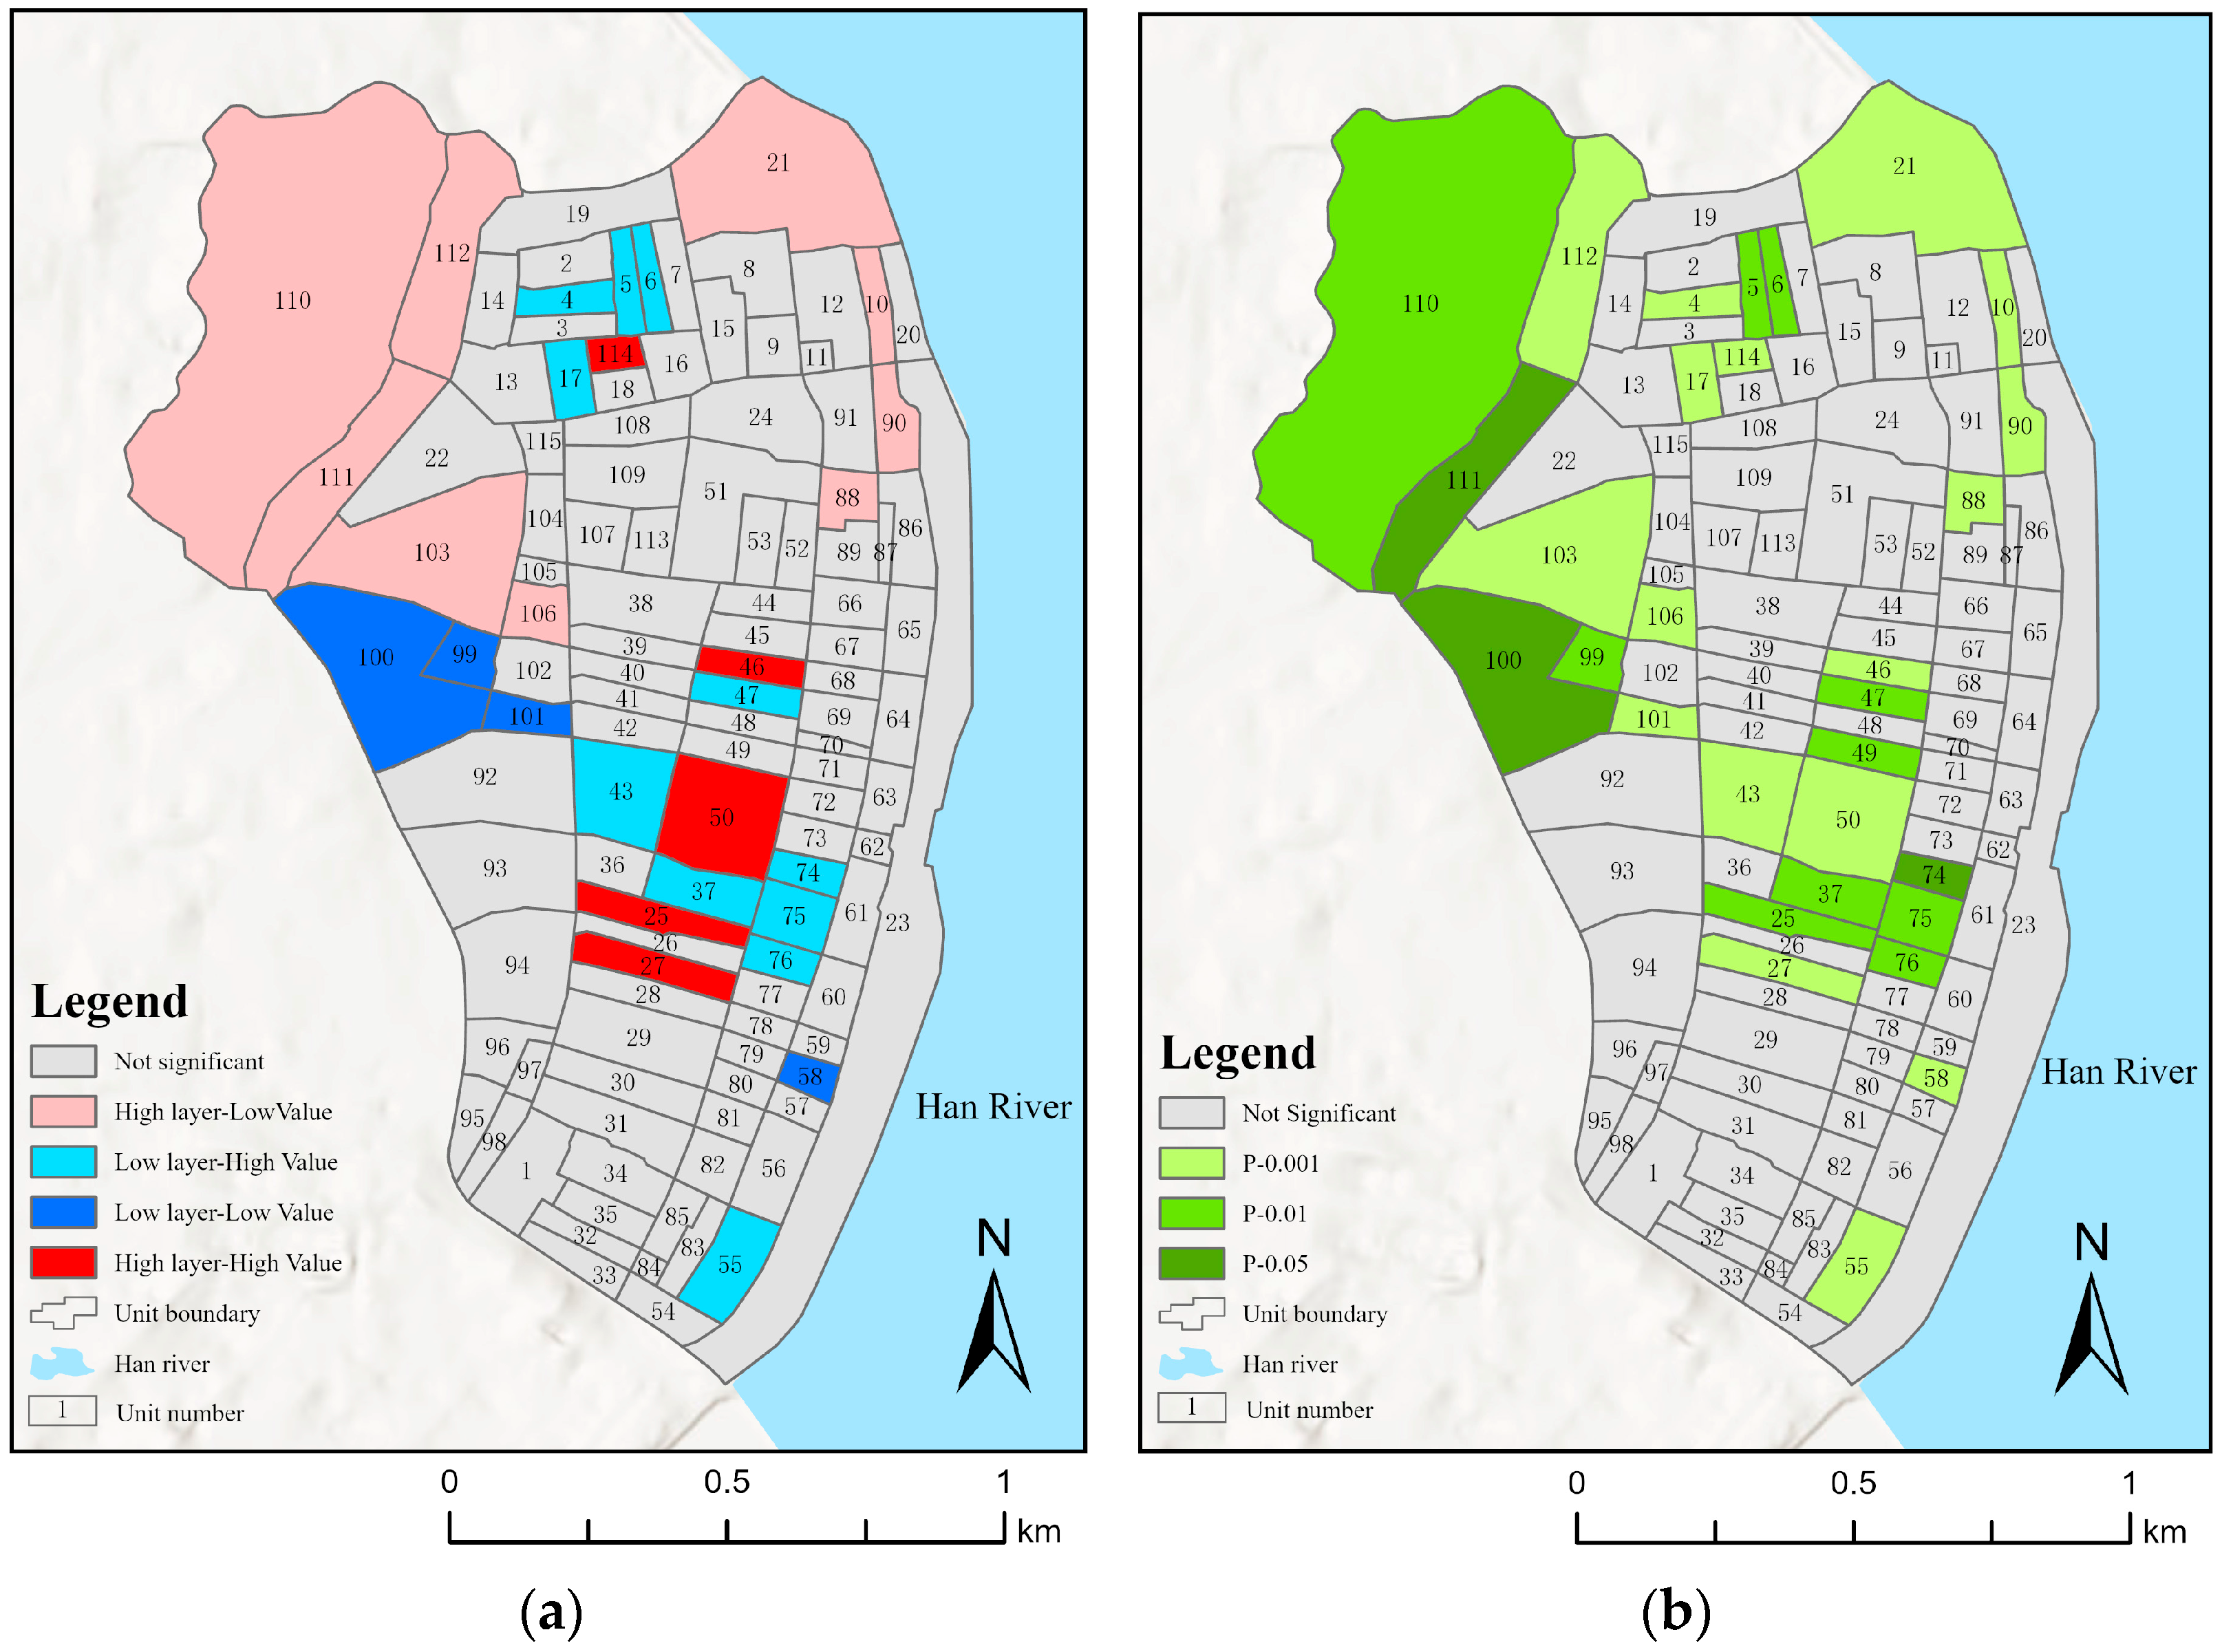
Using ArcGIS Pro 3.3.1 and GeoDa 1.22 software to carry out spatial metrological analysis, we determined that there are significant non-equilibrium and coupling in the distribution of the layer space and value space of the historic landscapes of Chaozhou Ancient City (Table 8). The Moran’s I indexes of the layer space and value space, respectively, are 0.2712 and 0.6437, with the Z values both above 2, which indicates that the layer space and value space both have the characteristics of agglomerative spatial distribution, and the degree of agglomeration of the value space distribution is much higher than that of the layer space distribution. Based on the bivariate LISA spatial distribution map (Figure 12a), the high–high agglomeration is mainly distributed in the Kaiyuan Temple space in the central part of the ancient city, as well as in the spaces of Jia Di Lane, Yang Yu Lane, and the Residence of the Xu Emperor’s Son-in-Law in the north. This is mainly because these areas have retained intact cultural relics and buildings and have been effectively revitalized and utilized, with a high level of consistency between the high-layer and high-value assessment of historic landscapes. The low–low agglomeration is mainly distributed in the surrounding spaces of Guowanggong Lane and Dayin Street in the west of the ancient city, which have mostly been converted into modern buildings, with low historical layering; these areas are far away from the center of the ancient city, presenting the characteristics of low layer and low value. The low–high agglomeration is mainly distributed in the spaces around Kaiyuan Road in the central part of the ancient city, and the spaces around the Residence of the Xu Emperor’s Son-in-Law in the north. The high–low agglomeration is mainly reflected in the natural environmental elements in the north and northwest parts of the ancient city. Based on the bivariate LISA significance level (Figure 12b), the low–high agglomeration in the center, the low–low agglomeration in the west, and the high–low agglomeration showed extremely significant correlation (p < 0.01), while the other spaces showed significant correlation (p < 0.05).
Overall, the distribution of historical landscape value space in Chaozhou Ancient City presents a typical pattern of “high inside and low outside”, and there is a significant spatial mismatch with the pattern of “high outside and low inside” layering in-tensity. Currently, the preservation and revitalization of the high-layer space in the central part of Chaozhou Ancient City has begun to bear fruit, and the value of the historic landscape is gradually emerging. However, there is a widespread issue of insufficient value exploration in the western area of the ancient city, where the layering intensity is relatively high. This contradictory phenomenon between the high-layer space and the low-value space further reveals the imbalance between the layer space and value exploration of the ancient city. In addition, about 63% of the spaces within the ancient city have insignificant correlation, indicating that the landscape value of a large number of high-layer spaces remains to be further explored and utilized.

4.3.2. Analysis of Spatial Coupling Coordination

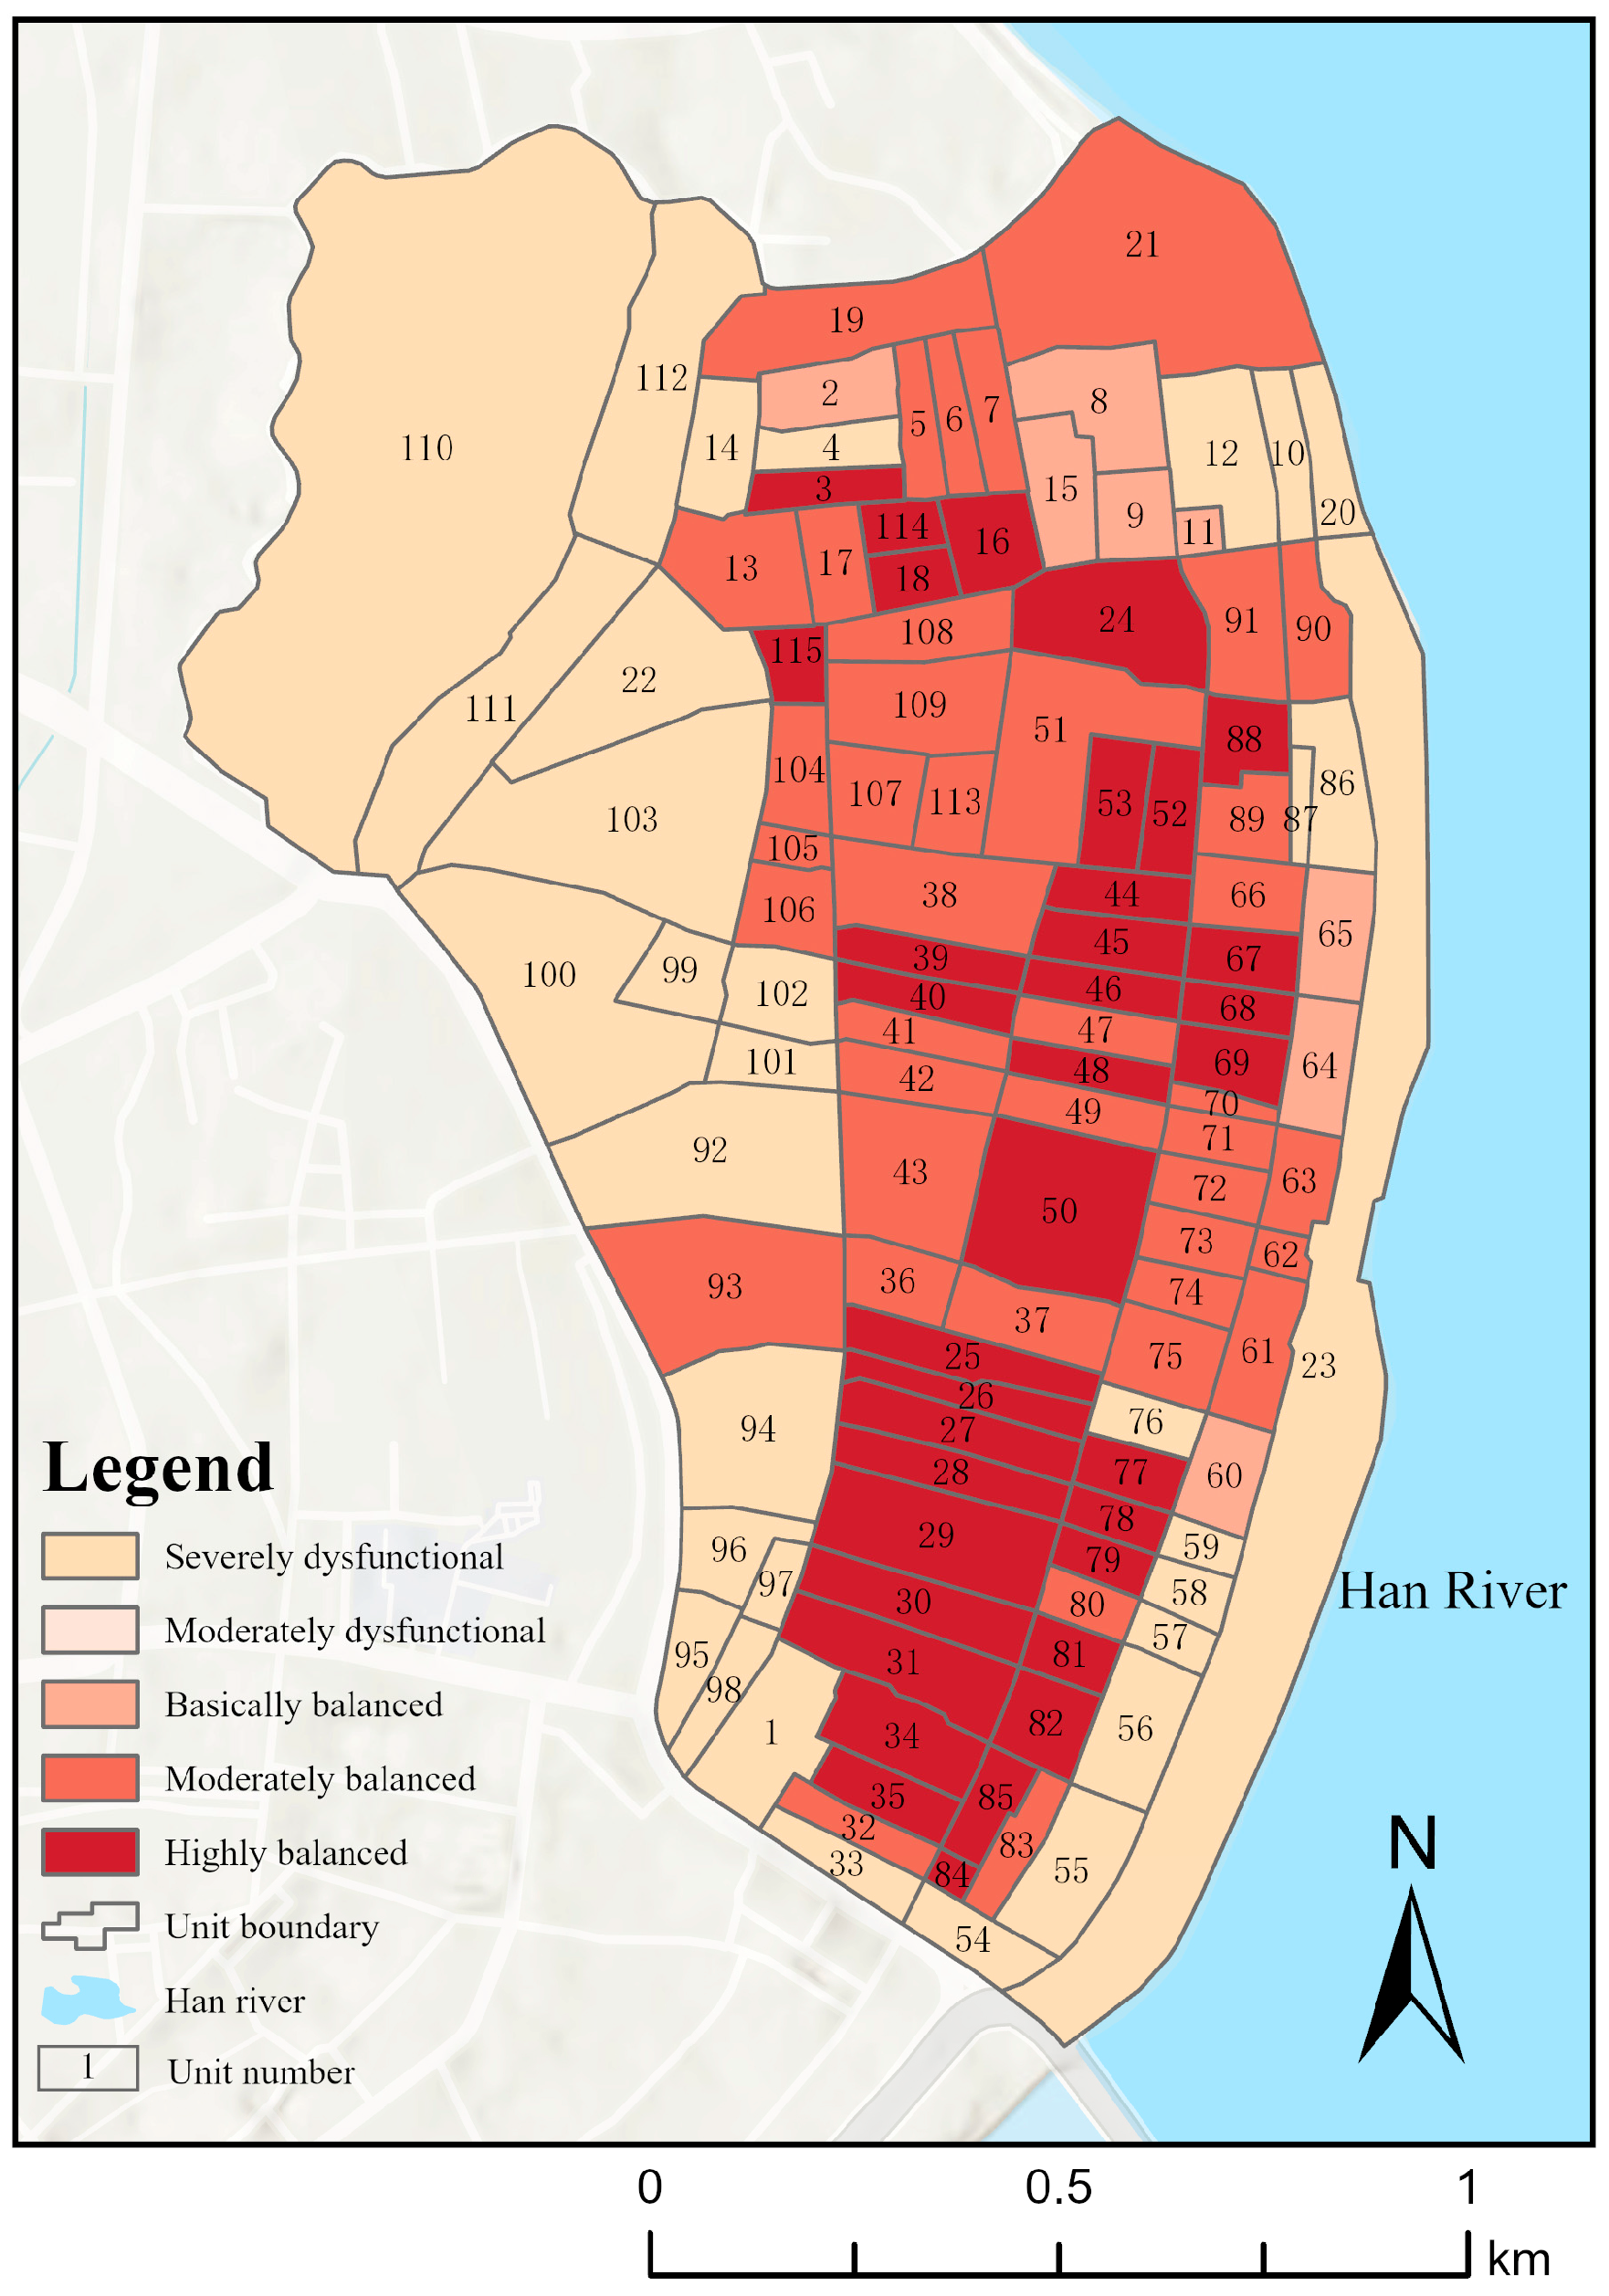
For the region as a whole, the average coupling coordination degree of the study area is 0.56, i.e., the overall coupling coordination degree indicates basically balanced, and the difference between the mean value of the layer space index and the value space index is 0.023. The type of coordination constitutes the simultaneous development type of the layer–value space. However, based on the area statistics (Figure 13), the layer–value space development types of the historical landscape in Chaozhou Ancient City exhibit significant differentiation. The area proportion of the severely dysfunctional space is the highest, accounting for 48% of the total area of the ancient city, with the transformational development space accounting for 32% and the coordinated development space accounting for only 20%. This indicates that, although the layer–value space of the historical landscape in Chaozhou Ancient City can develop synchronously, the overall level of mutual promotion and coordinated development is generally moderate, being in a critical stage from dysfunction to coordination. Moreover, the degree of coordination is severely differentiated, with a large proportion of severely dysfunctional areas. From the perspective of spatial distribution, the coupling coordination degree of the historical landscape in Chaozhou Ancient City is highest in the central area, distributed along the north–south axis, slightly lower on both east and west sides, and lowest in the southwest area (Figure 14).
This is because the best-preserved Ming and Qing streets and architectural landscapes of the ancient city are concentrated in the central region, with a high degree of landscape layering. In recent years, the development of culture and tourism has focused on the central part of the ancient city and important cultural relic resources, further highlighting the value attributes of the area. For example, as China has increased its efforts in heritage protection in recent years, many ancient memorial archways from the Ming–Qing dynasties in Taiping Road, the central axis of the ancient city, have been successively restored and renovated, forming a unique landscape space combining Chinese and Western elements with the arcade buildings in the Republic of China style on both sides. The result is a space with significantly enhanced vitality and a more attractive landscape. Additionally, the ancient city adheres to the principle of ‘repairing the old as the old’ in architectural restoration. This approach preserves the ancient urban pattern and style while also achieving a balance between cultural heritage and contemporary values. The serious dysfunction is mainly concentrated in the southwest and southern parts of the ancient city. On the one hand, the modernization process has led to the fragmentation of the landscape of the ancient city, and the landscape layering is low; on the other hand, although the spaces are close to the main roads of the city, they receive little attention due to a lack of representative cultural resources, resulting in low overall value.

4.3.3. Analysis of Space Matching Degree

To further analyze the matching relationship between the layer space and value space of the ancient city, we adopted the natural breakpoints method to subdivide the layering characteristics and value space of the historical landscape of Chaozhou Ancient City into nine matching types (Figure 15). These can be categorized into three main situations: layer and value mutually matched, layering intensity higher than value dimension, and layering intensity lower than value dimension.
Spaces where layering intensity and value assessment are mutually matched can be divided into three types. The high-layer–high-value type accounts for the largest proportion in the ancient city and coincides entirely with the high coupled coordination space, making it the dominant type for the coordinated development of the ancient city. The medium-layer–medium-value type is mainly distributed in the central area of the ancient city and accounts for a relatively small proportion. The low-layer–low-value type is concentrated in the southwest edge of the ancient city. It is noted that almost all low-layer spaces exhibit a low-value trend, and this type of space is also one of the main types of space that creates severely dysfunctional spaces in ancient cities.
Spaces where layering intensity exceeds value assessment can be divided into three types. High-layer–low-value spaces are primarily located in the natural landscape areas surrounding the ancient city, and his type of space is another major type that led to the severely dysfunctional development of ancient cities. High-layer–medium-value spaces are mainly found in the central part of the ancient city and are closely related to high-layer–high-value spaces. Medium-layer–low-value spaces are scattered sporadically and occupy the smallest area.
Spaces where layering intensity is lower than value assessment can be divided into three types. The medium-layer–high-value space is mainly distributed around Kaiyuan Temple in the central part of the ancient city; meanwhile, the low-layer–high-value space and low-layer–medium-value space account for a small proportion in the ancient city and are scattered sporadically.
In general, as the dominant type for the coordinated development of the ancient city, high-layer–high-value spaces are widely present in the core spaces of Chaozhou Ancient City, indicating to some extent that significant achievements have been made in the layering protection and value exploration of historical landscape of the ancient city in these spaces. Furthermore, among the severely dysfunctional spaces, 48% of the ancient city, high-layer–low-value spaces and low-layer–low-value spaces constitute the two dominant types of dysfunctional spaces, primarily distributed in the peripheral areas of the ancient city. The focus of future protection and renewal efforts should be on these two types of dysfunctional spaces. On the one hand, it is necessary to thoroughly explore the potential value of high-layer–low-value spaces and enhance their value recognition as well as revitalization and utilization levels. On the other hand, efforts should be made to strengthen the value reshaping and revitalization of low-layer–low-value spaces to promote the overall coordinated and sustainable development of the ancient city.

5. Discussion

5.1. Discussion of the Correlation Characteristics of “Layer–Value” Space

This study explores the distribution characteristics and correlation issues of the layer space and value space of the historical landscape of Chaozhou Ancient City by constructing an assessment model for the “coupling coordination of layer–value space” of the ancient city historical landscapes. This approach addresses the shortcomings of previous studies that focused on partial architectural reconstruction while neglecting the overall study of the ancient city [58]. The research reveals a significant mismatch and imbalance between the high-layer space (accounting for 66.1%) and high-value space (accounting for 31.1%) in the historical landscape of Chaozhou Ancient City. In terms of spatial distribution, the layering intensity increases from the center to the periphery of the ancient city (Figure 9), while the value shows a decreasing trend from the center to the periphery (Figure 11), indicating significant spatial heterogeneity. This finding aligns with previous studies of Chaozhou Ancient City [59]. Further analysis suggests that this spatial difference stems from the superposition of three spatial forces: (1) the central area of the ancient city is prone to forming a value anchoring effect due to its resource allocation advantages, such as the reconstruction of the Memorial Archway Street, which has brought about cultural and tourism development, objectively exacerbating regional value differentiation; (2) the value of peripheral natural landscapes has been underestimated for a long time and has lagged behind in development, failing to effectively integrate into the overall value system of the ancient city; (3) the fragmentation of landscapes caused by historical special events, such as the policy of demolishing the ancient city walls and expanding roads during the Republic of China period, disrupted the continuity of layering in the periphery of the ancient city, leading to a decline in its value recognition.
In terms of spatial cluster analysis, both layer space and value space exhibit spatial clustering, but the agglomeration intensity of value space (Moran’s I = 0.6437) is significantly higher than that of the layer space (Moran’s I = 0.2712). This difference may stem from the current protection and development mode of the ancient city. At present, the protection and development of ancient cities in China mainly rely on government investment [60], and limited funds are often concentrated in specific hotspot areas rather than evenly covering the entire ancient city. This approach reinforces the perception of value in partial space [61], leading to a highly clustered state in value space. Secondly, spaces that include historical buildings themselves, whether layer space or value space, exhibit a strong agglomeration effect. On the one hand, historical buildings themselves are the core carriers of historical layering, and their existence directly affects the layering and continuity of the spatial historical landscape [62]. On the other hand, as explicit cultural symbols and value focuses, historical buildings strongly attract the convergence of value identity [63]. In addition, about 63% of the space within the ancient city has insignificant layer–value correlation, indicating that there is still a large amount of high-layer space with potential value that needs to be excavated and activated.
In terms of spatial coupling analysis, current research on coupling methods primarily focuses on the coupling level between urbanization and the ecological environment [64,65], and it has been fully applied and validated. Therefore, this study innovatively applies it to the interactive analysis of historical layering and value space. The research results indicate that there is a significant interaction between layer space and value space in the historical landscape of Chaozhou Ancient City, but, overall, it has not yet reached the ideal state of coupling coordination (D = 0.56); it is in a critical stage between dysfunction and coordination. It is worth noting that 48% of the ancient city still has severely dysfunctional space that urgently needs further optimization and construction. Unlike previous studies that mainly reported general coupling coordination scores and did not reveal the mismatch of specific spaces [66,67], this study further subdivides spatial types into nine categories and identifies high-layer–low-value and low-layer–low-value spaces as the dominant factors leading to the overall spatial dysfunction of the ancient city. Further analysis suggests that this lack of coordination may be partly attributed to both the objective reality and subjective cognition of the ancient city’s protection methods. On the one hand, over the past five decades, nearly all urban conservation policies have more or less adhered to a “dichotomy” between historicity and modernity, dividing the city into unchangeable historic conservation areas and changeable modern urban areas outside them. While the conservation area approach has played a role, it has also significantly fragmented the connection between urban historic districts, the overall city, and natural landscapes [68]. On the other hand, development modes and resource allocation tend to favor the ancient city center, where the space values in areas with convenient transportation or established hotspots are more easily perceived subjectively, but their actual historical layering may be relatively limited or damaged. This lack of coordination represents a mismatch between value cognition and historic background, requiring targeted adjustments and optimizations.

5.2. Suggestions for Future Renewal and Optimization of Chaozhou Ancient City

Understanding the coupling coordination relationship between the layering characteristics and value space of ancient city historical landscapes is crucial for achieving sustainable development. Based on the research findings, several suggestions are proposed for the future renewal and optimization of Chaozhou Ancient City:
(1)
Implement a targeted priority intervention strategy for 48% of the severely dysfunctional spaces in the ancient city. For the “high-layer–low-value” spaces, through deepening historical interpretation, environmental enhancement, and functional activation, we can effectively transform historical layering into perceivable contemporary value, especially by reevaluating and integrating the underestimated natural landscapes sur-rounding the ancient city. For the “low-layer–low-value” spaces, we must be wary of excessive commercialization and value perception bubbles and rather focus on strengthening historical excavation, appropriately promoting the reproduction of historical scenes of partial space, and optimizing resource allocation towards such spaces.
(2)
A shift in resource allocation models and an enhancement of historical layering cognition are necessary to improve overall coordination. The high agglomeration of value spaces reflects the limitations of the current government-led, centralized resource investment model. Exploring diversified investment mechanisms can strengthen the connectivity of ancient cities through tourism routes and establish a dynamic evaluation mechanism with the coupling coordination degree as the monitoring indicator to guide the development of the “layer–value” space of ancient cities from critical coordination to highly coupled coordination.
(3)
We should build on the construction experience of international cities. Drawing on the construction experience of HUL pilot cities such as Macao (China), Cuenca in Ecuador, and Amsterdam in the Netherlands, we can strengthen the role of Historic Urban Landscape methods in the protection and management of ancient cities.

6. Conclusions

(1)
There is a mismatch and imbalance between the high-layer space (accounting for 66.1%) and high-value space (accounting for 31.1%) in the historical landscape of Chaozhou Ancient City. In terms of spatial distribution, the layer space increases from the center of the ancient city to the periphery, while the value space decreases from the center to the periphery, exhibiting significant spatial heterogeneity.
(2)
Both the layer space and value space of the historical landscape of Chaozhou Ancient City exhibit spatial clustering, but the agglomeration intensity of the value space (Moran’s I = 0.6437) is significantly higher than that of the layer space (Moran’s I = 0.2712). The results of the partial space correlation analysis indicate that high–high clustering is mainly concentrated in several national key cultural relics protection units in the central area of the ancient city, while high–low clustering is mainly reflected in the ecological environment space in the northern and northwestern parts of the ancient city. In addition, about 63% of the space within the ancient city still shows insignificant layer–value correlation, indicating that there is still a large amount of high-layer space with potential value that needs to be excavated and activated.
(3)
The relationship between the layer space and value space of the historical landscape of Chaozhou Ancient City has not yet reached an ideal state of coupling coordination. The average coupling coordination degree is 0.56, indicating that the overall coupling coordination level is only in a basically balanced state, at the critical stage from dysfunction to coordination. In total, 48% of the space in the ancient city is still in a severely dysfunctional state. After further subdividing the space types into nine categories, we identified that the space types of “high layer–low value” and “low layer–low value” are the dominant factors leading to the overall spatial dysfunction of the ancient city. These two types of spaces can be protected and updated through value mining and historical scene reproduction.
This study has some limitations:
  • The core value of the ancient city is not only reflected in the spatial level but also includes non-material elements such as the social structure, historical events, and living patterns, etc. This study mainly explores the material dimension of the ancient city through the spatial quantification method; regarding the question of how to explore the correlation between the material space and the non-material elements using other methods, there is a need for consistent improvement by combining this approach with empirical research.
  • Although the spatial vitality data can characterize the heat and distribution of people flow, they cannot distinguish the types of people. As such, we need to attempt to analyze the vitality index of specific groups of people in the future.
  • In the application of the coupling coordination degree model, regarding the weight proportion of two space subsystems, this study conducts calculations based on the premise that “both are equally important”, that is, α = β = 0.5 is set in Formula (6), which is a common practice in related research on the coupling coordination degree model [69,70]. Furthermore, some scholars have proposed an improved coupling coordination degree model, the core of which revolves around optimizing the proportion of the subsystem weights α and β [71]. This approach provides important inspiration for subsequent research and will be attempted in the next stage.
  • By analogy with the research approach employed in this study, further research is required to validate the findings and apply them to other historical cities.

Author Contributions

Conceptualization, G.W. and S.W.; methodology, S.W. and H.W.; software, S.W. and H.W.; validation, S.W. and H.W.; formal analysis, S.W.; investigation, S.W. and H.W.; resources, G.W.; data curation, S.W. and H.W.; writing—original draft preparation, S.W.; writing—review and editing, G.W. and S.W.; visualization, S.W. and H.W.; supervision, G.W.; project administration, G.W.; funding acquisition, G.W. All authors have read and agreed to the published version of the manuscript.

Funding

This research received no external funding.

Data Availability Statement

The materials and datasets analyzed in this study were mostly sourced from publicly available data on the internet, as detailed in the article. Some data may contain information that could compromise the privacy of research participants. However, they are available from the author upon reasonable request.

Acknowledgments

We acknowledge the support provided by the “Ancient City Conservation Volunteers” in Chaozhou, who actively participated in the field survey work.

Conflicts of Interest

The authors declare no conflicts of interest.

References

  1. Dang, A.; Hu, H.; Li, X.; Lun, Y. Advancement and Prospect of Informatized Conservation of Historic Cities in China. China Anc. City 2023, 37, 40–46. [Google Scholar] [CrossRef]
  2. Bai, X.; Shi, P. China’s Urbanization at a Turning Point—Challenges and Opportunities. Science 2025, 388, eadw3443. [Google Scholar] [CrossRef]
  3. Jiang, D.; Zhou, J.; Bao, Z. The Construction and Enlightenment of the Historic Landscape Baseline Map of Nanning Based on the Perspective of Territorial Historic Conservation. Chin. Landsc. Archit. 2024, 40, 82–88. [Google Scholar] [CrossRef]
  4. Taylor, K. The Historic Urban Landscape Paradigm and Cities as Cultural Landscapes. Challenging Orthodoxy in Urban Conservation. Landsc. Res. 2016, 41, 471–480. [Google Scholar] [CrossRef]
  5. Cao, Y.; Li, H. Construction of Heritage Value Cognitive Framework from the Perspective of Historic Urban Landscape. Urban Dev. Stud. 2023, 30, 80–87. [Google Scholar]
  6. Wang, S.; Gu, K. Pingyao: The Historic Urban Landscape and Planning for Heritage-Led Urban Changes. Cities 2020, 97, 102489. [Google Scholar] [CrossRef]
  7. Liu, W.; Zhan, J.; Zhao, F.; Yan, H.; Zhang, F.; Wei, X. Impacts of Urbanization-Induced Land-Use Changes on Ecosystem Services: A Case Study of the Pearl River Delta Metropolitan Region, China. Ecol. Indic. 2019, 98, 228–238. [Google Scholar] [CrossRef]
  8. Sengur, S.; Nurlu, E. Historic Landscape Characterization in Protected Areas; A Case Study Kazdagi National Park. J. Agric. Sci.-Tarim Bilim. Derg. 2021, 27, 106–113. [Google Scholar] [CrossRef]
  9. Xiao, J.; Cao, K. Historic Towns’ Preservation Methodologies Based on Analysis of Landscape Narration Grammar and Historic Layering Mechanism. Chin. Landsc. Archit. 2016, 32, 20–26. [Google Scholar]
  10. Liu, Y. The Anchoring-Layering Theory: For a Better Understanding and Conservation of Historic Urban Landscape. Ph.D. Thesis, Tsinghua University, Beijing, China, 2016. [Google Scholar]
  11. Xiao, J.; Li, H.; Cao, K. Characteristic Recognition and Layering Interpretation of Historic Urban & Townish Landscapes in Southwest China. South Archit. 2017, 3, 18–25. [Google Scholar]
  12. Warnock, S.; Griffiths, G. Landscape Characterisation: The Living Landscapes Approach in the UK. Landsc. Res. 2015, 40, 261–278. [Google Scholar] [CrossRef]
  13. Li, X.; Zhou, X.; Weng, F.; Ding, F.; Wu, Y.; Yi, Z. Evolution of Cultural Landscape Heritage Layers and Value Assessment in Urban Countryside Historic Districts: The Case of Jiufeng Sheshan, Shanghai, China. Herit. Sci. 2024, 12, 96. [Google Scholar] [CrossRef]
  14. Stastná, M.; Vaishar, A.; Vavrouchová, H.; Masícek, T.; Perinková, V. Values of a Suburban Landscape: Case Study of Podoli u Brna (Moravia), The Czech Republic. Sustain. Cities Soc. 2018, 40, 383–393. [Google Scholar] [CrossRef]
  15. Xiao, J.; Cao, K.; Li, H. The Evolution Laws and Layering Management Methodologies of Historic Urban Landscape. Urban Dev. Stud. 2018, 25, 59–69. [Google Scholar]
  16. Dong, S.; Shen, D. A Study of Historical Urban Landscape Layering in Luoyang Based on Historical Map Translation. Land 2023, 12, 663. [Google Scholar] [CrossRef]
  17. Jiang, L.; Cai, J.; Fan, Y. Spatiotemporal Distribution and Heritage Corridor Construction of Vernacular Architectural Heritage in the Cao’e River, Jiaojiang River, and Oujiang River Basin. Land 2025, 14, 1484. [Google Scholar] [CrossRef]
  18. Yang, C.; Zeng, W.; Yang, X. Coupling Coordination Evaluation and Sustainable Development Pattern of Geo-Ecological Environment and Urbanization in Chongqing Municipality, China. Sustain. Cities Soc. 2020, 61, 102271. [Google Scholar] [CrossRef]
  19. Cai, R.; Nasu, S. Adopting the ‘Historic Layering’ Concept from the Historic Urban Landscape Approach as a Methodological Framework for Urban Heritage Conservation. Int. J. Herit. Stud. 2025, 31, 573–591. [Google Scholar] [CrossRef]
  20. Girard, L.F. Toward a Smart Sustainable Development of Port Cities/Areas: The Role of the “Historic Urban Landscape” Approach. Sustainability 2013, 5, 4329–4348. [Google Scholar] [CrossRef]
  21. UNESCO. Recommendation on the Historic Urban Landscape; UNESCO: Paris, France, 2011. [Google Scholar]
  22. Bandarin, F. New Approaches and New Tools for Urban Conservation. İDEALKENT 2016, 7, 341–346. [Google Scholar]
  23. UNESCO. New Life for Historic Cities: The Historic Urban Landscape Approach Explained; UNESCO: Paris, France, 2013. [Google Scholar]
  24. Bandarin, F.; van Oers, R. Reconnecting the City: The Historic Urban Landscape Approach and the Future of Urban Heritage; Wiley: Hoboken, NJ, USA, 2014; pp. 17–19. ISBN 978-1-118-38398-8. [Google Scholar]
  25. Bandarin, F.; Van Oers, R. Planning and Managing Historic Urban Landscapes; John Wiley & Sons, Ltd.: Hoboken, NJ, USA, 2012; pp. 161–202. [Google Scholar]
  26. Zhou, J.; Bandarin, F. Operationalising the Historic Urban Landscape: A Practitioner’s View; Tongji University Press: Shanghai, China, 2018. [Google Scholar]
  27. Li, J.; Jing, F.; Shao, Y. Global Practices of the UNESCO Historic Urban Landscape: Ten-Year Review and Insights for Chinese Urban Heritage Protection. City Plan. Rev. 2022, 46, 90–98. [Google Scholar]
  28. WHITRAP.; City of Ballarat. The HUL Guidebook: Managing Heritage in Dynamic and Constantly Changing Urban Environments. A Practical Guide to UNESCO’s Recommendation on Historic Urban Landscape; UNESCO: Bad IschI, Austria, 2016. [Google Scholar]
  29. Cooke, S.; Buckley, K.; Fayad, S. Using the Historic Urban Landscape to Reimagine Ballarat: The Local Context. In Urban Heritage, Development and Sustainability; Routledge: London, UK, 2015; pp. 93–113. [Google Scholar]
  30. Li, H.; Fu, P. The Interpretation and Preservation Strategies of the Layering Laws of Historic Urban Landscape. Chin. Landsc. Archit. 2020, 36, 49–54. [Google Scholar] [CrossRef]
  31. Auziņš, A.; Viesturs, J. A Values-Led Planning Approach for Sustainable Land Use and Development. Balt. J. Real Estate Econ. Constr. Manag. 2017, 5, 275–286. [Google Scholar] [CrossRef]
  32. Pei, Y.; Yang, R.; Dang, A. Historic Layering Process Interpretation and Value Assessment of the Ancient City of Yulin Based on Historic Urban Landscape Approach. Urban Dev. Stud. 2022, 29, 128–136. [Google Scholar]
  33. Fredheim, L.H.; Khalaf, M. The Significance of Values: Heritage Value Typologies Re-Examined. Int. J. Herit. Stud. 2016, 22, 466–481. [Google Scholar] [CrossRef]
  34. González Martínez, P. Urban Authenticity at Stake: A New Framework for Its Definition from the Perspective of Heritage at the Shanghai Music Valley. Cities 2017, 70, 55–64. [Google Scholar] [CrossRef]
  35. Tenzer, M. Social Landscape Characterisation: A People-Centred, Place-Based Approach to Inclusive and Transparent Heritage and Landscape Management. Int. J. Herit. Stud. 2024, 30, 269–284. [Google Scholar] [CrossRef]
  36. Auzins, A.; Chigbu, U.E. Values-Led Planning Approach in Spatial Development: A Methodology. Land 2021, 10, 461. [Google Scholar] [CrossRef]
  37. Sun, H. Some Issues on Heritage Value: The Essence, Attributes, Structure, Types, and Evaluation of Heritage Value. Chin. Cult. Herit. 2019, 1, 4–16. [Google Scholar]
  38. Hong, X.; Ji, X.; Wu, Z. Architectural Colour Planning Strategy and Planning Implementation Evaluation of Historical and Cultural Cities Based on Different Urban Zones in Xuzhou (China). Color Res. Appl. 2022, 47, 424–453. [Google Scholar] [CrossRef]
  39. Lee, P.; Wu, J.-Z.; Hu, K.-C.; Flynn, M. Applying Analytic Network Process (ANP) to Rank Critical Success Factors of Waterfront Redevelopment. Int. J. Shipp. Transp. Logist. 2013, 5, 390–411. [Google Scholar] [CrossRef]
  40. Tseng, M.-L. Application of ANP and DEMATEL to Evaluate the Decision-Making of Municipal Solid Waste Management in Metro Manila. Environ. Monit. Assess. 2009, 156, 181–197. [Google Scholar] [CrossRef]
  41. Feng, Y.; Wei, H.; Huang, Y.; Li, J.; Mu, Z.; Kong, D. Spatiotemporal Evolution Characteristics and Influencing Factors of Traditional Villages: The Yellow River Basin in Henan Province, China. Herit. Sci. 2023, 11, 97. [Google Scholar] [CrossRef]
  42. Lin, Z.; Liang, Y.; Liu, X. Study on Spatial Form Evolution of Traditional Villages in Jiuguan under the Influence of Historic Transportation Network. Herit. Sci. 2024, 12, 29. [Google Scholar] [CrossRef]
  43. Zhang, Y.; Liu, Y.; Zhang, Y.; Liu, Y.; Zhang, G.; Chen, Y. On the Spatial Relationship between Ecosystem Services and Urbanization: A Case Study in Wuhan, China. Sci. Total Environ. 2018, 637–638, 780–790. [Google Scholar] [CrossRef]
  44. Yuan, Y.; Bai, Z.; Zhang, J.; Huang, Y. Investigating the Trade-Offs between the Supply and Demand for Ecosystem Services for Regional Spatial Management. J. Environ. Manag. 2023, 325, 116591. [Google Scholar] [CrossRef] [PubMed]
  45. Anselin, L. The Moran Scatterplot as an ESDA Tool to Assess Local Instability in Spatial Association. In Spatial Analytical Perspectives on GIS; Routledge: London, UK, 2019; pp. 111–126. ISBN 978-0-203-73905-1. [Google Scholar]
  46. He, Y.; Ma, J.; Zhang, C.; Yang, H. Spatio-Temporal Evolution and Prediction of Carbon Storage in Guilin Based on FLUS and InVEST Models. Remote Sens. 2023, 15, 1445. [Google Scholar] [CrossRef]
  47. Yin, C.; Yuan, M.; Lu, Y.; Huang, Y.; Liu, Y. Effects of Urban Form on the Urban Heat Island Effect Based on Spatial Regression Model. Sci. Total Environ. 2018, 634, 696–704. [Google Scholar] [CrossRef] [PubMed]
  48. Gedamu, W.T.; Plank-Wiedenbeck, U.; Wodajo, B.T. A Spatial Autocorrelation Analysis of Road Traffic Crash by Severity Using Moran’s I Spatial Statistics: A Comparative Study of Addis Ababa and Berlin Cities. Accid. Anal. Prev. 2024, 200, 107535. [Google Scholar] [CrossRef] [PubMed]
  49. Roy, S.; Majumder, S.; Bose, A.; Chowdhury, I. Hilly Terrain and Housing Wellness: Geo-Visualizing Spatial Dynamics of Urban Household Quality in the Himalayan Town of Darjeeling, India. Singap. J. Trop. Geogr. 2024, 45, 361–383. [Google Scholar] [CrossRef]
  50. Sarwar, A. Mapping out Regional Disparities of Reproductive Health Care Services (RHCS) across Pakistan: An Exploratory Spatial Approach. Asia-Pac. J. Reg. Sci. 2021, 5, 825–849. [Google Scholar] [CrossRef]
  51. Li, Y.; Li, Y.; Zhou, Y.; Shi, Y.; Zhu, X. Investigation of a Coupling Model of Coordination between Urbanization and the Environment. J. Environ. Manag. 2012, 98, 127–133. [Google Scholar] [CrossRef] [PubMed]
  52. Shen, L.; Huang, Y.; Huang, Z.; Lou, Y.; Ye, G.; Wong, S.-W. Improved Coupling Analysis on the Coordination between Socio-Economy and Carbon Emission. Ecol. Indic. 2018, 94, 357–366. [Google Scholar] [CrossRef]
  53. He, J.; Wang, S.; Liu, Y.; Ma, H.; Liu, Q. Examining the Relationship between Urbanization and the Eco-Environment Using a Coupling Analysis: Case Study of Shanghai, China. Ecol. Indic. 2017, 77, 185–193. [Google Scholar] [CrossRef]
  54. Xing, L.; Xue, M.; Hu, M. Dynamic Simulation and Assessment of the Coupling Coordination Degree of the Economy-Resource-Environment System: Case of Wuhan City in China. J. Environ. Manag. 2019, 230, 474–487. [Google Scholar] [CrossRef]
  55. Song, Q.; Zhou, N.; Liu, T.; Siehr, S.A.; Qi, Y. Investigation of a “Coupling Model” of Coordination between Low-Carbon Development and Urbanization in China. Energy Policy 2018, 121, 346–354. [Google Scholar] [CrossRef]
  56. Li, W.; Wang, Y.; Xie, S.; Cheng, X. Coupling Coordination Analysis and Spatiotemporal Heterogeneity Between Urbanization and Ecosystem Health in Chongqing Municipality, China. Sci. Total Environ. 2021, 791, 148311. [Google Scholar] [CrossRef] [PubMed]
  57. Beynon, M. An Analysis of Distributions of Priority Values from Alternative Comparison Scales within AHP. Eur. J. Oper. Res. 2002, 140, 104–117. [Google Scholar] [CrossRef]
  58. Sepe, M. Urban History and Cultural Resources in Urban Regeneration: A Case of Creative Waterfront Renewal. Plan. Perspect. 2013, 28, 595–613. [Google Scholar] [CrossRef]
  59. Wei, H.; Wang, G. Investigating the Spatiotemporal Pattern between Street Vitality in Historic Cities and Built Environments Using Multisource Data in Chaozhou, China. J. Urban Plan. Dev. 2024, 150, 05024027. [Google Scholar] [CrossRef]
  60. Li, X.; Hui, E.C.M.; Chen, T.; Lang, W.; Guo, Y. From Habitat III to the New Urbanization Agenda in China: Seeing through the Practices of the “Three Old Renewals” in Guangzhou. Land Use Policy 2019, 81, 513–522. [Google Scholar] [CrossRef]
  61. Chen, D. How Visitors Perceive Heritage Value-A Quantitative Study on Visitors’ Perceived Value and Satisfaction of Architectural Heritage through SEM. Sustainability 2023, 15, 9002. [Google Scholar] [CrossRef]
  62. Pang, Z. The Multi-Layered Correlation between Historic Urban Landscape and Building Type: A Case Study of DIAOYUTAI Historic Area in Nanjing, China. In Proceedings of the 30th International Seminar on Urban Form Conference (ISUF), Belgrade, Serbia, 4–9 September 2023; pp. 1442–1455. [Google Scholar]
  63. Su, J. Managing Intangible Cultural Heritage in the Context of Tourism: Chinese Officials’ Perspectives. J. Tour. Cult. Change 2020, 18, 164–186. [Google Scholar] [CrossRef]
  64. Feng, Y.; He, S.; Li, G. Interaction between Urbanization and the Eco-Environment in the Pan-Third Pole Region. Sci. Total Environ. 2021, 789, 148011. [Google Scholar] [CrossRef]
  65. Fang, C.; Cui, X.; Li, G.; Bao, C.; Wang, Z.; Ma, H.; Sun, S.; Liu, H.; Luo, K.; Ren, Y. Modeling Regional Sustainable Development Scenarios Using the Urbanization and Eco-Environment Coupler: Case Study of Beijing Tianjin-Hebei Urban Agglomeration, China. Sci. Total Environ. 2019, 689, 820–830. [Google Scholar] [CrossRef] [PubMed]
  66. Xu, D.; Hou, G. The Spatiotemporal Coupling Characteristics of Regional Urbanization and Its Influencing Factors: Taking the Yangtze River Delta as an Example. Sustainability 2019, 11, 822. [Google Scholar] [CrossRef]
  67. Song, C.; Sun, C.; Xu, J.; Fan, F. Establishing Coordinated Development Index of Urbanization Based on Multi-Source Data: A Case Study of Guangdong-Hong Kong-Macao Greater Bay Area, China. Ecol. Indic. 2022, 140, 109030. [Google Scholar] [CrossRef]
  68. Zhou, J.; Jiang, D.; Bao, Z.; Huang, Y.; Yuan, Y.; Huang, D. Historic Landscape Characterisation: Linking “Conservation Areas” and “Historic Urban Landscape”. Urban Plan. Int. 2023, 38, 124–132+142. [Google Scholar]
  69. Tao, J.; Yang, M.; Wu, J. Coupling Coordination Evaluation of Lakefront Landscape Spatial Quality and Public Sentiment. Land 2022, 11, 865. [Google Scholar] [CrossRef]
  70. Xie, X.; Li, X.; Fan, H. Research on the Interactive Coupling Relationship between Land Space Development and Eco-Environment from the Perspective of Symbiosis: A Practical Analysis of Henan, China. Land 2022, 11, 1252. [Google Scholar] [CrossRef]
  71. Dong, G.; Ge, Y.; Liu, J.; Kong, X.; Zhai, R. Evaluation of Coupling Relationship between Urbanization and Air Quality Based on Improved Coupling Coordination Degree Model in Shandong Province, China. Ecol. Indic. 2023, 154, 110578. [Google Scholar] [CrossRef]
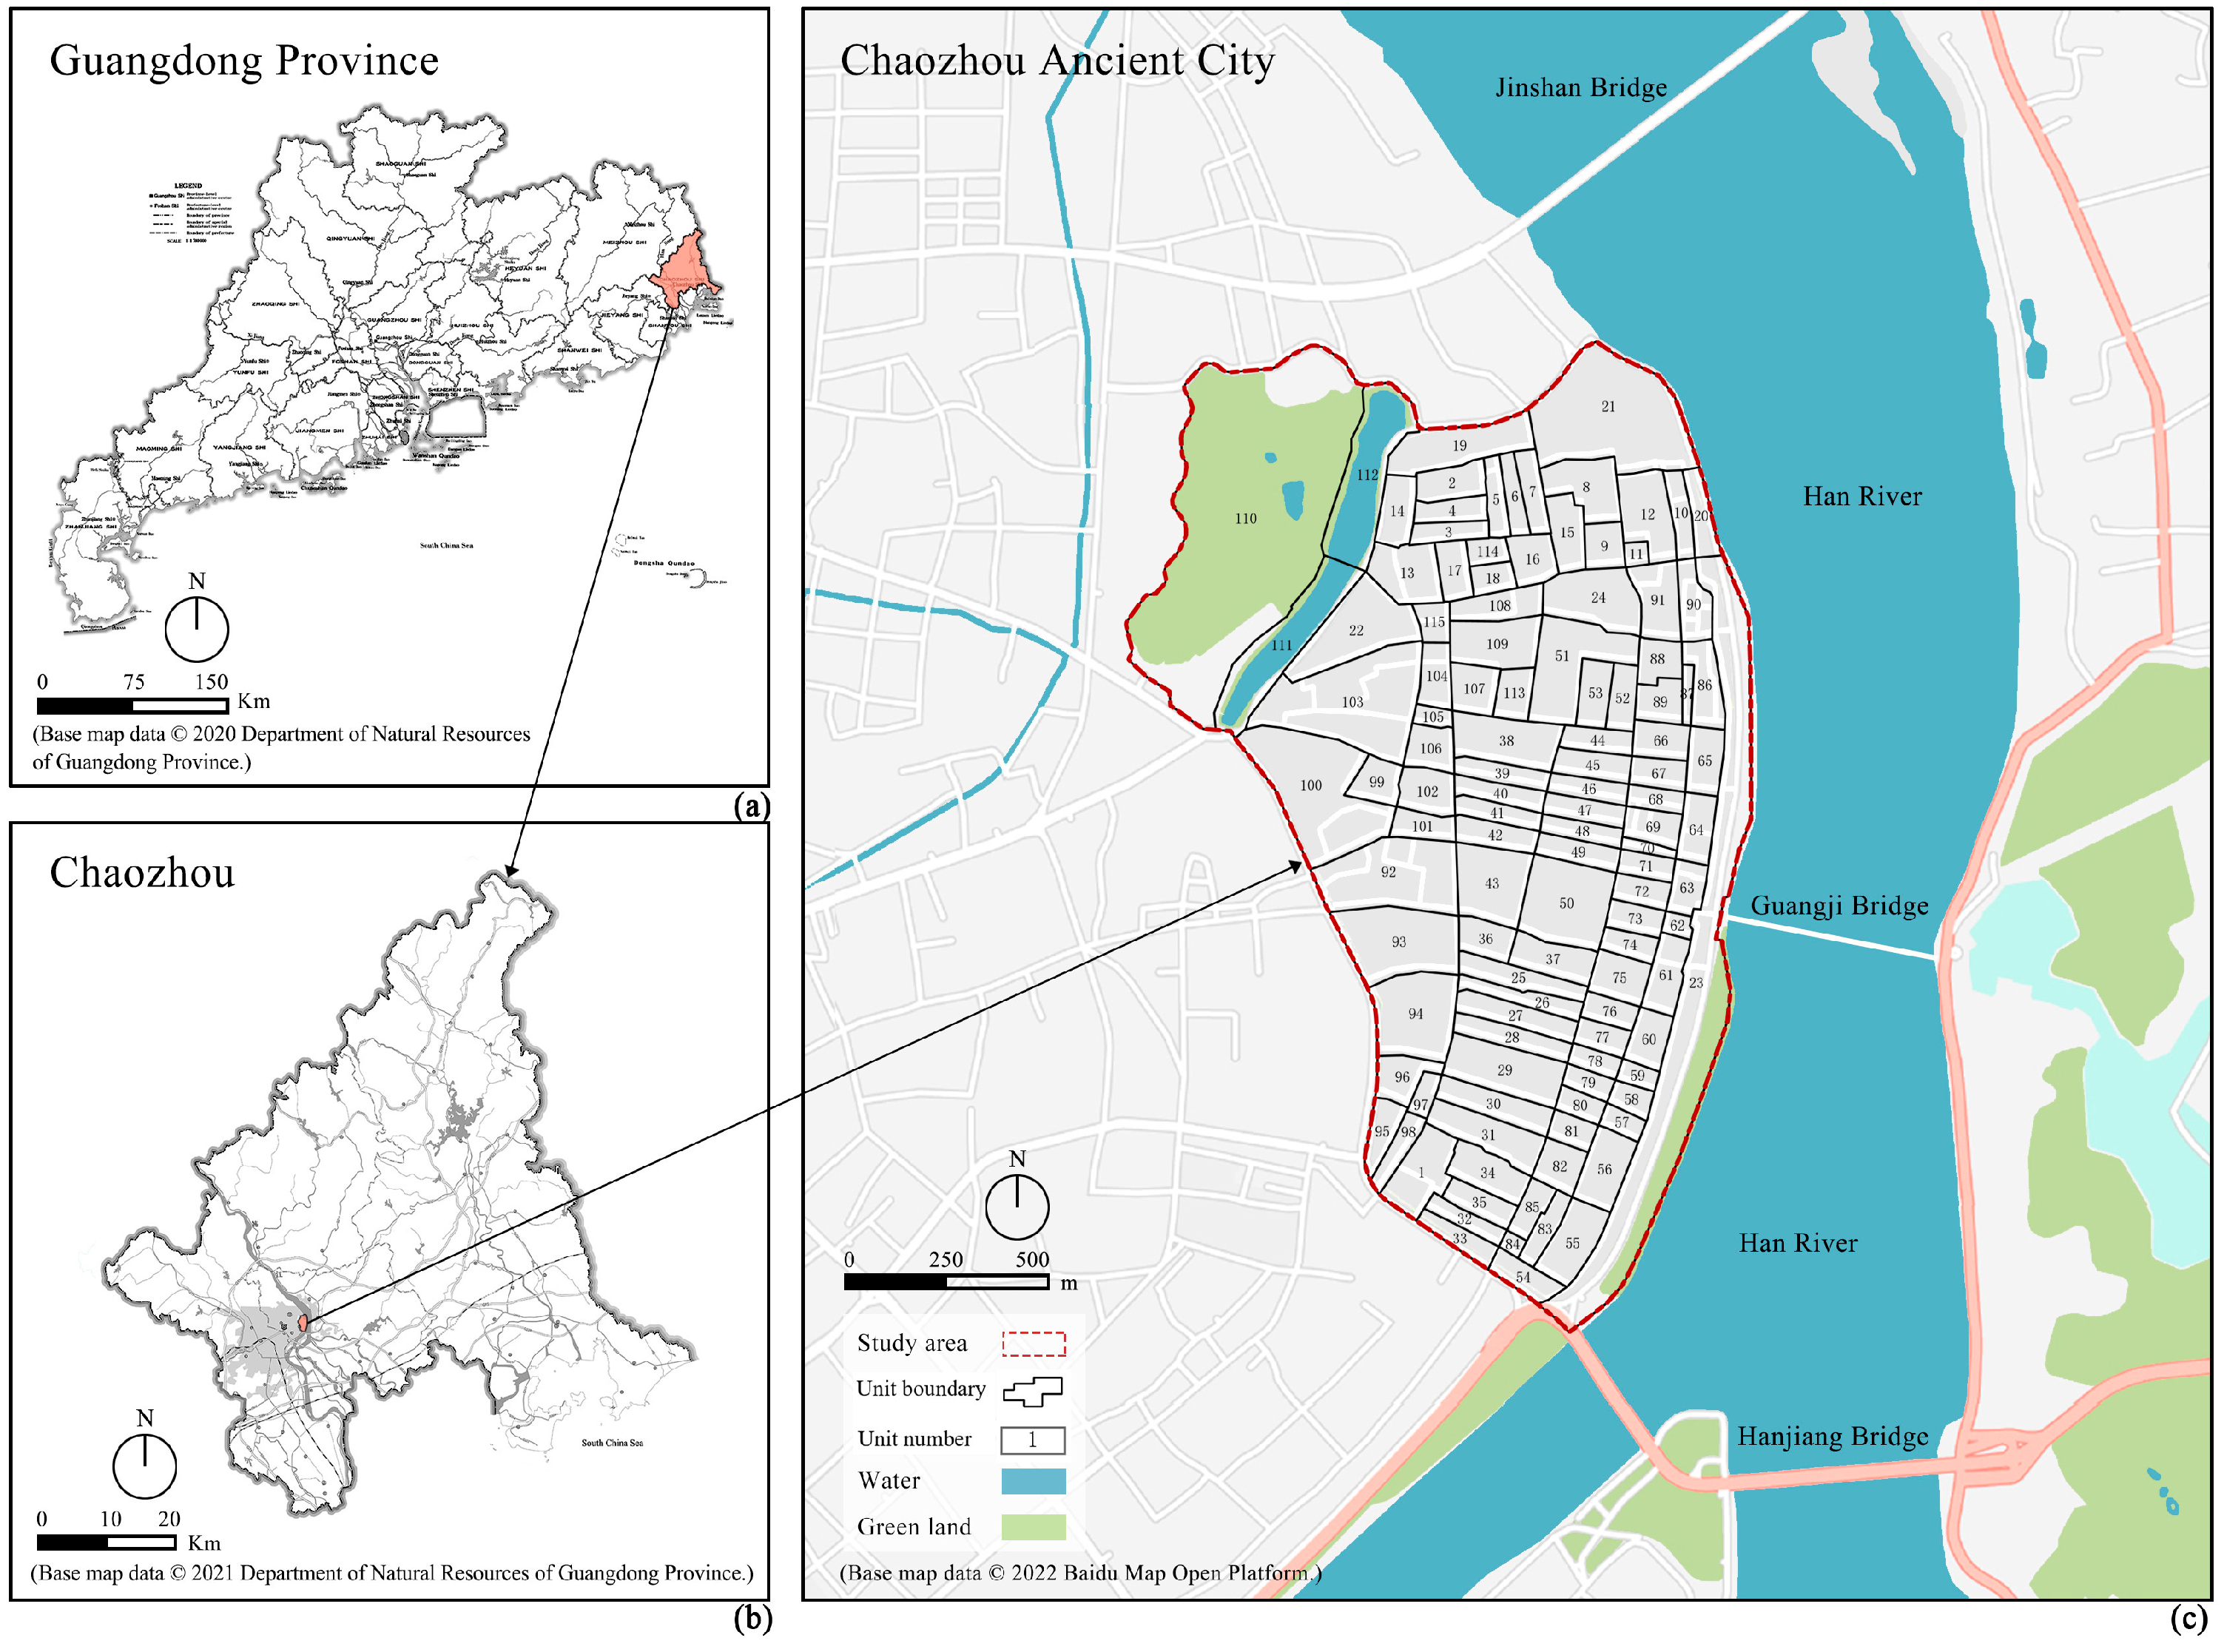
Figure 1. Location of Chaozhou and Chaozhou ancient city: (a) Guangdong Province (base map data © 2020 Department of Natural Resources of Guangdong Province); (b) Chaozhou (base map data © 2021 Department of Natural Resources Guangdong Province); and (c) Chaozhou ancient city (base map data © 2022 Baidu Map Open Platform).
Land 14 01767 g001
Figure 2. Major cultural heritage sites of Chaozhou Ancient City. (Source: photographed by the author).
Land 14 01767 g002
Figure 3. Composition and development of “layering” (Source: summarised by the author based on [19,21,23,24,26]).
Land 14 01767 g003
Figure 4. Research framework. (Source: self-drawn by the author).
Land 14 01767 g004
Figure 5. Four layering patterns of the historic landscape. (Source: self-drawn by the author).
Land 14 01767 g005
Figure 6. Value framework. (Source: self-drawn by the author).
Land 14 01767 g006
Figure 7. Evolution of landscape elements. (Source: self-drawn by the author, the base maps in the figure all use the core area of modern Chaozhou Ancient City as a unified spatial reference. The Chinese characters in the maps denote place names and architectural labels).
Land 14 01767 g007
Figure 8. (a) Spatial distribution of layering characteristics from the Sui–Tang to Song–Yuan dynasties; (b) spatial distribution of layering characteristics from the Song–Yuan to Ming–Qing dynasties; (c) spatial distribution of layering characteristics from the Ming–Qing dynasties to Republic of China Periods; (d) spatial distribution of layering characteristics from the Republic of China to the modern era. (Source: ArcGIS Pro Screenshot, the base maps in the figure all use the core area of modern Chaozhou Ancient City as a unified spatial reference).
Land 14 01767 g008
Figure 9. Graded map of layering characteristics in the historic landscapes of Chaozhou Ancient City. (Source: self-drawn by the author).
Land 14 01767 g009
Figure 10. Assessment of historic landscape values in Chaozhou Ancient City; (a) represents terrain and topography; (b) represents vegetation greening; (c) represents cultural relics; (d) represents historical place; (e) represents historic districts; (f) represents architectural landscape; (g) represents streets and alleys landscape; (h) represents cultural space; (i) represents business vitality; (j) represents space vitality; (k) shows the weighted superposition result of all the above-mentioned drawings. It is used to comprehensively present the multi-factor elements such as terrain and vegetation in the study area and the overall characteristics after superposition, providing basic data support for subsequent analysis. (Source: ArcGIS Pro Screenshot, the base maps in the figure all use the core area of modern Chaozhou Ancient City as a unified spatial reference).
Land 14 01767 g010aLand 14 01767 g010b
Figure 11. Results of the value assessment based on space division. (Source: Self-drawn by the author).
Land 14 01767 g011
Figure 12. (a) Bivariate LISA distribution map of layer–value space; (b) Bivariate LISA significance level of layer–value space. (Source: ArcGIS Pro Screenshot).
Land 14 01767 g012
Figure 13. Statistical diagram of coupling coordination types in the layer-value space. (Source: self-drawn by the author).
Land 14 01767 g013
Figure 14. Coupled coordinated distributions in layer–value space. (Source: ArcGIS Pro Screenshot).
Land 14 01767 g014
Figure 15. Matching relations in layer–value space. (Source: ArcGIS Pro Screenshot).
Land 14 01767 g015
Table 1. Data system for historic landscape research in Chaozhou Ancient City. (Source: created by the author).
Data FormatData NameData Source and Processing
Grid (with a resolution of 30 m)ElevationGeospatial data cloud (http://www.gscloud.cn)
Topographic relief
Spatial vitality heat mapBaidu Map API heat data (summer solstice: 20–22 June 2024; winter solstice: 19–21 December 2024)
Vector surfaceType of land property“Chaozhou Historical and Cultural City Protection Plan (2021–2035)”
Cultural landscape patternAncient books and atlases such as “Chaozhou Prefecture Local Records” and “Haiyang County Local Records” + Drone aerial photography (DJI P4 RTK) spatial registration
Distribution of construction years“Chaozhou Historical and Cultural City Protection Plan (2021–2035)” + On-site sampling verification
Distribution of construction qualityChaozhou Historical and Cultural City Protection Plan (2021–2035) * + On-site sampling verification
Vector pointDistribution of cultural relics protection unitsChaozhou Historical and Cultural City Protection Plan (2021–2035) *
Distribution of historical buildings and traditional-style buildingsChaozhou Historical and Cultural City Protection Plan (2021–2035) * + The fourth batch of survey data on Chaozhou historical buildings
POI business type distributionBaidu Map POI data (captured on 8 March 2025) (http://lbsyun.baidu.com/index.php?title=webapi)
Vector lineHistorical street and alley networkBaidu Map POI data (captured on 8 March 2025) + OpenStreetMap road network correction (http://download.geofabrik.de/)
* Chaozhou Historical and Cultural City Protection Plan (2021–2035) is sourced from “https://www.chaozhou.gov.cn/attachment/0/519/519450/3814125.pdf (accessed on 15 June 2025)”.
Table 2. Historic landscape value assessment system. (Source: created by the author).
Value TypeAssessment
Indicator
Assessment FactorDescription of Indicators
Ecological Base ValueEcological
integration
Terrain and topographyAssessment of typical terrain and topography spaces such as mountains and water bodies
Vegetation greeningAssessment of vegetation cover in the ancient city
Historical Heritage ValueDensity of heritage
distribution
Cultural relics protection unitAssessment of the density of distribution of cultural relics and monuments such as cultural relics protection units and historical buildings
Historical placeAssessment of the density of the distribution of historically important places (disappeared) in the ancient city
Linear heritage
distribution
Historic districtAssessment of the spatial distribution of historical and cultural districts
Landscape Character ValueArchitectural landscape
harmonization
Architectural landscapeAssessment of traditional architectural landscape
Streets and alleys
landscape integrity
Streets and alleys
landscape
Assessment of traditional streets and alleys landscape
Social Vitality ValueCultural services
coverage
Cultural spaceAssessment of the density of distribution of cultural spaces such as museums, cultural centers and exposition pavilions
Business vitality
intensity
Business vitalityAssessment of the density of distribution of commercial service resource points
Space vitalityAssessment of the distribution of space vitality in the region
Table 3. The standard of the coupling coordination degree. (Source: [56]).
CategoryLevelDegreeType
Uncoordinated
development
0 < D ≤ 0.2Severely dysfunctionalf(a) − f(b) < −0.1, Layer space lag
−0.1 ≤ f(a) − f(b) < 0.1, Layer-Value space balanced
f(a) − f(b) > 0.1, Value space lag
0.2 < D ≤ 0.4Moderately dysfunctional
Transformation
development
0.4 < D ≤ 0.6Basically balanced
0.6 < D ≤ 0.8Moderately balanced
Coordinated development0.8 < D ≤ 1.0Highly balanced
Table 4. Assignment criteria for layering characteristics of the historic landscapes. (Source: created by the author).
CategoryScoreLayering Characteristics
Continuous Layering4The degree of historical landscape change is small, and the stratification characteristics are most prominent.
Juxtaposed Layering3The degree of historical landscape change is moderate, and the stratification characteristics are moderate.
Coverage layering2The degree of historical landscape change is large, and the stratification characteristics are not prominent.
Attenuated Layering 1The historical landscape has almost disappeared, and the stratification characteristics are extremely weak.
Table 5. The 1–9 scale method. (Source: [57]).
PropertyDominance (Scale)Definition
Importance1Compared to the two elements, both are equally important.
3Compared to the two elements, the former is slightly more important than the latter.
5Compared to the two elements, the former is obviously more important than the latter.
7Compared to the two elements, the former is significantly more important than the latter.
9Compared to the two elements, the former is extremely more important than the latter.
2, 4, 6, 8The intermediate value of the aforementioned adjacent judgment
Reciprocal of 1–9Two corresponding indicators exchange the importance of order comparison.
Table 6. Assessment indicator weight value and ranking. (Source: created by the author).
Value TypeWeightAssessment IndicatorWeightAssessment FactorWeightRank
Ecological Base Value0.1313Ecological integration0.1313Terrain and topography0.059610
Vegetation greening0.07178
Historical Heritage Value0.3195Density of heritage
distribution
0.2344Cultural relics protection unit0.10784
Historical place0.12663
Linear heritage
distribution
0.0851Historical district0.08517
Landscape Character Value0.2314Architectural landscape
harmonization
0.1271Architectural landscape0.12712
Streets and alleys
landscape integrity
0.1043Streets and alleys landscape0.10435
Social Vitality Value0.3178Cultural services
coverage
0.0616Cultural space0.06169
Business vitality intensity0.2562Business vitality0.10426
Space vitality0.15201
Table 7. Spatial quantification standards for value assessment. (Source: created by the author).
Assessment
Indicator
Assessment
Factor
Assessment
Content
Score CriteriaAnalytic Method
4321
Ecological
integration
Terrain and
topography
Distance from
typical terrain and
topography
≤50 m50–100 m100–150 m150–200 mBuffer analysis
Vegetation
greening
Vegetation coverageExcellent
coverage rate
Good
coverage rate
General
coverage rate
Almost no
greening
Raster
reclassification
Density of
heritage
distribution
Cultural relics protection unitDistribution density of cultural relics unitsEspecially
concentrated
Relatively
concentrated
Generally
concentrated
ScatteredKernel density analysis
Historical placeDistribution density of historical placesEspecially
concentrated
Relatively
concentrated
Generally
concentrated
ScatteredKernel density analysis
Linear heritage
distribution
Historical
district
Distribution pattern of historical and
cultural districts
Core protection scopeConstruction control zoneHistoric areaScope of the ancient city districtBuffer analysis
Architectural landscape
harmonization
Architectural landscapeTraditional architecture landscapesExcellent
landscape
Good
landscape
General
landscape
Poor
landscape
Raster
reclassification
Streets and alleys landscape
integrity
Streets and
alleys landscape
Traditional streets and alleys
landscapes
Very completeRelatively
complete
Generally completeIncompleteRaster
reclassification
Cultural services coverageCultural spaceDistribution
density of cultural space
Especially
concentrated
Relatively
concentrated
Generally
concentrated
ScatteredKernel density
analysis
Business
vitality
intensity
Business
vitality
Distribution
density of business
service resources
Especially
concentrated
Relatively
concentrated
Generally
concentrated
ScatteredKernel density
analysis
Space vitalityDegree of space
vitality
Especially highRelatively highGenerally highRelatively lowBaidu heat map
Table 8. Analysis of global spatial autocorrelation between layer space and value space. (Source: created by the author).
Moran’s I IndexStandard Deviation (I)Z Valuep ValueCorrelation
Layer Space0.27120.06864.03750.001Agglomeration
Value Space0.64370.06989.37860.001Agglomeration
Disclaimer/Publisher’s Note: The statements, opinions and data contained in all publications are solely those of the individual author(s) and contributor(s) and not of MDPI and/or the editor(s). MDPI and/or the editor(s) disclaim responsibility for any injury to people or property resulting from any ideas, methods, instructions or products referred to in the content.