Article

Multiscale Approaches to Ecosystem Services in the Urban Agglomeration of the Yangtze River Delta, China: Socio-Ecological Impacts and Support for Urban Sustainability and Precision Management

College of Public Administration, Guizhou University of Finance and Economics, Guiyang 550025, China
*
Author to whom correspondence should be addressed.
Land 2025, 14(9), 1748; https://doi.org/10.3390/land14091748
Submission received: 9 July 2025 / Revised: 15 August 2025 / Accepted: 18 August 2025 / Published: 29 August 2025

Abstract

The trade-offs and synergies among ecosystem services can provide clues for understanding the mechanisms of regional ecological evolution. Previous studies have mainly concentrated on administrative divisions to characterize ecosystem services trade-offs and synergies within specific regions. However, ambiguity persists regarding the spatial diversity and scale dependency of regional ecosystem services, along with the degree to which human activity and climatic variation influence the relationships of multiscale ecosystem services. This study focuses on the Yangtze River Delta Urban Agglomeration in China. Based on grid, county-level, and city-level scales, it analyzes five ecosystem services, namely habitat quality, carbon storage, food production, soil conservation, and water yield, from 2000 to 2020. By using correlation analysis and spatial autocorrelation methods, this study explores the intensity of the trade-offs and synergies among ecosystem services and their spatial patterns. Then, combined with the Optimal Parameters-based Geographical Detector, it identifies the dominant driving factors, quantifies their degree of contribution, and reveals the multiscale differentiation of ecosystem service relationships and their causes. The results show that the five ecosystem services all exhibit significant spatiotemporal heterogeneity. At the grid scale, there is a trade-off relationship between food production and the other four services, while a strong synergistic effect exists among the remaining four services. At the county scale, the synergistic association between habitat quality and carbon storage is the most significant, with the highest contributions from the average annual precipitation and average annual temperature (q-values 0.893 and 0.782, respectively). At the prefecture-level city scale, the intensity of the ecosystem services trade-offs and synergies shows an increasing trend, and the impact of interactions between socio-ecological elements is significantly higher than that at the grid and county scales. This research provides an evidence-based foundation for decision makers to devise suitable strategies that support the coordinated advancement of ecology and the economy across various spatial scales. It is crucial for promoting precise ecosystem regulation and the sustainability of the Yangtze River Delta Urban Agglomeration in China.

1. Introduction

Ecosystem services (ESs) are defined as the direct or indirect prerequisites and advantages that are essential for sustaining life and human existence and are derived from the structure and functioning of ecosystems [1,2]. Serving as a connection between human society and natural ecosystems, research on ESs is of great consequence in advancing the development of urban areas and achieving precise administration [3]. Research statistics show that, influenced by rapid human socio-economic development and climate change, 60% of global ESs have degraded [4]. This is especially the case in urban agglomerations, which are among the regions where the conflict between human activities and the natural environment is the most intense and the relationships are the most complex [5,6]. In regard to urban ecological administration, when specific stakeholders, such as local development-oriented entities, resource-dependent industries, or short-term policy implementers, who are among the beneficiaries or co-generators of ESs, prioritize the growth of particular ESs without comprehensive planning, it may inadvertently lead to the diminishment of other ESs [7,8]. This undoubtedly intensifies the trade-off effect of ESs and increases potential ecological risks. Therefore, it is necessary to thoroughly comprehend the complex changes and relationships within ecosystems. This helps to quantitatively and provide an evidence base to understand the linkage between socio-economic development and the supply of ESs, in order to promote the healthy and sustainable development of cities [9,10].
Currently, there are still many limitations in regard to the spatial expression of the spatiotemporal differences within regions, the systematic comprehension of the internal mechanisms underlying the formation of relationships among ESs, and the research on the internal heterogeneity of ecosystems [11]. On the one hand, there are complex interactions among socio-ecological factors, such as nature, the economy, culture, and population, which have diverse and elusive impacts on the mechanisms of trade-off and synergy relationships [12]. On the other hand, traditional research methods are unable to fully present these complex influences. For example, global regression models cannot depict the spatial non-stationarity of ecosystems [13] and, although geographically weighted regression takes into account spatial interactions, it also has its drawbacks [14]. The intricacy of ecosystem changes and continuous anthropogenic disturbances have created a gap between ecosystems and their practical applications in geographical layouts and ecological governance [15,16], meaning that it is still a major challenge for the relevant departments to balance the demands of stakeholders and enhance the provision of ESs [17,18].
The research on ESs has evolved from a conceptual definition, methodological exploration, dynamic assessment, and spatiotemporal characterization to the analysis of influencing factors, yielding fruitful results during this progression [19,20,21]. Academics extensively utilize geographic mapping [22], scenario analysis [23,24], and model simulations [25], leveraging tools like InVEST [26] and ARIES [27]. They have placed great emphasis on exploring the spatiotemporal variation features of the trade-offs and synergies of ESs, the scaling effects, and the formation mechanisms [28,29]. With the acceleration of urbanization in the Yangtze River Delta (YRD) region, research on the trade-offs and synergies of ESs has gradually become a focus of academic attention. At present, numerous scholars have conducted in-depth explorations from multiple dimensions, revealing the complex interrelated mechanisms of ESs in this region, on temporal and spatial scales. Min et al. [30] found that from 1990 to 2020, the ecosystem service functions in the YRD region showed significant spatiotemporal heterogeneity. There was a dominant synergistic relationship among soil conservation, carbon storage, and habitat quality, while the net primary productivity (NPP) mainly had a trade-off relationship with the above three services. This finding provides an important scientific basis for regional ecological management practices. Fang et al. [31] found that the total ecosystem service value in the YRD region decreased from 1990 to 2018, with the decline rate slowing down after 2010. In terms of spatial distribution, it showed a pattern of being higher in the south and lower in the north. Its dynamic changes are mainly driven by factors such as altitude, sunshine duration, and annual precipitation. Chen et al. [32] found in their study on the trade-off and synergy relationships of ESs in the YRD that as the research scale expands, the strength of the synergies generally weakens, while the trade-offs become more pronounced. Although understanding the relationships among ESs in the Yangtze River Delta (YRD) Urban Agglomeration and their dynamic changes over long-term time series and across multiscale dimensions is particularly crucial for urban managers to formulate scientific decisions, existing research outcomes are mostly confined to single administrative regions or watershed units. There is a scarcity of studies that systematically analyze the associations between the spatiotemporal changes of ESs and influencing factors from a multiscale perspective, and there remains a significant deficiency in the multiscale analysis of influencing factors.
Numerous studies have revealed that the trade-offs and synergies among ESs and the degree of influence from social–ecological factors exhibit significant variations across different scales [33,34]. Xia et al. [35] focused on the Beijing–Tianjin–Hebei region, exploring the scale effects in regard to the relationship between urbanization and ESs, and found that changes in scale affect the interactions between ecological processes and functions. Similarly, Zeng et al. [36] analyzed the scale impacts and determinants of ESs trade-offs and synergies within the Lishui River Basin and found that as the scale increases, the trade-off and synergy effects become more pronounced, and the capacity to provide explanations for single-factor or two-factor interactions increases accordingly. Among these, climatic factors and topographic characteristics have particularly significant impacts on ESs. This confirms that scale effects are important factors that affect alterations to ESs. The correlative results revealed by single-scale analyses may lack representativeness; if directly extrapolated to adjacent scales, this could lead to oversimplification or the neglect of scale-dependent relationships, thereby obscuring the mechanisms through which the same influencing factors drive variations in ESs across several scales of space [37]. Neglecting cross-scale interactions may lead to a mismatch between the management strategies for ESs and the provision of diverse services [38]. In summary, there is still the lack of a systematic understanding of how social–ecological drivers of ESs trade-offs and synergies vary across different spatial scales. This limited understanding may severely restrict the regulation of various drivers, thereby affecting the formulation of multi-level management decisions. Therefore, analyzing ESs trade-offs and synergies using a multiscale viewpoint, identifying relevant driving factors and, thereby, clarifying the scale effects influencing this dynamic process, represent critical issues that need to be addressed urgently. This research approach is crucial for guiding management decision makers at different levels to formulate scientific and targeted management strategies based on local ecological realities, and it also provides the foundation for attaining the most effective use of ecological resources and healthy city growth.
The YRD Urban Agglomeration in China is one of the six major urban agglomerations in the world. At the same time, it is also among the most economically thriving areas, with a high degree of urbanization and urban agglomeration in China [39]. Since the early 21st century, the YRD Urban Agglomeration has undergone swift urbanization and development. Urban expansion has brought about the appropriation of substantial amounts of natural wetlands and ecological land, weakening the carbon sink capacity and damaging natural ecosystems, thereby triggering tensions in regard to regional human–land relationships and imbalances in the provision of ESs, like air contamination, water shortages, and the degradation of water quality [40]. Nevertheless, a deficiency still exists in regard to empirical research into the effects of such activities on ESs across the YRD Urban Agglomeration. In particular, there has been a dearth of studies that identify and disclose the motivating forces and variances in regard to ESs trade-offs and synergies, based on diverse scales. This insufficiency makes it challenging to provide managers with effective evidence-based insights. Against this backdrop, this paper focuses on the YRD Urban Agglomeration, calculates and evaluates five key ESs for the years 2000, 2010, and 2020, and clarifies their spatiotemporal dynamic advancement characteristics at grid, county, and municipal scales. Using Spearman’s correlation analysis and bivariate spatial autocorrelation, this study analyzes the relationships of ESs at multiple scales and their spatial aggregation effects. By scientifically diagnosing and identifying dominant driving factors through the use of the Optimal Parameters-based Geographical Detector (OPGD) model, this research reveals the interactions among multiscale ESs and their drivers. This research focuses on the trade-off and synergy relationships of ESs across multiple scales, as well as their spatiotemporal distribution patterns, identifies their driving factors, and puts forward the following scientific inquiries: (1) What are the intensity differences and spatial variations in regard to ESs trade-offs and synergies? (2) What are the disparities in ESs dynamics between 15 km × 15 km grid, county, and municipal scales? (3) Do the dominant drivers identified by the OPGD model form a scientific basis for precision management units? (4) How do changes in ESs influence spatial planning and management strategies for urban agglomerations?
The objectives and academic contributions of this study are as follows: (1) to reveal the multiscale expression differences between ESs trade-off and synergy relationships and their driving factors; (2) to clarify the spatiotemporal dynamic evolution characteristics of ESs, and quantitatively identify the dominant driving factors and their interaction effects by means of the OPGD model; and (3) to analyze the scale dependence and variability of ESs and the influencing factors, so as to provide decision-making references for the formulation of cross-scale ecological management strategies and the optimization of urban agglomeration spatial planning. This study aims to provide a theoretical and scientific basis for the precise regulation and sustainable management of ESs in the YRD Urban Agglomeration. Furthermore, it is hoped that the results will provide important clues for the management of ESs and the optimal distribution of ecological resources in the YRD Urban Agglomeration and other global urban agglomerations.

2. Materials and Methods

2.1. Study Area

The YRD Urban Agglomeration is situated in eastern coastal China (Figure 1), exhibiting an ordinary subtropical climate, with a typical yearly temperature of about 15–16 °C and a typical precipitation range from 1000 to 1400 mm. There exists in the region a largely flat terrain, with small hills located in the western and southern portions. The natural vegetative cover is mainly defined by tropical evergreen broadleaf forests [41]. The YRD Urban Agglomeration spans across the Shanghai Municipality and the provinces of Jiangsu, Zhejiang, and Anhui, which together comprise 27 cities. In recent years, rapid urbanization has led to the continuous shrinkage of the ecological space and persistent degradation of the ESs. The escalating imbalance in regard to the ESs trade-offs and synergies has emerged as a critical threat to regional sustainability. As a highly urbanized and economically vibrant region in China, the YRD Urban Agglomeration has experienced particularly acute cumulative impacts from human activities and economic models on ESs. Prominent ecological issues, such as exacerbated urban heat islands, wetland ecosystem degradation, and biodiversity loss, have further highlighted the urgent need to harmonize ESs relationships. Against this backdrop, systematically unraveling the interaction mechanisms and precisely identifying the key drivers of ESs trade-offs and synergies are imperative for achieving deep integration between human well-being maximization and regional sustainable development in the YRD Urban Agglomeration.

2.2. Data Sources and Preprocessing

The foundational data used in the research includes land use, meteorological, soil property, topographic, and socio-economic data from 2000, 2010, and 2020 (see Table 1 for details). All the data referenced throughout this study have been uniformly transformed into the WGS_1984_UTM_Zone_47N coordinate system, and the spatial resolution of all the data is 1 km × 1 km.

2.3. Methodology

2.3.1. Quantification and Assessment of ESs

By utilizing the InVEST model and ArcGIS 10.8 software, this study quantitatively evaluated the quantities of five types of ESs in the YRD Urban Agglomeration in 2000, 2010, and 2020, and revealed their spatiotemporal patterns. The calculation methods are presented in Table 2.

2.3.2. Research Methods for ESs Trade-Offs and Synergies

(1)
Correlation Analysis
Correlation analysis was utilized to analyze the linear relationships between variables [44]. The correlation coefficient quantified the intensity of the correlations among the variables to measure ESs trade-offs and synergies. A positive number signifies a synergistic interaction in which both variables rise or decrease concurrently, while a negative value indicates an inhibitory relationship with mutually restrictive effects. Spearman’s correlation analysis formulas are as follows:
r s = 1 d 2 j n ( n 2 1 )
d j = r g ( X j ) r g ( Y j )
where rs is Spearman’s correlation coefficient, j represents different types of ESs, n denotes the sample size, and dj signifies the rank difference of the j-th observation between variables X and Y.
(2)
Geographically Weighted Regression (GWR)
Geographically weighted regression is a regional regression model proposed by Brunsdon et al. [45]. In this study, GWR was employed to identify the spatial heterogeneity of the trade-off and synergy relationships among the ESs [46]. The calculations were primarily performed using the MGWR software, with the formula as follows:
y i = β 0 ( μ i , v i ) + K = 1 P β k ( μ i , v i ) x j k + ε i
where ( μ i , v i ) represents the spatial location of point i; P is the number of independent variables; yi denotes the dependent variable; xjk stands for the independent variable; ε i is the random error; β 0 ( μ i , v i ) is the intercept at point i; and K = 1 P β k ( μ i , v i ) is the regression coefficient. A negative regression coefficient indicates a trade-off relationship, while a positive regression coefficient indicates a synergistic relationship.
(3)
Bivariate Spatial Autocorrelation Method
Geographical phenomena typically exhibit varying degrees of spatial autocorrelation under the impact of spatial relationships and spatial dispersion. Moran’s I is typically used to examine spatial correlations among various variables. Bivariate spatial autocorrelation results are marked by high–high and low–low cluster patterns, indicating synergistic relationships between ESs; low–high and high–low clusters indicate trade-off relationships [47]. This study employs this approach to investigate the spatial correlations of bivariate ESs, with the relevant formulas referenced from the literature.
I i = n ( x i x ¯ ) j = 1 n w i j ( x j x ¯ ) i = 1 n ( x i x ¯ ) 2
where Ii denotes the localized Moran’s I; n signifies the number of evaluation space units; xi and xj denote the regional ecosystem service quantities; and wij represents the spatial weight matrix.

2.3.3. Influencing Factors of ESs Trade-Off and Synergistic Relationships

(1)
Screening of Influencing Factors
This study, placed within the practical setting of the YRD Urban Agglomeration and informed by relevant results from previous research [48], comprehensively considers key elements of natural and socio-economic aspects. Ten driving factors were identified according to the criteria for indicator quantification and data accessibility: six natural factors, including the proportion of cultivated land, the proportion of forestland, the annual average precipitation, sunshine duration, the NDVI, and the annual average temperature; and four socio-economic factors, including the proportion of built-up land, human activity intensity, GDP per unit of land area, and population density [49].
(2)
Optimal Parameters-based Geographical Detector (OPGD)
Geographical detectors can be used for the detection and analysis of ESs and selected factors, revealing the spatial differentiation of driving forces. Traditional geographical detectors have strong subjectivity in regard to discretizing continuous variables, which affects the determination of the optimal scale of spatial stratification heterogeneity, to a certain extent. The improved OPGD model can better achieve optimal discretization of spatial data and optimal combination analysis of spatial layer numbers and spatial scale parameters. Referencing prior studies, this paper uses classification methods such as the equal interval, natural interval, quantile interval, and standard deviation interval, sets the number of classification levels to 3–6 categories [50], and screens out the parameter combination with the largest q value for spatial discretization. By calculating the q value of a single factor [q(X1), q(X2)] and the q value of the interaction between two factors [q(X1∩X2)], it is determined whether there is an interaction between the two factors and the degree of the interaction. The following is the formula for calculating the q value:
q = 1 h = 1 L N h σ h 2 N σ 2 = 1 S S W S S T
where q represents the factor’s interpretive ability, ranging from 0 to 1, and a higher magnitude implies a more effective explanation; h denotes the stratum of the explicating factor or the dependent variable; Nh and N are the number of units in stratum h and the whole region, respectively; σh and σ2 represent the variance of stratum h and the total variance of the entire area, respectively; and SSW and SST are the total of within-strata variances and the total variance of the entire region, respectively.

2.4. Technical Approach

This study analyzes five ecosystem service functions, from 2000 to 2020, from a multiscale perspective and clarifies the intensity and spatially aggregation attributes for ESs trade-offs and synergies. By applying the OPGD model, it scientifically diagnoses and identifies the dominant driving factors, quantifies their contributions, and explores the multiscale characteristics and the causes of differential alterations in ESs trade-offs and synergies. Figure 2 illustrates the technical roadmap.

3. Results

3.1. Spatiotemporal Dynamic Evolution Characteristics of ESs

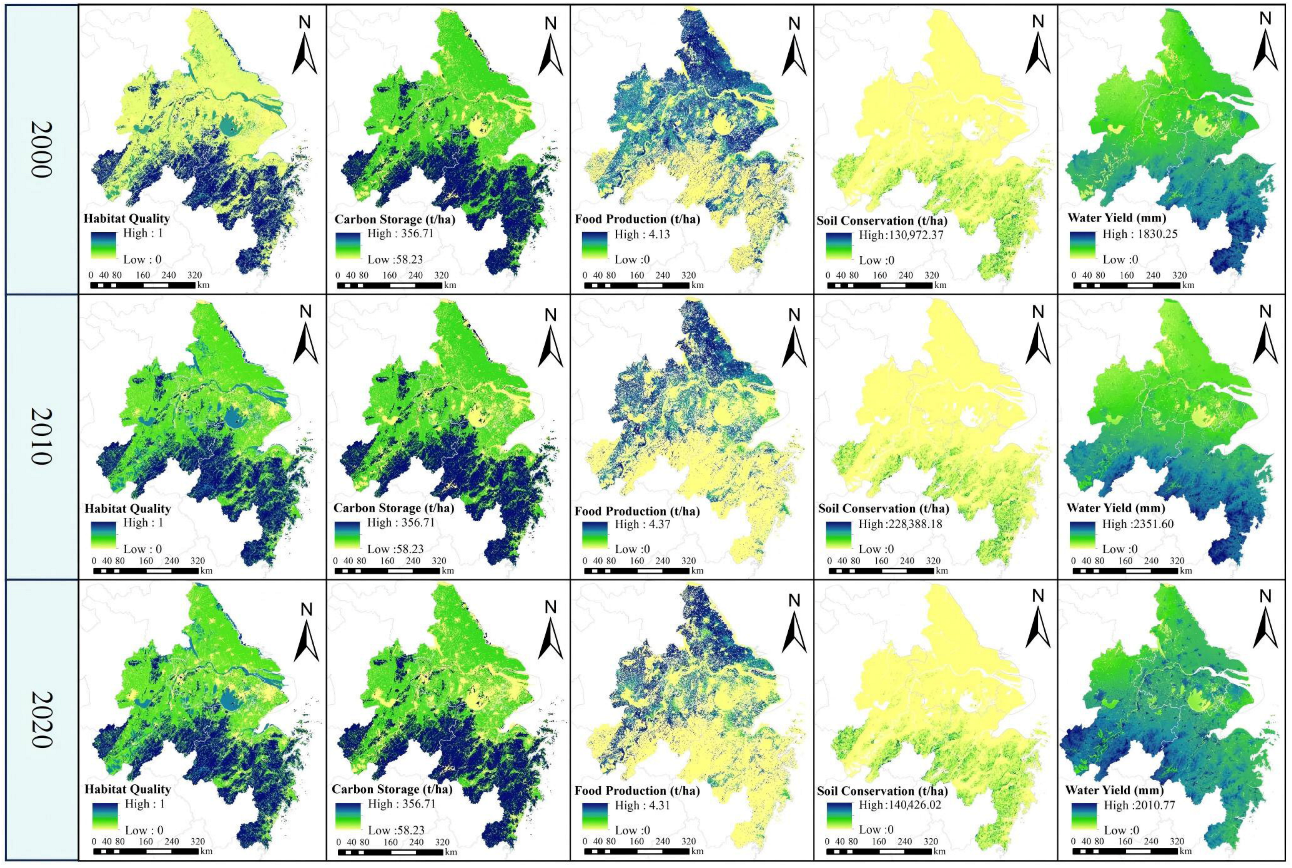
The ESs in the YRD Urban Agglomeration showed relatively significant fluctuating change characteristics from 2000 to 2020. As Table 3 shows, the HQ index fell from 0.504 to 0.489, with a decline rate of 2.90%. This declining trend may be mostly linked to the growth of building land, which has led to habitat patch fragmentation and increased ecological sensitivity, therefore affecting the continuing drop in habitat quality. During the last two decades, CS has declined by around 1.71%. This alteration reflects the substantial effect of human activities on this region. In particular, the expansion of cities has led to a reduction in the area of certain land uses, such as cultivated land, forestland, and grassland, which have a relatively high carbon density. With regard to FP, the decline rate was 33.95% from 2000 to 2020. This downward trend reveals the deterioration of the FP function of the urban agglomeration in the YRD, which is likely associated with factors including land use changes, adjustments in farming policies, and climatic change.
SC and WY followed a “inverted A-shaped pattern” over the 2000–2020 period. The SC capacity markedly improved from 2000 to 2010, rising from 5.522 × 10¹⁰ t to 8.908 × 10¹⁰ t, an increase of 61.32%. This growth was primarily attributed to high natural vegetation coverage, particularly the critical role of forestland in terms of windbreak, sand fixation, and soil–water conservation. Vegetation enhanced the soil stability through root systems, reducing water and wind erosion. However, from 2010 to 2020, SC decreased from 8.908 × 10¹⁰ t to 5.905 × 10¹⁰ t, a decline of 33.71%. Despite this, the SC capacity still achieved an overall growth of 6.94% throughout the entire study period. The trend of the WY closely aligned with that of SC. Overall, the WY showed a relatively obvious growth trend, with an increase of 37.34%. More specifically, the WY increased from 1.505 × 10⁸ t to 1.992 × 10⁸ t between 2000 and 2010, an increase of approximately 1.32 times its original value. This growth was likely attributed to increased rainfall, which provided more water sources for surface runoff and groundwater recharge. The extension of urban areas has increased the extent of the impervious surfaces in the region, hence altering natural water infiltration and the production of surface runoff. However, throughout the years from 2010 to 2020, the WY increased by 3.78%. One of the significant reasons for this change is that the urban and rural living lands and the lands for industrial production in the YRD have encroached upon forestlands, grasslands, and agricultural production lands. This has resulted in overexploitation and the contamination of water resources and has impacted the hydrological cycle and freshwater replenishment.
As can be seen from Figure 3, all of the ESs, from 2000 to 2020, exhibited remarkable spatial heterogeneity. HQ, CS, SC, and WY exhibited a north-to-south increasing gradient. High-value areas for HQ were mainly distributed in southern counties (e.g., Chun’an, Shitai, Wencheng, and Taishun), with average values exceeding 0.85. In contrast, low-value areas were clustered in northeastern regions (e.g., Shanghai Municipality, Nanjing City, Suzhou Industrial Park, etc.), with average values that were below 0.10. For CS, the highest values (356.71 t/ha) in 2000–2020 were observed in Wencheng County, while the lowest values (58.23 t/ha) were consistently recorded in Shanghai Municipality. High carbon storage areas are primarily concentrated in the southern YRD Urban Agglomeration, due to the region’s humid climate and forest-dominated land use, which promotes high-density vegetation and rich soil organic matter composition. SC followed a higher in the south, lower in the north spatial trend, with high per grid cell values concentrated in southern cities (e.g., Hangzhou, Wenzhou, Anqing). This distribution likely resulted from the prevalence of forestland in the south, where forests effectively reduced soil loss through their windbreak, sand fixation, and soil–water conservation functions. The WY generally featured a “north low and south high” pattern, with the maximum value reaching up to 2351.60 mm. Fluctuations in precipitation and topographical features primarily constrain alterations in the WY. Forestlands and grasslands with high vegetation coverage significantly influence the WY through their unique mechanisms of rainfall absorption and transpiration release. Meanwhile, the expansion of construction land increases the WY by altering the surface cover, affecting the hydrological cycle and the surface energy balance.
Contrary to the above ESs, FP demonstrates a spatial arrangement feature of “high in the north and low in the south”. Between the years 2000 and 2020, the highest yield attained 4.37 t/ha, with premium zones distributed in the northern plain region. This region features flat terrain and extensive farmland, serving as the core zone for FP in the YRD Urban Agglomeration. Inversely, low-value lands are concentrated in the south’s hilly regions. Because of a complicated and diverse geography and extensive forest coverage in this area, the area of farmland is significantly restricted, which in turn affects the total FP and results in relatively lower yields.

3.2. ESs Trade-Offs and Synergies in the YRD Urban Agglomeration

3.2.1. Spearman’s Rank Correlation Coefficients Among ESs

To delve into the interaction mechanisms among different ESs, this study divided the research area into 1318 grids of 15 km × 15 km on the basis of the average area of land use patches (approximately 14.85 km2) [51]. Spearman’s correlation coefficients were calculated for multiple scales. As shown in Figure 4, significant correlations (p < 0.01) were observed among the five ESs, with absolute correlation coefficients exhibiting scale-dependent trends: the highest absolute value (r = 0.95, p < 0.01) occurred at the municipal scale, followed by the county scale (r = 0.92, p < 0.01), and the lowest (r = 0.84, p < 0.01) at the grid scale.
The correlation results across three time periods at different scales were strongly consistent, revealing four trade-off relationships and six synergy ties. The trade-offs were primarily that of FP and other ESs. At the level of the city size, the most relevant trade-off was detected among FP and soil protection (r = −0.94, p < 0.01), while the weakest trade-off at the county scale was between FP and CS (r = −0.18, p < 0.01). Between 2000 and 2020, the significance of the trade-offs reduced in regard to all the scales, accompanied by decreased negative correlation coefficients. Meanwhile, in regard to the dominant relationships, synergies existed among SC, CS, HQ, and WY. At the city scale, there was an extremely strong positive correlation between HQ and SC from 2000 to 2020. Following that, the correlation coefficients for HQ, SC, and CS were 0.95 (p < 0.01), 0.94 (p < 0.01), and 0.94 (p < 0.01), respectively. However, the synergistic correlation coefficients of WY with HQ, CS, and SC showed a declining trend when comparing the grid cell size to the county scale, indicating that the synergistic relationships weaken as the scale expands.

3.2.2. Multiscale Spatial Agglomeration Characteristics of ESs

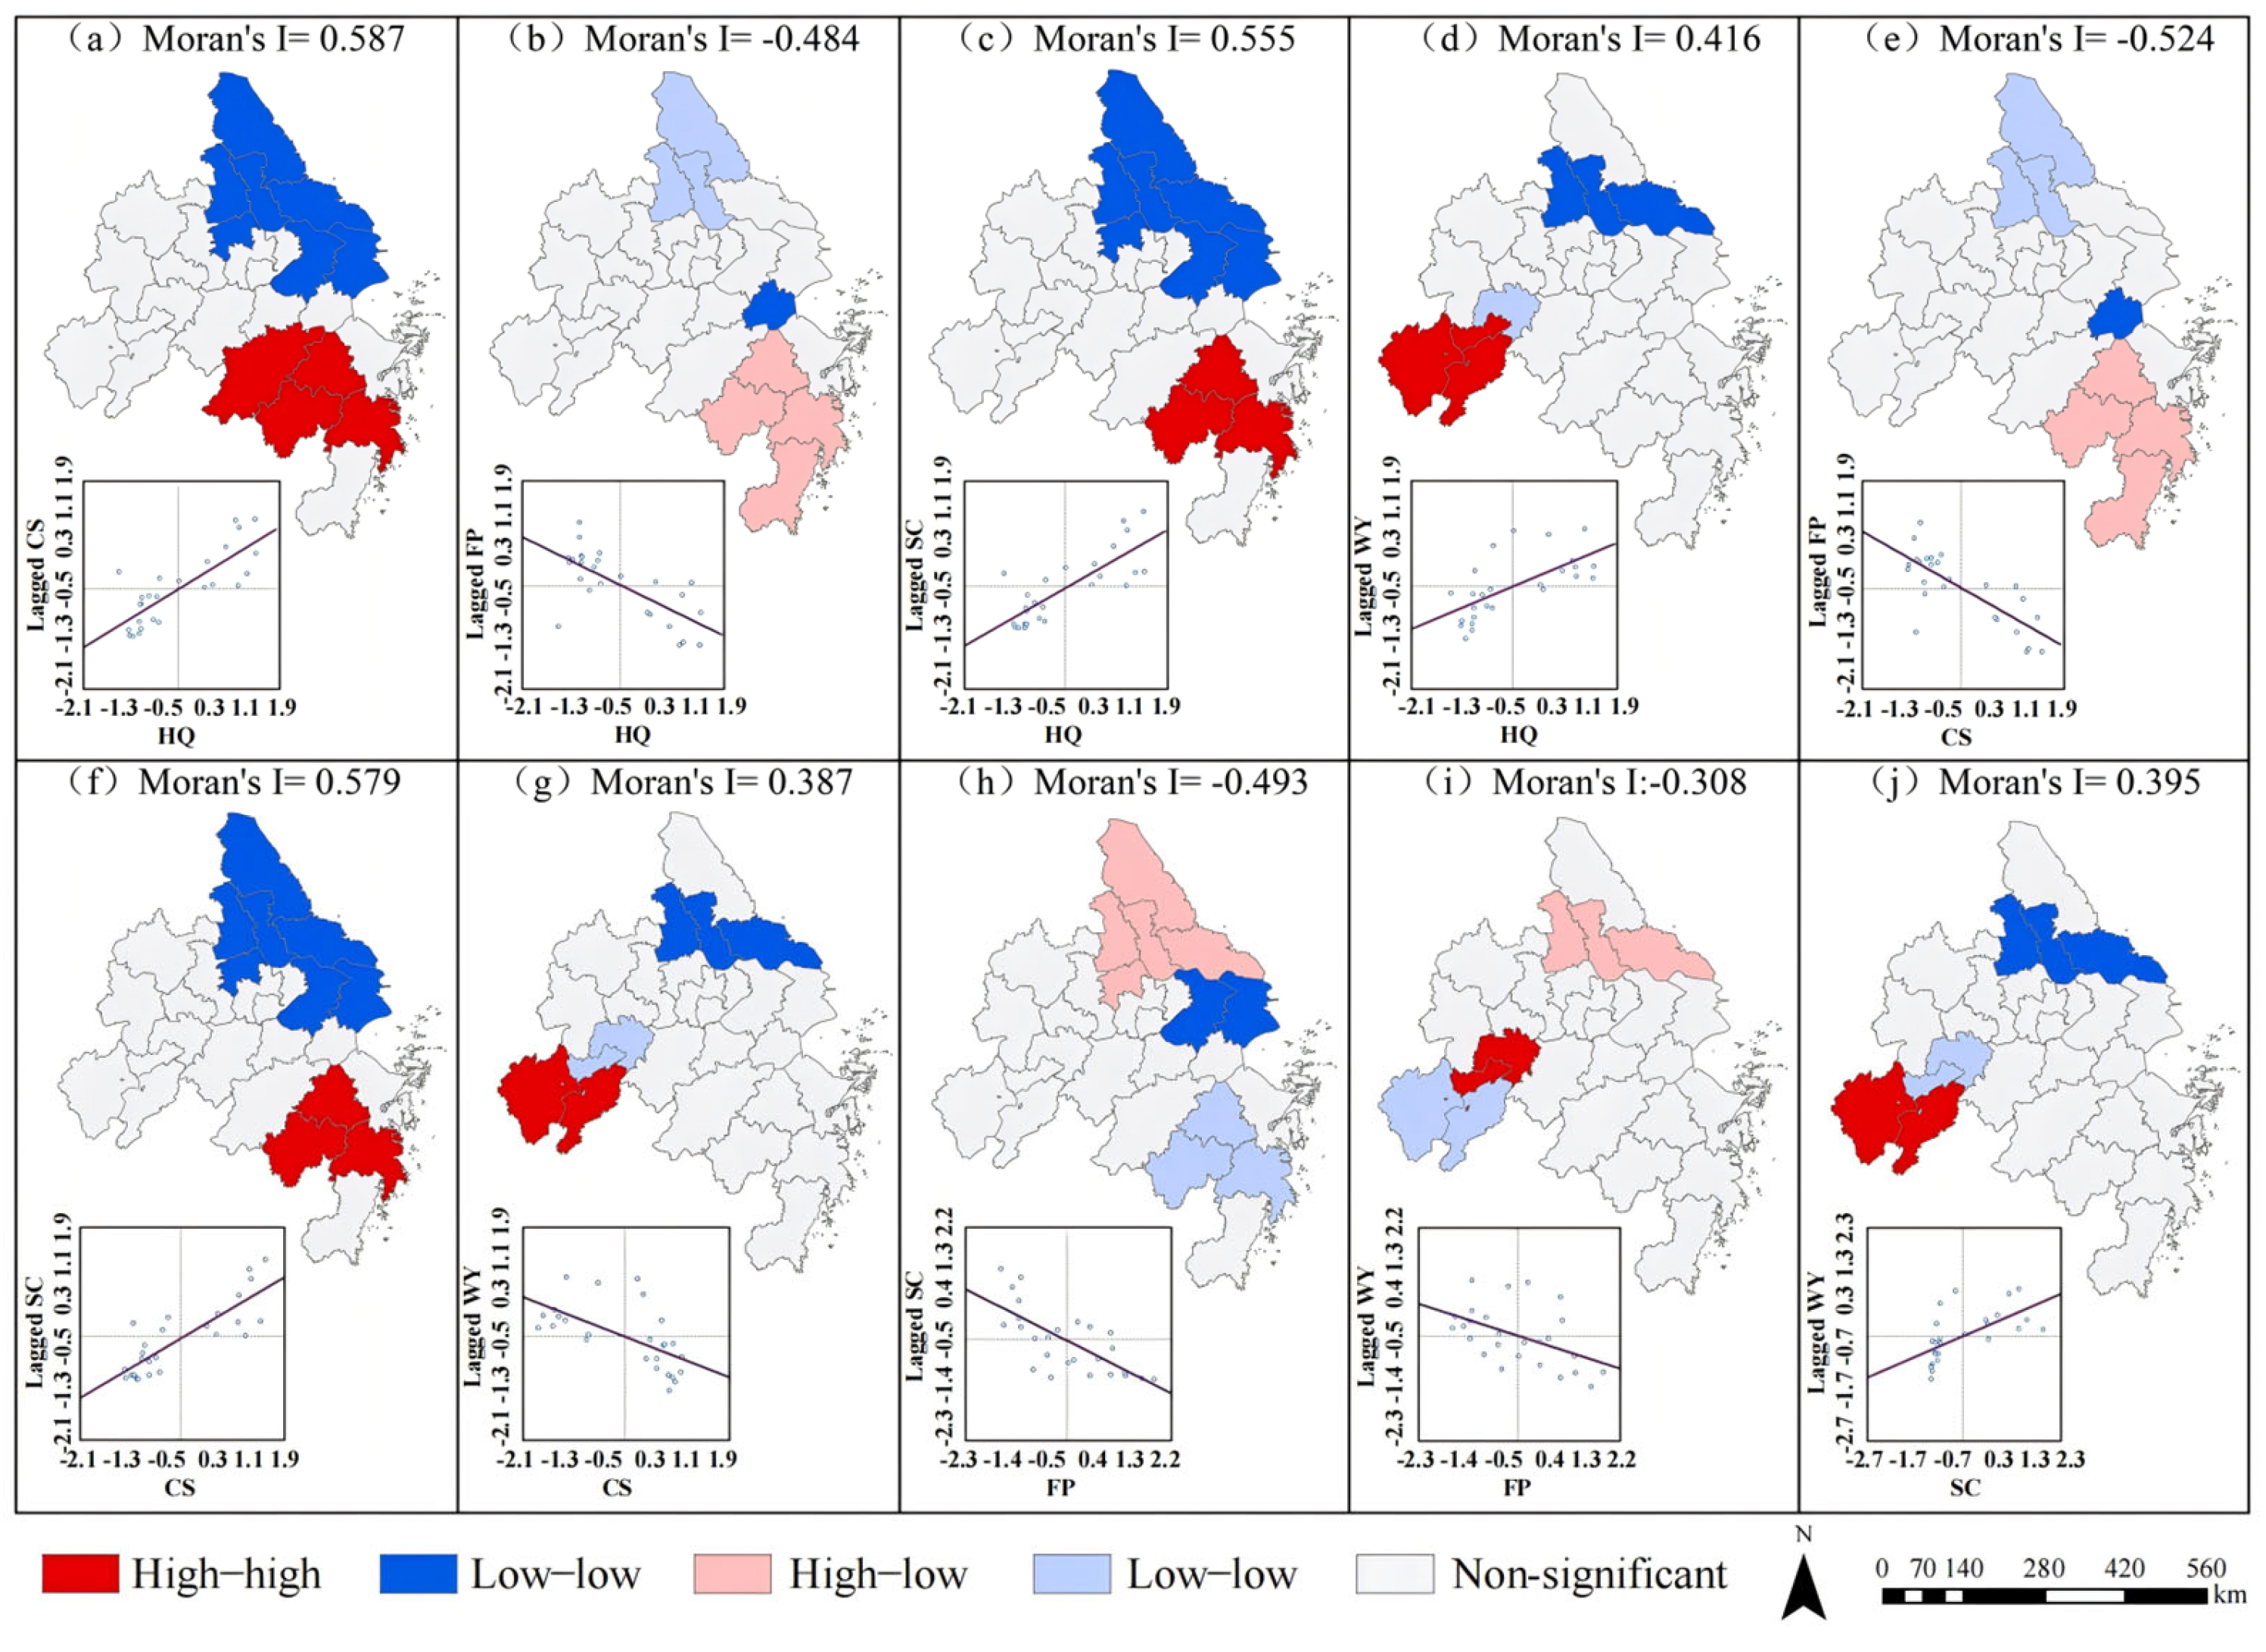
This part of the study focuses on the year 2020. The LISA agglomeration maps for the five ESs were used to illustrate the regional agglomeration characteristics over three distinct spatial scales: grid, county, and city. As shown in Figure 5, at the grid scale, there were significant variations in the geographical distribution of the relationships among the ESs. Predominantly, locations with synergistic relationships were relatively concentrated in the northern and southern parts of the research region, indicating that the ESs in these areas exhibited positive spatial dependence. Conversely, the areas with trade-off relationships were more scattered, with the number of cells involved not exceeding 800, and they were mostly distributed in regions with a higher degree of urbanization, closely linked to the intense interference of human activities. In particular, the areas where the CS and FP exhibited a trade-off relationship were relatively concentrated, involving a total of 754 cells, and were mainly distributed in plain regions with a high degree of agricultural intensification, reflecting the potential impact of agricultural production on carbon storage capacity. As depicted in Figure 6, at the county scale, the bivariate spatial autocorrelation coefficient was relatively high, and there was a certain resemblance to the spatial distribution pattern at the grid scale, with both “High–high” and “Low–low” clusters concentrated on the northern and southern sides of the study area. The most significant synergistic relationship (118 cells), which was between the CS and the SC, was mostly situated in the northern and southern parts of the research area. Meanwhile, there were small-scale distributions in Hefei City and Ma’anshan City, as well as in Nanjing City and Zhenjiang City, which are in the western part of the research region. Figure 7 shows that at the city scale, the area was composed of 27 cells, with a relatively low bivariate spatial autocorrelation coefficient, reflecting an increase in heterogeneity of large-scale spatial units and a weakening of local agglomeration effects. The areas where the five ESs exhibited synergistic interactions mostly occurred in the north and southeast sections of the research range. Among them, the highest number of areas exhibited a synergistic relationship between HQ and CS (11 cities), and these regions generally have a high integrity in terms of natural habitats and relatively low development intensity. With respect to the trade-off relationships, eight cells were involved in the more obvious trade-off relationship between FP and SC, yet no obvious agglomeration effect was formed.

3.3. Quantitative Attribution of Influencing Factors

3.3.1. Selection of Optimal Parameters

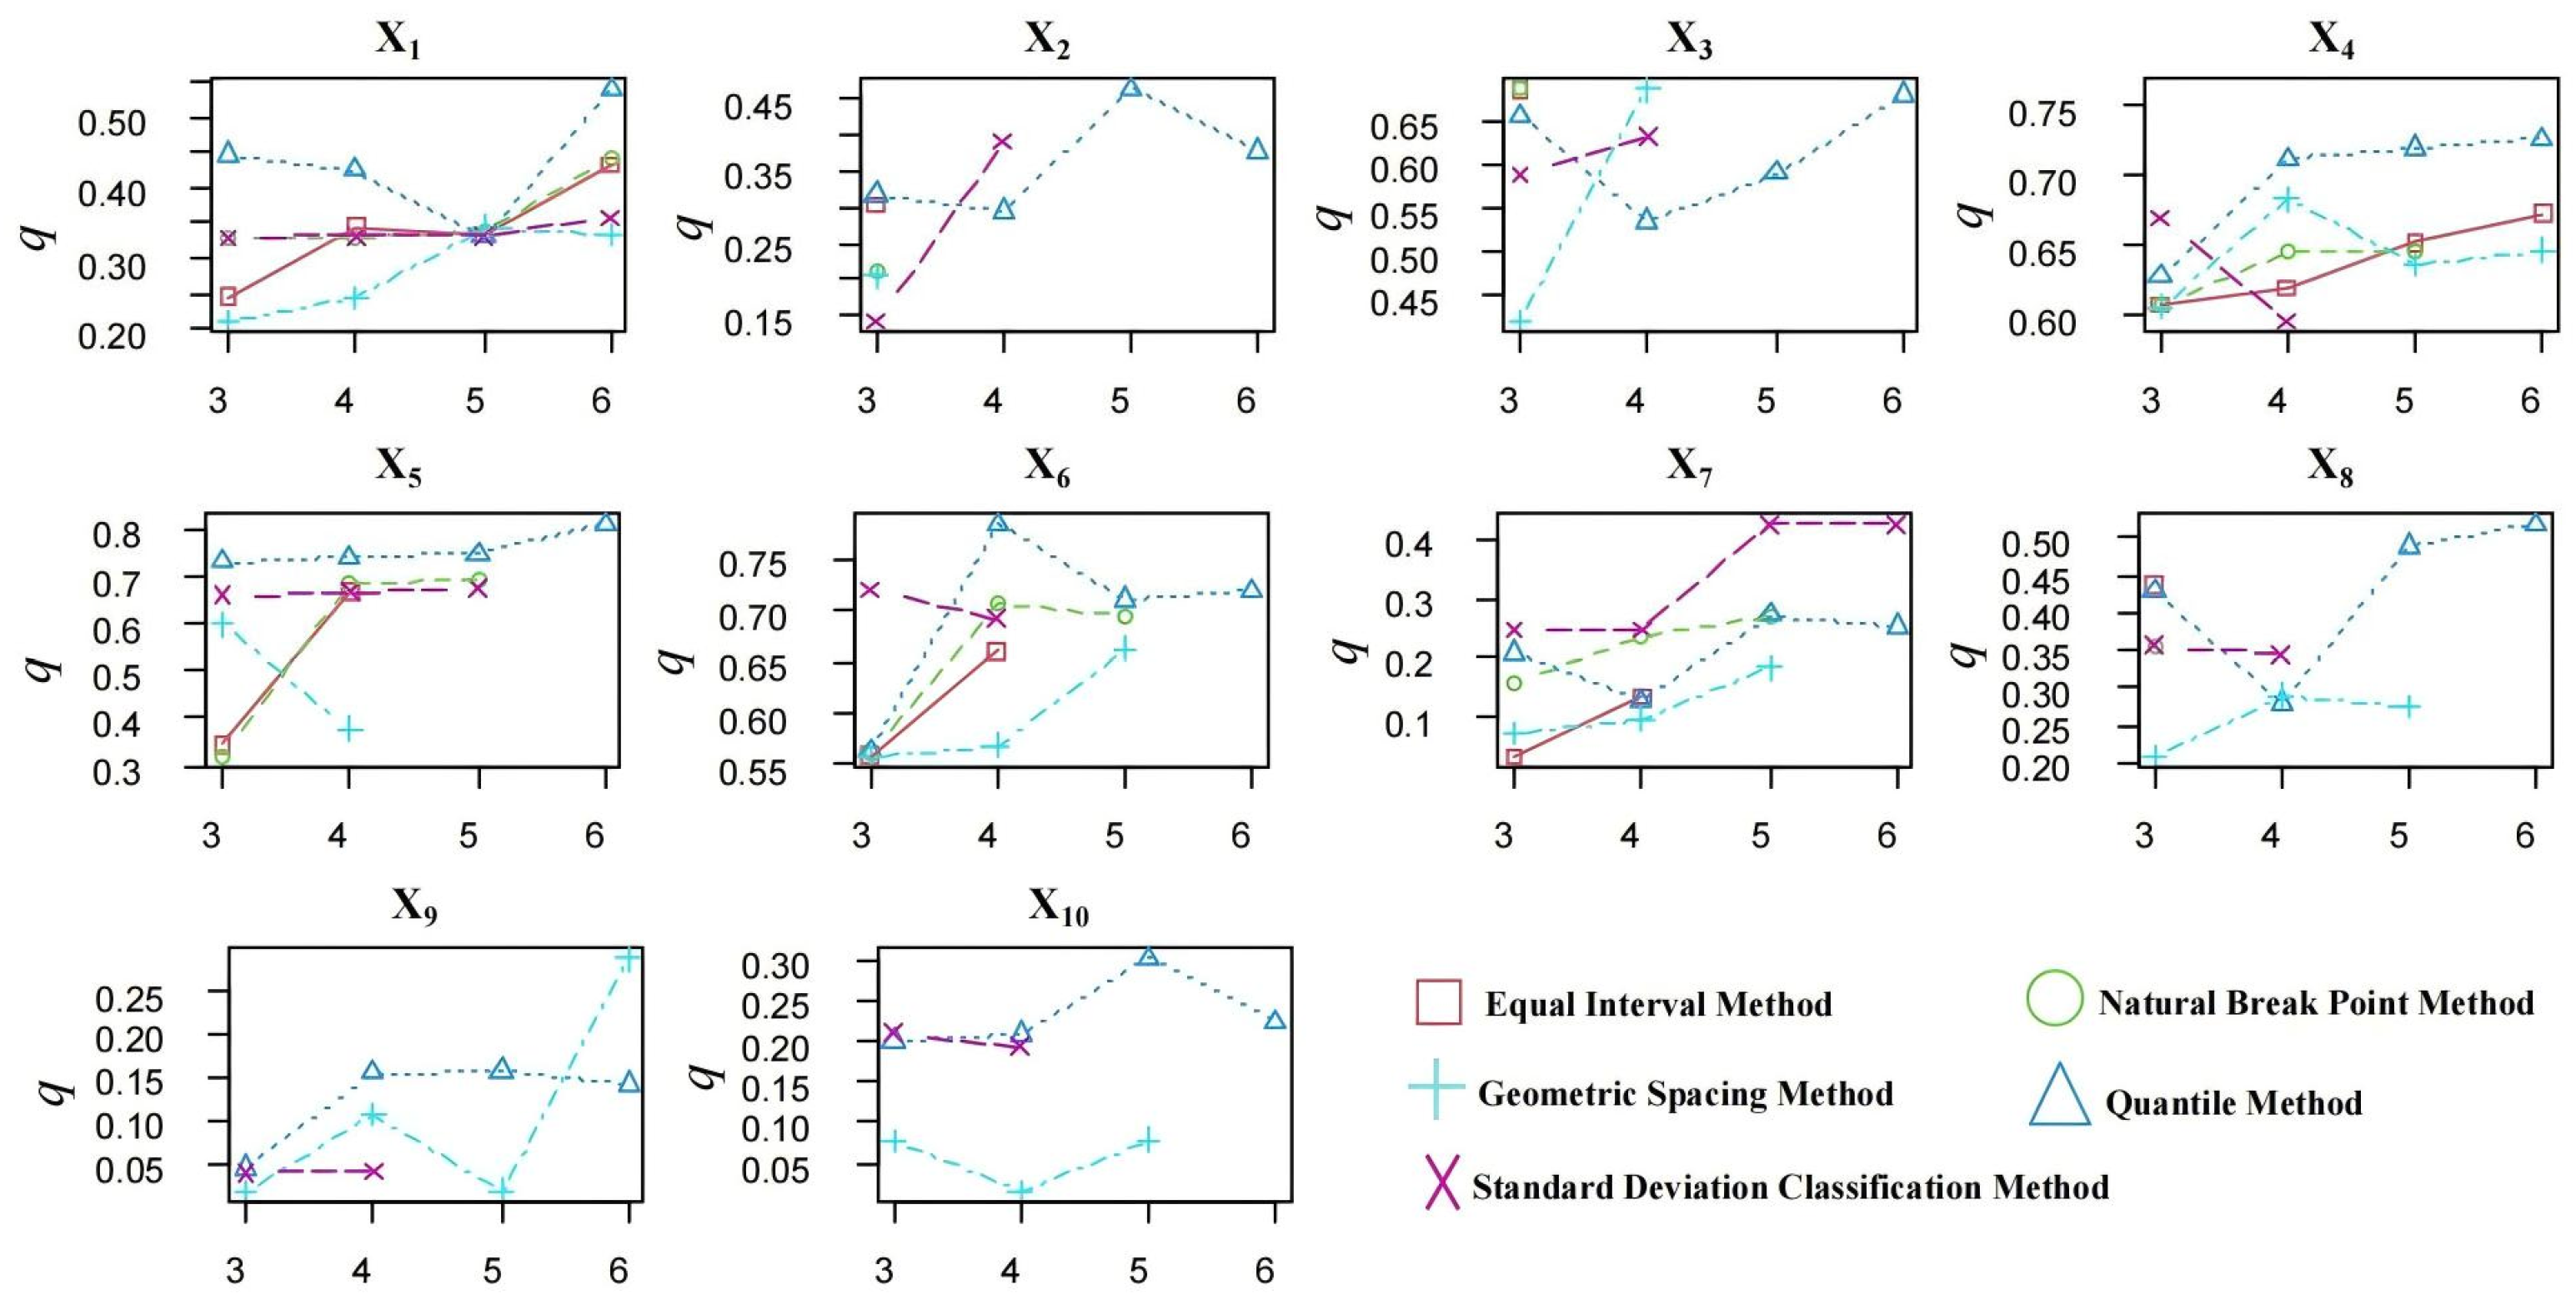
During the process of applying the geographical detector in this study, the optimal scale for the discretization of spatial data was screened out. Due to the limited length of the paper, this study takes the selection of the optimal scale for the spatially stratified heterogeneity of the impulses of HQ–FP at the county scale as an example (Figure 8). The results show that different spatial discretization methods and different combinations of the number of intervals have a major influence on the q value. The investigation found that when the quantile classification method is used for the proportion of built-up land (X1), its q value is much greater compared to that of other classification methods, and when the numerosity of intervals amounts to six, the q value attains its maximum. Therefore, in this study, it is determined that dividing the proportion of built-up land (X1) into six categories by quantiles in the geographical detector is the optimal discretization parameter. Further analysis shows that the spatial discretization methods of different driving factors have a great impact on the q value. Based on this, the discretization approach that maximizes the q value of each driving factor is chosen as the optimal parameter selection for the geographical detector in order to improve the model’s explanatory power and prediction accuracy.

3.3.2. Factor Detection Based on the OPGD Model

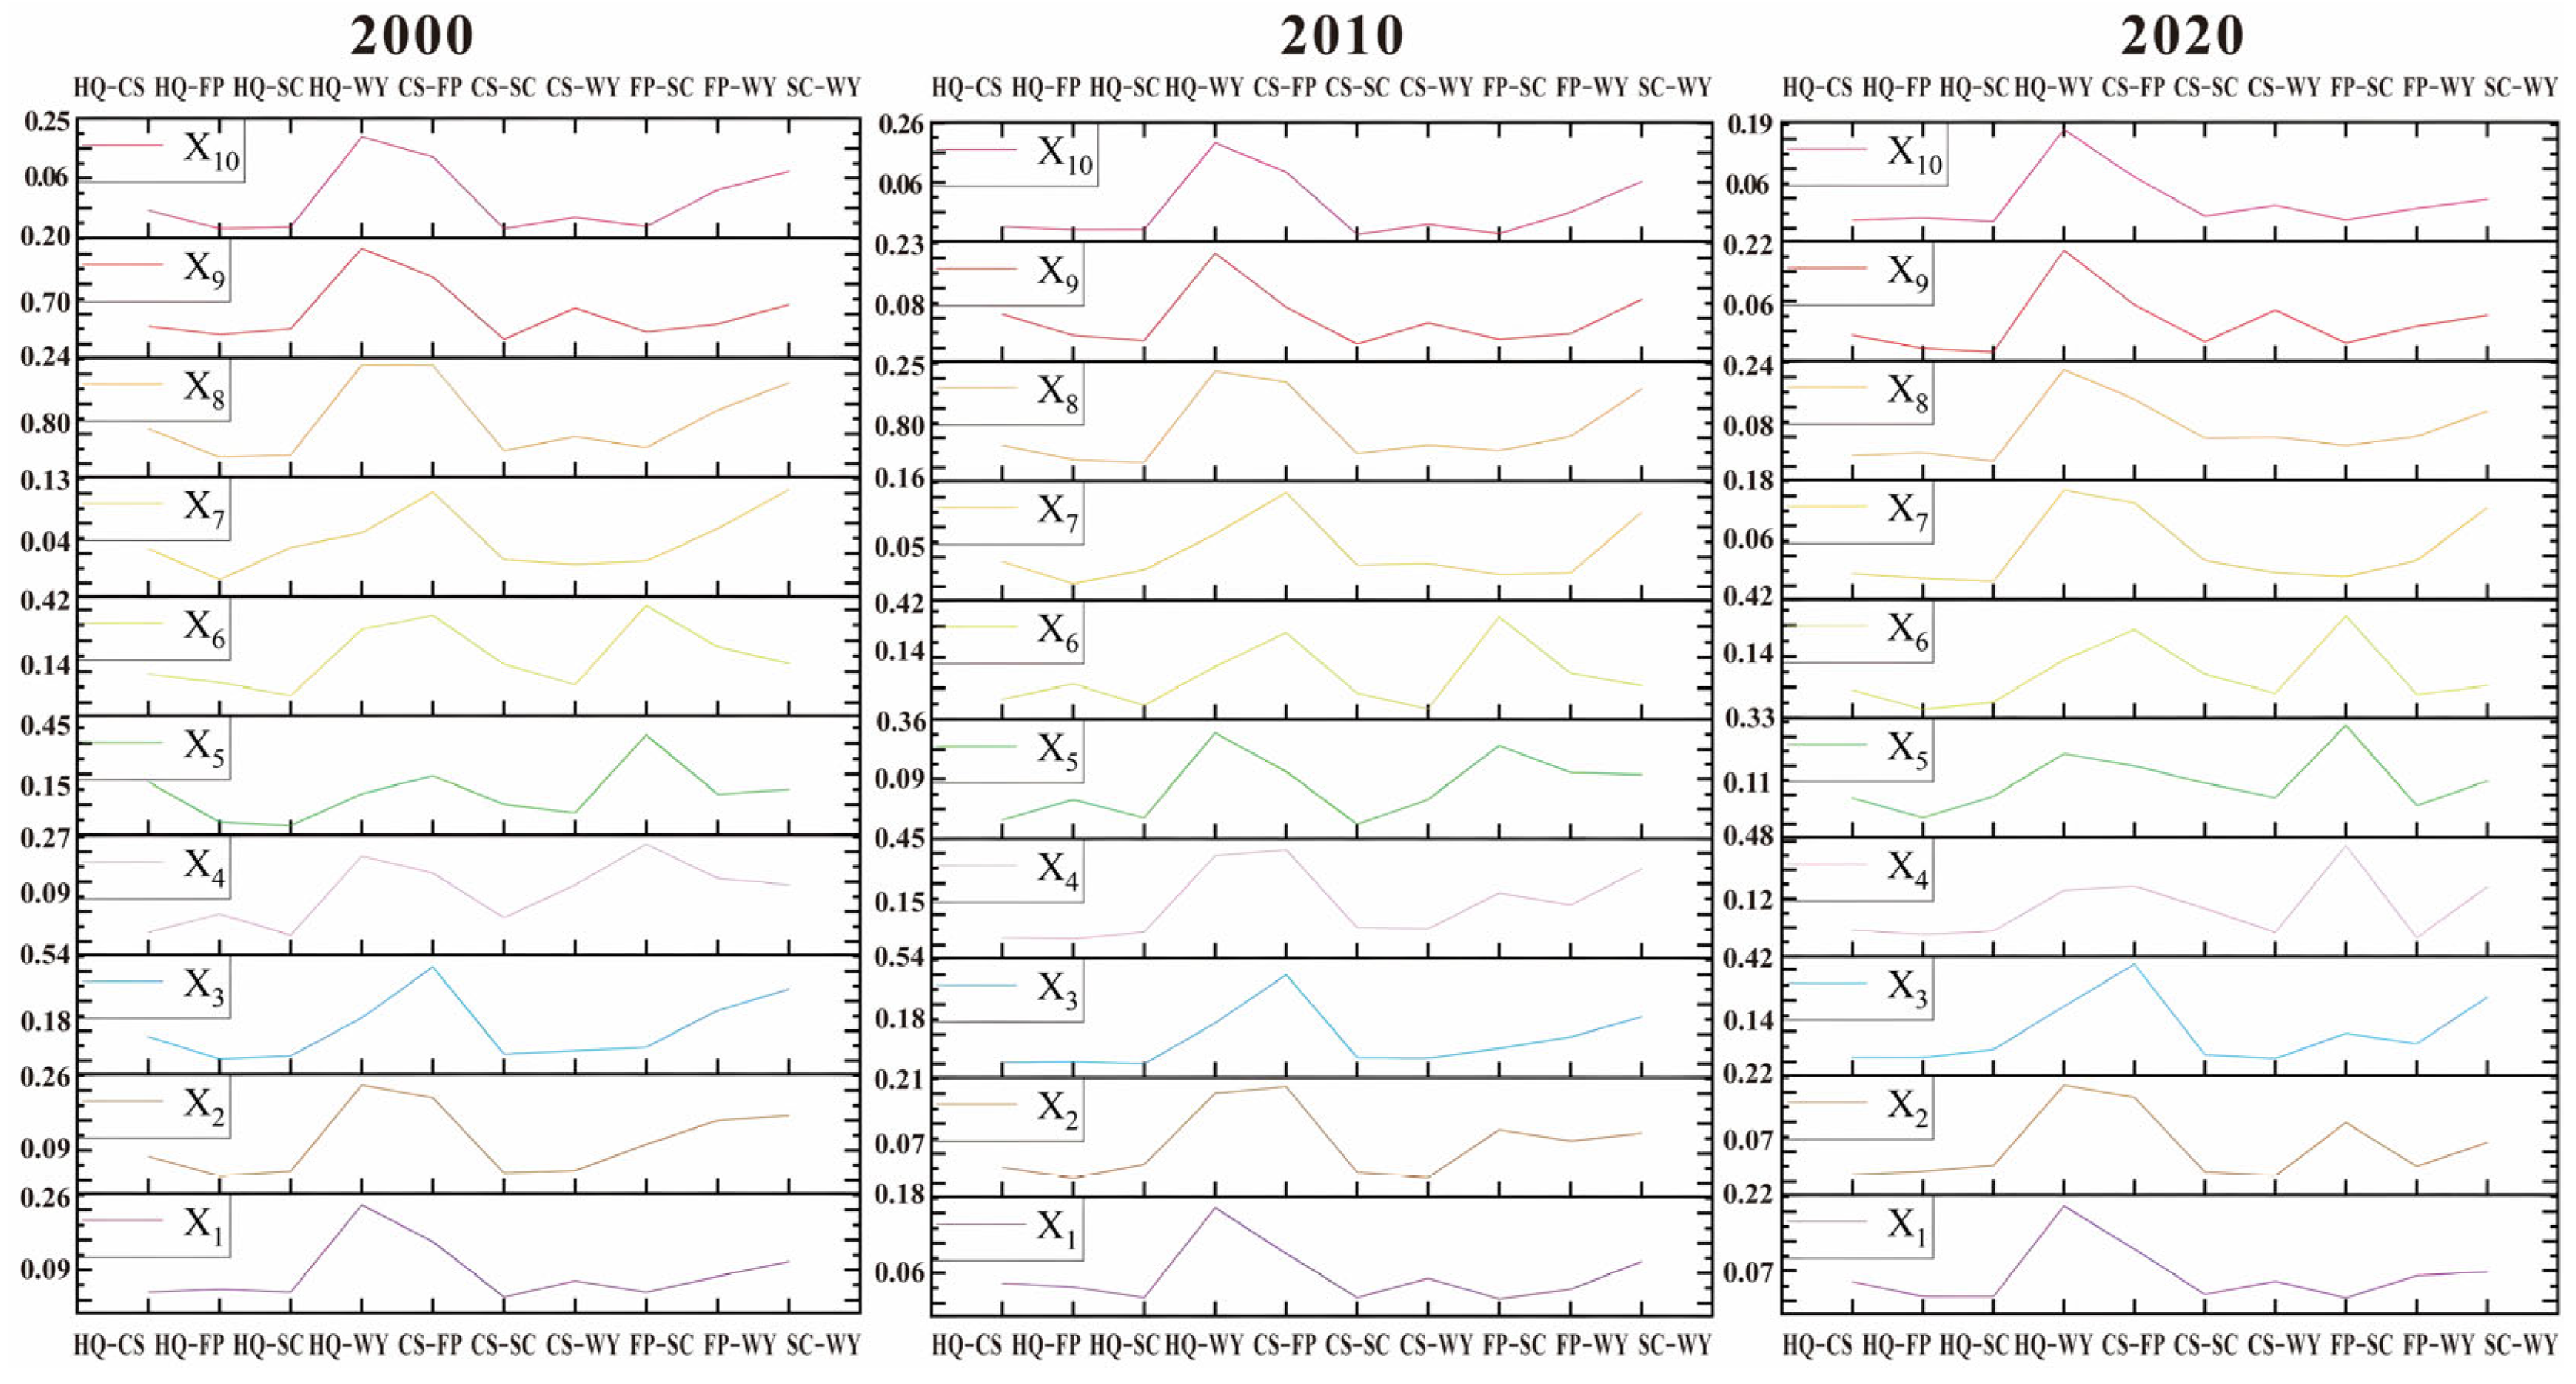
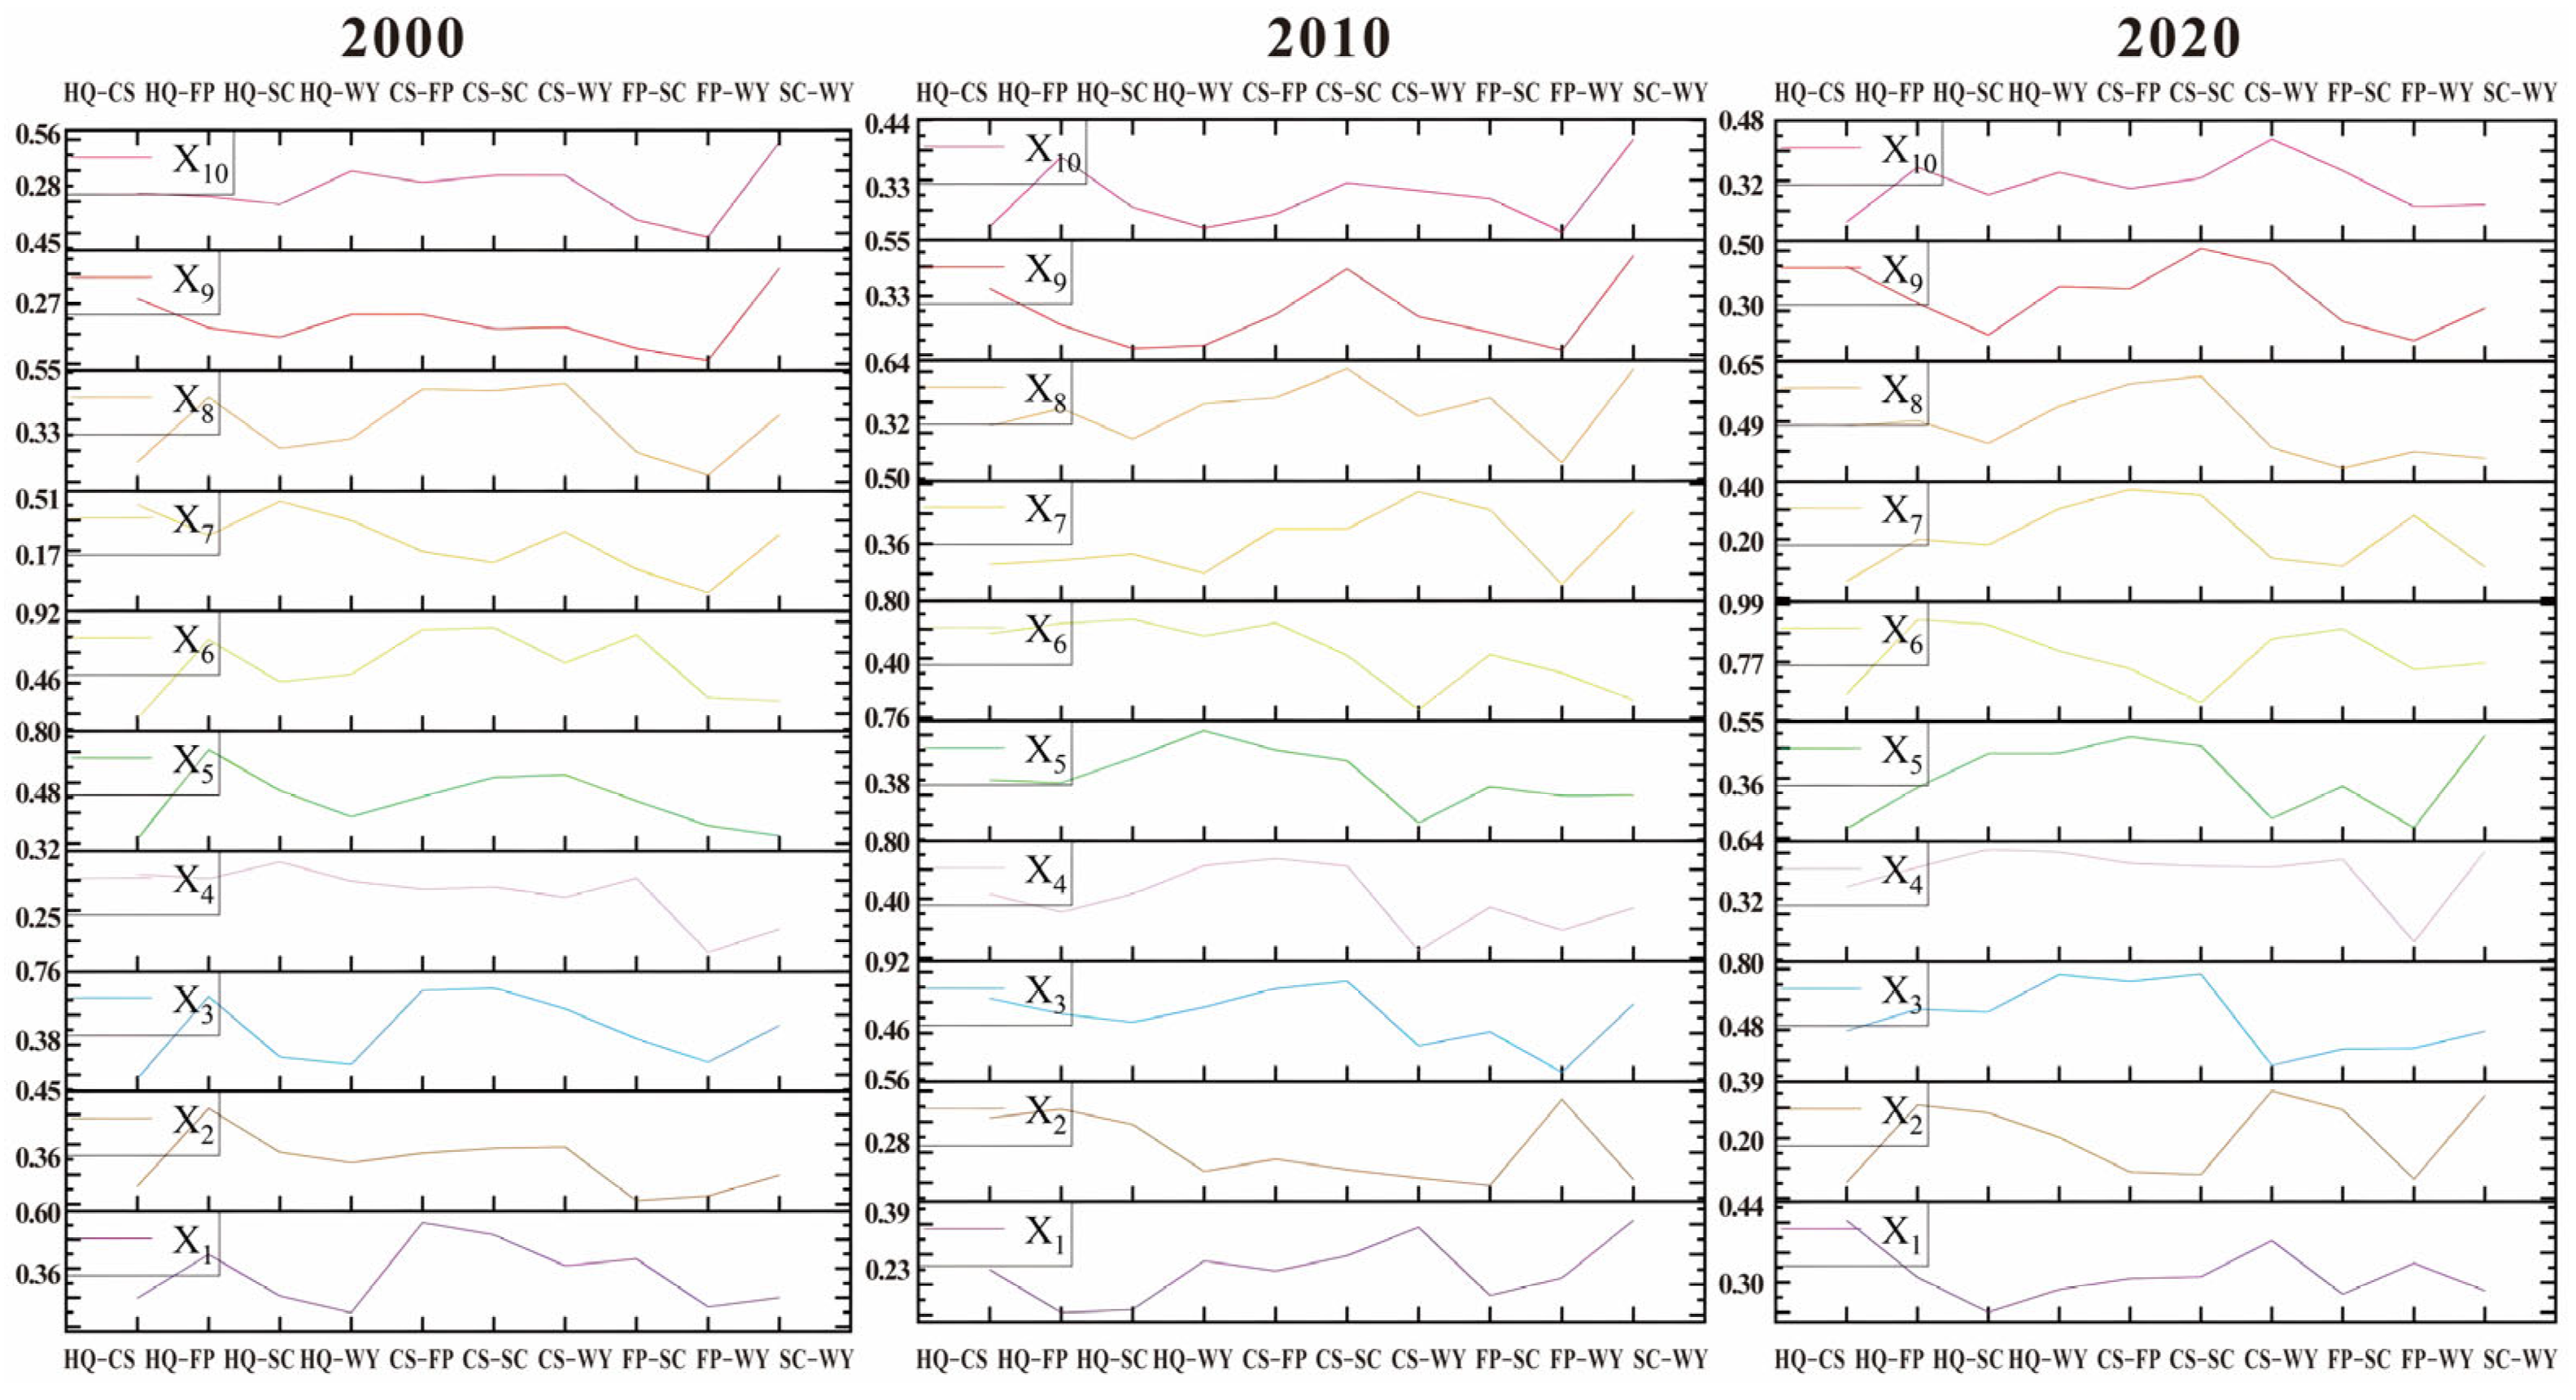
From the results of the factor detection, the influencing factors of the spatial differentiation of ESs trade-off and synergy relationships showed significant variation in the responses at different scales. At the grid level (Figure 9), during the period from 2000 to 2020, the primary determinants of the spatial differentiation of ESs trade-off and synergy relationships are presented. However, there were notable differences in the interpretative ability of every single factor, and the variation range was large, ranging from 0.20% to 56.50%. Among them, the portion of forestland has the strongest explanation capacity for CS–FP. Its q values in 2000, 2010, and 2020 were 0.565, 0.539, and 0.444, respectively. This may be because the forestland community has a complex hierarchy. The rich above-ground canopy layer and surface litter not only have a significant impact on CS, but also their interception function increases the infiltration of soil moisture, thereby reducing surface runoff. Moreover, socio-economic factors like the intensity of human activities, GDP per unit area of land, and population density all had an explanatory power of more than 1% for the geographic diversification of ESs trade-off and synergy at the grid scale. This may be because higher human activity and economic levels are often associated with more effective land management and conservation measures, which affect ESs trade-offs and synergies.
On the county-level scale (Figure 10), the influence of natural factors on ESs trade-off and synergy relationships is particularly significant. Specifically, the average annual precipitation is a key driver factor for SC–WY, and it has an explanation ability of as high as 0.893. The average annual temperature comes next, with an explanatory power of 0.782 for FP–SD. In the study area, the average annual precipitation significantly influences soil erosion through its effect on the runoff volume; it also interacts with temperature to regulate vegetation growth, thereby affecting surface cover and likely contributing to the trade-offs and synergies among the ESs. Within socio-economic determinants, the GDP per unit area of land and population density significantly impacted SC–WY, with an explanatory power of 0.431 and 0.383, respectively.
At the city scale (Figure 11), the explanatory power of every factor that influences the distinct traits of ESs trade-off and synergy relationships has increased significantly, exceeding 16%. Among them, the average annual precipitation in 2000 had the greatest significant influence on HQ–SC, and the average annual temperature in 2020 had the most powerful explanation for HQ–FP, with q values of 0.899 and 0.931, respectively. The above findings suggest that the primary factors of ESs trade-off and synergy relationships vary at different scales. These differences may be due to the impact of scale expansion and contraction on the integrity of the landscape, as well as its components and structure, thereby changing the degree of interaction among subsystems of different geographical elements within the cells. Compared with the grid and county scales, the city scale can more comprehensively cover the landscape units of the changing areas of ESs and their spatial relationships with physical environmental and socio-economic variables. Therefore, the elucidatory capacity of the driving factors is stronger. In addition, the explanatory power of individual factors of the natural environment is generally greater than that of socio-economic factors. The impact force and increase range of natural environmental factors are relatively significant, while the impact of socio-economic factors at the city scale is more prominent compared with the grid and county scales.

3.3.3. Interaction Detection Analysis Based on the OPGD Model

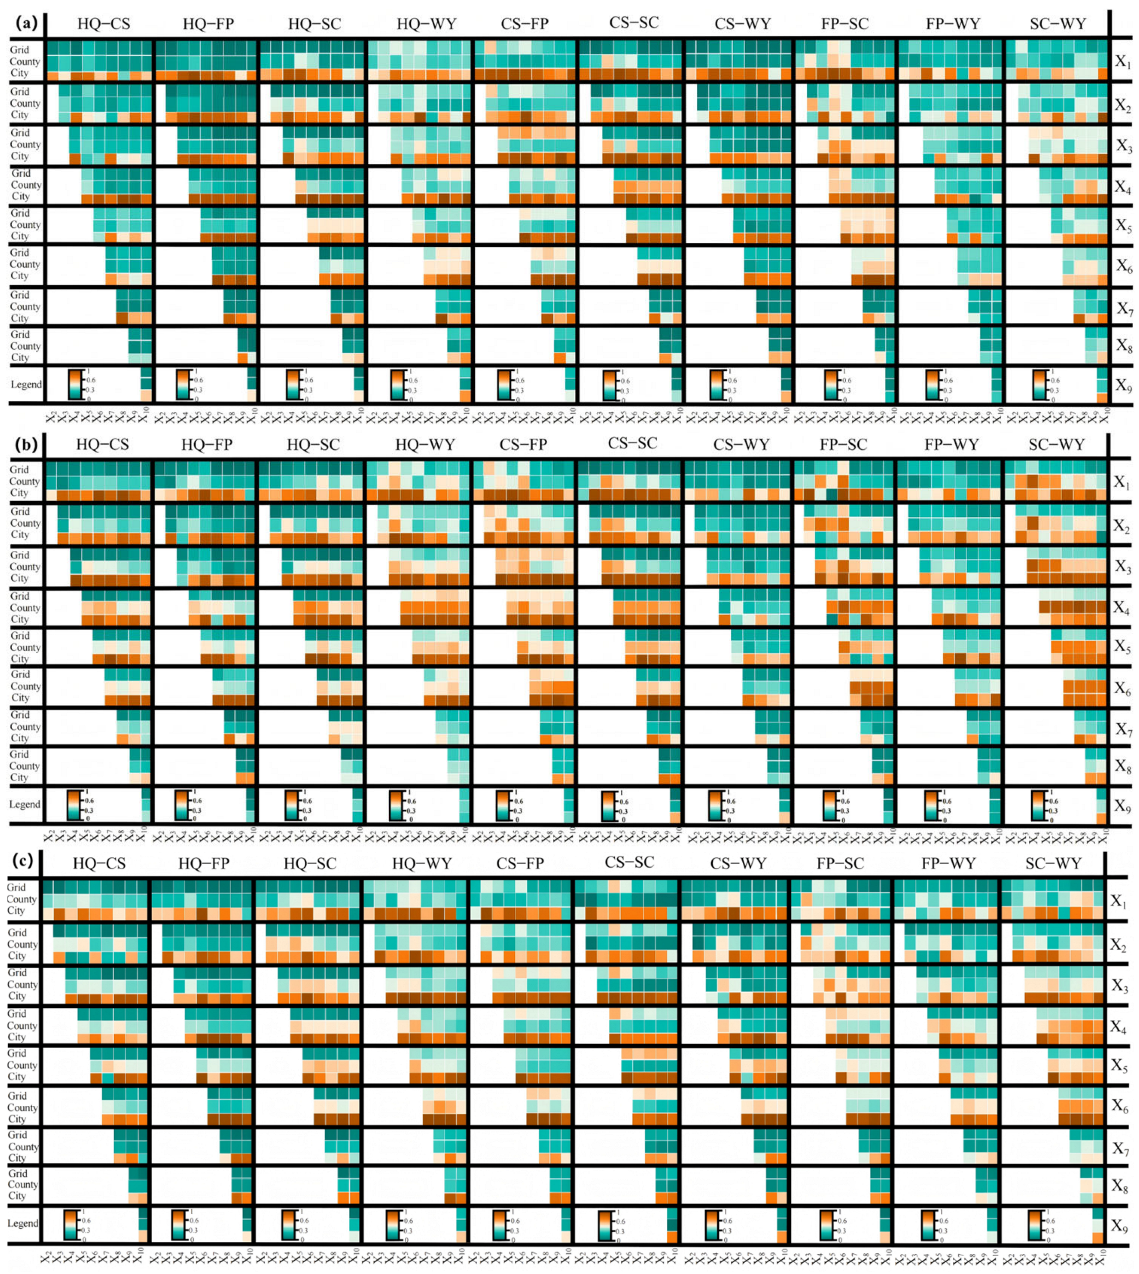
The outcomes of the interaction detection analysis (Figure 12) show that at the different scales, the principal interacting factors of the ESs trade-off and synergy relationships remain basically consistent. However, during the process of scale transformation, the interaction of each factor will show varying degrees of change trends. In addition, the driving factors are not independent of each other, but there are significant interaction effects. The interaction among any two factors exceeds the explanatory power of a single factor, mainly manifested as enhancement effects. Among them, the two-factor enhancement effect is dominant, that is, the interaction between each factor can more effectively explain the differences in the distribution of ESs trade-off and synergy relationships.
At the grid scale, the interactions among various factors were generally not significant. There were no obvious interactions among factors like average annual precipitation and the NDVI in regard to the trade-off and synergy relationships of ESs. However, the explanatory power of the proportion of forestland∩average annual temperature, sunshine hours∩average annual temperature, and sunshine hours∩average annual precipitation had relatively significant impacts on CS–FP, CS–SC, and FP–SC. Their interactive influence levels reached 0.633, 0.275, and 0.576, respectively. At the county level, the effects of the interconnections among numerous factors on ESs during the period from 2000 to 2020 increased. This phenomenon can be attributed to the enhanced functional connectivity among the components of ESs due to the enlargement of the scale. As the scale expanded to the county level, the connectivity of socio-ecological factors, such as the intensity of human activities, average annual precipitation, and sunshine hours, had a more noticeable impact on the ESs trade-off and synergy effects.
This study revealed that from 2000 to 2020, at the county scale, the interactions among the factors showed significant differences in the temporal dimension. Especially in 2010, the interactions between the average annual precipitation, average annual temperature, and other factors at the county scale were particularly significant. Among them, the average annual precipitation∩the intensity of human activities had the strongest influence on SC–WY, with q values as high as 0.948. When the research scale is expanded to the city level, the interaction among various influencing factors significantly increases, and the q values all exceed 0.11. Moreover, the interaction between natural ecological factors and social factors is particularly prominent. The interactions between the proportion of built-up land and other factors exhibited the highest explanatory force for the trade-off and synergy spatial patterns of WY with CS, FP, and SC, followed by the interactions between the NDVI and other factors. In particular, the proportion of built-up land∩sunshine hours had the highest explanatory ability for the spatial distributions of CS–FP, CS–SC, and FP–SC, with q values of 0.978, 0.969, and 0.973, respectively. At the same time, the increments in the q values of the trade-off and synergy relationships between HQ and CS, FP, SC all exceeded 0.144. Although the interaction factors of ESs trade-off and synergy relationships differed at various scales, the changing trends of the q values of these interacting factors exhibited a significant level of consistency throughout the scale transformation process. ESs are affected by natural environmental and social variables, while scale alterations modulate the intensity of the interactions among various factor types to some degree. For example, among the three different scales, the interactions of natural factors, such as the average annual precipitation, were relatively significant. However, when the scale was expanded to the city level, the interactions of social influencing factors grew significantly, and the increments in the q values all exceeded 10%. It is clear that the adjustment of the research scale profoundly influences the interaction intensity of the influencing factors among geographical elements, revealing the decisive role of scale changes in the coupling degree of geographical elements. This indicates that scale is a key variable for regulating the internal dynamics of the geographical system and the interdependence among its elements.

4. Discussion

4.1. Temporal and Spatial Variation Characteristics of ESs

The results of the quantitative calculation of the ESs show that from 2000 to 2020 FP exhibits a “north–higher and south–lower” distribution, while the other four ESs generally present a spatial pattern of being greater in the west than in the east and larger in the south than in the north. Among them, HQ, CS, and SC are all relatively high in the southern area of the YRD, and WY is comparatively high in the southeastern region. This conclusion is supported by quantitative data from existing studies [52,53], which align with our findings. Moreover, our study found that during the research period, the area of forests and grasslands in the YRD region, characterized by high carbon density and rich biodiversity, decreased, leading to a downward trend in HQ and CS [54]. The amount of SC shows a slight upward trend. The primary factors contributing to this transformation are the heightened degree of humanity in the region and the rapid urbanization trend. However, the execution of forestry ecological projects in the YRD region has effectively enhanced the vegetation coverage, which has, to some extent, improved the SC function [55]. The FP exhibits a downward tendency and is predominantly concentrated in the northern plain region. This region serves as the primary food-producing region of the YRD Urban Agglomeration, with cultivated land being the dominant land use type and being responsible for high food yields. Nevertheless, with the rapid urban expansion, FP has declined. The distribution of WY is mainly impacted by climatic and land utilization factors. After 2010, the rapid enlargement of built-up land increased the area of impervious surfaces, thus affecting the natural infiltration of water and the formation of surface runoff. As a result, the WY has demonstrated a pattern of “rising initially and then declining”. While this pattern aligns with the findings by Li et al. [53], this study further identifies that such a trend manifests as “patchy fluctuations” at the grid scale and “holistic transitions” at the city scale. The former is linked to microtopographic responses to localized vegetation destruction, while the latter is highly synchronized with the implementation stages of regional urbanization strategies across the YRD. This scale-specific differentiation refines and supplements the conclusions from comparable studies. Cities located within the northwestern region of the research area, such as Chuzhou, Ma’anshan, and Tongling, are the key areas for optimizing ecological functions. This region should continuously promote ecological environment construction to enhance the quality and benefits of forestland and facilitate refined urban management. On the one hand, the restoration of impaired ecosystems is precisely prioritized. Wetland ecological restoration projects can be carried out to reshape waterbird habitats and purify water quality, while forest tending plans can optimize vegetation communities to create diverse and stable spaces for wildlife survival and reproduction, thereby comprehensively improving ecological quality. On the other hand, allowing natural dynamics to persist through minimal intervention, such as preventing pollution and avoiding human disturbances, remains a viable strategy, as demonstrated in large-scale temporary wetlands like the Banhine wetland outflow in Mozambique, where unregulated dry–wet cycles sustain highly adaptive plant communities and complex ecological functions [56].

4.2. Scale Effects of ESs Trade-Offs and Synergies

Exploring the multiscale features of ESs trade-offs and synergies, along with the reasons behind the differential changes, is highly demanded for the hierarchical management of ESs. This study found that the correlation coefficients of ESs exhibit an obvious scale effect, which is manifested as an overall enhancement of the correlation between trade-offs and synergies as the scale expands. Thus, the structure and function of ESs in the study area exhibit significant scale dependence, namely as the scale increases, the spatial distribution of ESs becomes more homogenized, which is consistent with the findings by Lu et al. [57]. However, this study further quantifies the variation trends of the trade-offs and synergies across different scales. In particular, the OPGD model enables in-depth quantitative analysis of the driving factors under scale differences, differing from traditional studies that merely describe the relationship between driving factors and ESs through the use of a single statistical method. Leveraging the advantages of the OPGD model, this study accurately measures the explanatory power of each driving factor on ESs trade-offs and synergies, as well as the intensity of their interactive effects, across different scales. Meanwhile, this study finds that there are scale differences in the spatial agglomeration characteristics of the bivariate trade-offs and synergies of ESs, with the degree of bivariate spatial agglomeration at the city scale being significantly higher than that at the grid and county scales. This conclusion is consistent with the findings by Chen et al. [58], as both confirm that the trade-offs and synergies of ESs are dependent on the research scale. However, this study further reveals the differential manifestations of spatial agglomeration characteristics across different scales, thereby providing differentiated spatial guidance for managers at various levels and enhancing the precision and efficiency of ecological management.
The direction and strength of the relationships among ESs differ across different scales, which indicates that scale is a key variable for regulating the internal dynamics of the geographical system and the interdependence among its elements. This suggests that policymakers should tailor management policies to appropriate spatial scales when formulating ESs-related policies. Specifically, the grid scale mainly reflects the influences of direct motivating elements like local land use and vegetation cover, intuitively representing immediate changes to ecosystems in a rather small region [36]. At the grid scale, the relationships between ESs are mainly regulated by micro-scale factors, such as microtopography, vegetation community structure, and plot management methods, which directly affect service supply by altering material cycles and energy flow paths [31]. However, scaling up to county or larger scales reveals that ecosystem dynamics are shaped by interactions among socio-economic development, regional policies, and climate change, leading to divergent anthropogenic disturbance responses across different scales [59]. Meanwhile, the transformation of the land use structure, the adjustment of the industrial layout, and ecological compensation policies emerge as important influencing factors, which indirectly regulate service relationships by altering landscape patterns and resource allocation methods [60]. In general, in most ecosystems, the functional connectivity between ecosystem components tends to increase with expanding scales. Taking large basin ecosystems such as the Yellow River Basin as an example, the enhanced flow intensity of ESs between sub-basins directly confirms the increasing trend in terms of functional connectivity [61,62]. However, this pattern is not absolute. In specific ecosystems, such as the Poyang Lake grasslands, significantly affected by fragmentation caused by water level fluctuations, their functional connectivity may not show an increasing characteristic at larger scales [63]. Nevertheless, in this study, the enhanced functional connectivity of ESs at the municipal scale can capture the regional patterns of ESs and their driving mechanisms from a macro perspective. However, the correlation mode between scale and functional connectivity still needs to be analyzed specifically in combination with the inherent characteristics of specific ecosystems. Evidently, analyzing the relationships of ESs from a multiscale perspective is crucial for guiding management decision makers at different levels to formulate scientific, reasonable, and precise management strategies, supporting the optimal allocation of ecological resources, and promoting urban sustainable development. Future research should focus on constructing scale conversion models, quantitatively analyzing the laws of driving factor contribution rates that change with the scale, and developing ecosystem service synergy optimization decision support systems that consider scale effects [64].

4.3. Insights into Driving Factor Detection and Precision Management

The findings from the single-factor detection reveal that natural elements, including the average annual precipitation and sunshine duration, are the key factors contributing to regional variation in ESs trade-offs and synergies. Comparatively, socio-economic factors have a weaker explanatory power, which is in line with the results by Chen et al. [32] based on a study of the YRD Urban Agglomeration. Meanwhile, the findings on interactive factor identification reveal that interactions between natural and socio-economic factors have a bigger impact than dual socio-economic–ecological factor interactions. This aligns with prior studies, demonstrating that the spatial differentiation of ESs trade-offs and synergies arises from the combined effects of natural–ecological and socio-economic factors [65]. Furthermore, two-factor interactions contribute more than single-factor interactions, and the explanatory power improves as the size increases.
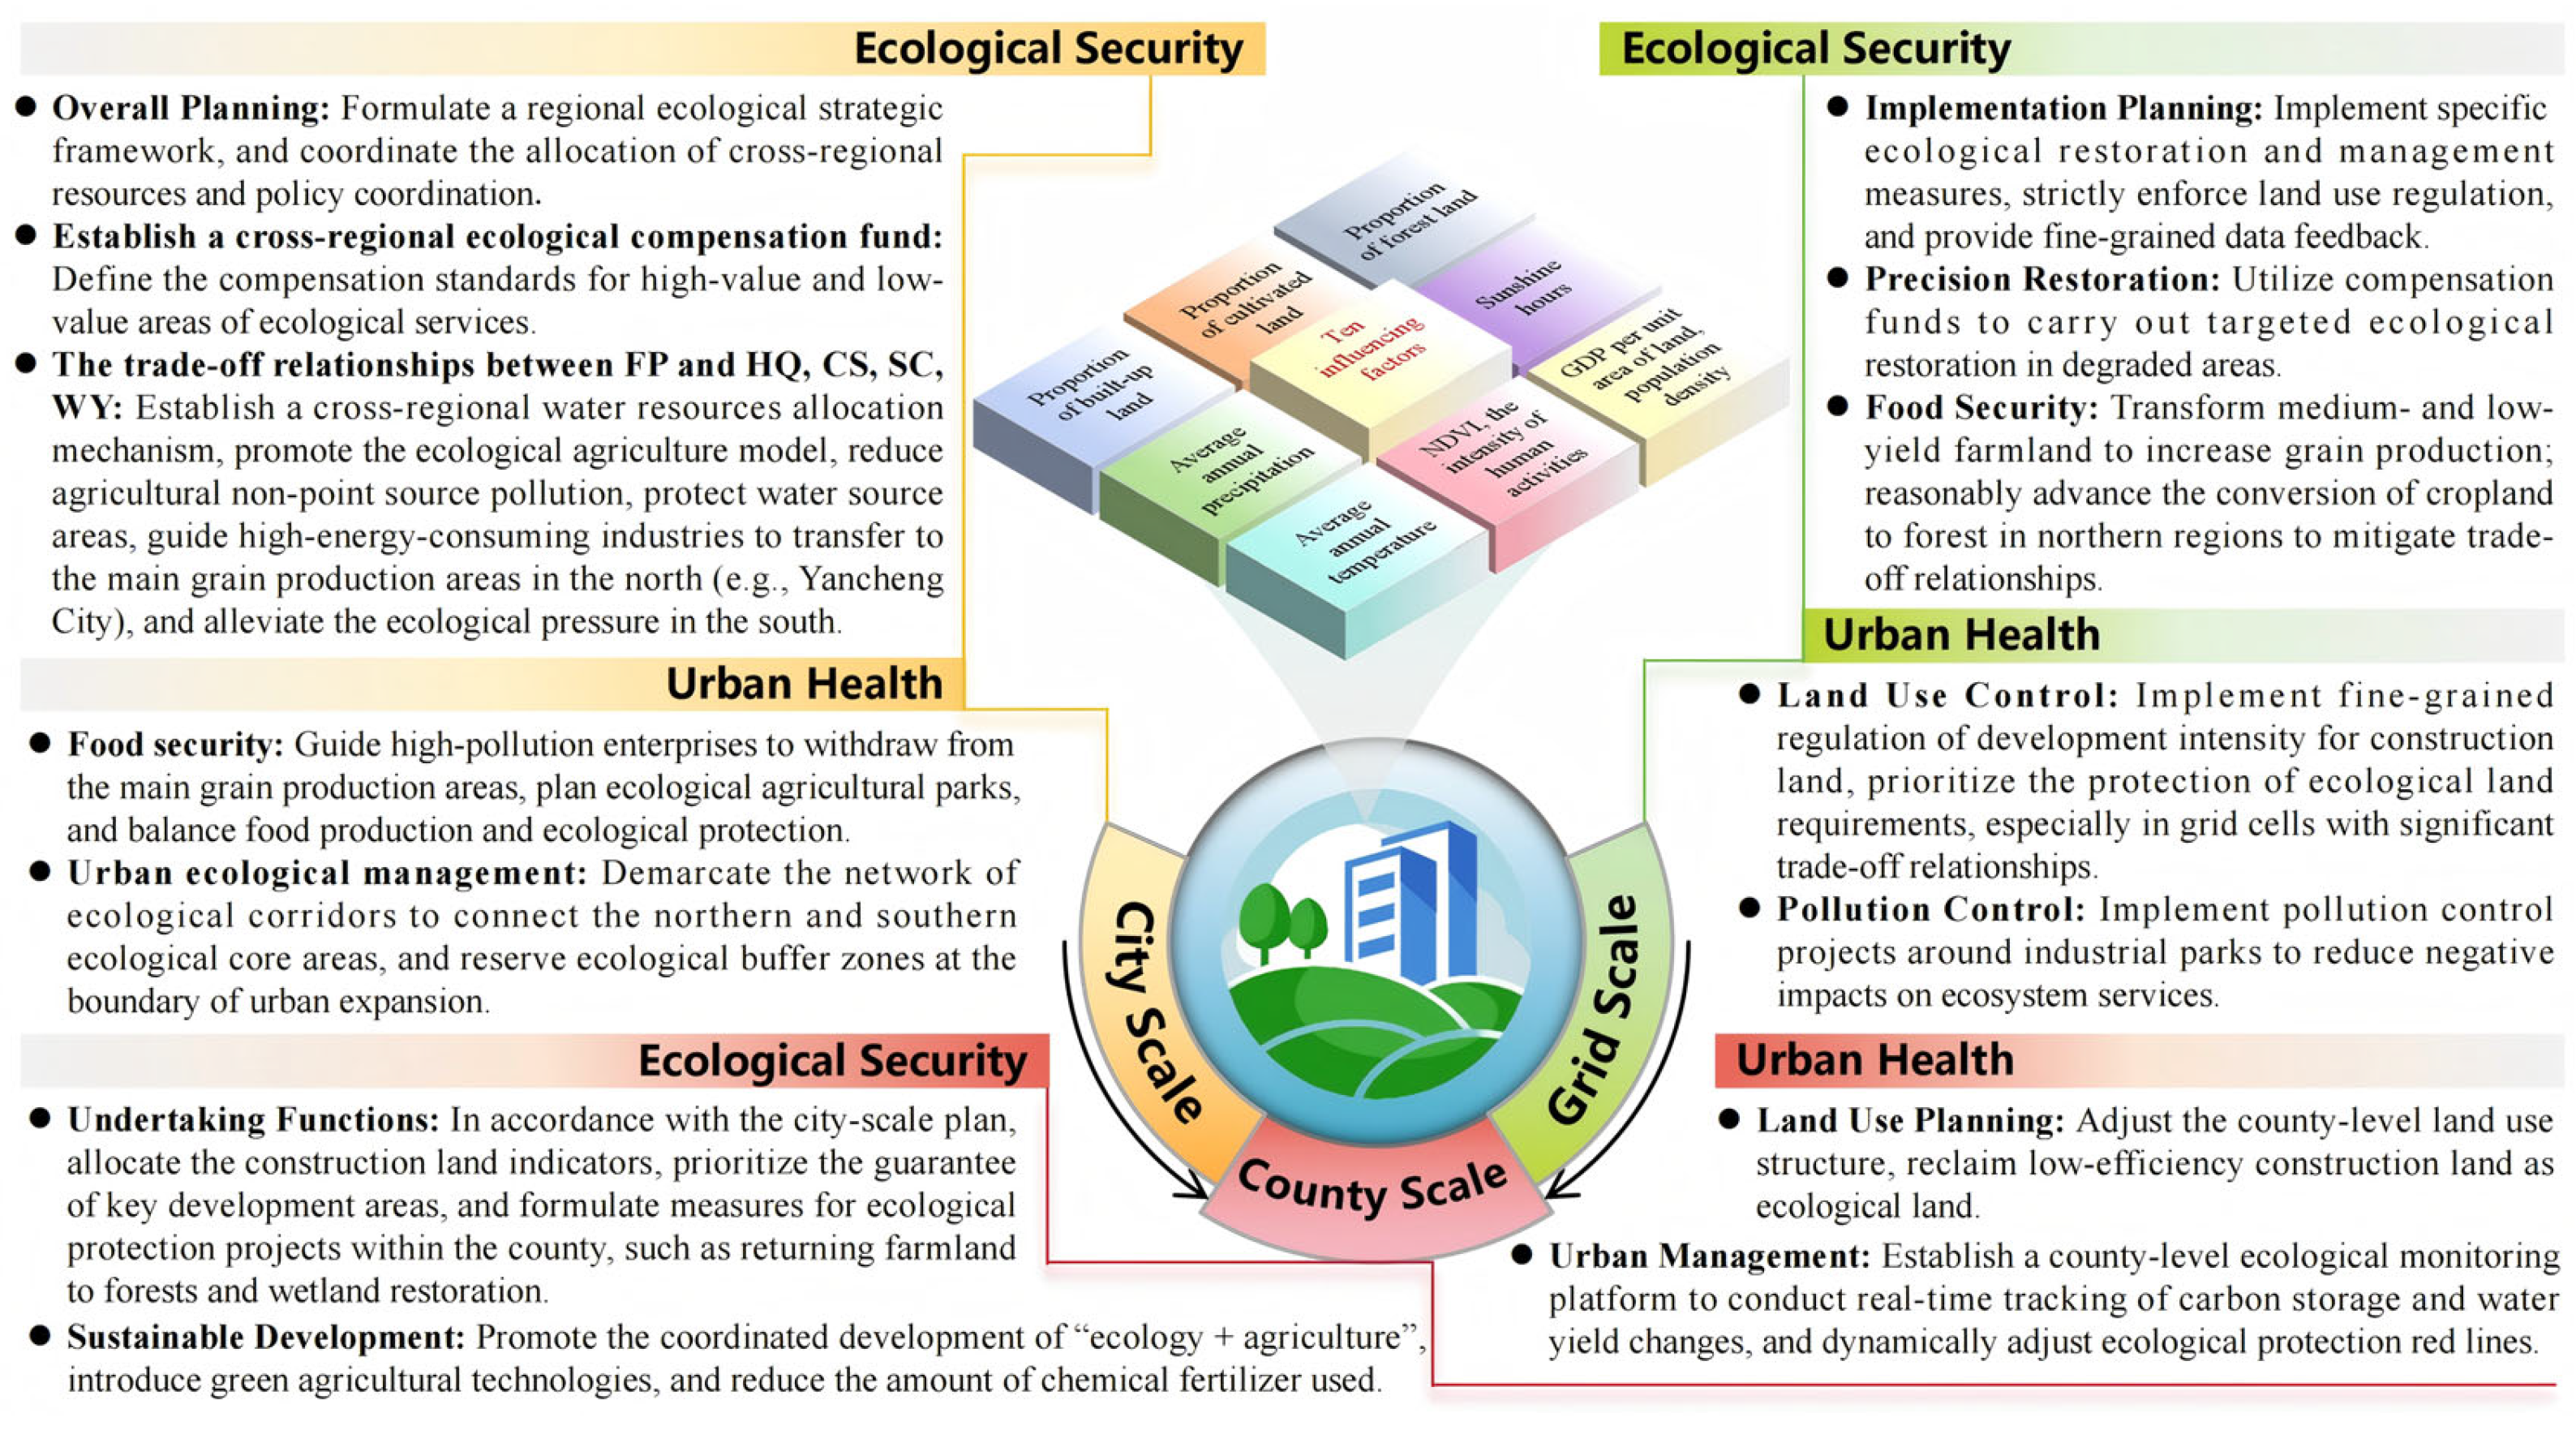
As a link between humanity and nature, ESs are predominantly influenced by two major factors: natural ecosystems and social–ecological systems [66]. Natural factors (e.g., annual average precipitation, annual average temperature, and the proportion of forestland) have, despite being subject to certain degrees of natural or anthropogenic disturbances, maintained relatively stable core driving effects on ESs within the research period (2000–2020) and the spatial scope of the YRD Urban Agglomeration as set out in this study. This relative stability makes them key driving factors influencing the trade-off and synergy relationships of ESs [67]. Cities in northern YRD (e.g., Yancheng, Yangzhou, Nantong, Chuzhou, Wuhu) serve as vital grain-producing areas, providing foundational support for food security. Given the trade-off relationship between FP and other ESs, with the food production service declining by 33.95% from 2000 to 2020, it is suggested that, on the one hand, the grain yield per unit area should be improved by transforming medium and low-yield fields and promoting modern agricultural technologies; on the other hand, in combination with the spatial distribution characteristics of LISA cluster maps, high standard farmland construction should be prioritized in the northern plain areas (e.g., Nantong City, Yancheng City). In regions with significant trade-off relationships, such as Chuzhou City and Wuhu City, pilot projects to convert farmland to forests should be promoted to balance grain production and ecological protection. In terms of HQ, the study locale experienced a 2.90% decline in HQ between 2000 and 2020, with low-value regions concentrated in eastern and northern YRD (e.g., Shanghai, Nanjing, Suzhou Industrial Park). It is suggested that a differentiated ecological compensation mechanism should be implemented in these regions; with reference to the results of the driving factor analysis at the city scale, key indicators such as the annual average precipitation and the intensity of human activities should be incorporated into the calculation of compensation standards. Regarding CS, regions with severe vegetation degradation in southern YRD (e.g., Taizhou, Shaoxing, Ningbo) require prioritized ecological restoration measures [68]. In combination with the interaction detection results of the OPGD model, strict control of urban expansion boundaries should be implemented to enhance carbon sequestration functions. Additionally, with China’s carbon peak and carbon neutrality targets, the YRD Urban Agglomeration must strictly control urban expansion boundaries, scientifically adjust agricultural layouts, maintain forest and green space areas, and construct ecological corridors to enhance ecosystem carbon sink functions [69]. The study found that areas with high soil retention amounts are mainly gathered in the forestlands and mountainous regions in the southern part of the region. Factors such as the average annual precipitation and the proportion of forestland have an important function in regard to SC. Therefore, it is essential to continuously strengthen the projects for vegetation protection and restoration, implement scientific land management, and impose strict controls on land use [70]. WY is mainly affected by natural elements, such as the average annual precipitation and sunshine hours. With the accelerating pace of urbanization, the impact of social factors has become more significant. The WY in the YRD Urban Agglomeration witnessed a downward trend. As a crucial part of ESs, the stable supply of WY is closely linked to regional eco-friendly development. First of all, it is important to improve the restoration of vegetation in mountainous and hilly places, selecting drought-resistant and soil-conserving tree species for afforestation, so as to avoid soil erosion and increase the SC and water retention ability [71]. Secondly, urban planning should promote the concept of sponge cities. By laying a high proportion of permeable ground surfaces, constructing green facilities, such as rain gardens, and strengthening wastewater reuse, WY in the region can be helped to recover. At the same time, in cities like Nantong, Hangzhou, and Xuancheng where ESs continue to improve, it is possible to moderately enhance the capacity for industrial and population aggregation, rationally plan the industrial layout, introduce green and environmentally friendly industries, and achieve a harmonious relationship between the ecology and industry [72]. Overall, within the urban evolution process, the five key ESs are interconnected, forming a tightly coupled organic system. Through the comprehensive and orderly promotion of the health benefits, regional biodiversity persistence, climate change adaptation, food supply system stabilization, efficient soil erosion control, and precise water demand adaptation can be utilized to collectively drive cities toward sustainable development that balances economic and ecological objectives. Additionally, during the process of regulating ESs, it is vital not only to jointly consider the importance of natural environmental factors and socio-economic factors, but also to exercise caution when extrapolating findings from one scale to another. Homogenized management strategies across different spatial scales should be avoided, as they may lead to inefficiencies in the hierarchical management of ESs. These perspectives and understandings offer a scientific foundation for formulating cross-scale ecosystem management strategies, enabling targeted ecological protection and urban management practices to be implemented in the study area that are tailored to local conditions (Figure 13).

4.4. Uncertainty Analysis

This study uses Spearman’s correlation analysis to clarify the intensity of the ESs trade-off and synergy relationships, and it integrates bivariate spatial autocorrelation to assess the multiscale aggregation effects and employs the OPGD model to scientifically diagnose and identify the dominant driving factors. The goal of this research is to reveal long-term interactions between multiscale ecosystems and their socio-ecological driving factors, providing a theoretical and scientific foundation for the enhancement of ESs, sustainable planning, and refined management of the YRD Urban Agglomeration in China. Yet, this study also has the following limitations: (1) In regard to the InVEST model, data such as the threat sources and sensitivity of HQ and carbon density data mainly refer to existing research findings in the YRD region, as well as those in similar regions. At the same time, the optimal geographic detector of the parameters used in this study may have faced difficulties in explaining the relationships between the variables. These limitations of the models and data may lead to certain errors in the evaluation results. (2) Since this study focuses on the grid, county-level, and city-level scales of urban agglomerations, the relationships among ESs at other scales, including the landscape and watershed scales, remain unclear and require further in-depth investigation. (3) The conclusions about the driving forces drawn from this study are based on the overall average level across three scales. Given the regional differences in natural geographical and socio-economic conditions, the dominant driving factors in different areas within the study area may vary. Therefore, the exploration of driving forces with the characteristics of spatial differentiation still urgently require in-depth investigation in subsequent research.

5. Conclusions

Systematically revealing the spatiotemporal characteristics and scale effects of ESs constitutes an important foundation for supporting sustainable ecosystem management and safeguarding human well-being. Focusing on the YRD Urban Agglomeration in China, this study employs a multiscale analytical framework to explore the trade-off and synergy relationships of five ESs and their driving mechanisms from 2000 to 2020. The methodology and conclusions hold methodological transfer value for global regions similarly affected by ecological–economic conflicts driven by rapid urbanization. By quantifying multiscale ESs associations and their drivers, this research not only provides scale-adapted analytical tools for ecological–urban conflict zones, but also offers a quantitative basis for collaborative governance under climate change, and further supports the construction of a hierarchical linkage management system. The primary conclusions in this study are as follows:
(1)
The five ESs in this research region demonstrated significant spatiotemporal heterogeneity. HQ, CS, and FP all showed fluctuating downward trends, decreasing by 2.90%, 1.71%, and 33.95%, respectively, while SC and WY presented upward trends, increasing by 6.94% and 37.34%, respectively. High-value regions for HQ, CS, and SC were concentrated in the southern and western parts of the study area; WY exhibited a spatial pattern of being higher in the south and lower in the north, whereas FP showed the opposite distribution.
(2)
At the grid scale, the trade-off relationship between FP and the other four ESs showed a relatively scattered spatial distribution, while the synergistic relationship among the remaining four ESs was concentrated in the northern and southern parts. Natural environmental factors exhibited relatively high single-factor explanatory power. Among them, the proportion of forestland had the strongest explanatory power for the CS–FP relationship, with its q values being 0.565, 0.539, and 0.444 in 2000, 2010, and 2020, respectively. Additionally, the single-factor explanatory power of all of the socio-economic factors exceeded 1%.
(3)
At the county scale, HQ and CS exhibited the most prominent synergistic relationship (r = 0.92, p < 0.01), while FP showed a weak trade-off with each of them, with the minimum correlation coefficient reaching −0.18 (p < 0.01). The synergistic relationship between CS and SC exhibited obvious spatial aggregation characteristics. The explanatory power of both single and interactive socio-ecological factors had increased, among which the average annual precipitation and average annual temperature contributed the most, with values of 0.893 and 0.782, respectively.
(4)
At the city scale, the trade-offs and synergies among the ESs showed a strengthening trend. Obvious spatial aggregation was observed in the northern and southeastern parts of the study area. The interaction of socio-ecological factors had significantly intensified, with all of the q values exceeding 0.11, indicating that formulating cross-scale ecosystem management strategies requires comprehensive consideration of both natural environmental and socio-economic factors.

Author Contributions

Y.L.: Conceptualization, Writing—Review and Editing, Methodology, Resources, Supervision. S.W.: Writing—Original Draft Preparation, Writing—Review and Editing, Software, Formal Analysis. J.L.: Formal Analysis, Software, Resources. L.Q.: Conceptualization, Methodology. All authors have read and agreed to the published version of the manuscript.

Funding

This study was jointly supported by the National Natural Science Foundation of China (42401358), the Humanities and Social Sciences Research Projects of the Ministry of Education (24XJCZH007), Guizhou Provincial Basic Research Program (Natural Science) (Qiankehe Basic Research Project-zk [2025] General Project No. 223), and the Guizhou Provincial Water Conservancy Science and Technology Program (KT202438).

Data Availability Statement

Data will be made available on request.

Conflicts of Interest

The authors declare that they have no known competing financial interests or personal relationships that could have appeared to influence the work reported in this paper.

Appendix A

Table A1. Maximum distance of influence, weight, and type of spatial recession of threat sources.
Land Use TypesMaximum Distance of Influence/kmWeightType of Spatial Recession
Cultivated land40.6linear
Construction land80.4exponential
Unutilized land60.5linear
Table A2. Sensitivity setting of each land use type in regard to habitat stress factors.
Land Use TypesHabitat
Suitability
Threat Factors
Cultivated LandConstruction LandUnutilized Land
Cultivated land0.300.80.4
Forestland10.60.40.2
Grassland10.80.60.6
Water0.70.50.40.2
Construction land0000.1
Unutilized land0.60.60.40
Table A3. Carbon density of each land type (t/hm2).
Land Use TypesC_AboveC_BelowC SoilC_Dead
Cultivated land5.442.57123.831.24
Forestland37.3615.6300.703.05
Grassland8.587.24205.220.36
Water0.930.6682.21.23
Construction land3.292.1178.200
Unutilized land0.750.9856.50

References

  1. Costanza, R.; D’arge, R.; Groot, R.; Farber, S.; Grasso, M.; Hannon, B.; Limburg, K.; Naeem, S.; O’neill, R.V.; Paruelo, J.; et al. The value of the world’s ecosystem services and natural capital. Nature 1977, 387, 253–260. [Google Scholar] [CrossRef]
  2. Zhang, Y.; Zheng, H.; Chen, X. Effects of ecological restoration projects on ecosystem services flows. Ecosyst. Serv. 2024, 70, 101681. [Google Scholar] [CrossRef]
  3. Pang, C.; Wen, Q.; Ding, J.; Wu, X.; Shi, L. Ecosystem services and their trade-offs and synergies in the upper reaches of the Yellow River basin. Acta Ecol. Sin. 2024, 44, 5003–5013. [Google Scholar] [CrossRef]
  4. Ahmed, M.T. Millennium ecosystem assessment. Environ. Sci. Pollut. Res. 2002, 9, 219–220. [Google Scholar] [CrossRef] [PubMed]
  5. Soma, K.; Dijkshoorn-Dekker, M.W.C.; Polman, N.B.P. Stakeholder contributions through transitions towards urban sustainability. Sustain. Cities Soc. 2018, 37, 438–450. [Google Scholar] [CrossRef]
  6. Wang, Z.; Yang, H.; Hu, Y.; Peng, Y.; Liu, L.; Su, S.; Wang, W.; Wu, J. Multifunctional trade-off/synergy relationship of cultivated land in Guangdong: A long time series analysis from 2010 to 2030. Sustain. Cities Soc. 2023, 154, 110700. [Google Scholar] [CrossRef]
  7. Cortinovis, C.; Geneletti, D.; Hedlund, K. Synthesizing multiple ecosystem service assessments for urban planning: A review of approaches, and recommendations. Landsc. Urban Plan 2021, 213, 104129. [Google Scholar] [CrossRef]
  8. Perrings, C.; Duraiappah, A.; Larigauderie, A.; Mooney, H. The biodiversity and ecosystem services science-policy interface. Science 2011, 331, 1139–1140. [Google Scholar] [CrossRef]
  9. Chaplin-Kramer, R.; Sharp, R.P.; Weill, C.; Bennett, E.M.; Pascual, U.; Arkema, K.K.; Brauman, K.A.; Bryant, B.P.; Guerry, A.D.; Haddad, N.M.; et al. Global modeling of nature’s contributions to people. Science 2019, 366, 255–258. [Google Scholar] [CrossRef]
  10. Li, C.; Fu, B.; Wang, S.; Stringer, L.C.; Wang, Y.; Li, Z.; Liu, Y.; Zhou, W. Drivers and impacts of changes in China’s drylands. Nat. Rev. Earth Environ. 2021, 2, 858–873. [Google Scholar] [CrossRef]
  11. Shen, J.; Li, S.; Wang, H.; Wu, S.; Liang, Z.; Zhang, Y.; Wei, F.; Li, S.; Ma, L.; Wang, Y.; et al. Understanding the spatial relationships and drivers of ecosystem service supply-demand mismatches towards spatially-targeted management of social-ecological system. J. Clean. Prod. 2023, 406, 136882. [Google Scholar] [CrossRef]
  12. Wang, X.; Peng, J.; Luo, Y.; Qiu, S.; Dong, J.; Zhang, Z.; Vercruysse, K.; Grabowski, R.C.; Grabowski, R.C.; Meersmans, J. Exploring social-ecological impacts on trade-offs and synergies among ecosystem services. Ecol. Econ. 2022, 197, 107438. [Google Scholar] [CrossRef]
  13. Li, N.; Yu, S.; Luo, G. Quantifying the spatial nonstationary response of influencing factors on ecosystem health based on the geographical weighted regression (GWR) model: An example in Inner Mongolia, China, from 1995 to 2020. Environ. Sci. Pollut. Res. 2023, 30, 73469–73484. [Google Scholar] [CrossRef] [PubMed]
  14. Chien, Y.C.; Carver, S.; Comber, A. Using geographically weighted models to explore how crowdsourced landscape perceptions relate to landscape physical characteristics. Landsc. Urban Plan. 2020, 203, 103904. [Google Scholar] [CrossRef]
  15. Förster, J.; Barkmann, J.; Fricke, R.; Hotes, S.; Kleyer, M.; Kobbe, S.; Kübler, D.; Rumbaur, C.; Siegmund-Schultze, M.; Seppelt, R.; et al. Assessing ecosystem services for informing land-use decisions: A problem-oriented approach. Ecol. Soc. 2015, 20, 31. [Google Scholar] [CrossRef]
  16. Laurans, Y.; Rankovic, A.; Billé, R.; Pirard, R.; Mermet, L. Use of ecosystem services economic valuation for decision making: Questioning a literature blindspot. J. Environ. Manag. 2013, 119, 208–219. [Google Scholar] [CrossRef]
  17. Datola, G. Implementing urban resilience in urban planning: A comprehensive framework for urban resilience evaluation. Sustain. Cities Soc. 2023, 98, 104821. [Google Scholar] [CrossRef]
  18. Khan, A.; Aslam, S.; Aurangzeb, K.; Alhussein, M.; Javaid, N. Multiscale modeling in smart cities: A survey on applications, current trends, and challenges. Sustain. Cities Soc. 2022, 78, 103517. [Google Scholar] [CrossRef]
  19. Li, J.; Hu, D.; Wang, Y.; Chu, J.; Yin, H.; Ma, M. Study of identification and simulation of ecological zoning through integration of landscape ecological risk and ecosystem service value. Sustain. Cities Soc. 2024, 107, 105442. [Google Scholar] [CrossRef]
  20. Jiang, Y.; Lin, W.; Xu, D.; Xu, D. Spatio-temporal variation of the relationship between air pollutants and land surface temperature in the Yangtze River Delta Urban Agglomeration, China. Sustain. Cities Soc. 2023, 91, 104429. [Google Scholar] [CrossRef]
  21. Qian, F.; Chi, Y.; Xu, H.; Pang, R.; Wang, S.; Li, H.; Wen, L. Study on evolution of trade-off and synergy relationship of multifunctional cultivated land from 2006 to 2020: A case of Shenyang city. China Land Sci. 2022, 36, 31–41. [Google Scholar]
  22. Qiao, J.; Deng, L.; Liu, H.; Wang, Z. Spatiotemporal heterogeneity in ecosystem service trade-offs and their drivers in the Huang-Huai-Hai Plain, China. Landsc. Ecol. 2024, 39, 42. [Google Scholar] [CrossRef]
  23. Ju, X.; Li, W.; Li, J.; He, L.; Mao, J.; Han, L. Future climate change and urban growth together affect surface runoff in a large-scale urban agglomeration. Sustain. Cities Soc. 2023, 99, 104970. [Google Scholar] [CrossRef]
  24. González-Redín, J.; Luque, S.; Poggio, L.; Smith, R.; Gimona, A. Spatial Bayesian belief networks as a planning decision tool for mapping ecosystem services trade-offs on forested landscapes. Environ. Res. 2016, 144, 15–26. [Google Scholar] [CrossRef]
  25. Yang, X.; Li, J.; Qin, K.; Li, T. Trade-offs between ecosystem services in Guanzhong-Tianshui Economic Region. Acta Geogr. Sin. 2015, 70, 1762–1773. [Google Scholar] [CrossRef]
  26. Wu, J.; Hou, Y.; Gui, Z. Coupled InVEST–MGWR modeling to analyze the impacts of changing landscape patterns on habitat quality in the Fen River basin. Sci. Rep. 2024, 14, 13084. [Google Scholar] [CrossRef] [PubMed]
  27. Martínez-López, J.; Bagstad, K.J.; Balbi, S.; Magrach, A.; Voigt, B.; Athanasiadis, I.; Pascual, M.; Willcock, S.; Villa, F. Towards globally customizable ecosystem service models. Sci. Total Environ. 2019, 650, 2325–2336. [Google Scholar] [CrossRef]
  28. Li, Y.; Cong, Y.; Zhang, J.; Wang, L.; Fei, L. Ecosystem Service Trade-Offs and Synergies in a Temperate Agricultural Region in Northeast China. Remote Sens. 2025, 17, 852. [Google Scholar] [CrossRef]
  29. Zhang, L.; Chen, G.; Zhao, J.; Lin, Y.; Yang, H.; He, J. Spatiotemporal Characteristics and Scale Effects of Ecosystem Service Bundles in the Xijiang River Basin: Implications for Territorial Spatial Planning and Sustainable Land Management. Sustainability 2025, 17, 1967. [Google Scholar] [CrossRef]
  30. Min, J.; Liu, X.; Xiao, Y.; Li, H.; Luo, X.; Wang, R.; Xing, L.; Wang, C.; Zhao, H. Spatial and temporal distribution of ecosystem services and trade-offs in the Yangtze River Delta. Geol. Bull. China 2025, 44, 136–149. [Google Scholar] [CrossRef]
  31. Fang, L.; Cai, J.; Liu, Y.; Yang, H.; Li, C. Dynamic Evolution of Ecosystem Service Value in Yangtze River Delta and Analysis on the Driving Factors. J. Ecol. Rural Environ. 2022, 38, 556–565. [Google Scholar] [CrossRef]
  32. Chen, Y.; Liu, W.; Zhao, F.; Zhao, Q.; Xu, Z.; Kumi, M.A. Multi-Scale Analysis of Ecosystem Service Trade-Offs/Synergies in the Yangtze River Delta. Land 2024, 13, 1462. [Google Scholar] [CrossRef]
  33. Rodríguez, J.P.; Beard, T.D.; Bennett, E.M.; Cumming, G.S.; Cork, S.J.; Agard, J.; Dobson, A.P.; Peterson, G.D. Trade-offs across space, time, and ecosystem services. Ecol. Soc. 2006, 11, 28. [Google Scholar] [CrossRef]
  34. Wang, K.; Gao, J.; Liu, C.; Zhang, Y.; Wang, C. Understanding the effects of socio-ecological factors on trade-offs and synergies among ecosystem services to support urban sustainable management: A case study of Beijing, China. Sustain. Cities Soc. 2024, 100, 105024. [Google Scholar] [CrossRef]
  35. Xia, C.; Guo, H.; Zhao, J.; Xue, F.; Wang, C.; Zhou, J.; Sun, T.; Li, S.; Zhang, N. Dynamic responses of ecosystem services to urbanization at multi-spatial scales in the Beijing-Tianjin-Hebei region. Acta Ecol. Sin. 2023, 43, 2756–2769. [Google Scholar] [CrossRef]
  36. Zeng, S.; Jiang, C.; Bai, Y.; Wang, H.; Liu, E.; Gu, L.; Chen, S.; Zhang, J. Understanding scale effects and differentiation mechanisms of ecosystem services tradeoffs and synergies relationship: A case study of the Lishui River Basin, China. Ecol. Indic. 2024, 167, 112648. [Google Scholar] [CrossRef]
  37. Qin, H.; Li, S.; Sun, J.; Cheng, J. Scale-dependent responses of ecosystem service trade-offs to urbanization in Erhai Lake Basin, China. Environ. Sci. Pollut. Res. 2023, 30, 120663–120682. [Google Scholar] [CrossRef]
  38. Qian, J.; Shang, Q.; Fu, D.; Zhang, J. A method based on elitist genetic algorithm for calibrating the thermo-physical surface indicators: Its principles, validation and application to bioswales. Ecol. Indic. 2023, 153, 110461. [Google Scholar] [CrossRef]
  39. Yu, X.; Zhang, Z.; Lu, L.; Sun, H. Measurement of Low-Carbon Development Efficiency and Spatial-Temporal Pattern Evolution of the Yangtze River Delta Urban Agglomerations. Res. Environ. Sci. 2024, 37, 1470–1482. [Google Scholar] [CrossRef]
  40. Lin, M.; Lin, T.; Sun, C.; Jones, L.; Sui, J.; Zhao, Y.; Liu, J.; Xing, L.; Ye, H.; Zhang, G.; et al. Using the Eco-Erosion Index to assess regional ecological stress due to urbanization—A case study in the Yangtze River Delta urban agglomeration. Ecol. Indic. 2020, 115, 106482. [Google Scholar] [CrossRef]
  41. Xu, Z.S.; Xu, Y.M. Study on the Spatio-Temporal Evolution of the Yangtze River Delta Urban Agglomeration by Integrating Dmsp/Ols and Npp/Viirs Nighttime Light Data. J. Geo-Inf. Sci. 2021, 23, 837–849. [Google Scholar] [CrossRef]
  42. Chen, S.; Jin, Y.; Huang, Y. Spatio-temporal variations of habitat quality and its underlying mechanism in the central region of Yangtze River Delta. Chin. J. Ecol. 2023, 42, 1175–1185. [Google Scholar] [CrossRef]
  43. Wang, Y.; Yu, H.; Lu, L. Spatio-temporal pattern and functional zoning of ecosystem services in the Yangtze River Delta region based on spatially constrained K-means. Acta Ecol. Sin. 2024, 44, 7087–7104. [Google Scholar] [CrossRef]
  44. Wartenberg, D. Multivariate Spatial Correlation: A Method for Exploratory Geographical Analysis. Geogr. Anal. 2010, 17, 263–283. [Google Scholar] [CrossRef]
  45. Brunsdon, C.; Fotheringham, A.S.; Charlton, M.E. Geographically Weighted Regression: A method for exploring spatial nonstation-arity. Geogr. Anal. 1996, 28, 281–298. [Google Scholar] [CrossRef]
  46. Xia, H.; Yuan, S.F.; Prishchepov, A.V. Spatial-temporal heterogeneity of ecosystem service interactions and their social-ecological drivers: Implications for spatial planning and management. Resour. Conserv. Recycl. 2023, 189, 106767. [Google Scholar] [CrossRef]
  47. Wang, J.; Wu, W.; Yang, M.; Gao, Y.; Shao, J.; Yang, W.; Ma, G.; Yu, F.; Yao, N.; Jiang, H. Exploring the complex trade-offs and synergies of global ecosystem services. Environ. Sci. Ecotechnol. 2024, 21, 100391. [Google Scholar] [CrossRef]
  48. Li, C.; Li, G.; Li, J.; Jiao, Y. Trade-offs and synergies of ecosystem services in Yangtze River delta urban agglomeration: A spatiotemporally heterogeneous analysis approach. China Environ. Sci. 2024, 44, 992–1006. [Google Scholar] [CrossRef]
  49. Sheng, S.; Liu, Y.; Liu, Y.; Lu, Y. Spatial Pattern and Driving Forces of the Synergy and Trade-off of Ecosystem Services in the Coastal Areas of Shandong. Res. Soil Water Conserv. 2023, 30, 384–392. [Google Scholar] [CrossRef]
  50. Wang, D.; Zhang, L.; Yu, H.; Zhong, Q.; Zhang, G.; Chen, X.; Zhang, Q. Attributing spatially stratified heterogeneity in biodiversity of urban–rural interlaced zones based on the OPGD model. Ecol. Inform. 2024, 83, 102789. [Google Scholar] [CrossRef]
  51. Wu, S.; An, Y.; Ma, L. Study on spatio-temporal variation in the value of ecosystem services for karst watershed under the background of urbanization. Resour. Environ. Yangtze Basin 2015, 24, 1591–1598. [Google Scholar]
  52. Huang, Y.; Cao, Y.; Wu, J. Evaluating the spatiotemporal dynamics of ecosystem service supply-demand risk from the perspective of service flow to support regional ecosystem management: A case study of Yangtze River delta urban agglomeration. J. Clean. Prod. 2024, 460, 142598. [Google Scholar] [CrossRef]
  53. Li, C.; Zhao, J.; Zhuang, Z.; Gu, S. Spatiotemporal dynamics and influencing factors of ecosystem service trade-offs in the Yangtze River Delta urban agglomeration. Acta Ecol. Sin. 2022, 42, 5708–5720. [Google Scholar] [CrossRef]
  54. Zhao, H.; Fan, J.; Gu, B.; Chen, Y. Carbon sink response of terrestrial vegetation ecosystems in the Yangtze River Delta and its driving mechanism. J. Geogr. Sci. 2024, 34, 112–130. [Google Scholar] [CrossRef]
  55. Hao, J.; Wang, J.; Zhang, S.; Wu, F.; Jiang, H.; Wu, W.; Chen, L.; Zhang, L.; Liu, N. Several Strategic Issues for the Construction of Ecological Civilization in Yangtze River Economic Belt. Strateg. Study CAE 2022, 24, 141–147. [Google Scholar] [CrossRef]
  56. Zaplata, M.K.; Nhabanga, A.; Stalmans, M.; Volpers, T.; Burkart, M.; Sperfeld, E. Grasses cope with high-contrast ecosystem conditions in the large outflow of the Banhine wetlands, Mozambique. Afr. J. Ecol. 2021, 59, 190–203. [Google Scholar] [CrossRef]
  57. Lu, Y.; Wang, J.; Jiang, X. Spatial and temporal changes of ecosystem service value and its influencing mechanism in the Yangtze River Delta urban agglomeration. Sci. Rep. 2024, 14, 19476. [Google Scholar] [CrossRef]
  58. Chen, Y.; Lu, Y.; Meng, R.; Li, S.; Zheng, L.; Song, M. Multi-scale matching and simulating flows of ecosystem service supply and demand in the Wuhan metropolitan area, China. J. Clean. Prod. 2024, 476, 143648. [Google Scholar] [CrossRef]
  59. Han, L.; Liu, Y.; Liu, J.; Kang, H.; Liu, Z.; Tuo, F.; Gan, S.; Ren, Y.; Yi, C.; Hu, G. Microtopography Affects the Diversity and Stability of Vegetation Communities by Regulating Soil Moisture. Water 2025, 17, 1012. [Google Scholar] [CrossRef]
  60. Cheng, Y.; Qiao, W.; He, T.; Liu, Q. Response of ecosystem services value to land use function change at the village scale in Gaochun District. Nanjing. Sci. Geogr. Sin. 2024, 44, 340–350. [Google Scholar] [CrossRef]
  61. Ji, Q.; Feng, X.; Sun, S.; Zhang, Z.; Li, S.; Fu, B. Cross-scale coupling of ecosystem service flows and socio-ecological interactions in the Yellow River Basin. J. Environ. Manag. 2024, 367, 122071. [Google Scholar] [CrossRef] [PubMed]
  62. Luo, Y.; Cadotte, M.W.; Jie, L.; Burgess, K.S. Multitrophic diversity and biotic associations influence subalpine forest ecosystem multifunctionality. Ecology 2022, 103, 3745. [Google Scholar] [CrossRef] [PubMed]
  63. Zhang, C.; Chen, W.; Huang, F. Effects of grassland connectivity on plant diversity in Poyang Lake. Acta Geogr. Sin. 2024, 1, 259–278. [Google Scholar] [CrossRef]
  64. Zhang, R.; Hu, C.; Sun, Y. Decoding the Characteristics of Ecosystem Services and the Scale Effect in the Middle Reaches of the Yangtze River Urban Agglomeration: Insights for Planning and Management. Sustainability 2024, 16, 7952. [Google Scholar] [CrossRef]
  65. Zhang, L.; Lei, J.; Chen, Z.; Zhou, P.; Wu, T.; Chen, X.; Li, Y.; Pan, X. Spatiotemporal differentiation and trade-offs and synergies of ecosystem services in tropical island basins: A case study of three major basins of Hainan Island. J. Clean. Prod. 2025, 490, 144798. [Google Scholar] [CrossRef]
  66. Zhao, W.; Liu, Y.; Feng, Q.; Wang, Y.; Yang, S. Ecosystem services for coupled human and environment systems. Prog. Geogr. 2018, 37, 139–151. [Google Scholar] [CrossRef]
  67. Waring, R.C. Forests: Fresh Perspectives from Ecosystem Analysis. For. Sci. 1983, 29, 678. [Google Scholar]
  68. Huang, Y.; Wu, J. Spatial and temporal driving mechanisms of ecosystem service trade-off/synergy in national key urban agglomerations: A case study of the Yangtze River Delta urban agglomeration in China. Ecol. Indic. 2023, 154, 110800. [Google Scholar] [CrossRef]
  69. Zhang, Z.; Zhang, Y.; Hu, Y.; Gao, J. Spatial and temporal distribution of supply-demand of ecosystem services in the demonstration zone of green and integrated ecological development of the Yangtze River Delta from the perspective of water-energy-food nexus. Acta Ecol. Sin. 2023, 43, 430–9445. [Google Scholar] [CrossRef]
  70. Pei, Y.; Luo, M.; Zhao, Y.; Han, L.; Yang, S.; Zhang, L. Trade-offs and synergies among ecosystem services at multiple scales: A case study of Yan’an City. Chin. J. Ecol. 2022, 41, 1351–1360. [Google Scholar] [CrossRef]
  71. Chu, W.; Yang, X.; Xiao, R.; Jin, W. Research on the Strategies for Safe Management of Drinking Water in the Yangtze River Delta. Eng. Sci. 2022, 24, 19–25. [Google Scholar] [CrossRef]
  72. Xia, J.; Chen, J. Practice and countermeasures of the great protection of the Yangtze River. South–North Water Transf. Water Sci. Technol. 2022, 20, 625–630. [Google Scholar] [CrossRef]
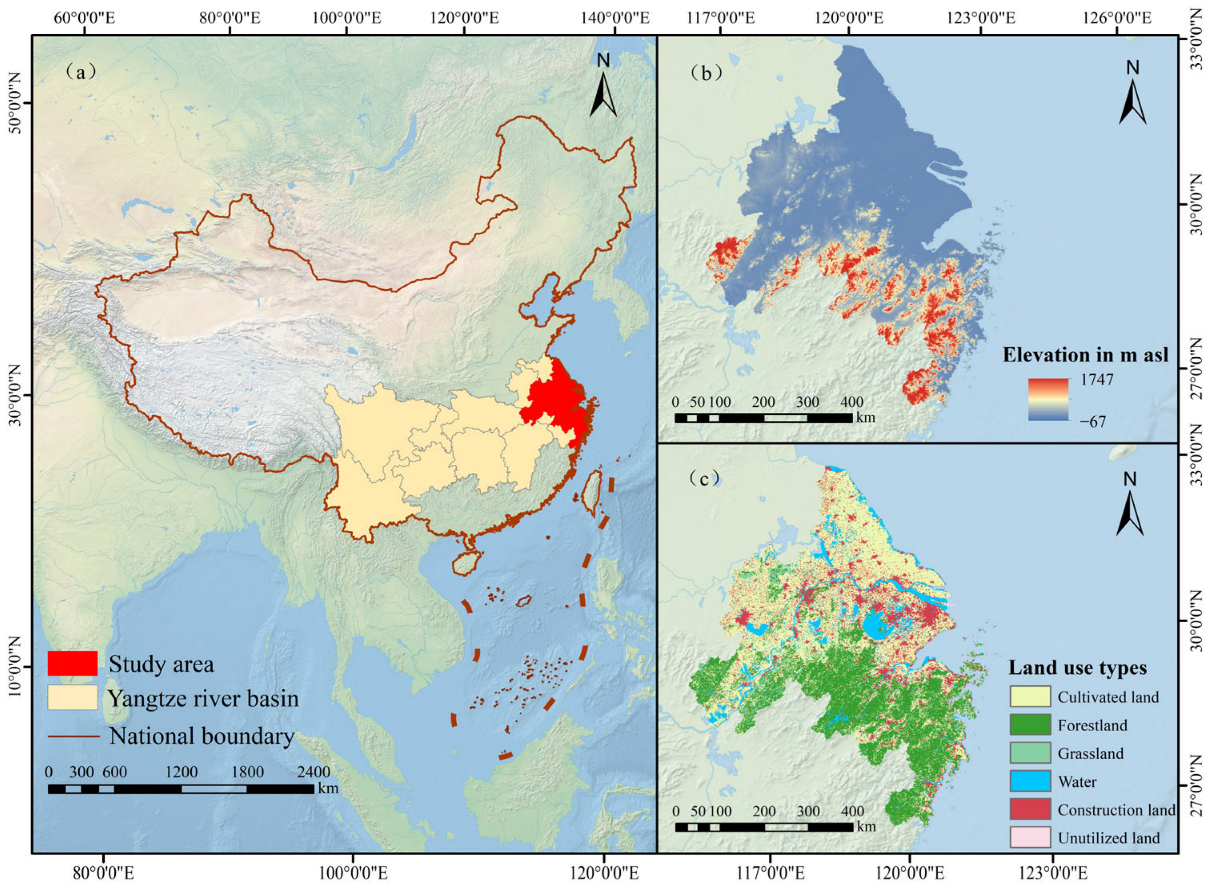
Figure 1. Overview of the study area: (a) location of the study area in China; (b) elevation map; (c) land use type map.
Land 14 01748 g001
Figure 2. Technical roadmap. Note: * means p < 0.05; ** means p < 0.01.
Land 14 01748 g002
Figure 3. Spatial distribution of ESs in the YRD Urban Agglomeration.
Land 14 01748 g003
Figure 4. Spearman’s correlation coefficients of ESs. Note: * means p < 0.05; ** means p < 0.01.
Land 14 01748 g004
Figure 5. LISA clustering diagram of ESs at the grid scale in 2020.
Land 14 01748 g005
Figure 6. LISA clustering diagram of ESs at the county scale in 2020.
Land 14 01748 g006
Figure 7. LISA clustering diagram of ESs at the city scale in 2020.
Land 14 01748 g007
Figure 8. Discretization results of the factors. Note: Taking HQ–FP at the county scale in 2000 as an example; X1–X10 refer to the proportion of built-up land, the proportion of cultivated land, the proportion of forestland, the average annual precipitation, sunshine hours, the average annual temperature, the NDVI, the intensity of human activities, GDP per unit area of land, and the population density, respectively.
Land 14 01748 g008
Figure 9. Results of single-factor detection at grid scale.
Land 14 01748 g009
Figure 10. Results of single-factor detection at county scale.
Land 14 01748 g010
Figure 11. Results of single-factor detection at city scale.
Land 14 01748 g011
Figure 12. Detection results for interaction factors of multiscale ESs trade-off and synergy relationships from 2000 to 2020: (ac) 2000, 2010, and 2020, respectively. Note: X1–X10 refers to the proportion of built-up land, the proportion of cultivated land, the proportion of forestland, the average annual precipitation, sunshine hours, the average annual temperature, the NDVI, the intensity of human activities, GDP per unit area of land, and the population density, respectively.
Land 14 01748 g012
Figure 13. Multiscale management and planning strategies for the YRD Urban Agglomeration.
Land 14 01748 g013
Table 1. Research data and their sources.
Data TypesFormatResolutionData Source
Land use dataRaster1 kmhttps://www.resdc.cn/, accessed on 1 June 2025
Administrative boundariesShapefile-https://www.resdc.cn/, accessed on 1 August 2024
NDVIRaster1 kmhttps://www.resdc.cn/, accessed on 1 June 2025
TemperatureRaster1 kmhttps://data.cma.cn/, accessed on 1 June 2025
PrecipitationRaster1 kmhttps://data.cma.cn/, accessed on 1 June 2025
Sunshine durationRaster1 kmhttps://data.cma.cn/, accessed on 1 June 2025
Soil dataRaster1 kmHWSD, https://www.fao.org/, accessed on 1 August 2024
DEMRaster30 mhttp://www.gscloud.cn/, accessed on 1 August 2024
GDPRaster1 kmhttps://www.resdc.cn/, accessed on 15 October 2024
Population densityRaster1 kmhttps://hub.worldpop.org/, accessed on 1 June 2025
Intensity of human activitiesRaster1 kmhttps://sedac.ciesin.columbia.edu, accessed on 1 June 2025
Table 2. Calculation methods for ESs.
ESsCalculation MethodsMain Parameters and Processing
Habitat quality (HQ)InVEST Model Habitat Quality ModuleAccording to Chen et al. [42], cultivated land, construction land, and unutilized land are all potential hazard sources (Table A1 and Table A2). The equation is as follows:
Q x j = H j × ( 1 D x j z D x j z + k z )
where Qxj represents the habitat quality of grid cell x for land usage type j; Hj is the habitat suitability of land usage type j; Dxj is the habitat stress degree of grid cell x; and z is a scaling parameter.
Carbon storage
(CS)
InVEST Model Carbon ModuleThe module calculates carbon storage by multiplying the average carbon density of four carbon pools for different land use types by their respective areas (Table A3) [43]. Here is the formula:
Ctotal = Cabov e + Cbelow + Csoil + Cdead
where Ctotal, Cabove, Cbelow, Csoil, and Cdead represent ecosystem carbon storage, aboveground biomass carbon storage, belowground biomass carbon storage, soil carbon storage, and dead organic matter carbon storage, respectively.
Food production
(FP)
NDVI CalculationFood production in each grid cell is calculated using the NDVI for various land use categories. The formula is as follows:
F P i = N D V I i N D V I t × G t
where FPi indicates the food production of grid cell i; NDVIi denotes the NDVI value of grid cell i; Gt signifies the total NDVI of land use type t; and Gt indicates the total food production of land use type t.
Soil
conservation
(SC)
InVEST Model Soil Conservation ModuleThe soil conservation capacity can be assessed by using the Universal Soil Loss Equation (USLE). The following are the formulas:
R K L S = R × K × S
U S L E = R × K × L S × P × C
S D R = R K L S × U S L E
where RKLS refers to potential soil erosion; USLE denotes actual soil erosion; SDR signifies soil conservation quantity; R represents rainfall erosivity parameters; K denotes soil erodibility parameters; LS represents the slope length and steepness parameters; P represents conservation practice parameters; and C denotes the vegetation and management parameters.
Water yield
(WY)
InVEST Model Water Yield ModuleThis module obtains the water yield by calculating the difference between the precipitation and the actual evapotranspiration of each grid cell. The formula is as follows:
Y x = [ 1 ( 1 A x P x ) ] × P x
where Yx, Ax, and Px represent the annual water yield, annual actual evapotranspiration, and annual precipitation of grid cell x, respectively.
Table 3. Amounts and changes to ESs in the YRD Urban Agglomeration.
YearHabitat QualityCarbon Storage (t)Food Production (t)Soil Conservation (t)Water Yield (t)
20000.5044.729 × 1094.231 × 1075.522 × 10101.505 × 108
20100.4964.687 × 1093.089 × 1078.908 × 10101.992 × 108
20200.4894.648 × 1092.795 × 1075.905 × 10102.067 × 108
Magnitude of Change (%)
2000–2010−1.58−0.89−26.9961.3232.36
2010–2020−1.35−0.83−9.52−33.713.78
2000–2020−2.90−1.71−33.956.9437.34
Disclaimer/Publisher’s Note: The statements, opinions and data contained in all publications are solely those of the individual author(s) and contributor(s) and not of MDPI and/or the editor(s). MDPI and/or the editor(s) disclaim responsibility for any injury to people or property resulting from any ideas, methods, instructions or products referred to in the content.