Article

Uncovering Urban Green Space (Dis)Investment Through Cultural Ecosystem Service Potential: A Case Study of Szeged, Hungary

Department of Human Geography, University of Szeged, Egyetem u. 2, H-6722 Szeged, Hungary
*
Authors to whom correspondence should be addressed.
Land 2025, 14(9), 1701; https://doi.org/10.3390/land14091701
Submission received: 15 July 2025 / Revised: 12 August 2025 / Accepted: 14 August 2025 / Published: 22 August 2025
(This article belongs to the Special Issue Monitoring the Effect of Urban Green Space on Environmental Quality)

Abstract

Climate change and rapid urbanization are underscoring the need for urban green spaces that offer a wide range of ecosystem services, which can provide irreplaceable benefits to residents. Cultural services are the ones that affect visitation patterns the most and may be the easiest to influence via investment or neglect. The main aim of this research was to evaluate and cluster the urban green spaces of a Hungarian city, Szeged, based on their potential cultural ecosystem service values, to uncover their investment and management differences. Regarding the methodology, we performed three field observations on each of the selected 19 sample areas, assessing their potential cultural ecosystem services and visitation patterns. The green spaces were evaluated on a total of 36 criteria, which we analysed using principal component analysis, factor analysis, and cluster analysis. As a result of our research, we defined four main urban green space clusters: city centre squares, suburban playgrounds, central parks, and informal green spaces. The differences in their potential cultural ecosystem service values significantly affect their usage patterns and are indicators of investment inequities. Understanding and tackling the uncovered environmental injustices requires a complex assessment of the local urban fabric along with its usage and management practices.

1. Introduction

Urban ecosystems and green spaces are under rapidly growing pressure, as more than 55% of the world’s population already lives in cities, a number which is set to rise to 69% by 2050 [1]. Moreover, as a result of the intensifying climate change and urban heat island effect, the interconnectedness of nature and humans is as essential and vital as ever [2]. The resilience and environmental quality of urban areas heavily depend on the condition and size of the urban green spaces (UGSs) they contain [3,4]. The quality of the green spaces has a strong effect on the living conditions of the people using them [5]. According to the concept of One Health, adequate green space management is essential for the well-being of both humans and animals living around them [6,7]. Creating and maintaining biodiverse ecosystems are vital but increasingly challenging in the face of global warming and urban sprawl [8,9]. Hence, ecosystem services (ESs) and their monitoring are gaining attention globally [10,11,12]. Although initially, in the early 2000s, researchers’ emphasis was more on the ecological aspects of UGSs, current studies focus more on the social aspects, such as environmental justice or cultural ecosystem services (CESs) [13]. Cultural and recreational ESs are especially unique regarding their evaluation since, although they heavily influence the usage rates of green spaces, they are also intangible and difficult to assess [12,14]. Quantitatively monitoring their potential values and comparing these to their actual effects can provide important urban planning insights [15,16]. Additionally, it can give a unique perspective on land value changes and investment patterns [17], helping to uncover environmental injustices [18]. The latter is crucial as the competition for urban land is increasing and pressuring local authorities to act in favour of private investors rather than creating urban green spaces for the general public [3,19]. Moreover, in the past decades, many municipalities have taken a neoliberal turn and become facilitators of capitalist investment processes that often create or preserve spatial inequalities [20]. This frequently worldwide phenomenon has been coined as “neoliberal urbanism”. It is often linked to the privatisation and elimination of public goods or the restructuring of municipal budget allocations [21]. However, this has led to the neglect and disinvestment of specific neighbourhoods and districts [22,23]. To identify these areas, a possible method could be the evaluation of local urban green spaces, as these public spaces often serve as representatives of the local urban fabric and the investment practices of the neighbourhood [24].
The sample area of this study was Szeged, a post-socialist Hungarian city that has 157,930 inhabitants [25] but is mainly characterized by its more than 20,000 university students [26]. The city’s total area is 281 km2, out of which 50.8 km2 is administratively considered as the inner, inhabitable urban area [25], having a total of 7.68 km2 covered by urban green spaces. Located in the southern part of the country, the city is among the most climate change-affected settlements in the country [26,27]. The warming climate and the increasing urban heat island effect cause heat stress for local humans, animals, and plants [28,29]. To combat these, the municipality has implemented multiple green infrastructure development projects, mainly through European Union funding. However, the local authorities are also struggling to keep up with the increasing costs and workload required to manage the city’s green spaces. This often leads to them needing to choose among the green areas, regarding which one of them is going to be well-maintained, and which ones are going to be neglected, hence creating inequalities [30]. Based on these local issues and the above-mentioned global trends, the main goal of this research was to evaluate and cluster the green spaces of the city based on their potential cultural ecosystem service values, to uncover the investment and management differences and injustices. This aim was transformed into two research questions. First, how do the potential cultural ecosystem service values and visitation patterns of urban green spaces indicate their investment and management practices? On the other hand, if there are any significant discrepancies between the green spaces and their clusters, why do these form, and how can these processes be mitigated or tackled?
In the remainder of this study, we first showcase (based on the existing literature) why cultural ecosystem services can be a potential indicator of investment. Thereafter, we describe our methodology, followed by the results section, which is divided into three sub-sections: a description of the identified clusters, an analysis of the environmental injustices, and a case study of a bottom-up management practice. Finally, we discuss these and conclude with our key findings.

2. Potential Cultural Ecosystem Services as Investment Indicators

Uneven developments and inequalities are essential parts of today’s economic system, capitalism [31]. Hence, despite the numerous urban development initiatives highlighting the need for territorial equalization and the elimination of spatial injustices, it is inevitable that inequalities are going to remain a prevalent characteristic of cities [19,32]. However, to combat these, mitigate the adverse effects, and avoid environmental injustices, it is essential to critically analyse the processes creating and recreating the inequalities [18]. A typical example of these processes is gentrification, which highlights the displacement of residents in favour of capital investment and urban renewal [33]. These investment processes have already been linked to urban green spaces in the case of green gentrification, which reflects on how UGS renewal can lead to filtration and the displacement of low-income residents [34,35]. However, we highlight the need to address the environmental injustices occurring not just in the neighbourhoods affected by investment, but also in the ones affected by systematic neglect. The latter can be understood as a disinvestment process that may involve an explicit “redlining” but may also be the result of the scarce resources of the local stakeholders [36].
First, to understand how potential ecosystem services can indicate investment or disinvestment, we have to clarify how we define ESs and urban green spaces. Mainly because these notions can have different meanings and definitions based on which discipline—urban planning, ecology, or geography—uses them. But there is a common point between the different approaches: these are key elements of a city’s green infrastructure [37]. The latter is typically understood as a settlement-wide network comprising all land surfaces with any degree of vegetative cover, regardless of scale (ranging from small plants to entire ecosystems) [38,39,40,41,42]. In the international discipline of urban development and geography, urban green spaces can be understood as the individual building elements of the green infrastructure. UGSs are defined as urban land parcels containing vegetative cover of any level [39,41,43] and serving aesthetic, recreational, or functional purposes, contributing to urban liveability, microclimate regulation, and ecosystem service provision, while remaining accessible to residents [44]. There are multiple classifications of UGSs, but from a green space management perspective, the most important one is formal and informal, which are divided based on their regulatory status and physical condition [45]. Formal green spaces are clearly delineated, easily identifiable, and maintained by designated caretakers and authorities to at least a basic degree. These include five primary types: public parks and gardens, community gardens, cemeteries, institutional gardens, and urban forests [46]. In contrast, informal green spaces are now-neglected human-disturbed urban lands that support spontaneously emerging, transient vegetation, such as abandoned lots, railway corridors, and halted construction sites [47,48,49,50].
Amongst the research focusing on urban green spaces, many highlight the importance of their ecosystem functions and services provided to the people, reflecting their status as ecological systems [10,11,51,52]. Studies have highlighted the complex, dynamic, and adaptive nature of these systems, while also emphasising how the interaction of human and biophysical agents determined their condition [53]. A holistic urban development approach recognizes that urban environmental conditions significantly affect the quality of life, as exemplified by the increasing relevance of the One Health paradigm [6,8]. Additionally, studies focusing on the geosystem approach, which examine urban green areas as complex and hierarchical landscapes consisting of biotic and abiotic features [54,55], also highlight the importance of integrating human-made elements into planning [56]. Ecosystem services can be defined as all tangible and intangible benefits—both products and functions—generated by the natural- or human-modified processes of ecological systems, contributing to individual and societal well-being [51,57,58]. While the term first appeared in the 1960s, it gained prominence through the Millennium Ecosystem Assessment (MEA), which aimed to assess global ecosystem transformations [58] scientifically. Later research has further refined the concept to foster its practical implementation [59], for example, by distinguishing between ES supply and demand [14], or potential and realized ecosystem services [60]. Moreover, increasing attention has also been directed toward analysing interactions and trade-offs among different ecosystem services [61]. Our research focuses on both potential and realised ES values, as these notions have started to gain attention globally. However, there is still some room for improvement regarding their practical usage [62]. The potential ESs refer to the theoretical maximum benefits a given green space could provide, while the realized ESs denote the actual services utilized by society. Consequently, the realized ecosystem service value can never exceed the potential value [62]. In the 2010s, the academic discourse increasingly highlighted the importance of distinguishing between these two concepts and understanding their relative proportions [63]. This distinction allows for a more accurate assessment of a green space’s societal role and facilitates the identification of urban green development priorities and injustices.
Despite specific criticisms of the MEA framework—such as its lack of clear differentiation between services, values, and benefits [64]—it remains the most comprehensive and widely accepted classification system for ESs [12]. The MEA framework identifies four main categories of services: provisioning, regulating, supporting, and cultural services. Provisioning services include tangible products; regulating services moderate natural processes; supporting services are foundational, ensuring ecosystem sustainability; and cultural services encompass aesthetic, recreational, and spiritual values [58].
The primary focus of our research is on cultural ecosystem services, due to their uniqueness in multiple aspects. In the MEA framework, this category includes those services that are predominantly intangible and contribute to the mental, emotional, and social well-being of individuals and communities, such as improvements in mental health or the enhancement of property values [58,65]. The MEA framework created nine sub-categories of CESs: cultural diversity, spiritual and religious values, knowledge systems, educational values, inspiration, aesthetic values, social relations, sense of place, cultural heritage values, and recreation and ecotourism [12,58]. However, these were non-encompassing categories that were later expanded by many researchers in diverse ways [66,67,68,69], leading to an inconsistent and broad group of ecosystem services [70,71]. The intangible and interdisciplinary nature of CESs, along with their unique methodological requirements for assessment, are key reasons why early research on ecosystem services paid relatively little attention to this category compared to provisioning and regulating services [12]. Moreover, CESs form a unique category of ecosystem services, and as a result of nature’s contribution to the people concept, some researchers have even started to examine culture as an overarching lens for the three other ES categories, rather than a separate category [72]. An additional concept that highlights the challenges of CES assessment is the ecosystem services cascade model, which emphasises the user- and context-dependent nature of the cultural ecosystem benefits resulting from CESs [73,74]. However, these same characteristics provide compelling motivation for their further study [65,75]. Moreover, the valuation of specific CESs can vary widely across societies and individuals, given the inherently normative and context-dependent nature of culture itself [74]. This variability highlights the importance of conducting research that can enhance understanding and enable the integration of CES values into practical development frameworks and urban planning interventions [12]—potentially tailored by social group or demographic segment [76]. In addition, CESs deserve focused attention because decision-makers often prioritize economic and environmental benefits in urban development projects, frequently at the expense of initiatives aimed at improving the quality and accessibility of cultural ecosystem services [77]. Despite growing recognition of their importance, there is a broad consensus among scholars that many key aspects of CESs remain poorly understood and under-researched. Thus, further investigation into cultural ecosystem services is essential [78]. Moreover, one of the main reasons why CESs are a focus of research coming from diverse backgrounds is that they are the ones most heavily affecting the usage patterns of UGSs [14] and in connecting humans to urban nature [12,79,80]. Although there are several other factors, like location or size [4], a green space that is rich in cultural ecosystem services is likely to be well attended.
Finally, another unique characteristic of CESs is that the potential amount and quality of recreational services can be improved or degraded rapidly in case of a park renovation or vandalism. At the same time, the improvement of other ES categories usually takes more time and can function for more extended periods without human maintenance [61]. This is due to the human-reliant aspect of CESs [58,81], as they are directly experienced and appreciated by people through ecosystems, which is also why they can be labelled as the most “human-made ecosystem services” [82]. For example, street furniture can be placed in a matter of hours or days with the proper financial and decision-maker support to increase recreational CES values, while trees take years to grow into their optimal size, when they finally start to provide adequate shading as regulating ESs. Other examples of investments that rapidly increase the potential CES values could be the placement of artworks for higher aesthetic values, the organisation of community programs to increase cultural diversity, or the placement of information boards for educational purposes. This means that recreational services are the fast-changing proxy indicators for investment while regulating or provisional services only change on a longer timescale (Figure 1) [61]. This also applies to the indication of disinvestment in certain aspects, because if vandalism or extreme weather events degrade street furniture, only investment can restore it. In contrast, natural ecosystems and plants have a self-revitalizing capability to a certain extent. However, it is crucial to notice that in natural conditions, plants usually need more care and investment than street furniture. Still, cultural ecosystem services also include the aesthetic value of street furniture and plants combined. The latter is highlighted by studies which emphasize that CESs are co-produced by humans and the landscape [56,79]. Based on these unique aspects of cultural ecosystem services, we can assume that this category of ESs represents most accurately the investment volumes that an UGS receives.
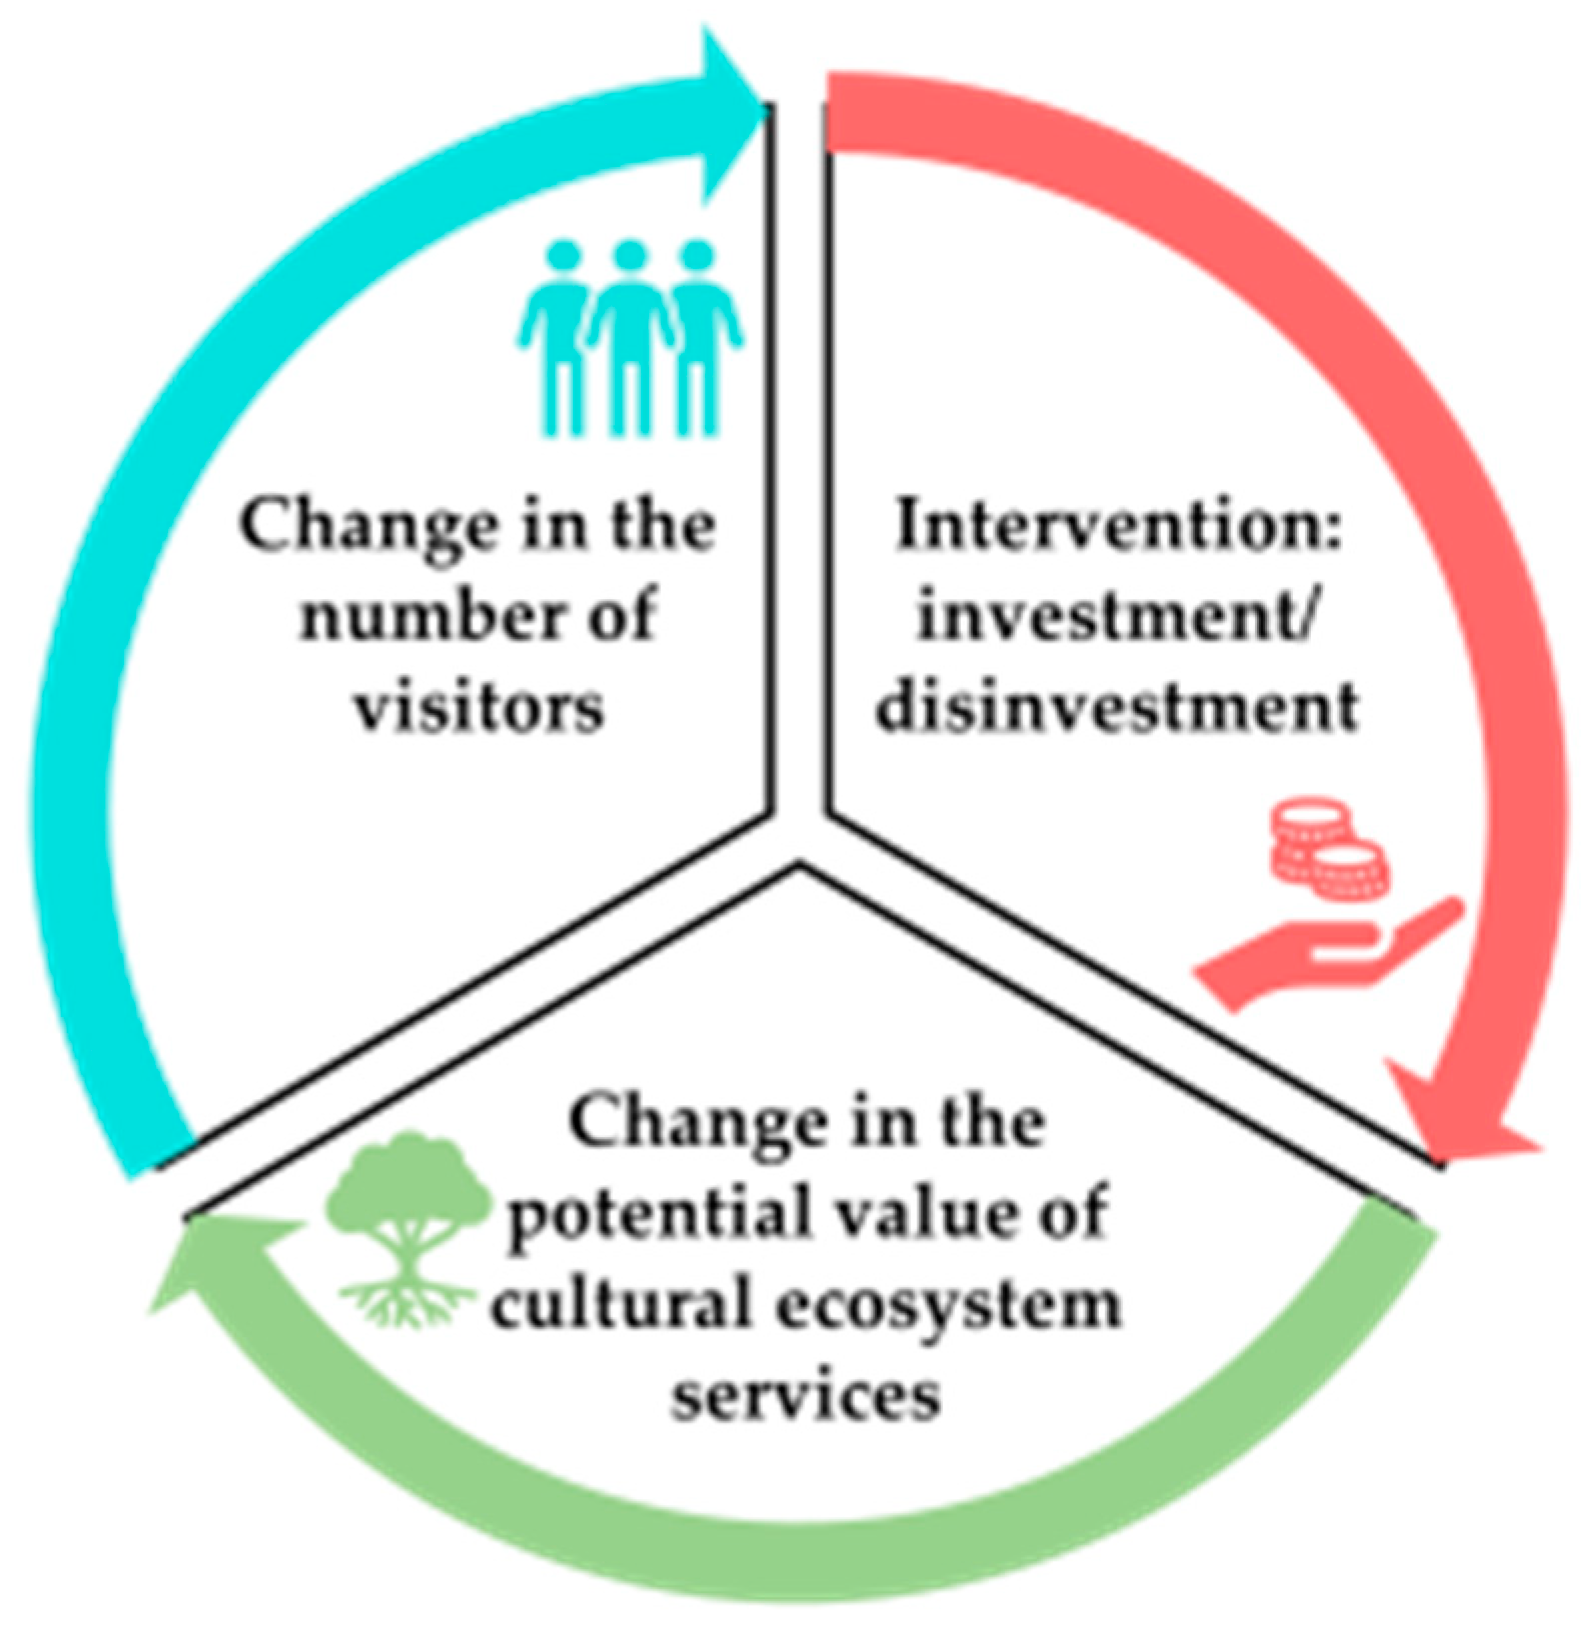
As we have highlighted, cultural ecosystem services can rapidly change their response to green space management practices, such as investment or disinvestment. This process can be understood as a complex “cascade” effect or a chain reaction, where a single intervention can cause significant changes regarding the CES values and visitor activities. A shift in the condition of the UGSs or their management practices can start a rapid domino effect, which changes the potential values of the green space’s cultural ecosystem services. In the end, this leads to a change in how residents perceive and value the UGSs, which in turn influences and limits the number of visitors. As positive feedback, the rising or decreasing usage can initiate additional investments or the continuation of disinvestment and neglect (Figure 2). However, it is essential to highlight that these processes in practice are often more complex and multiple interventions with different intentions can happen at the same time on an urban green space. In many cases, the complex processes negate each other’s effects and do not result in a rapid change.

3. Materials and Methods

Both the assessment of cultural ecosystem service values and the observation of urban green space usage are represented by an extensive body of work in the literature [15,83]. There are multiple existing methods for assessment, most of which focus on monetary evaluation methods [15], such as willingness to pay [14] or payments for ecosystem services [57]. However, even though it would seem fitting for our study to monetarily evaluate the investment volumes in the neighbourhood around the UGSs based on the land value changes with a hedonic pricing method [17,84,85], we argue that these monetary evaluations are too simplistic to understand the complex values of cultural ecosystem services. Hence, we opt to use a non-monetary [15] green space CES evaluation method: field observations [86,87] using pre-made data sheets. On one hand, the in situ evaluation of the physical environment lets us obtain a better understanding of the local processes [56] while on the other hand, this fits into the trend of evaluating CESs based on indicators [69]—or in the case of our study, potential cultural ecosystem services can also be understood as proxy indicators of investment practices.
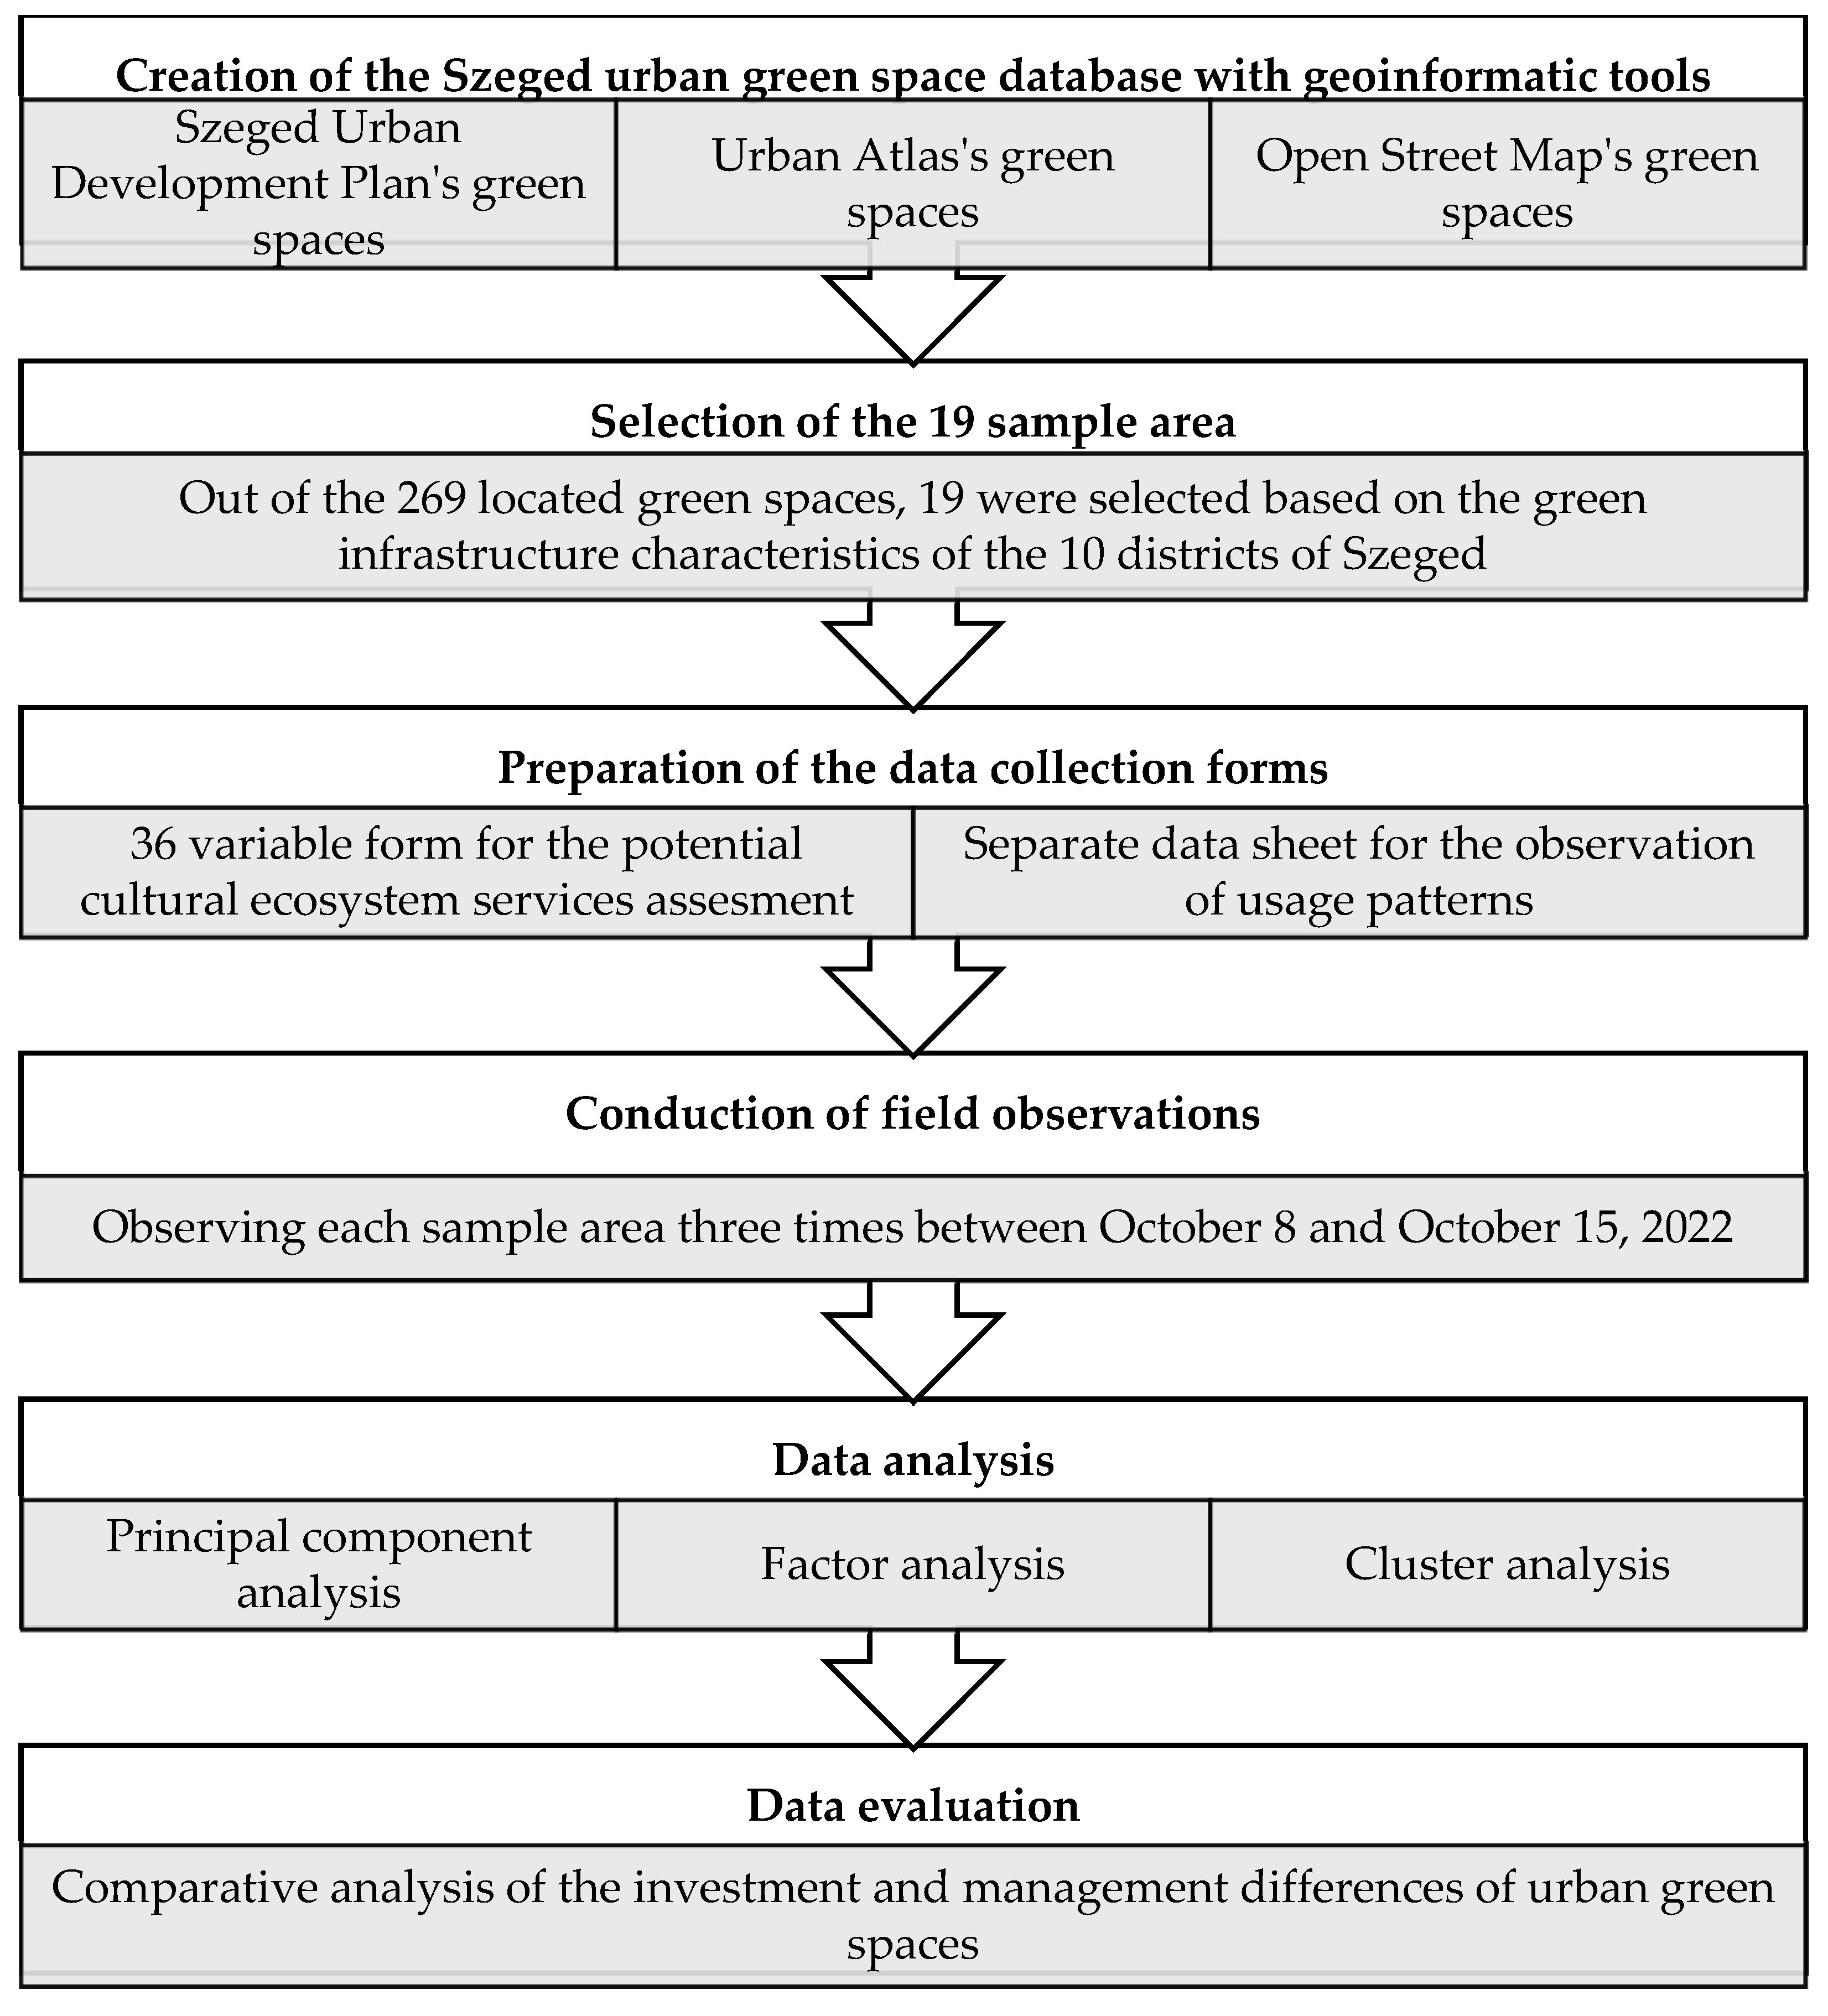
As a starting point, we created a comprehensive database of the urban green spaces of Szeged, which became our population for choosing the sample areas. The initial framework for this database was based on the city’s current Urban Development Plan. The official green space dataset was combined with alternative data sources—namely, community-updated OpenStreetMap and satellite-based Urban Atlas—which have proven more suitable for tracking changes over time [88]. This resulted in a dataset of 269 urban green spaces, including a diverse array of green infrastructure elements.
To decide how many green spaces to observe, we sorted the UGSs based on which of the 10 city districts they were situated in. When we examined the green space numbers by district, we observed natural breaks in the dataset at 19 and 29. Hence, if there were fewer than 19 UGSs in a district, we selected one; if there were between 19 and 29, we selected two; and if there were more than 29, we selected three sample areas from a district. This led to 19 sample areas, which is 7% of the total population of 269 UGSs. The green space selection criterion aimed to represent the predominant types of green spaces within each district. This was based on classifications from the Urban Development Plan, OpenStreetMap, and Urban Atlas. In districts from which multiple UGSs were selected, we aimed to select different sample areas that represented the two or three most dominant green space types (for example, public park, urban forest, sport field, pasture, etc.) in that part of the city.
Field observation was selected as the primary data collection method (Table 1) based on the relevant literature [87,89]. Observation, as a non-interventional method, ensured that the research itself would not change or influence the behaviour and attitudes of visitors. When selecting the observation period, two primary factors were considered; on one hand, the use of green spaces is significantly influenced by the extreme climatic conditions, characteristic of summer and winter. On the other hand, university students—who play a key role in shaping the life of the city—are predominantly present in Szeged during the academic terms of September to December and February to June. Additionally, due to the cross-sectional nature of this study, we aimed to conduct the observations over a week to avoid the distorting effects of significant changes in the condition of sample areas. As a result of these, the field data collection was conducted between October 8 and 15, 2022, with each sample area observed three times, leading to fifty-seven observation sessions in all. Over seven days, each sample area was observed on three different days, in diverse periods, including morning and afternoon observation sessions. During an observation session, we evaluated the potential cultural ecosystem service values and assessed the number of visitors in period. Data were recorded using pre-structured observation sheets, ensuring a standardized format for data collection. Moreover, the repeatability of this study was ensured as the same data sheets were used on all occasions. To counterbalance this rigid structure, photographic and narrative documentation was also collected during each visit. Two types of observation sheets were used: one for evaluating potential cultural ecosystem services, and another for assessing visitation patterns (see Appendix A).
The observation sheet prepared for potential CES evaluation was based on the work of Vidal and colleagues, who developed a 36-criterion form (see Appendix A, Table A1) grounded in the earlier cultural ecosystem service assessment literature [90]. Additionally, they also showcased and validated their application in field observations and clustering analyses [87,91,92]. In our study, the 36 criteria were retained, but the measurement scale was modified from nominal to ordinal. Instead of a binary “present or not” indicator, a four-point scale was used: absent (0), low (1), medium (2), and high (3) presence. This modification increased the subjectivity of the assessment but also allowed for richer data collection and enabled statistical analyses that are not possible with nominal variables. To reduce subjectivity, a textual justification was recorded for each rating, as the relevant literature suggests [90,93].
To evaluate actual CES values and the effects of investment/disinvestment, we observed visitor numbers using a separate data sheet that captured contextual information (e.g., weather, time), visitor demographics, and the activities undertaken on-site [45,93,94,95]. During an observation session, we took note of the number of visitors regarding the different variables using the pre-made data sheets (see Appendix A, Table A2) based on the works of Jan Gehl [96]. Although a questionnaire-based method may have provided more accurate information on the demographics or on how the users evaluate certain recreational services, with field observation, we were able to assess every green space in the same amount of time regardless of their visitor numbers. Moreover, with field observation, we were able to determine general trends in each sample area regarding the four observed variables (sex; age group; physical/social/nature-related activity; alone/in a group) (see Appendix A, Table A2). The CESs primarily influence preferences for visiting the green spaces that they offer [14], and highly frequented urban green spaces typically provide more cultural ecosystem services. This hypothesis was tested using correlation analysis. Cultural ecosystem services that influence social behaviour and usage patterns of green spaces were considered as actual CESs. Thus, visitor numbers observed in the field serve as valid indicators of the actual CES value of each sample area. While the international literature offers varying recommendations regarding the ideal duration for public space observations [97,98], a five-minute observation window was used to count visitors. The main reason behind this was the diverse type of green spaces, because if we had opted for a more extended observation period, the sample areas with a higher number of visitors passing through would have seemed more popular than the ones that are primarily used for longer, sit-down activities. However, regarding the evaluation of how much people appreciate cultural ecosystem services, we argue that the more extended visitors who spend longer periods in a green space are more important than those who just pass through during commuting. As a result, the visitor numbers showcased in the results part of this study are the average values of the three five-minute-long observations in every sample area. Moreover, we have to highlight that the five-minute time window only applies to the visitor number observation, as we spent more time on the sample area during each observation session to evaluate potential CES values.
In contrast to the work of Vidal and colleagues, our study also employed data reduction techniques. Principal component analysis and factor analysis were performed on the collected data [99]. Based on the theoretical framework of Vidal et al. [87], four factors were created: activities performed (A—consisting of seven variables), environmental quality (B—consisting of eleven variables), facilities (C—consisting of twelve variables), and security (D—consisting of six variables). From the original 36 variables, seven principal components were derived: (1) activity potential (consisting of four variables), (2) maintenance (consisting of four variables), (3) environmental elements (consisting of five variables), (4) facilities (consisting of nine variables), (5) visibility (consisting of three variables), (6) recreation (consisting of four variables), and (7) infrastructure (consisting of three variables). Four variables did not fit into any of the seven principal components: religious gatherings, the surrounding area, public transport, and lighting. Cluster analysis was used to create development groups from the sample areas. Five iterations were considered successful, differing in whether they used the 36 CES indicators, principal components or factors, and in the clustering method used (Ward’s hierarchical or K-means) (see Appendix B). Despite methodological variations, the results were largely consistent, revealing four clearly defined development clusters. By comparing the sample areas and their clusters regarding their usage patterns and potential CES values, we were able to uncover green space management and investment-related environmental injustices (Figure 3).

4. Results

4.1. Clustering Based on the Potential Cultural Ecosystem Services Values

After performing three field observations on each of the 19 sample areas, a total of 860 green space users were observed. The average number of visitors was 15 people, while the average aggregated potential cultural ecosystem service values was 45.32 per sample area out of the possible maximum 108. All in all, the evaluated urban green spaces of Szeged can be labelled as “average” regarding the dimensions of environmental quality, facilities, and security. In contrast, the possibility to perform diverse activities can be labelled as “minimal”. Hence, it can be stated that most of these urban green spaces are lacking the functions to support social gatherings and diverse activities, which is illustrated by the fact that the lowest average valued potential CES was “Religious gatherings”. On the other hand, all in all, the highest valued potential cultural ecosystem service was “Areas of little visualisation”. As expected, based on the connecting literature [14], the potential CES values and the number of visitors on a green space showed a strong and significant correlation (0.85; p < 0.005), which highlights the importance of examining the potential CES values of a green space. Although it could be assumed that other factors, like the location or the size of the green space, also affect the number of visitors, the latter showed a weak and not significant correlation with the number of users (0.24; p < 0.9).
The user activity assessment revealed that the majority of individuals engaged primarily in physical activities (60%) within the sample areas, followed by social interactions (29%). In comparison, the smallest proportion of users participated in nature-related activities (11%). The age composition of the visitors likely influences this distribution: one-third were middle-aged adults, one-quarter were children, while 18% of the visitors were in the young adult age category. Only 13% of the users were late middle-aged adults, while 10% was elderly. Although due to the methodological restrictions of field observation, the exact ages of the users were not possible to record, it was important to evaluate the distribution trends of the age groups. In particular, because previous studies have shown that physical activities are predominantly undertaken by younger age groups, while older individuals are more likely to engage in nature-oriented activities [95]. Therefore, the relatively lower presence of the oldest age group and the dominance of younger and middle-aged visitors likely explains the observed activity pattern. The gender distribution of visitors was nearly balanced, with 48% female and 52% male participants. This is a noteworthy result, especially considering that international studies have reported contrasting gender-based patterns in green space use [95]. Approximately two-thirds of the visitors used the study areas in groups, indicating a clear predominance of group use over solitary use. The validity of these findings is supported by their alignment with previous research conducted in Szeged, which observed user behaviour on informal urban green spaces and reported similar demographic and behavioural characteristics [45].
We must emphasize that the observed green spaces showed significantly different attributes regarding both their potential CES values and visitors (Table 2); hence, a clustering and a comparative analysis was needed to better understand the investment differences. Based on the potential cultural ecosystem services, we were able to identify four green space clusters: city centre squares, suburban playgrounds, central parks, and informal green spaces. Amongst the sample green spaces there are differences both regarding their management practices, usage rates/modes, and cultural ecosystem diversity.
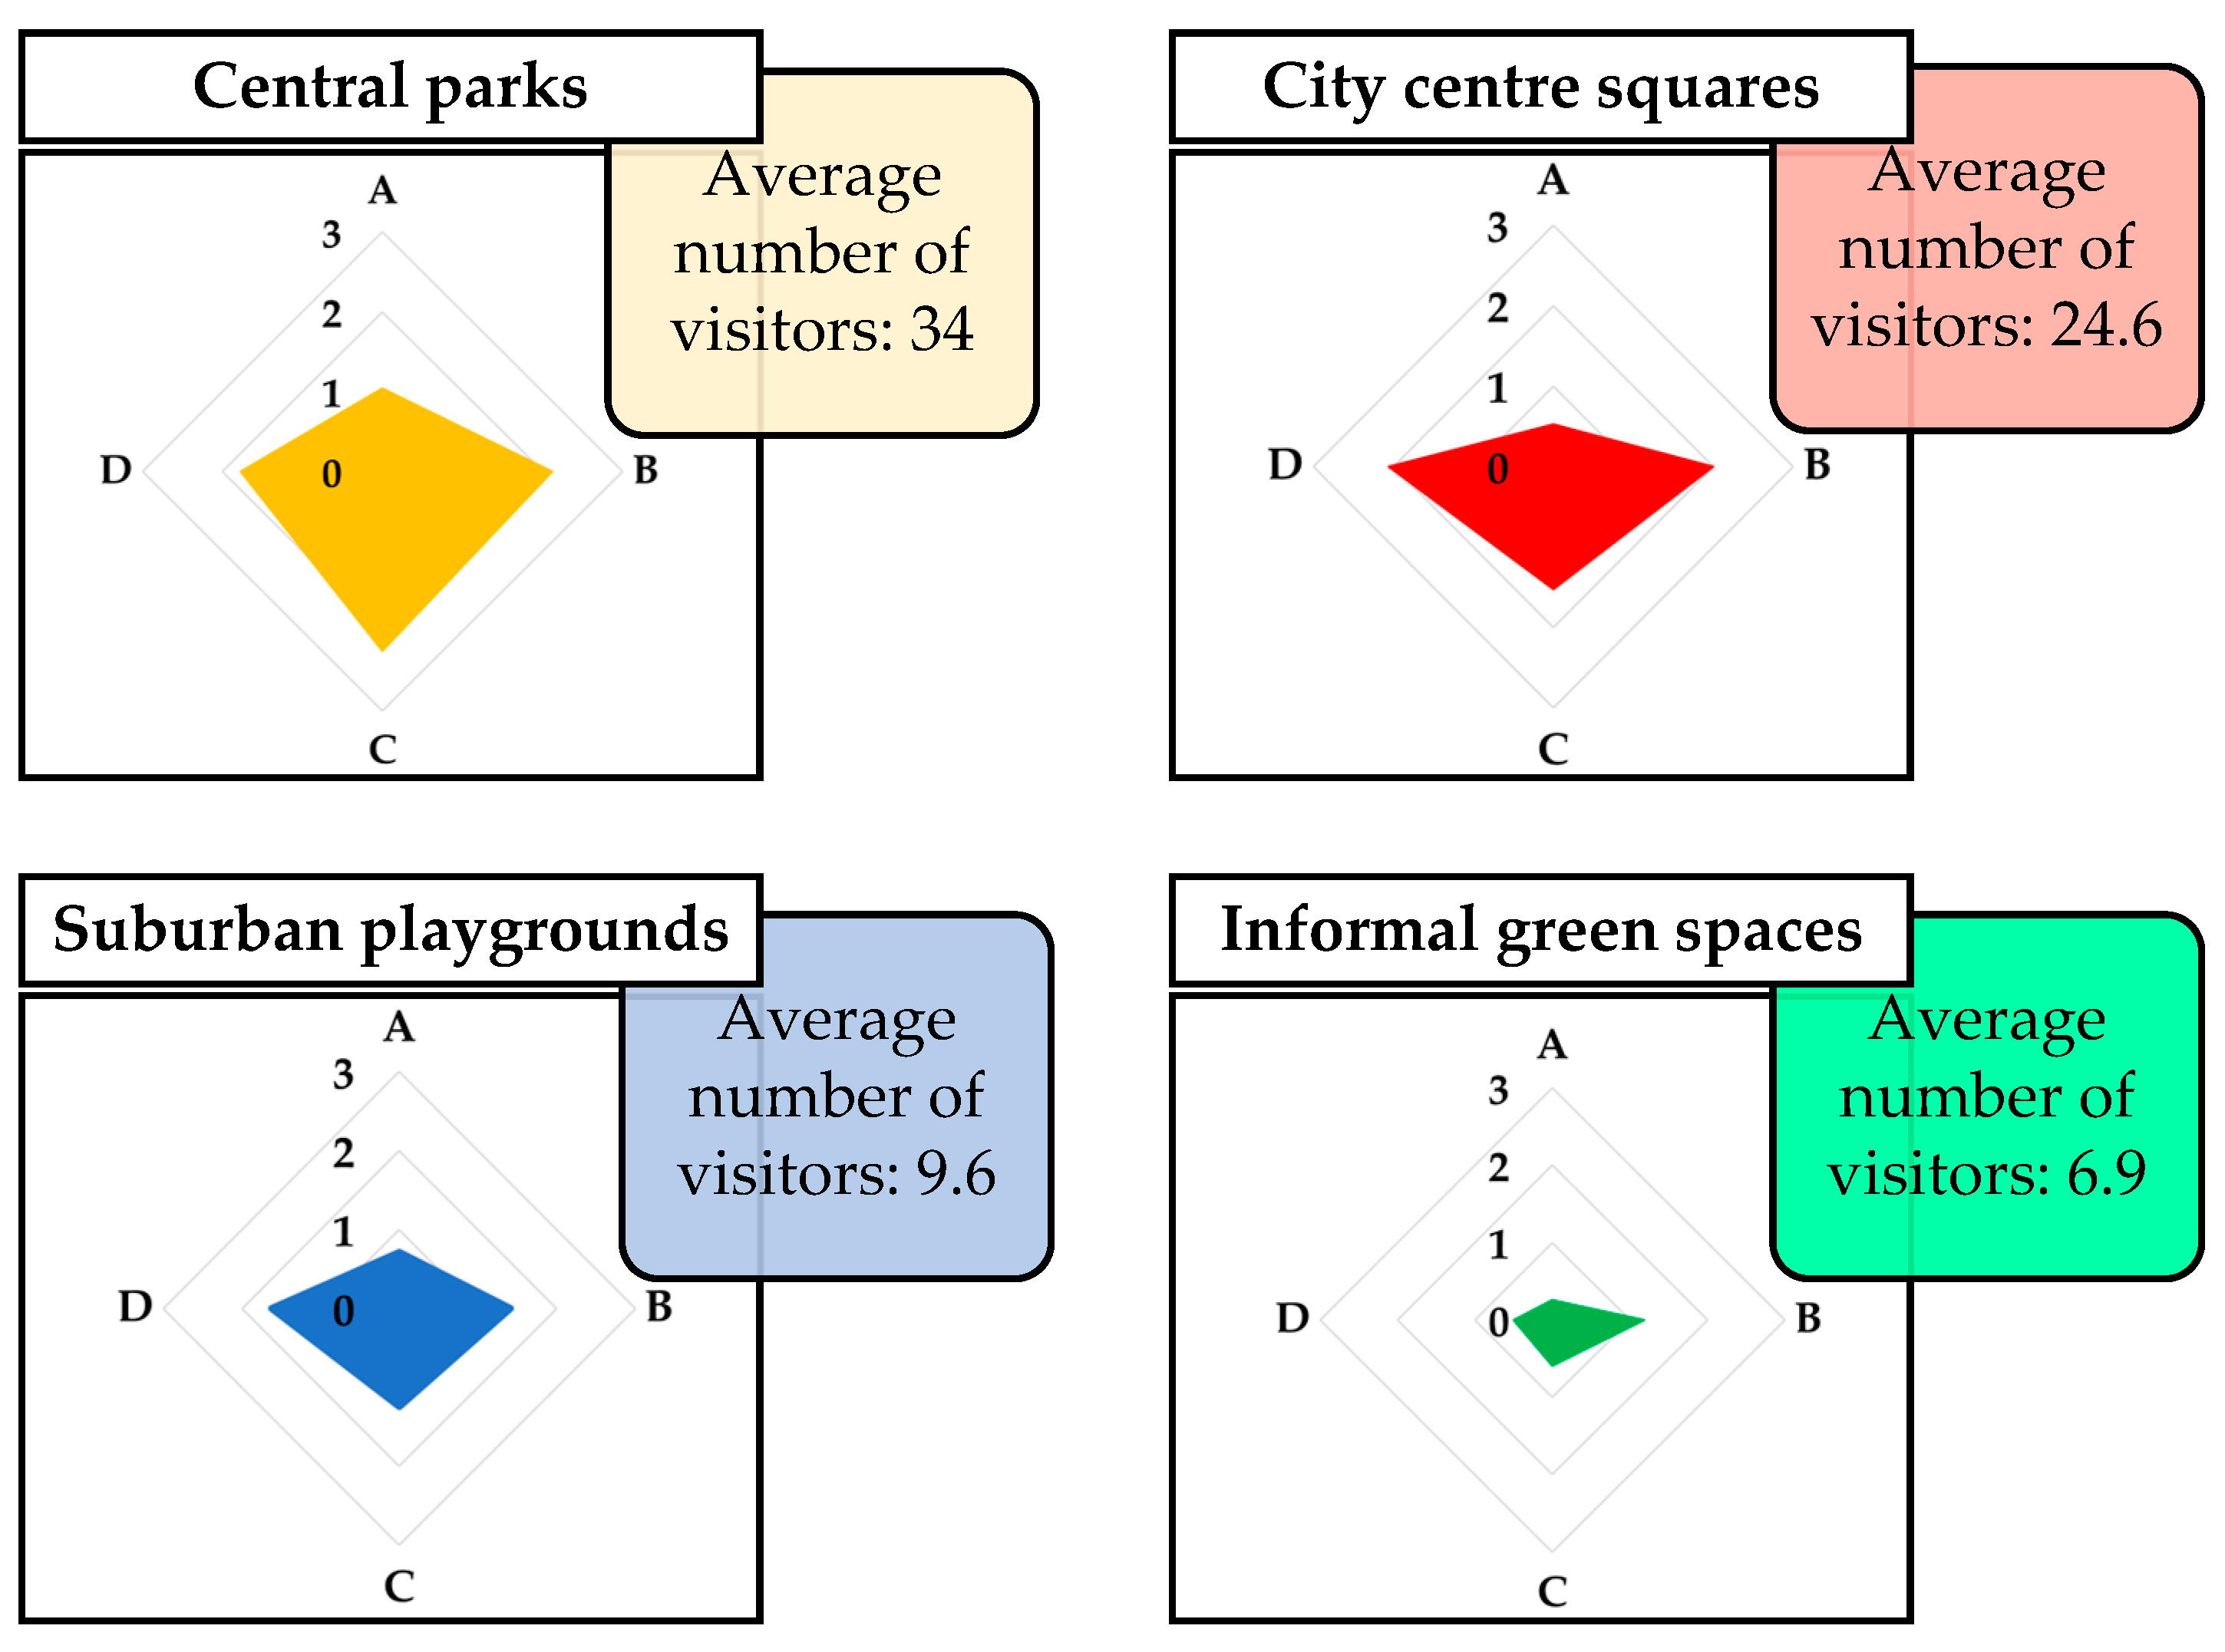
Among the four clusters identified in this study (Figure 4), the two with the highest levels of visitation and potential cultural ecosystem services were labelled “central parks” and “city centre squares”, reflecting their location and functional importance. In these sample areas, the high-quality presence of potential services translates into actual cultural ecosystem services, contributing to high levels of public use and indicating frequent maintenance and investment. In contrast, the third cluster was designated as “suburban playgrounds”, where, despite the presence of potential CESs, visitor numbers remained relatively low. This shows an imbalance between the investment values and the number of users. Finally, in the cluster termed “informal green spaces”, low visitation rates were directly attributable to the poor quality of potential services, disinvestment, and neglect, all leading up to underutilization.
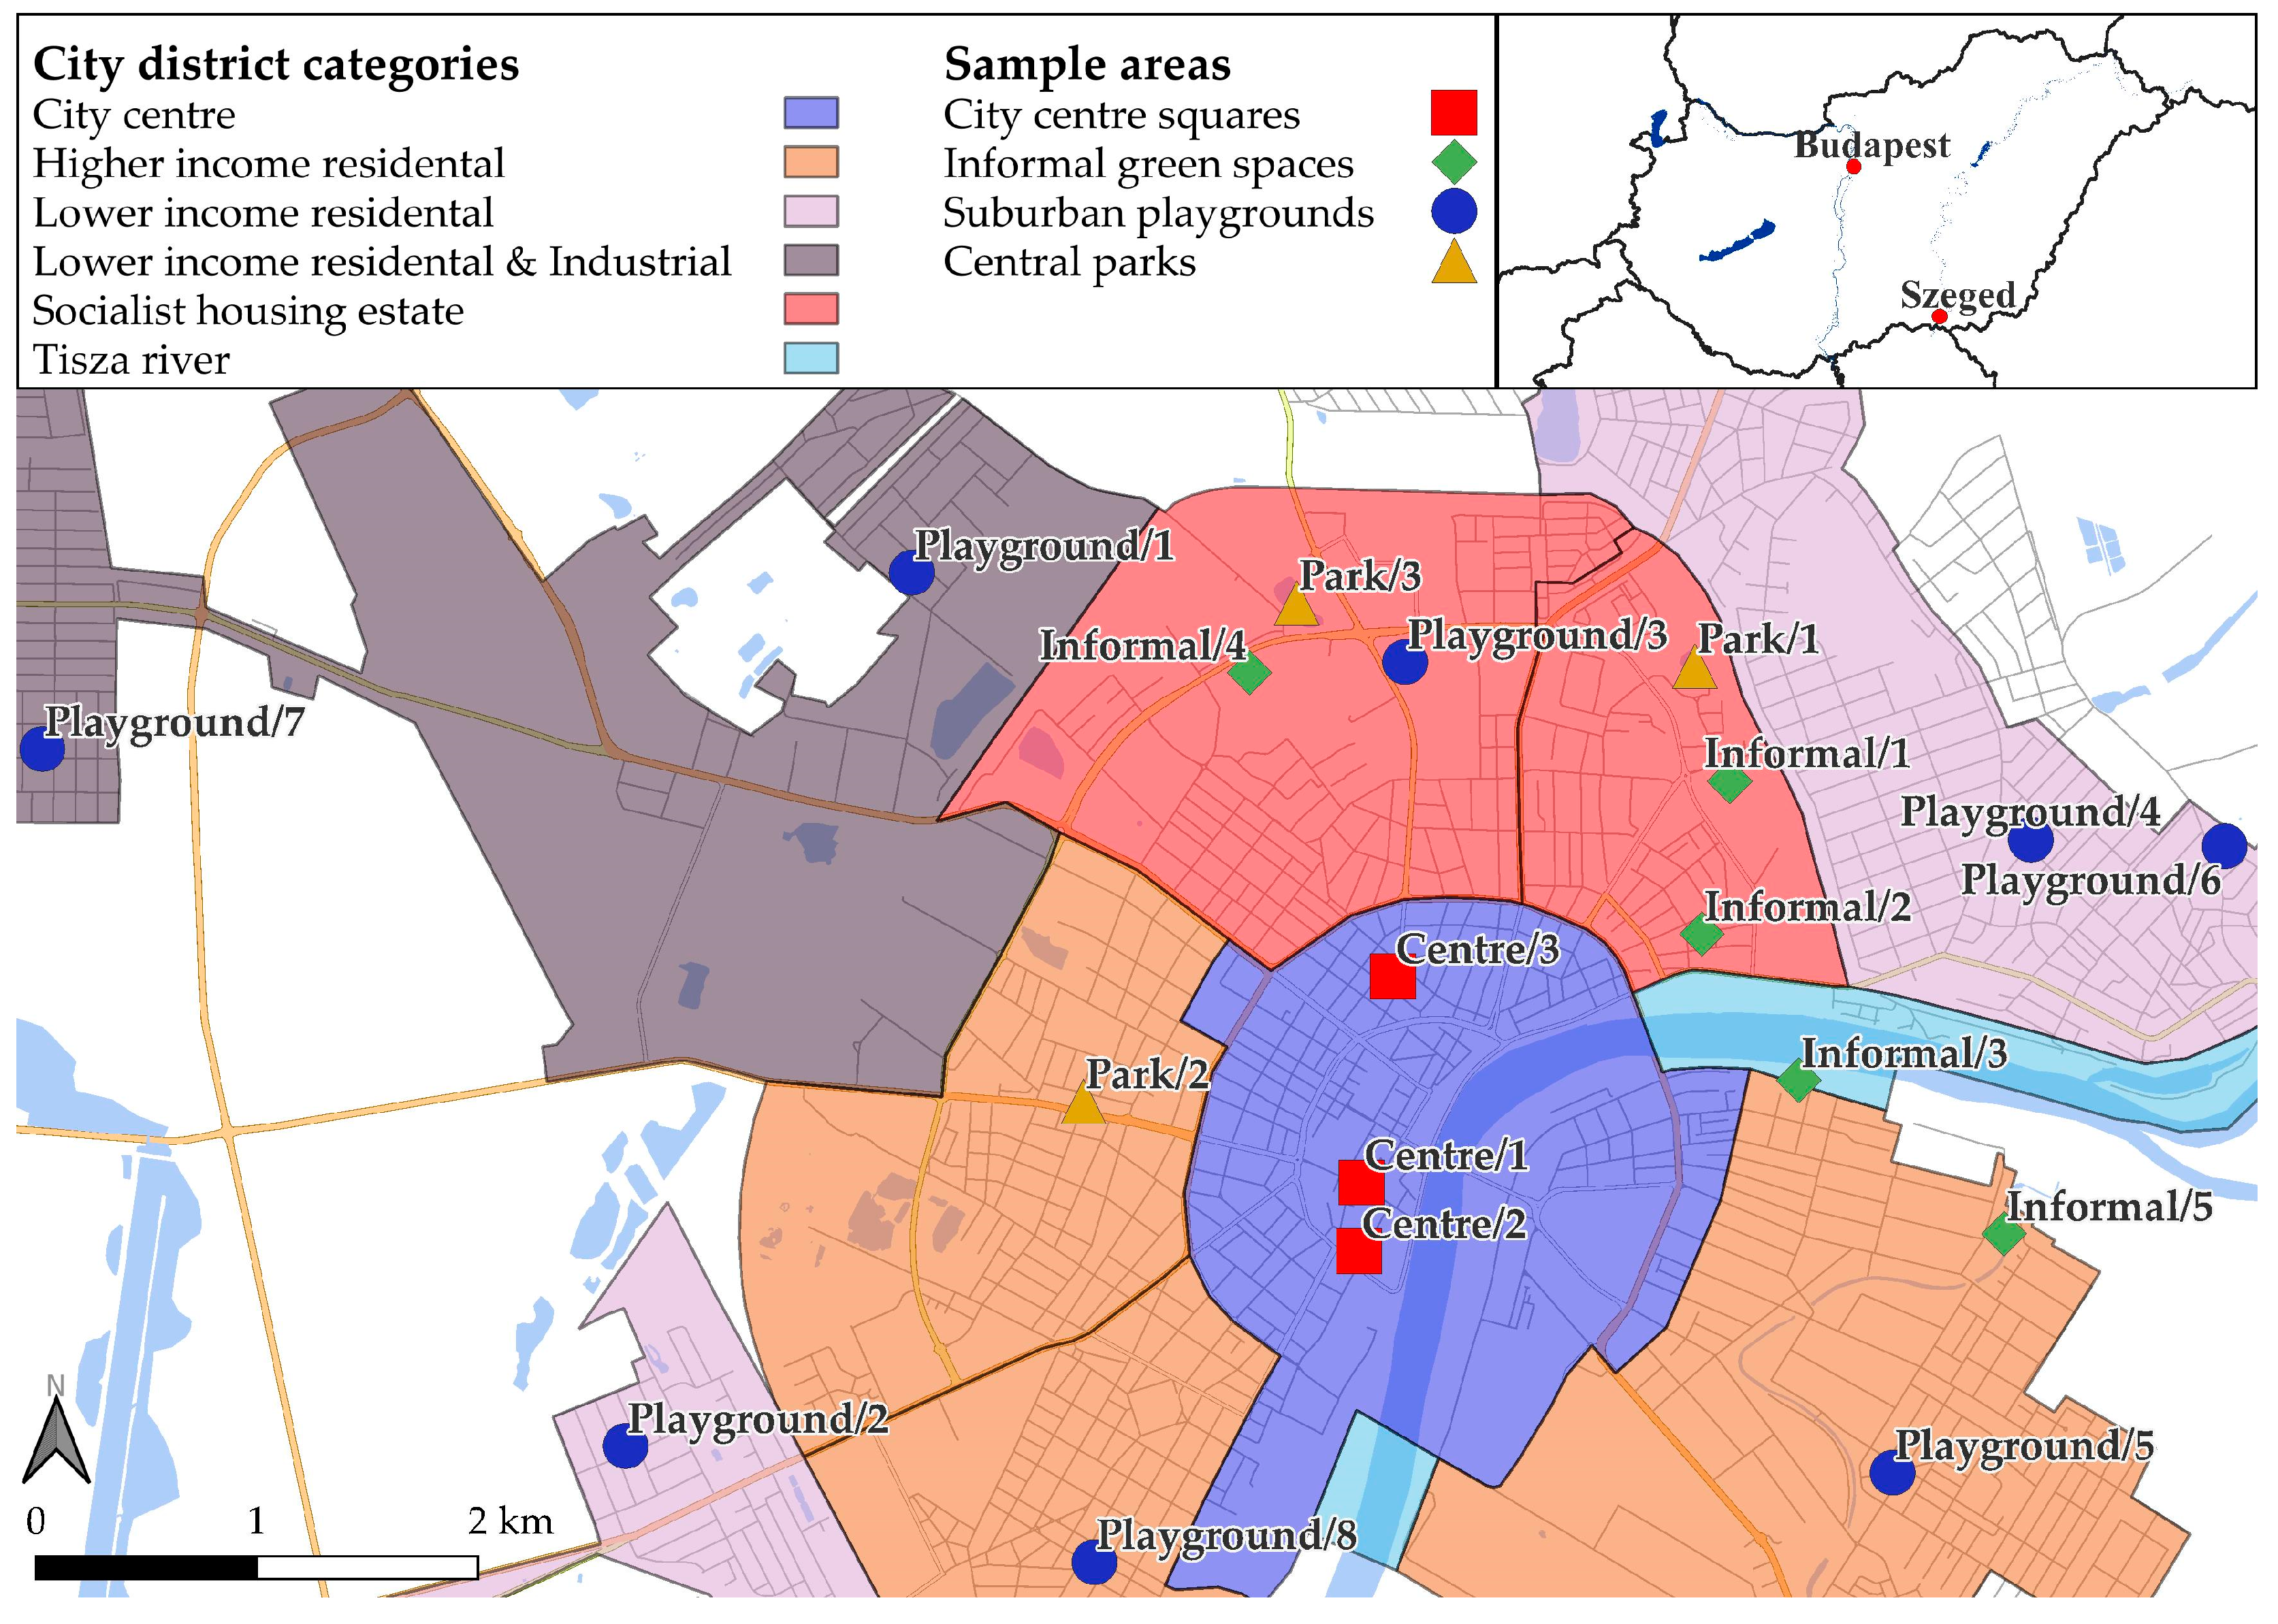
In addition to differences in visitation rates and the provision of potential cultural ecosystem services, the clusters also reflected spatial and structural distinctions between urban districts and types of urban fabric. Szeged has a typical concentrical city model with sectorial elements of socialist housing estate districts, representing a classical example of post-socialist cities (Figure 5) [100,101,102]. Although spatial variables were not explicitly included among the input indicators, the clustering process still resulted in distinct groups such as squares in the city centre and playgrounds in suburban areas, based on shared characteristics. This finding reinforces the notion that different urban districts with varying functions and population compositions require different types of green spaces. Consequently, in planning green infrastructure developments, it is essential to consider the broader urban context of each public space to ensure that interventions are responsive to local needs.
The highest potential cultural ecosystem service values and visitation rates were observed in central parks, a cluster comprising three sample areas. This cluster designation is based, on the one hand, on the fact that each of the three green spaces represent the largest and most frequented UGSs within their respective city districts, and on the other hand, on their outstanding city scale performance in terms of climatic, social, and quality-of-life indicators. Visitors’ activities and demographic composition generally align with the aggregated average. The facilities and environmental quality represent a high standard in terms of potential CESs, while safety is rated average, and the range of activities, similar to other green spaces in Szeged, is rated below average. From a development perspective, it can be concluded that the sample areas within this cluster fall short of ideal conditions in terms of maintenance, visibility, and infrastructure. The primary limiting factor is the extensive area of these urban green spaces, which increases the time and financial resources needed for upkeep and reduces visibility from surrounding streets and buildings. Hence, these aspects represent critical development priorities for the green spaces within this cluster. Despite the limitations, the high potential CES values show that these green spaces are well maintained and receivers of frequent investments in the form of street furniture renovation or community program organization.
Similar to central parks, the city centre squares also displayed exceptionally high potential CES values and visitor numbers, indicating the effective realization of these services. This cluster also includes three sample areas; all located in the city centre. What primarily differentiates these sites from other green spaces is the unique characteristics of their visitors. While potential CES values generally matched the aggregated average, only gender distribution and activity types were consistent with the city-wide patterns. Notably, children and elderly individuals were largely absent (each accounting for only 4% of visitors), and the proportion of solitary visitors was highest in this cluster. This is mainly due to the dominance of young (43%) and middle-aged adults (33%), who are primarily students or employees in the downtown area. These individuals typically traverse the green spaces alone, rather than engaging in social activities. The lack of multifunctional infrastructure and community-focused services highlights the primary development direction for these spaces. However, even with these shortcomings, city centre squares can be described as well-maintained formal parks that often receive investment due to their representative and touristic functions. A unique form of investment—that is frequently observed in city centre squares—is the placement of artworks and statues that increase the area’s aesthetic value and showcase the city’s rich culture and history.
The suburban playgrounds cluster comprises eight sample areas, which are mostly situated in residential zones with single-family housing in Szeged. The defining feature of these green spaces is that over 80% of users were either children (44%) or middle-aged adults (37%), the latter typically accompanying their children. This usage pattern reflects the dominant function of these sites as playgrounds, also evident in the low proportion of solitary visitors (15%). These areas can be characterized as average in terms of potential CESs, with low actual service provision, as indicated by their average visitation rate of fewer than 10 people. Development efforts should focus on expanding their functionality beyond serving young children and their guardians. However, such developments must preserve the core playground function, which is demonstrably in demand—especially in suburban districts. Finally, an interesting aspect of these green spaces is that they are relatively well maintained and have received multiple renovations in the past, but these investments are not justified by their visitor numbers. In particular, because these UGSs lie in districts where most of the residents have their own gardens as accessible green infrastructure.
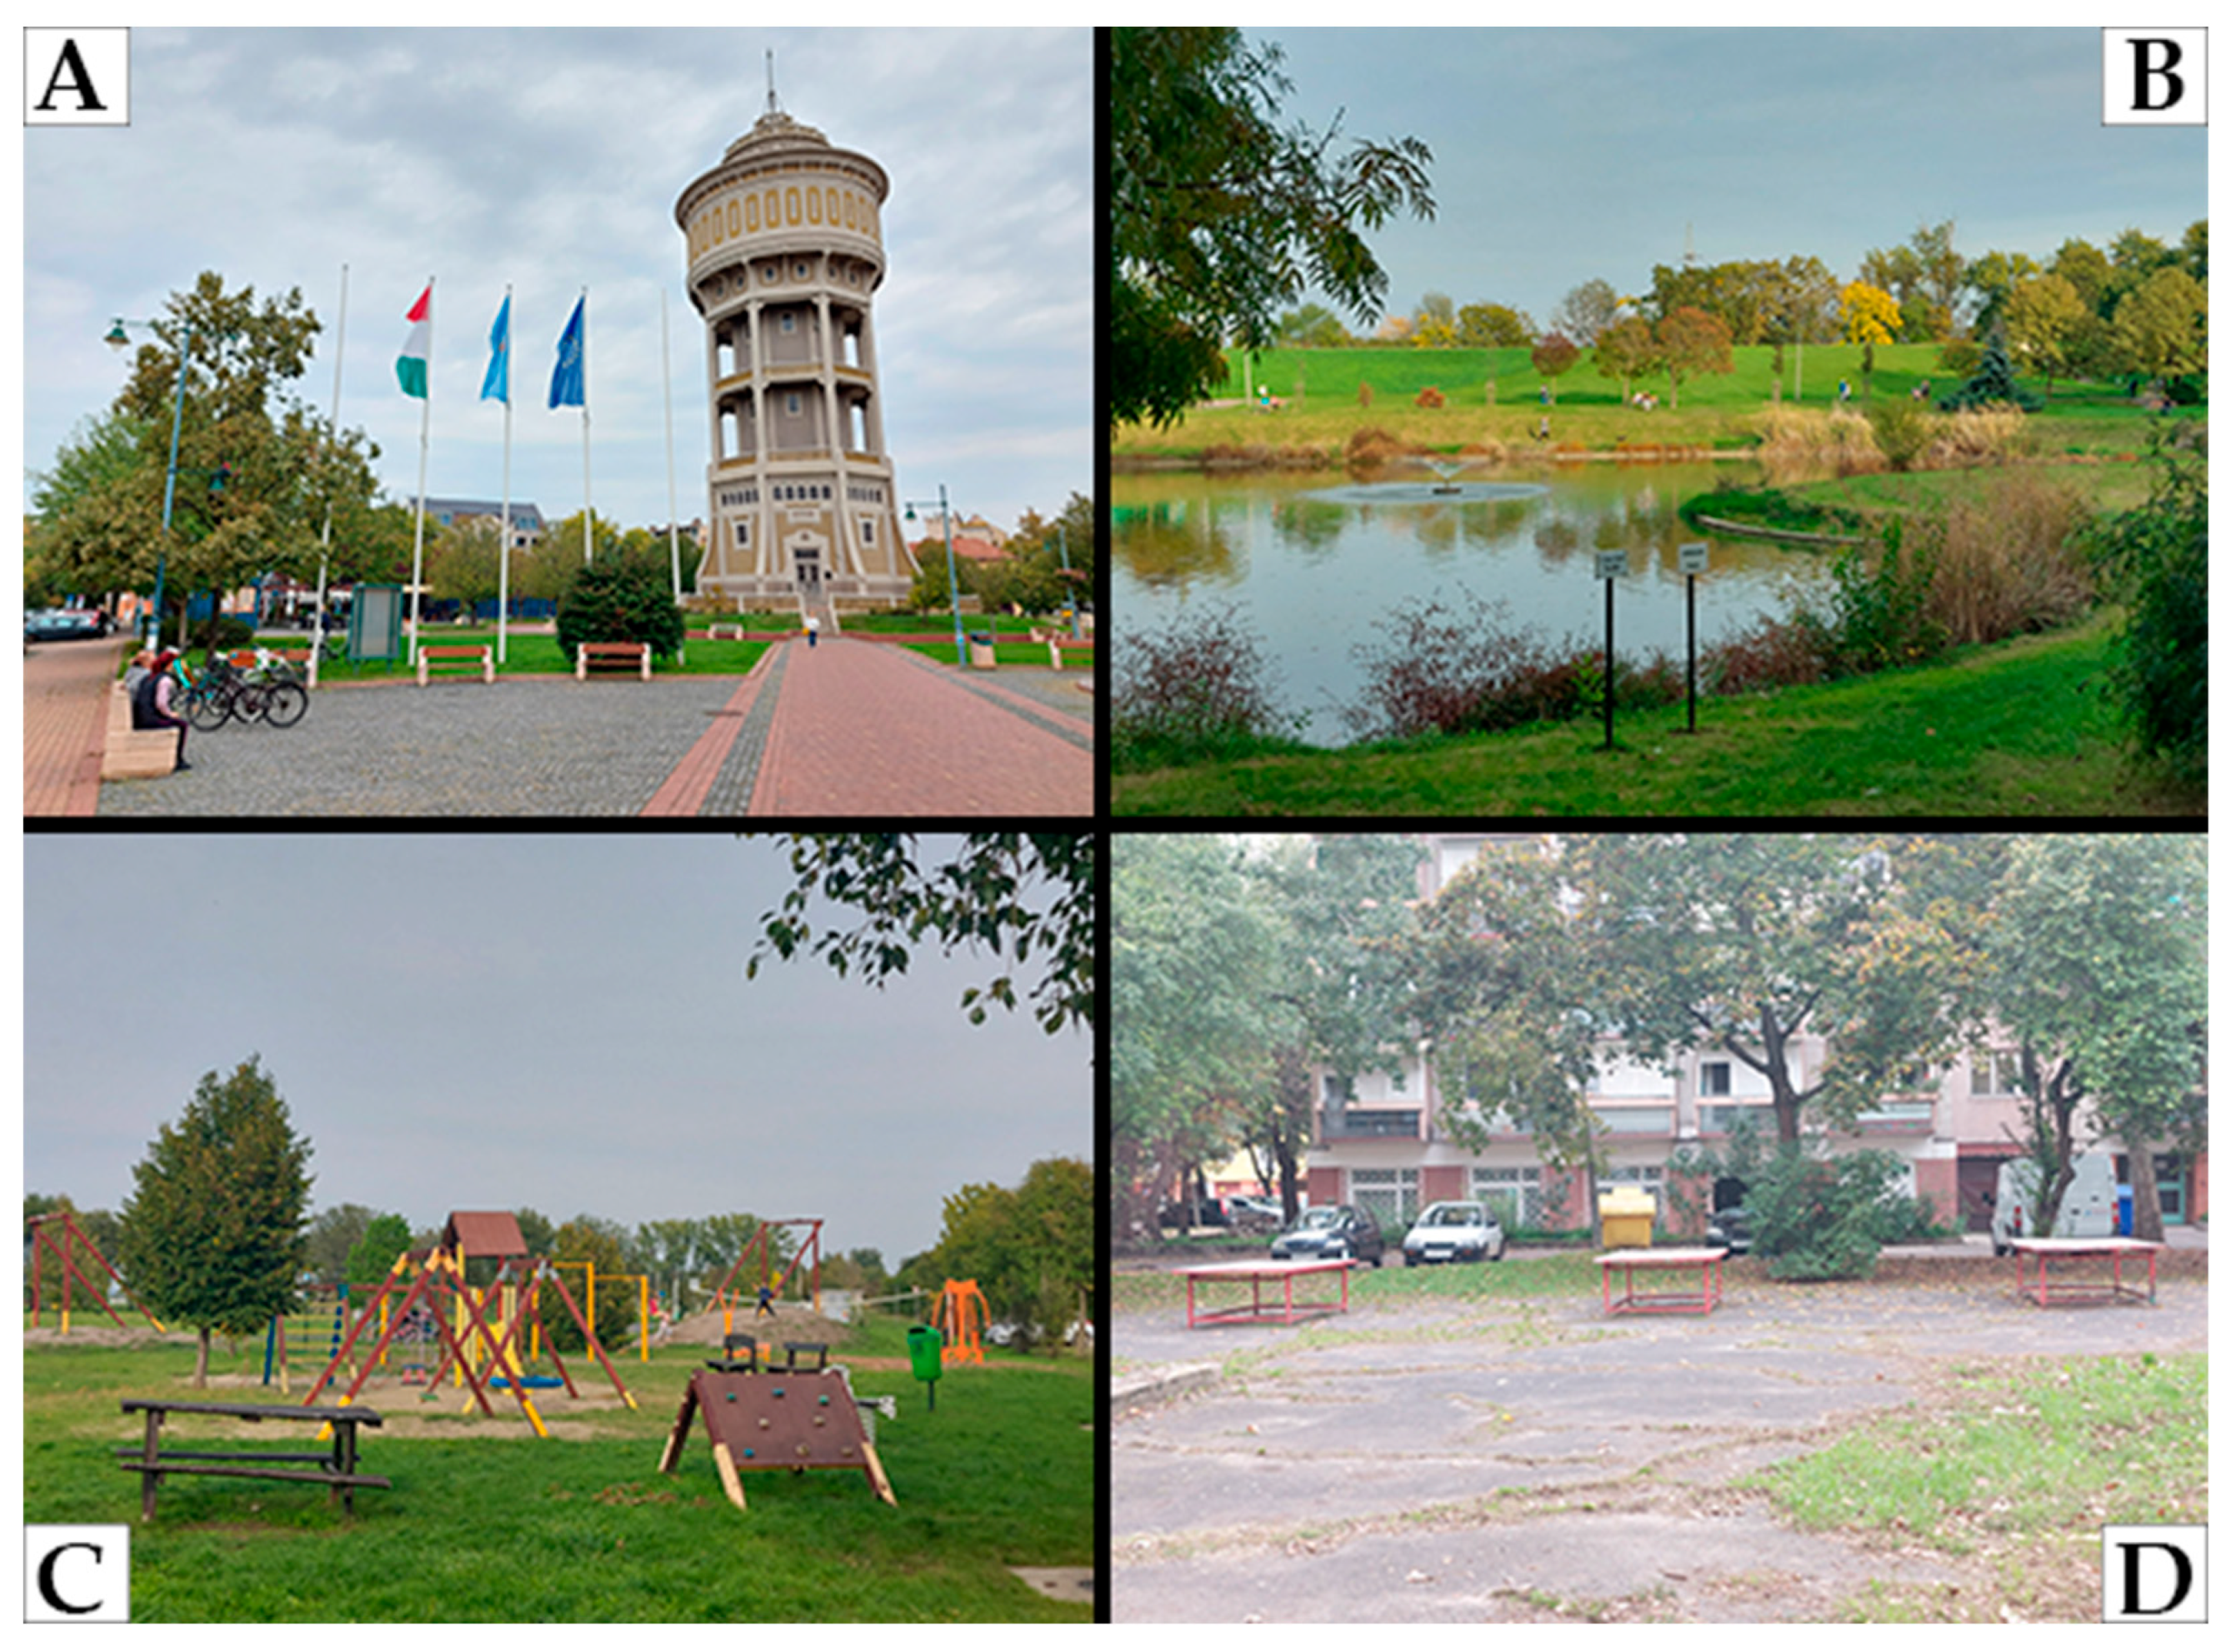
The five least-visited sample areas, with the lowest CES values, were categorized as informal green spaces (Figure 6). While the environmental quality was average, all other assessed indicators were below average. These areas are defined by minimal human maintenance and disinvestment, allowing natural processes to dominate their condition [103]. This is supported by the evaluation of 36 CES criteria, in which only canopy cover (providing shade) scored above average. Low CES values are reflected in limited visitation and a diminished sense of safety. As a result, relatively few children or young adult visitors (30%) or those arriving alone (24%) were recorded in these areas. Improving safety, facilities, and the range of possible activities is essential for encouraging wider use. Moreover, from an environmental justice perspective [104], it is a critical urban development challenge to identify neighbourhoods where similarly low CES-providing green spaces are concentrated. Perceived safety is also an important problem in the case of informal urban green spaces. If the citizens label a place as (potentially) dangerous, they would rather not use or visit them, which can create green space disparities, even if on paper, there are urban green spaces in the neighbourhood. Hence, the most important investments in these green areas should be the ones enhancing perceived safety, for example, by installing lighting in order to eliminate dark road sections at night.

4.2. Understanding the Investment Differences of Urban Green Spaces

Although the potential cultural ecosystem service clustering led to significant results, we highlight the need to compare these to the visitor numbers and neighbourhood qualities of each sample area to understand the investment and management processes resulting in the given CES values. The potential cultural ecosystem services are heavily tied to the investment/disinvestment practices, which are determined by the decision-making power of the residents in the neighbourhoods surrounding each green space.
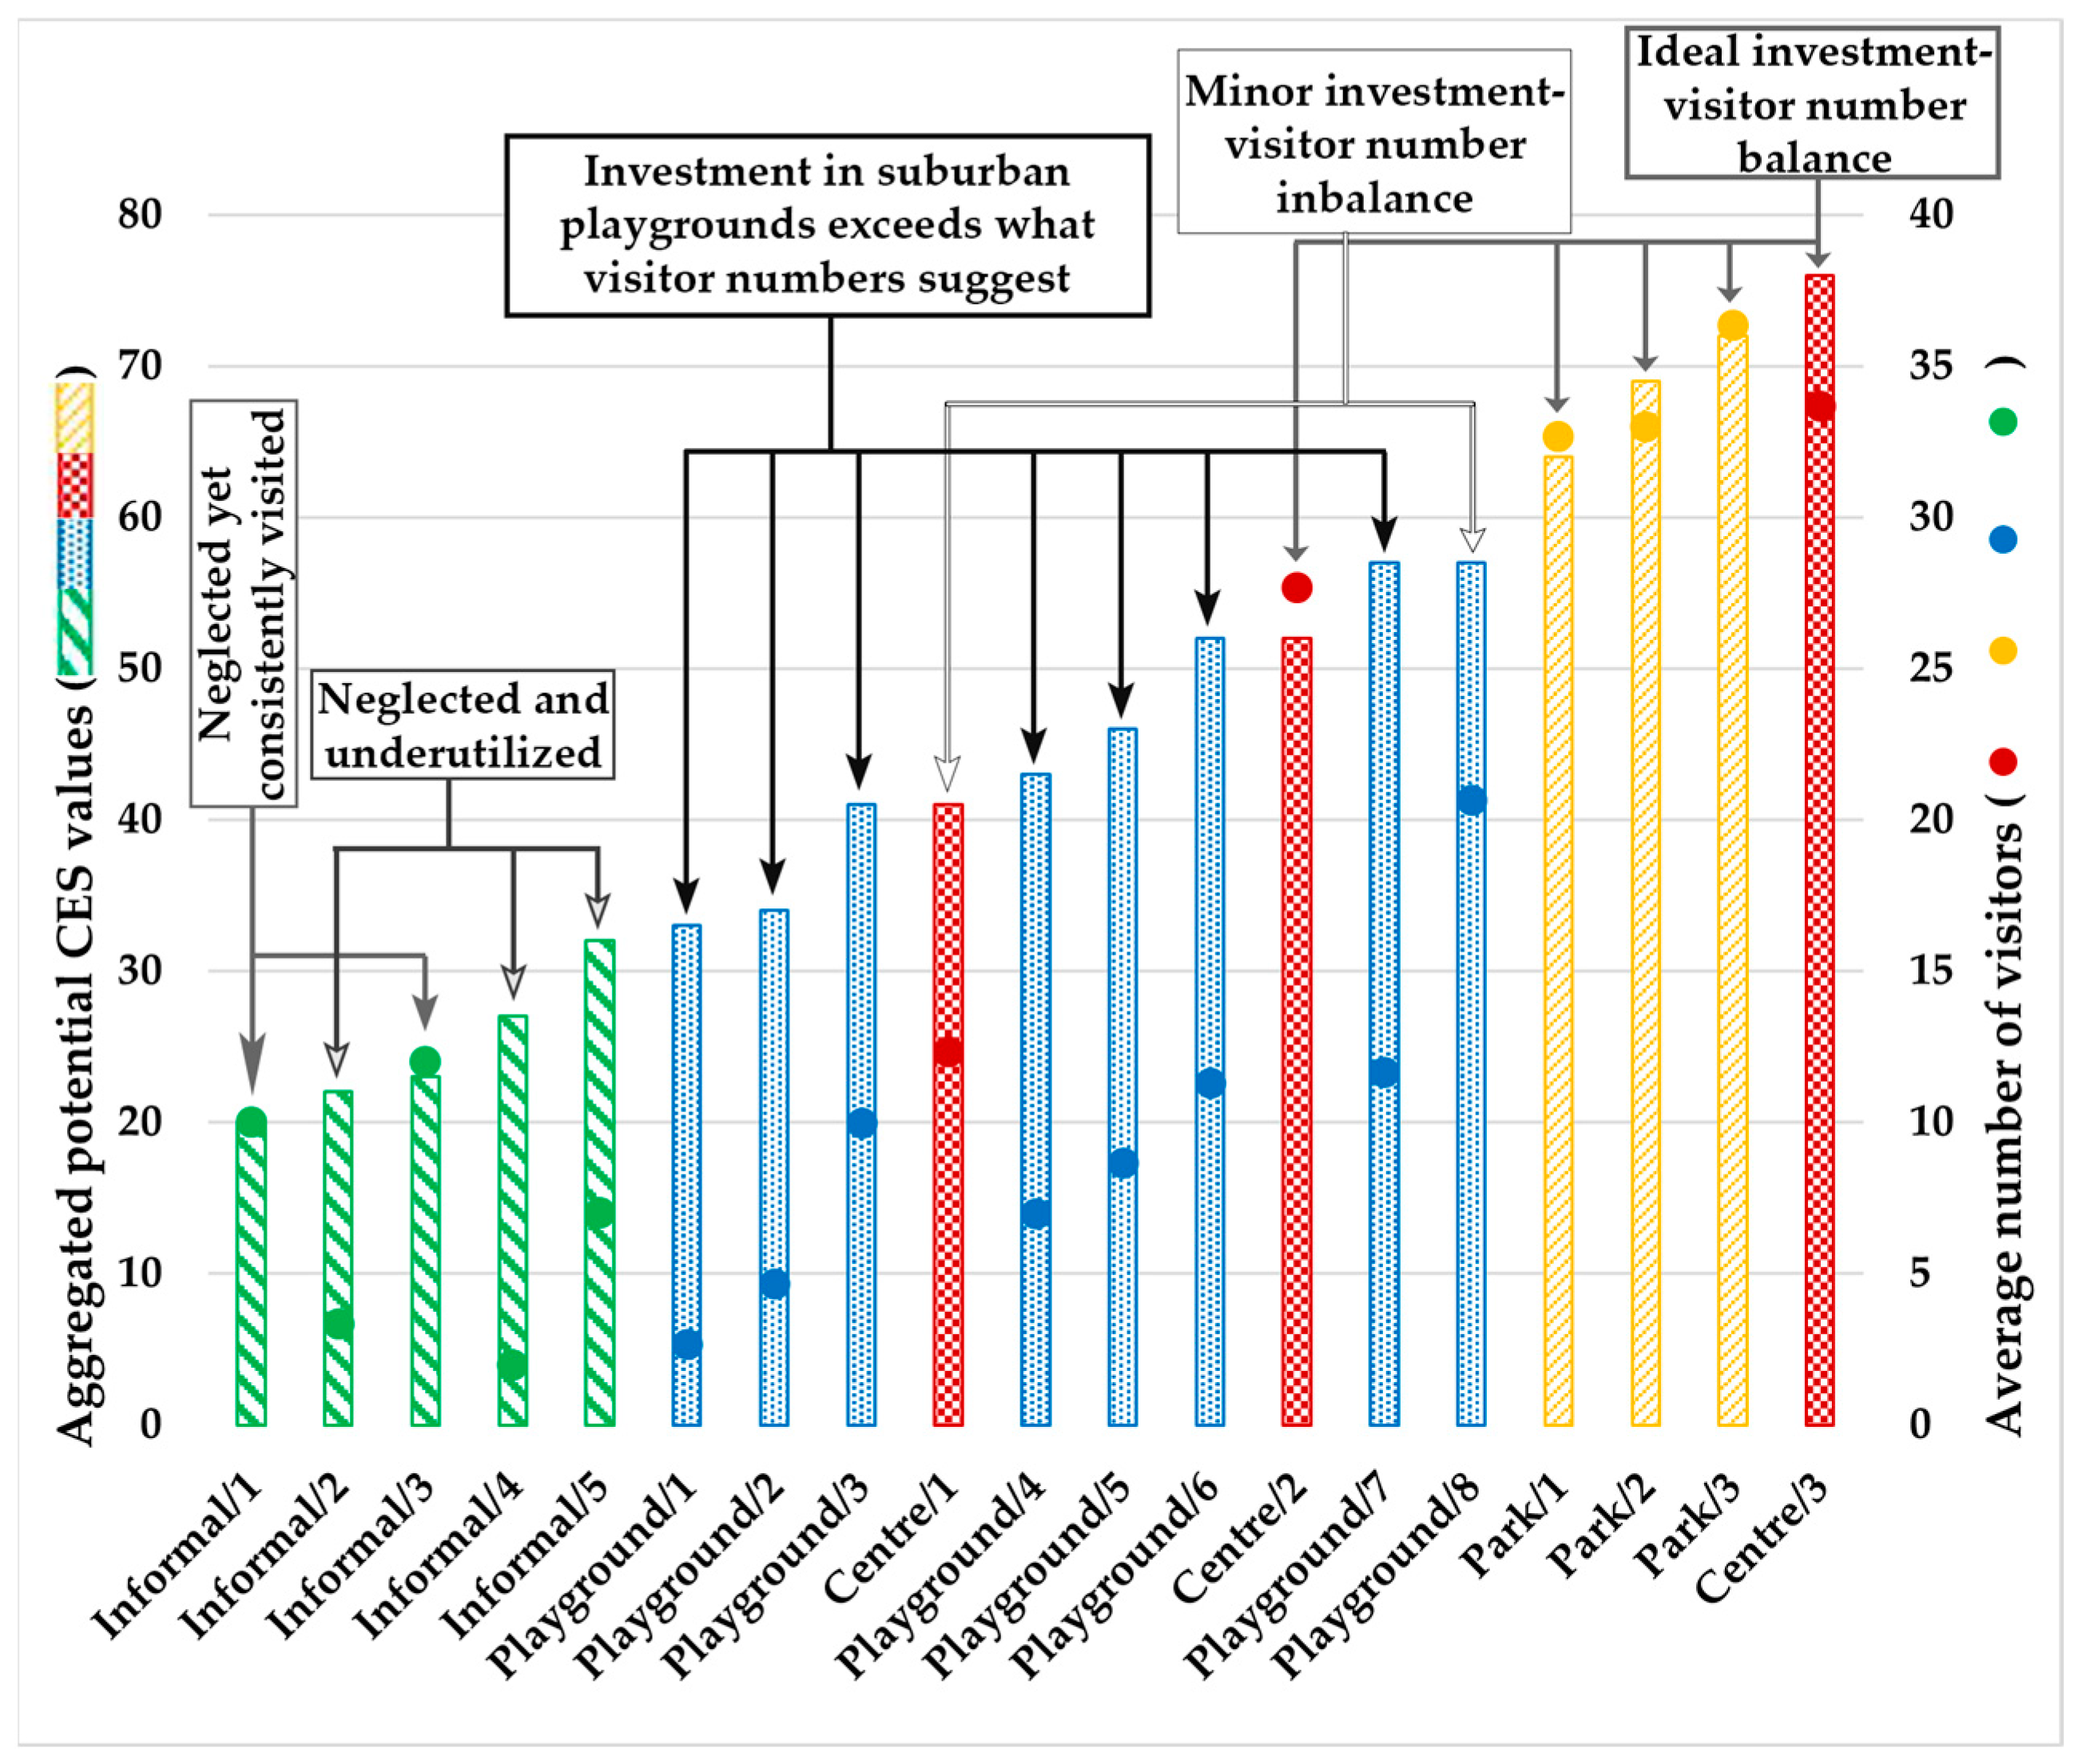
There are green spaces that are balanced regarding their potential CES values and visitor numbers, but these are usually the central parks of a district or city centre squares with high values in both regards. However, the informal green spaces are the ones with the lowest amount of potential CESs—which can be interpreted as neglected, disinvested places—with low visitor numbers apart from two cases (Informal/1 and Informal/2). The latter two are the most interesting ones, because they have above-average visitor numbers, which match the usage rates of many suburban parks that have higher potential CES values. The suburban parks are also unique in this regard, because the relatively high amount of investment and potential CES values struggle to turn into actual cultural ecosystem services and frequent users (Figure 7). However, these can also be understood as neighbourhoods whose residents can influence decision-makers to improve the quality of green spaces despite their underutilization.
The quality and quantity of green spaces in an area are determined by two factors: on one hand, the type of the urban fabric, which is related to zoning and the people living inside these houses, and on the other hand, the amount of invested capital in the neighbourhood. The latter is affected by the decision-influencing power of the residents and stakeholders. This is where a critical comparative analysis and the concept of environmental injustices become important, allowing us to interpret what leads to the investment differences and how it affects the residents.
To uncover the possible environmental injustices, we must highlight that there are fewer people living in the suburban residential districts around the suburban playgrounds than in the socialist housing estates. This is worsened by the fact that most of the detached family houses have their own gardens, while the people living in panel flats only have access to the public urban green spaces. This creates a situation where the amount of accessible green space for one person is much higher in the suburban areas than in the socialist housing estate districts. This finding has been uncovered before [30,102,105]; however, we are able to add a new layer to this phenomenon. Based on our results, suburban residents not only have access to relatively more green space, but those UGSs are of a higher quality and provide more potential ecosystem services. We could argue that they offer more than enough, because they do not turn into actual services if we look at the low visitor rates. On the other hand, people living in large housing estates not only have access to relatively less green urban areas [30], but according to our results, those spaces are usually less maintained, less safe, and provide less potential cultural ecosystem services. This situation can be understood as an environmental injustice, negatively affecting the health and well-being of many residents, while simultaneously reducing their property value. However, this is more complex than only being a distributional injustice. It is also a recognitional injustice that these inequalities are not addressed formally by the municipality or the local authorities. Moreover, this can also be seen as a procedural injustice, because the key aspect of how these inequalities are (re)created and preserved lies in the decision-making process of the local green space management authority. In Hungary, urban green space management is the task of municipal authorities, which manage them in a top-down, policy-led way. But due to the shortage of their human and financial resources, these authorities are struggling. As a result, they have to choose between maintaining certain green spaces and neglecting others. The resulting green space diversity is not inherently a problem; the big issue is rather the tendencies that we examined regarding which neighbourhoods have well-maintained and culturally rich green spaces, and which neighbourhoods lack these features. This can be tied to the concept of investment/disinvestment and the uneven territorial development aspect of capitalism. Also, this can be viewed as a disinvestment process leading to environmental injustices.

4.3. The Power of Bottom-Up Initiatives on an Example of Informal Greenspace

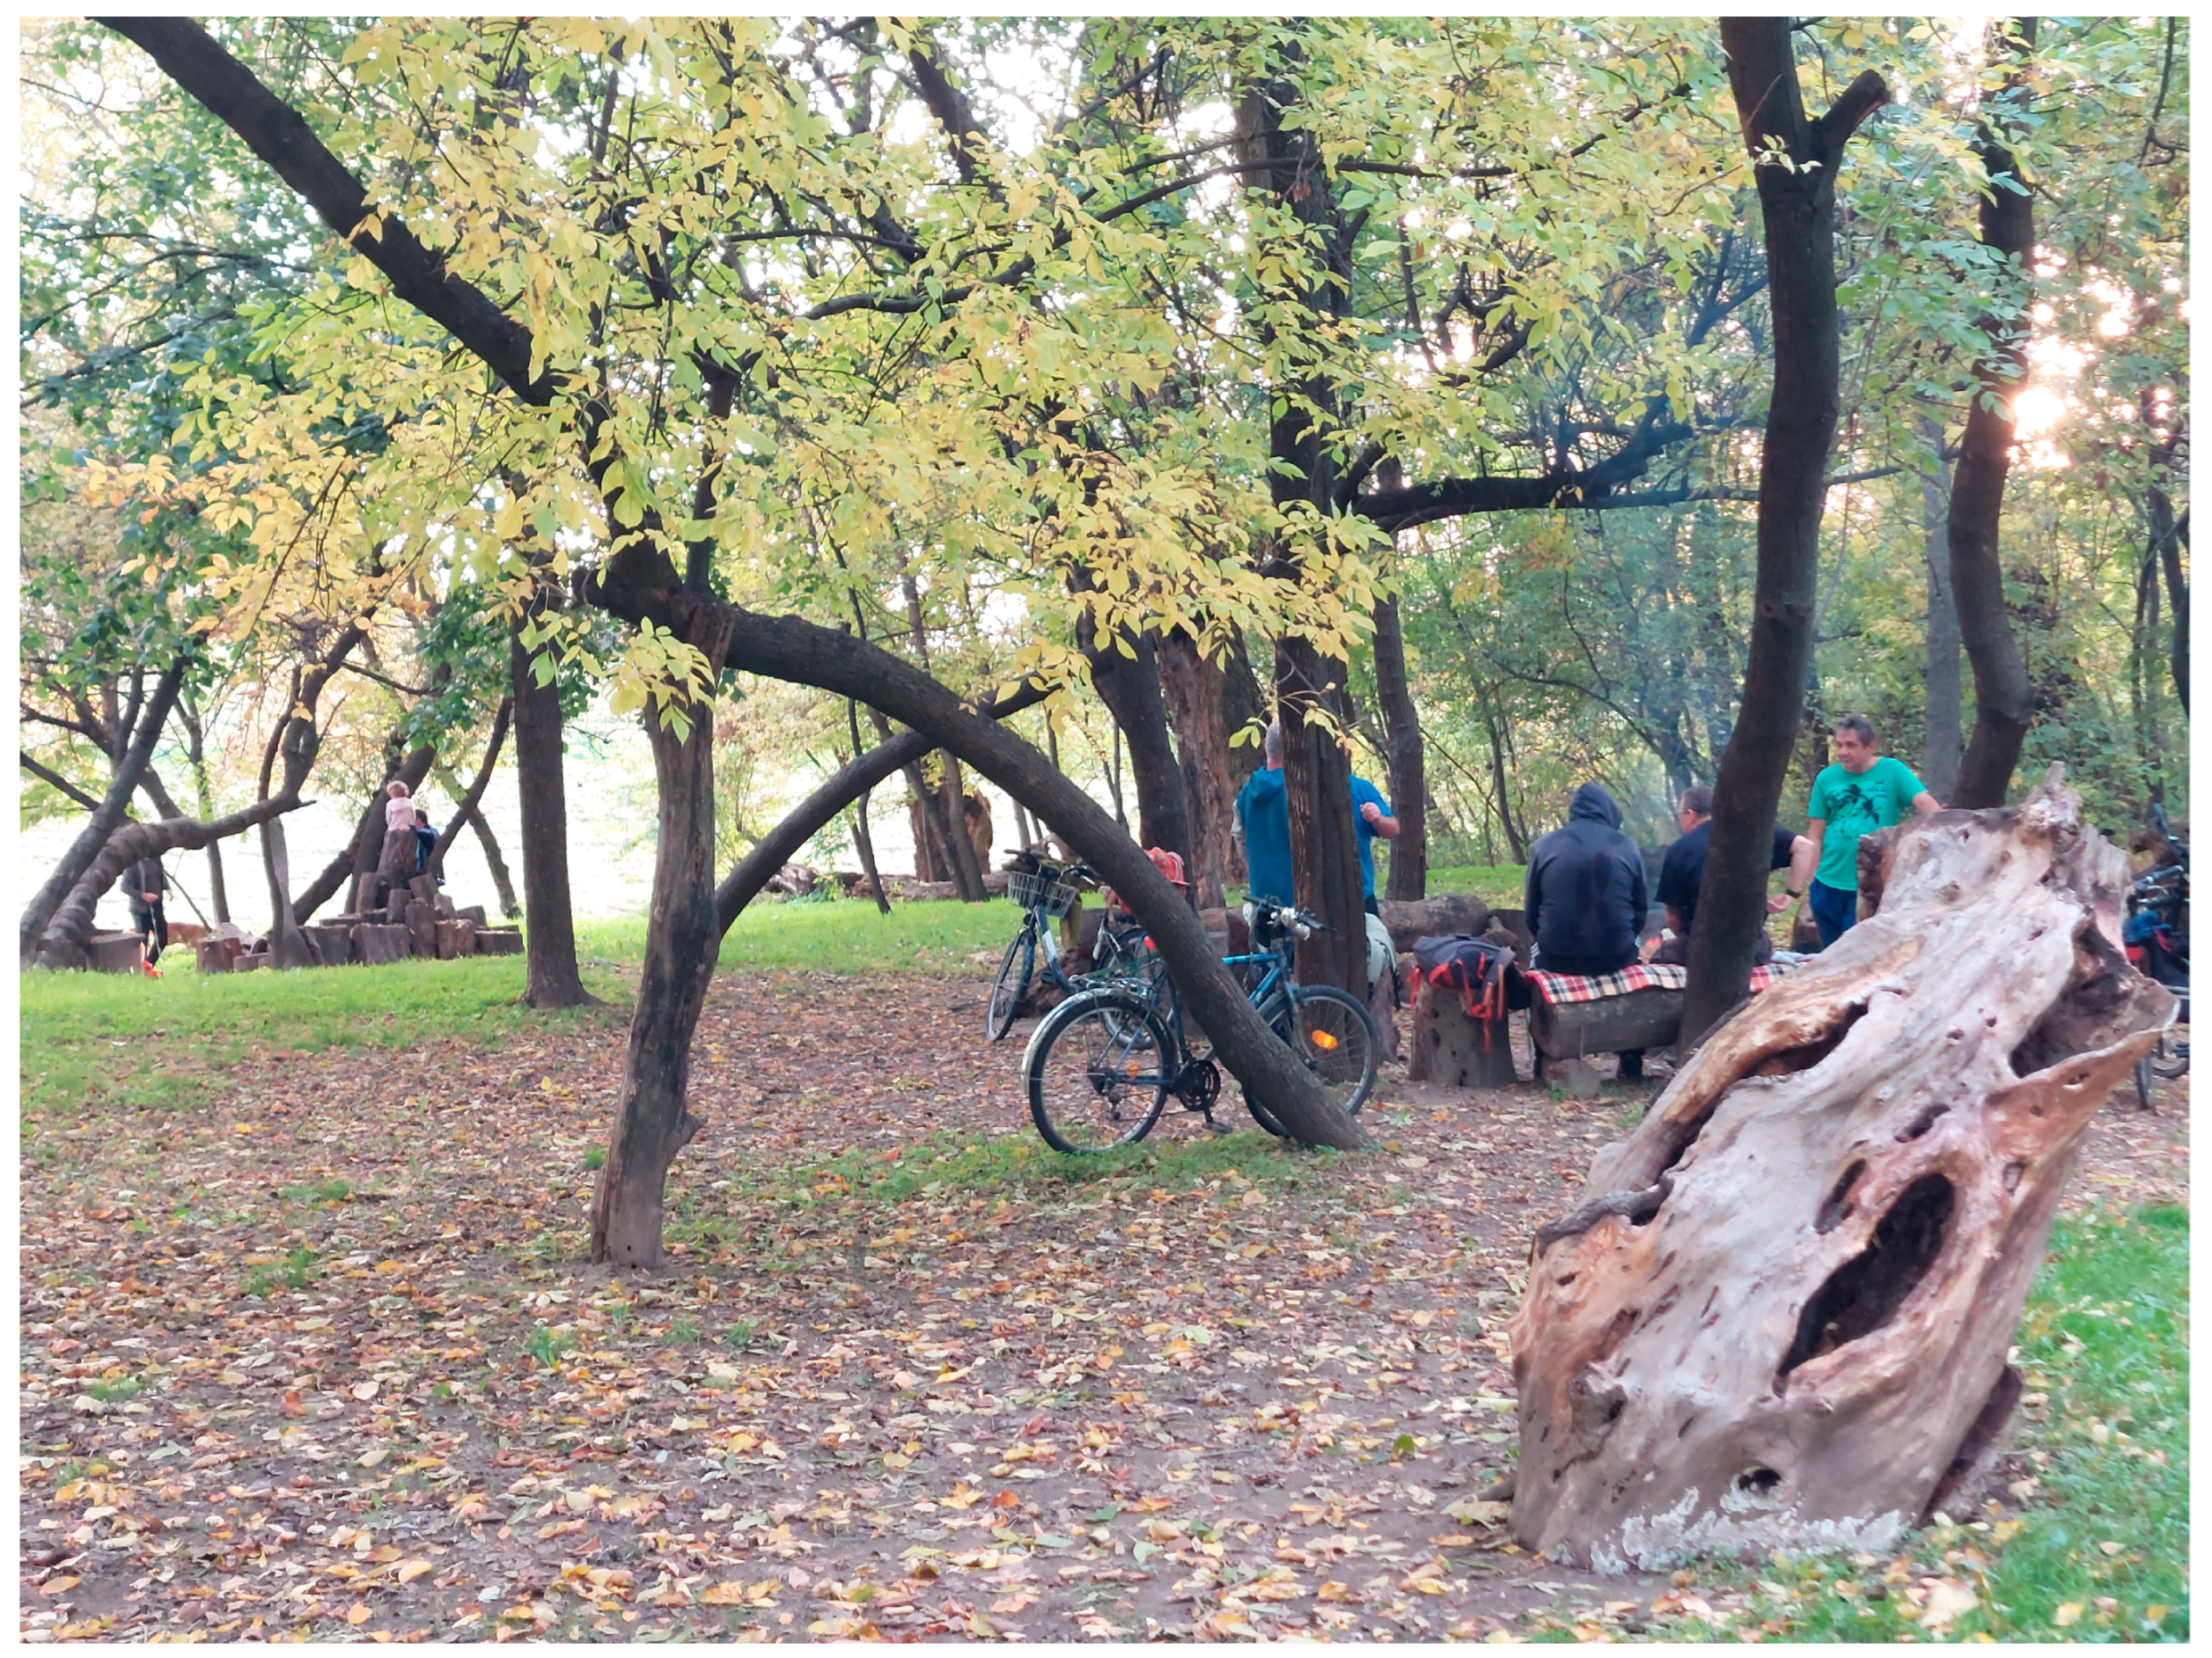
To combat the highlighted environmental injustices, residents need to realize that they cannot just be the users of their green spaces; they need to also act as maintainers and the voices of the non-human elements in decision-making. This can be achieved with the utilization of nature-based solutions and participatory, bottom-up planning and management practices. These solutions fit the embracing of informal or “semi-informal” urban green spaces. There are increasing examples of tactical urbanism practices [106], like guerilla gardening [107] or community waste collecting programs globally, which can be key in overcoming disinvestment and neglect by the formal authorities. However, out of the 19 sample areas, we only found one example of a movement like this, in the case of “Informal/3”, which is also known as Gergő-liget. This floodplain urban forest was converted into a formal green space by a resident, who maintained the park with the help of a local non-governmental organization. The latter consisted of the leading entrepreneurs and stakeholders of Szeged, most of whom lived in the nearby residential district. However, despite the efforts of these highly influential actors, the site manager decided to discontinue maintenance of the Gergő-liget a few years ago. This was primarily due to a high number of adverse external impacts; both anthropogenic (e.g., littering, vandalism) and natural (e.g., flooding of the nearby river). As a result, the originally formal greenspace underwent a substantial shift towards a more informal and wilderness-like character. Nevertheless, this condition did not persist for long. The local community recognized the importance of preserving the green space and, through a bottom-up initiative, established a new association to assume responsibility for its upkeep. The newly formed managing body, later joined by the original manager, soon realized that maintaining a formal green space entailed considerably higher costs compared to an informal one. Consequently, they did not attempt to restore elements traditionally associated with formality (such as benches or bins). Instead, the Gergő-liget is managed predominantly as an informal green space (Figure 8), with occasional community-driven activities such as litter collection events. These positive human interventions have played a key role in maintaining the condition of the area, while also including key nature-based solutions to lower the maintenance needs. Moreover, it is essential to highlight that the bottom-up approach was facilitated by a Facebook group consisting of the citizens of the nearby high-class residential neighbourhood. This case study serves as an exemplary model of effective community-based green space management, demonstrating the viability and benefits of participatory urban environmental stewardship. Moreover, the city’s residents highlighted in Szeged’s first citizen assembly that they need more initiatives and green spaces like the Gergő-liget.

5. Discussion and Conclusions

The aim of this study was to cluster urban green spaces based on their potential cultural ecosystem services and comparatively analyse their investment–disinvestment trends. Out of the identified 269 urban green spaces, we selected 19 sample areas in Szeged, based on territorial and functional criteria. We conducted three field observations in each of the sample areas to assess their potential cultural ecosystem services and visitation patterns. The sample areas were evaluated on a total of 36 criteria, and the quantitative data was analysed using principal component and factor analysis-based clustering. By implementing the framework of environmental injustices, we critically examined the potential factors behind the management and investment differences of urban green spaces.
Regarding our results, we defined four main urban green space clusters: city centre squares, suburban playgrounds, central parks, and informal green spaces. Their differences in the potential CES values significantly influence the usage patterns and are the indicators of investment inequities. The value of the clustering methodology was showcased in a way that prevented us from only thinking in a dichotomy of highly invested or disinvested green spaces during the comparative analysis. Additionally, this method helped in outlining green space groups such as suburban playgrounds, which are in multiple districts; however, these green spaces still show significant similarities regarding their potential CES values and visitor numbers. The latter two attributes played a crucial role in uncovering investment and management differences amongst the green spaces and their clusters. Moreover, we were able to shed light on green space quality-related environmental injustices. These are significantly connected to the post-socialist characteristics of certain districts; hence, there is a high chance that these injustices can be observed in other Central and Eastern European cities as well. To understand the methods of combating these injustices, we highlighted the case study of Gergő-liget, a community-managed informal green space that utilizes nature-based solutions and the active, bottom-up participation of the local community. However, it is important to notice that these citizens mostly live in the nearby high-class residential area. Hence, it is unclear whether other neighbourhoods, whose inhabitants have fewer personal resources, could successfully implement this management method, despite the recommendation for implementation by Szeged’s citizen assembly.
As part of the conclusions, we highlight the importance of reflecting on the differences in investment values and potentials of different urban green space types, even though the focus of this paper is not on providing an exact monetary evaluation. City centre squares in Szeged have a long, historical tradition of maintenance and development; hence, these green spaces can be viewed as the ones with the highest overall investment values. As a result of their rich cultural ecosystem services, these UGSs significantly contribute to the surrounding property values. The same can be stated about central parks, which often serve as flagship projects with high investment values despite the underdevelopment of the district in which they are located. By contrast, suburban playgrounds, which can play a crucial role in forming neighbourhood-level communities, often suffer from functional limitations, despite their high development potential. The most important goal of investing in these UGSs would be to broaden their functions and facilities, to foster more activities. This could happen either by the local stakeholders convincing the municipality to make further investments and developments, or by implementing community or private capital with a public–private partnership model. Informal green spaces are the most underdeveloped UGSs with low CESs and investment values, resulting in limited usage. However, due to their accessibility and often higher potential in other ecosystem service domains, they offer a significant opportunity for investments that could enable community-oriented transformation. Hence, although informal green spaces lack the investment values that can be observed in the case of city centre squares or central parks, they are the ones with the highest potential for future developments and investments.
To expand more on the idea that there is a high chance that other Central and Eastern European cities could experience similar green space investment processes as Szeged, we highlight the importance of placing our findings in the global scholarly canon of ecosystem service and urban green space research. Regarding the latter, our findings fit into the recent trends highlighted by Farkas et al., as urban green space research focuses more on the social aspects of inner urban areas rather than the ecological aspects of urban forests [13]. This trend is prominent in Europe, especially in Central and Eastern Europe, where our study took place. Case studies that have examined urban green spaces in the region [30,108] or have compared them to Western European UGSs [109] have highlighted the effect of the socialist era on the current green space management trends [13,18]. We reinforce the importance of historical background in present-day UGS investment and management processes, as we observed these in the green spaces of Szeged. Moreover, when comparing our results to other case studies, we must mention the work of Vidal et al. in Porto, which provided the starting point for our methodology. Although we have modified and repurposed certain aspects of the observation tool, we can still compare the findings of the two studies. These showcase similarities regarding the appearance of urban green spaces that have discrepancies between their social and environmental empowerment. The significant difference between the green space clusters of the two cities is the value of activities performed, which is low in each case in Szeged. At the same time, Porto has some positive examples in this regard [87]. Based on these findings, we reinforce what previous studies [74] have already highlighted: that cultural context and the local social attributes play a crucial role in the evaluation of cultural ecosystem services. However, we argue that there is another reason behind the generally low activity values of the UGSs of Szeged. The rapid privatization and commercialization of urban green spaces in the past 30 years have led to overregulated public spaces. These often thrive regarding their security, facilities, or environmental quality, but at the trade-off of the diversity of activities becoming more regulated and narrower. This can be observed in all three aspects of environmental justice: the low number of truly freely usable UGSs as a distributive injustice; the alternative usage needs being overlooked as a recognitional injustice; the omission of particular user groups from the green space planning process as a procedural injustice. Complex everyday UGS-related environmental injustices are common in post-socialist cities and have already been discussed in a review by Kronenberg et al., which we have reinforced and expanded, mainly by connecting the attractiveness dimension [18] with the concept of cultural ecosystem services (Table 3).
Urban green spaces can be viewed as a sub-group of public spaces; hence, UGSs can be seen as a space of representation [24,110]. Connecting to this discourse, based on our results, an evident follow-up question could be how well urban green spaces and their potential cultural ecosystem services represent the investment/disinvestment tendencies of their neighbourhoods. To answer this question, a separate study could be made with additional data gathering methods, especially because our current findings show mixed results. There were green space clusters that represented their surrounding urban fabric, such as city centre squares or suburban playgrounds. The unique attributes of their districts’ urban morphology and their residents led to significant similarities. However, the clusters with the lowest and highest values (central parks and informal green spaces) can be observed in multiple districts with different morphological characteristics. This leads to the critical assumption that almost every district can have green spaces with extremely high or low potential CES values; the critical aspect is which types are dominating the neighbourhood: high-quality parks and squares, well-maintained playgrounds, or neglected informal green spaces.
We must address several limitations of our research, which influence the generalisability of the findings. First of all, a key limitation of this paper lies in its reliance on short-term visitor counts as the primary metric, which may introduce measurement bias. The latter can also be said about our primary data gathering method: field observations inevitably contain a certain level of subjectivity, which we tried to minimize with the use of pre-made data sheets. Nevertheless, the findings of this experimental case study reveal consistent tendencies that could serve as a foundation for future research focusing on urban green spaces, their ecosystem services, and the environmental injustices related to these. To enhance the validity of our findings, it would be valuable to compare our empirical results to the green spaces of other cities, both in Central Europe and from outside the region. Moreover, as we have highlighted, Szeged has 269 green spaces, and we observed only 19 of them; thus, the assessment of other sample areas from Szeged could also be beneficial. Additionally, a significant improvement and validation tool for our findings could be achieved by combining the field observation results with other data gathering methodologies. There are multiple directions for this, and a statistical–economic land value change analysis could help in increasing understanding of the investment values of the neighbourhoods surrounding the green space [17]. On the other hand, empirical questionnaires or interviews would provide a deeper understanding of how residents value a green space and its ecosystem services [56,111,112]. Finally, another improvement could be to integrate geographic information system (GIS) methods not just into the selection process of the sample areas, but also into the evaluation of usage rates and location of ecosystem services [109]. The GIS-based green space accessibility studies are especially prominent in China [13], but have already also appeared in Central European, Hungarian research, which has already examined Szeged in this regard [30,102,105]. In our study, we implemented GIS methods into the selection process of the sample areas, but we also highlight the necessity of integrating GIS methods into environmental justice-focused studies [109] as an exciting future research direction.
To conclude our study, we argue that the well-being and life quality of urban residents are heavily influenced by the management practices of the green spaces in their neighbourhood, as informed by the implementation of the environmental injustice framework. Through a critical comparative analysis, we highlighted case studies of urban green spaces located in different neighbourhoods and used by groups that have significantly different powers to influence the decisions of the green space management authorities. However, there is a way of combatting these multi-level environmental injustices, which is implementing bottom-up maintenance practices with the use of nature-based solutions. The latter can be useful and beneficial in the case of the neglected and underutilized informal urban green spaces, which commonly occur in between the socialist housing estates, creating multi-level environmental injustices for many residents. Finally, we emphasize that cultural ecosystem service research needs to evolve in a way that is better suited for practical urban planning and development application [12], as illustrated by our example of connecting it to investment and management processes.

Author Contributions

Conceptualization, N.Z.T., G.N. and L.B.; methodology, N.Z.T.; validation, G.N. and L.B.; formal analysis, N.Z.T., G.N. and L.B.; investigation, N.Z.T.; data curation, N.Z.T.; writing—original draft preparation, N.Z.T., G.N. and L.B.; writing—review and editing, N.Z.T., G.N. and L.B.; visualization, N.Z.T.; supervision, G.N. and L.B.; project administration, G.N.; funding acquisition, G.N. and L.B. All authors have read and agreed to the published version of the manuscript.

Funding

This research was supported by the European Union project H2020-LC-GD-2020-4/PHOENIX–101037328. Project no TKP2021-NVA-09 was implemented with support provided by the Ministry of Culture and Innovation of Hungary from the National Research, Development and Innovation Fund, financed under the TKP2021-NVA funding scheme and funded by the Research Fellowship Program (Code: 2024-2.SZTE-468) of the Ministry of Culture and Innovation from the National Fund for Research, Development and Innovation.

Conflicts of Interest

The authors declare no conflicts of interest. The funders had no role in the design of this study; in the collection, analyses, or interpretation of data; in the writing of the manuscript; or in the decision to publish the results.

Abbreviations

The following abbreviations are used in this manuscript:
CESsCultural ecosystem services
ESsEcosystem services
GISGeographic information system
MEAMillennium Ecosystem Assessment
UGSUrban green space

Appendix A

Table A1. The 36 potential cultural ecosystem service variables are based on the work of Vidal et al. [87]. During the field observation, we evaluated every variable on a four-point scale: absent (0), low (1), medium (2), and high (3) presence.
DimensionName
Activities
performed
Sport activities
Table games
Theatres activities
Civic meetings, festivals, or concerts
Traditional fairs
Religious gatherings
Environmental education activities
Environmental qualitySurrounding area
Signs of vandalism
Heritage or artistic elements
Paths
Bike paths
Grove density
Shaded spaces
Urban furniture maintenance
Green infrastructure maintenance
Cleaning
Blue spaces
FacilitiesCentres or environmental education activities
Playgrounds
Car park or nearby parking
Public transport
Leisure spaces
Containers for animal waste
Water sources for animals
Water sources for humans
Cultural and/or recreational equipment
Cafes/bars/restaurants
Public toilets
Accessibility for people with disabilities and/or reduced mobility
SecurityVisibility to the streets that surround the green space
Visibility to the houses that surround the green space
Areas of little visualization
Adequate infrastructure for physical/sports activity
Lighting
Vigilance
Table A2. The variables were recorded on the visitor data sheet during the field observations.
CategoryVariable
General dataName of the sample area:
Date and time of the observation:
Type of the weather: sunny/windy/cloudy/rainy
Temperature (°C):
Activities performed by the visitorsNumber of visitors performing physical activities:
Number of visitors performing social activities:
Number of visitors performing nature-related activities:
Number of visitors attending alone:
Number of visitors attending as part of a group of people:
DemographicsNumber of female visitors:
Number of male visitors:
Number of children visitors:
Number of young adult visitors:
Number of middle-aged adult visitors:
Number of late middle-aged adult visitors:
Number of elderly visitors:

Appendix B

Table A3. The clustering results (Source: own editing).
Sample AreasBased on the 36 Variables Aggregated into 4 Categories, with Ward’s Hierarchical MethodBased on 36 Variables, with Ward’s Hierarchical Clustering Based on 7 Principal Components, with Ward’s
Hierarchical Method
Based on 4 Factors, with Ward’s
Hierarchical Method
Based on 4 Factors, with
K-Means Method
Centre/114224
Centre/214222
Centre/314312
Informal/121143
Informal/221143
Informal/321143
Informal/421143
Informal/521143
Playground/132222
Playground/232224
Playground/332224
Playground/432222
Playground/532222
Playground/632324
Playground/732212
Playground/832212
Park/143331
Park/243331
Park/343331

References

  1. United Nations. 2018 Revision of World Urbanization Prospects. New York, 2018. Available online: https://www.un.org/en/desa/2018-revision-world-urbanization-prospects (accessed on 7 July 2025).
  2. Lopes, H.S.; Vidal, D.G.; Cherif, N.; Silva, L.; Remoaldo, P.C. Green infrastructure and its influence on urban heat island, heat risk, and air pollution: A case study of Porto (Portugal). J. Environ. Manag. 2025, 376, 124446. [Google Scholar] [CrossRef]
  3. Gozalo, G.R.; Morillas, J.M.B.; González, D.M. Perceptions and use of urban green spaces on the basis of size. Urban For. Urban Green. 2019, 46, 126470. [Google Scholar] [CrossRef]
  4. Giles-Corti, B.; Broomhall, M.H.; Knuiman, M.; Collins, C.; Douglas, K.; Ng, K.; Lange, A.; Donovan, R.J. Increasing walking: How important is distance to, attractiveness, and size of public open space? Am. J. Prev. Med. 2005, 28, 169–176. [Google Scholar] [CrossRef]
  5. Kántor, N.; Unger, J.; Gulyás, Á. Subjective estimations of thermal environment in recreational urban spaces—Part 2: International comparison. Int. J. Biometeorol. 2012, 56, 1089–1101. [Google Scholar] [CrossRef]
  6. One Health High-Level Expert Panel (OHHLEP); Adisasmito, W.B.; Almuhairi, S.; Behravesh, C.B.; Bilivogui, P.; Bukachi, S.A.; Casas, N.; Becerra, N.C.; Charron, D.F.; Chaudhary, A.; et al. One Health: A new definition for a sustainable and healthy future. PLOS Pathog. 2022, 18, e1010537. [Google Scholar] [CrossRef]
  7. Bruno, A.; Arnoldi, I.; Barzaghi, B.; Boffi, M.; Casiraghi, M.; Colombo, B.; Di Gennaro, P.; Epis, S.; Facciotti, F.; Ferrari, N.; et al. The One Health approach in urban ecosystem rehabilitation: An evidence-based framework for designing sustainable cities. iScience 2024, 27, 110959. [Google Scholar] [CrossRef]
  8. Castañeda, N.R.; Pineda-Pinto, M.; Gulsrud, N.M.; Cooper, C.; O’dOnnell, M.; Collier, M. Exploring the restorative capacity of urban green spaces and their biodiversity through an adapted One Health approach: A scoping review. Urban For. Urban Green. 2024, 100, 128489. [Google Scholar] [CrossRef]
  9. Aronson, M.F.; A Lepczyk, C.; Evans, K.L.; A Goddard, M.; Lerman, S.B.; MacIvor, J.S.; Nilon, C.H.; Vargo, T. Biodiversity in the city: Key challenges for urban green space management. Front. Ecol. Environ. 2017, 15, 189–196. [Google Scholar] [CrossRef]
  10. Grammatikopoulou, I.; Vačkářová, D. The value of forest ecosystem services: A meta-analysis at the European scale and application to national ecosystem accounting. Ecosyst. Serv. 2021, 48, 101262. [Google Scholar] [CrossRef]
  11. Pukowiec-Kurda, K. The urban ecosystem services index as a new indicator for sustainable urban planning and human well-being in cities. Ecol. Indic. 2022, 144, 109532. [Google Scholar] [CrossRef]
  12. Tandarić, N.; Ives, C.D.; Watkins, C. Can we plan for urban cultural ecosystem services? J. Urban Ecol. 2020, 6, juaa016. [Google Scholar] [CrossRef]
  13. Farkas, J.Z.; Hoyk, E.; de Morais, M.B.; Csomós, G. A systematic review of urban green space research over the last 30 years: A bibliometric analysis. Heliyon 2023, 9, e13406. [Google Scholar] [CrossRef]
  14. Chen, S.; Wang, Y.; Ni, Z.; Zhang, X.; Xia, B. Benefits of the ecosystem services provided by urban green infrastructures: Differences between perception and measurements. Urban For. Urban Green. 2020, 54, 126774. [Google Scholar] [CrossRef]
  15. Cheng, X.; Van Damme, S.; Li, L.; Uyttenhove, P. Evaluation of cultural ecosystem services: A review of methods. Ecosyst. Serv. 2019, 37, 100925. [Google Scholar] [CrossRef]
  16. Dominici, A.; Sacchelli, S. Urban green infrastructure valuation: An economic method for the aesthetic appraisal of hedges. Aestimum 2024, 85, 3–19. [Google Scholar] [CrossRef]
  17. Cerovečki, M.T.; Stiperski, Z. The influence of urban green and recreational areas on the price of housing in Zagreb. Hung. Geogr. Bull. 2024, 73, 249–268. [Google Scholar] [CrossRef]
  18. Kronenberg, J.; Haase, A.; Łaszkiewicz, E.; Antal, A.; Baravikova, A.; Biernacka, M.; Dushkova, D.; Filčak, R.; Haase, D.; Ignatieva, M.; et al. Environmental justice in the context of urban green space availability, accessibility, and attractiveness in postsocialist cities. Cities 2020, 106, 102862. [Google Scholar] [CrossRef]
  19. Harvey, D. The Right to the City. New Left Rev. 2008, 53, 23–40. [Google Scholar]
  20. Peck, J.; Theodore, N.; Brenner, N. Neoliberal Urbanism Redux? Int. J. Urban Reg. Res. 2013, 37, 1091–1099. [Google Scholar] [CrossRef]
  21. Fanelli, C.; Paulson, J. Municipal Malaise: Neoliberal Urbanism and the Future of Our Cities. Bullet 2010, 357, 4–9. [Google Scholar]
  22. Aufseeser, D.; Mahmoudi, D. Interrogating narratives of urban change: Disinvestment and development in two neighborhoods in Baltimore, MD. Urban Geogr. 2024, 46, 589–611. [Google Scholar] [CrossRef]
  23. Raleigh, E.; Galster, G. Neighborhood Disinvestment, Abandonment, and Crime Dynamics. J. Urban Aff. 2015, 37, 367–396. [Google Scholar] [CrossRef]
  24. Boros, L.; Fabula, S.; Horváth, D.; Kovács, Z. Urban diversity and the production of public space in Budapest. Hung. Geogr. Bull. 2016, 65, 209–224. [Google Scholar] [CrossRef]
  25. TEIR. Available online: https://www.oeny.hu/oeny/teir/#/tablo/5 (accessed on 10 June 2025).
  26. Bajmócy, P.; Boros, L.; Csatári, B.; Dudás, R.; Farkas, Z.J.; Juray, T.; Kovács, Z.; Viktor, P. Managing the socio-econommic consequences of climate change. In Review of Climate Change Research Program at the University of Szeged; Rakonczai, J., Ladányi, Z., Eds.; University of Szeged: Szeged, Hungary, 2012; pp. 105–115. [Google Scholar]
  27. Skarbit, N.; Stewart, I.D.; Unger, J.; Gál, T. Employing an urban meteorological network to monitor air temperature conditions in the ‘local climate zones’ of Szeged, Hungary. Int. J. Climatol. 2017, 37, 582–596. [Google Scholar] [CrossRef]
  28. Gulyás, Á.; Unger, J.; Matzarakis, A. Assessment of the microclimatic and human comfort conditions in a complex urban environment: Modelling and measurements. Build. Environ. 2006, 41, 1713–1722. [Google Scholar] [CrossRef]
  29. Balázs, B.; Unger, J.; Gál, T.; Sümeghy, Z.; Geiger, J.; Szegedi, S. Simulation of the mean urban heat island using 2D surface parameters: Empirical modelling, verification and extension. Meteorol. Appl. 2009, 16, 275–287. [Google Scholar] [CrossRef]
  30. Csomós, G.; Farkas, Z.J.; Kolcsár, R.A.; Szilassi, P.; Kovács, Z. Measuring socio-economic disparities in green space availability in post-socialist cities. Habitat Int. 2021, 117, 102434. [Google Scholar] [CrossRef]
  31. Krätke, S. Cities in Contemporary Capitalism. Int. J. Urban Reg. Res. 2014, 38, 1660–1677. [Google Scholar] [CrossRef]
  32. Harvey, D. Social Justice and the City; University of Georgia Press: Athens, Greece, 2009. [Google Scholar]
  33. Shaw, K. Gentrification: What It Is, Why It Is, and What Can Be Done about It. Geogr. Compass 2008, 2, 1697–1728. [Google Scholar] [CrossRef]
  34. Anguelovski, I.; Connolly, J.J.T.; Cole, H.; Garcia-Lamarca, M.; Triguero-Mas, M.; Baró, F.; Martin, N.; Conesa, D.; Shokry, G.; del Pulgar, C.P.; et al. Green gentrification in European and North American cities. Nat. Commun. 2022, 13, 3816. [Google Scholar] [CrossRef]
  35. Wolch, J.R.; Byrne, J.; Newell, J.P. Urban green space, public health, and environmental justice: The challenge of making cities “just green enough”. Landsc. Urban Plan. 2014, 125, 234–244. [Google Scholar] [CrossRef]
  36. Naparstek, A.J.; Dooley, D. Countering Urban Disinvestment Through Community-Building Initiatives. 1997. Available online: https://academic.oup.com/sw/article/42/5/506/1915989 (accessed on 10 June 2025).
  37. Young, R.; Zanders, J.; Lieberknecht, K.; Fassman-Beck, E. A comprehensive typology for mainstreaming urban green infrastructure. J. Hydrol. 2014, 519, 2571–2583. [Google Scholar] [CrossRef]
  38. Wang, J.; Banzhaf, E. Towards a better understanding of Green Infrastructure: A critical review. Ecol. Indic. 2018, 85, 758–772. [Google Scholar] [CrossRef]
  39. Taylor, L.; Hochuli, D.F. Defining greenspace: Multiple uses across multiple disciplines. Landsc. Urban Plan. 2017, 158, 25–38. [Google Scholar] [CrossRef]
  40. Benedict, M.A.; McMahon, E.T. Green Infrastructure: Linking Landscapes and Communities; Island Press: Washington, DC, USA, 2012. [Google Scholar]
  41. Almanza, E.; Jerrett, M.; Dunton, G.; Seto, E.; Pentz, M.A. A study of community design, greenness, and physical activity in children using satellite, GPS and accelerometer data. Health Place 2012, 18, 46–54. [Google Scholar] [CrossRef] [PubMed]
  42. Tzoulas, K.; Korpela, K.; Venn, S.; Yli-Pelkonen, V.; Kaźmierczak, A.; Niemela, J.; James, P. Promoting ecosystem and human health in urban areas using Green Infrastructure: A literature review. Landsc. Urban Plan. 2007, 81, 167–178. [Google Scholar] [CrossRef]
  43. Stanford, H.R.; Garrard, G.E.; Kirk, H.; Hurley, J. A social-ecological framework for identifying and governing informal greenspaces in cities. Landsc. Urban Plan. 2022, 221, 104378. [Google Scholar] [CrossRef]
  44. Nagy, G.; Tráser, N.Z. Informális városi zöldterek dzsentrifikációja Szeged példáján. Ter Es Tarsad. 2024, 38, 3–32. [Google Scholar] [CrossRef]
  45. Zoltán, T.N.; Gyula, N. Informális városi zöldterek fejlődési pályáinak térhasználat-alapú vizsgálata Szegeden. Földrajzi Közlemények 2024, 3, 263–288. [Google Scholar]
  46. Pietrzyk-Kaszyńska, A.; Czepkiewicz, M.; Kronenberg, J. Eliciting non-monetary values of formal and informal urban green spaces using public participation GIS. Landsc. Urban Plan. 2017, 160, 85–95. [Google Scholar] [CrossRef]
  47. Kim, M.; Rupprecht, C.D.D.; Furuya, K. Residents’ perception of informal green space—A case study of Ichikawa City, Japan. Land 2018, 7, 102. [Google Scholar] [CrossRef]
  48. Rupprecht, C.D.D. Informal urban green space: Residents’ perception, use, and management preferences across four major Japanese Shrinking Cities. Land 2017, 6, 59. [Google Scholar] [CrossRef]
  49. Rupprecht, C.D.D.; Byrne, J.A.; Moreira, F. Informal urban green-space: Comparison of quantity and characteristics in Brisbane, Australia and Sapporo, Japan. PLoS ONE 2014, 9, e99784. [Google Scholar] [CrossRef]
  50. Rupprecht, C.D.; Byrne, J.A. Informal urban greenspace: A typology and trilingual systematic review of its role for urban residents and trends in the literature. Urban For. Urban Green. 2014, 13, 597–611. [Google Scholar] [CrossRef]
  51. Costanza, R.; d’Arge, R.; de Groot, R.; Farber, S.; Grasso, M.; Hannon, B.; Limburg, K.; Naeem, S.; O’Neill, R.V.; Paruelo, J.; et al. The value of the world’s ecosystem services and natural capital. Nature 1997, 387, 253–260. [Google Scholar] [CrossRef]
  52. Chen, S.; Li, G.; Zhuo, Y.; Xu, Z.; Ye, Y.; Thorn, J.P.R.; Marchant, R. Trade-offs and synergies of ecosystem services in the Yangtze River Delta, China: Response to urbanizing variation. Urban Ecosyst. 2021, 25, 313–328. [Google Scholar] [CrossRef]
  53. Alberti, M. Advances in Urban Ecology; Springer: Boston, MA, USA, 2008. [Google Scholar] [CrossRef]
  54. Bastian, O. Landscape Ecology—Towards a unified discipline? Landsc. Ecol. 2001, 16, 757–766. [Google Scholar] [CrossRef]
  55. Frolova, M. From the Russian/Soviet landscape concept to the geosystem approach to integrative environmental studies in an international context. Landsc. Ecol. 2019, 34, 1485–1502. [Google Scholar] [CrossRef]
  56. Derek, M.; Kulczyk, S.; Grzyb, T.; Woźniak, E. ‘This is my magical place here’. Linking cultural ecosystem services and landscape elements in urban green spaces. Ecosyst. Serv. 2025, 71, 101699. [Google Scholar] [CrossRef]
  57. Naidoo, R.; Balmford, A.; Costanza, R.; Fisher, B.; Green, R.E.; Lehner, B.; Malcolm, T.R.; Ricketts, T.H. Global mapping of ecosystem services and conservation priorities. Proc. Natl. Acad. Sci. USA 2008, 105, 9495–9500. [Google Scholar] [CrossRef] [PubMed]
  58. Millenium Ecosystem Assessment. Ecosystems and Human Well-Being: Synthesis; Island Press: Washington, DC, USA, 2005. [Google Scholar]
  59. Daily, G.C.; Matson, P.A. Ecosystem services: From theory to implementation. Proc. Natl. Acad. Sci. USA 2008, 105, 9455–9456. [Google Scholar] [CrossRef]
  60. Fisher, B.; Turner, R.K.; Morling, P. Defining and classifying ecosystem services for decision making. Ecol. Econ. 2009, 68, 643–653. [Google Scholar] [CrossRef]
  61. Rodríguez, J.P.; Beard, T.D.; Bennett, E.M.; Cumming, G.S.; Cork, S.J.; Agard, J.; Dobson, A.P.; Peterson, G.D. Trade-offs across Space, Time, and Ecosystem Services. Ecol. Soc. 2006, 11, 28. Available online: https://www.jstor.org/stable/26267786?seq=1&cid=pdf (accessed on 12 June 2025). [CrossRef]
  62. Burkhard, B.; Kroll, F.; Nedkov, S.; Müller, F. Mapping ecosystem service supply, demand and budgets. Ecol. Indic. 2012, 21, 17–29. [Google Scholar] [CrossRef]
  63. Aziz, T.; Van Cappellen, P. Comparative valuation of potential and realized ecosystem services in Southern Ontario, Canada. Environ. Sci. Policy 2019, 100, 105–112. [Google Scholar] [CrossRef]
  64. Chan, K.M.; Satterfield, T.; Goldstein, J. Rethinking ecosystem services to better address and navigate cultural values. Ecol. Econ. 2012, 74, 8–18. [Google Scholar] [CrossRef]
  65. Milcu, A.I.; Hanspach, J.; Abson, D.; Fischer, J. Cultural ecosystem services: A literature review and prospects for future research. Ecol. Soc. 2013, 18, 44. [Google Scholar] [CrossRef]
  66. Gould, R.K.; Lincoln, N.K. Expanding the suite of Cultural Ecosystem Services to include ingenuity, perspective, and life teaching. Ecosyst. Serv. 2017, 25, 117–127. [Google Scholar] [CrossRef]
  67. Rall, E.; Bieling, C.; Zytynska, S.; Haase, D. Exploring city-wide patterns of cultural ecosystem service perceptions and use. Ecol. Indic. 2017, 77, 80–95. [Google Scholar] [CrossRef]
  68. Bryce, R.; Irvine, K.N.; Church, A.; Fish, R.; Ranger, S.; Kenter, J.O. Subjective well-being indicators for large-scale assessment of cultural ecosystem services. Ecosyst. Serv. 2016, 21, 258–269. [Google Scholar] [CrossRef]
  69. Hernández-Morcillo, M.; Plieninger, T.; Bieling, C. An empirical review of cultural ecosystem service indicators. Ecol. Indic. 2013, 29, 434–444. [Google Scholar] [CrossRef]
  70. Blicharska, M.; Smithers, R.J.; Hedblom, M.; Hedenås, H.; Mikusiński, G.; Pedersen, E.; Sandström, P.; Svensson, J. Shades of grey challenge practical application of the cultural ecosystem services concept. Ecosyst. Serv. 2017, 23, 55–70. [Google Scholar] [CrossRef]
  71. Huu, L.H.; Ballatore, T.J.; Irvine, K.N.; Nguyen, T.H.D.; Truong, T.C.T.; Yoshihisa, S. Socio-geographic indicators to evaluate landscape Cultural Ecosystem Services: A case of Mekong Delta, Vietnam. Ecosyst. Serv. 2018, 31, 527–542. [Google Scholar] [CrossRef]
  72. Díaz, S.; Pascual, U.; Stenseke, M.; Martín-López, B.; Watson, R.T.; Molnár, Z.; Hill, R.; Chan, K.M.A.; Baste, I.A.; Brauman, K.A.; et al. Assessing nature’s contributions to people: Recognizing culture, and diverse sources of knowledge, can improve assessments. Science 1979, 359, 270–272. [Google Scholar] [CrossRef]
  73. Haines-Young, R.; Potschin, M. The links between biodiversity, ecosystem services and human well-being Managing ecosystems for people. In Ecosystem Ecology: A New Synthesis; Raffaelli, D., Frid, C., Eds.; Cambridge University Press: Cambridge, UK, 2010; Available online: http://www.un.org/millenniumgoals/ (accessed on 10 June 2025).
  74. Kilonzi, F.M.; Ota, T. Influence of cultural contexts on the appreciation of different cultural ecosystem services based on social network analysis. One Ecosyst. 2019, 4, e33368. [Google Scholar] [CrossRef]
  75. Kenter, J.O.; Hyde, T.; Christie, M.; Fazey, I. The importance of deliberation in valuing ecosystem services in developing countries—Evidence from the Solomon Islands. Glob. Environ. Chang. 2011, 21, 505–521. [Google Scholar] [CrossRef]
  76. Scullion, J.; Thomas, C.W.; Vogt, K.A.; Pérez-Maqueo, O.; Logsdon, M.G. Evaluating the environmental impact of payments for ecosystem services in Coatepec (Mexico) using remote sensing and on-site interviews. Environ. Conserv. 2011, 38, 426–434. [Google Scholar] [CrossRef]
  77. Costanza, R.; Kubiszewski, I.; Ervin, D.; Bluffstone, R.; Boyd, J.; Brown, D.; Chang, H.; Dujon, V.; Granek, E.; Polasky, S.; et al. Valuing ecological systems and services. F1000 Biol. Rep. 2011, 3, 14. [Google Scholar] [CrossRef]
  78. Gasparatos, A.; Stromberg, P.; Takeuchi, K. Biofuels, ecosystem services and human wellbeing: Putting biofuels in the ecosystem services narrative. Agric. Ecosyst. Environ. 2011, 142, 111–128. [Google Scholar] [CrossRef]
  79. Andersson, E.; Tengö, M.; McPhearson, T.; Kremer, P. Cultural ecosystem services as a gateway for improving urban sustainability. Ecosyst. Serv. 2015, 12, 165–168. [Google Scholar] [CrossRef]
  80. Ko, H.; Son, Y. Perceptions of cultural ecosystem services in urban green spaces: A case study in Gwacheon, Republic of Korea. Ecol. Indic. 2018, 91, 299–306. [Google Scholar] [CrossRef]
  81. Plieninger, T.; Dijks, S.; Oteros-Rozas, E.; Bieling, C. Assessing, mapping, and quantifying cultural ecosystem services at community level. Land Use Policy 2013, 33, 118–129. [Google Scholar] [CrossRef]
  82. Raudsepp-Hearne, C.; Peterson, G.D.; Bennett, E.M. Ecosystem service bundles for analyzing tradeoffs in diverse landscapes. Proc. Natl. Acad. Sci. USA 2010, 107, 5242–5247. [Google Scholar] [CrossRef]
  83. Romanazzi, G.R.; Koto, R.; De Boni, A.; Palmisano, G.O.; Cioffi, M.; Roma, R. Cultural ecosystem services: A review of methods and tools for economic evaluation. Environ. Sustain. Indic. 2023, 20, 100304. [Google Scholar] [CrossRef]
  84. Czembrowski, P.; Kronenberg, J.; Czepkiewicz, M. Integrating non-monetary and monetary valuation methods—SoftGIS and hedonic pricing. Ecol. Econ. 2016, 130, 166–175. [Google Scholar] [CrossRef]
  85. Spangenberg, J.H.; Settele, J. Precisely incorrect? Monetising the value of ecosystem services. Ecol. Complex. 2010, 7, 327–337. [Google Scholar] [CrossRef]
  86. Unnikrishnan, H.; Nagendra, H. Privatizing the commons: Impact on ecosystem services in Bangalore’s lakes. Urban Ecosyst. 2015, 18, 613–632. [Google Scholar] [CrossRef]
  87. Vidal, D.G.; Dias, R.C.; Teixeira, C.P.; Fernandes, C.O.; Filho, W.L.; Barros, N.; Maia, R.L. Clustering public urban green spaces through ecosystem services potential: A typology proposal for place-based interventions. Environ. Sci. Policy 2022, 132, 262–272. [Google Scholar] [CrossRef]
  88. Feltynowski, M.; Kronenberg, J.; Bergier, T.; Kabisch, N.; Łaszkiewicz, E.; Strohbach, M.W. Challenges of urban green space management in the face of using inadequate data. Urban For. Urban Green. 2018, 31, 56–66. [Google Scholar] [CrossRef]
  89. Vedrédi, K. Social perception of public space developments-the case of saint stephen square, szeged, hungary. Eur. J. Geogr. 2014, 5, 60–72. Available online: http://www.human.geo.u-szeged.hu/?q=hu (accessed on 9 June 2025).
  90. Broomhall, M.H.; Giles-corti, B.; Lange, A. Quality of Public Open Space Tool (POST); School of Population Health, The University of Western Australia: Perth, Australia, 2004. [Google Scholar]
  91. Vidal, D.G.; Fernandes, C.O.; Viterbo, L.M.F.; Vilaça, H.; Barros, N.; Maia, R.L. Uses and perceptions on gardens and public parks. Preliminary results of a survey in the city of porto (portugal). Finisterra 2021, 56, 137–157. [Google Scholar] [CrossRef]
  92. Vidal, D.G.; Fernandes, C.O.; Viterbo, L.M.F.; Vilaça, H.; Barros, N.; Maia, R.L. Development and validation of a grid to evaluate ecosystem services of public urban green spaces in Porto. In Recent Advances in Environmental Science from the Euro-Mediterranean and Surrounding Regions; Ksibi, M., Ghorbal, A., Chakraborty, S., Chamin, H.I., Barbieri, M., Guerriero, G., Hentati, O., Negm, A., Lehmann, A., Rombke, J., et al., Eds.; Springer: Berlin/Heidelberg, Germany, 2021; pp. 2247–2252. [Google Scholar]
  93. Vidal, D.G.; Teixeira, C.P.; Fernandes, C.O.; Olszewska-Guizzo, A.; Dias, R.C.; Vilaça, H.; Barros, N.; Maia, R.L. Patterns of human behaviour in public urban green spaces: On the influence of users’ profiles, surrounding environment, and space design. Urban For. Urban Green. 2022, 74, 127668. [Google Scholar] [CrossRef]
  94. Haines-Young, R.; Potschin, M. Common International Classification of Ecosystem Services (CICES, Version 4.1). Nottingham. 2012. Available online: www.cices.eu (accessed on 9 June 2025).
  95. Fischer, L.; Honold, J.; Botzat, A.; Brinkmeyer, D.; Cvejić, R.; Delshammar, T.; Elands, B.; Haase, D.; Kabisch, N.; Karle, S.; et al. Recreational ecosystem services in European cities: Sociocultural and geographical contexts matter for park use. Ecosyst. Serv. 2018, 31, 455–467. [Google Scholar] [CrossRef]
  96. Gehl, J. Life Between Buildings: Using Public Space; Island Press: Washington, DC, USA, 1971. [Google Scholar]
  97. Tu, H.; Liao, X.; Schuller, K.; Cook, A.; Fan, S.; Lan, G.; Lu, Y.; Yuan, Z.; Moore, J.B.; Maddock, J.E. Insights from an observational assessment of park-based physical activity in Nanchang, China. Prev. Med. Rep. 2015, 2, 930–934. [Google Scholar] [CrossRef]
  98. Safari, H.; Moridani, F.F. Syntactical analysis of the accessibility and sociability of a square in the Kuala Lumpur City Center. Front. Arch. Res. 2017, 6, 456–468. [Google Scholar] [CrossRef]
  99. Babbie, E. Survey Research Methods; Wadsworth Publishing Company: Belmont, CA, USA, 1973. [Google Scholar]
  100. Vámos, R.; Nagy, G.; Kovács, Z. The Construction of the Visible and Invisible Boundaries of Microsegregation: A Case Study from Szeged, Hungary. Land 2023, 12, 1835. [Google Scholar] [CrossRef]
  101. Boros, L. Measuring deprivation in nurban neighborhoods—The case of Szeged. Geogr. Timisiensis 2010, 19, 209–217. Available online: https://www.researchgate.net/publication/268203652 (accessed on 13 June 2025).
  102. Kolcsár, R.A.; Csete, Á.K.; Kovács-Győri, A.; Szilassi, P. Age-group-based evaluation of residents’ urban green space provision: Szeged, Hungary. A case study. Hung. Geogr. Bull. 2022, 71, 249–269. [Google Scholar] [CrossRef]
  103. Rupprecht, C.D.; Byrne, J.A.; Garden, J.G.; Hero, J.-M. Informal urban green space: A trilingual systematic review of its role for biodiversity and trends in the literature. Urban For. Urban Green. 2015, 14, 883–908. [Google Scholar] [CrossRef]
  104. Nagy, G. Environmental Justice and its geographical aspects in Hungary. Ter Es Tarsad. 2021, 35, 76–103. [Google Scholar] [CrossRef]
  105. Kolcsár, R.A.; Csikós, N.; Szilassi, P. Testing the limitations of buffer zones and Urban atlas population data in urban green space provision analyses through the case study of Szeged, Hungary. Urban For. Urban Green. 2021, 57, 126942. [Google Scholar] [CrossRef]
  106. Silva, P. Tactical urbanism: Towards an evolutionary cities’ approach? Environ. Plan. B: Plan. Des. 2016, 43, 1040–1051. [Google Scholar] [CrossRef]
  107. Adams, D.; Hardman, M. Observing Guerrillas in the Wild: Reinterpreting Practices of Urban Guerrilla Gardening. Urban Stud. 2013, 51, 1103–1119. [Google Scholar] [CrossRef]
  108. Stătică, I. Urban courtyards: Ideologies of domesticity and the landscape of welfare in communist Bucharest. Landsc. Res. 2020, 46, 574–587. [Google Scholar] [CrossRef]
  109. Kulesza, P.; Lubiarz, M.; Kociuba, P.; Dubis, L.; Solski, M. Cultural Ecosystem Services of historic parks in context of their functionality and spatial organisation by the example of Lublin, Lviv, and London. Landsc. Online 2025, 100, 1134. [Google Scholar] [CrossRef]
  110. Mitchell, D, The End of Public Space? People’s Park, Definitions of the Public, and Democracy. Ann. Assoc. Am. Geogr. 1995, 85, 108–133.
  111. Koschke, L.; Van der Meulen, S.; Frank, S.; Schneidergruber, A.; Kruse, M.; Fürst, C.; Neubert, E.; Ohnesorge, B.; Schröder, C.; Müller, F.; et al. Do you have 5 minutes to spare? -The challenges of stakeholder processes in ecosystem services studies. Landsc. Online 2014, 37, 1–25. [Google Scholar] [CrossRef]
  112. Matsuoka, R.H.; Kaplan, R. People needs in the urban landscape: Analysis of Landscape and Urban Planning contributions. Landsc. Urban Plan. 2008, 84, 7–19. [Google Scholar] [CrossRef]
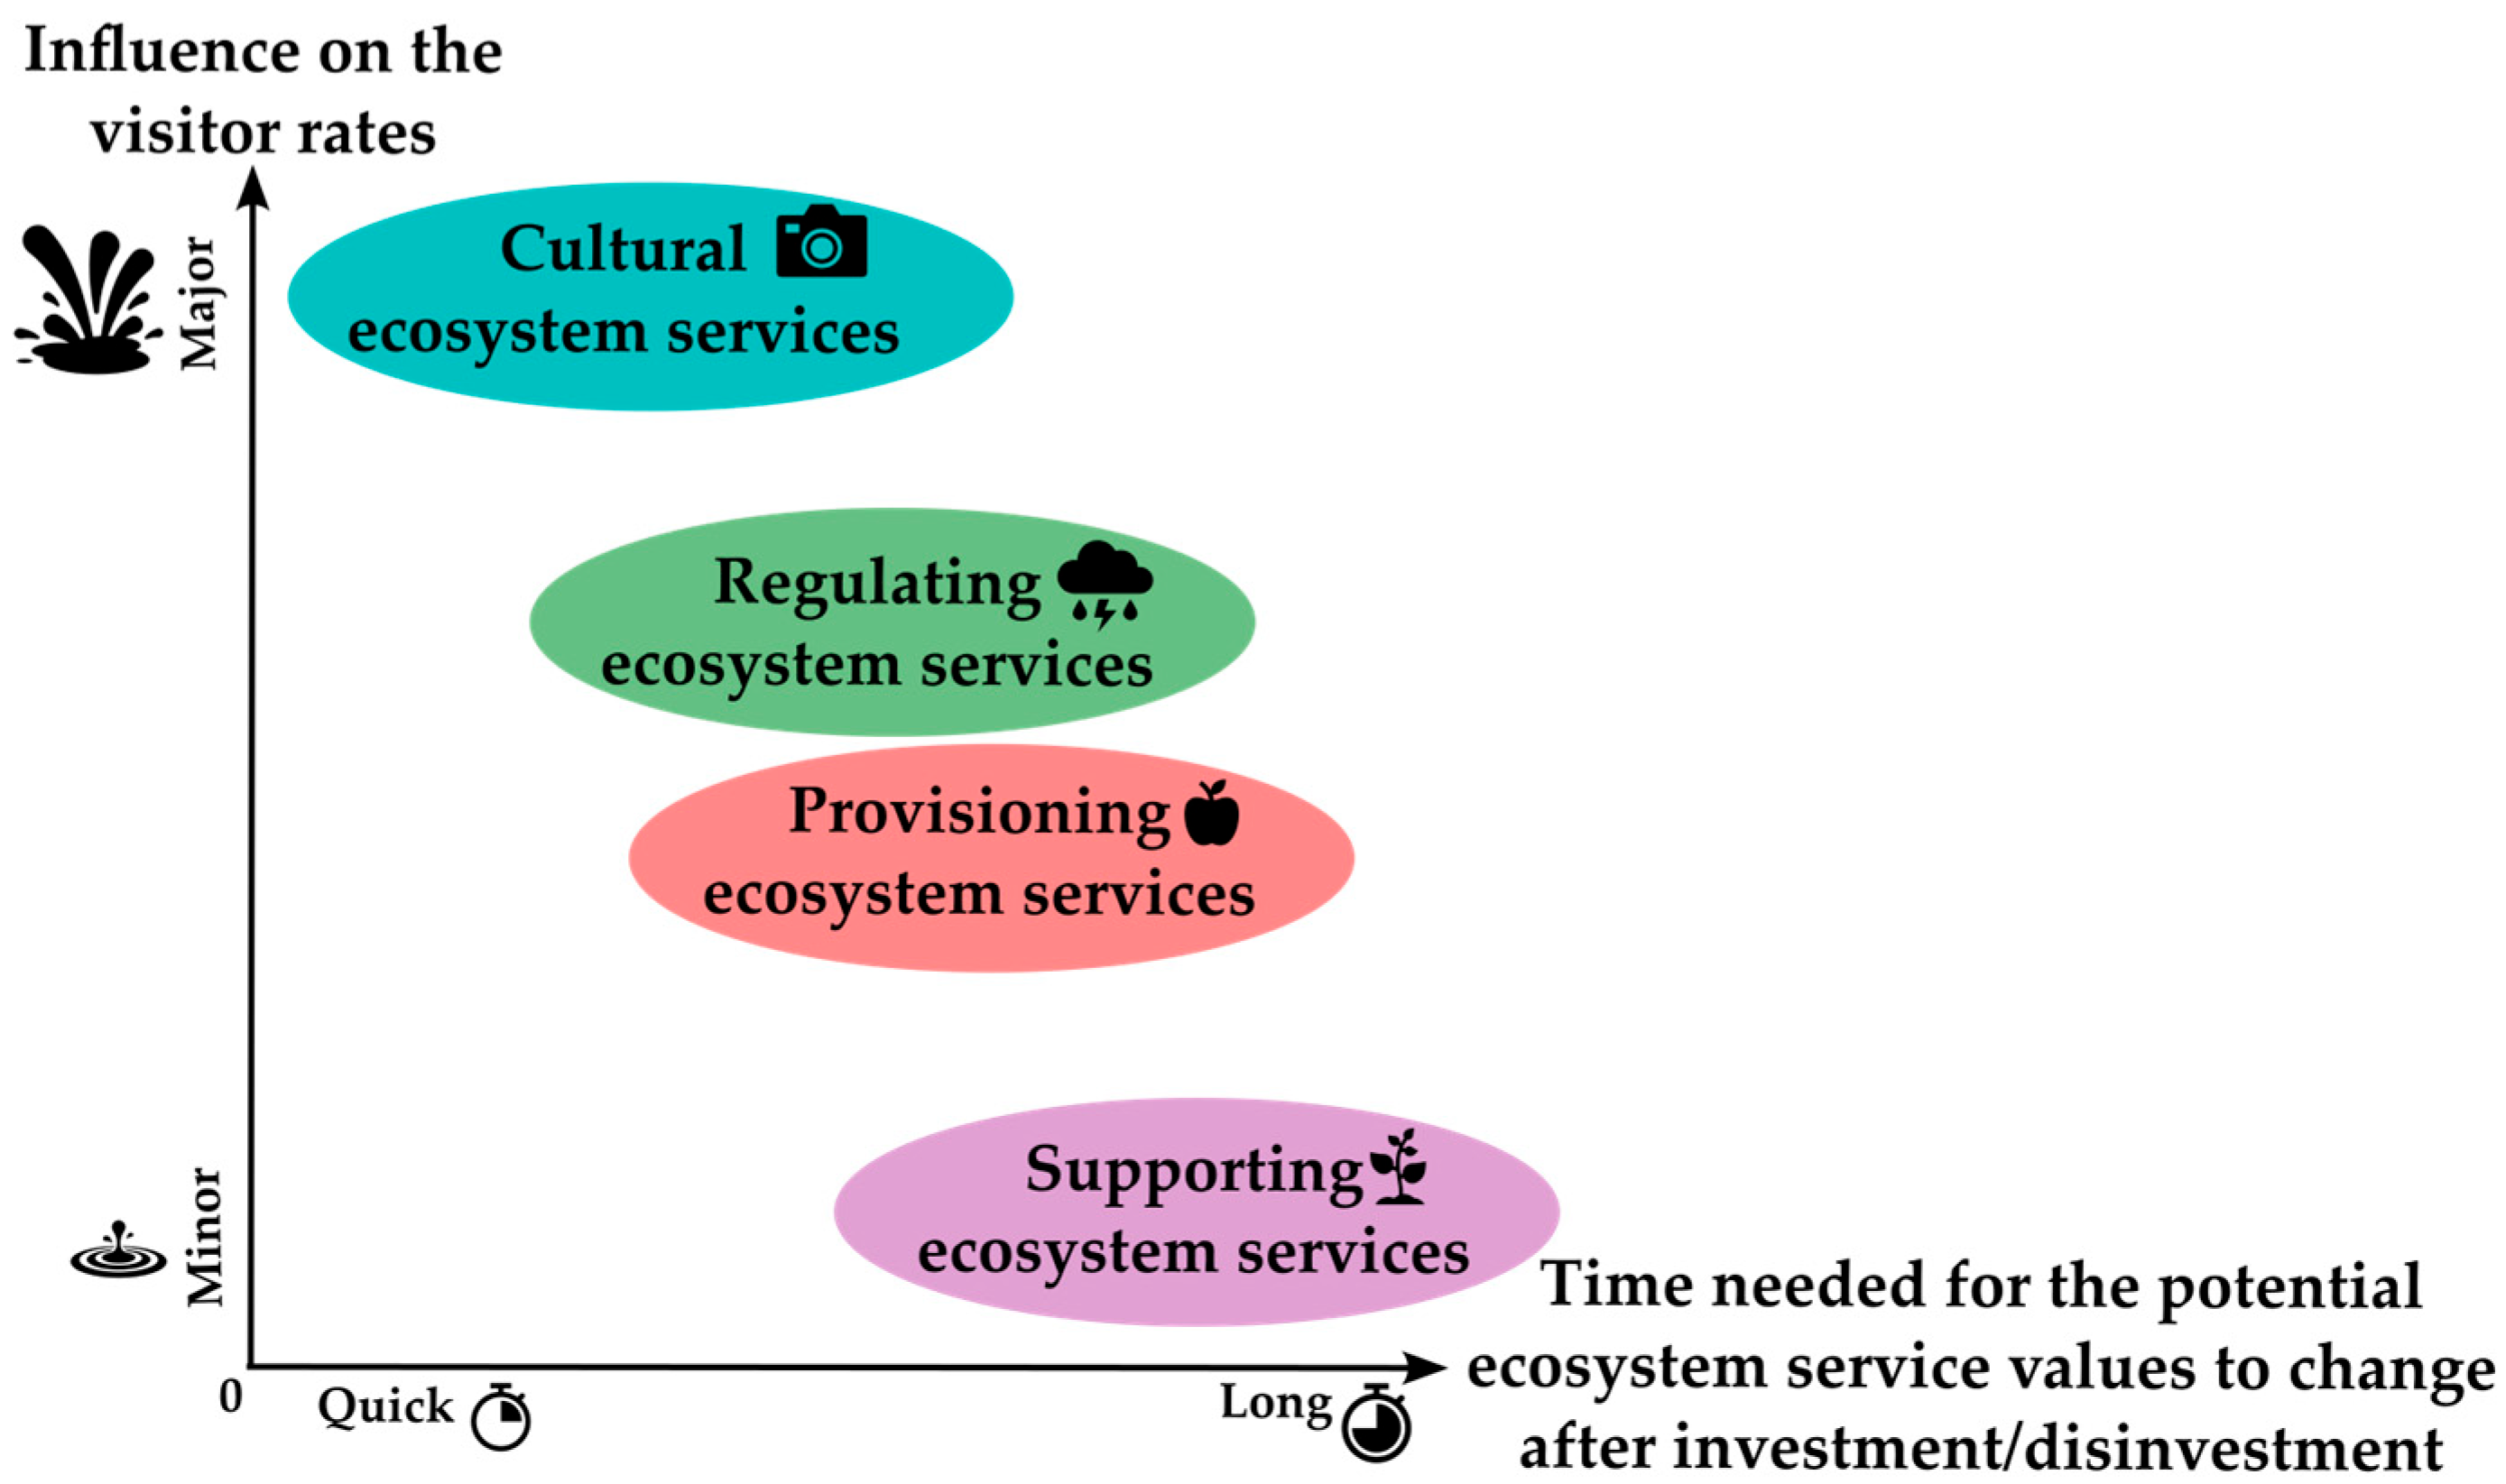
Figure 1. The four ecosystem service categories based on their influence on visitor rates and time needed to change their values (source: edited by the authors based on Chen et al. [14] and Rodríguez et al. [61]).
Land 14 01701 g001
Figure 2. The circular flow chart of the effect of investment/disinvestment in urban green spaces (source: edited by the authors).
Land 14 01701 g002
Figure 3. The flow chart of this study’s methodology (source: edited by the authors).
Land 14 01701 g003
Figure 4. Examples of the four clusters of urban green spaces of Szeged: city centre squares (A), central parks (B), suburban playgrounds (C), informal green spaces (D) (source: own photos of the authors).
Land 14 01701 g004
Figure 5. The location of Szeged and the sample areas with their cluster labels in the city (source: own editing).
Land 14 01701 g005
Figure 6. The four identified clusters: legend: activities performed (A), environmental quality (B), facilities (C), and security (D) (source: own editing).
Land 14 01701 g006
Figure 7. The potential cultural ecosystem values and visitor numbers of the sample areas (source: own editing).
Land 14 01701 g007
Figure 8. The current state of Gergő-liget and its users (source: own photo of the authors).
Land 14 01701 g008
Table 1. The data sources used in this study (source: edited by the authors).
Data CategoryData Source TypeData Source
Urban green space databaseSecondarySzeged Urban Development Plan
Urban Atlas
Open Street Map
Green spaces’ potential cultural ecosystem valuesPrimaryField observations
Green spaces’ usage patternsPrimaryField observations
Table 2. The potential cultural ecosystem service values (on a four-point ordinal scale: absent (0), low (1), medium (2), and high (3) presence) and visitor numbers of the sample areas (source: own editing).
Sample Areas’ Code NameActivities PerformedEnvironmental QualityFacilitiesSecurityAggregated Potential CES ValuesAverage
Number of Visitors
Informal/10.140.640.640.832010.00
Informal/20.001.090.500.67223.33
Informal/30.431.450.330.002312.00
Informal/40.290.821.000.67272.00
Informal/50.431.910.500.33327.00
Playground/10.431.360.671.17332.67
Playground/20.291.000.921.67344.67
Playground/30.001.551.002.004110.00
Centre/10.571.091.171.834112.33
Playground/40.431.361.251.67437.00
Playground/50.142.001.500.83468.67
Playground/61.711.451.331.335211.33
Centre/20.432.091.251.835227.67
Playground/70.861.731.672.005711.67
Playground/81.291.361.502.505720.67
Park/11.292.091.921.506432.67
Park/21.001.912.581.676933.00
Park/30.862.362.252.177236.33
Centre/31.142.362.332.337633.67
Average0.621.561.281.4245.3215.09
Table 3. The environmental injustices occurring in connection with the cultural ecosystem services of UGSs (source: edited by the authors based on their findings and Kronenberg et al., 2020 [18]).
Data CategoryDistributive JusticeProcedural JusticeRecognitional Justice
Review of the attractiveness of post-socialist cities’ green spaces by Kronenberg et al. (2020) [18] Urban green spaces are not adjusted to be attractive to the majority of the locals.Insufficient inclusion of different groups (especially the most vulnerable ones) in the management and planning of urban green spaces.In neoliberal capitalism, society is more tolerant of injustices, and the actual needs of certain groups are often overlooked.
Case study of the cultural ecosystem services of green spaces in SzegedDiscrepancies in facilities, possible activities, and security of green spaces showcase different investment values, which often cannot be justified by the number of visitors.Districts with upper-class residents have a higher influence on the UGS management and investment decisions of the municipality.Due to privatization and commercialization, certain groups and activities are becoming undesirable, and hence, overlooking their right to visit attractive urban green spaces.
Disclaimer/Publisher’s Note: The statements, opinions and data contained in all publications are solely those of the individual author(s) and contributor(s) and not of MDPI and/or the editor(s). MDPI and/or the editor(s) disclaim responsibility for any injury to people or property resulting from any ideas, methods, instructions or products referred to in the content.