Article

Multispectral Remote Sensing Monitoring Methods for Soil Fertility Assessment and Spatiotemporal Variation Characteristics in Arid and Semi-Arid Mining Areas

1
School of Geosciences & Surveying Engineering, China University of Mining & Technology (Beijing), Beijing 100083, China
2
School of Environment Science & Spatial Informatics, China University of Mining & Technology, Xuzhou 221116, China
*
Author to whom correspondence should be addressed.
Land 2025, 14(8), 1694; https://doi.org/10.3390/land14081694
Submission received: 4 August 2025 / Revised: 15 August 2025 / Accepted: 20 August 2025 / Published: 21 August 2025

Abstract

Soil fertility is the essential attribute of soil quality. Large-scale coal mining has led to the continuous deterioration of the fragile ecosystems in arid and semi-arid mining areas. As one of the key indicators for land ecological restoration in these coal mining regions, rapidly and accurately monitoring topsoil fertility and its spatial variation information holds significant importance for ecological restoration evaluation. This study takes Wuhai City in the Inner Mongolia Autonomous Region of China as a case study. It establishes and evaluates various soil indicator inversion models using multi-temporal Landsat8 OLI multispectral imagery and measured soil sample nutrient content data. The research constructs a comprehensive evaluation method for surface soil fertility based on multispectral remote sensing monitoring and achieves spatiotemporal variation analysis of soil fertility characteristics. The results show that: (1) The 6SV (Second Simulation of the Satellite Signal in the Solar Spectrum Vector version)-SVM (Support Vector Machine) prediction model for surface soil indicators based on Landsat8 OLI imagery achieved prediction accuracy with R2 values above 0.85 for all six soil nutrient contents in the study area, thereby establishing for the first time a rapid assessment method for comprehensive topsoil fertility using multispectral remote sensing monitoring. (2) Long-term spatiotemporal evaluation of soil indicators was achieved: From 2015 to 2025, the spatial distribution of soil indicators showed certain variability, with soil organic matter, total phosphorus, available phosphorus, and available potassium contents demonstrating varying degrees of increase within different ranges, though the increases were generally modest. (3) Long-term spatiotemporal evaluation of comprehensive soil fertility was accomplished: Over the 10 years, Grade IV remained the dominant soil fertility level in the study area, accounting for about 32% of the total area. While the overall soil fertility level showed an increasing trend, the differences in soil fertility levels decreased, indicating a trend toward homogenization.

1. Introduction

Soil fertility is the most essential attribute of soil quality. Soil nutrient content is an important indicator of soil fertility, providing critical nutrients for plant growth. It has a direct and close relationship with the difficulty of soil cultivation, playing a key role in determining soil quality and reducing cultivation costs [1,2,3]. For a long time, with coal being China’s primary energy source, extensive coal mining has inevitably caused damage to the surface soil ecosystem [4,5,6]. The Chinese government has recently promulgated and implemented policies to advance the national strategy of green development and ecological civilization construction. Strengthening ecological restoration in ecologically fragile coal mining areas has become an urgent priority [7,8]. At the same time, soil fertility status is crucial for evaluating soil quality and formulating soil improvement measures. Monitoring changes in soil fertility and its spatial distribution during mine ecological restoration is key to assessing the success of green development practices and environmental rehabilitation efforts in mining areas [9,10,11]. Therefore, comprehensively evaluating changes in various soil indicators, achieving integrated soil fertility monitoring, and assessing the long-term spatiotemporal variation characteristics of soil fertility distribution are crucial for soil ecological restoration and topsoil reconstruction in arid and semi-arid mining areas.
Multiple studies have widely validated spectral characteristics as effective indicators for analyzing gradual changes in surface soils, demonstrating significant sensitivity to variations in soil properties such as texture and nutrient content [9,12]. With the continuous advancement of remote sensing technology, the spatiotemporal resolution of satellite sensors has been progressively enhanced. Currently, remote sensing imagery and spectral reflectance data of various bare soils have been widely applied in the quantitative monitoring of multiple soil indicators [13,14,15,16,17,18,19,20], achieving varying degrees of success regarding inversion accuracy, prediction reliability, and spatiotemporal resolution [21,22,23,24,25,26]. Among them, multispectral remote sensing data possesses ample spatial coverage, low acquisition costs, high temporal resolution, and rich information content. It can establish high-precision inversion models for soil indicators and visually represent the inversion results through imagery, making it particularly advantageous for investigating the spatiotemporal distribution patterns of various soil properties [27,28,29,30,31,32].
In the field of multispectral remote sensing image-based bare soil reflectance calculation and soil property inversion modeling, our team’s published research demonstrates that adopting the 6SV (Second Simulation of the Satellite Signal in the Solar Spectrum Vector Version) model as the core algorithm—which integrates high spatiotemporal-resolution auxiliary meteorological data—significantly enhances reflectance calculation accuracy in complex terrain areas (e.g., mining sites) [1]. Concurrently, we constructed an intelligent inversion framework for soil particle size based on a support vector machine (SVM) using measured soil reflectance data. Compared with various modeling methods such as multiple linear regression (MLR), partial least squares regression (PLSR), convolutional neural network (CNN), and random forest (RF), considering the extremely high cost of field sampling in arid mining areas, both RF and CNN need to provide a large number of training samples to obtain high prediction accuracy. In complex scenarios (affected by special interference such as mining dust and climate dryness and wetness), the prediction accuracy of the SVM method has stronger stability and higher computational efficiency. Therefore, the technical advantage of the SVM method lies in the fact that it does not require a large dataset, and selecting the correct kernel function in high-dimensional space can have extreme prediction accuracy. Robust modeling performance and higher inversion accuracy [11].
Soil fertility is a comprehensive reflection of various soil properties, typically evaluated using multiple physicochemical indicators such as soil organic matter content, phosphorus, potassium, and texture [33,34,35,36]. Due to the diversity of soil physicochemical indicators and the differences in their units of measurement, the introduction of membership functions based on fuzzy mathematics has effectively addressed the quantification of soil fertility indicators. This approach ensures comparability and uniformity among various soil indicators, laying the foundation for establishing a soil fertility evaluation index to classify fertility levels [2,37,38,39,40]. Therefore, due to the complex diversity of indicators required for comprehensive soil fertility evaluation and the interdisciplinary nature of soil assessment and remote sensing technology, no current research has demonstrated the feasibility of soil fertility evaluation inversion based on multispectral remote sensing data. However, our team’s preliminary research achievements in using multispectral remote sensing to invert and predict soil texture characteristics and distribution changes have laid the foundation for further exploration. This provides ample room for imagination regarding multispectral remote sensing monitoring of various soil physicochemical indicators, the establishment of rapid calculation methods for soil fertility evaluation, and the analysis of spatiotemporal variation characteristics of soil fertility in mining areas.
The current ecological restoration work for post-mining damaged environments urgently requires further research on the dynamic monitoring of multiple soil physicochemical indicators and comprehensive evaluation methods for soil fertility integrating various indicators, aiming to rapidly assess surface soil fertility and spatiotemporal variation analysis in mining areas. This study takes Wuhai City in Inner Mongolia Autonomous Region, China, as an example and utilizes Landsat 8 OLI multispectral imagery data with the following objectives: (1) to establish prediction models for multiple soil indicators based on surface soil reflectance spectra from multispectral satellite imagery and calculate the inversion results of various nutrient contents in the study area; (2) to develop a soil fertility evaluation method for mining areas based on the inversion results of multiple soil indicators from satellite imagery data, achieving the classification of soil fertility levels in the study area; (3) to analyze the spatiotemporal variation characteristics of soil fertility in the study area using remote sensing images from different periods, combined with the soil indicator prediction models and fertility evaluation method.

2. Data and Methods

2.1. Experimental Scheme

Based on the research objective of “Multispectral Remote Sensing Monitoring Methods for Soil Fertility Assessment and Spatiotemporal Variation Characteristics in Arid and Semi-arid Mining Areas,” we designed the following experimental plan (Figure 1). Step 1 (Data acquisition and preprocessing): Conduct on-site soil sampling in the study area and perform laboratory analysis to obtain multiple soil indicator data. And select appropriate multispectral remote sensing images and perform preprocessing to obtain atmospheric apparent reflectance data. Step 2 (Construction and accuracy evaluation of soil indicator models): Carry out data processing and analysis. Based on existing research, the 6SV atmospheric correction model is applied to calculate surface reflectance data, followed by establishing prediction models for multiple soil indicators using the optimal modeling method (6SV-SVM). The inversion results of various nutrient contents in the study area are then computed. Step 3 (Comprehensive evaluation system for soil fertility): Construct a soil fertility evaluation method for mining areas based on the inversion results of multiple soil indicators from satellite imagery, enabling the classification of soil fertility grades in the study area. Step 4 (Spatial mapping and analysis of change characteristics): Analyze the spatiotemporal variation characteristics of soil fertility in the study area using multispectral remote sensing images from different periods, soil indicator prediction models, and the fertility evaluation method.

2.2. Overview of the Study Area

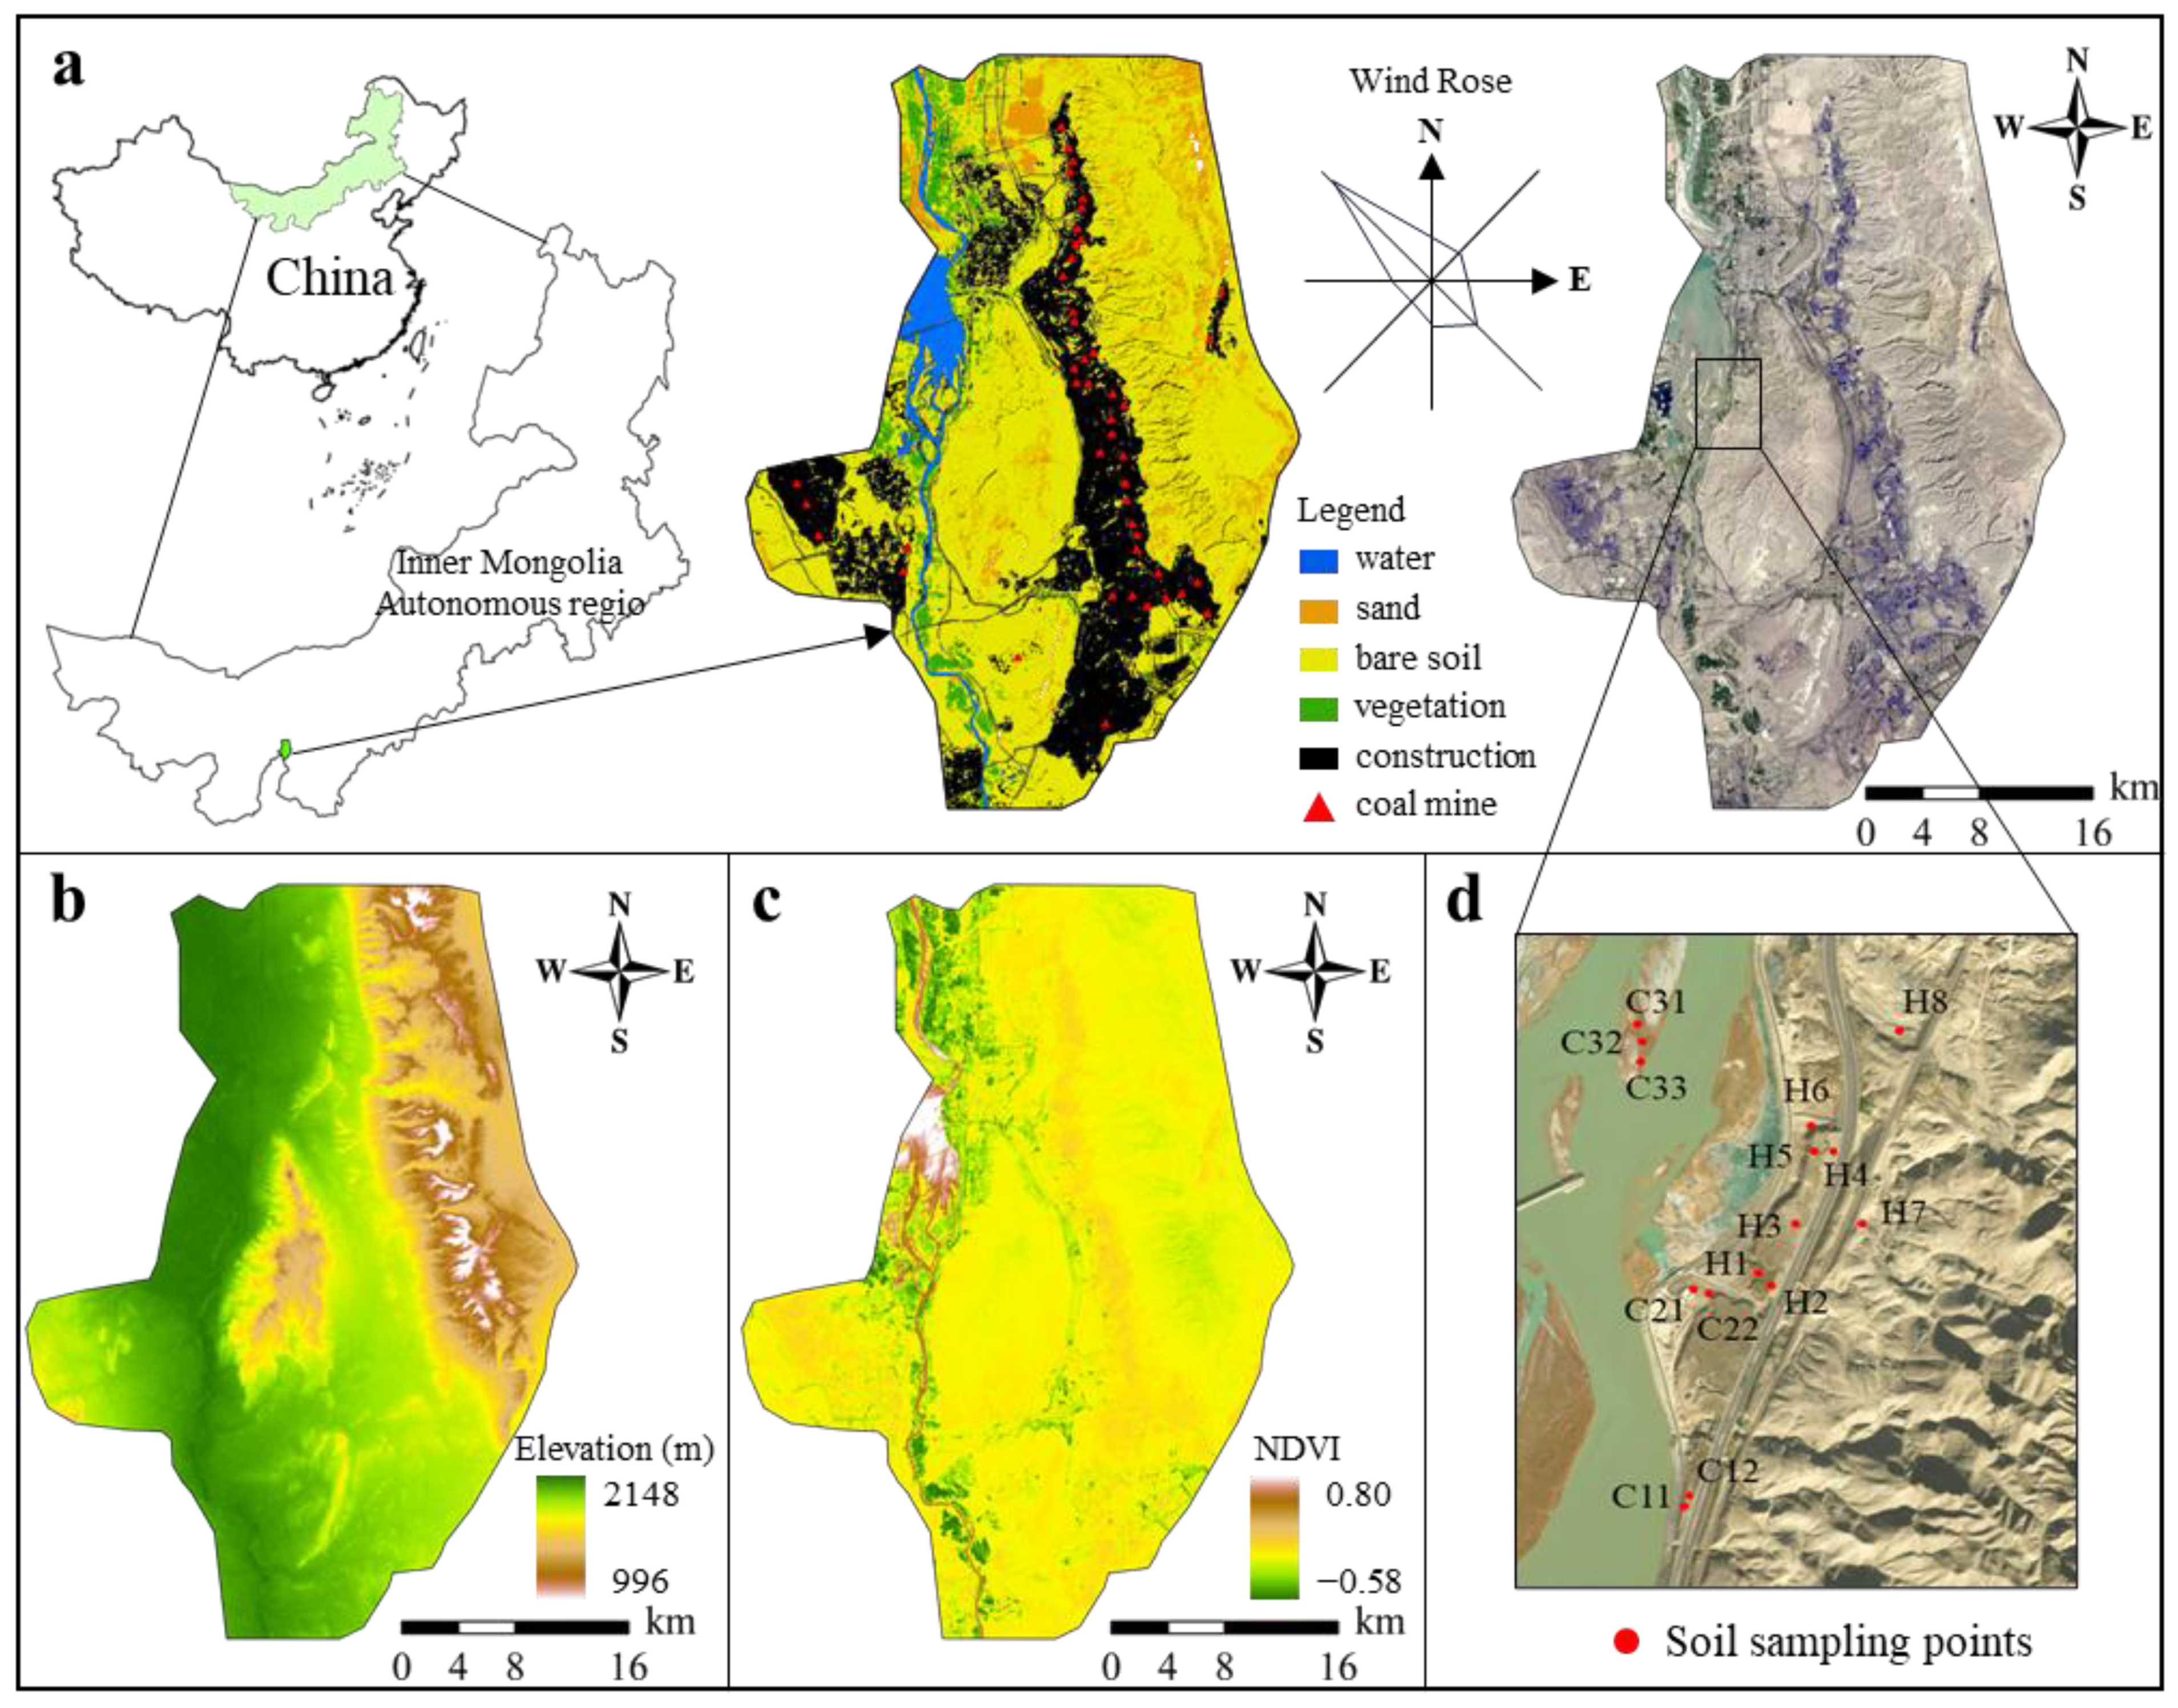
The study area, Wuhai City (39°16′–39°49′ N, 106°25′–107°8′ E), is situated in the western part of China’s Inner Mongolia Autonomous Region (Figure 2a). Characterized by a semi-arid continental climate, the region experiences long winters, short summers, drastic temperature variations, frequent sandstorms, and scarce rainfall. Spring, autumn, and winter are windy, with mostly northwest wind (the dominant wind direction throughout the year), with an average wind speed of 2.9 m/s and a maximum instantaneous wind speed of 33 m/s. In summer, southeast or southerly winds increase, but the wind strength is weaker. The topography features higher elevations on the eastern and western sides with a lower central area, averaging 1150 m above sea level (Figure 2b). The soil type in the research area is mainly gray desert soil, widely distributed in the low mountains, hills, and alluvial fan areas of Wuhai City. Its main characteristics are its loose structure, strong alkaline pH, low organic matter content in the topsoil layer, poor fertility, and poor water retention capacity. It is a desert soil formed under warm and arid climate conditions in the eastern desert area, prone to soil erosion under wind and water. The biological process of soil formation is very weak, and the thin layer of weathered crust is influenced by an arid climate (annual precipitation less than 200 mm, evaporation exceeding 3000 mm), becoming the dominant factor in the formation of desert soil [41]. Influenced by geographical and meteorological conditions, the study area represents a transitional zone between desertified grassland and steppe desert, exhibiting ecological fragility. Vegetation types are simplistic, with coverage rates below 5–10% (Figure 2c).

2.3. Soil Sampling and Analysis of Various Indicators

The sampling conditions of this study were consistent with previous research. Field sampling was conducted on 22 July 2021, at 15 locations near Wuhai Lake (Figure 2d), with three layers sampled at each location (sampling depths: 0–20 cm, 20–40 cm, and 40–60 cm), totaling 45 surface soil samples. At each sampling point, soil samples were collected using a soil auger, and basic information such as sampling location and sample number was recorded. All collected samples were transported to the laboratory and processed according to the following protocol: The field-collected soil samples were air-dried in a calm, ventilated environment, then mechanically sieved through a 2-mm stainless steel standard sieve to remove plant residues and gravel. Subsequently, six conventional nutrient contents were measured, including organic matter, total nitrogen, total phosphorus, total potassium, available phosphorus, and available potassium (Figure 3).
We have organized the data on the conventional nutrient content of six types of soil measured in the laboratory. As shown in Table 1, among the soil samples tested, the average Organic Matter content of the different soil thicknesses at sampling site C (closer to the Yellow River) was about 1.8 g/kg, an average Total N content of about 0.25 g/kg, an average Total P content of about 0.55 g/kg, an average Total K content of about 16.8 g/kg, an average Available P content of about 7.3 mg/kg, and an average Available K content of about 48 mg/kg; the average Organic Matter content of the different soil thicknesses at sampling site H (further away from the Yellow River than C) was about 4.3 g/kg, an average Total N content of about 0.43 g/kg, an average Total P content of about 0.6 g/kg, an average Total K content of about 18 g/kg, an average Available P content of about 9.9 mg/kg, and an average Available K content of about 80 mg/kg. Compared with sampling site H, sampling site C has significantly lower levels of six conventional nutrients in the soil, including nearly half as much the contents of Organic Matter, Total N, and Available K. In addition, according to the comparative analysis of sampling data, the organic matter, total N, available P, available K, and other nutrient contents at the H4 site (between H5 and H7) were significantly lower than those at surrounding sites. Based on field surveys and laboratory data, the anomalous phenomenon can be attributed to the synergistic effect of multiple factors. Firstly, the site is adjacent to a river channel (with a straight-line distance about 50% shorter than H7), and groundwater infiltration and recharge are more frequent. Secondly, it is located in a micro terrain depression area (with a relative elevation difference of 0.8 m), forming a natural watershed area. The soil moisture content reaches 28.5% (with an average of 21.2% around the site), and the excessively high soil wetland significantly enhances its leaching effect, accelerating nutrient dissolution and loss.

2.4. Remote Sensing Image Data Selection, Processing, and Analysis

2.4.1. Image Selection and Preprocessing

To use remote sensing data as auxiliary variables for predicting soil fertility in the study area while analyzing the spatiotemporal variation characteristics of soil fertility across different periods, in addition to selecting Landsat8 OLI imagery acquired close to the field sampling time (31 July 2021, Path: 129, Row: 33), we also selected three additional Landsat8 OLI images from 2015, 2018, and 2025. The image data were downloaded for free from the USGS (United States Geological Survey) website. The ENVI5.3 software performed image preprocessing steps, including cropping and radiometric correction. Subsequently, the top-of-atmosphere (TOA) apparent reflectance image was calculated using the following specific formula:
ρ ( t o a ) = D N · g a i n + o f f s e t
In Equation (1), ρ ( t o a ) represents the atmospheric surface reflectance, D N represents the brightness value of a pixel in a remote sensing image, g a i n is the gain value, and o f f s e t is the offset value.

2.4.2. Calculation of Surface Reflectivity

In quantitative remote sensing analysis, accurately acquiring surface-accurate reflectance data is a critical prerequisite for predicting soil nutrient content. However, apparent reflectance imagery is susceptible to interference from multiple environmental factors, such as cloud cover, variations in solar illumination conditions, and atmospheric aerosol distribution. Traditional atmospheric correction methods often struggle to eliminate these compound interferences effectively, leading to systematic bias in reflectance data. Based on previous research findings, this study employs the second-generation vector radiative transfer model, 6SV (Second Simulation of a Satellite Signal in the Solar Spectrum-Vector). This model improves reflectance calculation accuracy under complex atmospheric conditions through enhanced polarization algorithms and atmospheric parameterization schemes.
For detailed information about the 6SV model, please refer to our team’s published articles [1]. We utilized the Landsat 8 Atmospheric Correction Program (LaSRC) based on the 6SV2.1 model, which was implemented in the Remote Sensing Desktop (RSD) 3.1.6 software, to perform atmospheric correction on multi-temporal remote sensing images. This process enabled us to obtain surface reflectance data for the study area. The calculation formula is as follows:
R * θ S , θ V , Φ V = T g θ S , θ V R a θ S , θ V , Φ V + T θ S 1 R P S R C e τ μ V + R P T d θ V
In Formula (2), T g designates the gaseous transmission by the water vapor, ozone, or other gases, R a θ S , θ V , Φ V is the path radiation caused by the Rayleigh scattering and aerosol scattering, θ S is the zenith angle of the sun, θ V is the observation zenith angle, Φ V is the azimuth angle, T θ S is the total downlink radiation transmittance, T d θ V is the total uplink radiation transmittance, e τ μ V is the uplink radiation directly projected to the sensor, μ V = c o s θ V is the cosine of the zenith angle of the satellite, τ is the atmospheric optical thickness, R P is the non-uniform target reflectivity, and R C represents the proximity effect, R * θ S , θ V , Φ V is the apparent reflectance of the top atmospheric layer accepted by the sensor [42].

2.5. Modeling Methods and Accuracy Evaluation

For this research requirement, we plan to use spectral data of soil samples to establish multiple prediction models for calculating the distribution of six soil nutrient contents. Based on preliminary research data, single-band modeling methods have shown poor prediction accuracy and lack significant predictive capability. Among multi-band modeling methods, Multiple Linear Regression (MLR), Partial Least Squares Regression (PLSR), and Support Vector Machine (SVM) have been validated, with results indicating that the SVM method achieves higher prediction accuracy and demonstrates excellent classification and generalization capabilities. Therefore, this study primarily employs multi-band modeling methods. Building on the established finding that SVM exhibits higher accuracy in soil texture prediction models, we conduct modeling and prediction research for six common soil nutrient indicators, similarly adopting MLR, PLSR, and SVM methods to validate the predictive performance of different approaches further.
The Landsat8 OLI image contains nine bands, with their wavelength ranges in Table 2. The surface reflectance data calculated in this study include Bands 1–7. We define the independent variable x i as all Bands 1–7 surface reflectance data. In contrast, the dependent variable y j is the content of the six different soil nutrients. The regression equation between x i and y j was established using the MLR and PLSR methods as follows:
y j = b + i = 1 7 k i · x i
In Equation (3), j = 1 ,   2 ,   3 , 4,5 , 6 , where y 1 represents the content of Organic Matter in the soil; y 2 represents Total N; y 3 represents Total P; y 4 represents Total K; y 5 represents Available P; and y 6 represents Available K. MATLAB 2016a software was used to establish different regression models and calculate the coefficients k i and b of the MLR and PLSR regression equations.
The SVM model was implemented using MATLAB as the development platform, with the core algorithm executed through the libSVM toolbox. The function interfaces utilized were svmtrain and svmpredict. Dataset partitioning was performed via random sampling, allocating 70% of the data for training and 30% for validation. Other critical parameter configurations were set as follows: SVM type as epsilon-SVR; kernel type as Radial Basis Function (RBF); gamma as 2.8 (gamma in kernel function); cost as 1 (the parameter epsilon-SVR); and epsilon as 0.05 (the epsilon in loss function of epsilon-SVR).
This study established a multivariate statistical indicator system to evaluate the model’s predictive performance comprehensively. Core metrics, including the coefficient of determination (R2), mean squared error (MSE), and F-value (F-test statistic), were employed to validate the prediction accuracy. These metrics can be calculated using the following Equations (4)–(6):
R 2 = 1 i = 1 m y ^ i y i 2 / i = 1 m y ¯ i y i 2
M S E = 1 m i = 1 m y i y ^ i 2
F = i = 1 m y ¯ i y i 2 i = 1 m y ^ i y i 2 / i = 1 m y ¯ i y i 2
In the above equations, y i and y ^ i are the actual and predicted values of the soil nutrient’s content, respectively. y ¯ i is the mean of a set of valid values of the soil nutrient’s content, and m is the number of samples in the model. R 2 is calculated in the range of (0, 1), where values closer to 0 indicate poorer model prediction performance, while values approaching 1 signify better model performance. The M S E , as a core metric for measuring the dispersion of prediction errors, indicates superior prediction accuracy and stability when its value approaches zero. The F value, on the other hand, is used to assess the statistical significance of the model, and an increase in this metric directly reflects an enhanced comprehensive ability of the model to explain variable relationships. The optimal prediction model can be selected by systematically comparing the performance characteristics of these two metrics. Subsequently, based on the surface reflectance dataset of the study area, the spatial distribution characteristics of soil nutrient content can be accurately inverted.

2.6. Comprehensive Evaluation of Soil Fertility

2.6.1. Constructing Membership Functions

The membership function is a crucial concept in fuzzy mathematics. Given the diversity of soil physicochemical indicators and their dimensional differences, introducing membership functions based on fuzzy mathematics effectively addresses the quantification of soil fertility indicators. This approach ensures comparability and uniformity across various soil indicators, laying the foundation for establishing soil fertility evaluation indices and classifying fertility levels. Standard theoretical models of membership functions include the “S”-shaped, inverse “S”-shaped, and parabolic types. This study’s primary theoretical models selected for the membership functions are the “S”-shaped and parabolic types [3].
Indicators modeled using the S-shaped membership function include soil Organic Matter (OM), Total N (TN), Total P (TP), Total K (TK), Available P (AP), and Available K (AK). These indicators generally correlate positively with crop yield within a specific range. However, below or above this range, their variations have a relatively minor impact on soil productivity. The functional expression is as follows:
f x 1.0 ,     x x 2 0.9 x x 1 / ( x 2 x 1 0.1 ,     x x 1 ) + 0.1 ,         x 1 < x < x 2
Indicators modeled using the parabolic membership function include Clay Content (Clay) and Silt-to-Clay Ratio (S/C). These indicators exhibit an optimal range for crop growth—deviations beyond this range increasingly negatively affect crop productivity. The functional expression is as follows:
f x 0.1 + 0.9 ( x x 3 ) / ( x 4 x 3 ) , x 3 x < x 4 1.0 , x 2 x < x 3 0.9 ( x x 1 ) / ( x 2 x 1 ) , x 1 x < x 2 0.1 , x < x 1   o r   x x 4
In the above equations, x represents the content of a specific soil indicator, and x 1 ,   x 2 ,   x 3 ,   x 4 represent the inflection point values of the membership function of a specific indicator. We refer to the agricultural land classification standards and the actual situation of the local soil in the study area to determine the inflection point values of the membership function (Table 3). f x represents the membership function value of a specific soil indicator. Based on the above function, the membership values of various fertility indicators can be calculated, with a membership value range of 0.1 to 1.0. The maximum value of 1.0 indicates that the indicator is suitable for crop growth, while the minimum value of 0.1 means that the fertility indicator is severely lacking.

2.6.2. Determine the Weight of Each Soil Indicator

The weight of indicators can reflect the degree of influence of each evaluation index on the comprehensive fertility of soil. Individual indicators play varying roles and hold various positions in soil fertility; thus, their impact on soil fertility differs. Previous evaluations mainly determined weight coefficients through expert scoring methods, which are relatively subjective. In addition to the expert experience scoring method, commonly used weight calculation methods include the Delphi method, Analytic Hierarchy Process (AHP), Principal Component Analysis (PCA), and correlation coefficient method. Among these, the correlation coefficient method can objectively assign appropriate weights to evaluation indicators, avoiding interference from subjective human factors. Therefore, this study adopts the correlation coefficient method to calculate the weights [2].
The first step is calculating the correlation coefficients between each evaluation index to determine weights using the correlation coefficient method. Then, the average correlation coefficient of a given evaluation index with all other evaluation indices is computed. Finally, the ratio of this average correlation coefficient to the sum of all average correlation coefficients is obtained, which serves as the weight of that individual index. Based on the soil indicator data collected from sampling, this study calculated the weights for OM, TN, TP, TK, AP, AK, Clay, and S/C as 0.133, 0.139, 0.122, 0.129, 0.113, 0.133, 0.134, and 0.097, respectively.

2.6.3. Soil Fertility Evaluation

The index sum method is the most commonly used approach for classifying soil fertility grades. The Integrated Fertility Index (IFI) is based on the principles of addition and multiplication in fuzzy mathematics. It is calculated by multiplying the membership function value of each evaluation indicator by its corresponding weight in each evaluation unit, and then summing these products. The formula is as follows:
I F I = f i × W i
In Equation (9), f i represents the membership function value of a specific evaluation indicator; W i represents the weight value of a particular indicator of evaluation. This study selected 8 evaluation indicators, i = 1 ,   2 ,   3 ,   4 ,   5 ,   6 ,   7 ,   8 , namely OM, TN, TP, TK, AP, AK, Clay, S/C. I F I represents the comprehensive evaluation index of soil fertility, and the closer the value is to 1, the higher the soil fertility.
Soil fertility levels are classified based on the grading standards in the “China Farmland Quality Grade Evaluation Index System” and divided into five levels according to the actual situation in the study area (Table 4). The soil fertility levels decrease progressively from Grade I to Grade V.

3. Results and Analysis

3.1. Establishment and Validation of Soil Nutrient Prediction Model

Based on the multi-band surface reflectance data from the 6SV atmospheric correction model, prediction models for six soil nutrient contents at 0–60 cm depth were established using MLR, PLSR, and SVM methods (Table 5 and Table 6). Consistent with previous soil texture prediction model studies, the SVM method demonstrated higher prediction accuracy than MLR and PLSR. The performance ranking of the models was: 6SV-SVM > 6SV-MLR > 6SV-PLSR. Data analysis revealed significant differences in the accuracy of nutrient content prediction models established by different methods, indicating notable applicability variations among these approaches during the modeling and prediction. These differences directly impact the subsequent accuracy of soil fertility assessments.
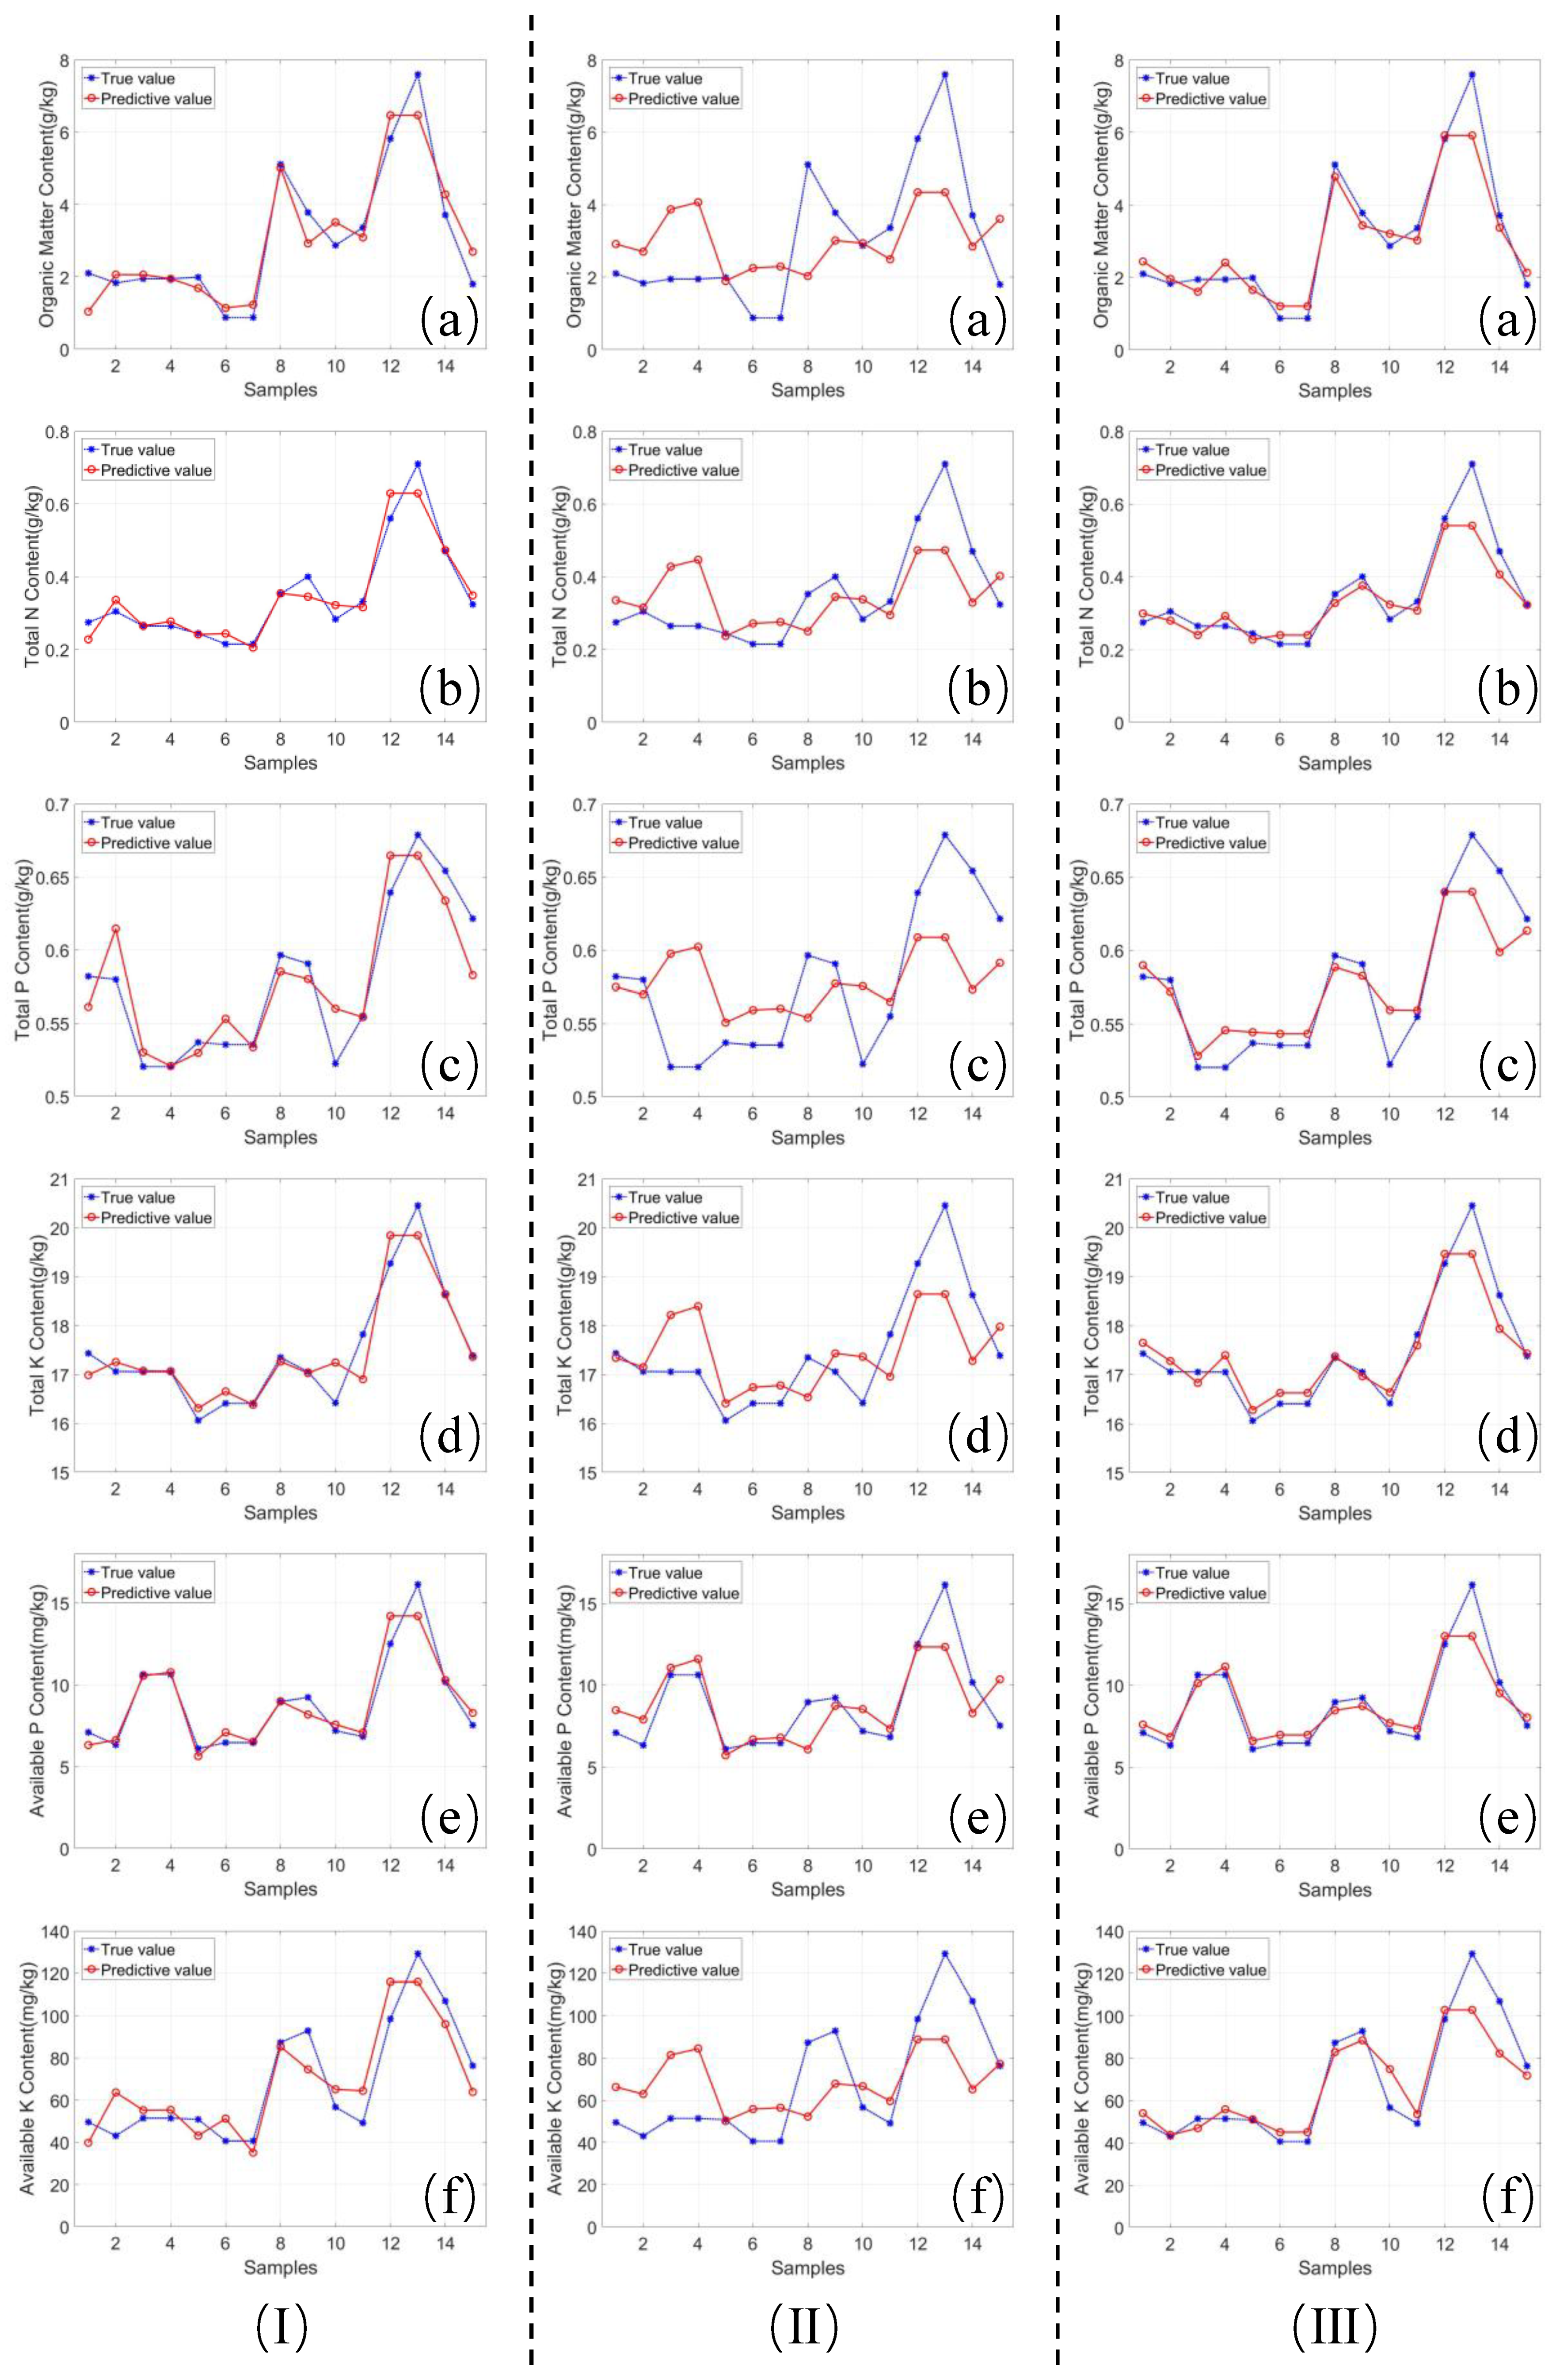
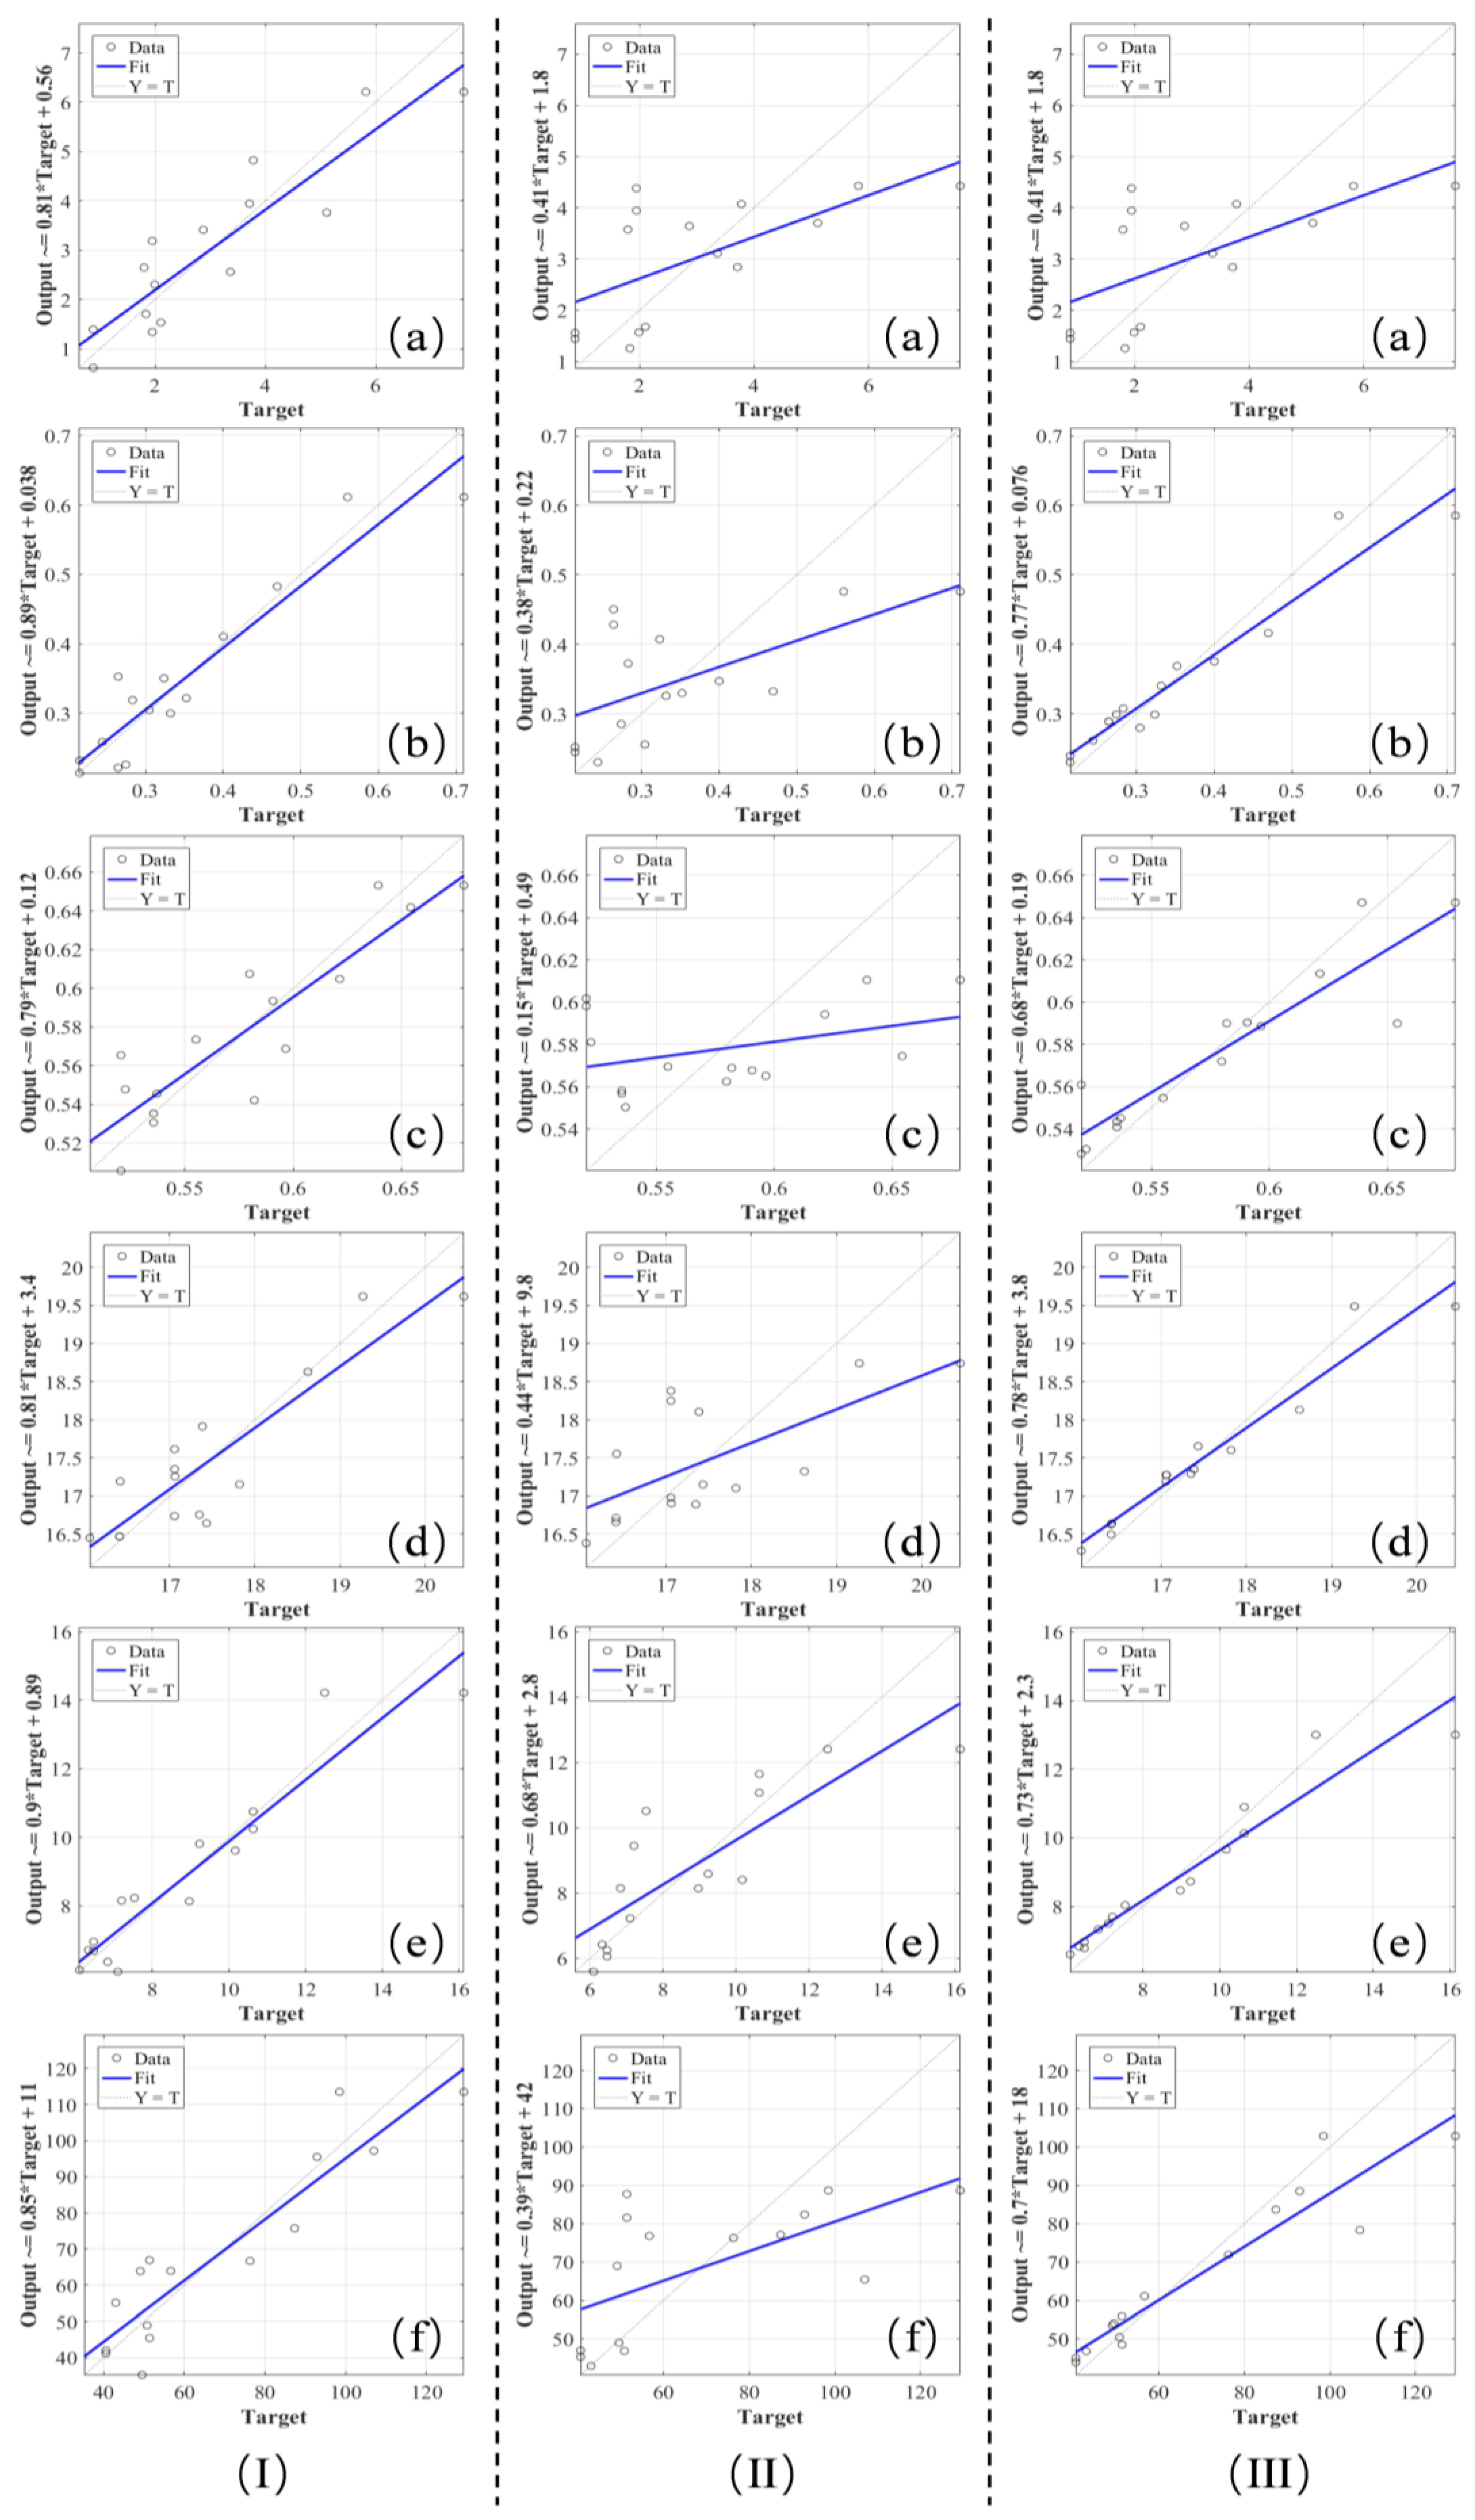
Analyzing the fitting effect diagram (Figure 4) of the predicted values and real values of the three models established using the 6SV correction data and the dispersion degree of the points in the regression diagram (Figure 5) shows that the 6SV-MLR model’s prediction accuracy is not very good (Figure 4I and Figure 5I). It is lower than the 6SV-SVM model, in which R 2 = 0.815 and F = 4.396 (Organic Matter), R 2 = 0.891 and F = 8.149 (Total N), R 2 = 0.795 and F = 3.877 (Total P), R 2 = 0.806 and F = 4.144 (Total K), R 2 = 0.899 and F = 8.945 (Available P), and R 2 = 0.846 and F = 5.480 (Available K). The nutrient’s content prediction accuracy of the 6SV-PLSR model is also poor (Figure 4II and Figure 5II), in which the highest prediction accuracy of the Available P content is only R 2 = 0.682 , while the other contents are R 2 = 0.407 (Organic Matter), R 2 = 0.378 (Total N), R 2 = 0.150 (Total P), R 2 = 0.441 (Total K), and R 2 = 0.385 (Available K), respectively; and the generated model can hardly reach the prediction accuracy. The 6SV-SVM model has the highest prediction ability for 6 nutrients’ contents (Figure 4III and Figure 5III), in which R 2 = 0.956 and M S E = 0.005 (Organic Matter), R 2 = 0.936 and M S E = 0.007 (Total N), R 2 = 0.877 and M S E = 0.020 (Total P), R 2 = 0.946 and M S E = 0.006 (Total K), R 2 = 0.926 and M S E = 0.009 (Available P), and R 2 = 0.897 and M S E = 0.015 (Available K).

3.2. The Inversion of Various Soil Indicators

Based on the soil nutrient content prediction model established using the 6SV-SVM method mentioned above, combined with the soil particle size content prediction model developed in previously published research, we conducted inversion predictions for surface soil indicators in the study area over 10 years (2015, 2018, 2021, and 2025).
First, the RSD3.1.6 software was used to perform 6SV atmospheric correction on the preprocessed remote sensing images from the four periods, obtaining surface reflectance images for the entire study area at different times. Next, the reflectance data of each pixel in the images were extracted and imported into MATLAB software. Using our established 6SV-SVM models, we calculated the following indicators for each pixel within the study area: OM, TN, TP, TK, AP, AK, Clay, and S/C. The resulting data were then exported.
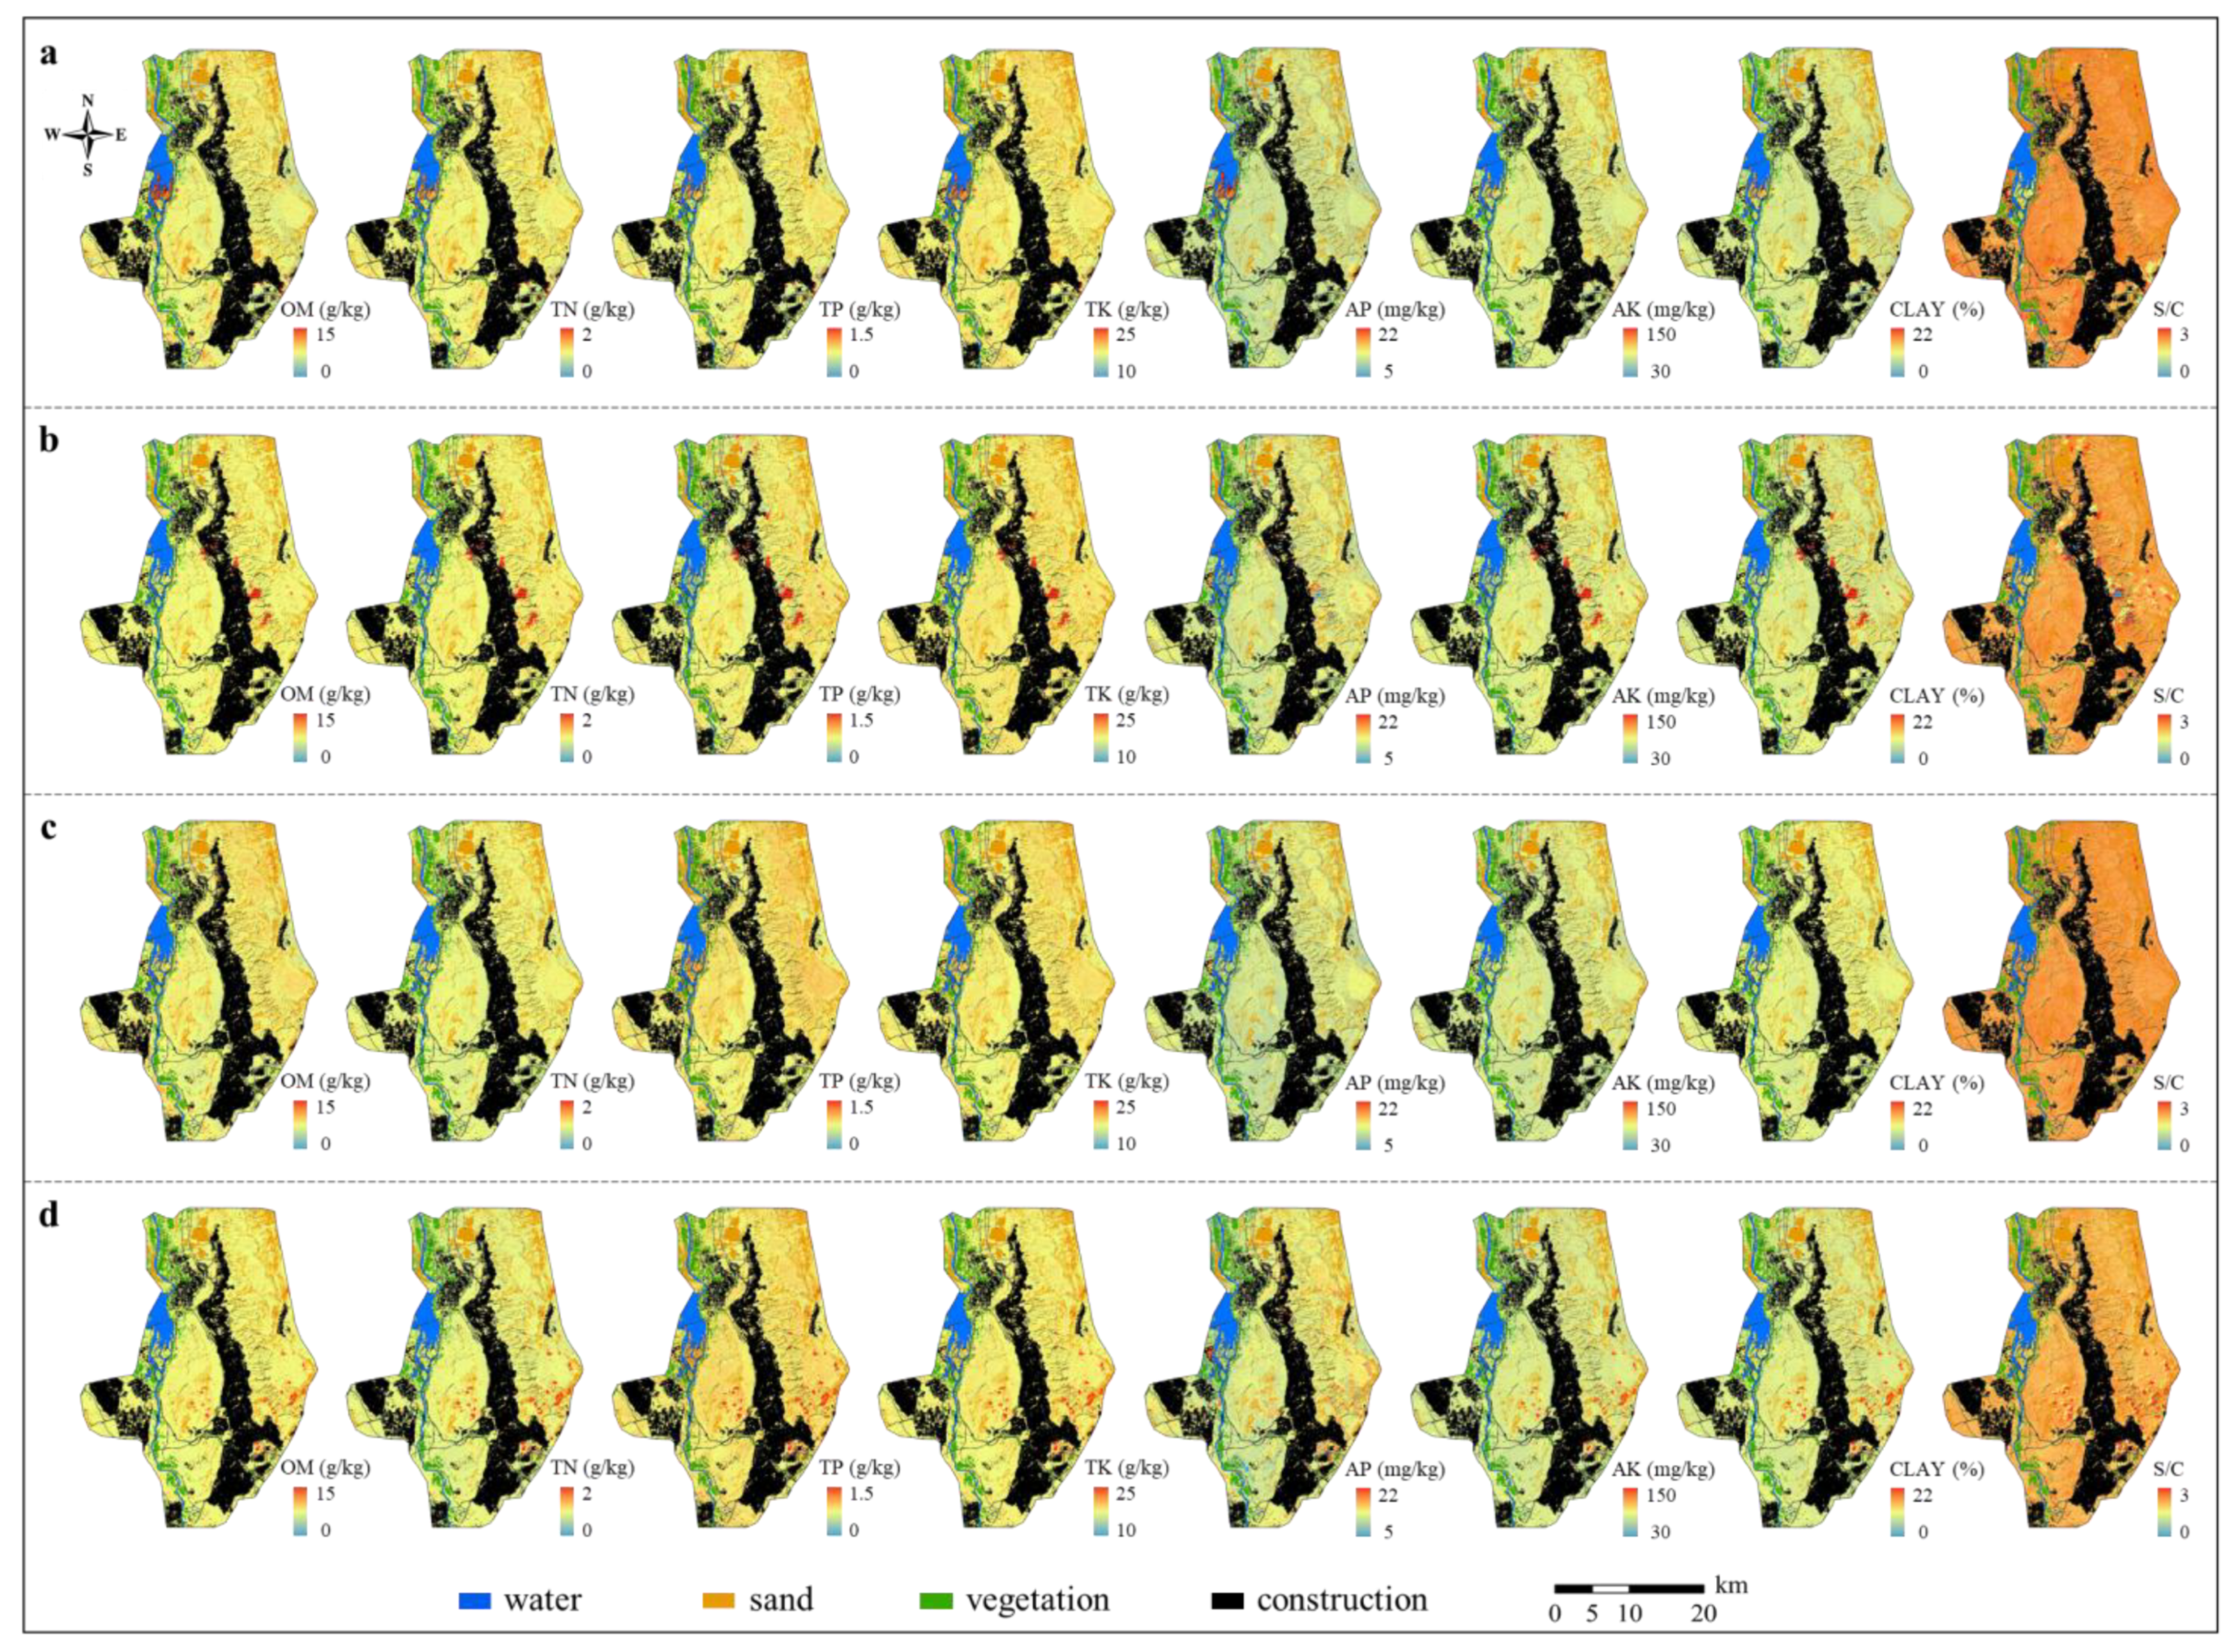
Subsequently, the data were imported into ArcGIS10.4.1 software and overlaid with classification layers of other land cover types in the study area. This process ultimately yielded the inversion results of surface soil indicators for the study area over the 10 years (2015, 2018, 2021, and 2025), as shown in Figure 6.
The statistical characteristic values of various soil indicators in the study area for 2015, 2018, 2021, and 2025 are shown in Table 7. From Table 7, we can make the following observations.
In the surface soil of the study area in 2015, the ranges (difference between max and min) of OM, TN, TP, TK, AP, AK, Clay, and S/C were 9.48 g/kg, 1.18 g/kg, 0.61 g/kg, 9.46 g/kg, 14.86 mg/kg, 102.30 mg/kg, 15.12%, and 2.64, respectively. The mean values were 4.84 g/kg, 0.49 g/kg, 0.58 g/kg, 17.48 g/kg, 9.63 mg/kg, 84.36 mg/kg, 9.98%, and 1.69, respectively.
In 2018, the ranges of OM, TN, TP, TK, AP, AK, Clay, and S/C were 8.62 g/kg, 1.22 g/kg, 0.68 g/kg, 10.90 g/kg, 14.07 mg/kg, 104.33 mg/kg, 18.00%, and 2.65, respectively. The mean values were 5.16 g/kg, 0.45 g/kg, 0.61 g/kg, 18.31 g/kg, 9.96 mg/kg, 86.75 mg/kg, 10.11%, and 1.61, respectively.
In 2021, the range of OM, TN, TP, TK, AP, AK, Clay, and S/C were 9.92 g/kg, 1.87 g/kg, 0.81 g/kg, 9.58 g/kg, 14.44 mg/kg, 98.38 mg/kg, 15.86%, and 2.76, respectively. The mean values were 5.54 g/kg, 0.43 g/kg, 0.60 g/kg, 18.08 g/kg, 11.38 mg/kg, 89.32 mg/kg, 9.17%, and 1.75, respectively.
In 2025, the range of OM, TN, TP, TK, AP, AK, Clay, and S/C were 10.67 g/kg, 1.41 g/kg, 0.70 g/kg, 9.53 g/kg, 13.78 mg/kg, 111.13 mg/kg, 16.37%, and 2.83, respectively. The mean values were 5.98 g/kg, 0.48 g/kg, 0.66 g/kg, 18.41 g/kg, 11.69 mg/kg, 94.98 mg/kg, 9.67%, and 1.60, respectively.
Except for TN, TP, and S/C, the content levels of other soil indicators within a single year are distributed between extreme values with significant variability. A comparison of the four-phase data reveals that from 2015 to 2025, the ranges (difference between extremes) of six indicators—OM, TN, TP, AK, Clay, and S/C—all exhibited a fluctuating upward trend, with increases of 12.55%, 19.49%, 14.75%, 8.63%, 8.26%, and 7.19%, respectively. The range of TK remained stable with fluctuations, showing no clear trend, and the overall variation was less than 1%. Only AP showed a decreasing trend in its range, with a reduction of 7.27%. The mean values of TN, TK, Clay, and S/C fluctuated steadily without a significant trend, with variations remaining within 5%. In contrast, the mean values of OM, TP, AP, and AK displayed an upward trend, increasing by 23.55%, 13.79%, 21.39%, and 12.59%, respectively.
According to the nutrient classification standards of China’s Second National Soil Survey (Table 8), during the period from 2015 to 2025, the proportion of soil OM content in the study area classified as Level VI (Extremely poor, <6 g/kg) was the highest, accounting for 44.56%, 45.17%, 43.97%, and 44.09% of the total, respectively. The proportion of TN content classified as Level VI (Extremely poor, <0.5 g/kg) was the highest, accounting for 51.39%, 50.12%, 53.61%, and 53.02% of the total, respectively. The proportion of TP content classified as Level IV (Moderate, 0.4–0.6 g/kg) was the highest, accounting for 48.13%, 45.96%, 44.22%, and 45.34% of the total, respectively. The proportion of TK content classified as Level III (Relatively rich, 15–20 g/kg) was the highest, accounting for 49.00%, 51.30%, 52.07%, and 51.67% of the total, respectively. The proportion of AP content classified as Level IV (Moderate, 5–10 mg/kg) was the highest, accounting for 40.60%, 39.54%, 36.07%, and 34.98% of the total, respectively. The proportion of AK content classified as Level IV (Moderate, 50–100 mg/kg) was the highest, accounting for 40.16%, 42.29%, 41.88%, and 43.61% of the total, respectively. The K-S test (p > 0.05) indicated that the soil indicators followed a normal or log-normal distribution.

3.3. Comprehensive Evaluation of Soil Fertility

Based on the inversion results of various soil indicators in the study area, calculated using the 6SV-SVM model, membership functions were constructed for eight indicators (OM, TN, TP, TK, AP, AK, Clay, S/C). Combined with the weights of each indicator, the soil Integrated Fertility Index (IFI) was calculated. Subsequently, in ArcGIS software, the soil fertility of the study area was classified into different grades, and the spatial distribution maps of the soil IFI for four periods (2015, 2018, 2021, and 2025) were generated (Figure 7).
Table 9 shows that the average soil fertility indices for 2015, 2018, 2021, and 2025 were 0.29, 0.32, 0.30, and 0.36, respectively. According to the soil fertility classification criteria in Table 4, the overall soil fertility level in the study area was relatively low (Grade IV). The soil fertility indices for 2015, 2018, 2021, and 2025 ranged from 0.11–0.90, 0.17–0.90, 0.12–0.88, and 0.19–0.89, respectively, with extreme value differences of 0.79, 0.73, 0.76, and 0.70, indicating significant variation in soil fertility indices within the same year. Specifically, the minimum soil fertility index in 2015 was 0.08 lower than in 2025, while the maximum value was 0.01 higher than in 2025. The average value in 2015 was 0.07 lower than in 2025, suggesting varying degrees of change in different levels of soil fertility over the 10 years.

3.4. Spatiotemporal Variation Characteristics of Soil Fertility

The spatial distribution maps of various soil indicators (Figure 6) show that in 2015, the area with soil OM content < 5 g/kg accounted for the most significant proportion at 72.83%. By 2025, the area with OM content < 6 g/kg became the most considerable proportion at 69.77%, indicating an overall increasing trend in organic matter content, albeit with a relatively low growth rate. Similarly, from 2015 to 2025, the ranges with the highest area proportions for soil TP, AP, and AK all showed varying degrees of increase. Specifically, the ranges shifted from <0.6 g/kg, 5–10 mg/kg, and 30–85 mg/kg to <0.65 g/kg, 5–11 mg/kg, and 30–90 mg/kg, respectively, reflecting a slight overall upward trend.
In 2015, the ranges with the highest area proportions for soil TN, TK, Clay, and S/C were <0.6 g/kg, 14–18 g/kg, <10%, and <1.6, accounting for 50.34%, 78.85%, 68.16%, and 53.65% of the area, respectively. By 2025, the same ranges remained the most dominant for TN, TK, Clay, and S/C, with proportions of 53.67%, 74.10%, 70.21%, and 56.17%, respectively. In summary, from 2015 to 2025, the spatial distribution of various soil indicators in the study area exhibited specific differences. The contents of OM, TP, AP, and AK showed varying degrees of increase within different ranges, though the overall growth was generally modest. In contrast, TN, TK, Clay, and S/C did not exhibit significant changes.
The spatial distribution map of the soil fertility index shows that plots of different grades are scattered in patchy patterns across various regions. Analysis of Figure 7 indicates that in 2015, 2018, 2021, and 2025, Grade IV soil fertility predominated, accounting for 31.74%, 31.07%, 32.58%, and 32.10% of the area, respectively, primarily distributed in the central and northeastern parts of the study area. Areas with Grade I and II fertility were extremely scarce, accounting for 3.09%, 3.10%, 3.59%, and 4.07% of the area, respectively, mainly located in agricultural zones surrounding rural areas of the study region. Notably, the most significant change over the decade from 2015 to 2025 was observed in Grade V fertility, with its area proportion decreasing from 26.78% to 22.59%, a decline of 18.55%. Comparative data reveal that from 2015 to 2025, the area of Grade V soil fertility continuously decreased, while the area of Grades I–IV progressively increased, indicating an overall upward trend in soil fertility levels across the study area. Additionally, the disparity in soil fertility levels within the study area generally showed a decreasing trend, moving toward a more homogenized distribution.

4. Discussion

4.1. The Effectiveness of Predicting the Spatial Distribution of Soil Fertility Using Surface Spectral Reflectance Data

As a core element of land ecological sustainability, soil fertility exhibits significant spatiotemporal heterogeneity, primarily attributed to the dynamic variations in soil physicochemical properties and nutrient elements. In the field of mine environmental restoration, monitoring soil fertility levels and their spatial differentiation patterns in reclaimed areas through spectral technology has become a crucial basis for evaluating restoration effectiveness. Since differences in soil composition induce variations in surface spectral reflectance characteristics, this optical property effectively tracks soil improvement processes. Existing research has confirmed that the multi-source information fusion of bare soil remote sensing imagery and laboratory spectral data enables accurate inversion and rapid assessment of soil parameters.
In western China’s arid and semi-arid open-pit coal mining areas, ecological restoration and topsoil reconstruction during reclamation require effective methods for dynamically monitoring surface soil fertility levels and their spatial distribution characteristics. Building upon successful research on multispectral remote sensing monitoring methods for soil particle size, this study further considers using Landsat8 OLI surface reflectance data. Multiple soil indicator models were established in Wuhai City, Inner Mongolia Autonomous Region, China. The 6SV-SVM modeling method was employed to analyze the prediction accuracy for surface soil indicators such as OM, TN, TP, TK, AP, and AK. Based on the inversion results of these indicators, a comprehensive soil fertility evaluation method was constructed to achieve rapid soil fertility assessment and long-term change analysis.

4.2. Applicability and Limitations

Limited by the influence of factors such as the soil moisture and surface vegetation coverage, the 6SV-SVM prediction model for surface soil indicators and the comprehensive soil fertility evaluation method established in this study based on Landsat8 OLI imagery are more effectively applicable to arid and semi-arid climate regions with significant topographic relief. In the study area, the prediction accuracy (R2) for six surface soil nutrient contents—OM, TN, TP, TK, AP, and AK—exceeded 0.85, with OM, TN, TK, and AP achieving R2 values above 0.9. Furthermore, the comprehensive soil fertility evaluation method, developed based on these indicator prediction models, enabled the analysis of soil fertility evaluation and change characteristics over 10 years (2015–2025) in the study area. This provides a practical approach for dynamically monitoring soil fertility changes, supporting ecological restoration and soil reconstruction efforts in mining areas in China’s western arid and semi-arid regions. Meanwhile, in major coal-producing regions worldwide with similar physiographic characteristics—including Xinjiang, China (e.g., Zhundong Coalfield), Wyoming, USA (e.g., Powder River Basin), Arizona, USA (e.g., Black Mesa), Queensland, Australia (e.g., Peak Downs), Limpopo Province, South Africa (e.g., Waterberg Coalfield), Gobi-Altai Coal Region, Mongolia (e.g., Ovoot Tolgoi), and Barmer Lignite Field in Rajasthan, India—the 6SV-SVM-based prediction model for surface soil indicators and comprehensive soil fertility assessment method established in this study using Landsat8 OLI imagery demonstrate potential applicability. However, localized experimental studies are required to verify their significant transferability. Future research could focus on extending the application of this methodology to address common challenges in achieving sustainable development of global mining areas.
This study adopts the 6SV-SVM approach by thoroughly considering the unique challenges in arid mining area research, achieving an optimal balance among three critical factors: sample scarcity (prohibitively high costs for extensive field sampling), spectral complexity (interference from mining activities, climate, and topography), and engineering practicality (including computational efficiency considerations). Currently constrained by sampling costs (approximately $500 per additional soil sampling point, including collection and laboratory analysis), the model’s generalization capability could still be moderately improved with increased sampling density. However, it must be acknowledged that enhancing sampling density exhibits a distinct ceiling effect on improving generalization—unthinkingly pursuing high-density sampling may lead to cost-benefit imbalance, reduced cost-effectiveness, and even risks of over-sampling that could generate localized outliers. Future research could explore active learning methods to optimize sampling locations based on model uncertainty quantification dynamically. Furthermore, if subsequent studies can acquire larger sample sizes through additional field surveys, hybrid architectures combining CNN and SVM (e.g., using SVM as CNN’s classifier head) could be implemented to achieve higher inversion accuracy.
Furthermore, the limited resolution of the imagery data used in this study necessitates future research employing higher-resolution datasets (e.g., Sentinel-2). Enhanced spatial resolution will improve land-cover classification accuracy and the delineation precision of different fertility zones. Additionally, shorter revisit cycles and higher temporal resolution will enable more comprehensive monitoring of small-scale dynamic processes while reducing observation gaps caused by cloud contamination, thereby significantly improving the detection accuracy of soil fertility variation characteristics at finer scales. Future integration of UAV imagery with satellite data for fusion analysis could further overcome spatiotemporal observation limitations, facilitating refined monitoring of reclaimed mining soils to continuously enhance the accuracy of soil fertility assessment and spatiotemporal change detection.

5. Conclusions

This study focuses on soil fertility assessment and spatiotemporal variation monitoring in western China’s arid and semi-arid mining areas. Utilizing Landsat8 OLI multispectral imagery and measured soil sample nutrient content data, and building upon existing research findings, the study further investigates multiple aspects, including the establishment and evaluation of inversion models for various soil indicators, the construction of comprehensive soil fertility evaluation methods, and the analysis of spatiotemporal variation in soil fertility. The research thoroughly evaluated soil fertility for four periods (2015, 2018, 2021, and 2025) in the study area, and analyzed the spatial distribution characteristics of soil fertility changes over 10 years. The results indicate the following:
(1)
The 6SV-SVM prediction model for surface soil indicators developed using Landsat 8 OLI imagery achieved high prediction accuracy (R2 > 0.85) for six soil nutrient contents in the study area. This study established the first rapid assessment method for comprehensive surface soil fertility based on multispectral remote sensing monitoring, effectively addressing the limitations of single-indicator inversion approaches.
(2)
The methodology successfully enabled long-term sequential evaluation of individual soil indicators and spatial distribution patterns of comprehensive soil fertility. This provides a scientific basis for monitoring spatiotemporal variations in soil quality across undulating arid and semi-arid terrains, offering a practical solution for long-term soil quality monitoring.
(3)
Future research could further analyze soil fertility dynamics in heterogeneous landscapes under varying disturbance gradients (e.g., mining intensity, vegetation recovery stages, soil erosion levels) in arid mining areas. Quantitative investigation of the relationship between soil fertility evolution and mining lifecycle phases (exploration → extraction → closure) holds significant research potential for understanding soil fertility change patterns and optimizing regional soil ecological conservation strategies.

Author Contributions

Conceptualization, Q.L. and Z.H.; methodology, Q.L.; software, Q.L. and Y.G. (Yulong Geng); investigation, Y.G. (Yanwen Guo); resources, Y.G. (Yanwen Guo); data curation, Q.L.; writing—original draft preparation, Q.L.; writing—review and editing, Z.H.; visualization, Q.L.; supervision, Z.H.; project administration, Z.H.; funding acquisition, Q.L. All authors have read and agreed to the published version of the manuscript.

Funding

This research was supported by “the Fundamental Research Funds for the Central Universities (Ph.D. Top Innovative Talents Fund of CUMTB), grant number BBJ2025037”.

Data Availability Statement

Data are contained within the article.

Acknowledgments

The authors thank the Institute of Land Reclamation and Ecological Reconstruction for their help in this research.

Conflicts of Interest

The authors declare no conflicts of interest.

References

  1. Li, Q.; Hu, Z.; Zhang, F.; Song, D.; Liang, Y.; Yu, Y. Multispectral Remote Sensing Monitoring of Soil Particle-Size Distribution in Arid and Semi-Arid Mining Areas in the Middle and Upper Reaches of the Yellow River Basin: A Case Study of Wuhai City, Inner Mongolia Autonomous Region. Remote Sens. 2023, 15, 2137. [Google Scholar] [CrossRef]
  2. Li, H.; Jiang, X. Spatiotemporal characteristics of soil nutrients and fertility valuation of agricultural land in the Huang-Huai-Hai Plain agricultural area: A case study of Boxing County, Shandong Province. J. Agric. Resour. Environ. 2022, 39, 602–612. [Google Scholar] [CrossRef]
  3. Xu, J.; Zhang, G. Indices and Assessment of Soil Quality; Science Press: Beijing, China, 2010. [Google Scholar]
  4. Bi, Y.L.; Peng, S.P.; Du, S.Z. Technological difficulties and future directions of ecological reconstruction in open pit coal mine of the arid and semi-arid areas of Western China. J. China Coal Soc. 2021, 46, 1355–1364. [Google Scholar] [CrossRef]
  5. Han, J.Z.; Hu, Z.Q.; Wang, P.J.; Yan, Z.G.; Li, G.S.; Zhang, Y.H.; Zhou, T. Spatio-temporal evolution and optimization analysis of ecosystem service value—A case study of coal resource-based city group in Shandong, China. J. Clean. Prod. 2022, 363, 12. [Google Scholar] [CrossRef]
  6. Hu, Z.Q.; Zhao, Y.L. Main problems in ecological restoration of mines and their solutions. China Coal 2021, 47, 2–7. [Google Scholar] [CrossRef]
  7. Hu, Z.Q.; Zhao, Y.L. Principle and technology of coordinated control of eco-environment of mining areas and river sediments in Yellow River watershed. J. China Coal Soc. 2022, 47, 438–448. [Google Scholar] [CrossRef]
  8. Xi, J.P. Speech at the symposium on ecological protection and high-quality development in the Yellow River basin. Water Conserv. Constr. Manag. 2019, 39, 1–3+6. [Google Scholar] [CrossRef]
  9. Clark, R.N.; Roush, T.L. Reflectance spectroscopy: Quantitative analysis techniques for remote sensing applications. J. Geophys. Res. Solid Earth 1984, 89, 6329–6340. [Google Scholar] [CrossRef]
  10. Domínguez-Haydar, Y.; Velásquez, E.; Carmona, J.; Lavelle, P.; Chavez, L.F.; Jiménez, J.J. Evaluation of reclamation success in an open-pit coal mine using integrated soil physical, chemical and biological quality indicators. Ecol. Indic. 2019, 103, 182–193. [Google Scholar] [CrossRef]
  11. Bao, N.S.; Liu, S.J.; Zhou, Y.C. Predicting particle-size distribution using thermal infrared spectroscopy from reclaimed mine land in the semi-arid grassland of North China. Catena 2019, 183, 104190. [Google Scholar] [CrossRef]
  12. Madari, B.E.; Reeves, J.B.; Machado, P.; Guimaraes, C.M.; Torres, E.; McCarty, G.W. Mid- and near-infrared spectroscopic assessment of soil compositional parameters and structural indices in two Ferralsols. Geoderma 2006, 136, 245–259. [Google Scholar] [CrossRef]
  13. Ben-Dor, E.; Chabrillat, S.; Demattê, J.A.M.; Taylor, G.R.; Hill, J.; Whiting, M.L.; Sommer, S. Using Imaging Spectroscopy to study soil properties. Remote Sens. Environ. 2009, 113, S38–S55. [Google Scholar] [CrossRef]
  14. Fongaro, C.T.; Demattê, J.A.M.; Rizzo, R.; Lucas Safanelli, J.; Mendes, W.D.; Dotto, A.C.; Vicente, L.E.; Franceschini, M.H.D.; Ustin, S.L. Improvement of Clay and Sand Quantification Based on a Novel Approach with a Focus on Multispectral Satellite Images. Remote Sens. 2018, 10, 1555. [Google Scholar] [CrossRef]
  15. Shi, P.; Six, J.; Sila, A.; Vanlauwe, B.; Van Oost, K. Towards spatially continuous mapping of soil organic carbon in croplands using multitemporal Sentinel-2 remote sensing. ISPRS J. Photogramm. Remote Sens. 2022, 193, 187–199. [Google Scholar] [CrossRef]
  16. Wang, S.; Guan, K.; Zhang, C.; Lee, D.; Margenot, A.J.; Ge, Y.; Peng, J.; Zhou, W.; Zhou, Q.; Huang, Y. Using soil library hyperspectral reflectance and machine learning to predict soil organic carbon: Assessing potential of airborne and spaceborne optical soil sensing. Remote Sens. Environ. 2022, 271, 112914. [Google Scholar] [CrossRef]
  17. Xiao, J.; Shen, Y.; Tateishi, R.; Bayaer, W. Development of topsoil grain size index for monitoring desertification in arid land using remote sensing. Int. J. Remote Sens. 2007, 27, 2411–2422. [Google Scholar] [CrossRef]
  18. Duan, D.D.; Sun, X.; Liang, S.F.; Sun, J.; Fan, L.L.; Chen, H.; Xia, L.; Zhao, F.; Yang, W.Q.; Yang, P. Spatiotemporal Patterns of Cultivated Land Quality Integrated with Multi-Source Remote Sensing: A Case Study of Guangzhou, China. Remote Sens. 2022, 14, 1250. [Google Scholar] [CrossRef]
  19. Kumar, D.; Rizvi, R.H.; Bhatt, S.; Singh, R.; Chaturvedi, O.P. Land use/land cover change and soil fertility mapping using GIS and remote sensing: A case study of Parasai-Sindh watershed in Bundelkhand region of central India. Range Manag. Agrofor. 2021, 42, 15–21. [Google Scholar]
  20. Qv, W.; Du, H.; Wang, X. Remote Sensing Inversion of Soil Organic Matter Content in Straw-Returned Fields in China’s Black Soil Region. Sustainability 2024, 16, 7058. [Google Scholar] [CrossRef]
  21. Chen, F.; Kissel, D.E.; West, L.T.; Adkins, W.; Rickman, D.; Luvall, J.C. Mapping soil organic carbon concentration for multiple fields with image similarity analysis. Soil Sci. Soc. Am. J. 2008, 72, 186–193. [Google Scholar] [CrossRef]
  22. D’Acqui, L.P.; Pucci, A.; Janik, L.J. Soil properties prediction of western Mediterranean islands with similar climatic environments by means of mid-infrared diffuse reflectance spectroscopy. Eur. J. Soil Sci. 2010, 61, 865–876. [Google Scholar] [CrossRef]
  23. Levi, N.; Karnieli, A.; Paz-Kagan, T. Airborne imaging spectroscopy for assessing land-use effect on soil quality in drylands. ISPRS J. Photogramm. Remote Sens. 2022, 186, 34–54. [Google Scholar] [CrossRef]
  24. McCarty, G.W.; Reeves, J.B.; Reeves, V.B.; Follett, R.F.; Kimble, J.M. Mid-infrared and near-infrared diffuse reflectance spectroscopy for soil carbon measurement. Soil Sci. Soc. Am. J. 2002, 66, 640–646. [Google Scholar] [CrossRef]
  25. Shoshany, M.; Roitberg, E.; Goldshleger, N.; Kizel, F. Universal quadratic soil spectral reflectance line and its deviation patterns’ relationships with chemical and textural properties: A global data base analysis. Remote Sens. Environ. 2022, 280, 113182. [Google Scholar] [CrossRef]
  26. Zolfaghari, A.A.; Toularoud, A.A.S.; Baghi, F.; Mirzaee, S. Spatial prediction of soil particle size distribution in arid agricultural lands in central Iran. Arab. J. Geosci. 2022, 15, 1574. [Google Scholar] [CrossRef]
  27. Zhao, X.; Xu, Z.J.; Yin, J.P.; Bi, R.T.; Feng, J.F.; Liu, P. Retrieval of Soil Organic Carbon in Cinnamon Mining Belt Subsidence Area Based on OLI and 6SV. Spectrosc. Spect. Anal. 2019, 39, 886–893. [Google Scholar]
  28. Luo, C.; Zhang, W.; Zhang, X.; Liu, H. Mapping the soil organic matter content in a typical black-soil area using optical data, radar data and environmental covariates. Soil Tillage Res. 2024, 235, 105912. [Google Scholar] [CrossRef]
  29. Aksoy, S.; Yildirim, A.; Gorji, T.; Hamzehpour, N.; Tanik, A.; Sertel, E. Assessing the performance of machine learning algorithms for soil salinity mapping in Google Earth Engine platform using Sentinel-2A and Landsat-8 OLI data. Adv. Space Res. 2022, 69, 1072–1086. [Google Scholar] [CrossRef]
  30. Castaldi, F.; Hueni, A.; Chabrillat, S.; Ward, K.; Buttafuoco, G.; Bomans, B.; Vreys, K.; Brell, M.; van Wesemael, B. Evaluating the capability of the Sentinel 2 data for soil organic carbon prediction in croplands. ISPRS J. Photogramm. Remote Sens. 2019, 147, 267–282. [Google Scholar] [CrossRef]
  31. Castaldi, F.; Palombo, A.; Santini, F.; Pascucci, S.; Pignatti, S.; Casa, R. Evaluation of the potential of the current and forthcoming multispectral and hyperspectral imagers to estimate soil texture and organic carbon. Remote Sens. Environ. 2016, 179, 54–65. [Google Scholar] [CrossRef]
  32. Zhou, T.; Geng, Y.; Chen, J.; Pan, J.; Haase, D.; Lausch, A. High-resolution digital mapping of soil organic carbon and soil total nitrogen using DEM derivatives, Sentinel-1 and Sentinel-2 data based on machine learning algorithms. Sci. Total Environ. 2020, 729, 138244. [Google Scholar] [CrossRef]
  33. Chang, R.C.; Chen, Z.; Wang, D.M.; Guo, K. Hyperspectral Remote Sensing Inversion and Monitoring of Organic Matter in Black Soil Based on Dynamic Fitness Inertia Weight Particle Swarm Optimization Neural Network. Remote Sens. 2022, 14, 4316. [Google Scholar] [CrossRef]
  34. Dobarco, M.R.; Arrouays, D.; Lagacherie, P.; Ciampalini, R.; Saby, N.P.A. Prediction of topsoil texture for Region Centre (France) applying model ensemble methods. Geoderma 2017, 298, 67–77. [Google Scholar] [CrossRef]
  35. Dou, X.; Wang, X.; Liu, H.J.; Zhang, X.L.; Meng, L.H.; Pan, Y.; Yu, Z.Y.; Cui, Y. Prediction of soil organic matter using multi-temporal satellite images in the Songnen Plain, China. Geoderma 2019, 356, 113896. [Google Scholar] [CrossRef]
  36. Gulnara, K.; Kazbek, B.; Gulzhiyan, K.; Aidyn, A.; Linara, A. Use of the Earth Remote Sensing data for the monitoring of the level of soil fertility. In Proceedings of the 8th International Conference on Remote Sensing and Geoinformation of the Environment (RSCy), Paphos, Cyprus, 16–18 March 2020. [Google Scholar]
  37. Li, Y.S.; Chang, C.Y.; Wang, Z.R.; Li, T.; Li, J.W.; Zhao, G.X. Identification of Cultivated Land Quality Grade Using Fused Multi-Source Data and Multi-Temporal Crop Remote Sensing Information. Remote Sens. 2022, 14, 2109. [Google Scholar] [CrossRef]
  38. Liu, C.; Sun, Q.; Zhang, C.; Chen, W.T.; Qu, X.Z.; Tang, B.Y.; Ma, K.; Gu, X.H. Monitoring the interannual dynamic changes of soil organic matter using long-term Landsat images. Precis. Agric. 2025, 26, 50. [Google Scholar] [CrossRef]
  39. Liu, X.; Wang, M.; Liu, Z.; Bao, Y.; Li, X.; Wang, F.; Ji, X. Improving spatial prediction of soil organic matter in typical black soil area of Northeast China using structural equation modeling integration framework. Comput. Electron. Agric. 2025, 236, 110404. [Google Scholar] [CrossRef]
  40. Talukder, A.; Raghavendra, C.; Glenn, E.; Soc, I.C. AI-based Soil Fertility Quality Estimation from Remote Sensing Data. In Proceedings of the 30th International Conference on High Performance Computing, Data, and Analytics (HiPC), Goa, India, 18–21 December 2023; p. 70. [Google Scholar]
  41. Zhang, L. Research on Reservoir Water Depth Inversion and Water Area Extraction Based on Multi-Band Remote Sensing. Master’s Thesis, Inner Mongolia Agricultural University, Hohhot, China, 2018. [Google Scholar]
  42. Vermote, E.; Justice, C.; Claverie, M.; Franch, B. Preliminary analysis of the performance of the Landsat 8/OLI land surface reflectance product. Remote Sens. Environ. 2016, 185, 46–56. [Google Scholar] [CrossRef]
Figure 1. Experimental flow chart.
Land 14 01694 g001
Figure 2. (a) Overview map, (b) elevation change map, (c) NDVI distribution map, and (d) soil sampling distribution map of the study area.
Land 14 01694 g002
Figure 3. Histogram of soil nutrients’ contents at sampling points with different soil layer thicknesses: (a) Organic Matter, (b) Total N, (c) Total P, (d) Total K, (e) Available P, and (f) Available K.
Land 14 01694 g003
Figure 4. Fitting effect of (I) MLR, (II) PLSR, and (III) SVM models, (a) Organic Matter, (b) Total N, (c) Total P, (d) Total K, (e) Available P and (f) Available K content predicted and actual values using 6SV atmospheric correction surface reflectance data.
Land 14 01694 g004
Figure 5. Regression between predicted and actual values of (I) MLR, (II) PLSR, and (III) SVM models, (a) Organic Matter, (b) Total N, (c) Total P, (d) Total K, (e) Available P and (f) Available K content using 6SV atmospheric correction surface reflectance data.
Land 14 01694 g005
Figure 6. The inversion results of various soil indicators (a) 2015, (b) 2018, (c) 2021, (d) 2025.
Land 14 01694 g006
Figure 7. The spatial distribution of the soil Integrated Fertility Index.
Land 14 01694 g007
Table 1. Average content of soil nutrients at different sampling points.
Sampling PointSoil Thickness (cm)Average Content of Soil Nutrients
Organic Matter
(g/kg)
Total N
(g/kg)
Total P
(g/kg)
Total K
(g/kg)
Available P
(mg/kg)
Available K
(mg/kg)
C0–201.9750.2510.56216.9717.00050.958
0–401.7190.2500.55016.8167.35047.859
0–601.6540.2550.54416.7837.67646.801
H0–204.2960.4260.60118.1809.85073.136
0–404.4990.4510.60718.1659.95681.567
0–604.2570.4290.60718.0479.82187.139
Table 2. Landsat8 OLI image band parameters.
Band Wavelength   Range / μ m Signal-to-Noise Ratio Spatial   Resolution / m
1—COASTAL/AEROSOL0.43–0.4513030
2—Blue0.45–0.5113030
3—Green0.53–0.5910030
4—Red0.64–0.679030
5—NIR0.85–0.889030
6—SWIR11.57–1.6510030
7—SWIR22.11–2.2910030
8—PAN0.50–0.688015
9—Cirrus1.36–1.385030
Table 3. The turning points of membership function of soil fertility indexes.
Index x 1 x 2 x 3 x 4
Organic Matter (g/kg)1020--
Total N (g/kg)0.51--
Total P (g/kg)0.20.5--
Total K (g/kg)1020--
Available P (mg/kg)310--
Available K (mg/kg)50100--
Clay20406080
S/C0.51.52.53.5
Table 4. The classification standard of soil fertility degree.
IFISoil Fertility GradingThe Level of Soil Fertility
≥0.70IHigh
0.55–0.70IIHigher
0.40–0.55IIIMedium
0.25–0.40IVLower
≤0.25VLow
Table 5. Regression equation coefficient of MLR and PLSR models.
Model y i  (Nutrient’s Content) b k 1 k 2 k 3 k 4 k 5 k 6 k 7
6SV-MLR y 1 (Organic Matter)7.931.99−2.77−1.671.130.43−1.341.56
y 2 (Total N)1.040.03−0.01−0.270.140.04−0.130.13
y 3 (Total P)0.96−0.070.09−0.100.050.01−0.060.06
y 4 (Total K)22.52−0.200.49−2.141.080.21−0.840.91
y 5 (Available P)8.721.440.50−4.902.341.15−1.931.70
y 6 (Available K)213.74−6.4516.23−60.0527.968.92−26.9226.76
6SV-PLSR y 1 (Organic Matter)−2.39−0.14−0.070.0030.0160.150.060.05
y 2 (Total N)−0.055−0.005−0.0010.0020.0020.0080.0040.003
y 3 (Total P)0.486−0.00020.00020.00070.00060.00140.00090.0007
y 4 (Total K)13.92−0.0050.0130.0290.0240.0520.0330.028
y 5 (Available P)−2.21−0.11−0.020.060.060.210.110.09
y 6 (Available K)−10.38−1.99−0.990.070.242.150.900.72
Table 6. Prediction accuracy of MLR, PLSR, and SVM models.
Atmospheric Correction ModelModelEvaluation IndexSoil Nutrient Types
Organic MatterTotal NTotal PTotal KAvailable PAvailable K
6SVMLRR20.8150.8910.7950.8060.8990.846
F4.3968.1493.8774.1448.9455.480
PLSRR20.4070.3780.1500.4410.6820.385
SVMR20.9560.9360.8770.9460.9260.897
MSE0.0050.0070.0200.0060.0090.015
Table 7. The descriptive statistical characteristics of soil indicators.
YearSoil IndexMinMaxAverageStandard DeviationK-S TestDistribution Type
2015OM (g/kg)0.8810.364.842.120.20Normal Distribution
TN (g/kg)0.181.360.490.360.21Normal Distribution
TP (g/kg)0.250.860.580.430.18Normal Distribution
TK (g/kg)13.1922.6517.487.890.22Normal Distribution
AP (mg/kg)5.0119.879.637.17<0.05Lognormal Distribution
AK (mg/kg)36.98139.2884.3675.690.15Normal Distribution
Clay0.6115.739.988.13<0.05Lognormal Distribution
S/C0.142.781.691.510.16Normal Distribution
2018OM (g/kg)0.979.595.164.270.22Normal Distribution
TN (g/kg)0.191.410.450.41<0.05Lognormal Distribution
TP (g/kg)0.270.950.610.470.21Normal Distribution
TK (g/kg)12.2723.1718.3114.820.19Normal Distribution
AP (mg/kg)4.0818.159.969.87<0.05Lognormal Distribution
AK (mg/kg)37.25141.5886.7581.310.17Normal Distribution
Clay0.4718.4710.119.64<0.05Lognormal Distribution
S/C0.122.771.611.540.25Normal Distribution
2021OM (g/kg)1.0210.945.543.97<0.05Lognormal Distribution
TN (g/kg)0.091.960.430.190.20Normal Distribution
TP (g/kg)0.100.910.600.270.14Normal Distribution
TK (g/kg)13.422.9818.0810.810.20Normal Distribution
AP (mg/kg)4.7719.2111.388.270.15Normal Distribution
AK (mg/kg)34.81133.1989.3265.34<0.05Lognormal Distribution
Clay0.5416.409.174.08<0.05Lognormal Distribution
S/C0.192.951.751.040.15Normal Distribution
2025OM (g/kg)1.1411.815.982.090.23Normal Distribution
TN (g/kg)0.161.570.480.060.24Normal Distribution
TP (g/kg)0.190.890.660.170.18Normal Distribution
TK (g/kg)12.5722.118.4111.36<0.05Lognormal Distribution
AP (mg/kg)5.3119.0911.696.370.20Normal Distribution
AK (mg/kg)36.04147.1794.9884.370.19Normal Distribution
Clay0.6417.019.677.19<0.05Lognormal Distribution
S/C0.082.911.600.970.13Normal Distribution
Table 8. Nutrient grading standards for the second soil census in China.
Soil IndexI
(Extremely Rich)
II
(Rich)
III
(Relatively Rich)
IV
(Moderate)
V
(Poor)
VI
(Extremely Poor)
OM (g/kg)>4030–4020–3010–206–10<6
TN (g/kg)>21.5–21–1.50.75–10.5–0.75<0.5
TP (g/kg)>10.8–10.6–0.80.4–0.60.2–0.4<0.2
TK (g/kg)>2520–2515–2010–155–10<5
AP (mg/kg)>4020–4010–205–103–5<3
AK (mg/kg)>200150–200100–15050–10030–50<30
Table 9. The descriptive statistics of the soil Integrated Fertility Index.
YearMinMaxAverageStandard Deviation
20150.110.900.290.25
20180.170.900.320.27
20210.120.880.300.25
20250.190.890.360.29
Disclaimer/Publisher’s Note: The statements, opinions and data contained in all publications are solely those of the individual author(s) and contributor(s) and not of MDPI and/or the editor(s). MDPI and/or the editor(s) disclaim responsibility for any injury to people or property resulting from any ideas, methods, instructions or products referred to in the content.