Article

Assessment of the Food–Energy–Water Nexus Considering the Carbon Footprint and Trade-Offs in Crop Production Systems in China

1
School of Business, Anhui University, Hefei 230601, China
2
Tourism Planning Research Laboratory, Anhui University, Hefei 230601, China
*
Author to whom correspondence should be addressed.
Land 2025, 14(8), 1674; https://doi.org/10.3390/land14081674
Submission received: 12 May 2025 / Revised: 7 August 2025 / Accepted: 17 August 2025 / Published: 19 August 2025

Abstract

To elucidate the food–energy–water (FEW) nexus, in this paper, a food–energy–water–carbon (FEWC) measurement method is established, and the evolutionary mechanisms within the nexus are determined to optimize crop production systems (CPSs). A quantitative assessment of the trade-offs and synergies among the constituent sub-nexuses is presented. This assessment is achieved through carbon footprint analysis of CPSs. In addition to examining FEW resource interactions, we employ the logarithmic mean divisia index methodology—a tool well-suited for practical energy decomposition—to explore the nexus interrelationships. This research further accounts for anthropogenic inputs in CPSs, specifically using blue water and energy consumption as key indicators for characterizing water and energy dynamics, respectively. Five crops are selected for CPS carbon emissions analysis to inform cropping structure optimization. The results show that during 2000–2022, greenhouse gas (GHG) emissions from China’s CPSs exhibited significant fluctuations characterized by a concentrated–dispersed–concentrated distribution pattern: the food system’s carbon footprint decreased notably, the food–energy (FE) system’s impact increased substantially, and the food–water (FW) system’s footprint fluctuated before decreasing. The spatial diversity in the FE system’s provincial carbon footprint increased over time, while the FW nexus exhibited fluctuating yet significant efficiency gains, indicating movement toward more balanced spatial distribution along the Hu Huanyong Line and Botai Line. The net effect of the FEW nexus interactions on GHG emissions exhibited a slight mitigating influence.

1. Introduction

Food, energy, and water (FEW) are basic resources that are indispensable for human survival and development [1]. The security of FEW resources is inextricably linked, with complex interconnections and interdependencies [1,2,3]. A nexus can be employed to describe the interrelated and interdependent resource or environmental elements that characterize complex socio-economic systems [4]. This concept is being applied in the fields of urban studies [5,6], government administration [7,8], and management of natural resources [9]. Researchers have employed closed and isolated systems [10] to study this nexus. The global community is confronted with significant challenges in the areas of FEW resources [11], which are related to the United Nations’ sustainable development goals (SDGs) [12,13]. It is projected that the global demands for FEW resources will increase by 35%, 50%, and 40% by 2030, respectively [14]. Global challenges such as food security risks, freshwater scarcity, and fossil energy depletion are increasingly constraining modern societal development, posing serious threats to national security and social stability. The development of bioenergy [15] impacts the agricultural sector, which in turn influences the broader economy. The nexus concept’s initial research objectives focused on achieving more with fewer resources, thereby facilitating a transition toward a green economy [16]. It is not possible to assess food production in the agricultural sector without also evaluating the role of water resources and energy. Some argue that the prevention of food waste is equivalent to the conservation of water and energy [17,18]. The water system requires energy for water distribution, transmission, recycling, and regeneration processes. Additionally, the ecological environment of the water system and agricultural production behavior mutually influence one another. The interrelationships and interactions among FEW resources are embedded within various economic processes [19].
The contradiction between water scarcity and food production has been particularly evident and has constituted one of the primary contradictions affecting the FEW nexuses. The availability of water resources is a fundamental determinant of food security [20]. China has an urgent need to balance FEW securities with carbon neutrality in its food system, which is driven by complex environmental and socioeconomic factors, manifesting as spatial disparities among primary grain-producing areas, grain-deficit areas, and spillover zones [21]. Furthermore, the reliance on irrigation [22] in water-scarce areas [23] can intensify the constraints on resources, thereby exacerbating the challenge of attaining food security. It is therefore essential to consider the effective use of blue water [24,25]. While initiatives such as water transfer and food transfer projects have been implemented with the aim of addressing some of the challenges associated with attaining food security [26], some researchers have proposed that the cultivation of bioenergy crops on marginal land [27] should be planned in a rational manner that ensures food security while simultaneously making intensive use of the land. The production of foodstuffs necessitates a considerable input of energy, including the utilization of machinery, fertilizers [28], pesticides, mulch [29], and other means of production. Moreover, the consumption of energy gives rise to several environmental concerns. Even regions with limited water resources, such as deserts, have been transformed for agricultural purposes [30]. At this juncture, the imperative to augment the energy demand and its concomitant ecological and environmental consequences represents a significant cause for concern [31,32]. China faces a substantial demand for FEW resources, and concerns about their security are increasing. Ensuring regional food security and developing additional high-quality agricultural land require inputs such as fertilizers, improved irrigation systems, and soil quality enhancements. These measures impact carbon neutrality goals and may also lead to increased greenhouse gas (GHG) emissions [33,34]. Agricultural systems significantly influence the global carbon balance. In China, they contribute ~14% of total GHG emissions, emitting 1.17 Mg CO2-eq per CNY 10,000 of agricultural product value [35]. Future increases in food production and water resource utilization will necessitate greater energy consumption, thus underscoring the need to investigate the trade-offs between the FEW nexus and China’s crop production systems (CPSs) [36].
The majority of previous research on the FEW nexus has focused on climate change [1,37], sustainable development [12], and food production and security. The nexus approach is also a prominent area of investigation. Research in this field concerns the accounting of FEW input and output flows [38], the assessment of resource and environmental footprints [39,40], system simulation, fixed effects regression [41], life cycle assessment [42] of optimal management strategies, and even artificial intelligence [43]. Leveraging a mature carbon footprint methodology, in this study, we analyzed the trade-offs and synergies within the FEW nexus and its sub-nexuses through a lifecycle analysis of CPSs. Beyond analyzing FEW resource interactions, we explored their interrelationships, incorporating artificial inputs—specifically, blue water and energy consumption in CPSs—to characterize water and energy dynamics and assessed the GHG emissions of the CPSs of five crops, with findings aimed at informing cropping structure optimization. This study establishes a research framework for quantifying the FEWC nexus in crop production systems (CPSs), with three primary objectives: (1) developing methodologies to measure nexus relationships; (2) quantifying carbon emissions from material exchanges and energy flows within CPSs; and (3) optimizing anthropogenic energy inputs. The findings inform effective regional CPS management and mitigate resource allocation conflicts. Furthermore, we propose implementing differentiated cropping system management through zoning strategies based on specific quadrants of the study area, concurrently addressing food security, optimizing energy consumption structures, and enhancing water conservation.

2. Materials and Methods

2.1. Study Area

In recent decades, the frequency of natural disasters has risen, and this increase has coincided with global warming and increased carbon dioxide concentrations. China’s large population underscores the critical importance of food security, and the energy and water resources used in food production require scrutiny to support high-quality development. Despite water scarcity, the spatial center of China’s food production continues to shift northward, and the demand for food is expected to grow steadily, necessitating careful management of these interconnected resources [44]. Regarding the purposes of data acquisition and the examination of CPSs, we chose a study area consisting of 31 provinces in Mainland China (Figure 1). Due to climatic constraints, Qinghai’s cold, dry conditions make it unsuitable for rice cultivation, while Hainan’s tropical climate lacks the low temperatures required for wheat growth. To facilitate the identification of the FEW nexuses, China was divided into nine distinct zones [45], classified according to their climatic and agricultural characteristics. Marine fishery zones were excluded from this classification, as the focus of this study was the CPS. The results of zones are presented in Supplementary S2 Table S10.

2.2. Selection, Processing, and Merging of the Database

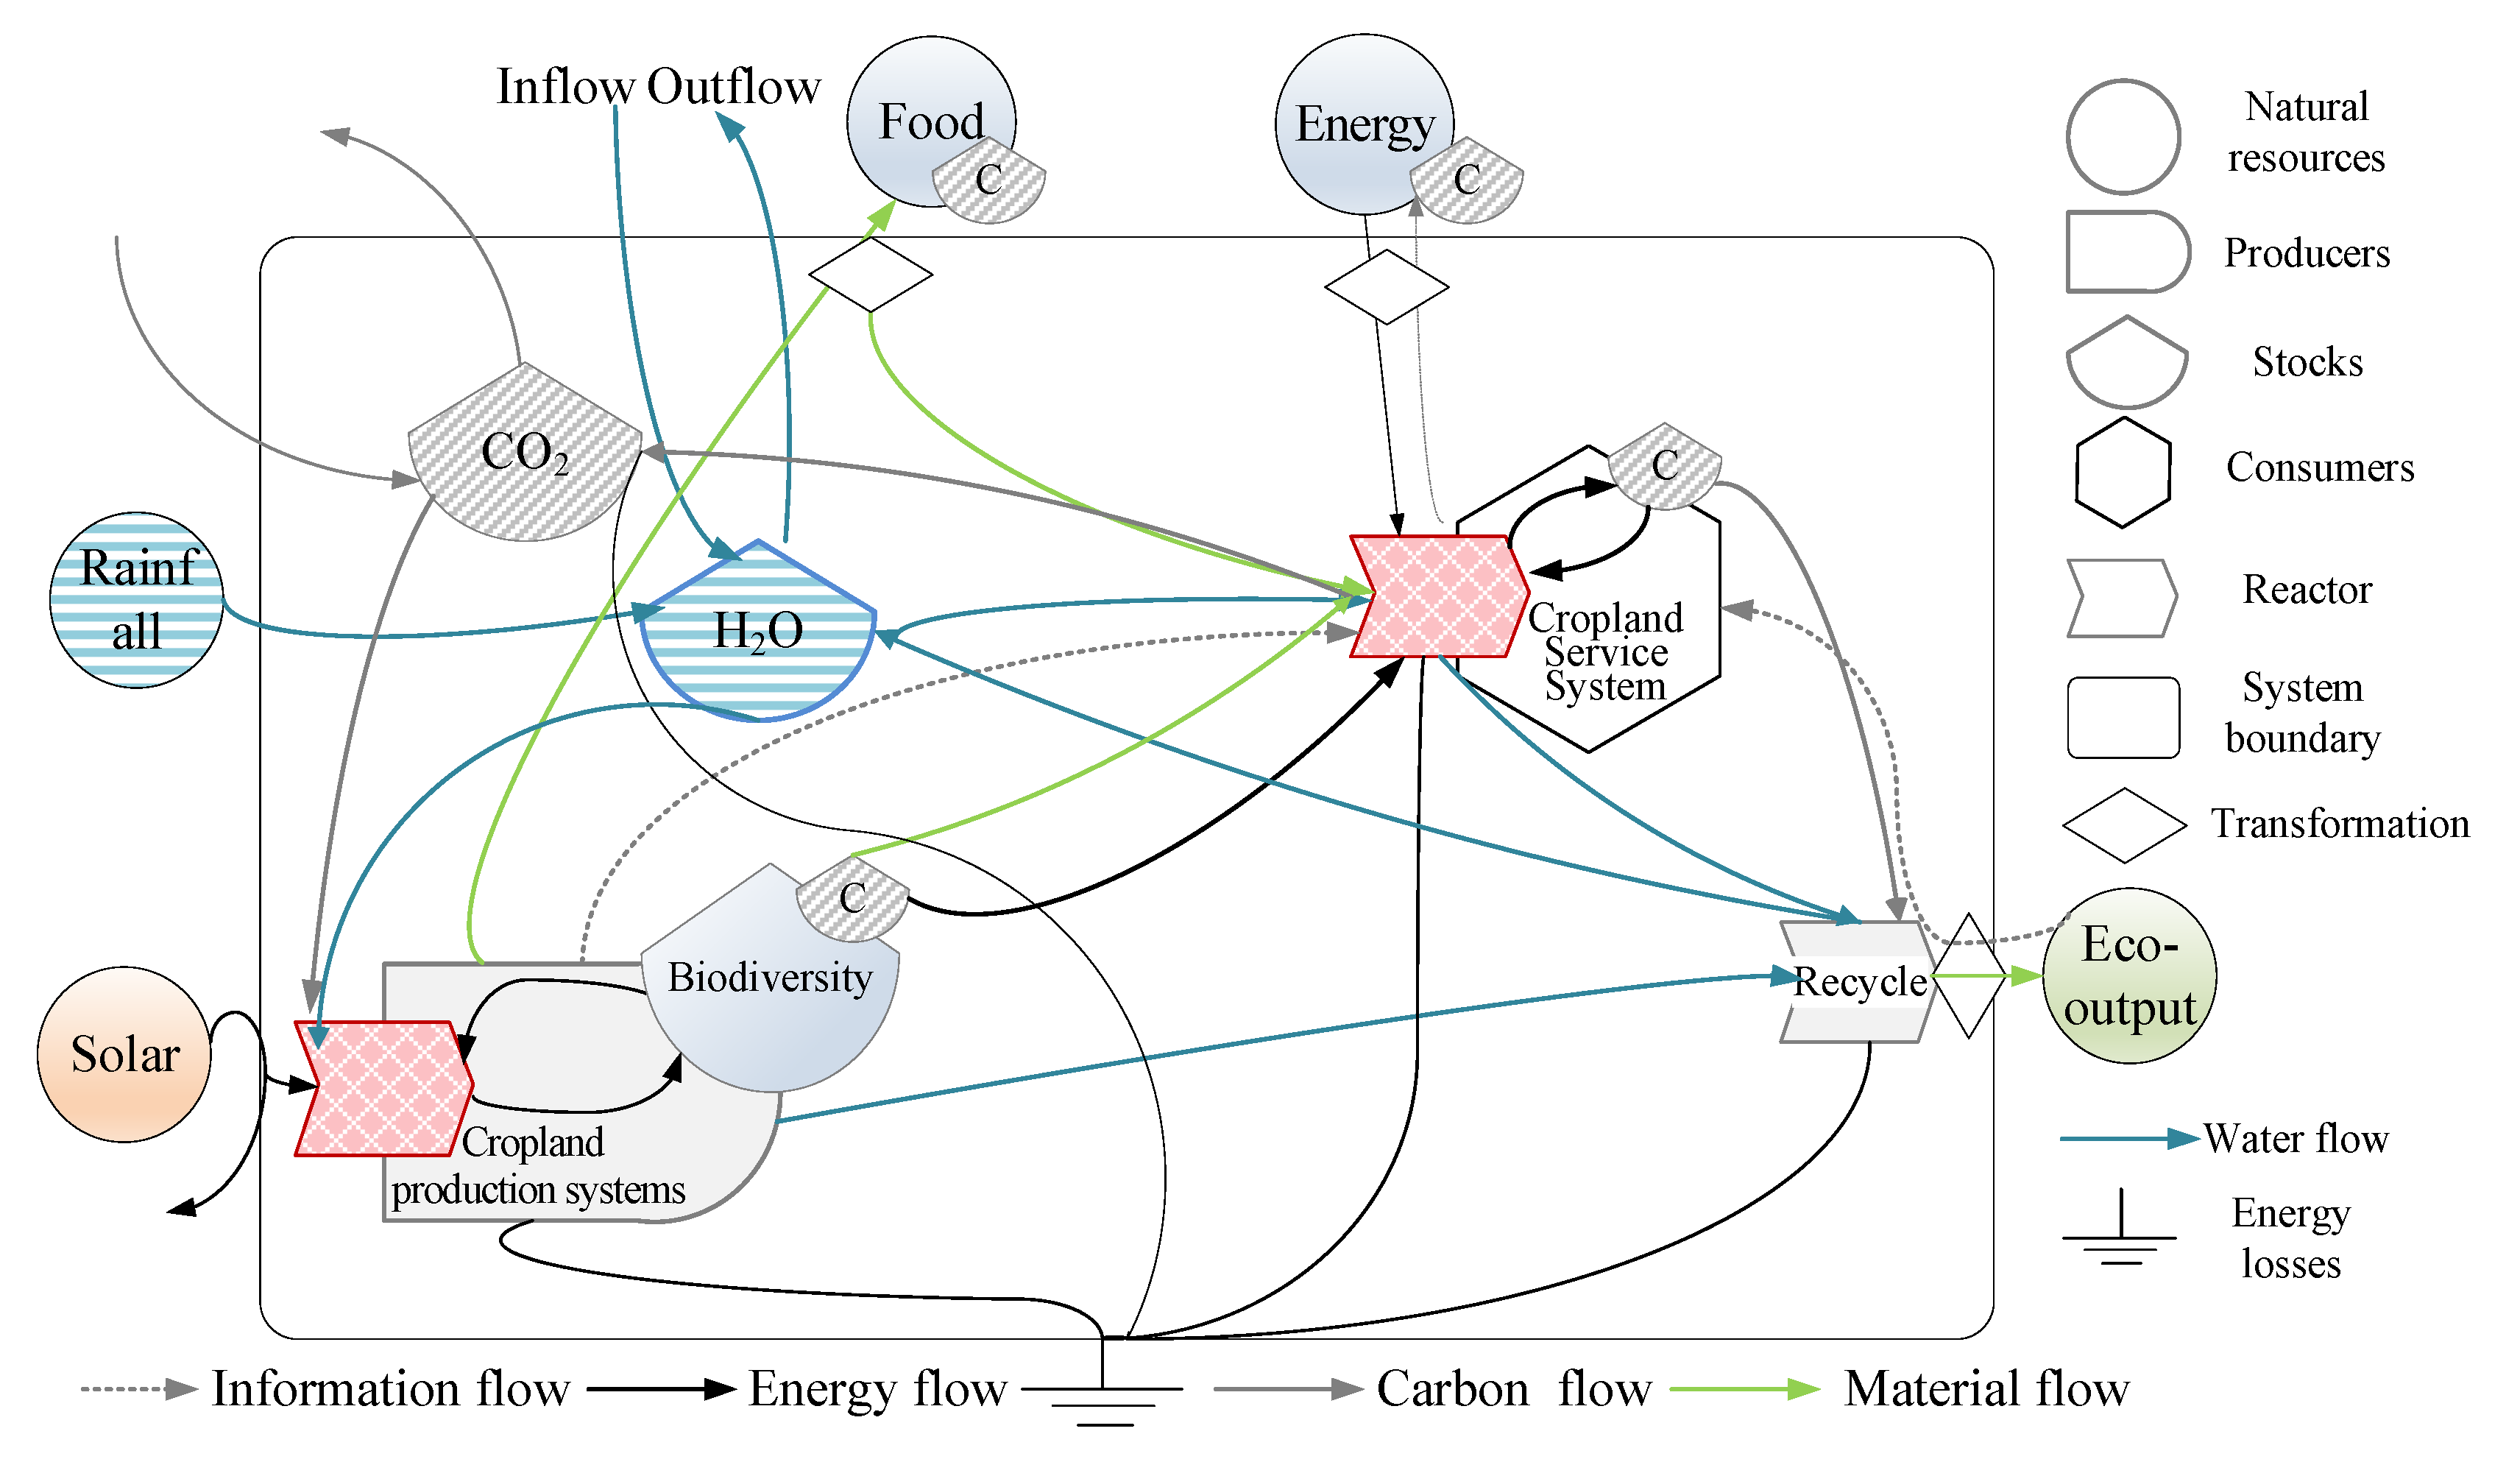
The production structure of Chinese agriculture encompasses a range of sectors, including planting, forestry, animal husbandry, fisheries, and sideline industries. The CPS is a complex system that is intertwined with the environment and society. Attaining high yields, quality, and efficiency in crop production represents a significant challenge, given that these three objectives are frequently in conflict with one another. Furthermore, the relationships between high yields, quality, and efficiency are subject to change because of climate and socio-economic development. Given its central role in FEW food provisions, investigating the CPS allows holistic FEW nexus analyses. Moreover, the most crucial food resources within the FEW nexuses originate from the CPS. A schematic diagram has been devised which illustrates the flows of energy, matter, and information in a CPS. Figure 2 shows a diagram of the material flows, such as carbon and water flows, and information flows. However, due to the inherent challenges associated with acquiring comprehensive data on crop production drain water, i.e., greywater, only carbon footprints were employed for the analysis of material flows. This study employs the C-footprint perspective to analyze the resource usage of FEW in this CPS.
The carbon (C) and nitrogen (N) footprints of five staple grain crops in China—rice, wheat, maize, soybeans, and potatoes—were analyzed using a lifecycle approach spanning 2000 to 2022, incorporating data on production, agricultural inputs, input costs, and GHG emission factors. The dataset comprises three categories of agricultural inputs: complementary materials (fertilizers [nitrogen, phosphate, potash, compound], pesticides, seeds, and mechanical supplies), energy sources (direct fuel sources like coal, diesel, petrol, paraffin, and electricity), and blue water (irrigation water during production). Crop varieties were distinguished by growth periods: rice into early, middle, and late types; wheat into winter and spring types. CH4 emissions from rice cultivation were specifically tracked. The sowing characteristics, including crop-specific planted areas, are described in Table S11. The blue water demand was simulated using data from the Atlas of Regional Distribution of Major Agricultural Products of the Third National Agricultural Census, which provides province-level information on cropping systems and patterns. This comprehensive analysis captures the environmental impacts of China’s staple food production through a structured, data-driven framework [46].

2.3. Carbon Footprint

The carbon footprint includes GHG emissions from both CPS inputs and crop growth. It is measured using the global warming potential (GWP), which is calculated as follows:
G W P C O 2 = C O 2 I n p u t   + N 2   O × 44 28 × 265 + C H 4 p a d d y   × 16 12 × 28 d S O C × 44 12
where GWPCO2 is the total GHG emissions (in terms of CO2, as defined below) associated with the CPS. CO2Input is the GHG emission generated by agricultural inputs. N2O is the amount of N2O emission from the cropland; 44 28 ,   16 12   , and 44 12   are used to convert N into N2O, carbon into CH4, and carbon into CO2, respectively; and 265 and 28 are the relative GWPs for the conversion of N2O and CH4 into CO2 over a 100-year time period, respectively. CH4paddy is the release of methane from paddy fields. Details are provided in Supplementary S1.

2.3.1. Carbon Emissions

The carbon footprint calculation includes GHG emissions from agricultural inputs for production, crop cultivation, irrigation/machinery energy use, and direct cropland emissions. The nitrogen footprint calculation primarily encompasses reactive nitrogen losses from agricultural inputs and fertilizer application.
C O 2 I n p u t   = I n p u t i × E F i + S t r a w i B u r n i n g
N 2   O s o i l = F e r N × E F F e r N N 2 O + S t r a w × E F S N 2 O + E i
C H 4 p a d d y = E F C H 4 p a d d y × d a y s
where Inputi is the agricultural material inputs for crop type i, and EFi is the GHG emission coefficients of the agricultural inputs. FerN is the usage of nitrogen fertilizers, and EFFerN-N2O is the emission coefficient of N2O. Straw and EFS-N2O are the quantity of straw and the associated emission coefficient of N2O, respectively. Ei is indirect N2O emission. EFCH4paddy is the emission coefficient of CH4, and days is the period of time required for the planting of rice.

2.3.2. Carbon Sequestration

The carbon sequestration parameters of the crop are presented in Table 1 and calculated as follows:
C I = i = 1 K c i × 1 w i × D i = i = 1 K c i × 1 w i × ( 1 + R i ) × Y i H i
where CI is the carbon sequestration of crop I, and ci is the carbon sequestration rate of crop i. K denotes the crop species, wi is the crop water content, Di is the biological yield, Ri is the root-to-crown ratio, Yi is the economic yield of the crop, and Hi is the economic coefficient of the crop. Note that potential footprint reductions were beyond this study’s scope.

2.4. Blue Water Footprint

This paper exclusively addresses the blue and green water footprints associated with crop water demand. This is primarily accomplished utilizing the CROPWAT software 8.0 [47], a decision support tool and a crop water productivity metric developed by the Land and Water Development Division of the Food and Agriculture Organization (FAO) [48]. This tool distinguishes between daily emissions and the irrigation water demand during the growing seasons of different crops, and it calibrates the total simulated value with agricultural water consumption at the provincial scale. The input parameters for the model include those related to the calculation of evapotranspiration, such as the minimum and maximum temperature (°C), daily light hours (h), wind speed (m/s), and humidity (%), as well as parameters such as the average monthly precipitation (mm), crop parameters, soil parameters, and crop pattern. In the calculation of the irrigation water demand, the crop separation considers the crop rotation in various provinces, resulting in a more accurate representation of the actual situation. The blue water calculations in this paper are primarily conducted using the CROPWAT software. For further details on the Penman–Monteith formula, please refer to Supplementary S1.

2.5. Trade-Off and Synergy Relationships

Spearman’s rank correlation coefficient and Pearson’s product–moment correlation coefficient are widely used to analyze the relationships among variables [49]. Spearman’s correlation analysis is characterized by flexibility in handling diverse variable types by ranking paired observations and assessing their ordinal association, making it suitable for identifying trade-offs and synergies in FEW resource interactions. In this paper, we employ the Spearman’s rank correlation coefficient to quantify these interrelationships. Positive and negative coefficients denote synergistic and trade-off relationships, respectively. The calculation formulas are as follows:
r ( X i , Y i ) = 1 - 6 1 n ( S i - W i ) 2 n ( n 2 1 )
t = r × n 2 1 r 2
where r is Spearman’s rank correlation coefficient between Xi and Yi. The term {(Xi,Yi)} denotes two sets of variables that correspond to each other one by one, with a total of n pairs of variables. The Xi are arranged from smallest to largest to obtain a new set of data pairs, Xi. The variables are x(1) <x(2) < … < x(n), and the corresponding y(i) variable acts as the companion of x(i). If we assume that Xj is in the qth order in the sequence xi, then q is the rank of {(Xi)}, that is, Si. Similarly, we can define the rank of Yj, that is, Wi. In this paper, the Pearson coefficient (i.e., the positive or negative of p) is employed to represent synergies or trade-offs [50]. For details, see Table 2.

2.6. LMDI

The logarithmic mean divisia index (LMDI) model, developed from the exponential decomposition method and Kaya expansion formula [51,52], is a factor decomposition technique that utilizes the logarithmic average method to analyze influencing factors. Compared to other exponential decomposition approaches, it offers the advantages of complete factor decomposition and the absence of residual terms [53]. By extending Kaya’s constant equation, the model enables the formulation of calculations of FEW resource consumptions.
C = F S i j × C E i × E W i × W F × F = C i j C i × C i E i × E i W i × W i F × F
where C is the carbon emission, and FSij is the food structure effect, defined as the proportion of crop type j used in the production in region i. CEi is the food–energy (FE) structure, and it signifies the carbon emissions from the grain yield attributable to the total energy use in region i. Energy–water (EW) is the ratio of the energy consumption to the water consumption in region i, and water–food (WF) is the ratio of the water consumption to the grain yield in region i. F is the regional food security effect, and it corresponds to the grain yield. The dataset, excluding F, is derived from carbon emission accounting, providing the basis for analyzing these structural relationships.
F = F F S + C C E + F E W + F W F + F F
The effects of the FEW resource structures are analyzed based on the contribution values of the various decomposition factors. In this paper, we employ the multiplicative method for factor decomposition to assess these structural impacts [54].

3. Results

3.1. GHG Emissions from China’s CPSs

The GHG emissions from China’s CPSs during 2000–2022 exhibited significant fluctuations. Emissions from China’s five major staple grains exhibited dual characteristics: acting as a substantial carbon source and contributing marginally to carbon sequestration. Moreover, both the total volume and intensity of these emissions decreased. The three principal crops—rice, wheat, and maize—accounted for 91.81% of the total GHG emissions from all of the CPSs (Figure S1a), even though they only occupied 85.19% of the total sown area. Between 2000 and 2003, reductions in the cultivated area and crop yields led to decreased GHG emissions. In subsequent years, grain production was expanded, which led to increased GHG emissions. In 2011, the effectiveness of emission reduction strategies began to improve. The carbon sequestration of rice, wheat, and maize increased, while those of soybeans and potatoes decreased slightly. Notably, the expansion of cultivated land did not result in higher net GHG emissions (Figure S1b).
In 2022, total GHG emissions reached 7.28 × 10⁸ t CO2-eq. Rice production alone contributed 51.06% of China’s total CPS-related emissions, and the emissions per hectare (14.28 t CO2-eq/ha) for rice exceeded those of wheat and maize by factors of 2.42 and 2.63, respectively. The net carbon footprint per unit area of rice cultivation increased annually by 0.15 t CO2-eq/ha (Figure S2a,b). Among the emission sources, 32.12% of emissions originated from CH4 emissions in paddy fields, 20.59% originated from direct and indirect N fertilizer use, 19.95% originated from straw burning, and 16.48% originated from irrigation. Compared to 2000, the emission contributions from N fertilizer and straw burning were 6.51% and 5.92% lower in 2022, respectively. However, CH4 emissions—the largest source of GHG emissions related to the grain yield—increased by 1.44%, and irrigation-related emissions increased by 4.62%.
Spatially, China’s provincial GHG emissions exhibited a distinct concentrated–dispersed–concentrated distribution pattern with fluctuating median values. This was accompanied by a club convergence phenomenon in emissions from the CPSs. The spatial carbon footprints of the CPSs were highly concentrated in the southeastern part of the study area and were low in the northwestern part of the study area (Figure S3), reflecting the strong inertia of the provincial carbon emission intensity. Rice, a significant GHG contributor (Figure S4a), followed this trend, with higher emissions in the eastern provinces and lower emissions in the western provinces. In contrast, maize’s emission intensity exhibited a dispersed Matthew effect (Figure S4b), while wheat, soybeans, and potatoes exhibited notable regional anomalies (Figure S4c–f). For example, wheat production in Henan (28.02%) and Shandong (16.12%) provinces, alongside similar patterns in Hebei, Jiangsu, and Anhui, collectively accounted for 28.88% of emissions, highlighting the localized contributions to the national footprint.

3.2. FEW Nexuses from the Carbon Footprint Perspective

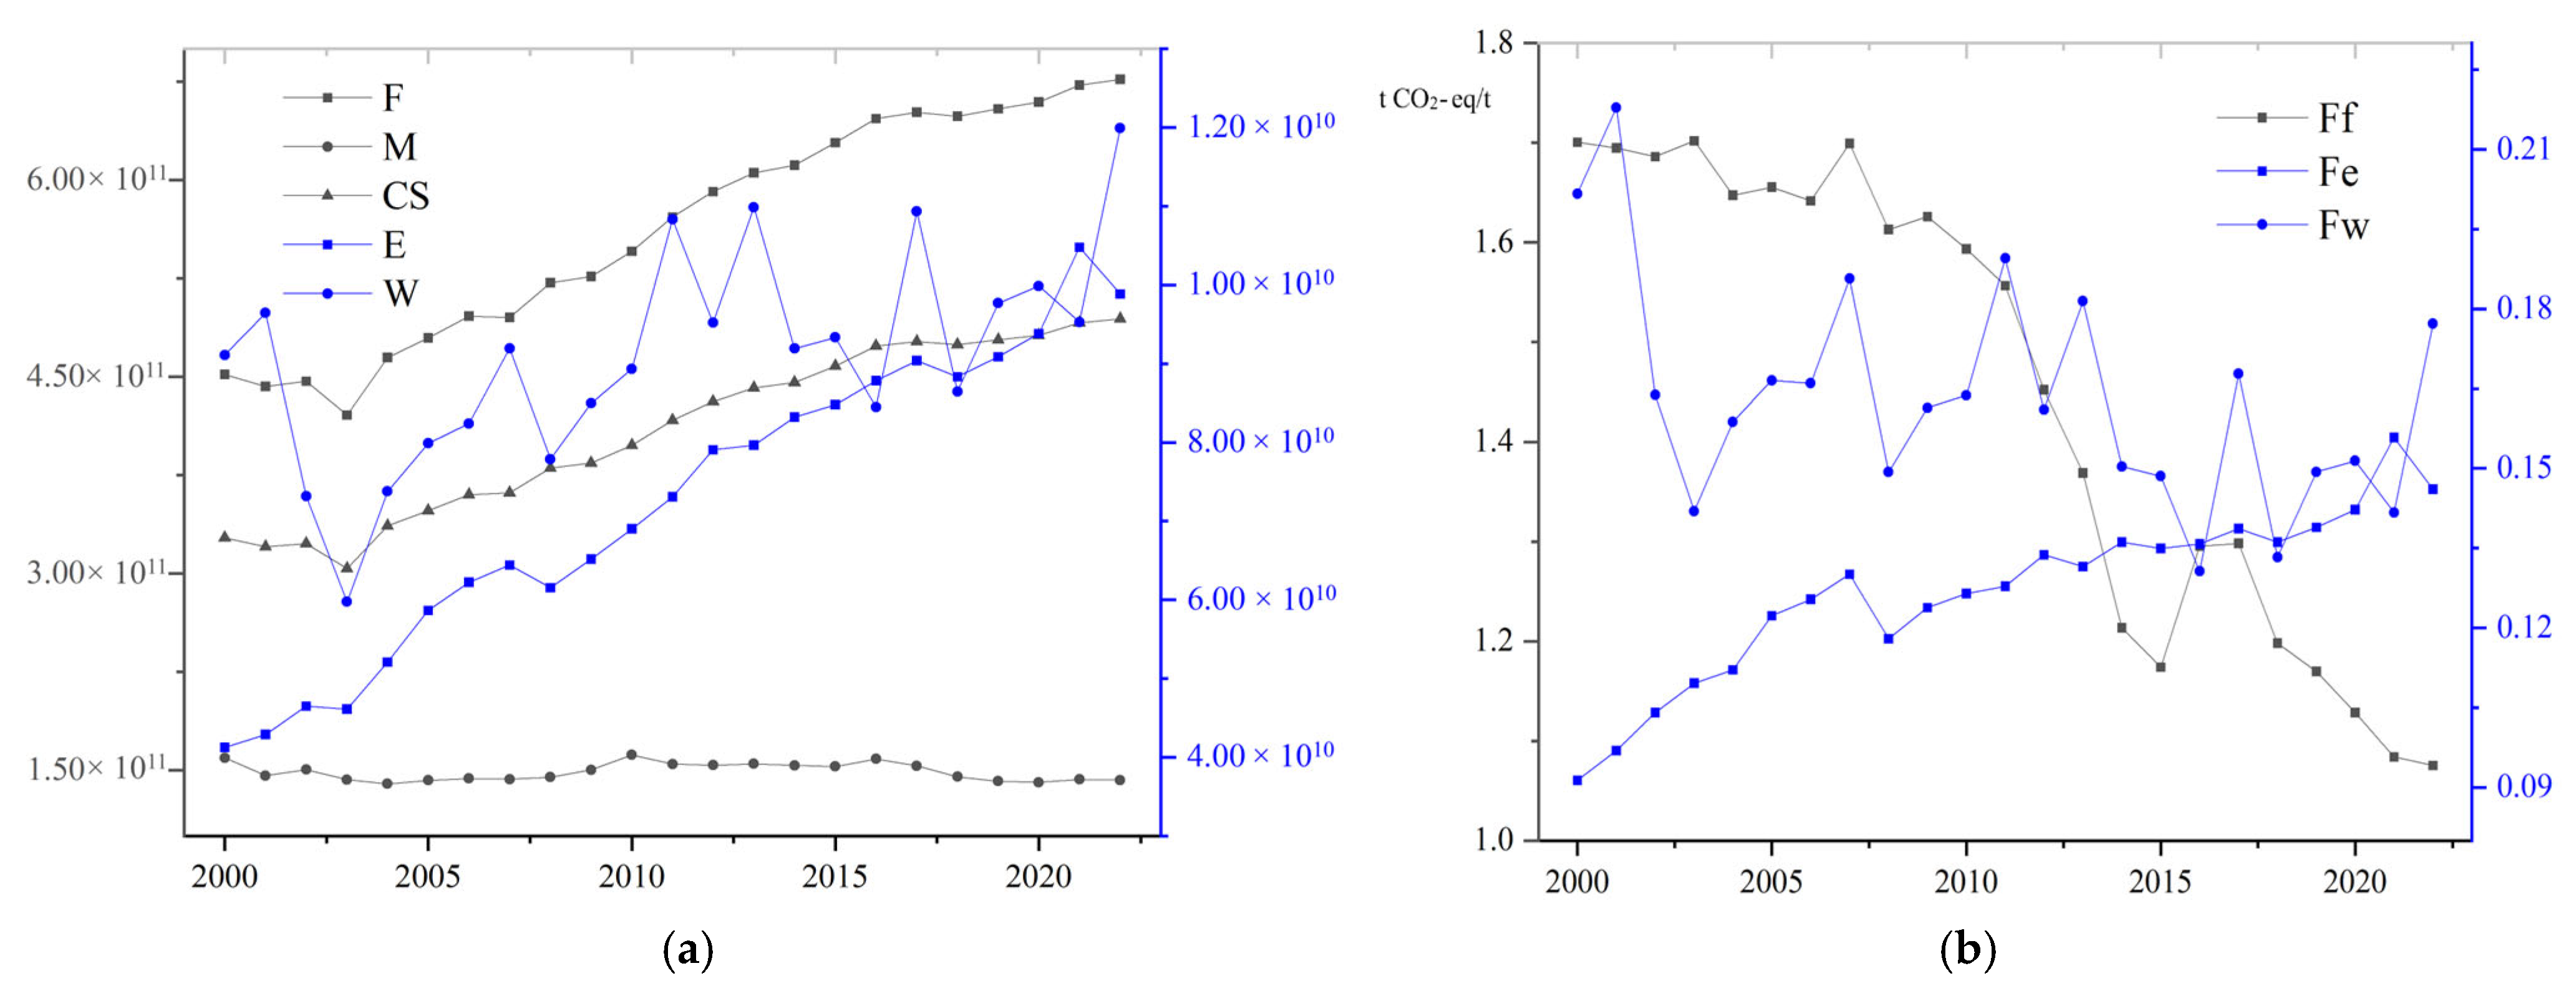
During 2000–2022, China achieved a notable increase in food production (F, kg CO2-eq) and modest growth in carbon sequestration by food crops (CS, kg CO2-eq). Conversely, GHG emissions from agricultural inputs in CPSs—including seeds, pesticides, fertilizers, and plastic films (M)—decreased slightly, driving a marked reduction in the food system’s carbon footprint (Ff) (Figure 3a). GHG emissions from blue water usage (W) increased significantly, but the associated carbon footprint (Fw) fluctuated and decreased overall. Energy-related emissions (Fe) exhibited a steady increasing trend, which was likely influenced by the low baseline energy consumption levels (Figure 3b). Blue water emissions exhibited substantial interannual variability due to precipitation fluctuations, and Fw exhibited a fluctuating decreasing trend. In contrast, energy emissions increased consistently, with annual growth rates exceeding those of F and W, and the carbon footprint of energy use (Fe) continued to steadily increase.
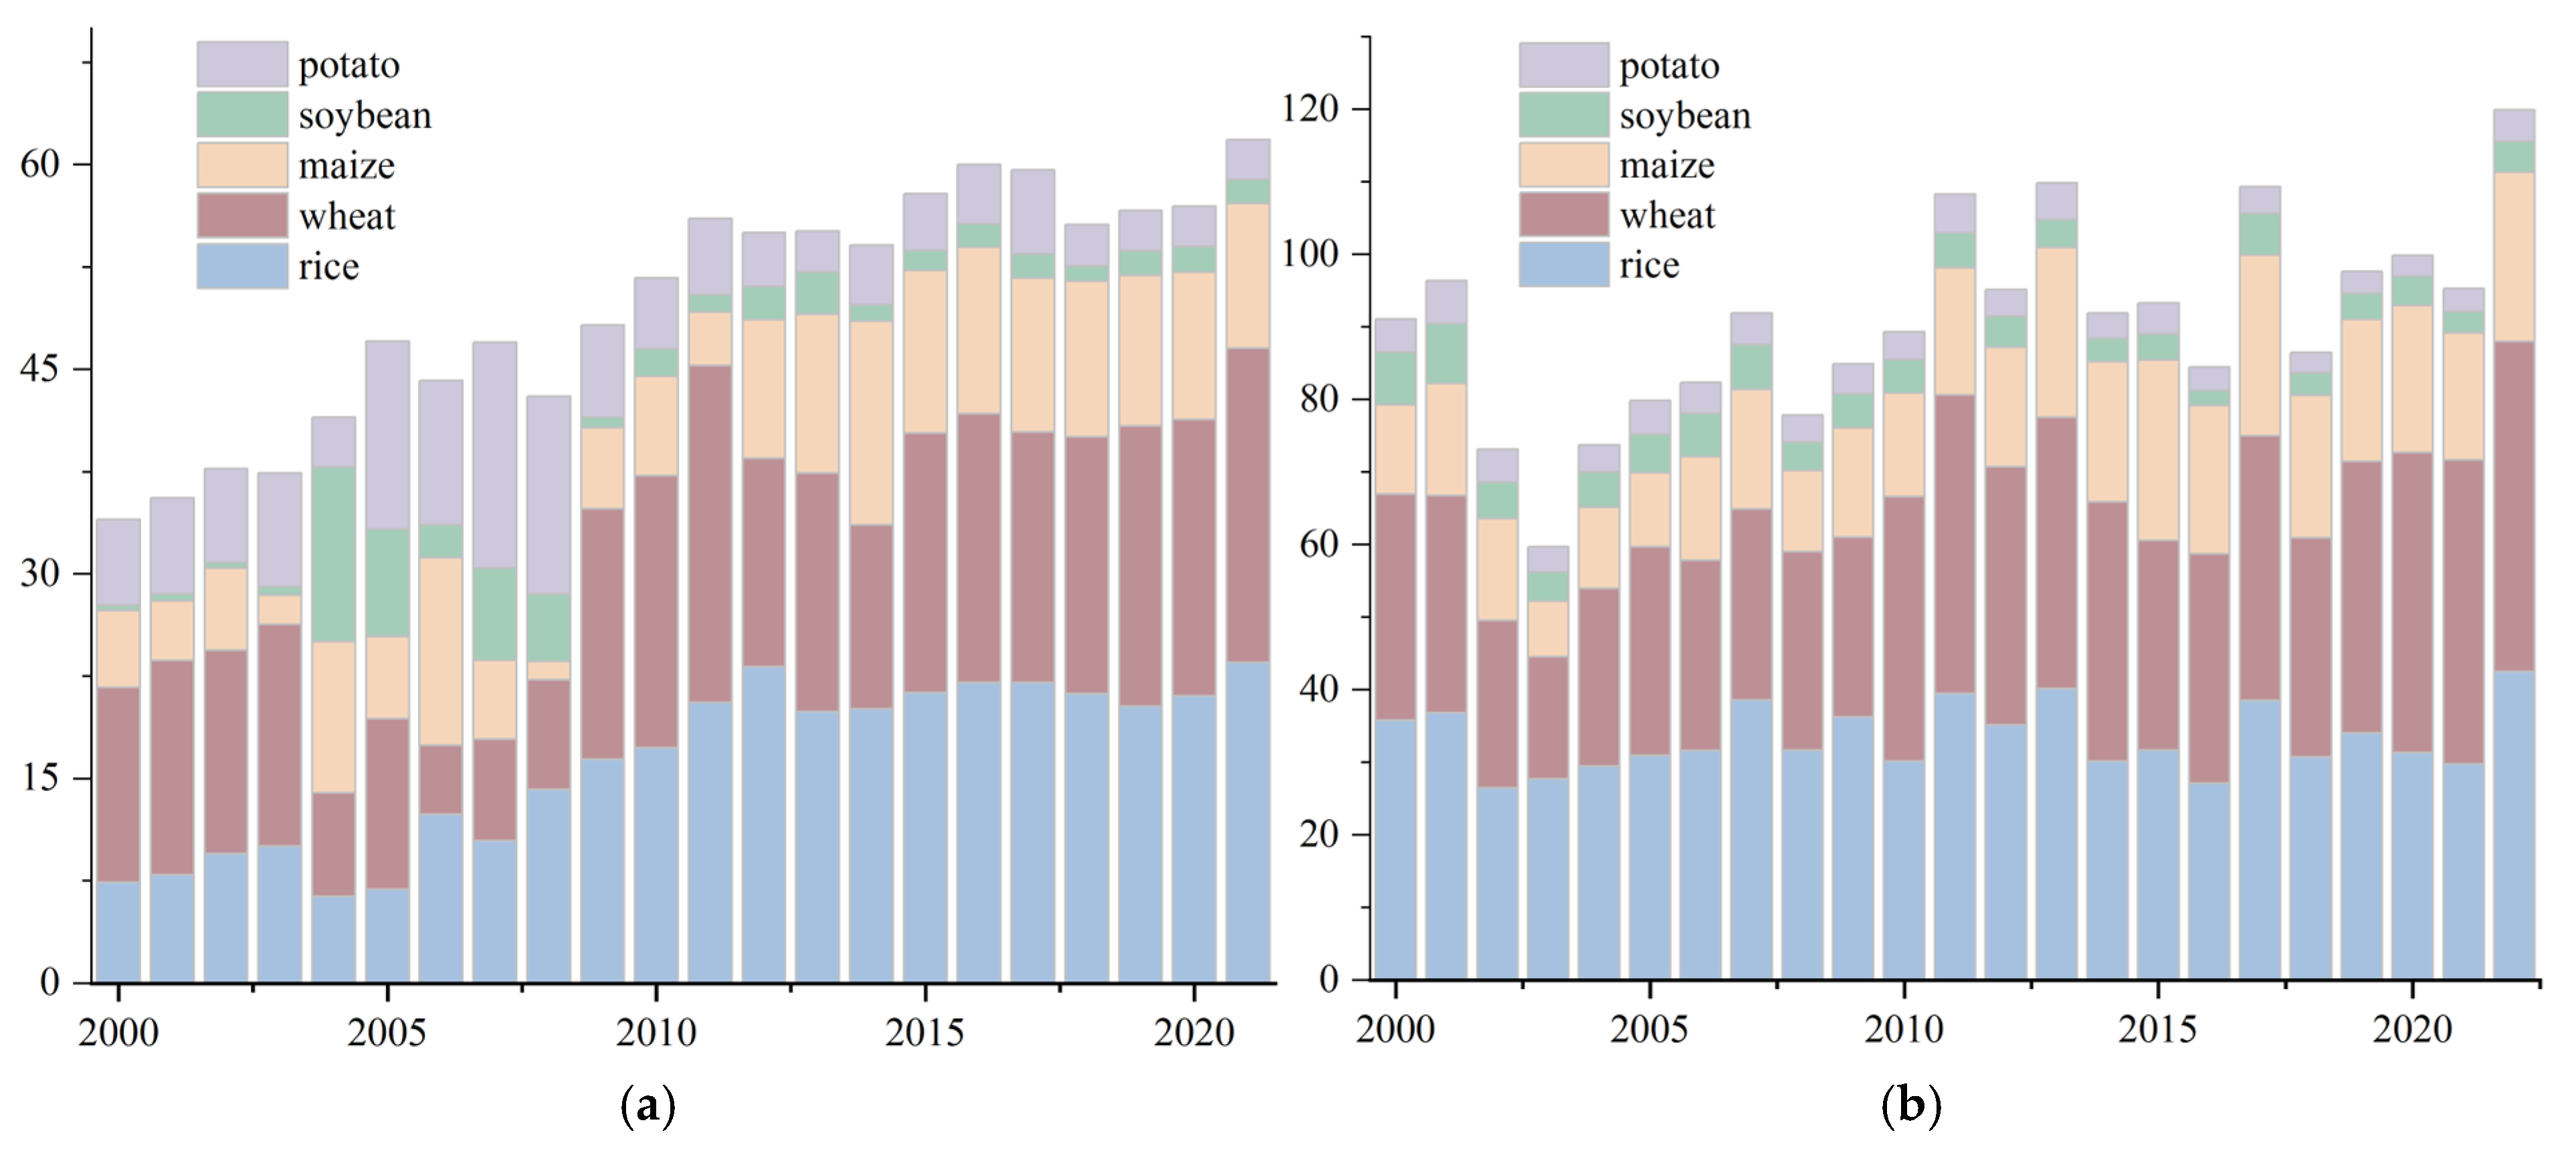
China’s CPSs exhibited significant growth in their energy-related carbon footprints through 2022, reflecting the limited adoption of renewable energy in this sector (Figure 4a). While energy use generally enhances crop yields, the energy consumption of rice cultivation decreased in 2004 and 2013. This trend was not observed for the other crops. Correlation analyses revealed that energy consumption was linked to the sown area across the various crops, but the outcomes differed: the rice and wheat yields increased with increasing energy use, whereas the energy use for maize, soybean, and potato cultivation was directly correlated with the sown area. Energy-related emissions (Fe) were elevated in the economically developed and major grain-producing provinces (Figure S5), and the regional disparities increased: the grain-producing regions in the northeast prioritized energy conservation, while the coastal areas maintained a high Fe intensity.
Blue water resource utilization (Fw) exhibited efficiency and conservation (Figure 4b) but generated higher GHG emissions than energy systems, and it had an uneven spatial distribution. Blue water use was strongly correlated with the grain-sown area, driving notable yield increases in wheat irrigation, while the other crops were irrigated proportionally to their planted area. The Fw increased significantly in Hainan and the central provinces, while it remained moderate yet productive in the grain-producing regions in the northeast. The spatial pattern shifted from lower intensity in the south to higher intensity in the north, with a more balanced distribution along the Hu Huanyong Line and Botai Line. (Researcher Fang Chuanglin introduced the Bo-tai Line as an advanced spatial framework, highlighting a gradual convergence between China’s southwestern and northeastern regions toward a 1:1:1 equilibrium in land area, population distribution, and economic development. This conceptual boundary serves three key functions: (1) it delineates a transitional zone for the spatial gradients of natural and human geographical elements; (2) it acts as a potential equilibrium axis, fostering coordinated regional development; and (3) it forms a strategic corridor linking the dual core zones of the Belt and Road Initiative, enhancing connectivity and economic integration.) [55]. The latter exhibited the opposite Fw pattern (low in the northeast (−0.2083) and high in the southwest (0.2176)). These findings underscore the need for crop-specific and regionally tailored strategies to address energy and water use dynamics in the various CPSs.

3.3. Trade-Off and Synergy of the FEW Nexus

3.3.1. Trade-Offs and Synergies in the Different CPSs

The FE nexus generally exhibited synergistic relationships with significant spatial and temporal variations, while the FW nexus exhibited moderate synergy (Table 3). Notable disparities in the trade-offs and synergies existed across the FEW nexus interactions within the different CPSs, and the FW nexus exhibited a relatively low overall Pearson correlation coefficient. For wheat, maize, soybeans, and potatoes, the FE and FW nexuses typically exhibited strong synergies. However, wheat was an exception: its FE nexus did not exhibit a correlation, and its FW nexus exhibited a pronounced trade-off with a weak correlation. Potato production had a good FE nexus correlation coefficient (0.638), indicating a strong link between production and associated GHG emissions, whereas rice, maize, and soybeans had lower Pearson coefficients. Despite these evident synergies, the overall results lack statistical significance, highlighting the need for further analysis to validate these relationships.
The carbon footprint analysis revealed the existence of a significant positive correlation within the FE nexus (statistically significant at the p < 0.05 level), and the potato production system had the strongest FE nexus correlation, followed by soybeans (Table S12). In contrast, the FW nexus exhibited a weaker trade-off relationship overall; however, soybean production exhibited a significant positive FW nexus correlation, indicating a robust synergistic effect. The rice and maize FW nexus interactions were also statistically significant (p < 0.05), reflecting moderate synergy. The EW nexus correlations across the crops lacked substantial statistical significance and thus were not analyzed in detail in this study.

3.3.2. Evolution of Synergies and Trade-Offs

From 2000 to 2022, the FE nexus exhibited strong synergy (I) in most years, and it trended gradually from synergy toward trade-offs over time. The FW nexus followed a trend of weak trade-offs, temporary strong synergy, and reversion to trade-offs. During the later part of the study period, there was a clear shift toward synergy in both the FE and FW nexuses (see Table 4 and Table S13, and Figure S7 for details). Energy consumption in the CPSs began increasing in 2008 and aligned with food production levels until 2019. After 2019, energy consumption outpaced production growth. The blue water consumption in the CPSs remained relatively moderate, particularly between 2006 and 2017, but associated water use costs increased in the later part of the study period. Ensuring future food security necessitates reducing energy use and conserving water. These objectives were achieved in some years but were challenging to implement consistently.

3.3.3. Evolution of Spatial Synergies and Trade-Offs

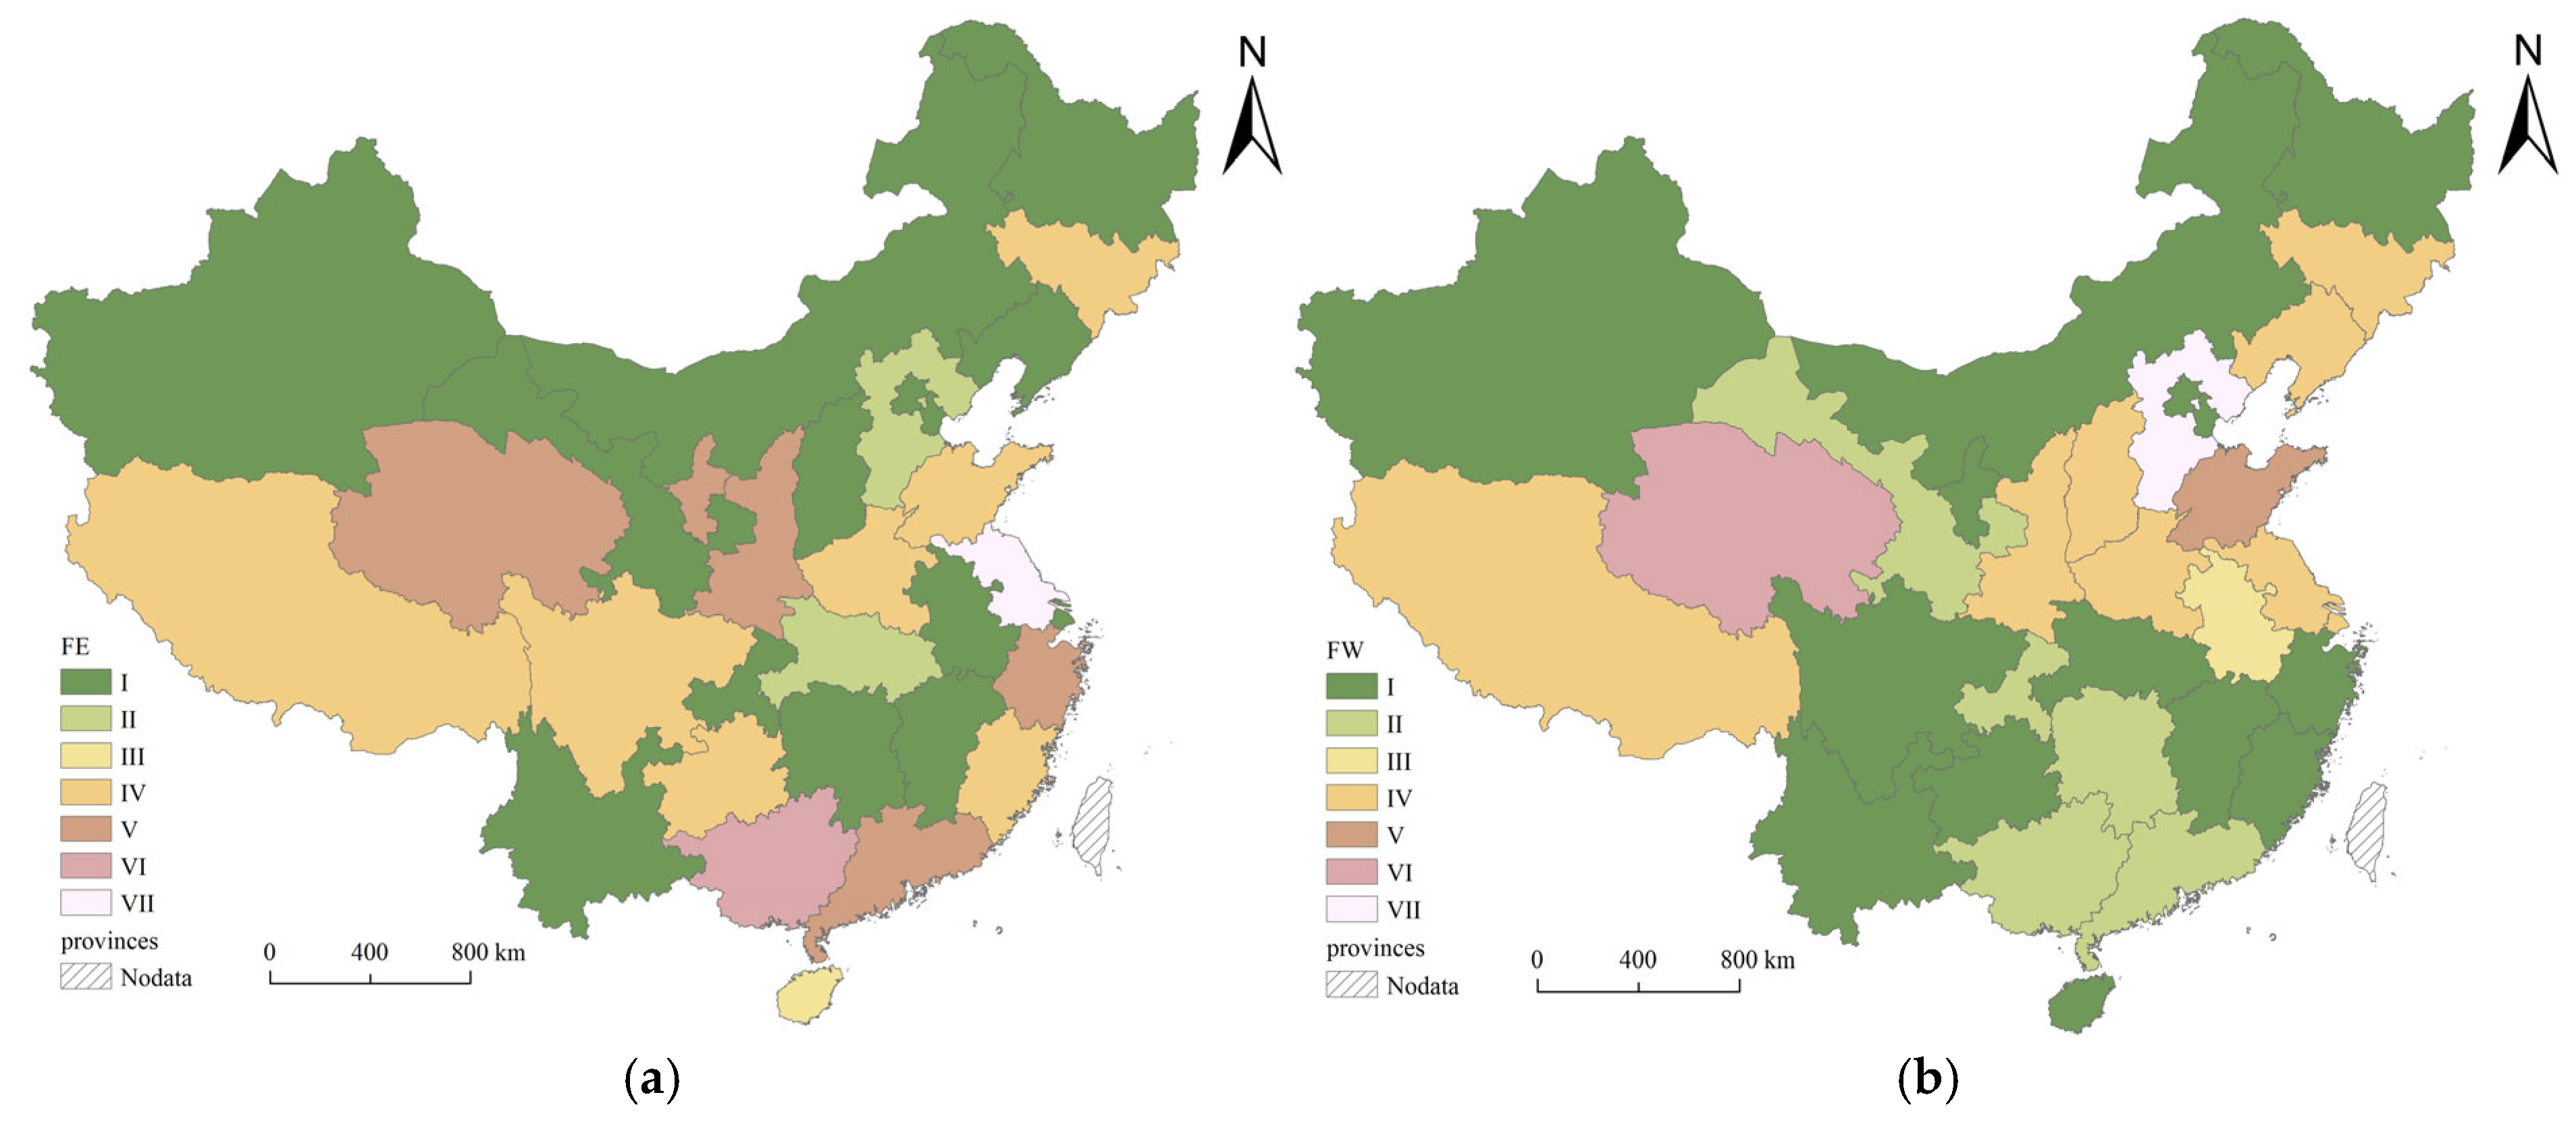
Analysis of the GHG emissions and carbon footprints of China’s CPSs revealed the existence of distinct patterns in FE and FW nexus interactions. The provinces within the FE nexus exhibited minimal differences in terms of the total GHG emissions and unit production carbon footprint between synergistic and trade-off outcomes (Figure 5a). In contrast, the FW nexus exhibited synergistic total emissions but pronounced trade-offs in the unit carbon footprint, highlighting the need for prioritizing water use efficiency in CPS management (Figure 5b).
Regionally, the northern provinces (Heilongjiang, Inner Mongolia, and Xinjiang), central Jiangxi, and southwestern Yunnan exhibited strong FE and FW nexus synergies in terms of the total GHG emissions, while Liaoning, Henan, and Tibet exhibited independent relationships. Central China exhibited greater FE synergy, whereas most of the coastal provinces, especially Jiangsu, exhibited antagonistic FE trade-offs between food production and energy consumption. The FW nexus was more synergistic in southern China. The provinces in the Huang-Huai-Hai basin generally exhibited independent relationships, but Shandong exhibited moderate trade-offs. These patterns were shaped by demographic, economic, and climatic factors. In this study, we found that Hebei exhibited a FW nexus trade-off, driven by its semi-arid/semi-humid climatic transition zone. In Anhui, Henan, and Tibet, maize exhibited an FE trade-off, while rice exhibited strong FW synergy, and wheat exhibited FE synergy (Figure S7). To enhance CPS management, we recommended integrating provincial differentiation into holistic strategies, as this approach can improve policy effectiveness and implementation by addressing regional contextual differences.

3.4. Analysis of the Contribution of Influencing Factors

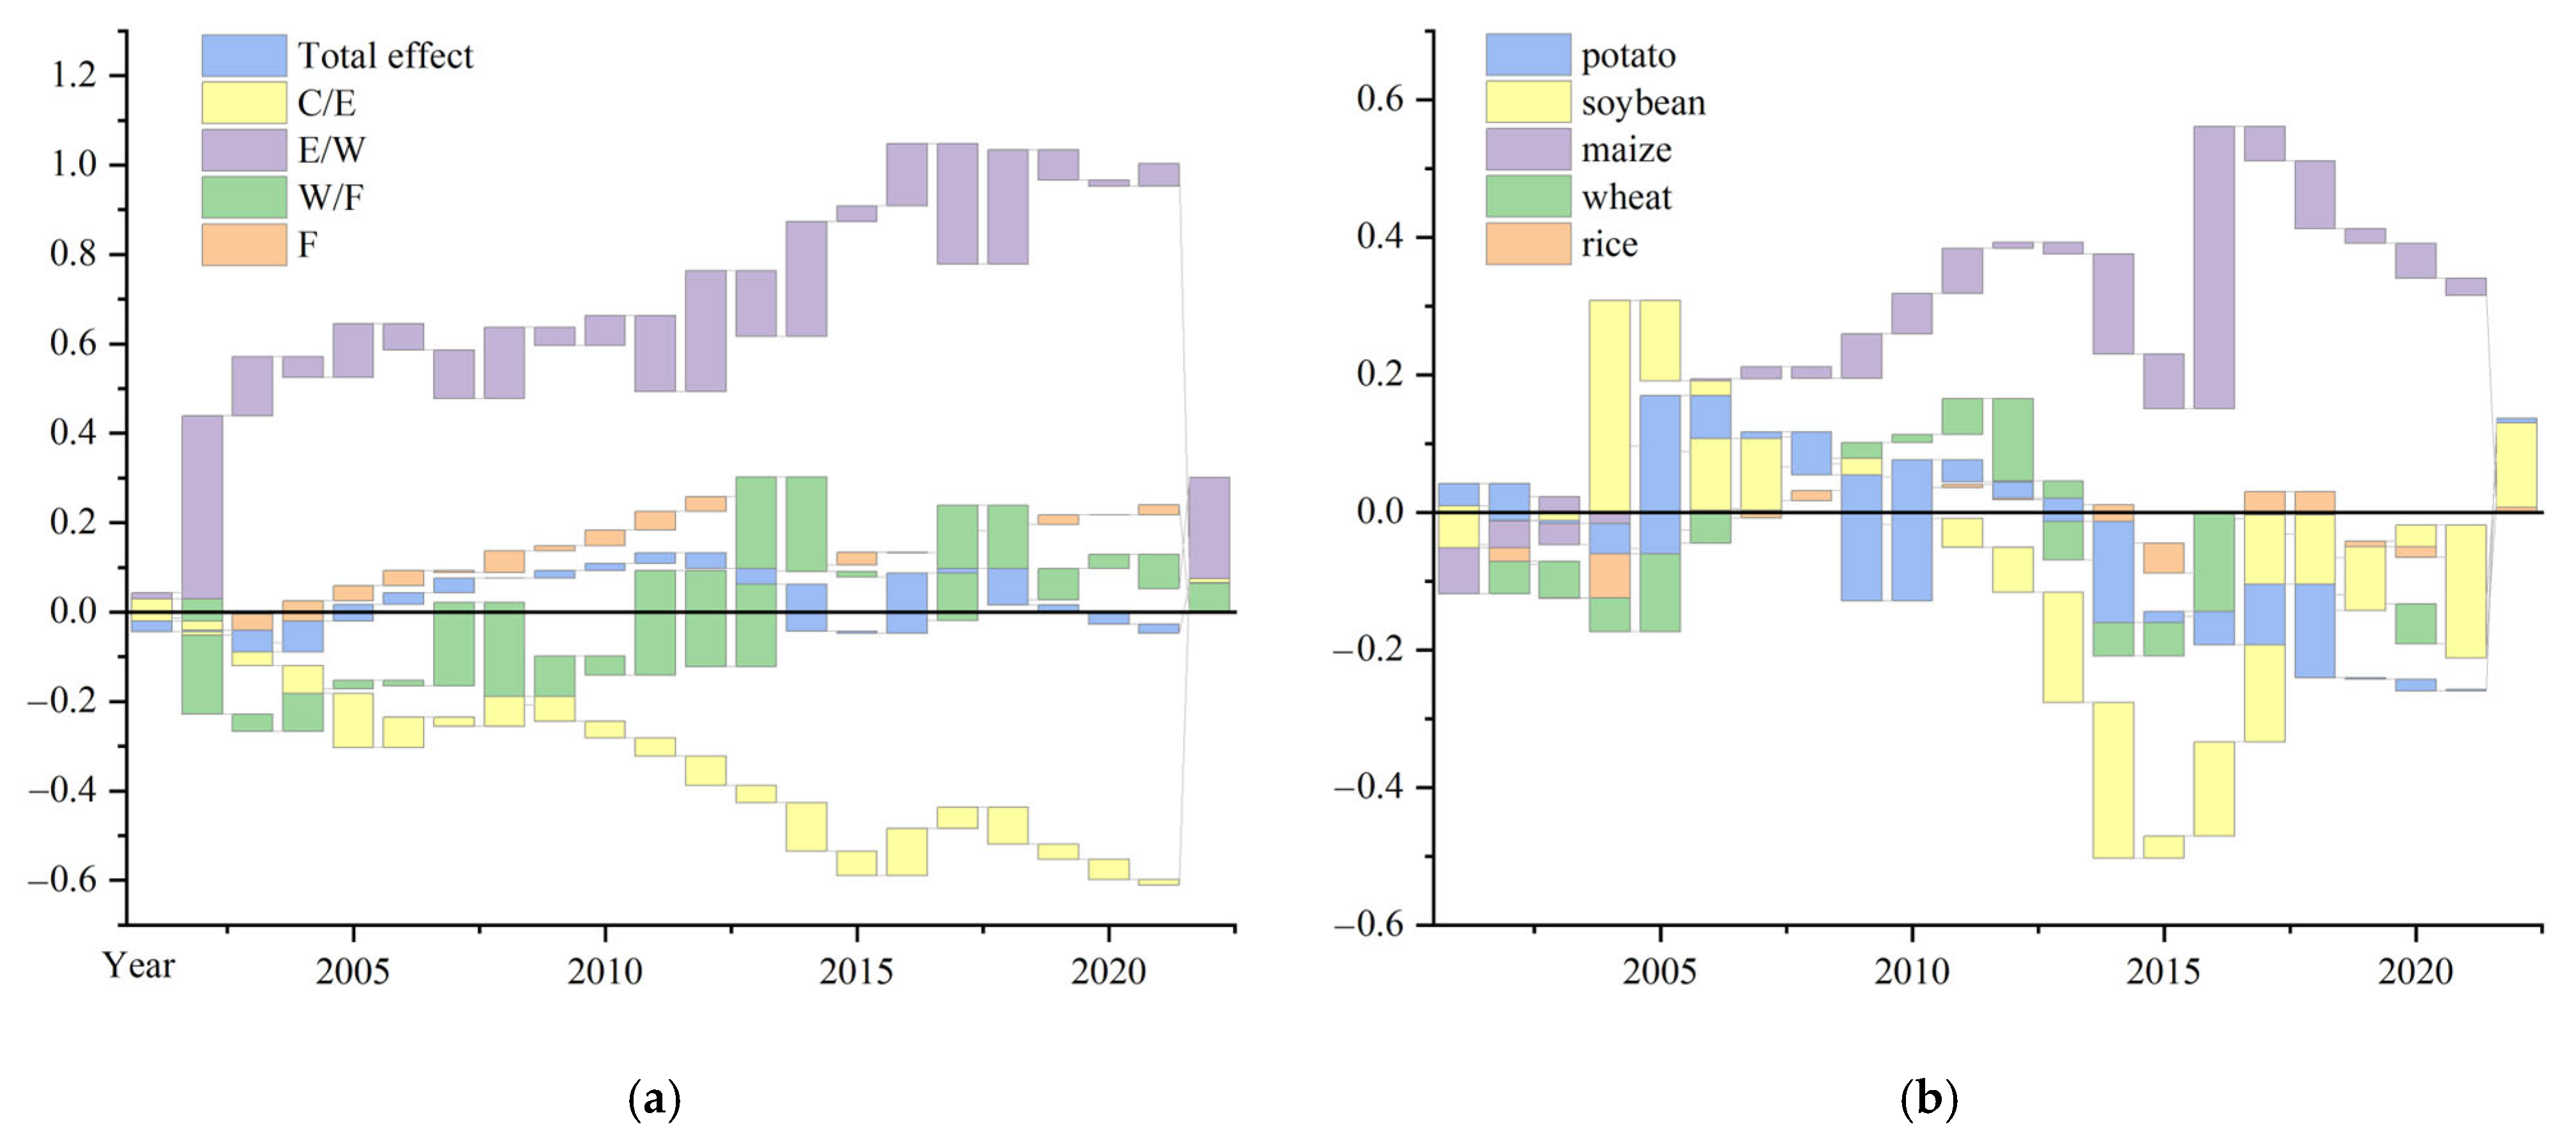
During 2000–2022, the total carbon effect of China’s CPSs exhibited a decreasing trend, indicating increasing overall contributions from FEW nexus interactions, which were characterized by substantial S-shaped inter-annual fluctuations (Figure 6a). Crop-specific analyses revealed divergent GHG emission trade-offs and synergies, with a notable synergistic trend in FEW resource emissions in 2022 (Figure 6b). From 2000 to 2022, food production contributed an average annual increase of 0.966% in GHG emissions, which was heavily influenced by rice. Rice made the largest positive contribution (4.283%), and it exerted a −0.691% negative impact on GHG emissions. This notably skewed the 2013 annual average due to a sharp decrease in rice production. The reduced rice sowing during 2020–2022 was correlated with the lower total emissions, highlighting rice’s dominant role in the emission trends. The major grains made overall positive contributions, suggesting that increasing rice cultivation would increase emissions. Soybean and potato production made negative contributions to the increase in GHG emissions in approximately half of the years analyzed.
The energy consumption in the CPSs drove an average annual increase of 3.155% in GHG emissions, exhibiting a similar S-shaped pattern, with consistently positive contributions during 2018–2022, confirming that the higher energy use increased GHG emissions. In contrast, blue water utilization supported food production but contributed a modest average annual increase of 0.042% in GHG emissions. The reliance on energy inputs—with an average annual contribution of 1.943%—was a key driver of GHG emissions, particularly in rice, wheat, and soybean production (with soybeans having a significant effect). Optimizing planting structures to favor wheat and soybeans may support food security while mitigating emissions. The rising marginal effects of energy-related GHG emissions underscore the urgency of improving energy efficiency in CPS management.
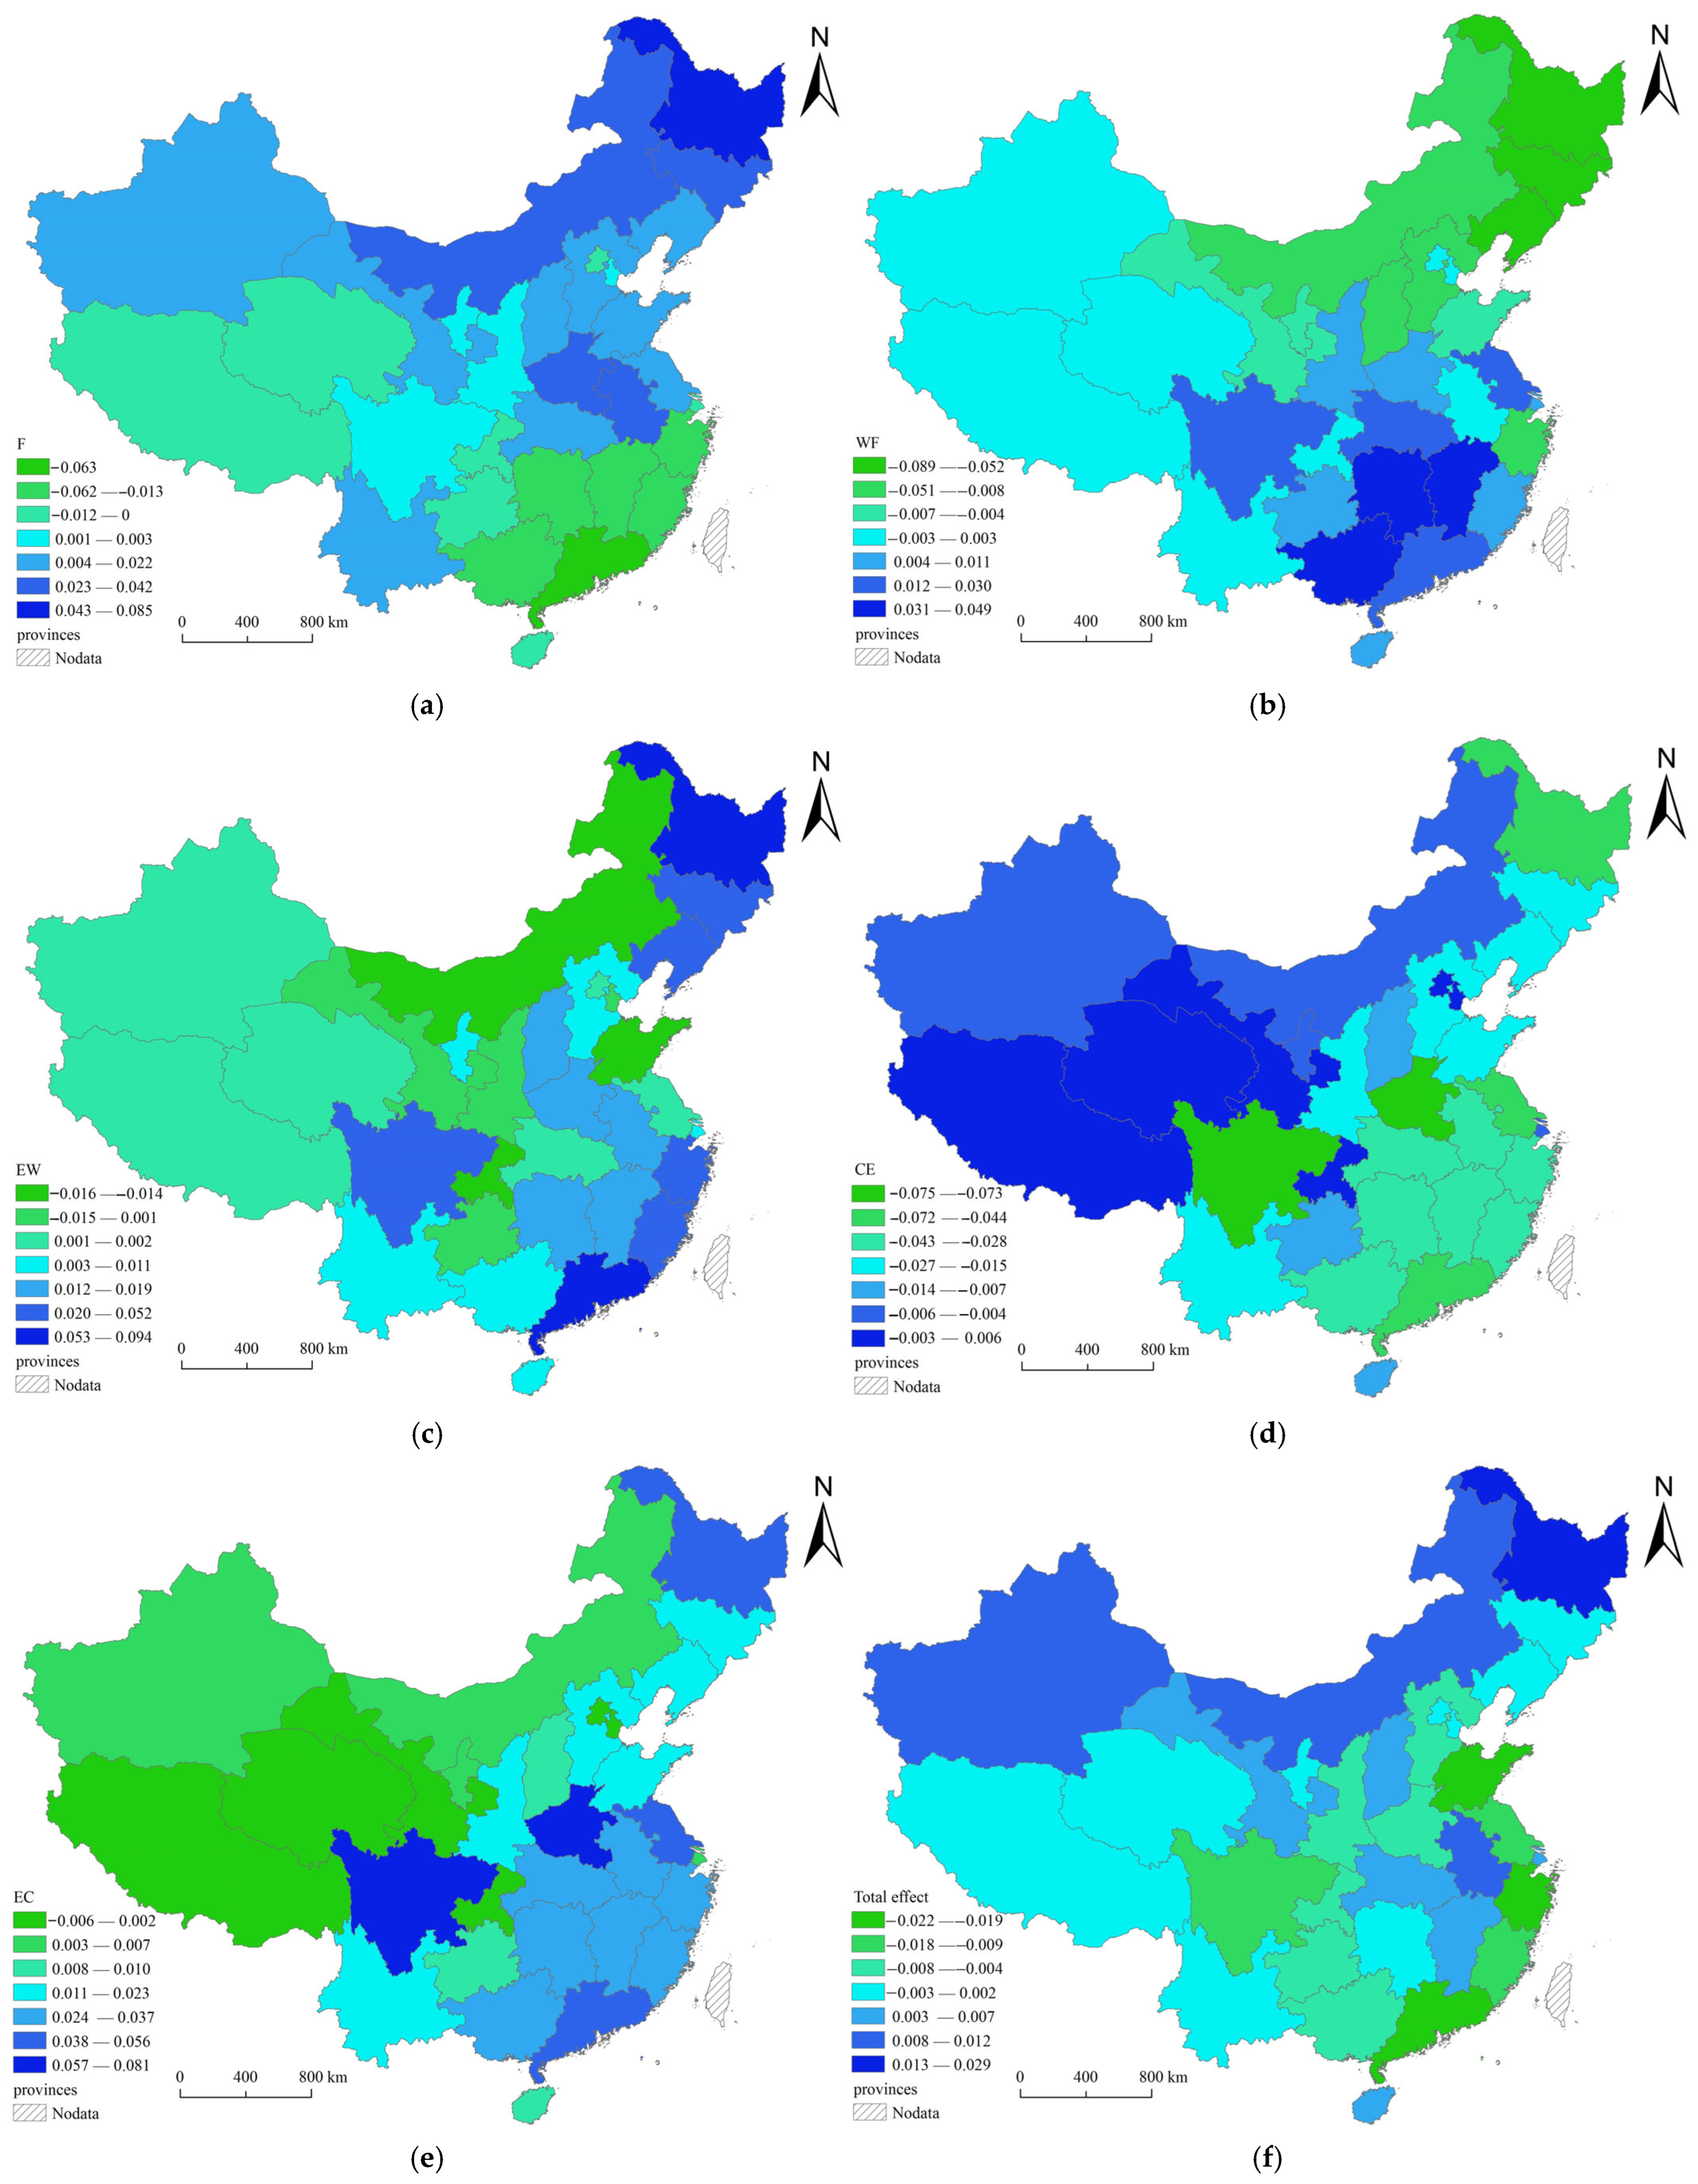
The spatial distribution of food security and its contribution to GHG emissions exhibited an increasing trend in the northern provinces and some of the central provinces (Figure 7a), particularly in major grain-producing regions such as Heilongjiang, Henan, Inner Mongolia, and Anhui. In terms of the crop structure, maize exhibited the most pronounced spatial variations in terms of its provincial contributions to the increase in GHG emissions, followed by rice—for example, Heilongjiang accounted for an average annual contribution of 8.520%. Substantial spatial disparities existed between the other drivers and food security (Figure 7b–e), with food security influencing the overall effect of the FEW nexuses on GHG emissions (Figure 7f). The less economically developed and ecologically fragile provinces likely contributed a smaller proportion of global GHG emissions, possibly due to reduced food production.
The absolute cumulative effect of the blue water carbon footprint in the CPSs was 2.17%. This metric revealed that the contributions were higher in the southwestern provinces and negative in the northern part of the study area, particularly in the northeast—where all of the crops exhibited negative blue water carbon footprint contributions, indicating highly efficient and carbon-saving blue water inputs. Rice had the largest absolute cumulative effect on the provincial blue water carbon footprints, accounting for 34.96% of the total, followed by potatoes and wheat. In contrast, maize and soybeans had negative absolute cumulative effects.
Except for Chongqing—where the energy intensity contributed negatively to the increase in GHG emissions—all of the provinces had positive energy intensity values, and the increased intensity was consistently correlated with higher emissions. The energy intensity’s spatial influence decreased from southeast to northwest, spanning the transition and extreme zones near the Hu Huanyong Line. Under the proposed future energy strategy, the goal is to maintain energy use efficiency in the northwestern provinces while promoting further energy conservation in the southeastern part of the study area.
The total effects of the FEW nexuses highlight that the most significant absolute cumulative impacts of integrated resource utilization occurred in northern and central China, with Henan and Heilongjiang experiencing significant effects. The spatial distribution of the relative FEW nexus effects mirrored this pattern, with higher values in the north and lower values in the south, and there were only minor shifts in the province with the maximum value. This indicates that Heilongjiang’s FEW nexuses had the most optimal net impact. Conversely, the coastal provinces require improvements to enhance the net positive effects of their FEW nexuses.

4. Discussion

4.1. Optimization and Management of CPSs Under Different GHG Emissions Reduction Scenarios

This study was fundamentally structured around the concept of food security, with a particular analytical focus on the GHG emissions associated with various CPSs [56]. The majority of the literature on this subject is in agreement that the global food production system has a considerable environmental impact [57,58] and that this is likely to become a significant cause for concern as the global population continues to grow [59]. The advice given is therefore unanimous in favor of investing in water productivity [60] and energy efficiency [61,62]. In accordance with the carbon footprint methodology, in this study, we exclusively focused on the utilization of direct energy sources [63], including fossil fuels and electricity, which are currently the focus of China’s green energy development reforms [64,65]. In other studies, the energy sources also encompassed indirect artificial auxiliary energies, such as fertilizers and pesticides [61]. Additionally, several production-based accounting studies have been conducted [66]. In 2021, China’s production of rice, wheat, and maize accounted for 19.57%, 17.76%, and 22.52% of the global staple grain production, respectively. The yields of these crops were 1.0808, 1.6640, and 1.0701 times the global average yield per unit area, respectively. In contrast, China’s soybean and potato production only accounted for 5.29% and 3.47% of the global output, respectively, with yields below the worldwide average. Some researchers have proposed expanding potato cultivation, citing its relatively small land requirement, high unit-area yield, and lower carbon footprint compared to other crops [67]. Implementing knowledge-based nitrogen management alongside integrated soil-crop system strategies [68] can effectively reduce GHG emissions in rice and maize production without compromising yields. This approach, which has been widely recommended in the academic literature, represents a critical measure for CPSs aiming to alleviate environmental pressures.
Throughout the study period, GHG emissions from the CPSs exhibited an M-shaped pattern. Research on GHG emission trends has shown that China’s CPS carbon emission increased rapidly from 2000 to 2011 [66]. Since 2011 (In March 2011, the various departments of the Government of China collaborated to produce the Guidelines for the Preparation of Provincial Greenhouse Gas Inventories (Trial)), advancements in the agricultural sector have significantly improved the effectiveness of emission reduction and carbon sequestration efforts in rural areas. China’s 2015 low-carbon development initiative had a pronounced impact on energy conservation and emission reductions, particularly reducing the prevalence of straw burning. A slight increase in emissions occurred in 2016, followed by a sustained decline beginning in 2018, which may be linked to the peak in the wheat and maize cultivation areas during this period. Among all of the drivers of GHG emissions, CH4 from paddy fields contributed the largest proportion of the GHG emissions, followed by carbon emissions from nitrogen fertilizer use and straw combustion [69,70,71].
During the study period, CH4 emissions from paddy fields exhibited an increasing trend, while emissions from nitrogen fertilizer use and straw burning decreased [72,73]. In 2022, GHG emissions from rice, wheat, and maize accounted for 53.04%, 15.15%, and 24.55% of the total CPS emissions, respectively—representing percentage changes of −1.27%, −3.85%, and 7.29%, respectively, compared to 2000. Despite these trends, rice maintained a high carbon footprint in 2022, with a value 2.4064 times the average footprint and an annual growth rate of 0.57%. The total rice production remained comparable to that in 2020, suggesting a shift in production patterns that peaked around 2012. Although production increased steadily after 2020, it did not exceed that in 2012. In 2012, rice’s carbon emission intensity was 14.937 t CO2-eq/t, a mid-range value reflective of historical practices. Research indicates that even with improved efficiency and moderate input reductions [58], ensuring food security could increase agricultural environmental burdens. Potential solutions include adjusting dietary structures [74], adopting no-tillage practices [75], and implementing fallow systems [76]. Spatially, Heilongjiang Province accounted for 18.16% of China’s rice production in 2022 but only 10.13% of associated GHG emissions, highlighting regional disparities in efficiency (Figure S5). To address these challenges, cropping structures must align with the provinces’ unique ecological and agronomic characteristics [69]. A differentiated management approach [77] focused on improving energy efficiency [78,79], conserving water resources [36], and reducing GHG emissions is essential for balancing food security with environmental sustainability.

4.2. A FEW Nexus Perspective on the Effective Resource Utilization

Given the complex interactions among FEW resources, it is necessary to deepen our understanding of the FEW nexus and to leverage nexus research [80,81,82]. While multiple interconnected nexuses exist, the relative importance of specific resources varies across regions [83,84]. In this CPS-based study, we identified food resources as the most critical component. Concurrently, energy resource use increased significantly alongside the development of the CPSs, with a notable increase in energy consumption throughout the study period [56]. However, energy use still constituted a relatively small proportion of CPS operations, underscoring the need for continued focus on efficient energy utilization across all of the CPSs in the future [85,86]. Compared to energy, blue water utilization generated higher GHG emissions. Among crops, rice exhibited the highest blue water consumption rate [87,88], followed by maize and wheat. While the rapid expansion of maize cultivation was accompanied by substantial yield increases, the associated increase in blue water use was lower than anticipated. From the perspective of water conservation and crop structure optimization, this presents an opportunity for further improvement. Expanding maize cultivation acreage is viable [89,90], as total GHG emissions from CPSs under high maize yields are lower than those from rice and wheat systems [29]. Notably, maize has the lowest energy consumption carbon footprint among all of the studied crops.
In terms of GHG emissions from energy sources, diesel and raw coal accounted for the largest proportions in 2000, accounting for 37.31% and 33.07% of the total emissions, respectively, while electricity contributed 19.76%. However, despite efforts toward clean energy development, carbon emissions from electricity use have increased [65,91]. National and local governments strongly advocate electricity substitution strategies [92]. During 2000–2022, diesel and raw coal usage remained stable, whereas electricity, petrol, and paraffin consumption increased significantly. By 2022, GHG emissions from electricity use in China’s CPSs were 4.073 times higher than the baseline period (2000), constituting 42.72% of energy-related emissions, a 2.162-fold increase since 2000. Spatially, the Optimized Development Area—comprising the Huang-Huai-Hai Plain, the middle and lower Yangtze River Basin (MT), and the Northeast (NE)—accounted for 68.46% of energy-related GHG emissions in 2022 [93], up from 65.81% in 2000. The proportion contributed by the HH Plain decreased, while that of the MT increased and that of the NE, a critical grain-producing region, increased modestly. Notably, Xinjiang experienced the fastest growth in energy consumption, surpassing all of the provinces in terms of the total direct energy use.
The FE nexus shifted from strong to weak synergy throughout the study period. In contrast, the FW nexus followed a gradual trajectory of trade-off to synergy and back to trade-off. While other studies have reported a consistent convergent trend toward trade-offs [94,95], the magnitudes of the results reported vary depending on the methodological approach utilized [96]. The decomposition analysis of the factors influencing the FEW nexus conducted in this study revealed that the total cumulative contribution of each factor decreased slightly and then increased during 2018–2022 [97,98,99], indicating that the FEW nexus maintained a favorable development trajectory [100]. To advance the efficacy of FEW nexus management, we recommend that short-term cropping structure optimization [101] and long-term GHG emission monitoring be conducted. Notable spatial variations exist in FEW nexus trade-offs and synergies. The FE nexus exhibited a higher prevalence of strong synergies, whereas the FW nexus exhibited significant regional differentiation [14]. Despite this, the results within the different agricultural sub-regions were highly variable and did not consistently exhibit strong–strong and weak–weak combinations of the FEW nexus. The FEW nexus exerted a considerable influence on the overall impact of GHG emissions [63], with the most pronounced effects observed in China’s eastern and central regions [94], which also play a crucial role in GHG emission reduction efforts. The details are presented in Figure 8. Heilongjiang Province had the most substantial combined impact of FEW nexus-related GHG emissions. As a major national food production base, crop production is a dominant driver of this province’s GHG emissions [102], suggesting the emergence of a robust synergistic relationship among FEW resources [103].

4.3. Policy Implications for Carbon Reduction in CPS Systems

China’s crop structure adjustment and optimization have become increasingly scientific; however, certain regions still need improvements aligned with local natural conditions. While the food cultivation is trending toward greater land efficiency, food supply and demand have remained in a narrow equilibrium in recent years. Spatially, grain production is regionally stratified into core production zones, surplus regions, and transitional adjustment areas, with a clear geographic shift in production emphasis toward the northeast. Overall, synergy analysis based on mean values revealed that crop structure adjustment is most critically needed in the MT (synergy value: 0.0181) and SW (0.0180) zones. Regarding rice cultivation specifically, the priority adjustment areas are the SW zone (0.0427) followed by the MT zone (0.0348) [104,105,106]. Similarly, maize cultivation structure adjustments should prioritize the SW zone (0.0384), followed by the MT zone (0.0129). Wheat cultivation restructuring warrants the highest priority in the HH, SW, and NW regions (0.0101, 0.0088, and 0.0096, separately). Additionally, soybean (0.0027) and potato (0.0994) cultivation systems in the SW region require optimization.
To enhance water and heat resource utilization in the southern regions [107], resuming rice production could be beneficial, but this is contingent on the demand and cultivation benefits. In the northern regions, farming systems should adapt to the local rainfall patterns [108,109], with reasonable control over rice and wheat planting areas. The implementation of alternate wet and dry irrigation strategies has been identified as a pivotal element in the mitigation of water stress in rice production, particularly in the regions characterized by limited water availability [110]. Achieving the optimal grain cultivation scale, efficient productivity, and safe quality depends on the resource quantity, quality, ecological health, and systematic scientific management [111,112]. In the future, we recommend sustainably enhancing the comprehensive grain production capacity of major regions such as the Northeast. Addressing GHG emissions requires strategies such as promoting fallow cultivation in environmentally sensitive areas, implementing crop rotation, and reducing the use of chemical fertilizers, pesticides, and agricultural films through improved management systems [72,113]. When effectively applied, nexus-based approaches can mitigate unforeseen negative impacts and foster integrated planning, management, and governance [80].
China’s current food security strategy facilitates GHG emission reductions through efficient water resource use, optimized energy consumption patterns, and improved energy efficiency. Developed regions with high GHG emissions have also achieved greater energy and water use efficiency [63]. Emissions intensity gaps should guide the classification of demonstration areas. A case in point is the NE region, where rice cultivation contributes 1.2865 times more to yield than to carbon emissions, highlighting its comparative efficiency (Table S14). The initial phase involves optimizing the use of conventional fossil and renewable energy sources [92,114]. As a global leader in the energy transition, China actively promotes cost reductions of clean and renewable energy technologies. Concurrently, reducing the reliance on fossil fuels is essential in the shift to clean energy. The global energy development agenda is shifting toward biomass energy [85], encompassing energy derived from food production processes and energy agriculture technologies such as biogas, straw gasification, fuel ethanol, and biodiesel extraction [15,115]. Cultivating energy crops and developing biomass energy can yield positive environmental impacts [61], underscoring the urgent need to build a climate-resilient energy system.
Revitalizing the food system is critical and is driven by the interplay of blue water use and integration across all of the nexus dimensions [116,117,118]. Enhancing the indicator system for monitoring the total water consumption and strengthening water resource management practices are imperative [119]. We recommend that transparent agricultural water use metrics be implemented and multifaceted water security strategies be pursued. A comprehensive water rights system has been established, facilitating the transfer of water rights and encouraging spatial balance [120]. Additionally, policymakers must account for regional water endowment conditions, optimize irrigation practices, expand high-efficiency water-saving irrigation areas, and standardize management protocols [88].

4.4. Limitations and Perspectives

This study has some limitations. We only analyzed five food crops and focused on CPSs, while we excluded crop rotation and intercropping due to data constraints. While the CROPWAT 8.0 software calculates both green water (effective precipitation) and blue water (effective irrigation), only blue water was examined as green water dynamics, and renewable energy sources such as solar and hydroelectricity have minimal associations with GHG emissions. Future research could more comprehensively characterize water resource utilization across these dimensions. Given China’s regional variability, the Kaya formula is insufficient for assessing CPS GHG emissions, as cross-regional material, energy, and information flows generate GHG emissions. Targeted dematerialization strategies and integrated approaches are needed to effectively address emissions. While we modified the Kaya formula to analyze the FEW nexuses, further validation is required to ensure its robustness across diverse regional contexts. The next phase involves integrating CPS accounting with a multiregional input–output framework to capture upstream electricity and fuel emissions. This will be followed by Monte Carlo uncertainty propagation using the published emission factor tables, and incorporation of green water resources to enable comprehensive FW nexus analysis.

5. Conclusions

The growing demand for FEW underscores their centrality to global sustainable development, particularly amid the complex interdependencies in the CPSs. As China’s agricultural sector is its second-largest GHG emitter after energy, in this study, we explored the FEW nexus dynamics by quantifying trade-offs and synergies through the a lifecycle approach and LMDI methods. We evaluated the emission patterns across staple crops and integrated blue water use and energy expenditure to model water–energy linkages. The results of this study reveal the occurrence of spatiotemporal shifts in China’s agricultural GHG emissions, including decreasing food-system footprints, increasing FE nexus dominance, and efficiency gains in the FW nexus, which align spatially with the Hu Huanyong Line. While the integrated FEW nexuses marginally reduced emissions, the provincial FE footprints became more heterogeneous. To optimize these systems, zonal cropping strategies are recommended in order to balance food security with EW stewardship. The results of this study provide actionable frameworks for sustainable CPS governance and FEW resource allocation.

Supplementary Materials

The following supporting information can be downloaded at: https://www.mdpi.com/article/10.3390/land14081674/s1, Table S1. Emission coefficients (CO2-eq(kg)); Table S2. Coefficients of CH4 emissions from rice fields in different provinces (Unit: g CO2-eq/m2); Table S3. CH4 emission factors for different paddy types in different regions of China (Unit: t CO2-eq/ha); Table S4. Coefficients of direct N2O emission from soil by province. Unit: kg(N2O)∙kg−1); Table S5. Crop dry matter fraction and combustion efficiency; Table S6. The average emission factors of straw; Table S7. Straw-to-grain ratios (R) for various craps in every province; Table S8. Domestic straw burning percentage (%) of each province from 2000 to 2022; Table S9. In-field straw burning percentage (%) of each province during 2000–2022; Table S10. Zoning of the study area; Table S11. Details of data sources; Table S12. The correlations between the dual-resource carbon footprints of FEW for different CPSs; Table S13. Variables and transformations FE, FW, and EW; Table S14. Emissions intensity gap of GHG emissions per rice production (t CO2-eq/t); Figure S1. The carbon footprint of CPSs during the period between 2000 and 2022; Figure S2. Carbon footprints and photosynthetic carbon sequestration of five crops; Figure S3. Carbon footprint proportion of CPSs in selected years; Figure S4. Box plots of carbon footprints of five crops (t CO2-eq/ha); Figure S5. Carbon footprint proportion of energy consumption in selected years; Figure S6. Carbon footprint proportion of blue water consumption in selected years; Figure S7. Spatio-temporal FE and FW nexuses. References [121,122,123,124,125,126,127,128,129,130,131,132,133,134,135,136,137,138,139,140,141] have been cited in main text.

Author Contributions

Conceptualization, B.G.; methodology, B.G., X.Z. and Y.L.; software, T.C.; validation, T.S. and Y.T.; formal analysis, T.C.; investigation, B.G.; resources, B.G.; data curation, X.Z.; writing—original draft preparation, B.G. and X.Z.; writing—review and editing, J.H.; visualization, B.G.; supervision, B.G. All authors have read and agreed to the published version of the manuscript.

Funding

This research was funded by the National Natural Science Foundation of China (Grant No. 42271272, 42171238) and the Natural Science Foundation of Anhui Province of China (2208085MD92).

Data Availability Statement

The data are available from the corresponding author on reasonable request.

Acknowledgments

We extend our gratitude to those who provided data and assistance.

Conflicts of Interest

The authors declare no conflicts of interest. The funders had no role in the design of the study; in the collection, analyses, or interpretation of data; in the writing of the manuscript; or in the decision to publish the results.

References

  1. Herrera-Franco, G.; Bollmann, H.A.; Lofhagen, J.C.P.; Bravo-Montero, L.; Carrion-Mero, P. Approach on water-energy-food (WEF) nexus and climate change: A tool in decision-making processes. Environ. Dev. 2023, 46, 10858. [Google Scholar] [CrossRef]
  2. Bhaduri, A.; Ringler, C.; Dombrowski, I.; Mohtar, R.; Scheumann, W. Sustainability in the water-energy-food nexus. Water Int. 2015, 40, 723–732. [Google Scholar] [CrossRef]
  3. Pandey, V.P.; Shrestha, S. Evolution of the Nexus as a Policy and Development Discourse. In Water-Energy-Food Nexus: Principles and Practices; AGU: Washington, DC, USA, 2017; pp. 11–20. [Google Scholar]
  4. Scanlon, B.R.; Ruddell, B.L.; Reed, P.M.; Hook, R.I.; Zheng, C.; Tidwell, V.C.; Siebert, S. The food-energy-water nexus: Transforming science for society. Water Resour. Res. 2017, 53, 3550–3556. [Google Scholar] [CrossRef]
  5. Liang, S.; Qu, S.; Zhao, Q.; Zhang, X.; Daigger, G.T.; Newell, J.P.; Miller, S.A.; Johnson, J.X.; Love, N.G.; Zhang, L. Quantifying the Urban Food-Energy-Water Nexus: The Case of the Detroit Metropolitan Area. Environ. Sci. Technol. 2019, 53, 779–788. [Google Scholar] [CrossRef]
  6. Zambrano-Prado, P.; Munoz-Liesa, J.; Josa, A.; Rieradevall, J.; Alamus, R.; Gasso-Domingo, S.; Gabarrell, X. Assessment of the food-water -energy nexus suitability of rooftops. A methodological remote sensing approach in an urban Mediterranean area. Sustain. Cities Soc. 2021, 75, 103287. [Google Scholar] [CrossRef]
  7. Fry, J.P.; Scroggins, R.E.; Garlock, T.M.; Love, D.C.; Asche, F.; Brown, M.T.; Nussbaumer, E.M.; Nguyen, L.; Jenkins, L.D.; Anderson, J.; et al. Application of the food-energy-water nexus to six seafood supply chains: Hearing from wild and farmed seafood supply chain actors in the United States, Norway, and Vietnam. Front. Sustain. Food S 2024, 7, 1269026. [Google Scholar] [CrossRef]
  8. Yuan, M.H.; Lo, S.L. Principles of food-energy-water nexus governance. Renew. Sustain. Energy Rev. 2022, 155, 111937. [Google Scholar] [CrossRef]
  9. Cairns, R.; Krzywoszynska, A. Anatomy of a buzzword: The emergence of the water-energy-food nexus’ in UK natural resource debates. Environ. Sci. Policy 2016, 64, 164–170. [Google Scholar] [CrossRef]
  10. Whitney, E.; Schnabel, W.E.; Aggarwal, S.; Huang, D.; Dotson, A.D. MicroFEWs: A Food-Energy-Water Systems Approach to Renewable Energy Decisions in Islanded Microgrid Communities in Rural Alaska. Environ. Eng. Sci. 2019, 36, 843–849. [Google Scholar] [CrossRef]
  11. Ogbolumani, O.A.; Nwulu, N. Environmental impact assessment for a meta-model-based food-energy-water-nexus system. Energy Rep. 2024, 11, 218–232. [Google Scholar] [CrossRef]
  12. Ioannou, A.E.E.; Laspidou, C.S.S. Cross-Mapping Important Interactions between Water-Energy-Food Nexus Indices and the SDGs. Sustainability 2023, 15, 8045. [Google Scholar] [CrossRef]
  13. Niet, T.; Arianpoo, N.; Kuling, K.; Wright, A.S. Embedding the United Nations sustainable development goals into energy systems analysis: Expanding the food-energy-water nexus. Energy Sustain. Soc. 2021, 11, 1. [Google Scholar] [CrossRef]
  14. Islam, S.M.F.; Karim, Z. World’s Demand for Food and Water: The Consequences of Climate Change. In Desalination—Challenges and Opportunities; Farahani, M.H.D.A., Vatanpour, V., Taheri, A.H., Eds.; IntechOpen: London, UK, 2019. [Google Scholar]
  15. Xu, S.; Wang, R.; Gasser, T.; Ciais, P.; Penuelas, J.; Balkanski, Y.; Boucher, O.; Janssens, I.A.; Sardans, J.; Clark, J.H.; et al. Delayed use of bioenergy crops might threaten climate and food security. Nature 2022, 609, 299. [Google Scholar] [CrossRef]
  16. Anser, M.K.; Yousaf, Z.; Usman, B.; Nassani, A.A.; Abro, M.M.Q.; Zaman, K. Management of water, energy, and food resources: Go for green policies. J. Clean. Prod. 2020, 251, 119662. [Google Scholar] [CrossRef]
  17. Kibler, K.M.; Reinhart, D.; Hawkins, C.; Motlagh, A.M.; Wright, J. Food waste and the food-energy-water nexus: A review of food waste management alternatives. Waste Manag. 2018, 74, 52–62. [Google Scholar] [CrossRef]
  18. Skawinska, E.; Zalewski, R. Combining the Water-Energy-Food and Food Waste-Food Loss-Food Security Nexuses to Reduce Resource Waste. Energies 2022, 15, 5866. [Google Scholar] [CrossRef]
  19. Proctor, K.; Tabatabaie, H.; Murthy, G.S. Gateway to the perspectives of the Food-Energy-Water Nexus. Sci. Total Environ. 2021, 764, 142852. [Google Scholar] [CrossRef] [PubMed]
  20. Ao, Y.Z.; Siddik, M.A.B.; Konar, M.; Marston, L.T. Watersheds and Infrastructure Providing Food, Energy, and Water to US Cities. Earths Future 2024, 12, e2023EF004258. [Google Scholar] [CrossRef]
  21. Xu, Z.; Chen, X.; Liu, J.; Zhang, Y.; Chau, S.; Bhattarai, N.; Wang, Y.; Li, Y.; Connor, T.; Li, Y. Impacts of irrigated agriculture on food-energy-water-CO 2 nexus across metacoupled systems. Nat. Commun. 2020, 11, 5837. [Google Scholar] [CrossRef]
  22. Variani, H.A.; Afshar, A.; Vahabzadeh, M.; Molajou, A.; Varyani, M.M.A. Development of a novel framework for agriculture simulation model for food-energy-water nexus analysis in watershed-scale. J. Clean. Prod. 2023, 429, 139492. [Google Scholar] [CrossRef]
  23. Tilt, J.; Babbar-Sebens, M.; Ramadas, M.; Kolagani, N.; Naren, U.S. Participatory Framing of a Conceptual Decision Model for a Hyperlocalized Food, Energy, and Water Nexus: A Case Study in Adaptive Management of Rural Water Systems in India. J. Water Res. Plan. Man. 2024, 150, 05024001. [Google Scholar] [CrossRef]
  24. Fridman, D.; Biran, N.; Kissinger, M. Beyond blue: An extended framework of blue water footprint accounting. Sci. Total Environ. 2021, 777, 146010. [Google Scholar] [CrossRef] [PubMed]
  25. Mekonnen, M.M.; Hoekstra, A.Y. Blue water footprint linked to national consumption and international trade is unsustainable. Nat. Food 2020, 1, 792–800. [Google Scholar] [CrossRef]
  26. Hanumante, N.; Shastri, Y.; Nisal, A.; Diwekar, U.; Cabezas, H. Water stress-based price for global sustainability: A study using generalized global sustainability model (GGSM). Clean. Technol. Environ. 2024, 27, 1131–1150. [Google Scholar] [CrossRef]
  27. Gelfand, I.; Sahajpal, R.; Zhang, X.; Izaurralde, R.C.; Gross, K.L.; Robertson, G.P. Sustainable bioenergy production from marginal lands in the US Midwest. Nature 2013, 493, 514. [Google Scholar] [CrossRef]
  28. Gu, W.; Ma, G.; Wang, R.; Scherer, L.; He, P.; Xia, L.; Zhu, Y.; Bi, J.; Liu, B. Climate adaptation through crop migration requires a nexus perspective for environmental sustainability in the North China Plain. Nat. Food 2024, 5, 569–580. [Google Scholar] [CrossRef]
  29. Yadav, G.S.; Das, A.; Kandpal, B.K.; Babu, S.; Lal, R.; Datta, M.; Das, B.; Singh, R.; Singh, V.; Mohapatra, K. The food-energy-water-carbon nexus in a maize-maize-mustard cropping sequence of the Indian Himalayas: An impact of tillage-cum-live mulching. Renew. Sustain. Energy Rev. 2021, 151, 111602. [Google Scholar] [CrossRef]
  30. Wang, Y.; Wang, R.; Tanaka, K.; Ciais, P.; Penuelas, J.; Balkanski, Y.; Sardans, J.; Hauglustaine, D.; Liu, W.; Xing, X.; et al. Accelerating the energy transition towards photovoltaic and wind in China. Nature 2023, 619, 761. [Google Scholar] [CrossRef]
  31. Kumar, R.; Mishra, J.S.; Mali, S.S.; Mondal, S.; Meena, R.S.; Lal, R.; Jha, B.K.; Naik, S.K.; Biswas, A.K.; Hans, H.; et al. Comprehensive environmental impact assessment for designing carbon-cum-energy efficient, cleaner and eco-friendly production system for rice-fallow agro -ecosystems of South Asia. J. Clean. Prod. 2022, 331, 129973. [Google Scholar] [CrossRef]
  32. Wada, I.; Faizulayev, A.; Bekun, F.V. Exploring the role of conventional energy consumption on environmental quality in Brazil: Evidence from cointegration and conditional causality. Gondwana Res. 2021, 98, 244–256. [Google Scholar] [CrossRef]
  33. Bekun, F.V. Race to carbon neutrality in South Africa: What role does environmental technological innovation play ? Appl. Energy 2024, 354, 122212. [Google Scholar] [CrossRef]
  34. Ukanwa, K.S.; Patchigolla, K.; Sakrabani, R. Energy and economic assessment of mixed palm residue utilisation for production of activated carbon and ash as fertiliser in agriculture. Environ. Technol. 2023, 44, 948–960. [Google Scholar] [CrossRef] [PubMed]
  35. Yang, H.; Wang, X.; Bin, P. Agriculture carbon-emission reduction and changing factors behind agricultural eco-efficiency growth in China. J. Clean. Prod. 2022, 334, 130193. [Google Scholar] [CrossRef]
  36. Fagodiya, R.K.; Singh, A.; Singh, R.; Rani, S.; Kumar, S.; Rai, A.K.; Sheoran, P.; Chandra, P.; Yadav, R.K.; Sharma, P.C.; et al. The food-energy-water -carbon nexus of the rice-wheat production system in the western Indo-Gangetic Plain of India: An impact of irrigation system, conservational tillage and residue management. Sci. Total Environ. 2023, 860, 160428. [Google Scholar] [CrossRef]
  37. Voeroesmarty, C.J.; Campana, P.E.; Jewitt, G.; Lawford, R.; Wuebbles, D. Editorial: Food-energy-water systems: Achieving climate resilience and sustainable development in the 21st century. Front. Environ. Sci-Switz. 2024, 11, 1334892. [Google Scholar] [CrossRef]
  38. Newell, J.P.; Goldstein, B.; Foster, A. A 40-year review of food-energy-water nexus literature and its application to the urban scale. Environ. Res. Lett. 2019, 14, 073003. [Google Scholar] [CrossRef]
  39. Meena, R.S.; Pradhan, G.; Kumar, S.; Lal, R. Using industrial wastes for rice-wheat cropping and food-energy-carbon-water-economic nexus to the sustainable food system. Renew. Sust. Energy Rev. 2023, 187, 113756. [Google Scholar] [CrossRef]
  40. Yu, L.; Liu, S.; Wang, F.; Liu, Y.; Li, M.; Wang, Q.; Dong, S.; Zhao, W.; Tran, L.P.; Sun, Y.; et al. Effects of agricultural activities on energy-carbon-water nexus of the Qinghai-Tibet Plateau. J. Clean. Prod. 2022, 331, 129995. [Google Scholar] [CrossRef]
  41. Ozturk, I. The dynamic relationship between agricultural sustainability and food-energy-water poverty in a panel of selected Sub-Saharan African Countries. Energy Policy 2017, 107, 289–299. [Google Scholar] [CrossRef]
  42. Caputo, S.; Schoen, V.; Specht, K.; Grard, B.; Blythe, C.; Cohen, N.; Fox-Kaemper, R.; Hawes, J.; Newell, J.; Ponizy, L. Applying the food-energy-water nexus approach to urban agriculture: From FEW to FEWP (Food-Energy-Water-People). Urban. Urban. Gree 2021, 58, 126934. [Google Scholar] [CrossRef]
  43. Uslu, S.; Kaur, D.; Rivera, S.J.; Durresi, A.; Tilt, J.H. A Trustworthy Human-Machine framework for collective decision making in Food-Energy-Water management: The role of trust sensitivity. Knowl-Based Syst. 2020, 213, 106683. [Google Scholar] [CrossRef]
  44. Huang, J.; Yang, G. Understanding recent challenges and new food policy in China. Glob. Food Secur-Agr. 2017, 12, 119–126. [Google Scholar] [CrossRef]
  45. China, M.O.A.A. National Plan for Sustainable Agricultural Development (2015–2030). Available online: http://www.moa.gov.cn/ztzl/mywrfz/gzgh/201509/t20150914_4827900.htm (accessed on 16 April 2025).
  46. Council, O.O.T.L.; Statistics, N.B.O. The Atlas of Regional Distribution of Major Agricultural Products of the Third National Agricultural Census; China Statistics Publishing House: Beijing, China, 2021. (In Chinese) [Google Scholar]
  47. FAO. CropWat, Model Item, OpenGMS; FAO: Rome, Italy, 2020. [Google Scholar]
  48. Allen, R.G. Crop Evapotranspiration-Guidelines for computing crop water requirements. Fao Irrig. Drain. Pap. (Fao) 1998, 56, D05109. [Google Scholar]
  49. Pearson, K. Notes on the history of correlation. Biometrika 1920, 13, 25–45. [Google Scholar] [CrossRef]
  50. Pradhan, P.; Costa, L.; Rybski, D.; Lucht, W.; Kropp, J.P. A Systematic Study of Sustainable Development Goal (SDG) Interactions. Earths Future 2017, 5, 1169–1179. [Google Scholar] [CrossRef]
  51. Kaya, Y.; Yokobori, K. Environment, Energy, and Economy: Strategies for Sustainability; United Nations University Press: Tokyo, Japan, 1997; p. 393. [Google Scholar]
  52. Xu, Y.; Li, J.; Li, H.; Yang, S.; Jiang, Q.; Sui, P.; Gao, W.; Cui, J.; Chen, Y. The water-food-energy nexus evaluation and optimization of cropping system in the North China Plain: A case of county scale. J. Clean. Prod. 2024, 443, 141200. [Google Scholar] [CrossRef]
  53. Sun, J.; Yang, K. The Wicked Problem of Climate Change: A New Approach Based on Social Mess and Fragmentation. Sustainability 2016, 8, 1312. [Google Scholar] [CrossRef]
  54. Ang, B.W. The LMDI approach to decomposition analysis: A practical guide. Energy Policy 2005, 33, 867–871. [Google Scholar] [CrossRef]
  55. Fang, C.L. The Bo-Tai Line: Establishing the concepts of a balanced regional development line and a national development backbone. J. Geogr. Sci. 2021, 31, 839–858. [Google Scholar] [CrossRef]
  56. Zhang, X.; Pan, H.; Cao, J.; Li, J. Energy consumption of China’s crop production system and the related emissions. Renew. Sust. Energy Rev. 2015, 43, 111–125. [Google Scholar] [CrossRef]
  57. Al-Ansari, T.; Korre, A.; Nie, Z.; Shah, N. Integration of greenhouse gas control technologies within the energy, water and food nexus to enhance the environmental performance of food production systems. J. Clean. Prod. 2017, 162, 1592–1606. [Google Scholar] [CrossRef]
  58. Chen, X.; Cui, Z.; Fan, M.; Vitousek, P.; Zhao, M.; Ma, W.; Wang, Z.; Zhang, W.; Yan, X.; Yang, J.; et al. Producing more grain with lower environmental costs. Nature 2014, 514, 486. [Google Scholar] [CrossRef]
  59. Khan, S.; Hanjra, M.A. Footprints of water and energy inputs in food production—Global perspectives. Food Policy 2009, 34, 130–140. [Google Scholar] [CrossRef]
  60. Holmatov, B.; Hoekstra, A.Y.; Krol, M.S. Land, water and carbon footprints of circular bioenergy production systems. Renew. Sust. Energy Rev. 2019, 111, 224–235. [Google Scholar] [CrossRef]
  61. Sharafi, S.; Kazemi, A.; Amiri, Z. Estimating energy consumption and GHG emissions in crop production: A machine learning approach. J. Clean. Prod. 2023, 408, 137242. [Google Scholar] [CrossRef]
  62. Zhang, F.; Cai, Y.; Tan, Q.; Engel, B.A.; Wang, X. An optimal modeling approach for reducing carbon footprint in agricultural water-energy-food nexus system. J. Clean. Prod. 2021, 316, 128325. [Google Scholar] [CrossRef]
  63. Li, W.; Liang, Y.; Liu, L.; He, Q.; Huang, J.; Yin, Z. Spatio-temporal impacts of land use change on water-energy-food nexus carbon emissions in China, 2011-2020. Environ. Impact Asses 2024, 105, 3347. [Google Scholar] [CrossRef]
  64. Musa, S.D.; Tang, Z.H.; Ibrahim, A.O.; Habib, M. China’s energy status: A critical look at fossils and renewable options. Renew. Sust. Energy Rev. 2018, 81, 2281–2290. [Google Scholar] [CrossRef]
  65. Yang, X.J.; Hu, H.; Tan, T.; Li, J. China’s renewable energy goals by 2050. Environ. Dev. 2016, 20, 83–90. [Google Scholar] [CrossRef]
  66. Hong, C.; Burney, J.A.; Pongratz, J.; Nabel, J.E.M.S.; Mueller, N.D.; Jackson, R.B.; Davis, S.J. Global and regional drivers of land-use emissions in 1961–2017. Nature 2021, 589, 554. [Google Scholar] [CrossRef] [PubMed]
  67. Liu, B.; Gu, W.; Yang, Y.; Lu, B.; Wang, F.; Zhang, B.; Bi, J. Promoting potato as staple food can reduce the carbon-land-water impacts of crops in China. Nat. Food 2021, 2, 570–577. [Google Scholar] [CrossRef]
  68. Chu, Q.; Shi, X.; Zhao, J.; Jia, H.; Zhao, J.; Lu, J.; Zhao, M. Seeking sustainable pathway of crop production by optimizing planting structures and management practices from the perspective of water footprint. Sci. Total Environ. 2022, 843, 157091. [Google Scholar]
  69. Lv, Q.; Yang, Z.; Chen, Z.; Li, M.; Gao, B.; Yang, J.; Chen, X.; Xu, B. Crop residue burning in China (2019–2021): Spatiotemporal patterns, environmental impact, and emission dynamics. Environ. Sci. Ecotech 2024, 21, 100394. [Google Scholar] [CrossRef] [PubMed]
  70. Maksyutov, S.; Eggleston, S.; Woo, J.H.; Fang, S.; Weitz, M.M. Refinement to the 2006 IPCC Guidelines for National Greenhouse Gas Inventories; IPCC: Yokohama, Japan, 2006. [Google Scholar]
  71. Wu, B.; Li, J.; Yao, Z.; Li, X.; Wang, W.; Wu, Z.; Zhou, Q. Characteristics and reduction assessment of GHG emissions from crop residue open burning in China under the targets of carbon peak and carbon neutrality. Sci. Total Environ. 2023, 905, 167235. [Google Scholar] [CrossRef]
  72. Gu, B.; Zhang, X.; Lam, S.K.; Yu, Y.; van Grinsven, H.J.M.; Zhang, S.; Wang, X.; Bodirsky, B.L.; Wang, S.; Duan, J.; et al. Cost-effective mitigation of nitrogen pollution from global croplands. Nature 2023, 613, 77–84. [Google Scholar] [CrossRef]
  73. Wu, H.; Huang, H.; Chen, W.; Meng, Y. Estimation and spatiotemporal analysis of the carbon-emission efficiency of crop production in China. J. Clean. Prod. 2022, 371, 133516. [Google Scholar] [CrossRef]
  74. Davis, K.F.; Gephart, J.A.; Emery, K.A.; Leach, A.M.; Galloway, J.N.; D’Odorico, P. Meeting future food demand with current agricultural resources. Global Environ. Chang. 2016, 39, 125–132. [Google Scholar] [CrossRef]
  75. Camargo, G.G.T.; Ryan, M.R.; Richard, T.L. Energy Use and Greenhouse Gas Emissions from Crop Production Using the Farm Energy Analysis Tool. Bioscience 2013, 63, 263–273. [Google Scholar] [CrossRef]
  76. Searchinger, T.D.; Wirsenius, S.; Beringer, T.; Dumas, P. Assessing the efficiency of changes in land use for mitigating climate change. Nature 2018, 564, 249. [Google Scholar] [CrossRef]
  77. Qi, X.; Huang, X.; Zhong, H.; Thompson, J.R.; Yang, H.; Zhong, T.; Peng, X. Spatiotemporal drivers of food system GHG emissions in China. Resour. Conserv. Recycl. 2024, 205, 107580. [Google Scholar] [CrossRef]
  78. Ahmad, N.; Virk, A.L.; Nizami, A.; Lal, R.; Chang, S.X.; Hafeez, M.B.; Guo, X.; Wang, R.; Wang, X.; Iqbal, H.M.W.; et al. Carbon trade-off and energy budgeting under conventional and conservation tillage in a rice-wheat double cropping system. J. Environ. Manag. 2024, 351, 119888. [Google Scholar] [CrossRef] [PubMed]
  79. Manirambona, E.; Talai, S.M.; Kimutai, S.K. Appraising Kenyan energy demand policies for energy efficiency improvement and GHG emissions mitigation. Energy Strateg. Rev. 2024, 51, 101291. [Google Scholar] [CrossRef]
  80. Liu, J.; Hull, V.; Godfray, H.C.J.; Tilman, D.; Gleick, P.; Hoff, H.; Pahl-Wostl, C.; Xu, Z.; Chung, M.G.; Sun, J.; et al. Nexus approaches to global sustainable development. Nat. Sustain. 2018, 1, 466–476. [Google Scholar] [CrossRef]
  81. Royse, E.A.; Manzanares, A.D.; Wang, H.; Haudek, K.C.; Azzarello, C.B.; Horne, L.R.; Druckenbrod, D.L.; Shiroda, M.; Adams, S.R.; Fairchild, E.; et al. FEW questions, many answers: Using machine learning to assess how students connect food-energy-water (FEW) concepts. Hum. Soc. Sci. Commun. 2024, 11, 1–18. [Google Scholar] [CrossRef]
  82. Simonovic, S.P.; Breach, P.A. System Context: Global Change and the Food-Energy-Water Nexus. J. Water Res. Plan. Man. 2023, 149. [Google Scholar] [CrossRef]
  83. Zhang, C.; Chen, X.; Li, Y.; Ding, W.; Fu, G. Water-energy-food nexus: Concepts, questions and methodologies. J. Clean. Prod. 2018, 195, 625–639. [Google Scholar] [CrossRef]
  84. Smajgl, A.; Ward, J.; Pluschke, L. The water-food-energy Nexus—Realising a new paradigm. J. Hydrol. 2016, 533, 533–540. [Google Scholar] [CrossRef]
  85. Rode, A.; Carleton, T.; Delgado, M.; Greenstone, M.; Houser, T.; Hsiang, S.; Hultgren, A.; Jina, A.; Kopp, R.E.; McCusker, K.E.; et al. Estimating a social cost of carbon for global energy consumption. Nature 2021, 598, 308. [Google Scholar] [CrossRef]
  86. Soni, P.; Taewichit, C.; Salokhe, V.M. Energy consumption and CO2 emissions in rainfed agricultural production systems of Northeast Thailand. Agric. Syst. 2013, 116, 25–36. [Google Scholar] [CrossRef]
  87. Lin, J.Y.; Hu, Y.C.; Cui, S.H.; Kang, J.F.; Xu, L.L. Carbon footprints of food production in China (1979–2009). J. Clean. Prod. 2015, 90, 97–103. [Google Scholar] [CrossRef]
  88. Nayak, A.K.; Tripathi, R.; Debnath, M.; Swain, C.K.; Dhal, B.; Vijaykumar, S.; Nayak, A.D.; Mohanty, S.; Shahid, M.; Kumar, A.; et al. Carbon and water footprints of major crop production in India. Pedosphere 2023, 33, 448–462. [Google Scholar] [CrossRef]
  89. Wang, X.; Tan, W.; Zhou, S.; Xu, Y.; Cui, T.; Gao, H.; Chen, M.; Dong, X.; Sun, H.; Yang, J.; et al. Converting maize production with low emergy cost and high economic return for sustainable development. Renew. Sustain. Energy Rev. 2021, 136, 110443. [Google Scholar] [CrossRef]
  90. Wei, X.; Zhang, Z.; Wang, P.; Tao, F. Recent patterns of production for the main cereal grains: Implications for food security in China. Reg. Environ. Change 2017, 17, 105–116. [Google Scholar] [CrossRef]
  91. Balsalobre-Lorente, D.; Shahbaz, M.; Roubaud, D.; Farhani, S. How economic growth, renewable electricity and natural resources contribute to CO2 emissions? Energy Policy 2018, 113, 356–367. [Google Scholar] [CrossRef]
  92. Lin, B.; Li, Z. Is more use of electricity leading to less carbon emission growth ? An analysis with a panel threshold model. Energy Policy 2020, 137, 11121. [Google Scholar] [CrossRef]
  93. Li, J. Spatialized carbon-energy-water footprint of emerging coal chemical industry in China. Renew. Sust. Energy Rev. 2024, 189, 113919. [Google Scholar] [CrossRef]
  94. Han, D.; Yu, D.; Cao, Q. Assessment on the features of coupling interaction of the food-energy-water nexus in China. J. Clean. Prod. 2020, 249, 119379. [Google Scholar] [CrossRef]
  95. Mao, S.; Lv, J.; Li, M.; Li, L.; Xue, J. Trade-off and driving factors of water-energy-food nexus in Mu Us sandy land, China. J. Clean. Prod. 2024, 434, 139852. [Google Scholar] [CrossRef]
  96. Fouladi, J.; AlNouss, A.; Bicer, Y.; Al-Ansari, T. Thermodynamic analysis of a renewable energy-water-food nexus: A trade-off analysis of integrated desalination, gasification and food systems. Case Stud. Therm. Eng. 2022, 34, 102024. [Google Scholar] [CrossRef]
  97. Cheng, Y.; Wang, J.; Shu, K. The coupling and coordination assessment of food-water-energy systems in China based on sustainable development goals. Sustain. Prod. Consump 2023, 35, 338–348. [Google Scholar] [CrossRef]
  98. Hu, Y.; Duan, W.; Zou, S.; Chen, Y.; De Maeyer, P.; Van de Voorde, T.; Takara, K.; Kayumba, P.M.; Kurban, A.; Goethals, P.L.M. Coupling coordination analysis of the water-food-energy-carbon nexus for crop production in Central Asia. Appl. Energy 2024, 369, 123584. [Google Scholar] [CrossRef]
  99. Qian, X.; Liang, Q. Sustainability evaluation of the provincial water-energy-food nexus in China: Evolutions, obstacles, and response strategies. Sustain. Cities Soc. 2021, 75, 103332. [Google Scholar] [CrossRef]
  100. Qi, Y.; Farnoosh, A.; Lin, L.; Liu, H. Coupling coordination analysis of China’s provincial water-energy-food nexus. Environ. Sci. Pollut. R. 2022, 29, 23303–23313. [Google Scholar] [CrossRef]
  101. Uen, T.; Chang, F.; Zhou, Y.; Tsai, W. Exploring synergistic benefits of Water-Food-Energy Nexus through multi-objective reservoir optimization schemes. Sci. Total Environ. 2018, 633, 341–351. [Google Scholar] [CrossRef] [PubMed]
  102. Sun, L.; Niu, D.; Yu, M.; Li, M.; Yang, X.; Ji, Z. Integrated assessment of the sustainable water-energy-food nexus in China: Case studies on multi-regional sustainability and multi-sectoral synergy. J. Clean. Prod. 2022, 334, 130235. [Google Scholar] [CrossRef]
  103. Fu, Y.; Ren, Y.; Pei, W. Evaluation of the symbiosis level of the water-energy-food complex system based on the improved cloud model: A case study in Heilongjiang Province. Environ. Sci. Pollut. R. 2023, 30, 22963–22984. [Google Scholar] [CrossRef]
  104. Chen, Y.; Guo, W.; Ngo, H.H.; Wei, W.; Ding, A.; Ni, B.; Hoang, N.B.; Zhang, H. Ways to mitigate greenhouse gas production from rice cultivation. J. Environ. Manage 2024, 368, 122139. [Google Scholar] [CrossRef]
  105. Qian, H.; Zhu, X.; Huang, S.; Linquist, B.; Kuzyakov, Y.; Wassmann, R.; Minamikawa, K.; Martinez-Eixarch, M.; Yan, X.; Zhou, F.; et al. Greenhouse gas emissions and mitigation in rice agriculture. Nat. Rev. Earth Environ. 2023, 4, 716–732. [Google Scholar] [CrossRef]
  106. Gangopadhyay, S.; Banerjee, R.; Batabyal, S.; Das, N.; Mondal, A.; Pal, S.C.; Mandal, S. Carbon sequestration and greenhouse gas emissions for different rice cultivation practices. Sustain. Prod. Consump 2022, 34, 90–104. [Google Scholar] [CrossRef]
  107. Li, M.; Cao, X.; Liu, D.; Fu, Q.; Li, T.; Shang, R. Sustainable management of agricultural water and land resources under changing climate and socio-economic conditions: A multi-dimensional optimization approach. Agr. Water Manag. 2022, 259, 107235. [Google Scholar] [CrossRef]
  108. Olesen, J.E.; Trnka, M.; Kersebaum, K.C.; Skjelvag, A.O.; Seguin, B.; Peltonen-Sainio, P.; Rossi, F.; Kozyra, J.; Micale, F. Impacts and adaptation of European crop production systems to climate change. Eur. J. Agron. 2011, 34, 96–112. [Google Scholar] [CrossRef]
  109. Shakoor, U.; Saboor, A.; Ali, I.; Mohsin, A.Q. Impact of Climate Change On Agriculture: Empirical Evidence from Arid Region. Pak. J. Agr. Sci. 2011, 48, 327–333. [Google Scholar]
  110. Liao, B.; Cai, T.; Wu, X.; Luo, Y.; Liao, P.; Zhang, B.; Zhang, Y.; Wei, G.; Hu, R.; Luo, Y.; et al. A combination of organic fertilizers partially substitution with alternate wet and dry irrigation could further reduce greenhouse gases emission in rice field. J. Environ. Manage 2023, 344, 118372. [Google Scholar] [CrossRef]
  111. Li, L.; Li, T. Improvement Measurement to Guarantee the Quantity and Quality of Ecological Cultivated Land. Ekoloji 2019, 28, 1835–1845. [Google Scholar]
  112. Moretti, M.; De Boni, A.; Roma, R.; Fracchiolla, M.; Van Passel, S. Integrated assessment of agro- ecological systems: The case study of the “Alta Murgia” National park in Italy. Agric. Syst. 2016, 144, 144–155. [Google Scholar] [CrossRef]
  113. Xu, P.; Li, G.; Zheng, Y.; Fung, J.C.H.; Chen, A.; Zeng, Z.; Shen, H.; Hu, M.; Mao, J.; Zheng, Y.; et al. Fertilizer management for global ammonia emission reduction. Nature 2024, 626, 792–798. [Google Scholar] [CrossRef] [PubMed]
  114. Hoffman, E.; Cavigelli, M.A.; Camargo, G.; Ryan, M.; Ackroyd, V.J.; Richard, T.L.; Mirsky, S. Energy use and greenhouse gas emissions in organic and conventional grain crop production: Accounting for nutrient inflows. Agric. Syst. 2018, 162, 89–96. [Google Scholar] [CrossRef]
  115. Luo, T.; Shen, B.; Mei, Z.; Hove, A.; Ju, K. Unlocking the potential of biogas systems for energy production and climate solutions in rural communities. Nat. Commun. 2024, 15, 5900. [Google Scholar] [CrossRef] [PubMed]
  116. Doelman, J.C.; Beier, F.D.; Stehfest, E.; Bodirsky, B.L.; Beusen, A.H.W.; Humpenoeder, F.; Mishra, A.; Popp, A.; van Vuuren, D.P.; de Vos, L.; et al. Quantifying synergies and trade-offs in the global water-land-food-climate nexus using a multi-model scenario approach. Environ. Res. Lett. 2022, 17, 045004. [Google Scholar] [CrossRef]
  117. Shang, K.; Zhuo, L.; Yang, X.; Yue, Z.; Zhao, D.; Wu, P. Emergy analysis of the blue and green water resources in crop production systems. J. Clean. Prod. 2021, 319, 128666. [Google Scholar] [CrossRef]
  118. Zhao, J.; Yang, J.; Xie, H.; Qin, X.; Huang, R. Sustainable management strategies for balancing crop yield, water use efficiency and greenhouse gas emissions. Agric. Syst. 2024, 217, 103944. [Google Scholar] [CrossRef]
  119. Zhang, G.; Wang, X.; Zhang, L.; Xiong, K.; Zheng, C.; Lu, F.; Zhao, H.; Zheng, H.; Ouyang, Z. Carbon and water footprints of major cereal crops production in China. J. Clean. Prod. 2018, 194, 613–623. [Google Scholar] [CrossRef]
  120. Yin, W.; Chai, Q.; Guo, Y.; Feng, F.; Zhao, C.; Yu, A.; Liu, C.; Fan, Z.; Hu, F.; Chen, G. Reducing carbon emissions and enhancing crop productivity through strip intercropping with improved agricultural practices in an arid area. J. Clean. Prod. 2017, 166, 197–208. [Google Scholar] [CrossRef]
  121. Mostashari-Rad, F.; Nabavi-Pelesaraei, A.; Soheilifard, F.; Hosseini-Fashami, F.; Chau, K. Energy optimization and greenhouse gas emissions mitigation for agricultural and horticultural systems in Northern Iran. Energy 2019, 186, 115845. [Google Scholar] [CrossRef]
  122. Wang, X.Y.; Xue, S.; Xie, G.H. Value-taking for residue factor as a parameter to assess the field residue of field crops. J. China Agric. Univ. 2012, 17, 1–8. (In Chinese) [Google Scholar]
  123. West, T.O.; Bandaru, V.; Brandt, C.C.; Schuh, A.E.; Ogle, S.M. Regional uptake and release of crop carbon in the United States. Biogeosciences 2011, 8, 2037–2046. [Google Scholar] [CrossRef]
  124. National Development and Reform Commission (NDRC). The Grass-to-Grain Ratios for Major Crops in Different Agricultural Regions; National Development and Reform Commission: Beijing, China, 2015. [Google Scholar]
  125. IKE Environmental Technology, Co., Ltd, China. Chinese Life Cycle Database (2009–2011); Chongqing, China. Available online: http://www.itke.com.cn (accessed on 31 March 2025).
  126. Ecoinvent, CCDB. Available online: https://ecoinvent.org/ (accessed on 31 December 2023).
  127. Wu, H.; Sipilainen, T.; He, Y.; Huang, H.; Luo, L.; Chen, W.; Meng, Y. Performance of cropland low-carbon use in China: Measurement, spatiotemporal characteristics, and driving factors. Sci. Total Environ. 2021, 800, 149552. [Google Scholar] [CrossRef]
  128. West, T.O.; Marland, G. A synthesis of carbon sequestration, carbon emissions, and net carbon flux in agriculture comparing tillage practices in the United States. Agric. Ecosyst. Environ. 2002, 91, 217–232. [Google Scholar] [CrossRef]
  129. Ozilgen, M.; Sorguven, E. Energy and exergy utilization, and carbon dioxide emission in vegetable oil production. Energy 2011, 36, 5954–5967. [Google Scholar] [CrossRef]
  130. Xue, J.; Liu, S.; Chen, Z.; Chen, F.; Lal, R.; Tang, H.; Zhang, H. Assessment of carbon sustainability under different tillage systems in a double rice cropping system in Southern China. Int. J. Life Cycle Assess. 2014, 19, 1581–1592. [Google Scholar] [CrossRef]
  131. Wang, S.; Sun, N.; Zhang, X.; Hu, C.; Wang, Y.; Xiong, W.; Zhang, S.; Colinet, G.; Xu, M.; Wu, L. Assessing the impacts of climate change on crop yields, soil organic carbon sequestration and N2O emissions in wheat-maize rotation systems. Soil Tillage Res. 2024, 240, 106088. [Google Scholar] [CrossRef]
  132. Ministry of Agriculture and Rural Affairs (MARA). Technical Guide for Rice Carbon Footprint Assessment (Draft for Comment). Beijing, China. Available online: http://www.reea.agri.cn/zhbwh/ (accessed on 30 April 2024).
  133. National Development and Reform Commission (NDRC). Notice on the Implementation of Carbon Emission Trading Pilot Programs. Beijing, China. Available online: https://www.ndrc.gov.cn/xxgk/zcfb/tz/201201/t20120113_964370_ext.html (accessed on 13 January 2012).
  134. Bernstein, L.; Bosch, P.; Canziani, O.; Chen, Z.; Christ, R.; Davidson, O.; Hare, W.; Huq, S.; Karoly, D.; Kattsov, V. Climate Change 2007: Fourth Assessment Report; IPCC: Cambridge, UK, 2007. [Google Scholar]
  135. Hong, X.; Zhang, C.; Tian, Y.; Wu, H.; Zhu, Y.; Liu, C. Quantification and evaluation of atmospheric emissions from crop residue burning constrained by satellite observations in China during 2016–2020. Sci. Total Environ. 2023, 865, 161237. [Google Scholar] [CrossRef]
  136. Pan, H.; Zheng, X.; Tian, X.; Geng, Y.; Zhang, X.; Xiao, S.; Gao, Z.; Yang, Y.; Liu, X.; Li, L.; et al. Toward sustainable crop production in China: A co-benefits evaluation. J. Clean. Prod. 2022, 361, 132285. [Google Scholar] [CrossRef]
  137. Xing, X.; Zhou, Y.; Lang, J.; Chen, D.; Cheng, S.; Han, L.; Huang, D.; Zhang, Y. Spatiotemporal variation of domestic biomass burning emissions in rural China based on a new estimation of fuel consumption. Sci. Total Environ. 2018, 626, 274–286. [Google Scholar] [CrossRef] [PubMed]
  138. Wu, J.; Kong, S.; Wu, F.; Cheng, Y.; Zheng, S.; Qin, S.; Liu, X.; Yan, Q.; Zheng, H.; Zheng, M.; et al. The moving of high emission for biomass burning in China: View from multi-year emission estimation and human-driven forces. Environ. Int. 2020, 142, 105812. [Google Scholar] [CrossRef]
  139. Zhang, X.; Lu, Y.; Wang, Q.; Qian, X. A high-resolution inventory of air pollutant emissions from crop residue burning in China. Atmos. Environ. 2019, 213, 207–214. [Google Scholar] [CrossRef]
  140. Jin, Q.; Ma, X.; Wang, G.; Yang, X.; Guo, F. Dynamics of major air pollutants from crop residue burning in mainland China, 2000–2014. J. Environ. Sci. 2018, 70, 190–205. [Google Scholar] [CrossRef]
  141. Zhou, Y.; Xing, X.; Lang, J.; Chen, D.; Cheng, S.; Wei, L.; Wei, X.; Liu, C. A comprehensive biomass burning emission inventory with high spatial and temporal resolution in China. Atmos. Chem. Phys. 2017, 17, 2839–2864. [Google Scholar] [CrossRef]
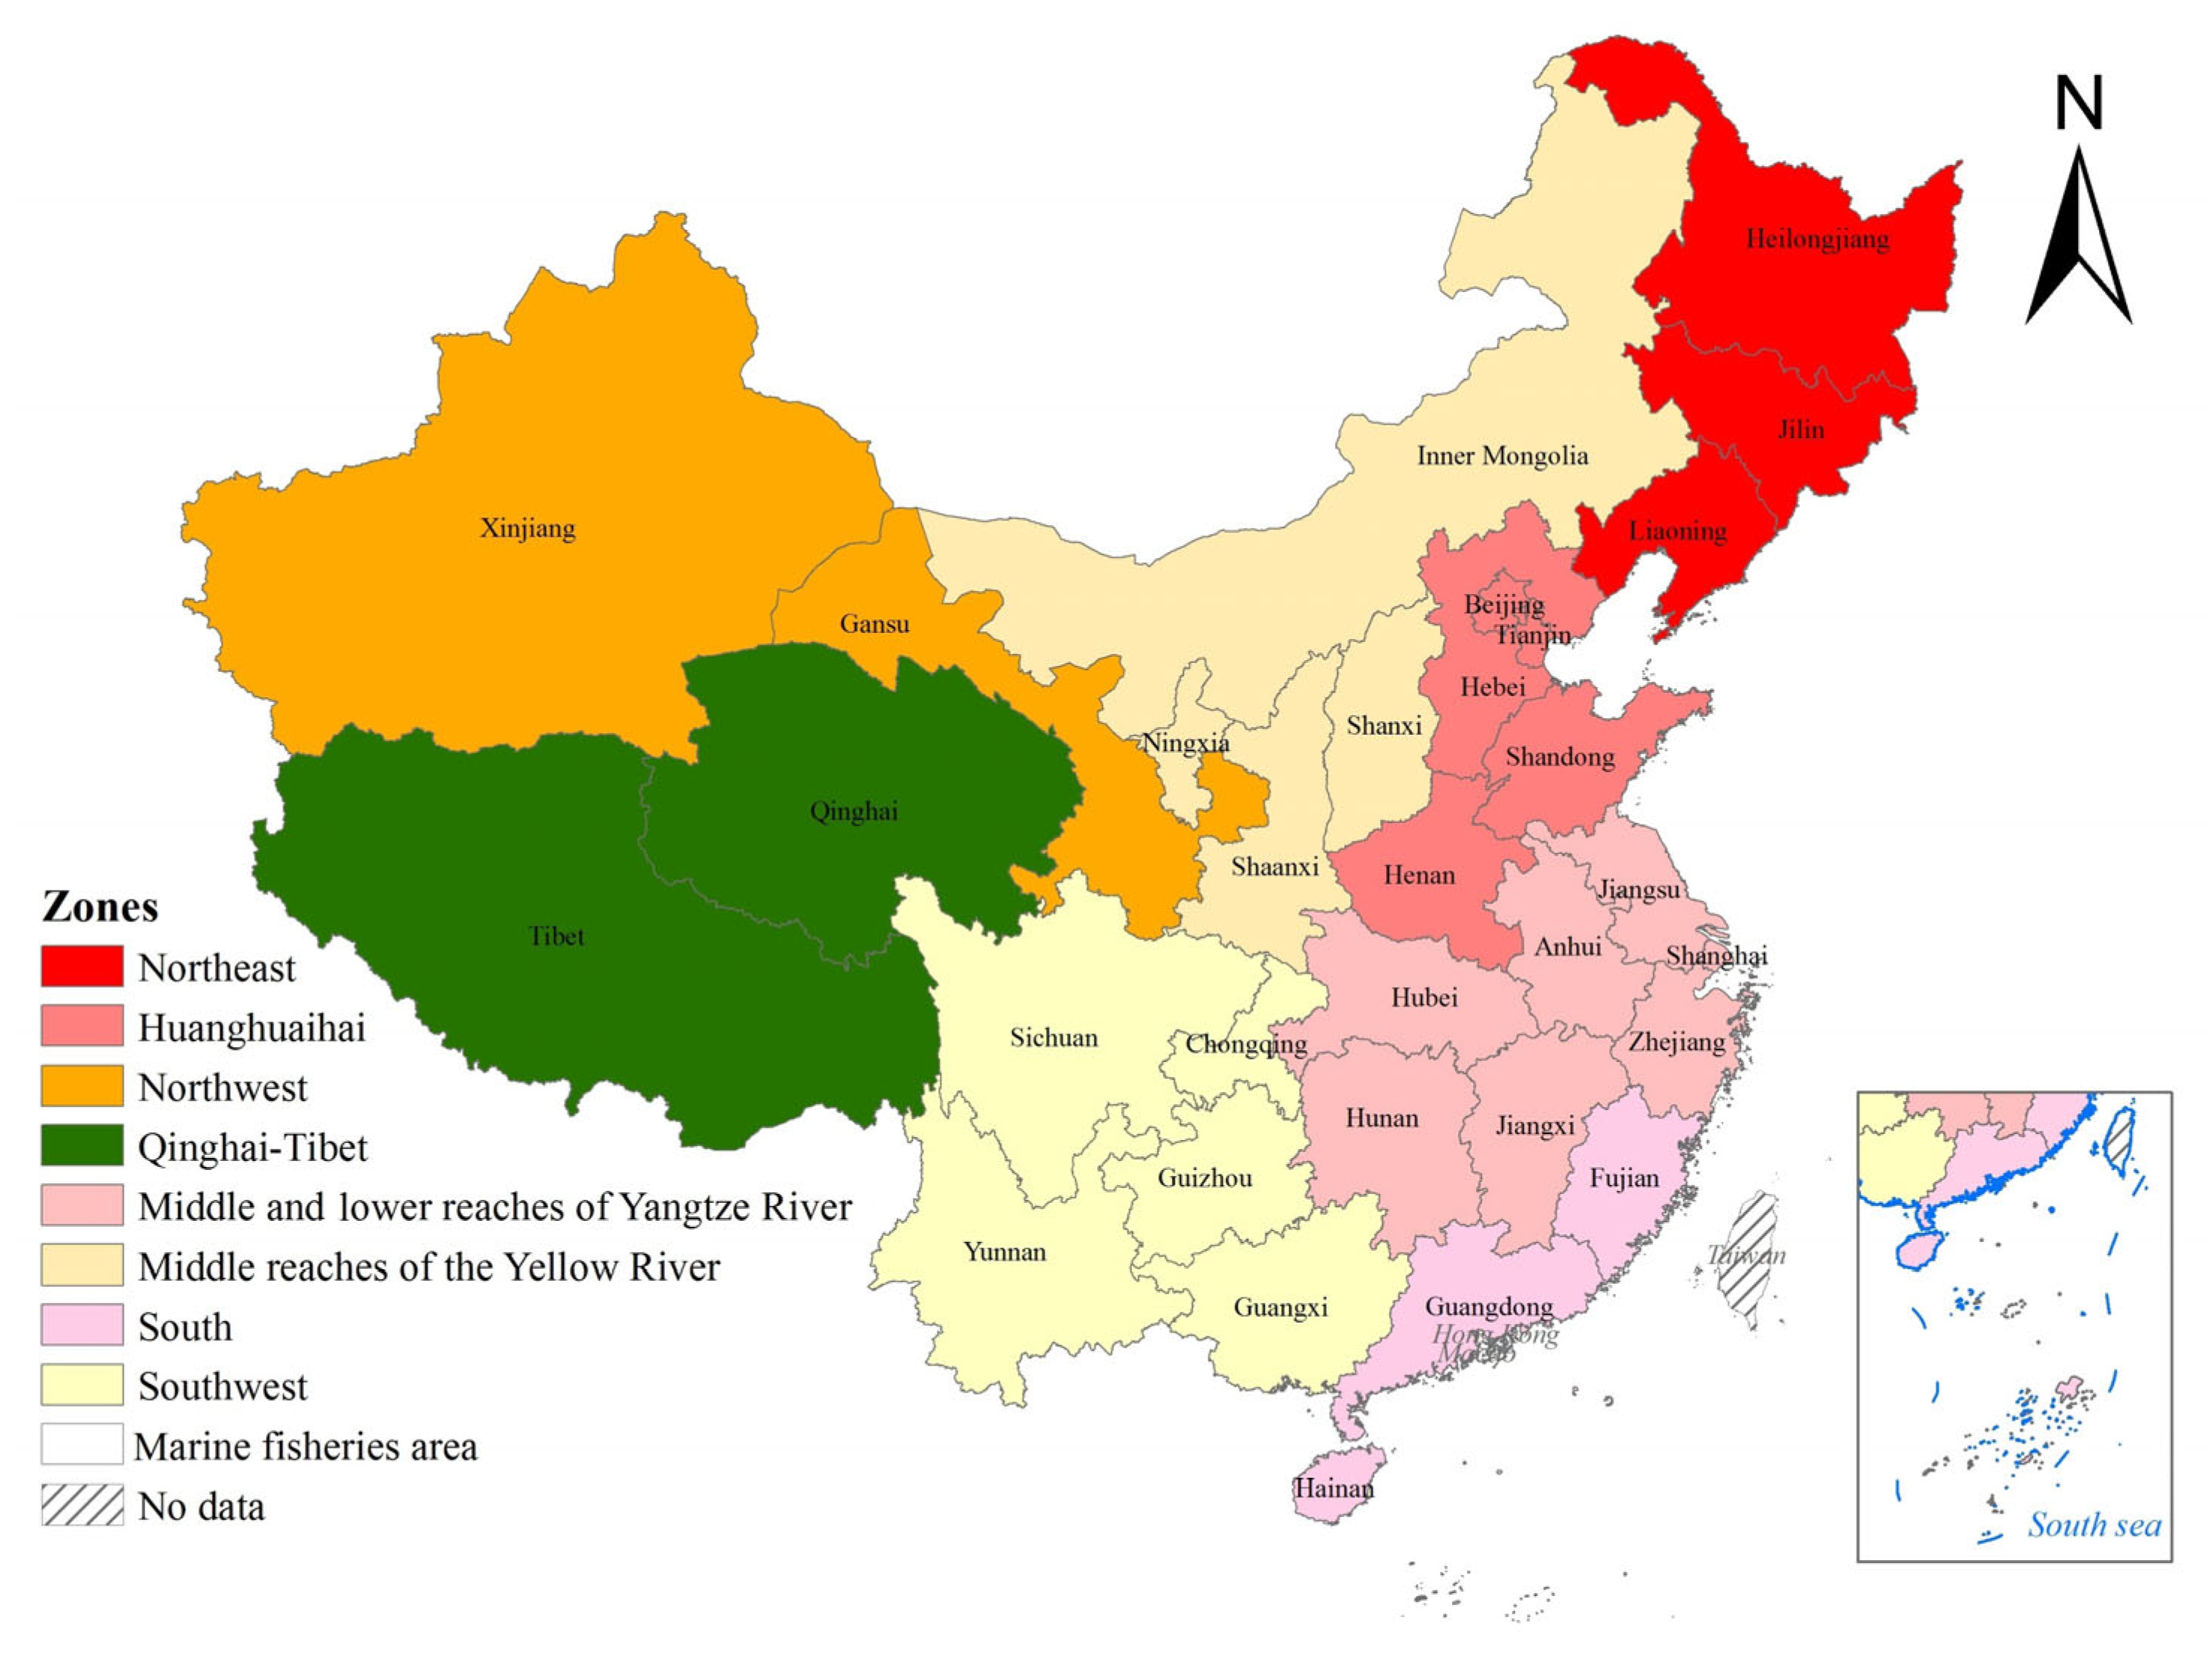
Figure 1. Study area and zones.
Land 14 01674 g001
Figure 2. The diagram of energy flow, carbon fluxes and water flows, and information flows.
Land 14 01674 g002
Figure 3. Changes in carbon emissions and carbon footprint of FEW resources 2000–2022. (a) Food production (F) and carbon emissions (kg CO2-eq). (b) Carbon footprint measured by F.
Land 14 01674 g003
Figure 4. Energy and blue water consumption carbon footprint (Mt CO2-eq/ha). (a) Energy consumption carbon footprint. (b) Carbon footprint of blue water consumption.
Land 14 01674 g004
Figure 5. Spatial synergies and trade-offs of FE nexus and FW nexus. (a) FE nexus (b) FW nexus.
Land 14 01674 g005
Figure 6. Time-series driver effects and changes in the contribution of different crops to GHG emissions. (a) Sub-system driver effects and total effects. (b) Contribution of different crops.
Land 14 01674 g006
Figure 7. Spatial distribution of the contribution of different drivers. (a) ΔFF. (b) ΔFWF. (c) ΔFEW. (d) ΔFCE. (e) ΔFEC = 1/ΔFCE. (f) ΔFEW.
Land 14 01674 g007
Figure 8. Trade-offs and synergies between GHG emissions in FEW nexuses across different zones. (a) Trade-offs and synergies in zones. (b) Contribution of influencing factors in zones.
Land 14 01674 g008
Table 1. Calculation coefficient of carbon sequestration for different crops.
CropRiceWheatMaizeSoybeansPotatoes
Dry weight ratio (1-w)0.8550.8700.8600.8600.450
Proportion of nitrogen in seeds 0.0100.0140.0170.0600.004
Proportion of nitrogen in straw0.0080.0050.0060.0180.011
Economic coefficient (H)0.4890.4340.4380.4250.667
Root-to-crown ratio (R)0.1250.1660.1700.1300.050
Carbon sequestration rate (c)0.4500.4000.4000.3500.650
Table 2. Outlin of the methodology employed in the evaluation of synergistic relationships.
Intensity of Trade-Off and Synergy RelationshipsLevelBasis
Strong Synergy Ir > 0, p < 0.01
Medium SynergyIIr > 0, 0.01 < p < 0.05
Weak SynergyIIIr > 0, 0.05 < p < 0.1
IndependentIVp > 0.1
Weak Trade-offVr < 0, p < 0.01
Medium Trade-offVIr < 0, 0.01 < p < 0.05
Strong Trade-offVIIr < 0, 0.05 < p < 0.1
Table 3. The trade-offs and synergies of GHG emissions of the FE and FW nexus.
FE FW
CropsrtpLevelrtpLevel
rice0.3439.724p < 0.01I0.1644.427p < 0.01I
wheat0.0190.507p > 0.1IV−0.056−1.4910.05 < p < 0.1VII
maize0.46113.862p < 0.01I0.2236.102p < 0.01I
soybean0.42212.410p < 0.01I0.1664.479p < 0.01I
potato0.63822.104p < 0.01I0.2206.007p < 0.01I
Total0.3148.827p < 0.01I0.0641.7060.01 < p < 0.05II
Table 4. The trade-offs and synergies of the FE and FW nexuses from 2000 to 2022.
YearrFELevelrFWLevelYearrFELevelrFWLevel
20000.395I−0.428V20120.432I0.774I
20010.564I−0.548V20130.400I0.555I
20020.640I−0.293V20140.288I−0.694V
20030.709I−0.631V2015−0.252V−0.598V
20040.520I−0.474V20160.671I0.651I
20050.597I−0.121V20170.515I0.675I
20060.197I0.133I20180.262I0.024IV
20070.138I0.476 I20190.050 IV−0.064VII
2008−0.098V0.606I20200.057III−0.268V
20090.133I0.702I20210.035IV−0.496V
20100.089II0.823I20220.120I−0.440V
20110.357I0.828I
Disclaimer/Publisher’s Note: The statements, opinions and data contained in all publications are solely those of the individual author(s) and contributor(s) and not of MDPI and/or the editor(s). MDPI and/or the editor(s) disclaim responsibility for any injury to people or property resulting from any ideas, methods, instructions or products referred to in the content.