1. Introduction
Croplands are important for ensuring national food security, maintaining ecological balance, and promoting social stability [
1], and maintaining both the quality and quantity of cropland is essential for achieving the United Nations Sustainable Development Goals (SDGs)—specifically Goal 2 (Zero Hunger), Goal 11 (Sustainable Cities and Communities), and Goal 15 (Life on Land) [
2]. However, patterns of cropland are undergoing dramatic changes under the influence of urbanization and industrialization [
3]; cropland is increasingly being occupied by continuously expanding construction land [
4,
5]. This phenomenon is particularly common in developing countries.
As one of the largest developing countries in the world, China has experienced rapid urbanization and industrialization over the past decades. The increasing demand for construction land, combined with limited cropland resources, has led China to face serious challenges in balancing urban development and cropland protection [
6], especially in the eastern coastal regions, urban agglomerations, and economically developed area [
7,
8]. As large amounts of high-quality cropland have been permanently occupied, spatial fragmentation, landscape degradation, and weakened ecosystem services have occurred [
9,
10].
From a theoretical perspective, the relationship between cropland loss and construction land expansion can be understood within the framework of “land-use conflict” theory, which views land as a limited resource competed for by agricultural, urban, and ecological interests [
11]. The “discordant human–land relationship” [
12] provides a conceptual basis for analyzing spatio-temporal tensions that emerge from land-use transition processes [
13]. Moreover, “urban–rural transformation development” [
14] reveals how the evolving relationship between urban and rural areas affects the structure and spatial distribution of land use. The above theoretical perspectives highlight that cropland loss is not only a physical phenomenon, but also a result of deeper policy, economic, and ecological transformations.
The contradiction between population and land in China has evolved beyond the traditional static notion of a “mismatch between population and total cropland” [
15]. It now represents a dynamic, multi-scalar conflict in which urban expansion and cropland protection interact across both temporal and spatial dimensions [
16]. Systematically identifying the spatial squeezing mechanism through which construction land expansion displaces cropland—and understanding its temporal and regional variations—has become a critical issue in contemporary land science and geography [
17,
18].
Considering the growing tension between urban expansion and cropland protection, research on this subject has deepened in recent years. Researchers have increasingly investigated the spatial patterns, driving forces, and regional differences associated with construction land expansion and cropland loss, aiming to better understand the complex dynamics underlying land-use transformation. This growing body of literature can be broadly categorized into three key areas:
- (1)
Patterns of Construction Land Expansion and Cropland Loss
As a major component of land-use change, the spatial and temporal patterns of construction land expansion and cropland loss have been widely examined in both global and regional studies, using methods such as remote sensing [
19,
20], GIS analysis [
21,
22], and long-term land-use datasets [
23,
24]. In China, extensive research has focused on tracking these processes in the context of rapid urbanization and agricultural restructuring. For example, a case study of Hubei Province (2009–2016) revealed that urban–rural construction land transition (URCLT) and rural–urban migration (RUM) are largely uncoordinated, with urban land expansion outpacing rural land-use efficiency and exhibiting strong decoupling from migration patterns [
25]. Another study found that construction land expansion was closely linked to the growth of economic development zones, while rural construction land also increased significantly; notably, less than 20% of farmland loss was directly attributable to urban expansion [
26]. In summary, evidence shows a strong correlation between construction land expansion and cropland loss, accounting for a large percentage of the total cropland loss during the period of rapid urbanization, industrialization, and rural settlement development [
27].
- (2)
Driving Mechanisms of Land-Use Change
While identifying spatio-temporal patterns is essential for describing land-use change, studying the driving mechanisms offers deeper insight into why these patterns emerge [
28]. In this context, the literature includes numerous studies on the drivers of land-use change. Various methods—such as multiple linear regression [
29,
30], spatial regression models [
31,
32], geographically weighted regression [
33,
34], and even machine learning techniques [
35,
36]—have been applied to identify and quantify the contributing factors and underlying mechanisms. The results show that both natural and socio-economic factors significantly influence land-use change [
37,
38]. While urbanization, industrial development, and infrastructure investment drive the expansion of construction land [
39,
40,
41], cropland loss is mainly caused by land conversion pressures, rural settlement sprawl, and weak enforcement of land protection policies [
42,
43,
44].
- (3)
Regional Differences in Land-Use Dynamics
One of the key purposes of identifying spatio-temporal patterns and understanding the driving mechanisms of construction land expansion and cropland loss is to support more effective land-use policy implementation [
45,
46]. However, effectively implementing land-use policies remains challenging, particularly in developing countries characterized by uneven regional development. In this context, studying regional differences in land-use dynamics—including both spatio-temporal patterns and driving mechanisms—has become an important focus in the literature [
47,
48]. In recent years, scholars have examined these regional differences across multiple spatial scales, including national, provincial, and county levels. For example, according to the study by Tu et al. [
46], cropland loss from urban expansion in China was most severe in higher-tier cities between 1990 and 2019, while future losses by 2050 are projected to be greatest in second- and third-tier cities in terms of total area. A study in Jiangsu Province, China, revealed significant spatial variation in cropland loss and fragmentation from 1900 to 2020, with urban areas experiencing more severe cropland reduction and fragmentation than rural areas, and notable regional differences between southern and northern [
49].
While current research has made important progress in revealing the relationship between construction land expansion and cropland loss, several key gaps remain. First, studies that quantitatively identify and analyze the spatial mechanisms and dynamic evolution of how construction land encroaches upon cropland are still limited, particularly at the national scale in China. Second, there is a lack of systematic research exploring regional differences in the spatial evolution of cropland from a multiscale, nested perspective—linking provinces, cities, and lower administrative levels. Third, the existing indicator systems require more comprehensive approaches to measure cropland spatial structure, particularly in terms of its integrity, connectivity, and the degree of spatial compression.
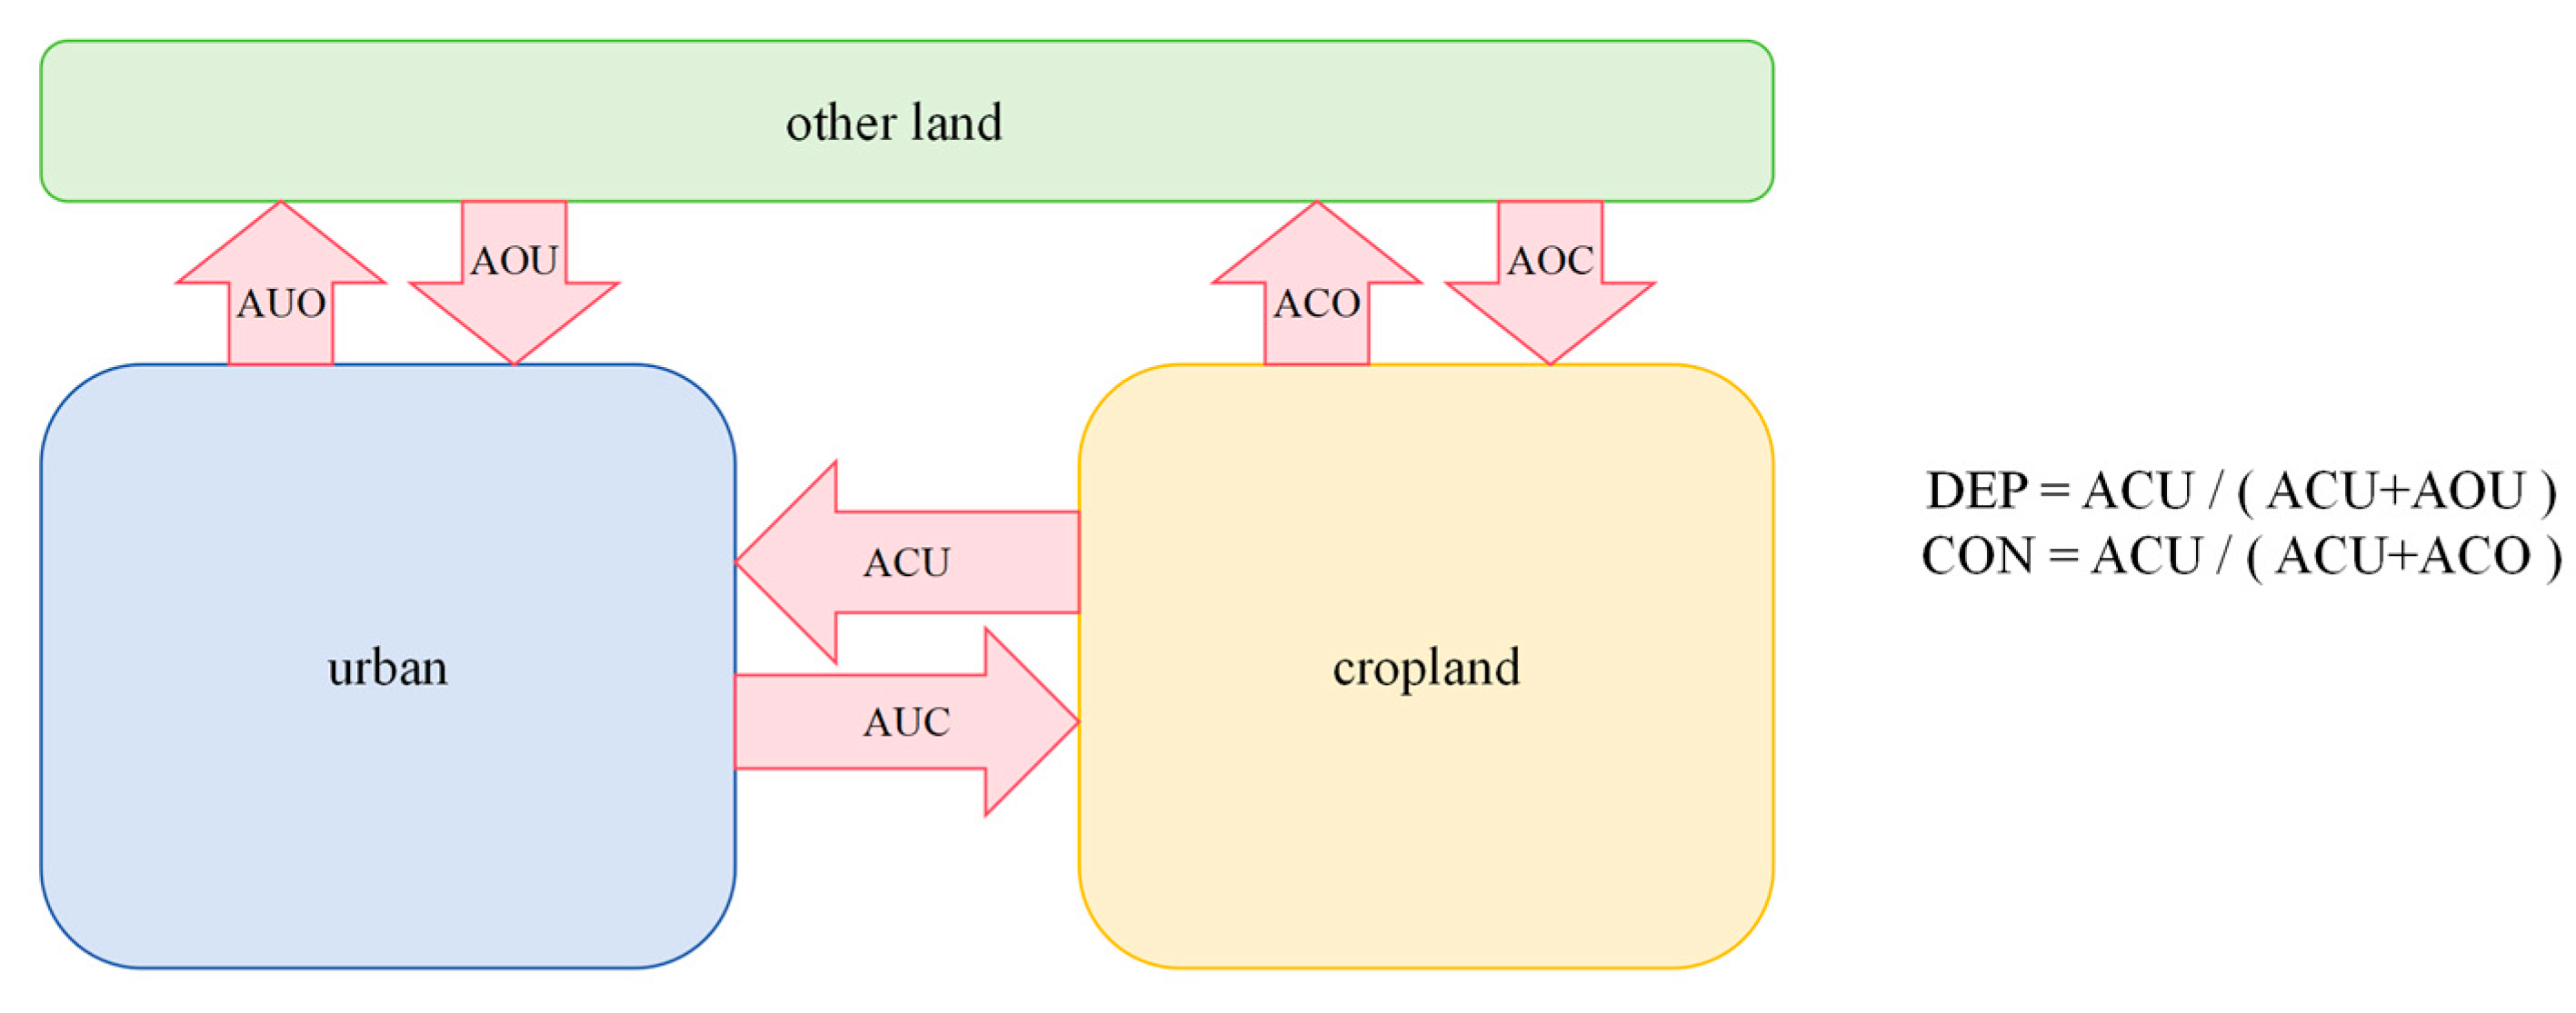
Therefore, this study aims to investigate the spatial effects of construction land expansion on cropland patterns from the perspective of the evolving human–land relationship. To achieve this, it introduces two explanatory variables—the dependence of construction land on cropland (DEP) and the contribution of cropland to construction land (CON)—to analyze the impact mechanisms of construction land expansion across different regions on the spatial configuration of cropland.
Compared with existing studies, this research makes three key contributions. First, it proposes a dual-indicator framework to capture the asymmetric interaction between urban expansion and cropland loss. Second, by adopting a multiscale spatial analysis linking provincial and city-level units, the study reveals nested regional disparities in cropland transformation patterns that are often obscured in single-scale assessments. Third, in response to growing concerns about food security and land-use conflict, this study provides an urgently needed empirical basis for strengthening cropland protection strategies under urbanization pressures, offering actionable insights for spatial planning and territorial governance in China and other developing countries.
3. Results
3.1. Spatial Heterogeneity in Cropland Change Patterns from 2000–2020
As shown in
Table S1 and Figure S1 (see
Supplementary Materials), from a temporal perspective, the differences in cropland changes among provinces fluctuated to a certain extent but generally maintained a stable trend. The differences among provinces reached their maximum in the 2005–2010 period. During this period, the province with the largest decrease in cropland area was Beijing, with a decrease of 16.16%, and the Tibet Autonomous Region had the largest increase in cropland area, with an increase of 65.64%.
From a spatial perspective, the spatiotemporal pattern of cropland changes at the provincial level in China is increasing in the west and decreasing in the east. From 2000 to 2020, Xinjiang and Tibet were the provinces with the greatest increase in cropland in China, with increases of 51.60% and 62.29%, respectively. Beijing, Tianjin, Shanghai, Jiangsu, and Zhejiang were the five provinces with the largest decreases in cropland, with rates of −26.84%, −25.45%, −16.54%, −15.56%, and −10.54%, respectively.
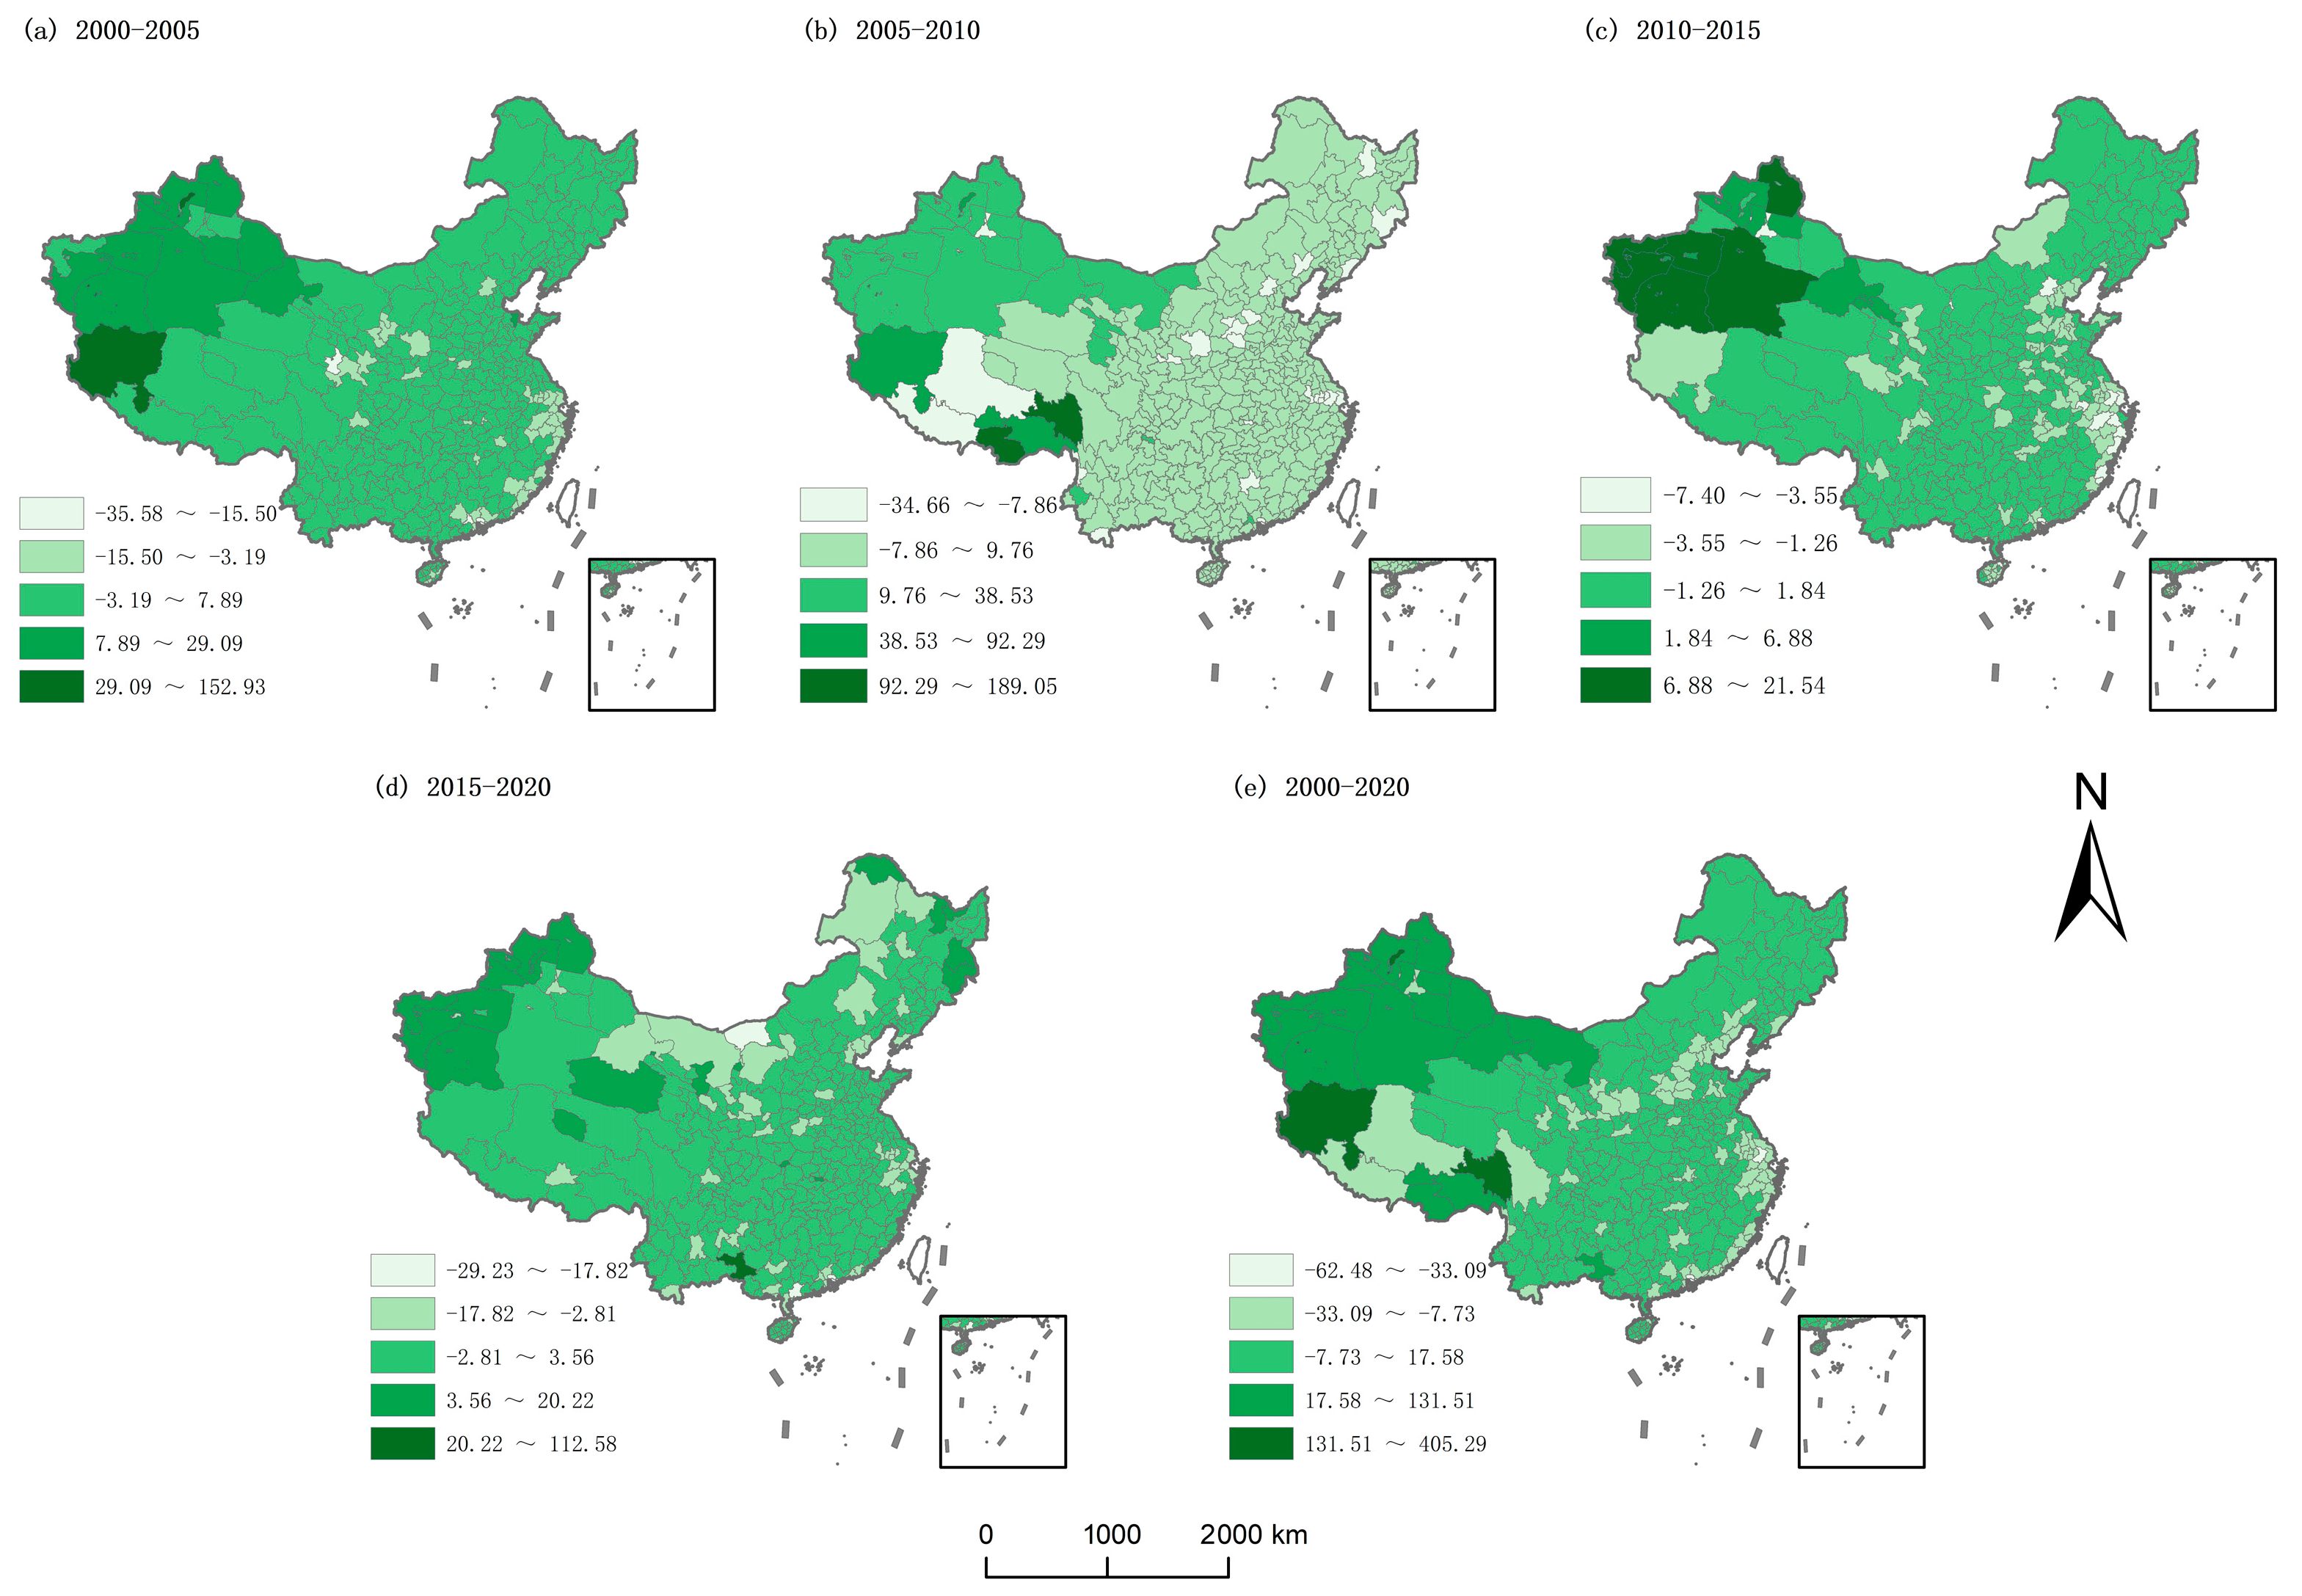
Building on the observed provincial-level trends, a finer-grained municipal-level analysis was conducted to further examine intra-provincial variations and identify localized extremes in cropland change. As shown in
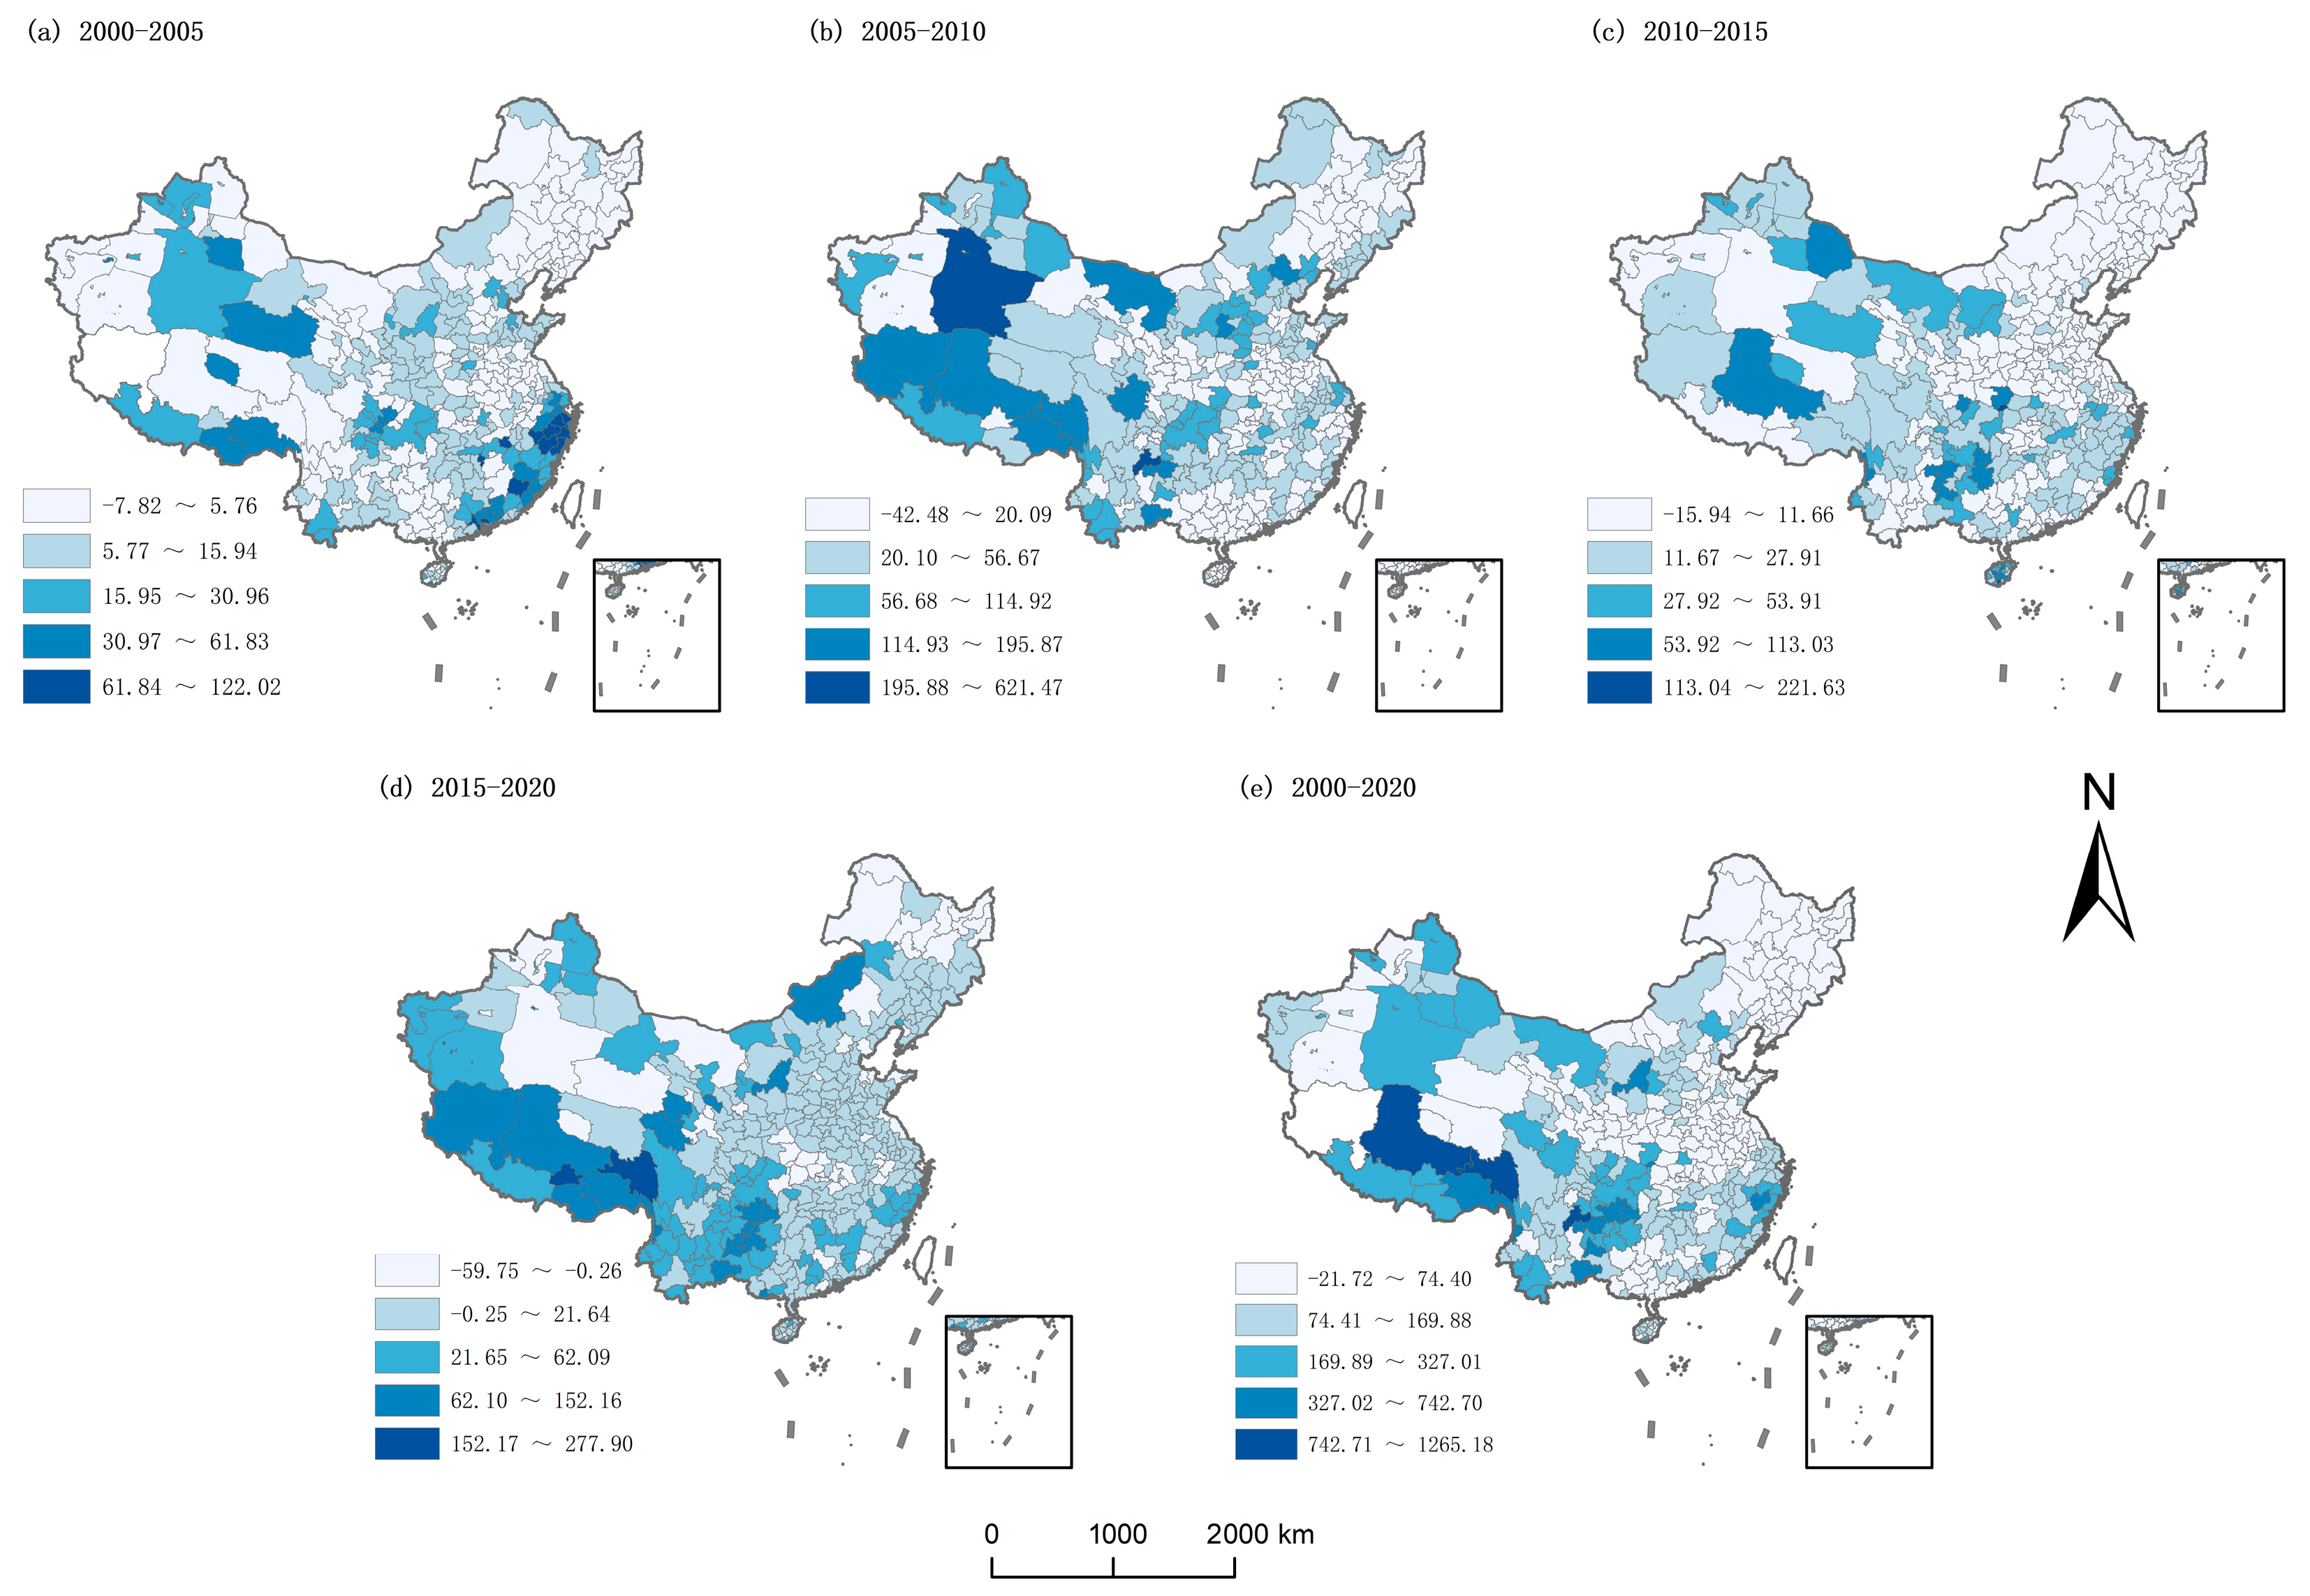
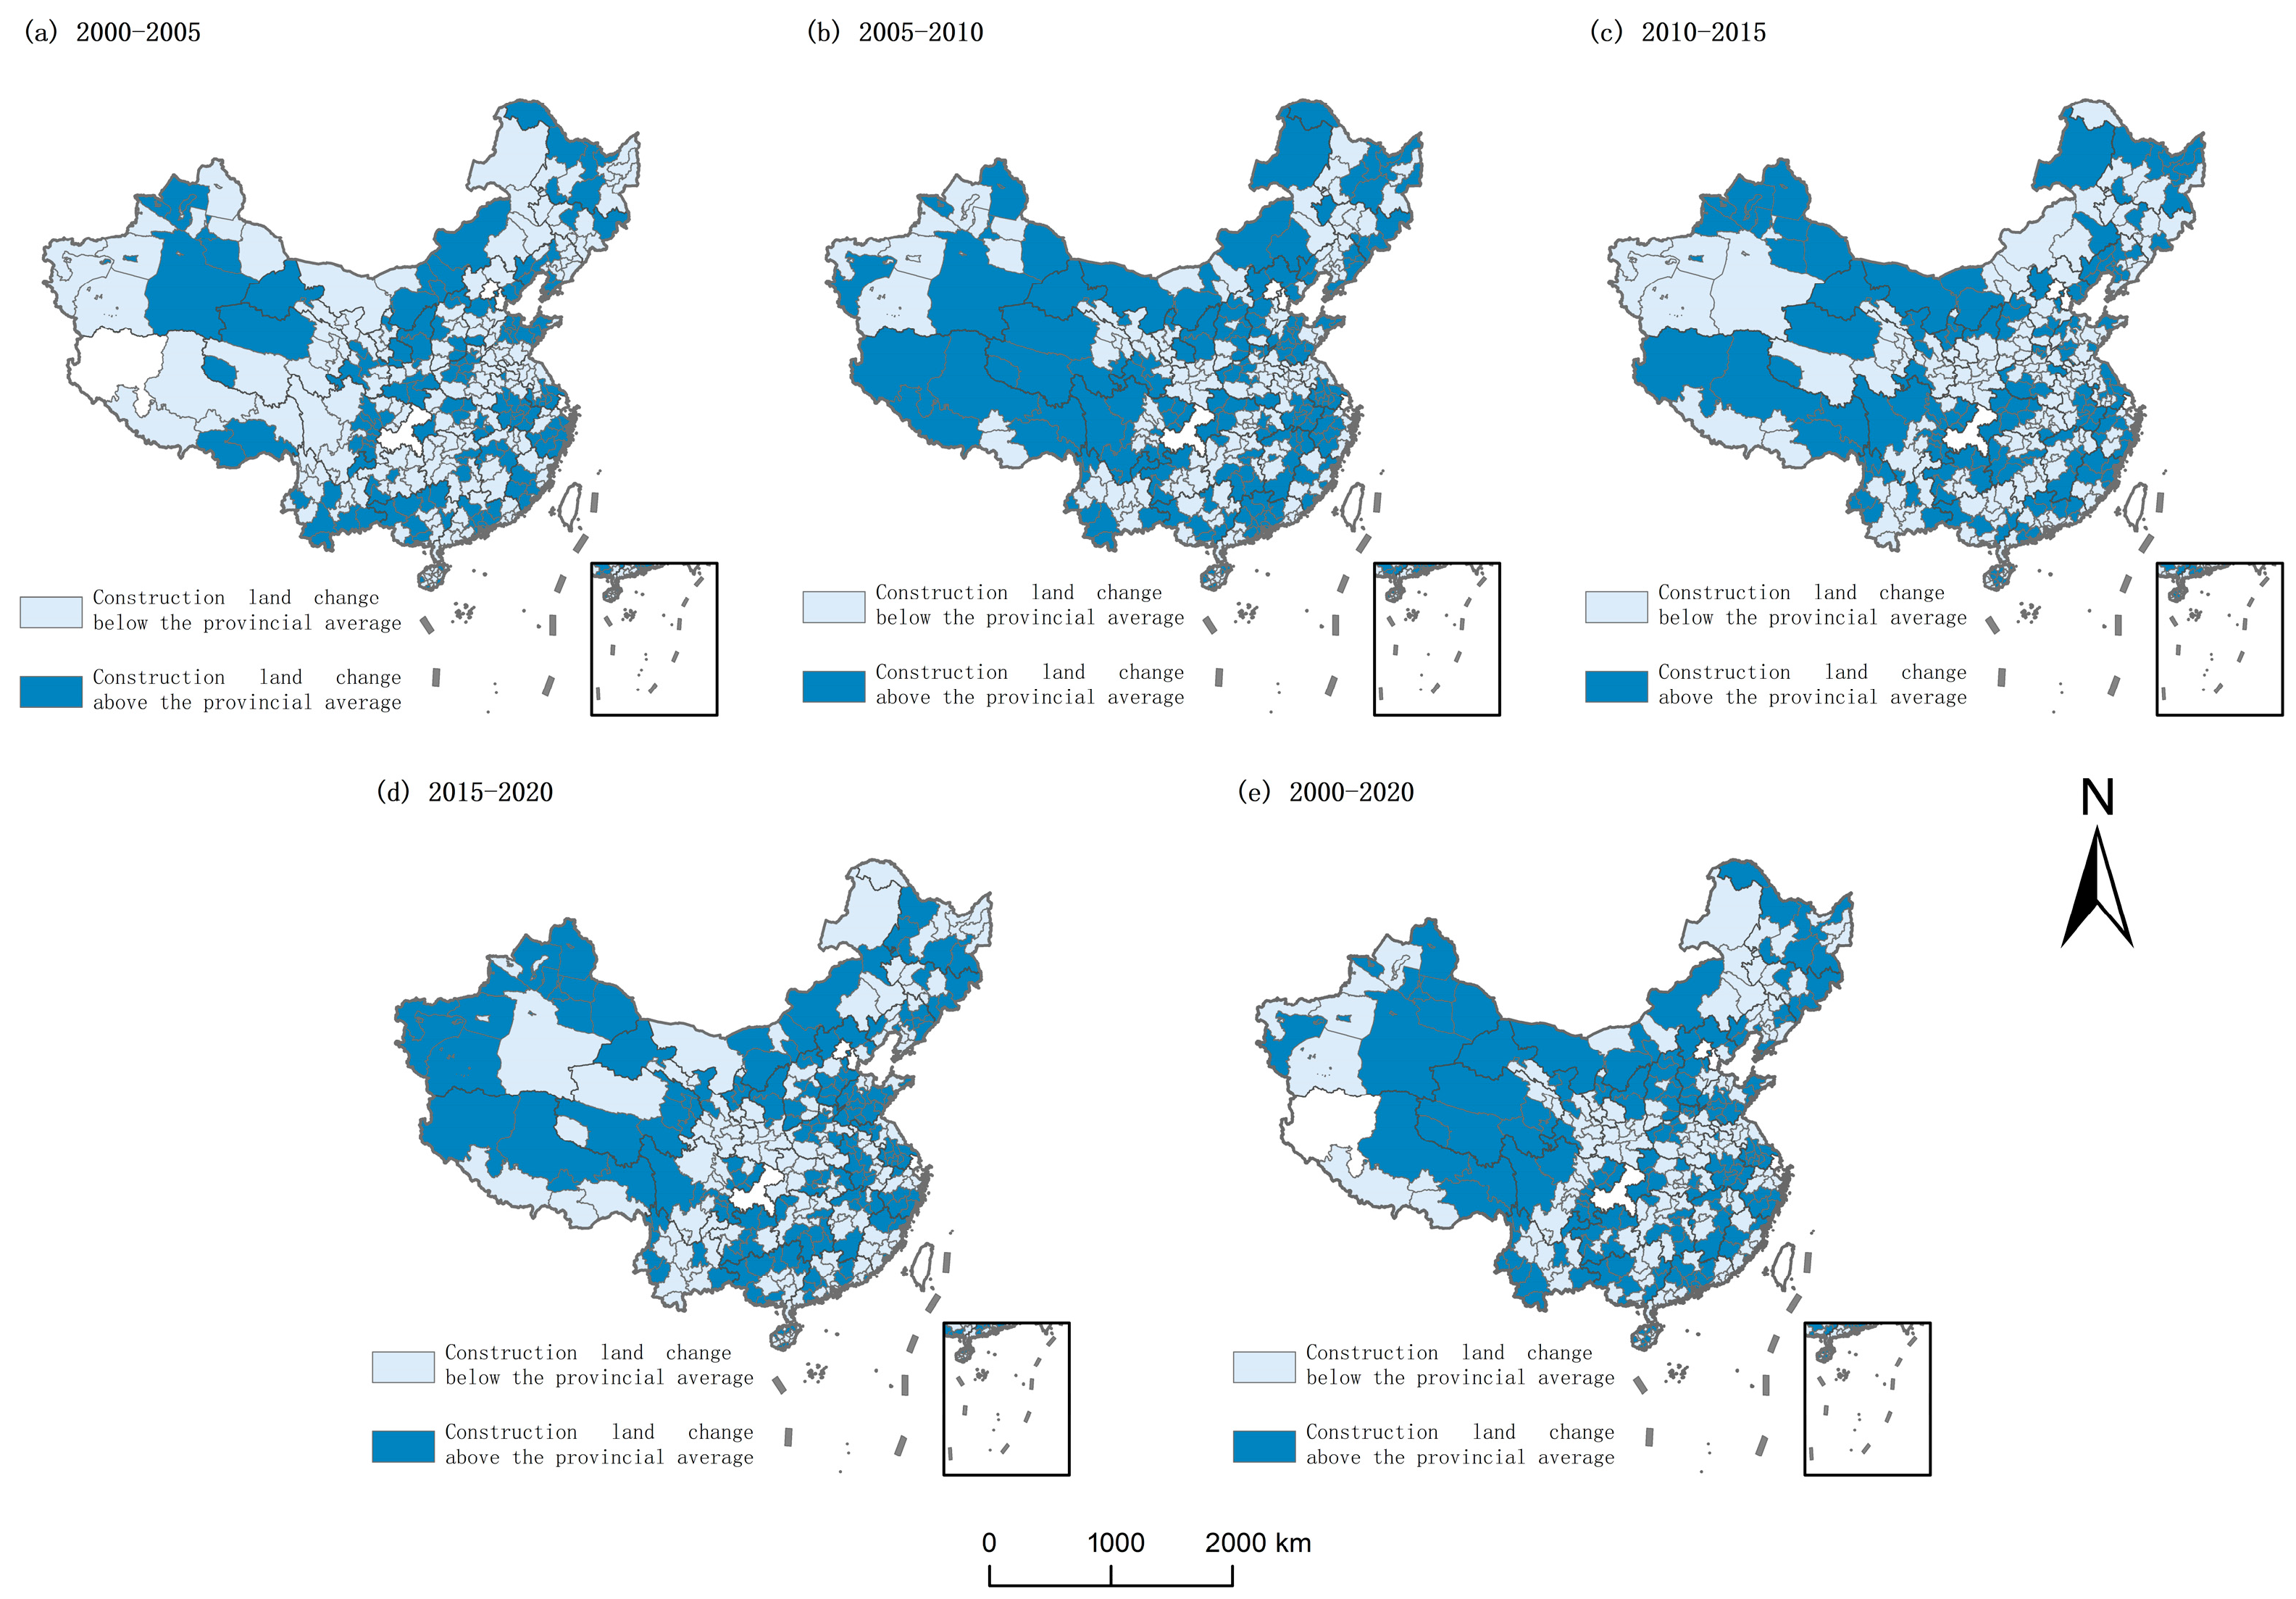
Figure 3, from a temporal perspective, the total amount of cropland has undergone a process of rapid polarization and then averaging. The maximum polarization period occurred between 2005 and 2010. During this period, Zhuhai city had the largest reduction in cropland, with a reduction of 34.66% in cropland area, and Qamdo city had the largest increase in cropland, with an increase of 189.05%. From a spatial perspective, except for a few areas in Xinjiang and Tibet, the level of cropland change is similar across the country. However, considering the unbalanced development of various regions in China and the polarization phenomenon of cropland change mentioned above, the interval generated by the natural breakpoint method is too large to meet research needs. The following compares the change level of each city with the change level of the whole province to highlight the changes in each city at the provincial level.
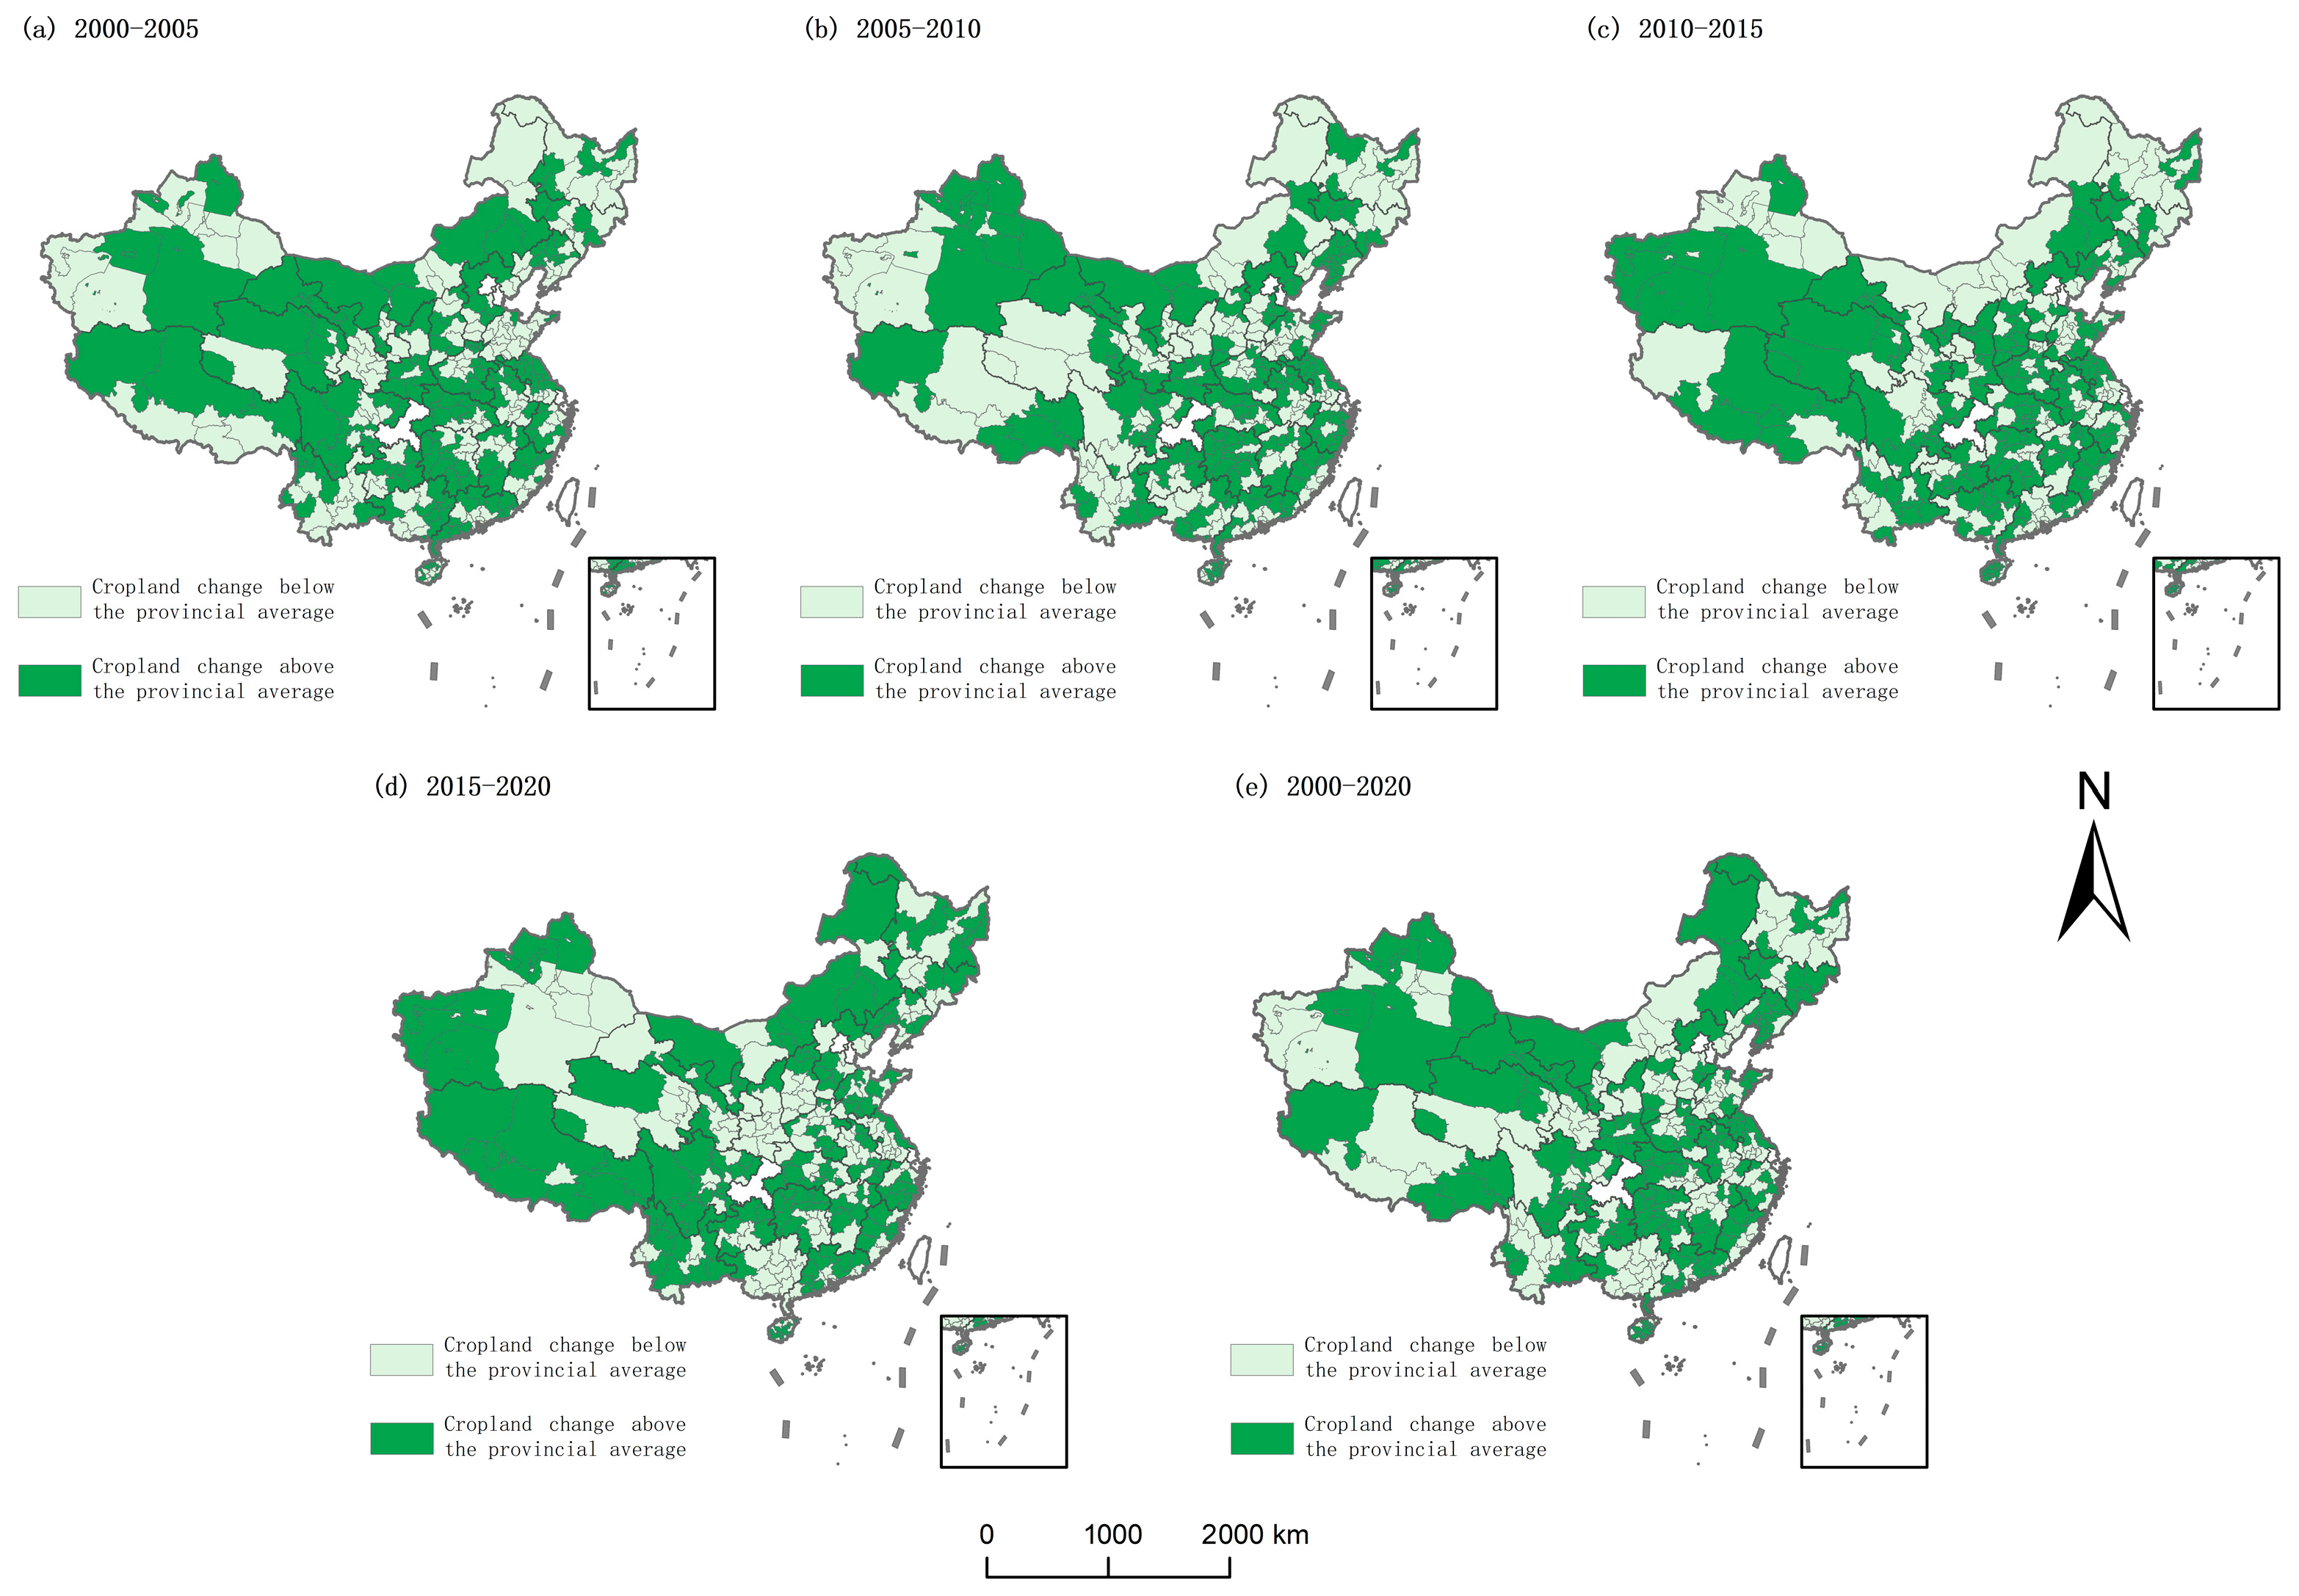
Figure 4 illustrates a comparison between city-level and provincial-level cropland change across different periods. Each time period does not show significant temporal evolution characteristics, and the number and spatial distribution of each type of city in each time period are almost the same. Cities with a lower cropland change rate than their provinces in each time period are basically concentrated in more developed areas of the province or near the provincial capital. For example, the light-colored regions of Hunan Province are concentrated in the Changsha–Zhuzhou–Xiangtan urban agglomeration and its surroundings where Changsha is located, the light-colored areas of Sichuan Province are concentrated in Chengdu and the Chengdu Plain, and the light-colored locations in Fujian Province are distributed on the west coast of the Taiwan Strait. In summary, the cropland change rate in areas with high urbanization or developed economies is lower than the provincial average.
In summary, the spatiotemporal patterns of cropland change in China, observed at both provincial and municipal scales, reveal a gradual narrowing of regional disparities, with trends converging toward average values over time. Spatially, cropland change at the provincial level exhibits a pattern of increase in the west and decrease in the east. At the municipal level, cities with higher cropland change rates are generally located in less developed or more remote areas, whereas more urbanized or economically advanced cities tend to exhibit lower rates of change.
3.2. Trends in the Expansion of Construction Land
As shown in
Figure S2, the gap in the change rate of construction land in various provinces has continued to increase over time. Between 2000 and 2005, the minimum change in construction land was 0.80%, and the maximum change was 60.46%. Between 2015 and 2020, the gap further widened, with a minimum of −17.28% and a maximum of 115.49%. Judging from time and numbers alone, the development of construction land in China seems to be unbalanced.
The maximum values in each time period varied, indicating a “multi-center” feature. Zhejiang Province and Fujian Province had the largest change rates of construction land between 2000 and 2005, reaching 60.46% and 49.14%, respectively. However, between 2005 and 2010, these two provinces fell into the fourth tier, which was at the middle and lower levels of the country. They were replaced by Shanxi Province, Chongqing Municipality, and Xinjiang Uygur Autonomous Region, all of which reached more than 60%. From the perspective of overall spatial distribution, the increase in construction land in the country after 2005 mainly came from the western region, and the increase proportion was much greater than that in the developed eastern region. The gap between the east and west in terms of construction land area has narrowed.
As shown in
Figure 5, the gap in construction land changes first widened and then narrowed, and the maximum value occurred between 2005 and 2010. However, at the city level, the change between cities is greater than the gap between provinces, indicating that the degree of imbalance in the development of cities in the same province is greater than the degree of imbalance between provinces.
Cities with increased built-up land are concentrated in provinces with increased built-up land. Notably, contrary to the loss of cropland, the largest increase in construction land within the same province is not in the provincial capital or central city but rather in the province’s “second- and third-tier cities”. This result is more obvious in the results presented below.
As shown in
Figure 6, cities within each province that were higher than the provincial average between 2000 and 2010 were concentrated in the province and economically developed cities within the province. After 2010, there was a trend of spreading to surrounding cities. For example, the Pearl River Delta region of Guangdong Province was a region with rapid expansion of construction land in Guangdong Province between 2000 and 2010. After 2010, the change rate of construction land in this region was lower than the provincial average.
As shown in
Figure S5, the SDE of ACU changes from small to large, indicating that the area where cropland is converted to construction land has been increasing since 2000 and has a trend of moving northwards. The SDE of cropland loss has become narrower as it moves northwards, indicating that the cropland loss in the northeast and northwest is more serious. Moreover, the SDE change trend of construction land expansion is consistent with that of ACU, which not only shows that the area of construction land expansion is also expanding but also shows that the source of construction land in most areas is mainly cropland.
In terms of the total amount from 2000 to 2020, ACU and the SDE of construction land expansion remain consistent, covering most of the North China Plain and the middle and lower reaches of the Yangtze River, indicating that the construction land in these areas has grown rapidly in the past 20 years and that the source is mainly cropland, among which the SDE of construction land expansion is slightly larger in area. The SDE of cropland loss is smaller than those of the other two areas and is located in Inner Mongolia and most of northeastern China, indicating that cropland loss mainly comes from northeastern China and Inner Mongolia.
3.3. Evolution of the Spatiotemporal Patterns of DEP and CON
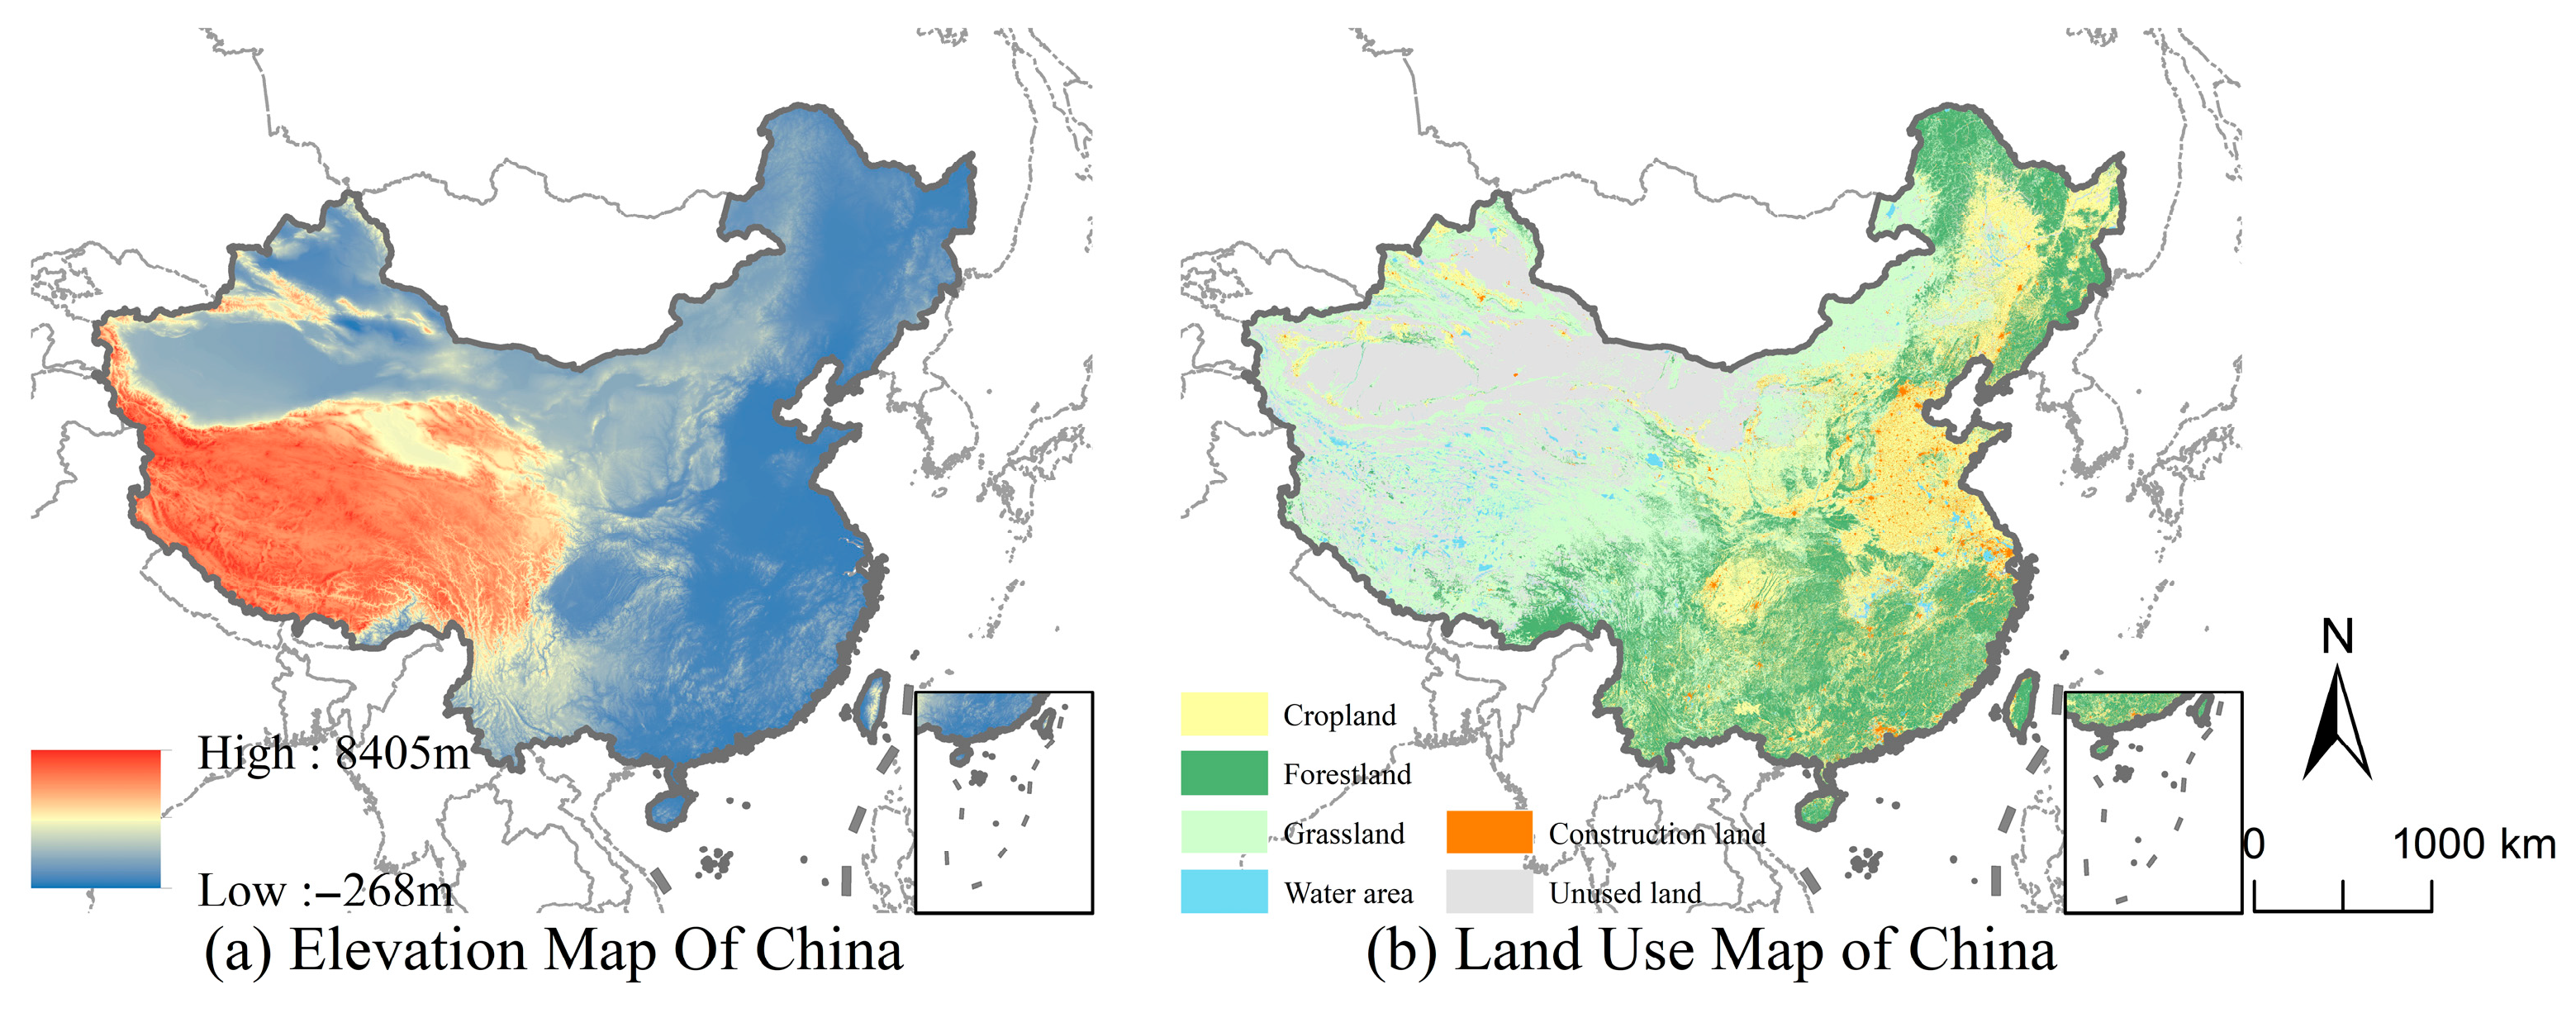
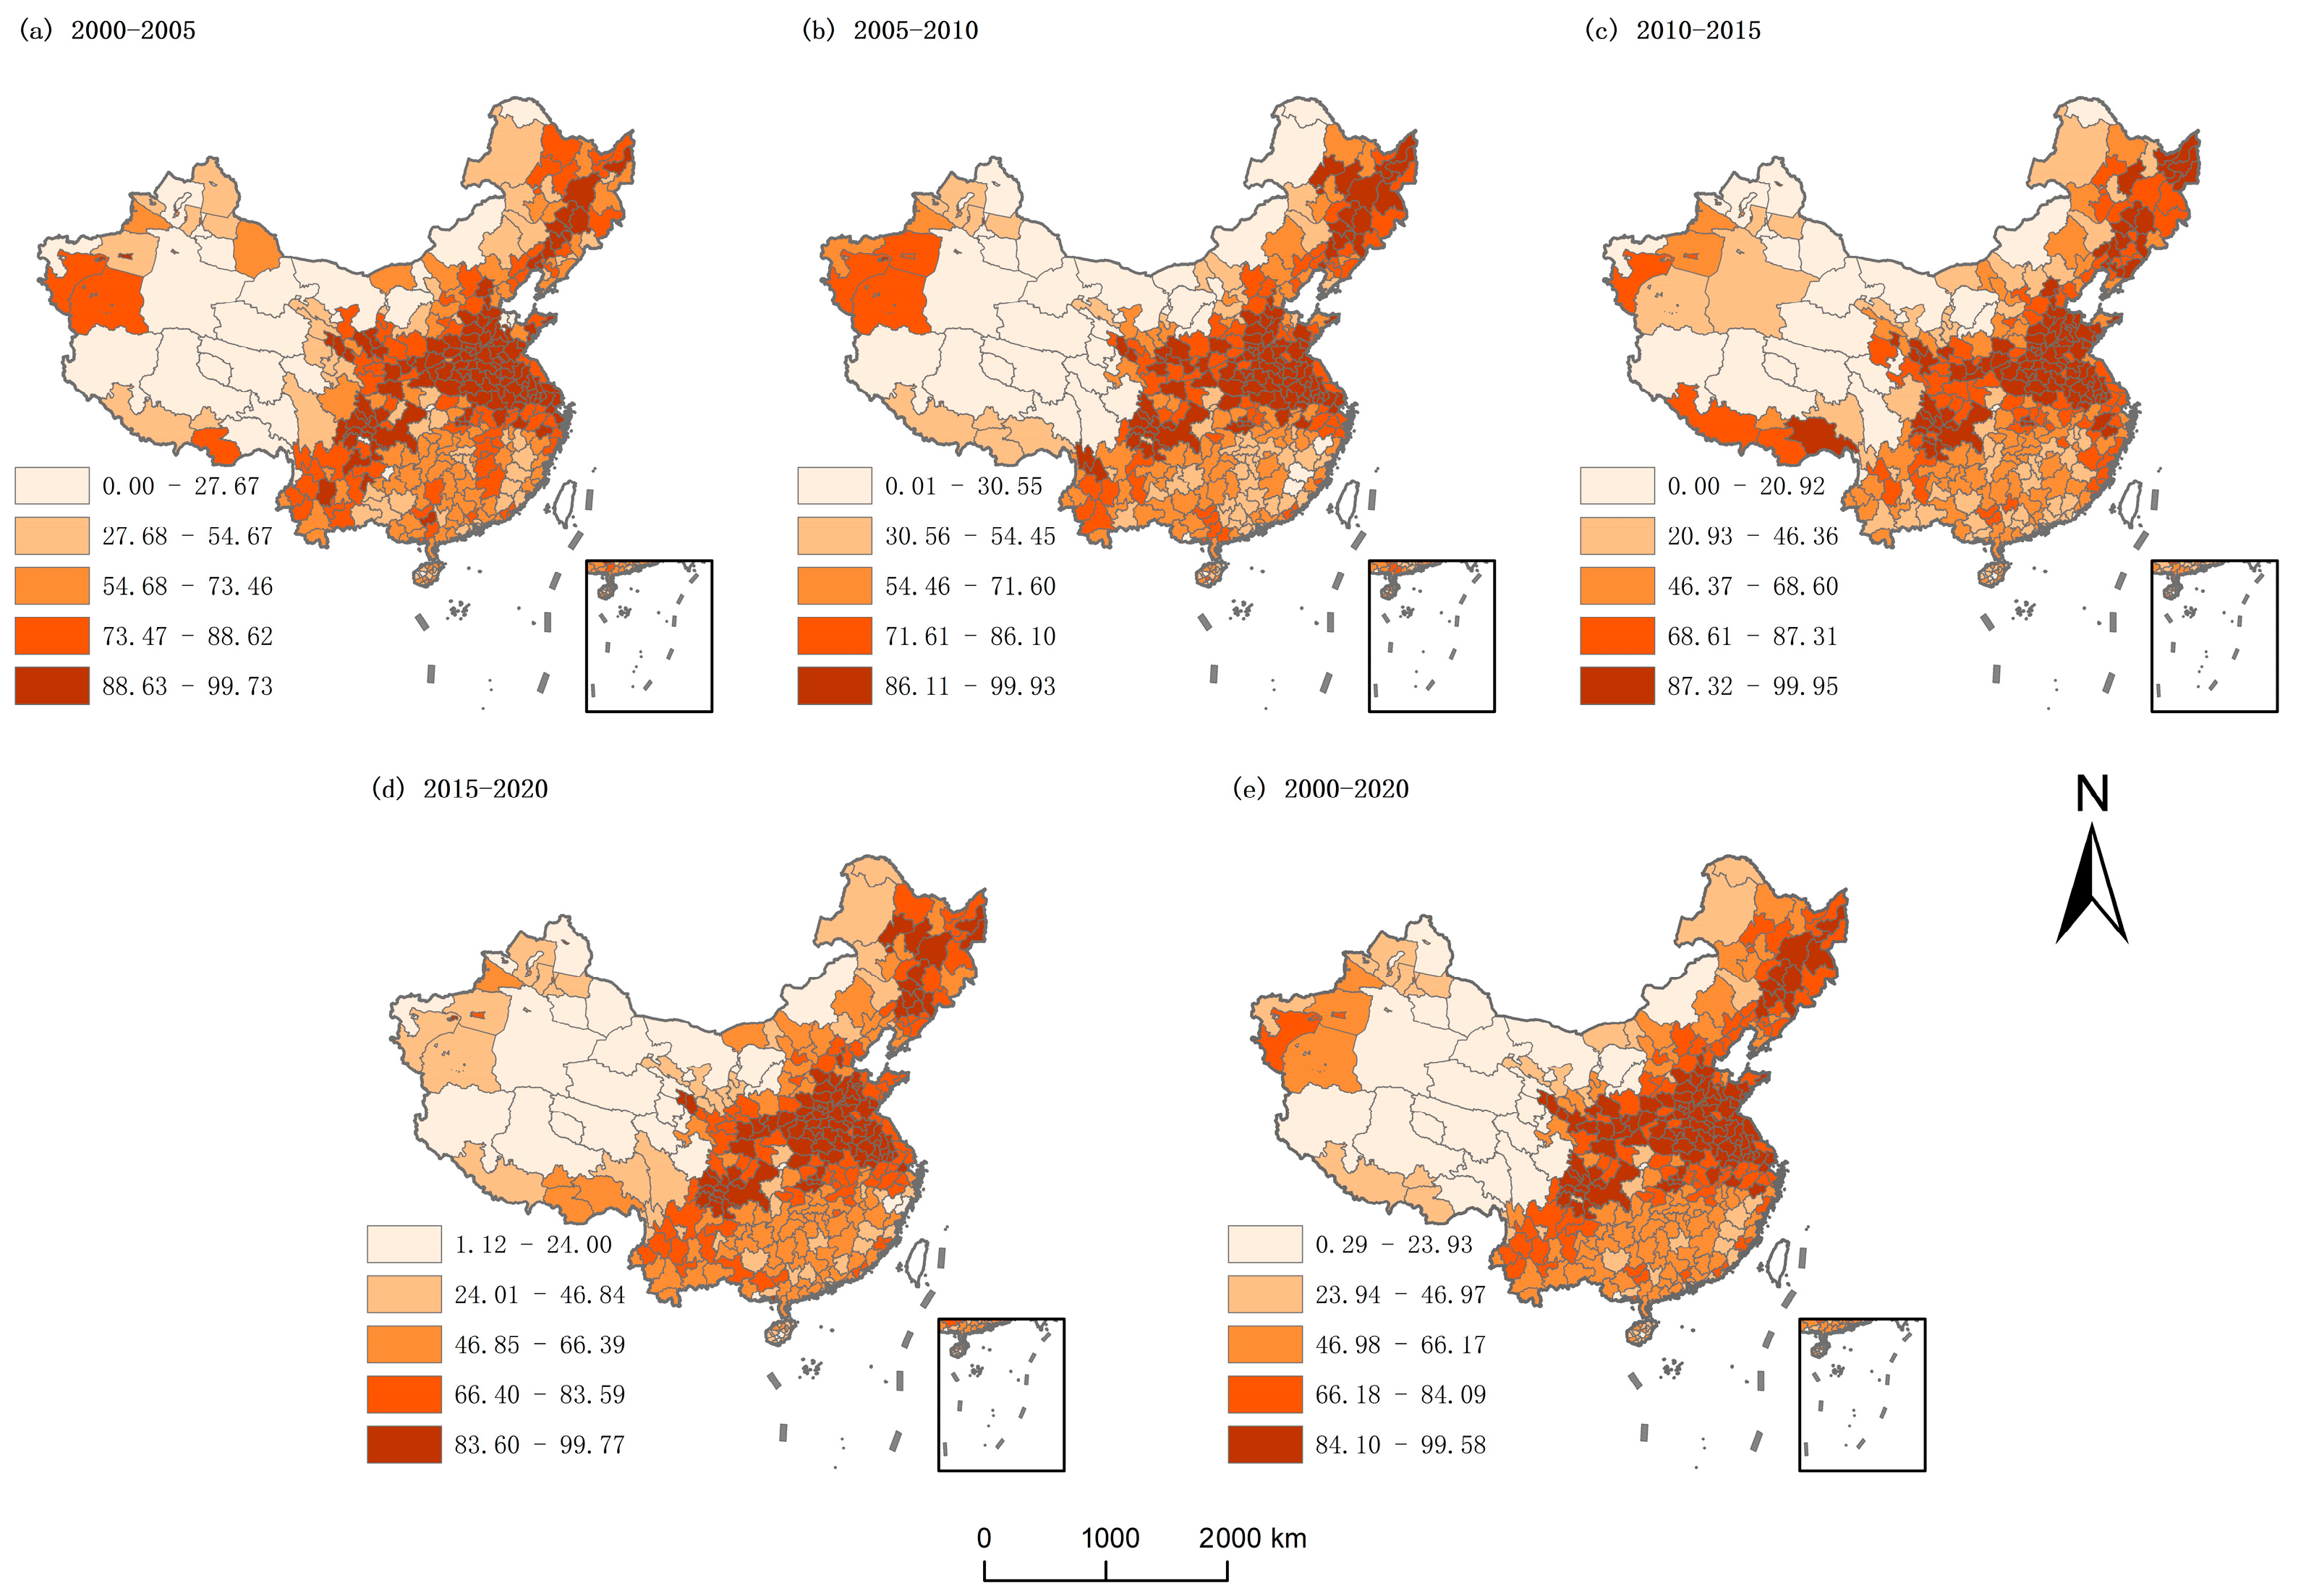
Table S2 and Figure S3 show that the degree of provincial construction land dependence on cropland shows strong spatial stability. Jilin Province, Henan Province, Anhui Province, and Chongqing city are the provinces with the highest dependence across all time periods, followed by other provinces in the Northeast Plain, North China Plain, and Sichuan Basin and the central and southern regions, including the southern banks of the Yangtze River, and the Guangdong and Guangxi regions. The provinces with the lowest degree of construction land dependence on cropland are the Xinjiang Uygur Autonomous Region, Qinghai Province, Inner Mongolia Autonomous Region, and Tibet Autonomous Region. The common characteristics of these provinces are large areas, sparse populations, and rich land resources, so there is sufficient land for expanding construction land without occupying cropland (
Figure 7).
The abovementioned concentrated features in the Northeast Plain, North China Plain, and Sichuan Basin are more obvious. The spatial features in the central and southern regions have no significant changes; the Z values of the four time periods tested by spatial autocorrelation are all greater than 2.58, indicating that DEP has significant spatial aggregation, and the aggregation areas are the North China Plain, Northeast Plain, Sichuan Basin, western Xinjiang, southern Tibet, and eastern and southern Inner Mongolia.
As shown in
Figure S4, at the provincial level, from a spatial perspective, the changes in CON and DEP show similarities and differences. Similarly, at the provincial level, the North China Plain is still a region with relatively high CON. The difference is that CON in northeastern China and the Sichuan Basin is lower than DEP, and CON in the southeastern coastal provinces is higher than DEP.
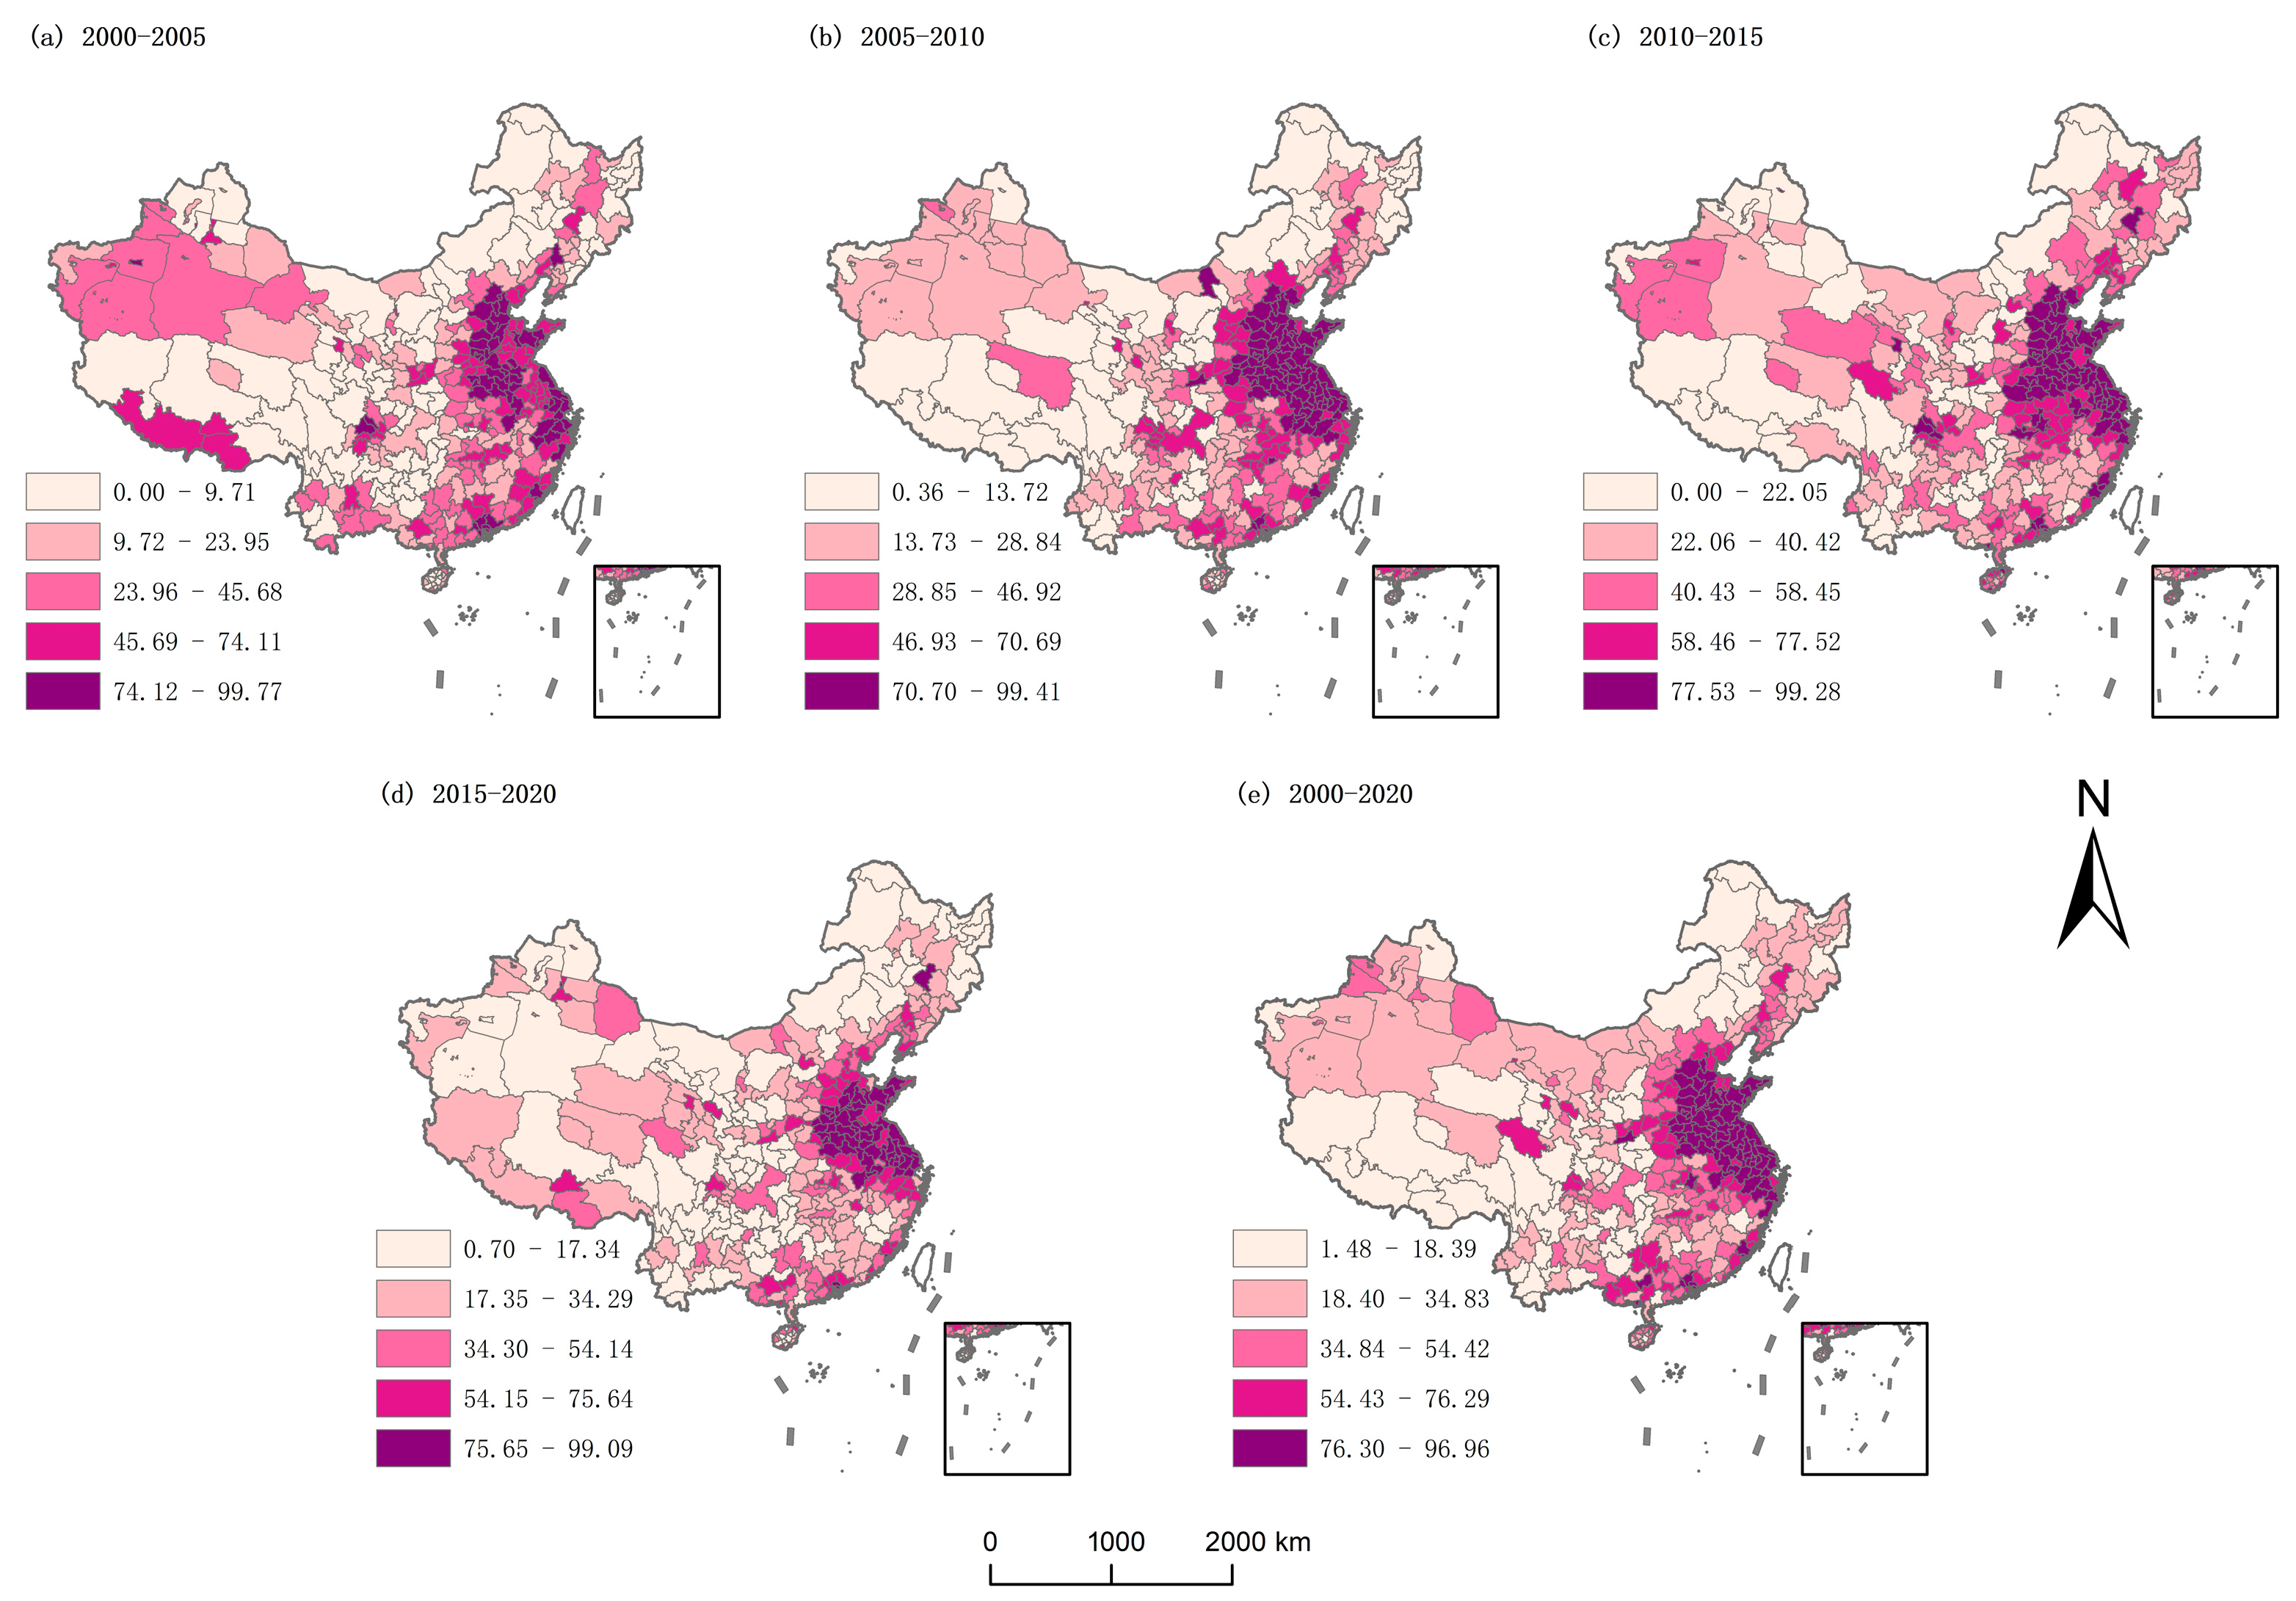
The city-level results (
Figure 8) are consistent with those for DEP; that is, the regional distribution law at the provincial level is maintained. In terms of specific spatial patterns, the North China Plain, Jiangsu and Zhejiang regions, and the Pearl River Delta have the highest CON in the country in all time periods. According to the distribution law, the CON of provincial capitals or economically developed cities is greater than that of other surrounding cities. This shows that for the southeastern coastal areas, the main method of farmland loss is conversion to construction land, whereas for northeastern China and the Sichuan Basin, farmland loss is affected by many factors.
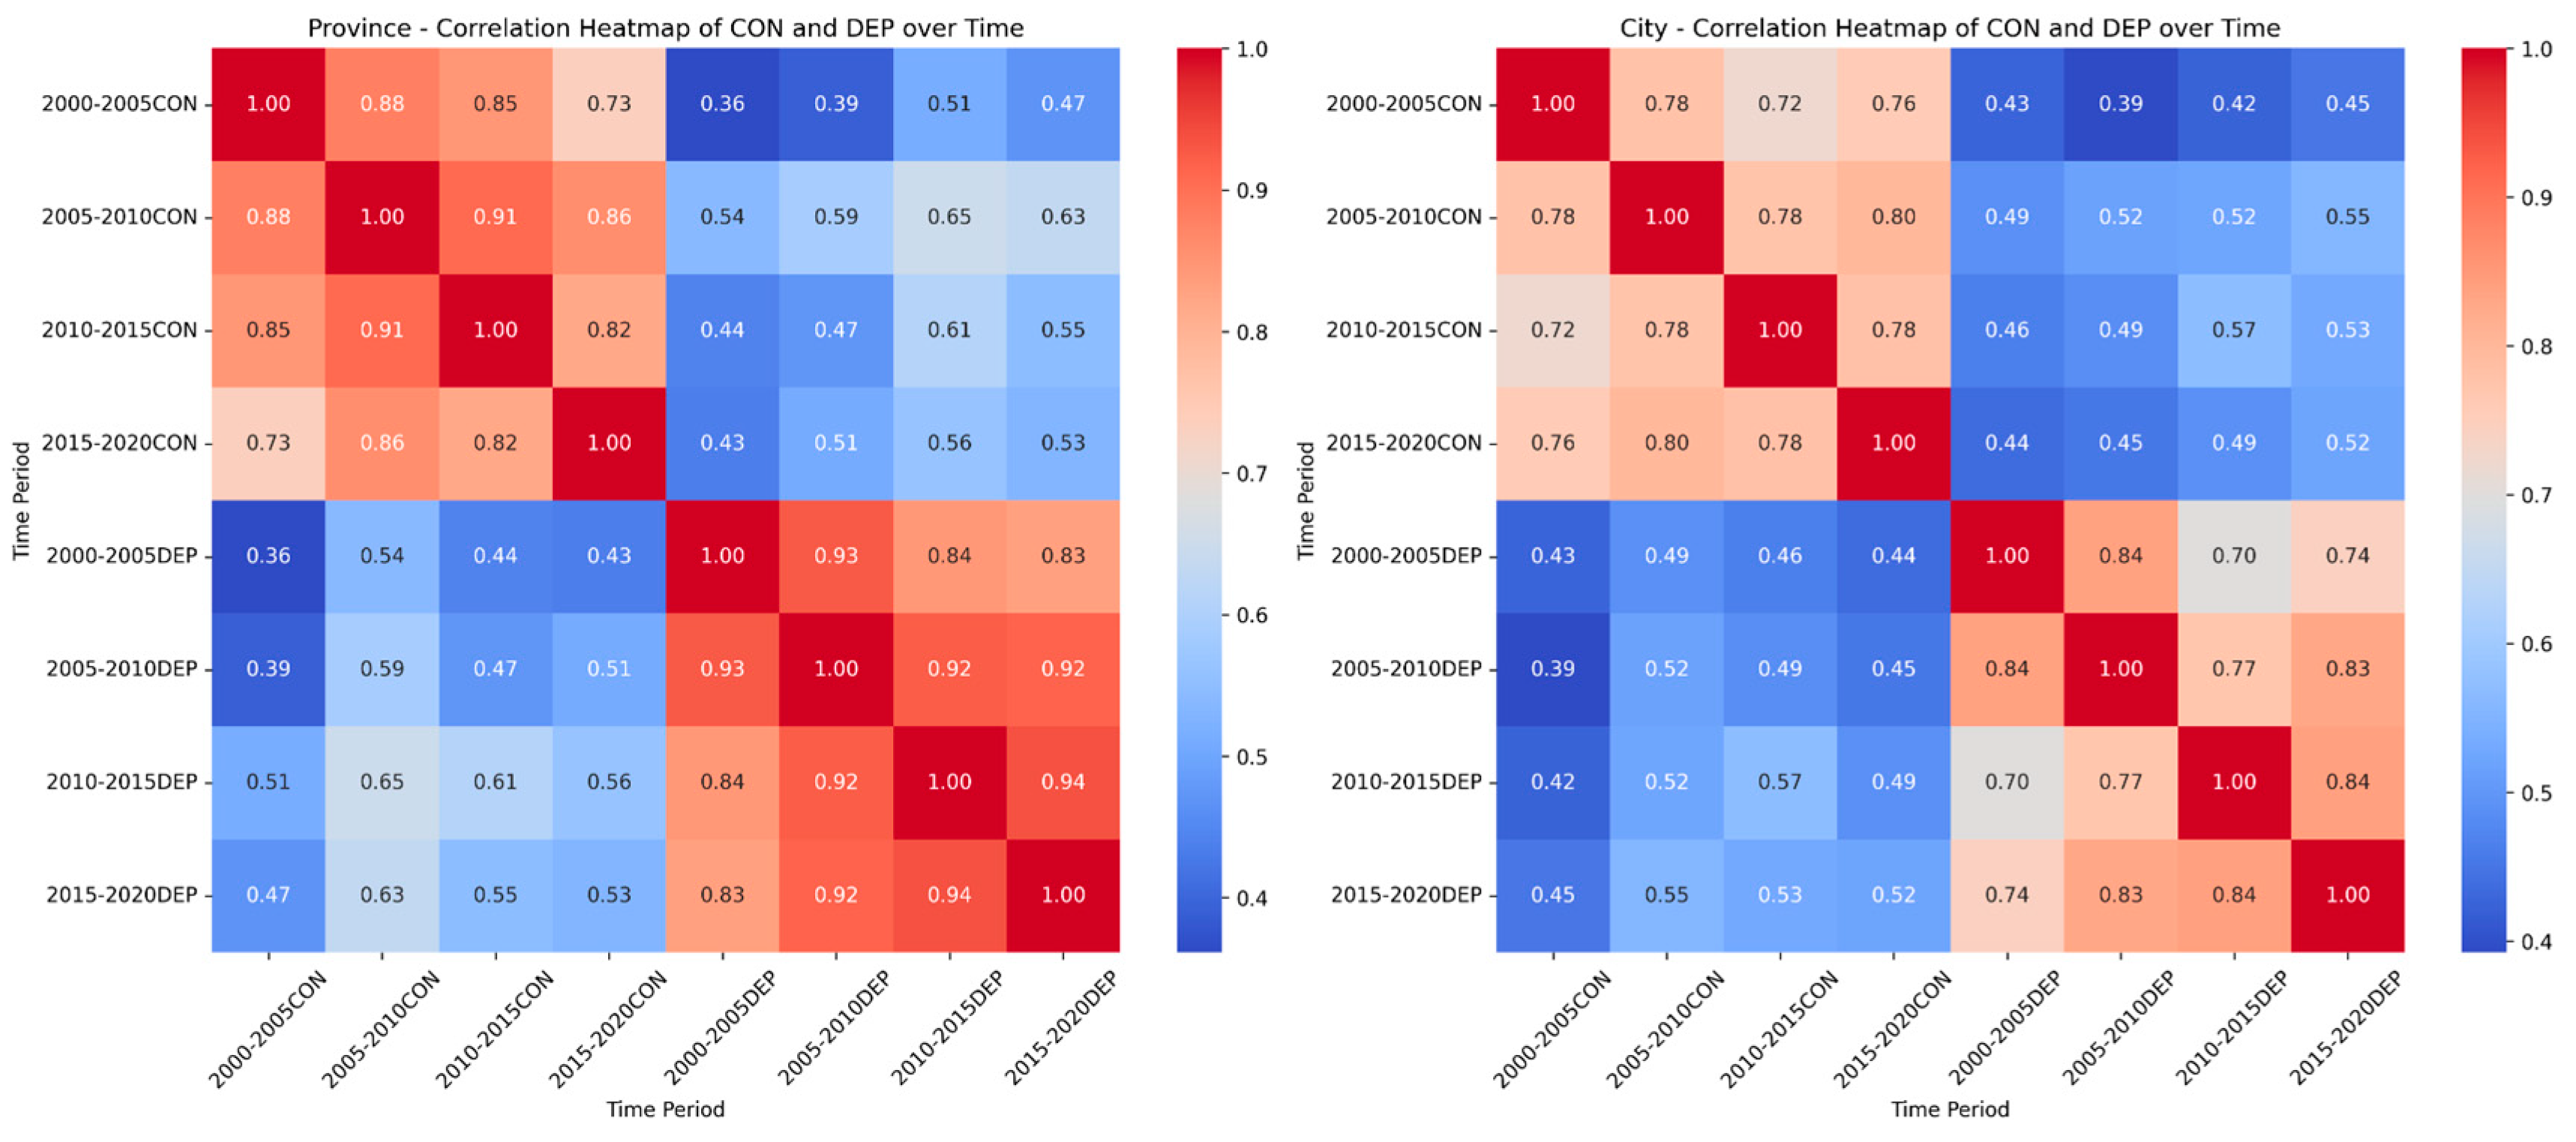
As shown in
Figure 9, DEP and CON are strongly correlated, but the correlation between CON and DEP is weak. At the provincial and municipal scales, CON and DEP have the same temporal characteristics: DEP has correlations in adjacent time periods, CON has the strongest correlation between the two time periods of 2005–2010 and 2010–2015, and CON has a weaker correlation than DEP does. For both DEP and CON, the correlation at the provincial scale is greater than that at the city level.
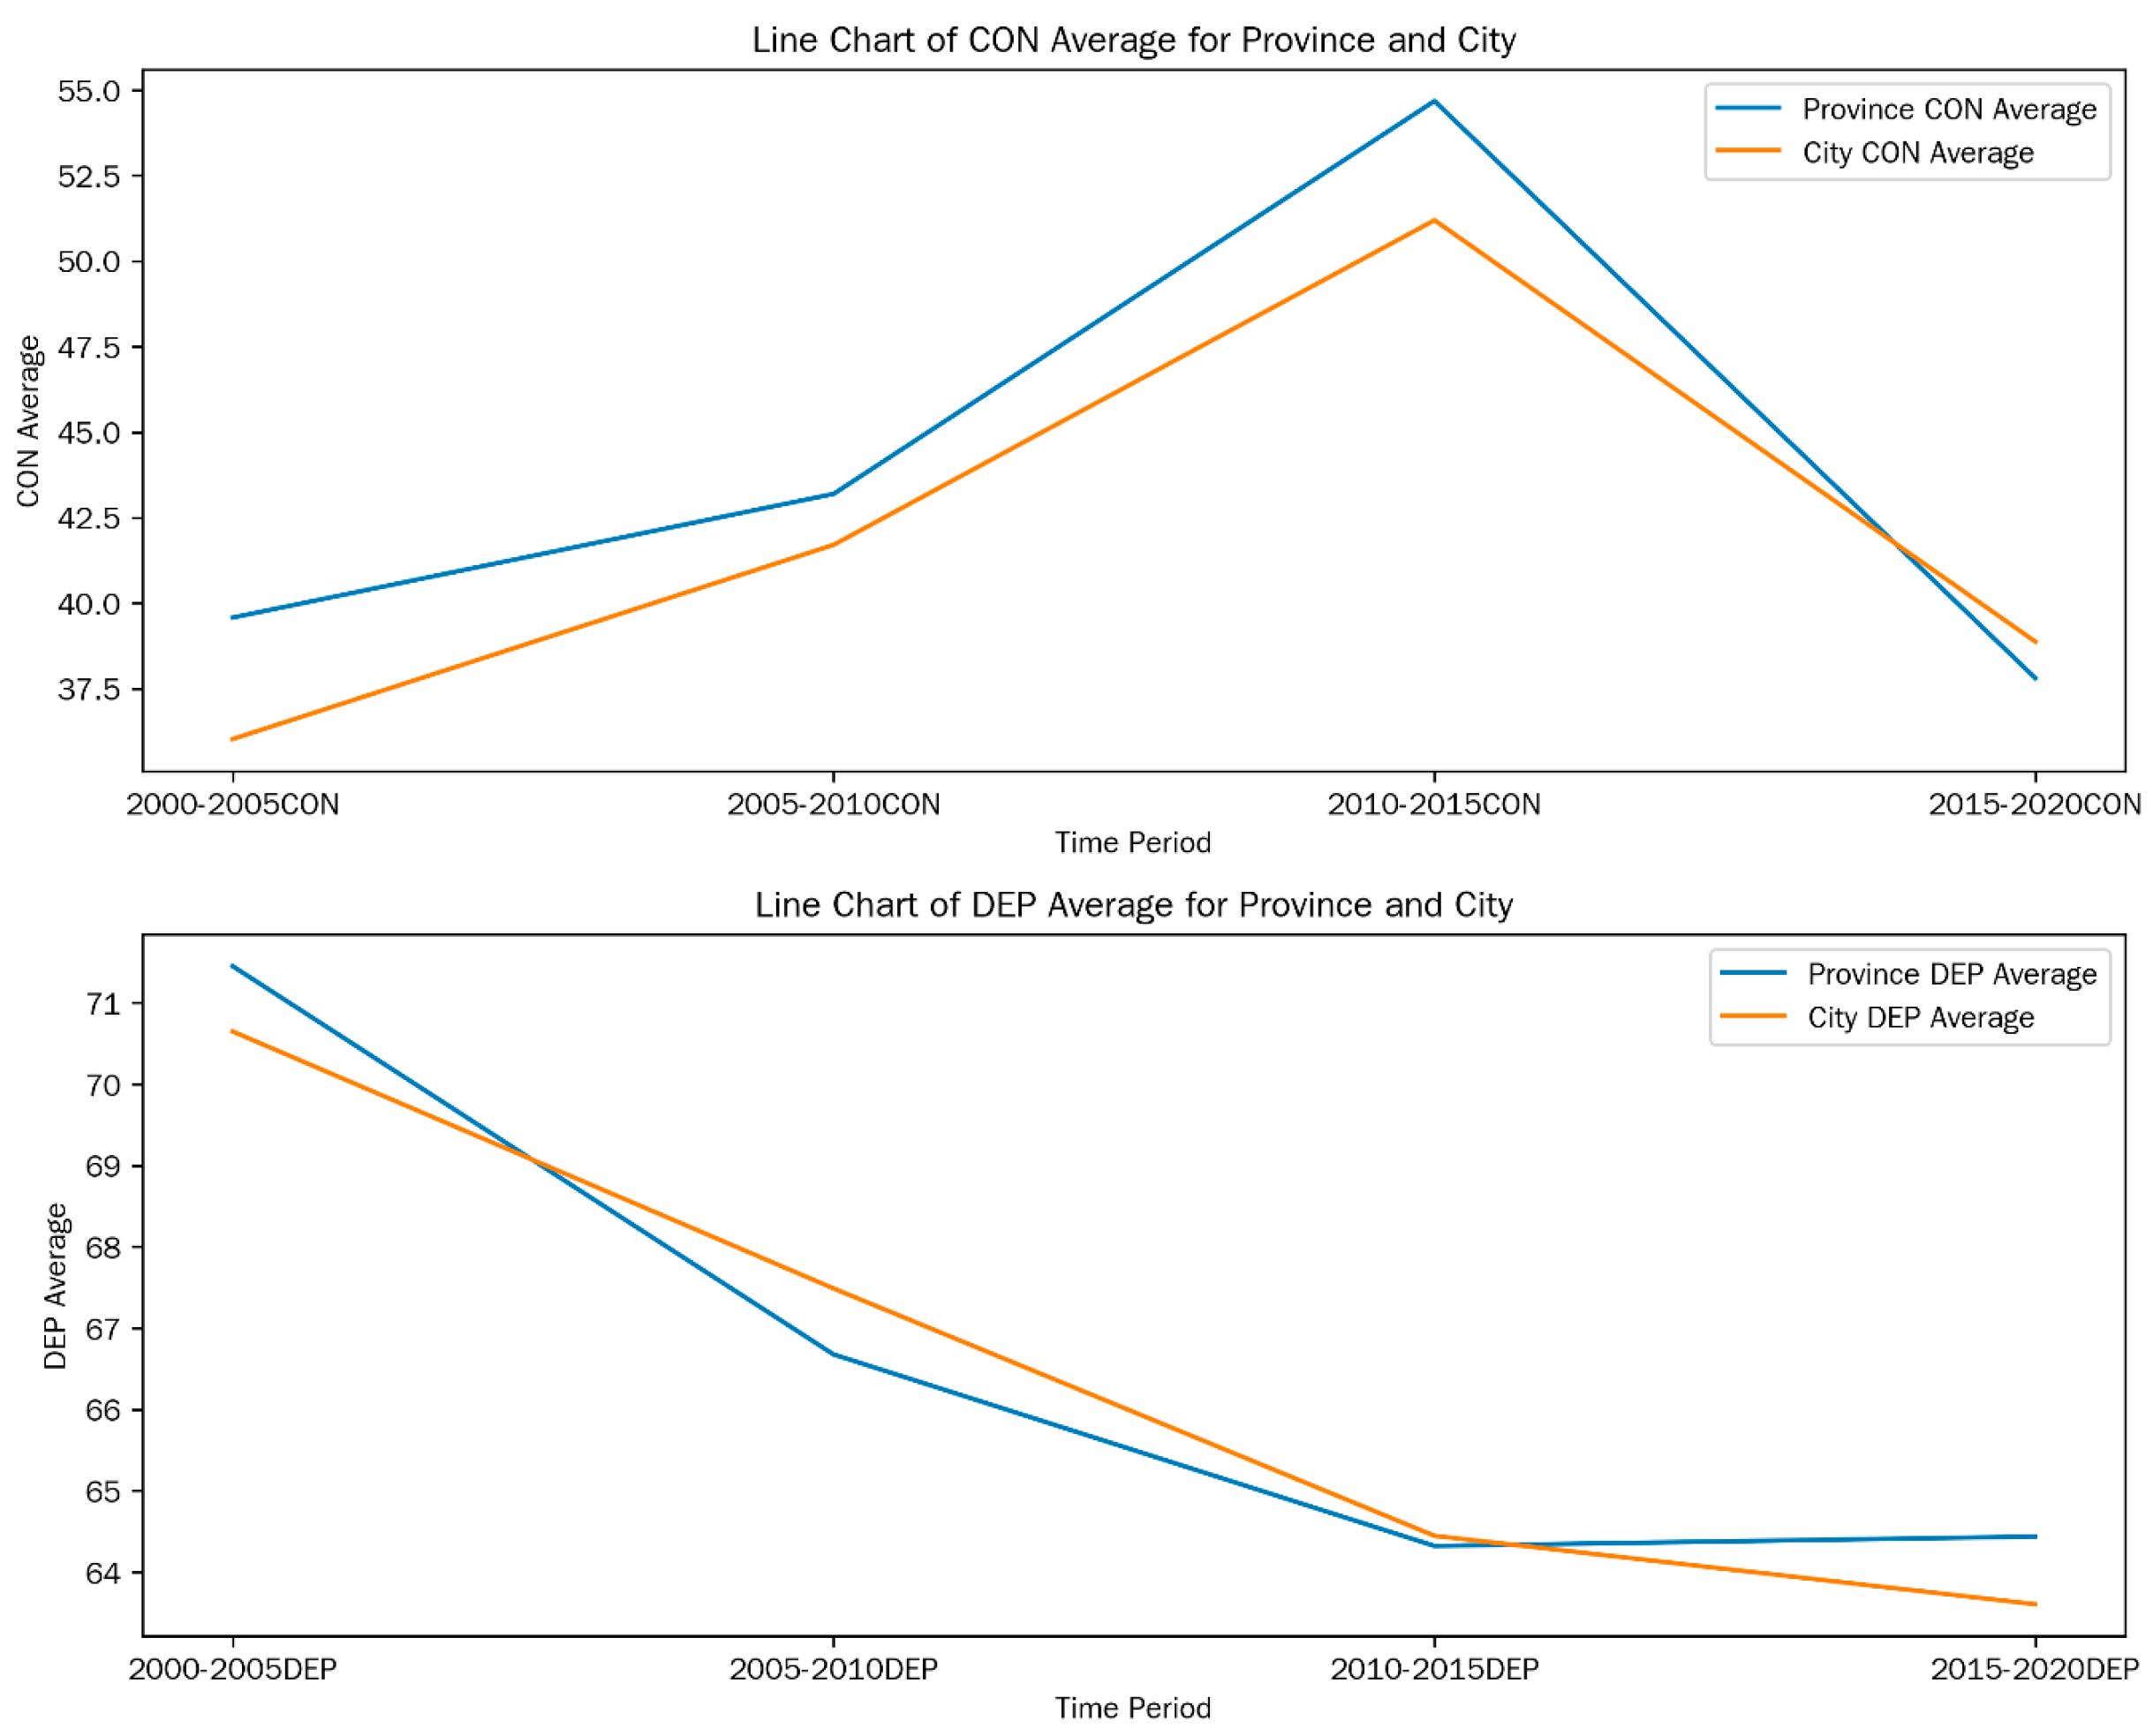
As shown in
Figure 10 and
Figure 11, the trend of change is consistent between the province and the city. CON shows a time characteristic of a linear increase and then a decrease, whereas DEP continues to decrease.
3.4. Driver Factor Analysis
Based on a comprehensive analysis, there is no significant difference in the spatiotemporal pattern of construction land expansion occupying cropland across the provincial and municipal scales. Due to the limited sample size at the provincial level (only around thirty samples), the reliability of statistical analysis is reduced. Therefore, the driving factor analysis is conducted at the city level, where the sample size is sufficient to ensure more robust and interpretable results.
After eliminating several highly collinear and statistically insignificant indicators, the variables listed in
Table 2 were selected for the driving factor analysis. The selection of these indicators was based on both theoretical relevance and empirical support from the existing literature. Socioeconomic factors—such as urbanization rate, municipal budgetary spending, and road network density—capture the intensity of urban development and infrastructure investment, which directly affect the pressure on cropland. Natural condition variables, including land degradation index (LDI), annual precipitation, and mean slope gradient, account for environmental and topographic constraints on land conversion. Agricultural production conditions, represented by fertilizer consumption and the non-grain cultivation index, reflect both the productivity and structural adjustment of cropland. Additionally, city hierarchy was included to represent administrative rank and policy influence, which can significantly shape land-use decisions. These indicators are particularly relevant for explaining the two core variables in this study: DEP and CON.
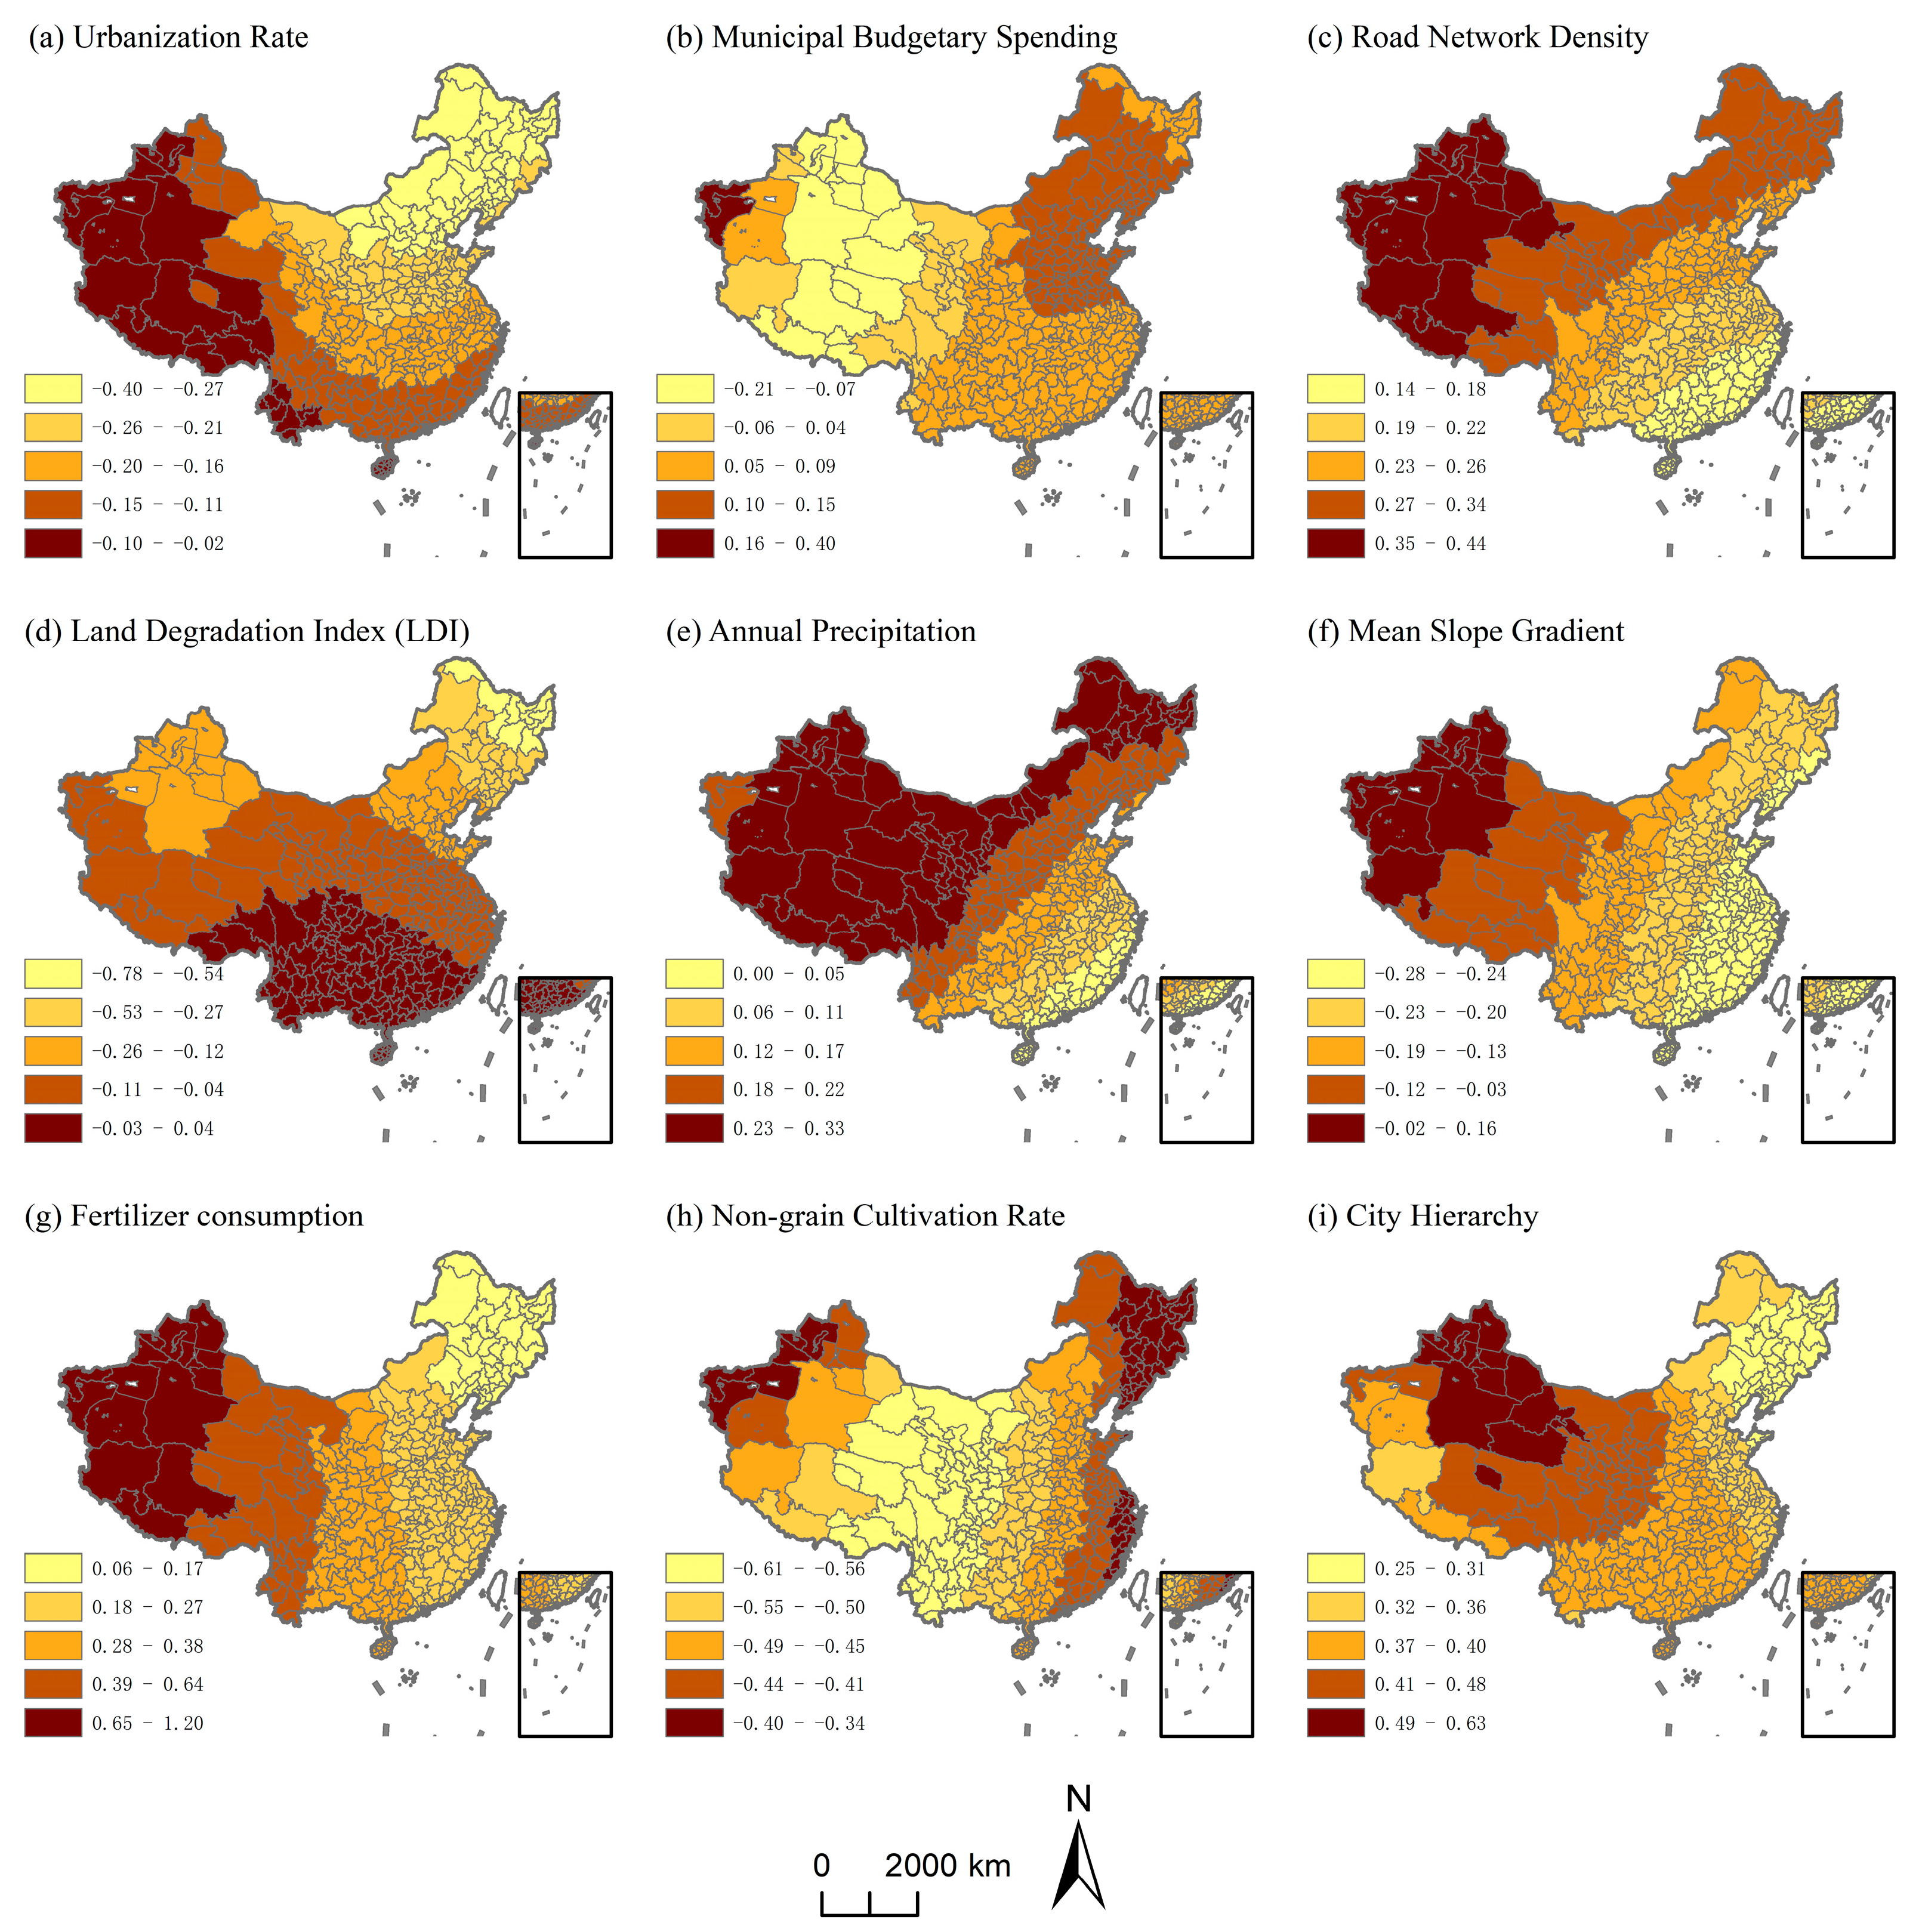
The GWR results (
Figure 12) reveal that, among socioeconomic factors, the three indicators exhibit distinct spatial effects on DEP. The urbanization rate exerts an overall inhibitory influence on DEP, with this effect intensifying progressively from the southwest to the northeast. Municipal budgetary spending displays both inhibitory and promoting effects: inhibition is concentrated at the junction of Tibet, Qinghai, and Xinjiang and surrounding areas, while promotion dominates elsewhere. Road network density generally intensifies DEP across the country, with the effect increasing from southeast to northwest—forming a spatial pattern roughly parallel to the Heihe–Tengchong line.
Regarding natural conditions, annual precipitation promotes DEP, with the strength of the effect increasing from the southeast to the northwest. Average slope typically inhibits DEP nationwide, though it exhibits a localized promoting effect in parts of the northwest. As a composite factor influenced by both slope and precipitation, the land degradation index (LDI) demonstrates a dual effect: promoting DEP in the southwest and strongly inhibiting it in the northeast.
In terms of agricultural production conditions, fertilizer consumption promotes DEP at the national level, with the influence increasing from east to west. The non-grain production rate has an overall inhibitory effect on DEP, and its spatial distribution resembles a belt-like pattern centered on western Inner Mongolia, Gansu, Qinghai, and western Sichuan.
In the domain of policy factors, city hierarchy promotes DEP, with a spatial diffusion pattern radiating outward from central inland areas toward surrounding regions.
To justify the application of the geographically weighted regression (GWR) model, we first evaluated a global Ordinary Least Squares (OLS) model. For DEP, the OLS model produced an R2 of 0.42 and an AICc of −115.52. In contrast, the GWR model yielded a higher R2 of 0.55 and a lower AICc of −222.83. A similar trend was observed for CON, where the OLS model had an R2 of 0.49 and an AICc of −79.87, compared to the GWR model’s R2 of 0.60 and AICc of −149.98. These results indicate that GWR better captures spatial heterogeneity and provides a superior model fit. It should be noted that adjusted R2 is generally not meaningful for GWR due to the model’s local estimation framework; therefore, it is not directly compared with the OLS results.
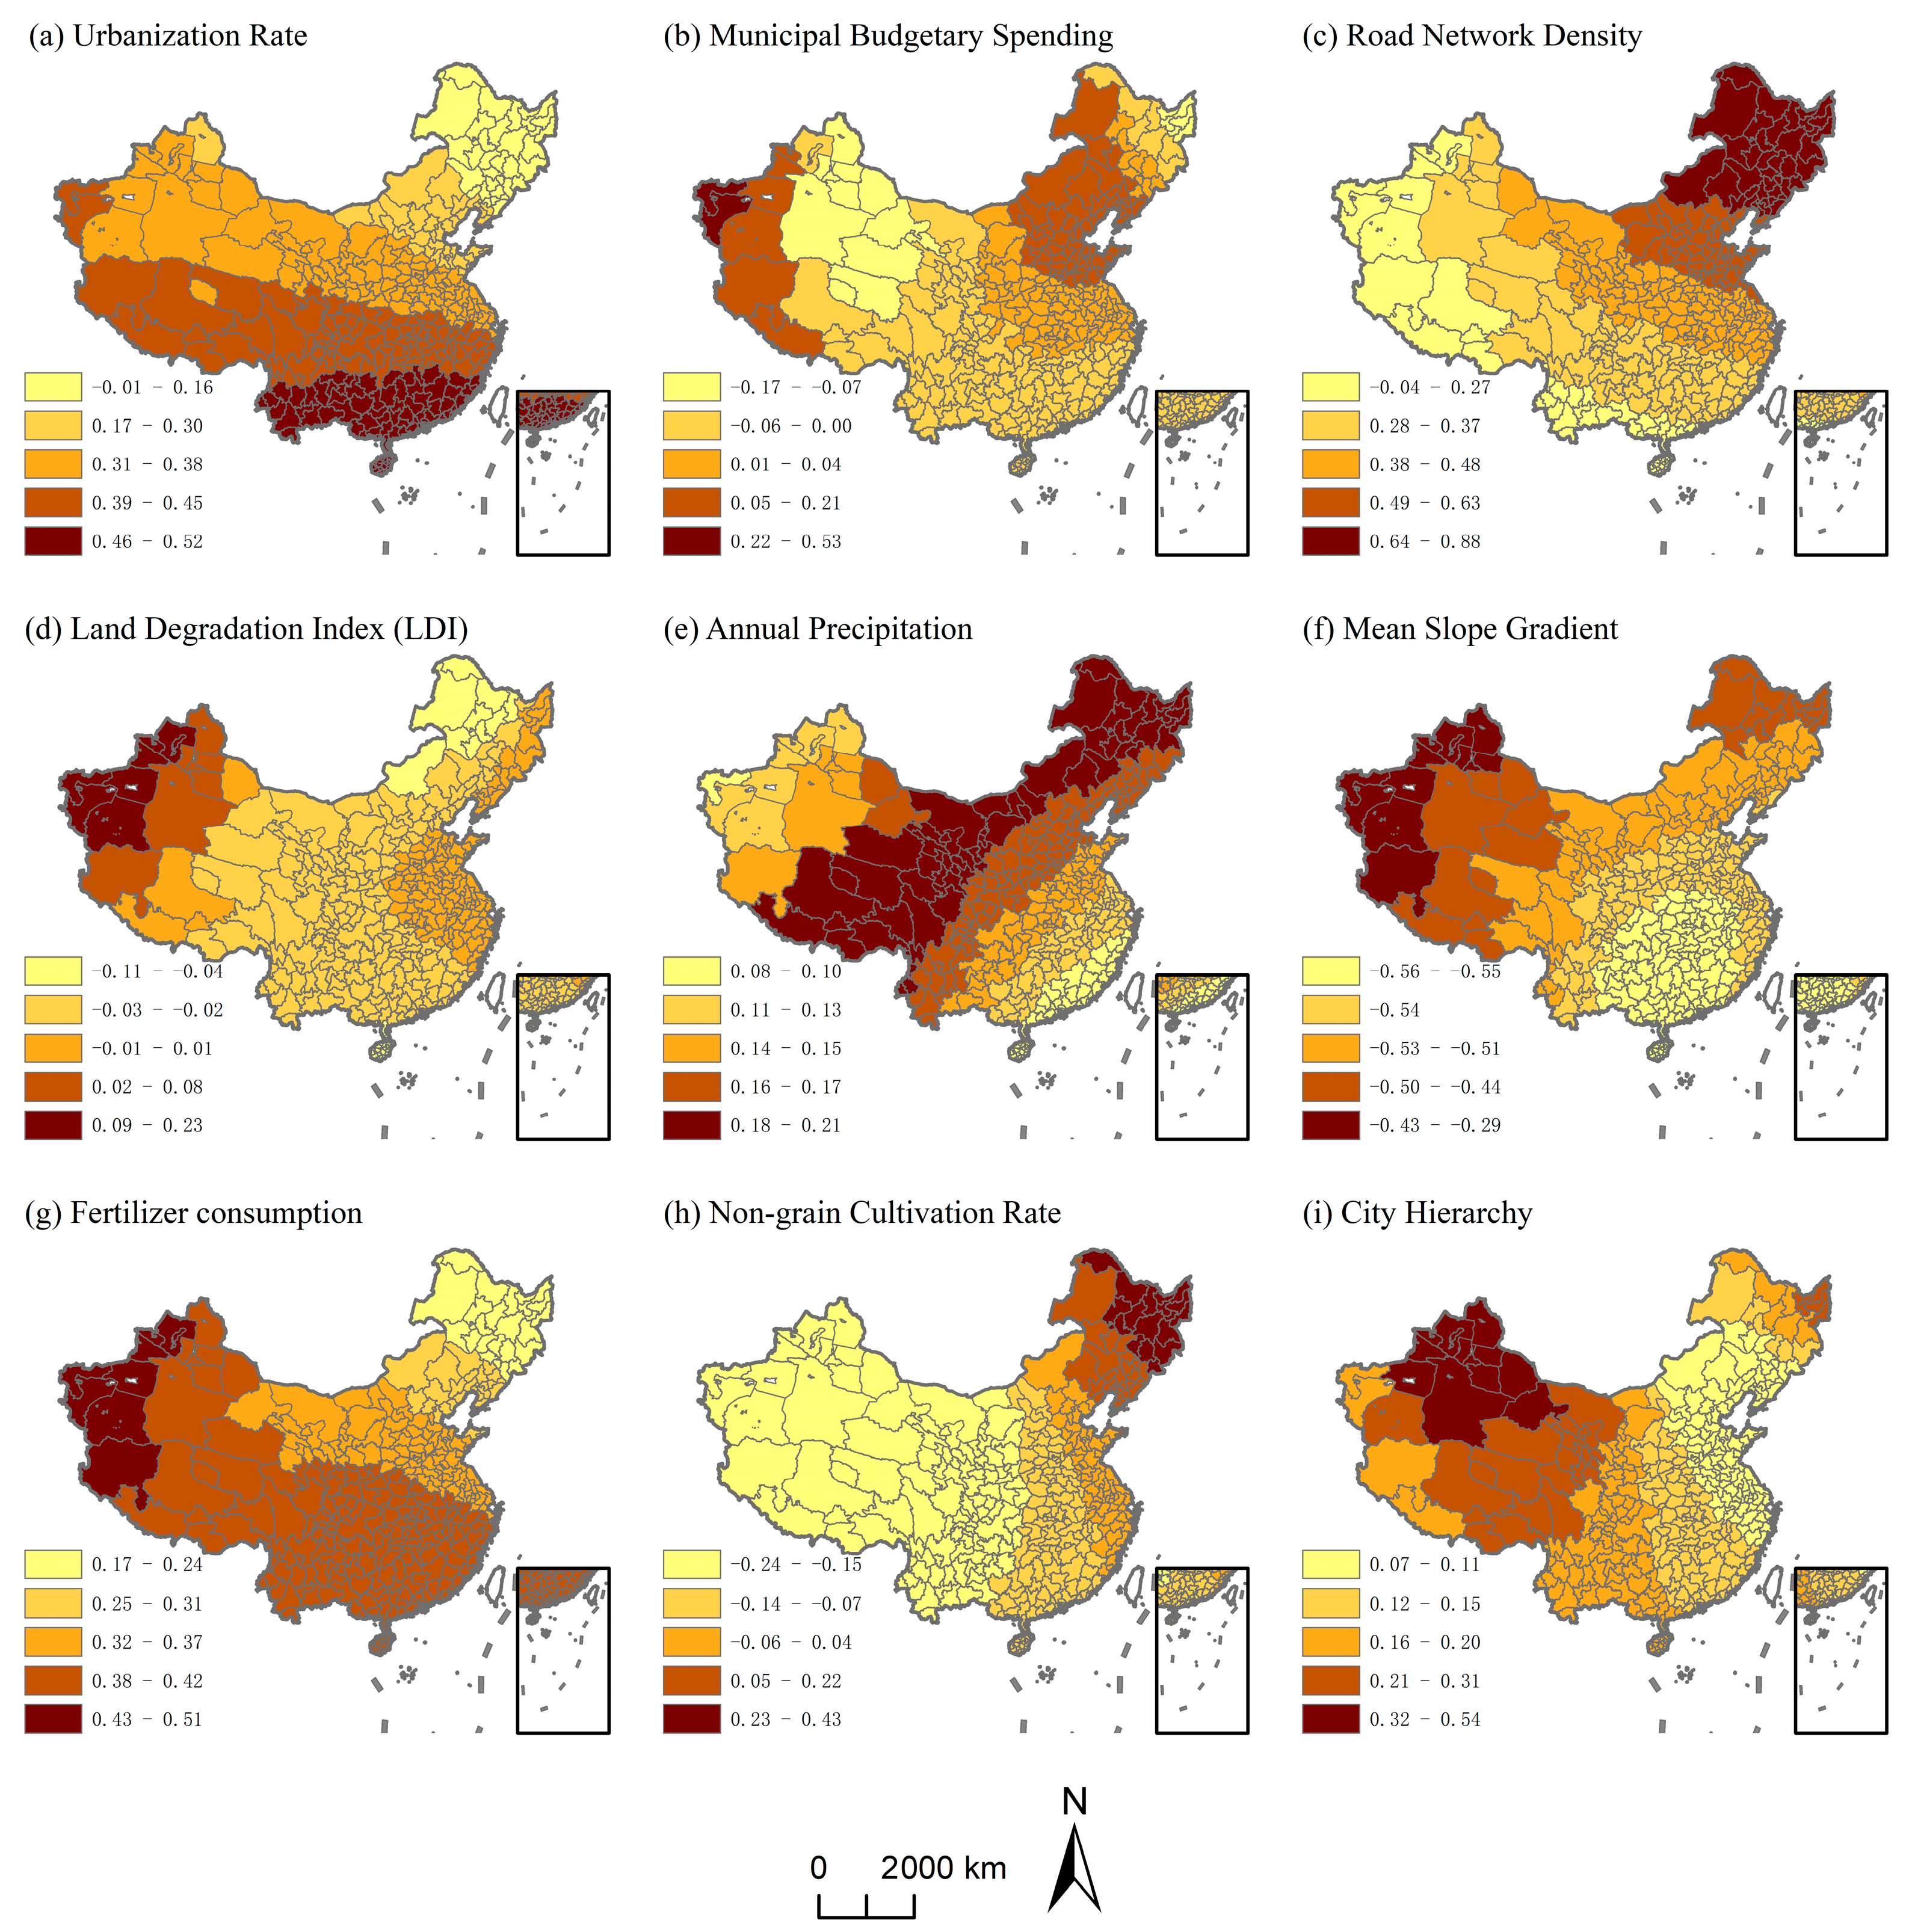
The GWR results (
Figure 13) show that, among socioeconomic factors, the urbanization rate exerts a promoting effect on CON, with the intensity of this effect increasing gradually from northeastern to southern China. Municipal budgetary spending demonstrates both inhibitory and promoting effects on CON: inhibitory effects are concentrated at the junction of Tibet, Qinghai, and Xinjiang and surrounding areas, while promoting effects dominate in other regions—consistent with the pattern observed for DEP. Road network density has a strong promoting influence on CON in northeastern China, with the effect diminishing radially outward.
Regarding natural conditions, annual precipitation promotes both the expansion of construction land and the occupation of cropland. This promoting effect is spatially distributed along both sides of the Heihe–Tengchong line. Average slope generally inhibits CON nationwide, with the strongest inhibitory effects occurring in central and southern China. The spatial effect of the land degradation index (LDI) on CON mirrors that on DEP, exhibiting a dual influence: it promotes CON in western Xinjiang while exerting the strongest inhibitory effect in the Greater Khingan Mountains.
In terms of agricultural production conditions, fertilizer consumption promotes CON across the country, with the strongest effect in the west and the weakest in the northeast. The promoting effect is also stronger in southern China than in the north. The non-grain production rate displays a dual effect: it is inhibitory in most regions—including northwestern China, Tibet, southwestern, central, southern, and northern China—and this inhibitory effect extends to the Shanhaiguan region. A promoting effect only emerges in northeastern China.
Regarding policy factors, the city hierarchy positively influences CON, with the strongest effects observed in Xinjiang and much of western China, and the weakest effects in the Bohai Rim region.
In summary, different driving factors exhibit both similarities and differences in their spatial mechanisms influencing DEP and CON. Municipal budgetary spending, precipitation, slope, fertilizer use, and city hierarchy show similar patterns for both indicators. In contrast, the intensity and spatial distribution of urbanization, road network density, LDI, and the non-grain rate differ between DEP and CON. Notably, urbanization has an opposite effect on DEP and CON, while other factors such as road density, LDI, and the non-grain rate show similar directions of influence but diverge in spatial distribution.
4. Discussion
4.1. The Evolution of Spatio-Temporal Patterns Reveals the Changes in Policies for Farmland Protection
This study reveals clear spatiotemporal heterogeneity in the conflict between construction land expansion and cropland protection in China. By employing DEP and CON as key indicators, we identified distinct trends at both provincial and city levels, shaped by interactions between policy shifts, economic development, and geographic constraints.
At the provincial level, cropland changes over time closely follow shifts in national land policies. The period between 2004 and 2010—marked by limited regulation and enforcement—saw substantial fluctuations in cropland area, particularly due to illegal land occupation. The introduction of stricter policies in 2009, such as the “compensation before occupation” rule [
64,
65], brought more consistency and control to land-use practices. Spatially, the east–west divergence in cropland trends reflects China’s broader economic landscape: eastern regions, with stronger economic activity, experience greater cropland loss, whereas western regions assume more of the national cropland protection responsibility, often through reclamation.
At the city level, intra-provincial disparities became more apparent. Economically developed cities within provinces often exhibit slower cropland loss because of their reliance on purchasing cropland quotas from underdeveloped areas, reinforcing regional inequalities. Similarly, as major urban agglomerations approached their land capacity limits, construction land and industry began to spill over to surrounding areas, transforming cities from “siphons” into “radiators” of development [
66].
4.2. The Driving Factors of DEP and CON Are in Opposition but Unified
Temporal analysis revealed that DEP has generally declined, suggesting a reduction in excessive cropland occupation. CON initially rose but then declined after 2017, coinciding with heightened emphasis on ecological policy following the 19th National Congress. Spatially, high DEP and CON values were concentrated in the North China Plain and Chengdu Plain—regions characterized by dense populations, intensive agriculture, and limited land reserves. In contrast, the Northeast Plain presented high DEP values but relatively low CON values due to ample cropland, whereas the southeastern coastal region presented relatively high CON values due to the fragmented terrain, intensive urbanization, and limited capacity for cropland reclamation.
The fundamental drivers of DEP and CON differ in nature. DEP reflects the demand side—how much new construction land comes from cropland—while CON reflects the supply side—how much cropland is lost to construction. DEP is more sensitive to urban expansion patterns and economic logic, whereas CON is more influenced by cropland resilience, land policy, and ecological constraints.
At the national scale, the opposing effects of urbanization rate on DEP and CON stem from regional differences in land development patterns during urbanization. As urbanization progresses, some areas support urban growth by utilizing existing construction land and improving land-use efficiency, thereby reducing reliance on farmland conversion and lowering DEP. In contrast, rapidly expanding regions experience strong demand for new construction land, often directly encroaching on farmland, which raises CON by making farmland loss largely attributable to urban development. The coexistence of these two mechanisms across different regions results in a nationwide pattern where urbanization suppresses DEP but promotes CON, creating a seemingly contradictory effect.
4.3. Suggestions for Differentiated Policies
Given that the increase in both DEP and CON can lead to significant impacts on food security and ecosystem services, designing appropriate land-use planning strategies is crucial for achieving coordinated development between humans and land. Based on the spatiotemporal patterns of DEP and CON, this study identifies the North China Plain, Northeast China Plain, Sichuan Basin, Hexi Corridor, and Southeast Coastal Area as core zones of human–land conflict. Using GWR results as supporting evidence and considering the current territorial spatial plans of each region, this study provides differentiated policy recommendations.
GWR results show that urbanization rate, land degradation index, average slope, and non-grain production rate tend to suppress DEP. For CON, however, the influencing factors are more diverse and show dual effects. At the national level, a general strategy to reduce the conversion of farmland to construction land could include strict control over the scale of construction land and rational delineation of permanent basic farmland protection zones. This study also finds that reducing the use of chemical fertilizers can help lower both DEP and CON.
In the North China Plain, both DEP and CON are at high levels. The region is densely populated and has a high proportion of farmland. GWR results show that for DEP, the coefficients for urbanization rate and average slope are around −0.2, for land degradation index around −0.1, and for non-grain rate around −0.4. For CON, the urbanization rate coefficient reaches 0.3. The most significant factor affecting the North China Plain is the non-grain rate. However, over-cultivation of non-grain crops may compromise food security. Therefore, the most effective approach to reduce farmland conversion in this region is to increase the profitability of grain cultivation, supported by government subsidies.
The Northeast China Plain exhibits similar characteristics to the North China Plain, with a key difference being that land degradation has a significantly stronger effect on DEP in this region. Meanwhile, the influence of non-grain production on DEP is relatively weak. For CON, road network density shows a strong positive effect, with a coefficient exceeding 0.6, followed by chemical fertilizer use (0.2), with the non-grain rate being the highest in the country. Overall, CON coefficients are more pronounced than DEP in this region, indicating that attention should be paid to controlling farmland loss. The region should focus on the strict designation of permanent basic farmland, preventing encroachment by transportation infrastructure, and enhancing ecological conservation to prevent soil erosion.
In the Sichuan Basin, especially the Chengdu Plain, the influence of urbanization and slope on DEP drops to around −0.15, while non-grain production exhibits the strongest suppressive effect on DEP, with a coefficient of −0.6. For CON, chemical fertilizer use has a coefficient of 0.4, and non-grain production is −0.2. Therefore, for cities surrounding the Chengdu Plain, it is important to control fertilizer usage and enhance subsidies for grain crops.
The Hexi Corridor is a special region—it is both an important grain production zone and an ecologically fragile area. Agricultural activities here must prioritize ecological protection, which is confirmed by the GWR results. In addition to urbanization and economic indicators, precipitation exerts a strong promoting effect on both DEP and CON, reflecting the area’s arid geographic setting. Fertilizer use also has a higher impact on DEP compared to other major grain-producing regions, with a coefficient exceeding 0.4. Meanwhile, non-grain production shows the most pronounced suppressive effect on DEP nationwide. For CON, general public expenditure appears to suppress farmland loss, while the non-grain rate also plays a significant mitigating role. Based on these findings, the most effective strategy to curb farmland-to-construction conversion in the Hexi Corridor is to increase public investment, which could support infrastructure development, ecological protection, and farmer subsidies—ultimately enhancing both ecological resilience and farming enthusiasm.
The Southeast Coastal Area is another key region where construction land often occupies farmland. This results from the combination of rapid economic growth and mountainous terrain. After decades of development, most flat lands have been occupied by construction or designated as basic farmland. This is supported by the GWR results, where indicators like public expenditure and road density—reflecting infrastructure-driven urban expansion—have minimal effects on DEP. Land degradation and precipitation also have limited influence, while slope emerges as the dominant natural constraint. For CON, similar patterns are observed. However, urbanization rate significantly promotes CON in southern coastal areas, with a coefficient reaching 0.5. Slope shows a negative effect, with a coefficient of −0.5. In summary, CON is more pronounced than DEP in this region. Thus, attention should focus on controlling farmland loss, which can be addressed by improving rural welfare, slowing urbanization, and promoting terraced or hillside farming to increase farmland quality.
These findings provide a deeper understanding of how cropland loss is shaped by regionally distinct development patterns, land-use efficiency, and urbanization intensity. The multiscale evidence demonstrates that one-size-fits-all policies may overlook important spatial differences. These insights highlight the need for region-specific planning strategies, while also offering empirical support for improving national cropland protection efforts in the context of accelerating urban expansion.
4.4. Limitations and Future Directions
This study has several limitations. First, although national land-use datasets were employed, we found that in some parts of northwest China, land-use types such as cropland and construction land changed dramatically between years. These shifts often appear to be linked with events like flooding and are especially evident in regions with sparse land-use distribution, potentially leading to exaggerated interpretations of change. Second, due to limitations in data availability, the study did not analyze land-use dynamics before 2000, which may result in an incomplete understanding of long-term patterns and the influence of earlier policies. Third, although the study focused on spatial outcomes, recent progress in China’s national spatial planning has produced policy texts at multiple levels of government. These documents offer rich qualitative insights that could be integrated with spatial modeling in future work to examine how planning narratives and regulatory intent shape land-use transitions. Addressing these issues, including event-driven variability, long-term historical continuity, and the incorporation of policy text analysis, will be essential for enhancing the explanatory power and robustness of future land-use research.
5. Conclusions
Socioeconomic indicators generally exert a stronger influence than natural conditions do. The key drivers include the urbanization rate, land degradation, fertilizer use, city hierarchy, road density and terrain, non-grain conversion rate, and precipitation. In areas with high urbanization rates, land development has shifted from outward expansion to internal optimization, thereby reducing pressure on croplands. This transition has been reinforced by strict farmland protection policies, particularly in coastal southern China. Land degradation also plays a critical role, with regional variations shaping outcomes: water erosion in the southwest and wind erosion in the northwest often trigger cropland abandonment, feeding into a cycle of construction land expansion [
67,
68]. In contrast, ecologically sensitive northeastern China experiences both cropland loss and construction constrained by environmental regulation. Fertilizer use reflects underlying land quality and land-use pressures—poor soil in western regions requires heavy fertilizer input, which contributes to land pollution and abandonment, increasing susceptibility to construction takeover [
69]. Moreover, land used for high-value cash crops, which offer greater economic returns, tends to be more resistant to conversion. City hierarchy further influences land use; provincial capitals and higher-tier cities possess more political leverage and land-use autonomy, facilitating faster urban expansion and cropland conversion [
46]. Road network density and terrain characteristics also matter: in sparsely populated regions, improved transportation accelerates urban sprawl, but the impact varies by geography—road development and slope play different roles in northwestern and northeastern China due to differing land endowments. Similarly, the non-grain conversion rate affects land preservation, as areas that shift from grain to cash crops generally exhibit better cropland retention due to higher land rents, particularly where agricultural conditions are less favorable. Finally, precipitation supports both agricultural productivity and population growth, contributing to increased construction land use (ACU), although its impact varies by region; southeastern areas show diminishing marginal effects, whereas in the less-developed west, improved agricultural conditions continue to stimulate urban expansion.
The divergence in the DEP and CON trends across regions highlights the importance of scale-sensitive, policy-responsive land management strategies. Spatial inequalities driven by administrative systems, economic gradients, and ecological constraints must be addressed through more refined land-use planning and governance mechanisms. Ultimately, managing the human–land contradiction requires balancing urban development needs with ecological integrity and food security—especially in regions where these goals are most at odds.
In summary, this study contributes to the literature by developing a dual-indicator framework (DEP and CON) and applying it across multiple spatial scales to reveal the asymmetrical relationship between cropland loss and construction land expansion. This approach enables a deeper understanding of the mechanisms underlying cropland transformation across heterogeneous regions. The results provide timely and practical insights for strengthening region-specific land management strategies, balancing urban development with agricultural sustainability, and improving nationwide farmland protection under rapid urbanization.
