
Study on Urban System Relationships and Resilience Promotion Strategies in Underdeveloped Mountainous Areas Based on Social Network Analysis: A Case Study of Qiandongnan Miao and Dong Autonomous Prefecture

Abstract
1. Introduction
2. Research Object and Research Method
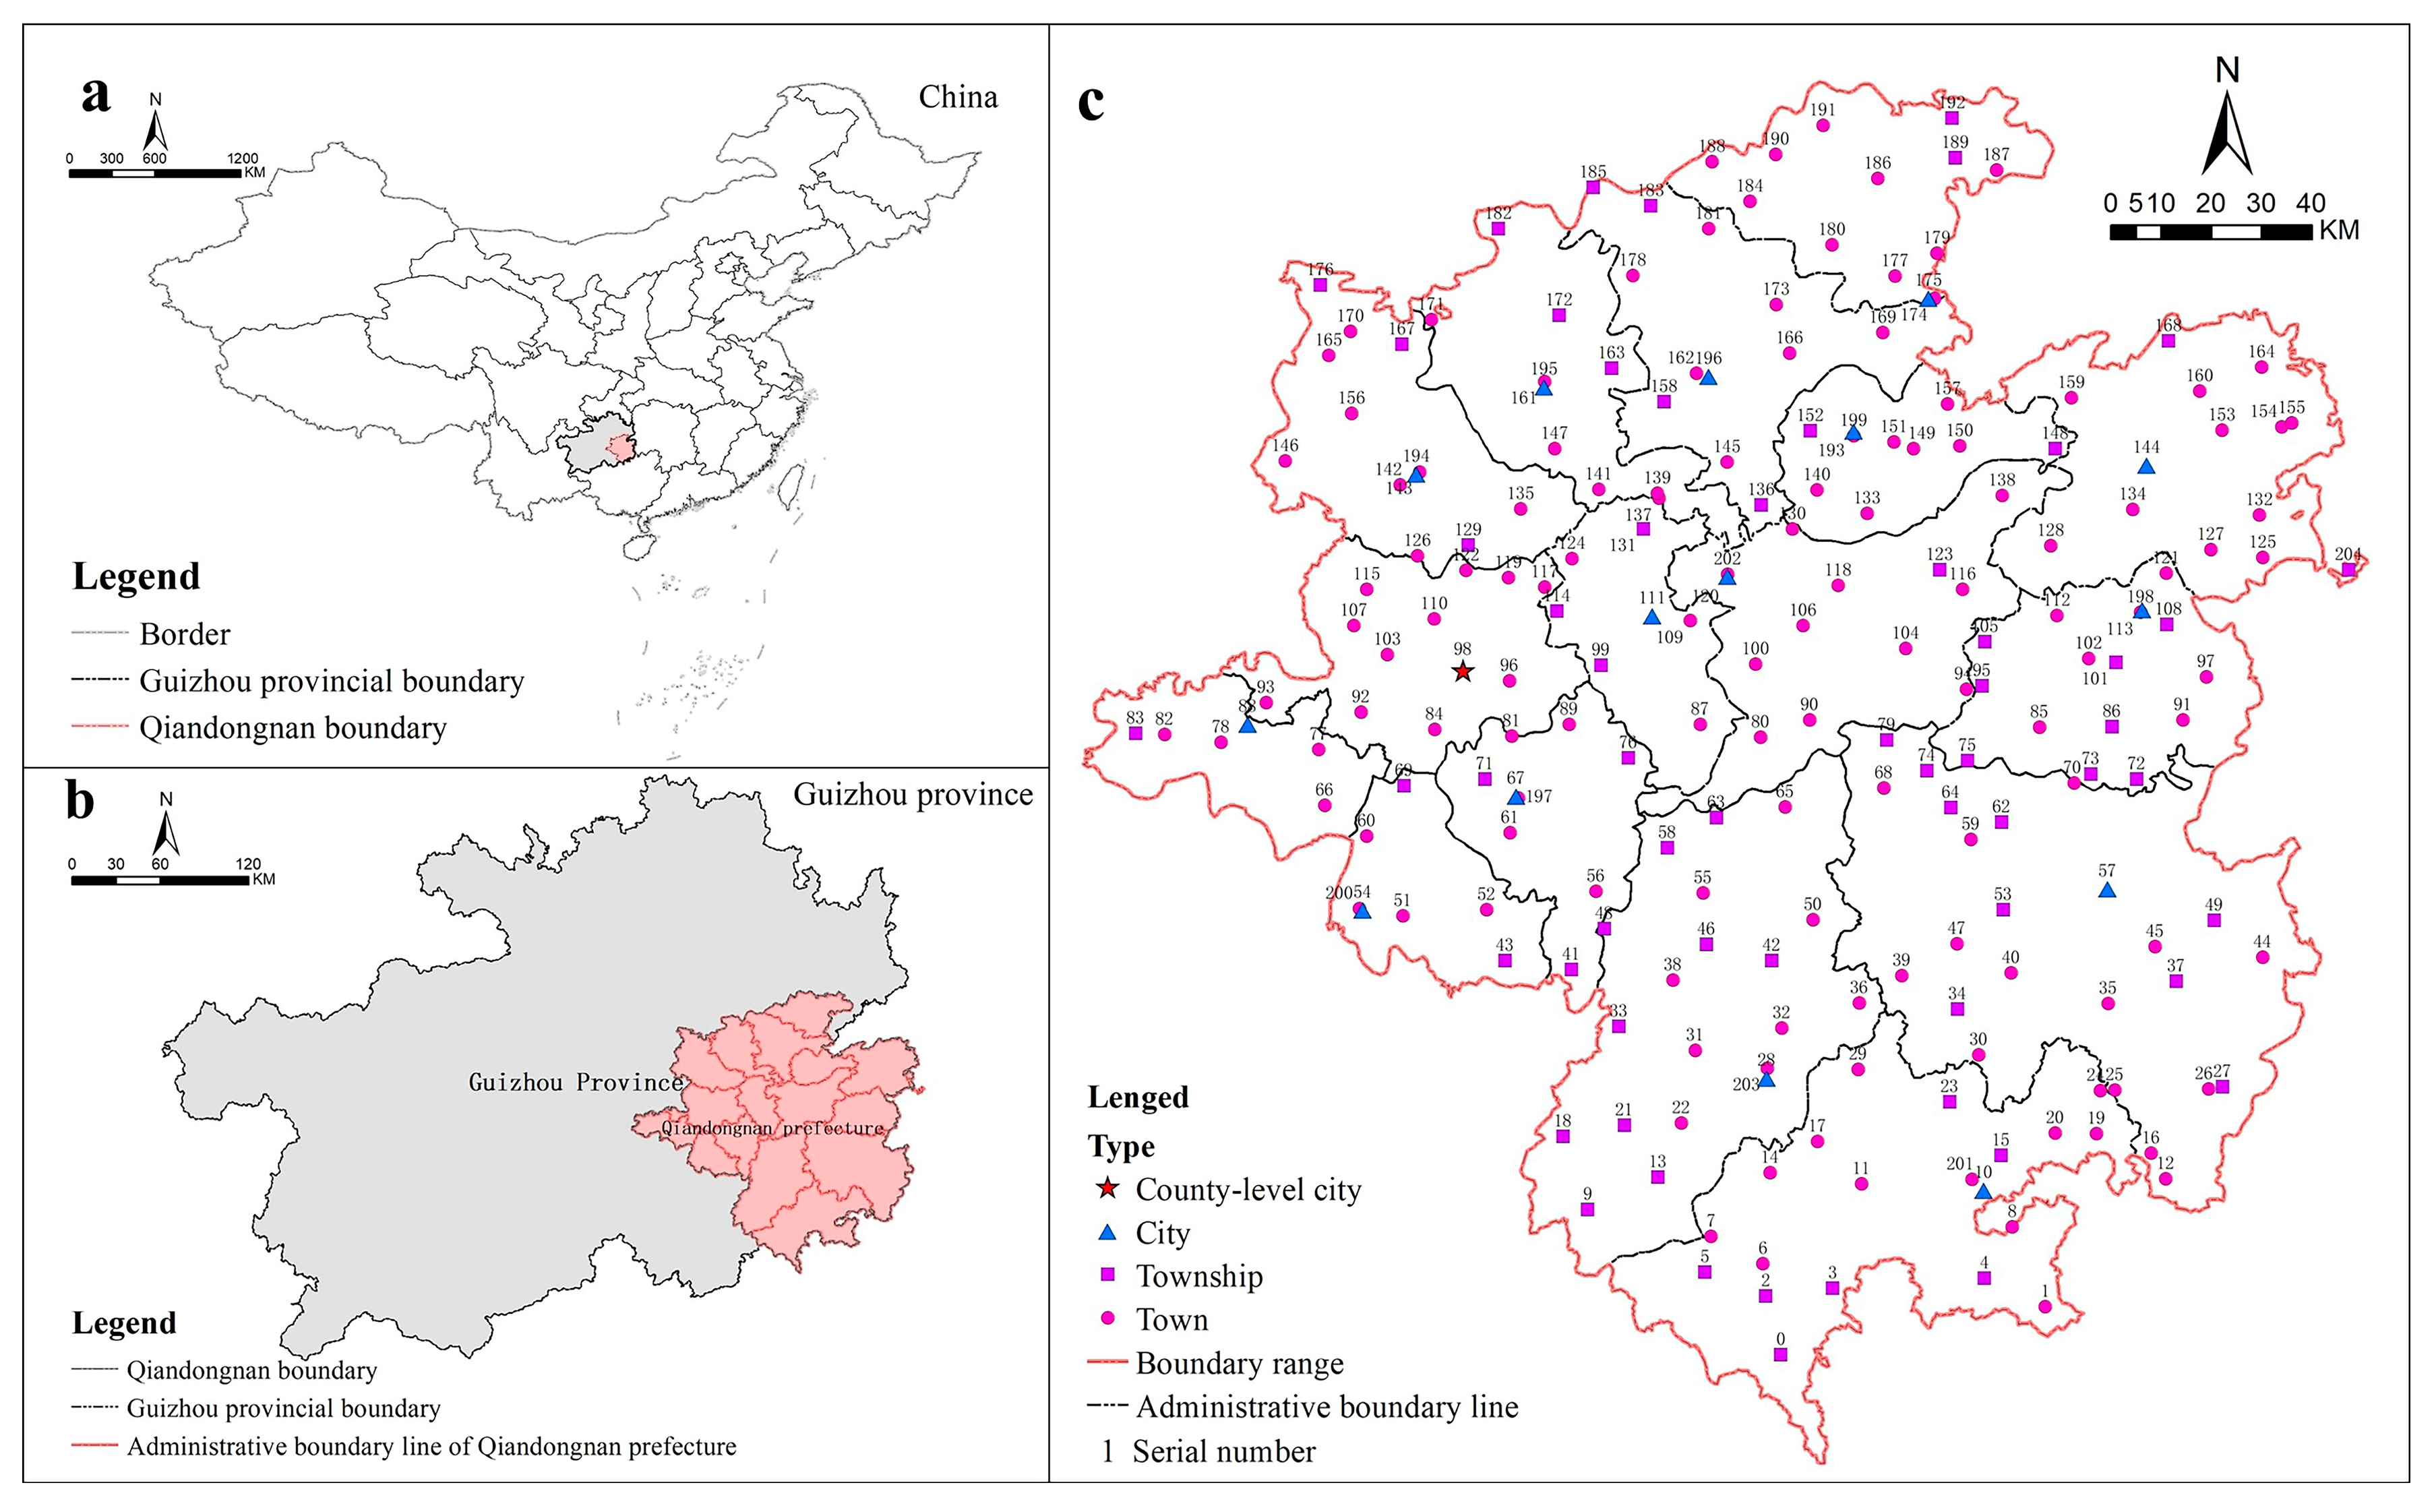
2.1. Research Object
2.2. Research Method
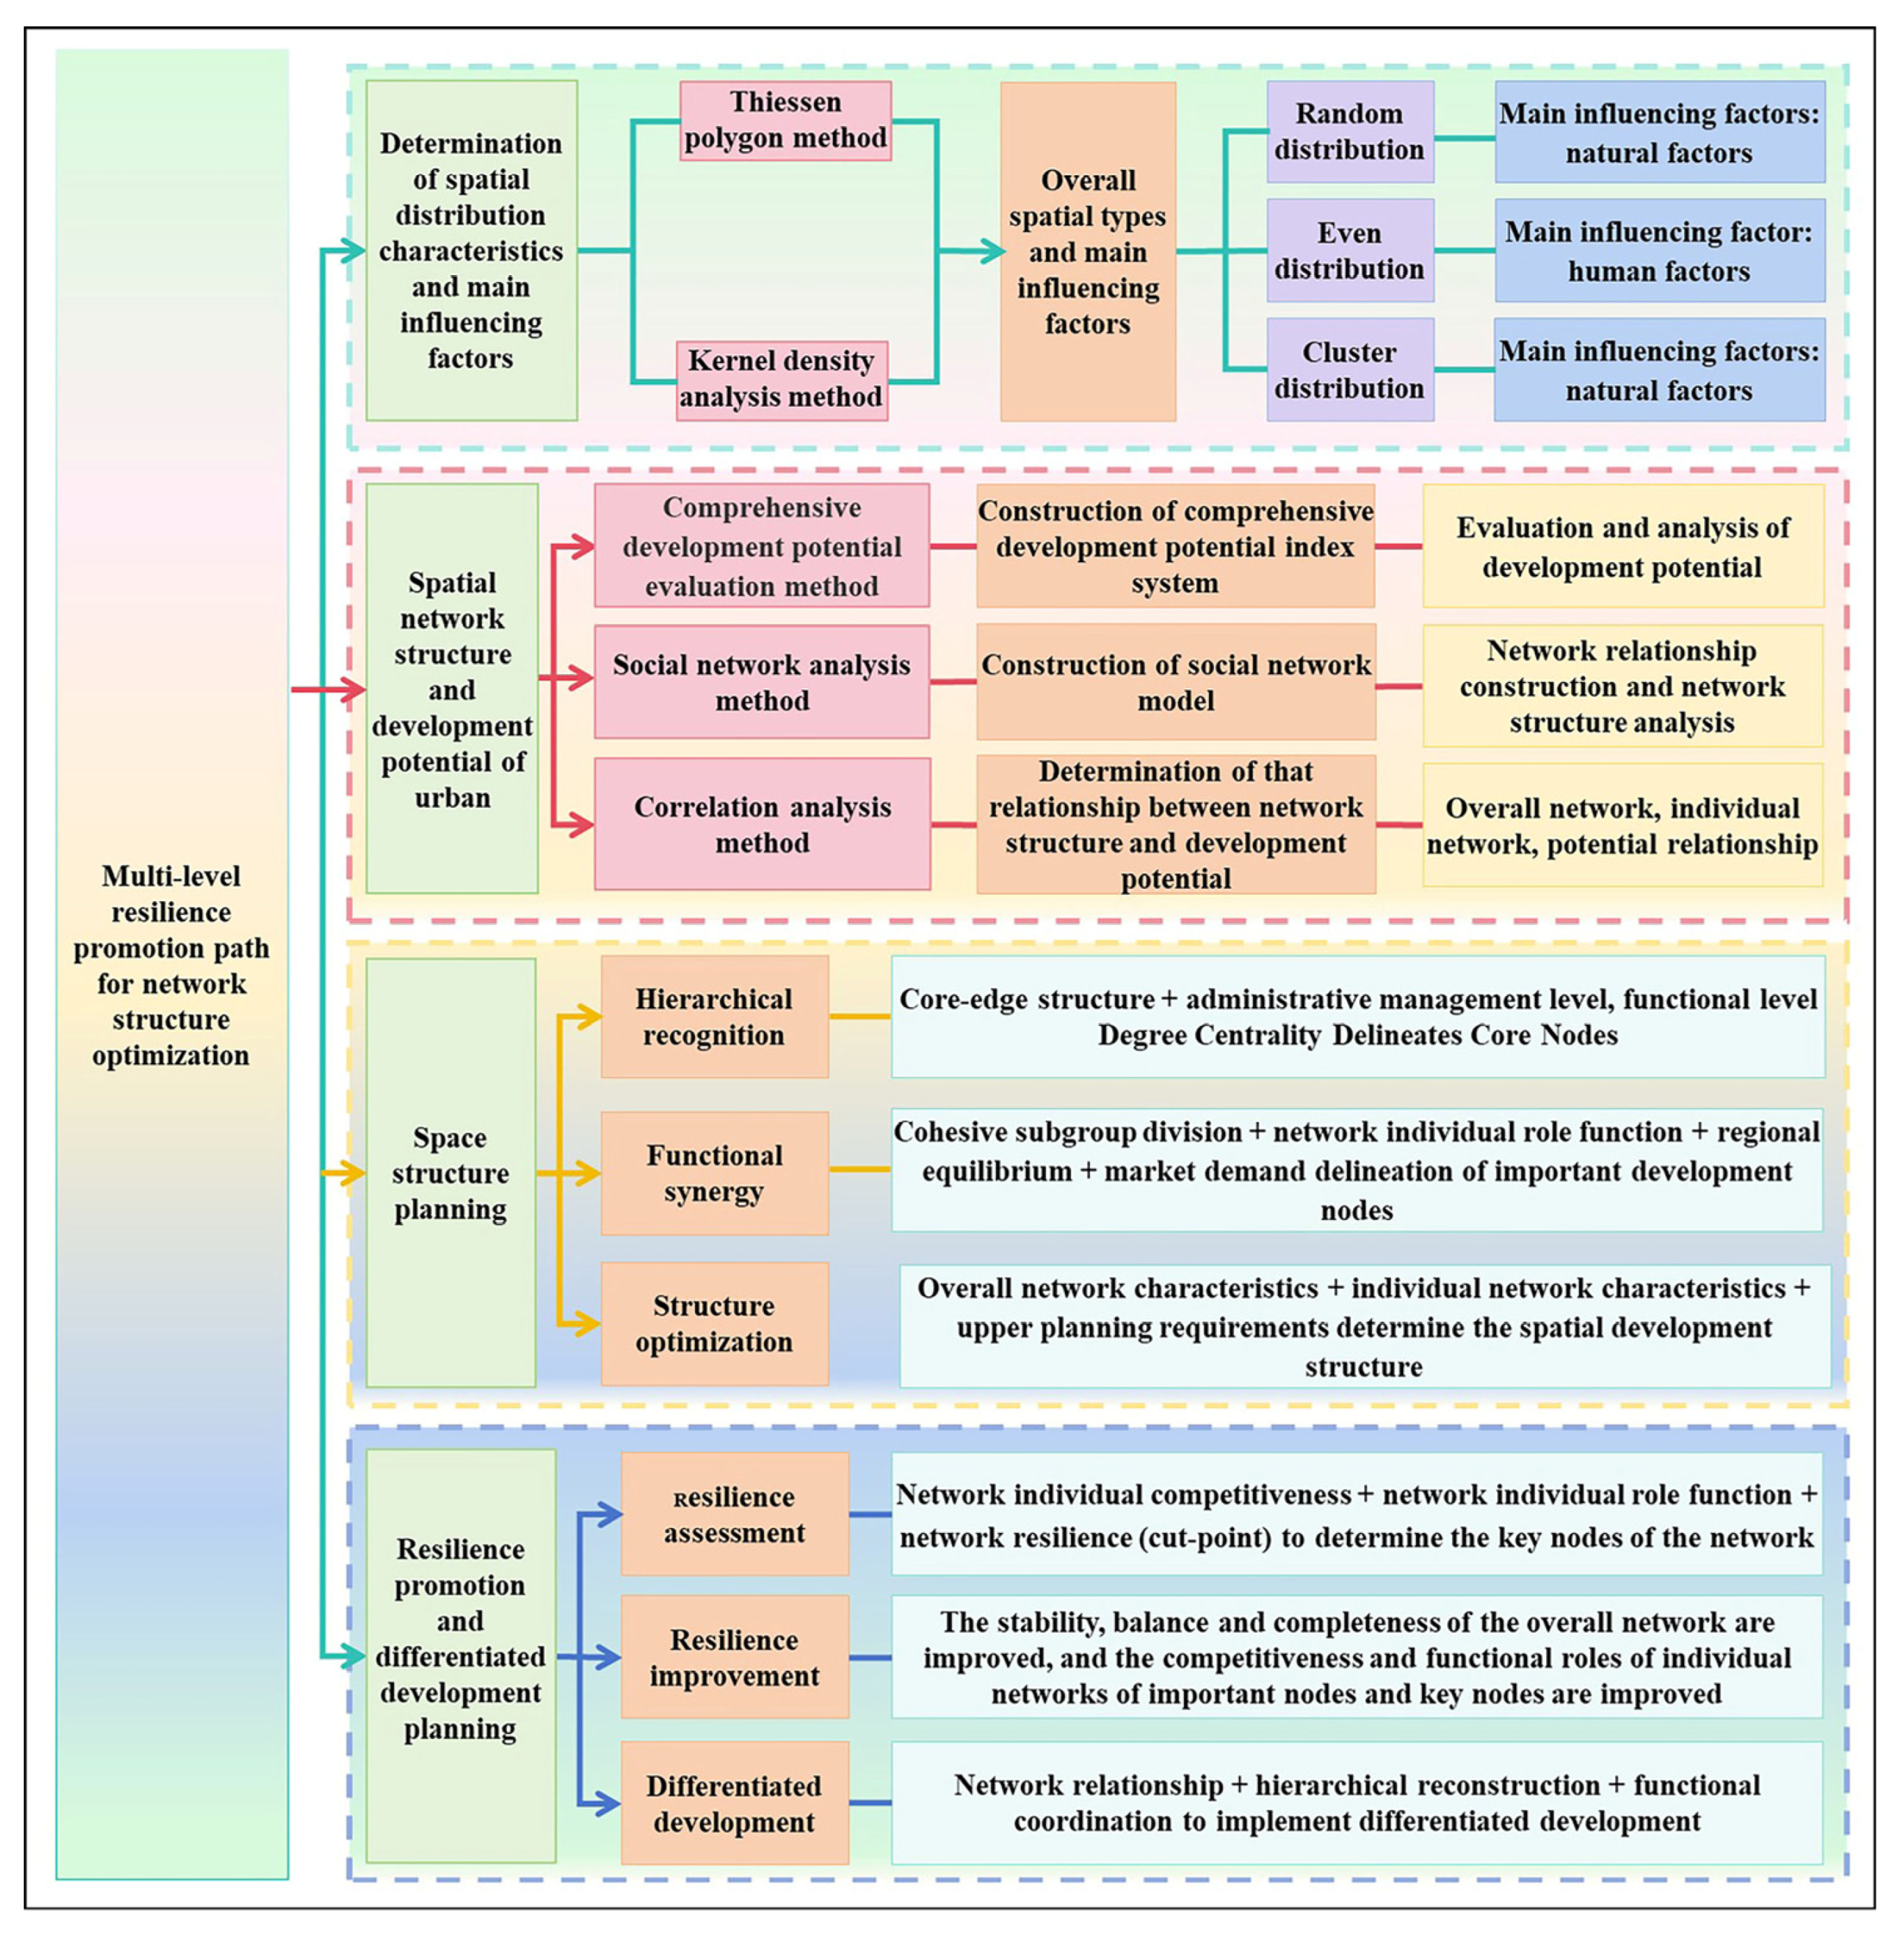
2.2.1. Overall Research Framework
2.2.2. Urban Spatial Distribution Analysis Method
- (1)
- Thiessen polygon method
- (2)
- Kernel density analysis method
2.2.3. Evaluation Method for Urban Development Potential
2.2.4. Analysis Method for Urban System Relationships
- (1)
- Social Network Analysis Method

| Indicator | Definitions |
|---|---|
| Cut-point | A “cut-point” is a special node whose removal leads to a break in the network structure and the formation of independent subgraphs. The number of such nodes is positively correlated with the vulnerability of the network structure, and the greater the share of cut-points, the lower the stability of the network as a whole [26]. |
| Small-world characteristics | If the network is large but sparsely connected, with no core hub nodes, and exhibits a high degree of clustering characteristics, then such a network is called a small world. The shorter the average path length and the higher the clustering coefficient, the more significant the small-world characteristics are, and such small-world characteristics tend to be negatively correlated with network completeness [27]. |
| Network density | Network density reflects the tightness of connections between nodes and is calculated as the ratio of the actual number of connections to the maximum possible number of connections. The lower the density, the looser the network, the weaker the connections between nodes, and the weaker the network’s completeness [26]. |
| Cohesive subgroups—Block model | Block model analysis achieves spatial clustering by investigating the internal and external correlation characteristics of subgroups, dividing multi-level cohesive subgroups, and identifying the network function roles of each plate based on information transmission and reception [27]. |
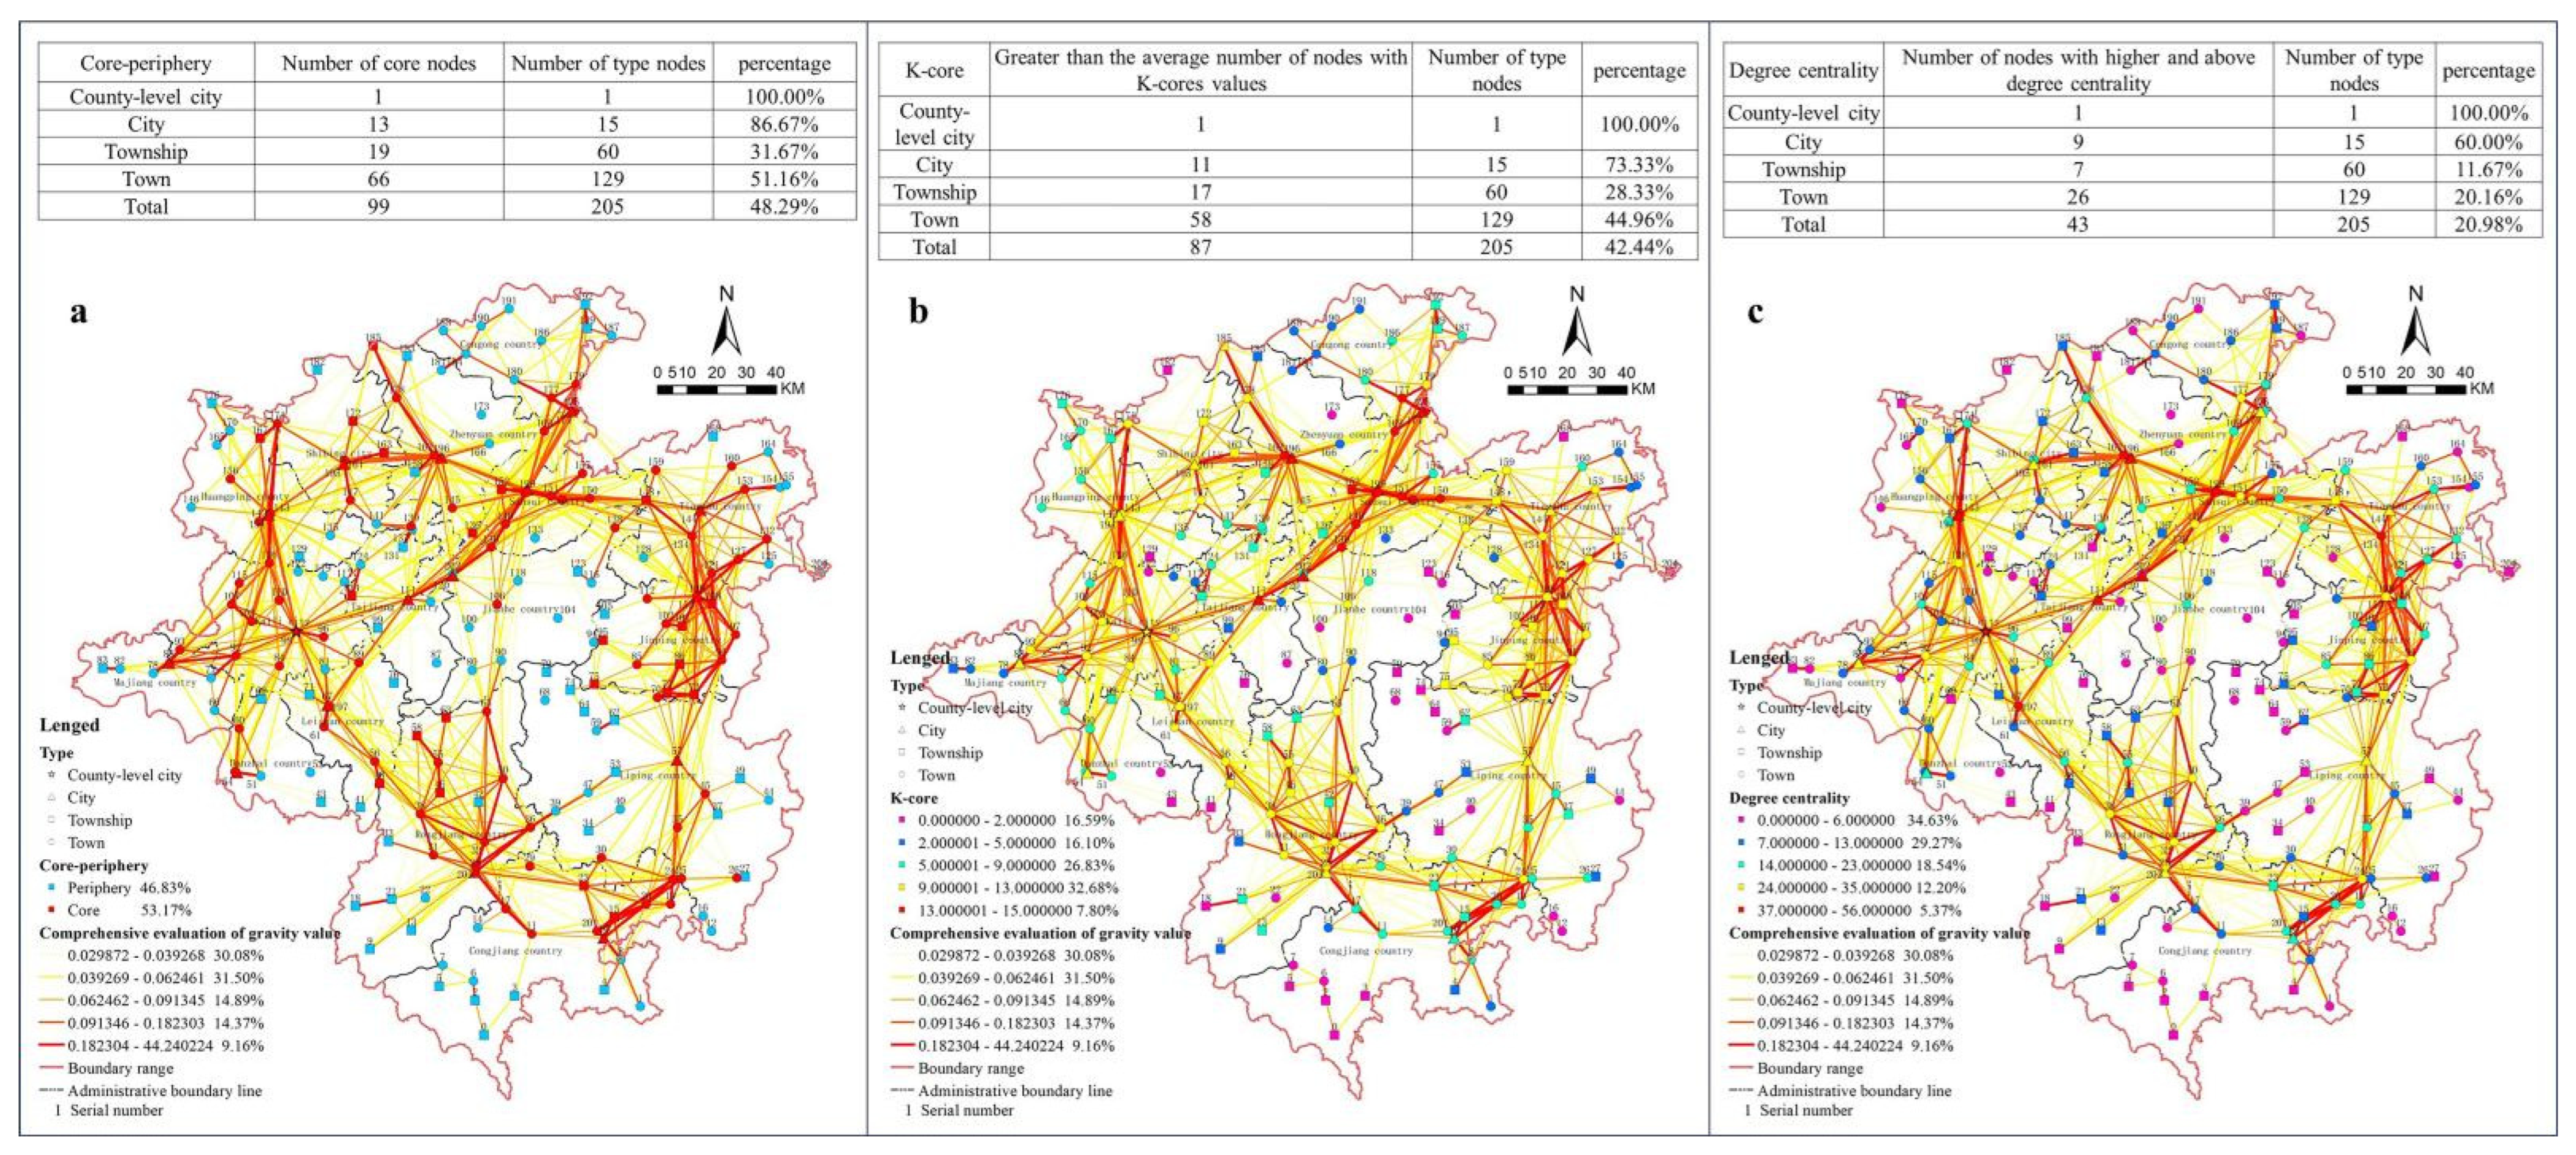
| K-core | The k-kernel indicates that each node in the subgraph is connected to at least k other nodes. By calculating the k-core with different K values (1, 2, 3…), the local stability of the network can be evaluated [28]. |
| Core-periphery | The “Core-periphery” model can distinguish between the core area and the edge area of the network structure. Nodes with an average core value or above can be used as core nodes, which are in a dominant position in the network structure [29]. |
| Degree centrality | Degree centrality is a measure of nodes’ ability to control network resources, and its value reflects the importance level of the nodes. When the number of nodes is evenly distributed in space, the network structure tends to be balanced [30]. |
| Structural holes | A structural hole refers to the connection gap between non-redundant nodes, and the nodes occupying this position have competitive advantages. Through the quantitative evaluation of three dimensions (efficiency, efficiency, and constraint), when a node has high efficiency and low constraint, its structural hole advantage is more obvious, and its development potential is greater [31]. |
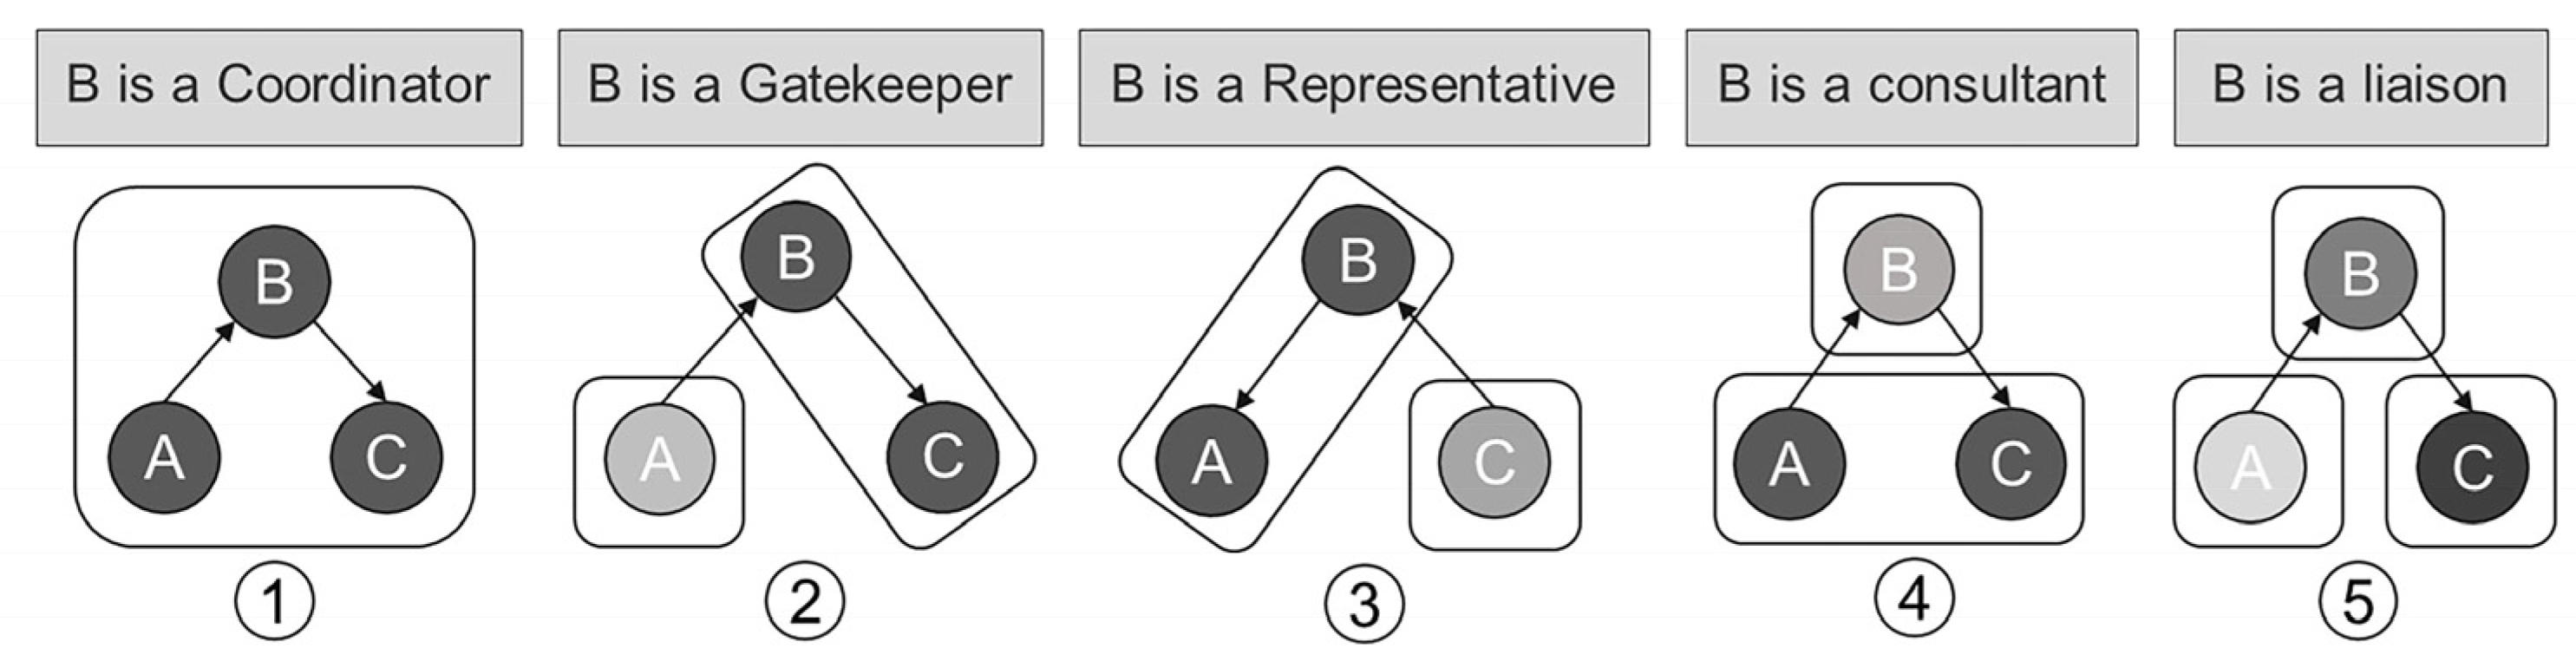
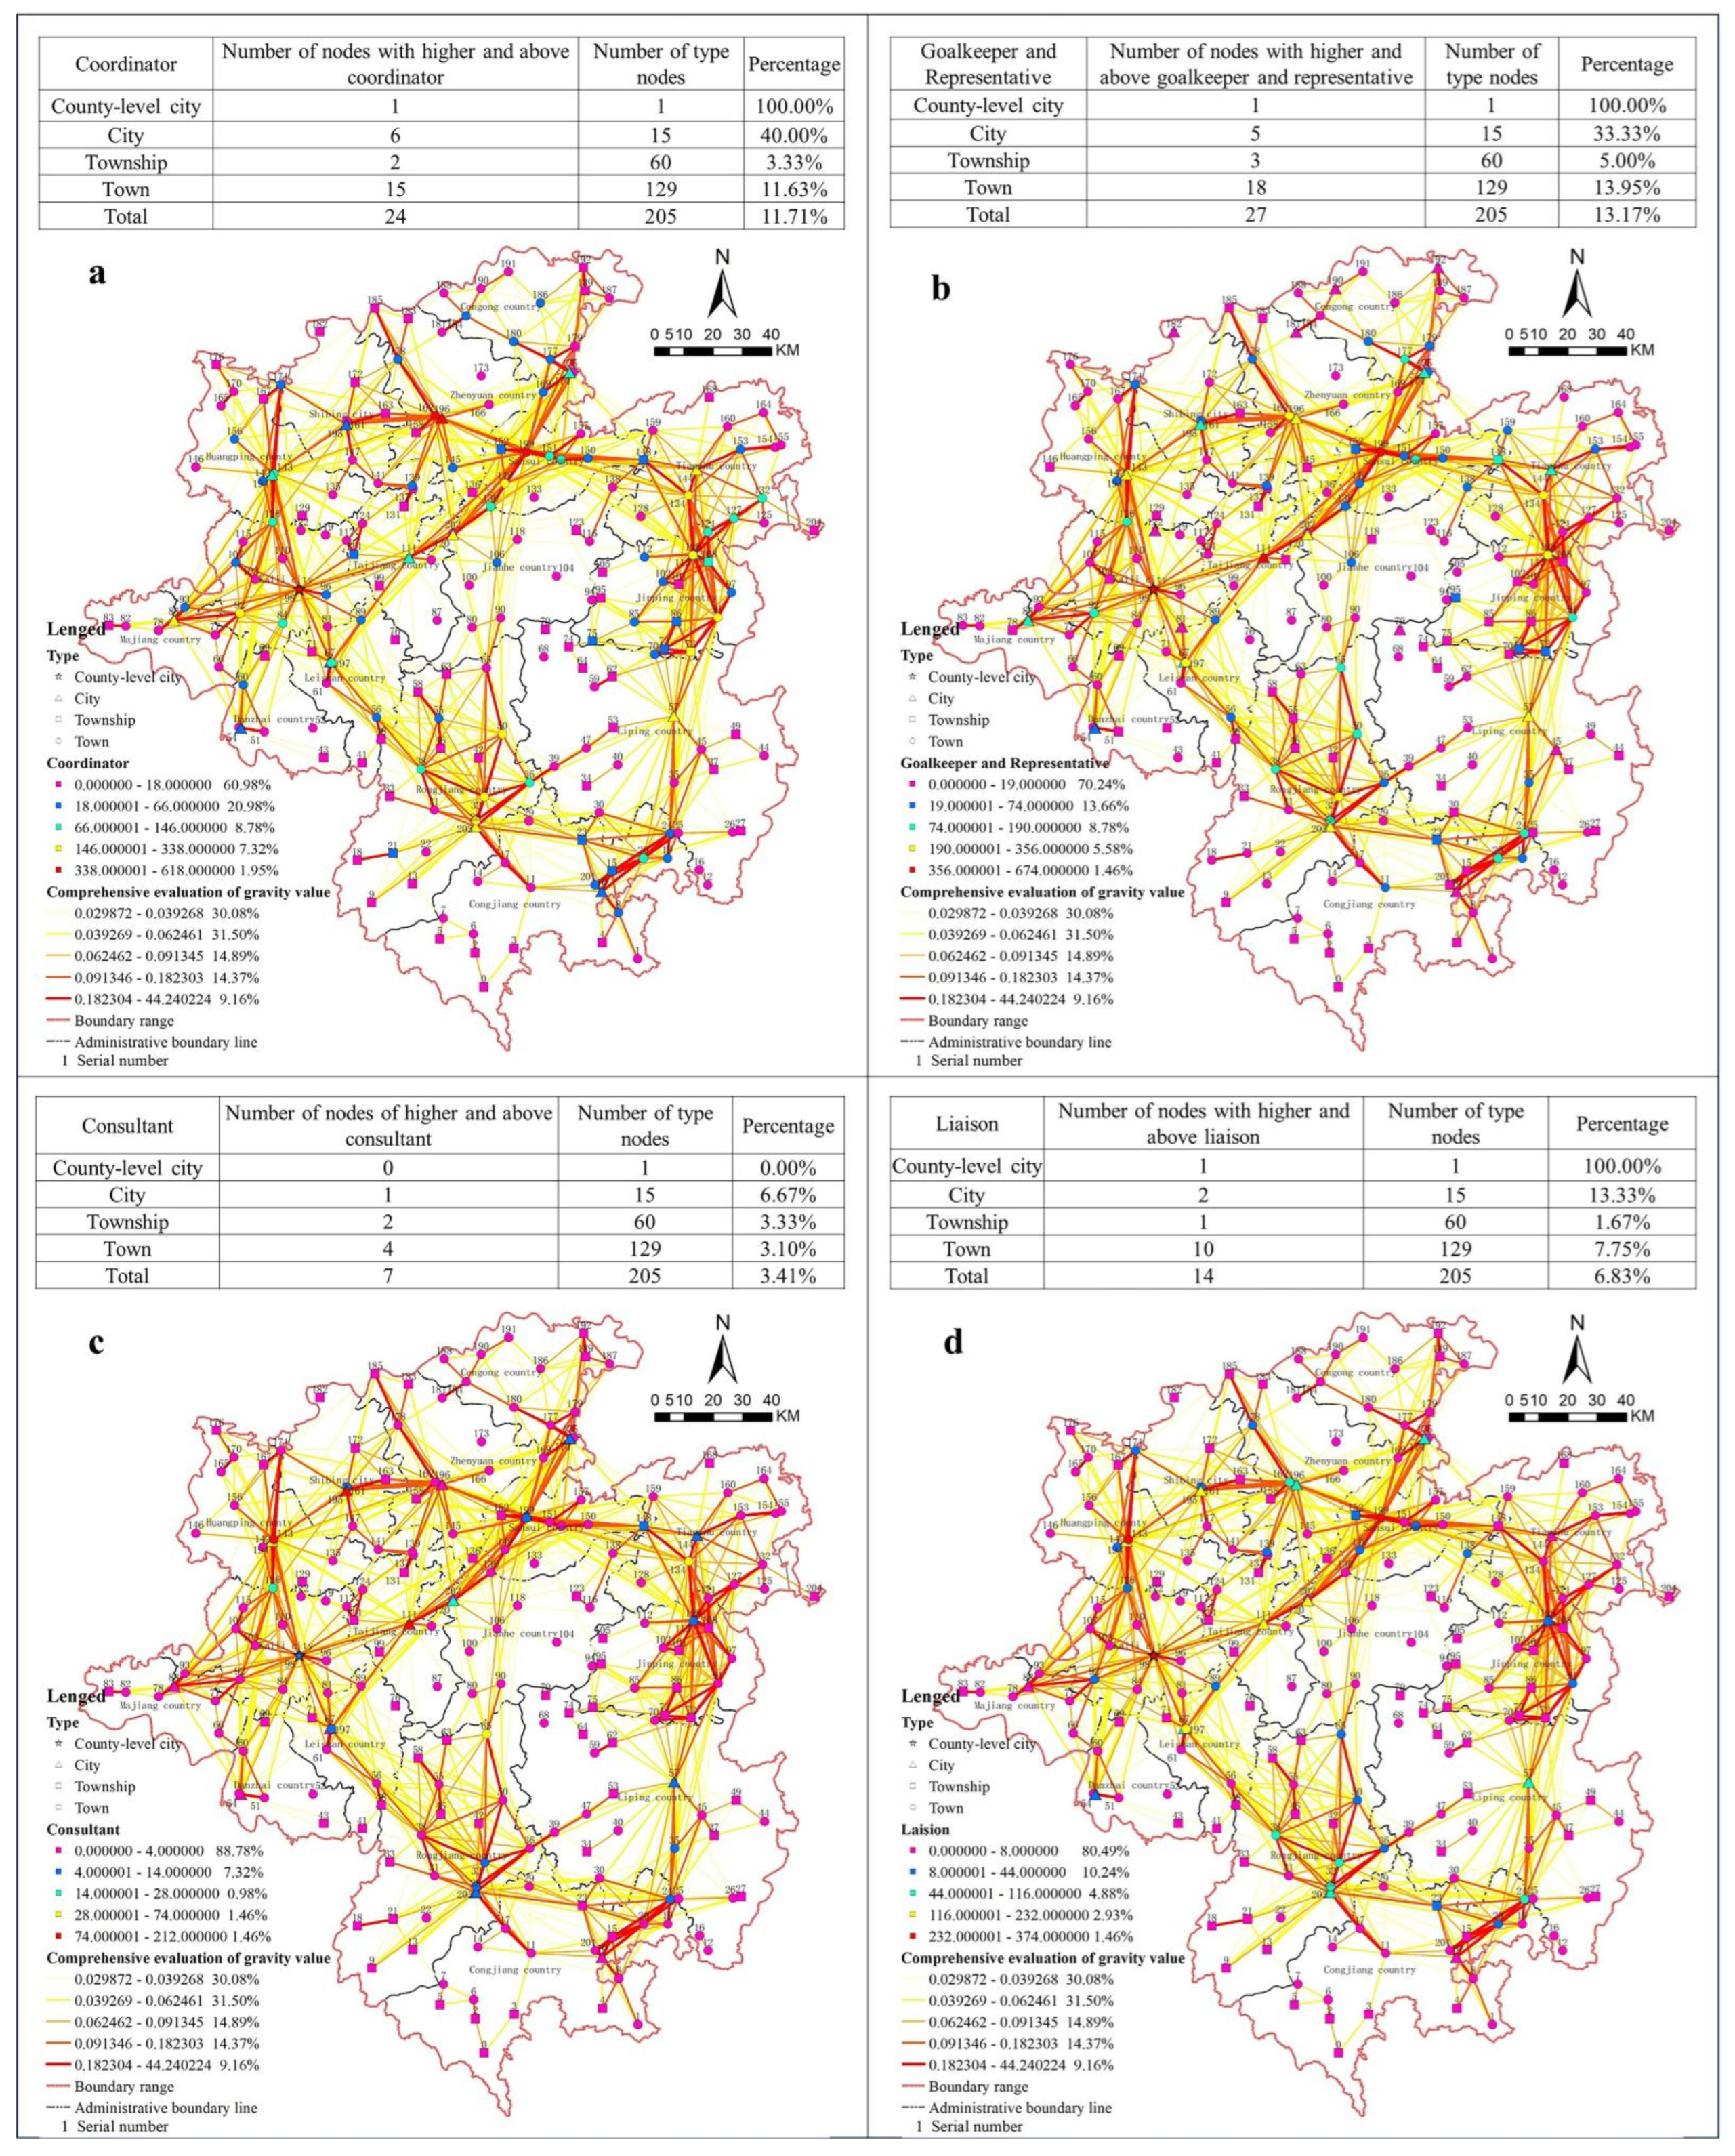
| Broker | The broker refers to the actors in the middle position, which are divided into five roles according to their positions: coordinator, goalkeeper, representative, consultant, and liaison (Figure 3). The coordinator refers to the strong information dissemination ability only within the subgroup. The goalkeeper and stakeholders inside and outside the subgroup have strong information connection abilities. The representatives and stakeholders inside and outside the subgroup also have strong information connection abilities. The consultant does not communicate directly with the stakeholders inside the subgroup but maintains a good connection relationship with the stakeholders outside the subgroup. Additionally, the liaison officer maintains strong information communication abilities with multiple external subgroups [32]. |
- (2)
- Network Resilience Assessment Method
- (3)
- Minimum Spanning Tree Analysis (MST)
2.2.5. Correlation Analysis Method
- (1)
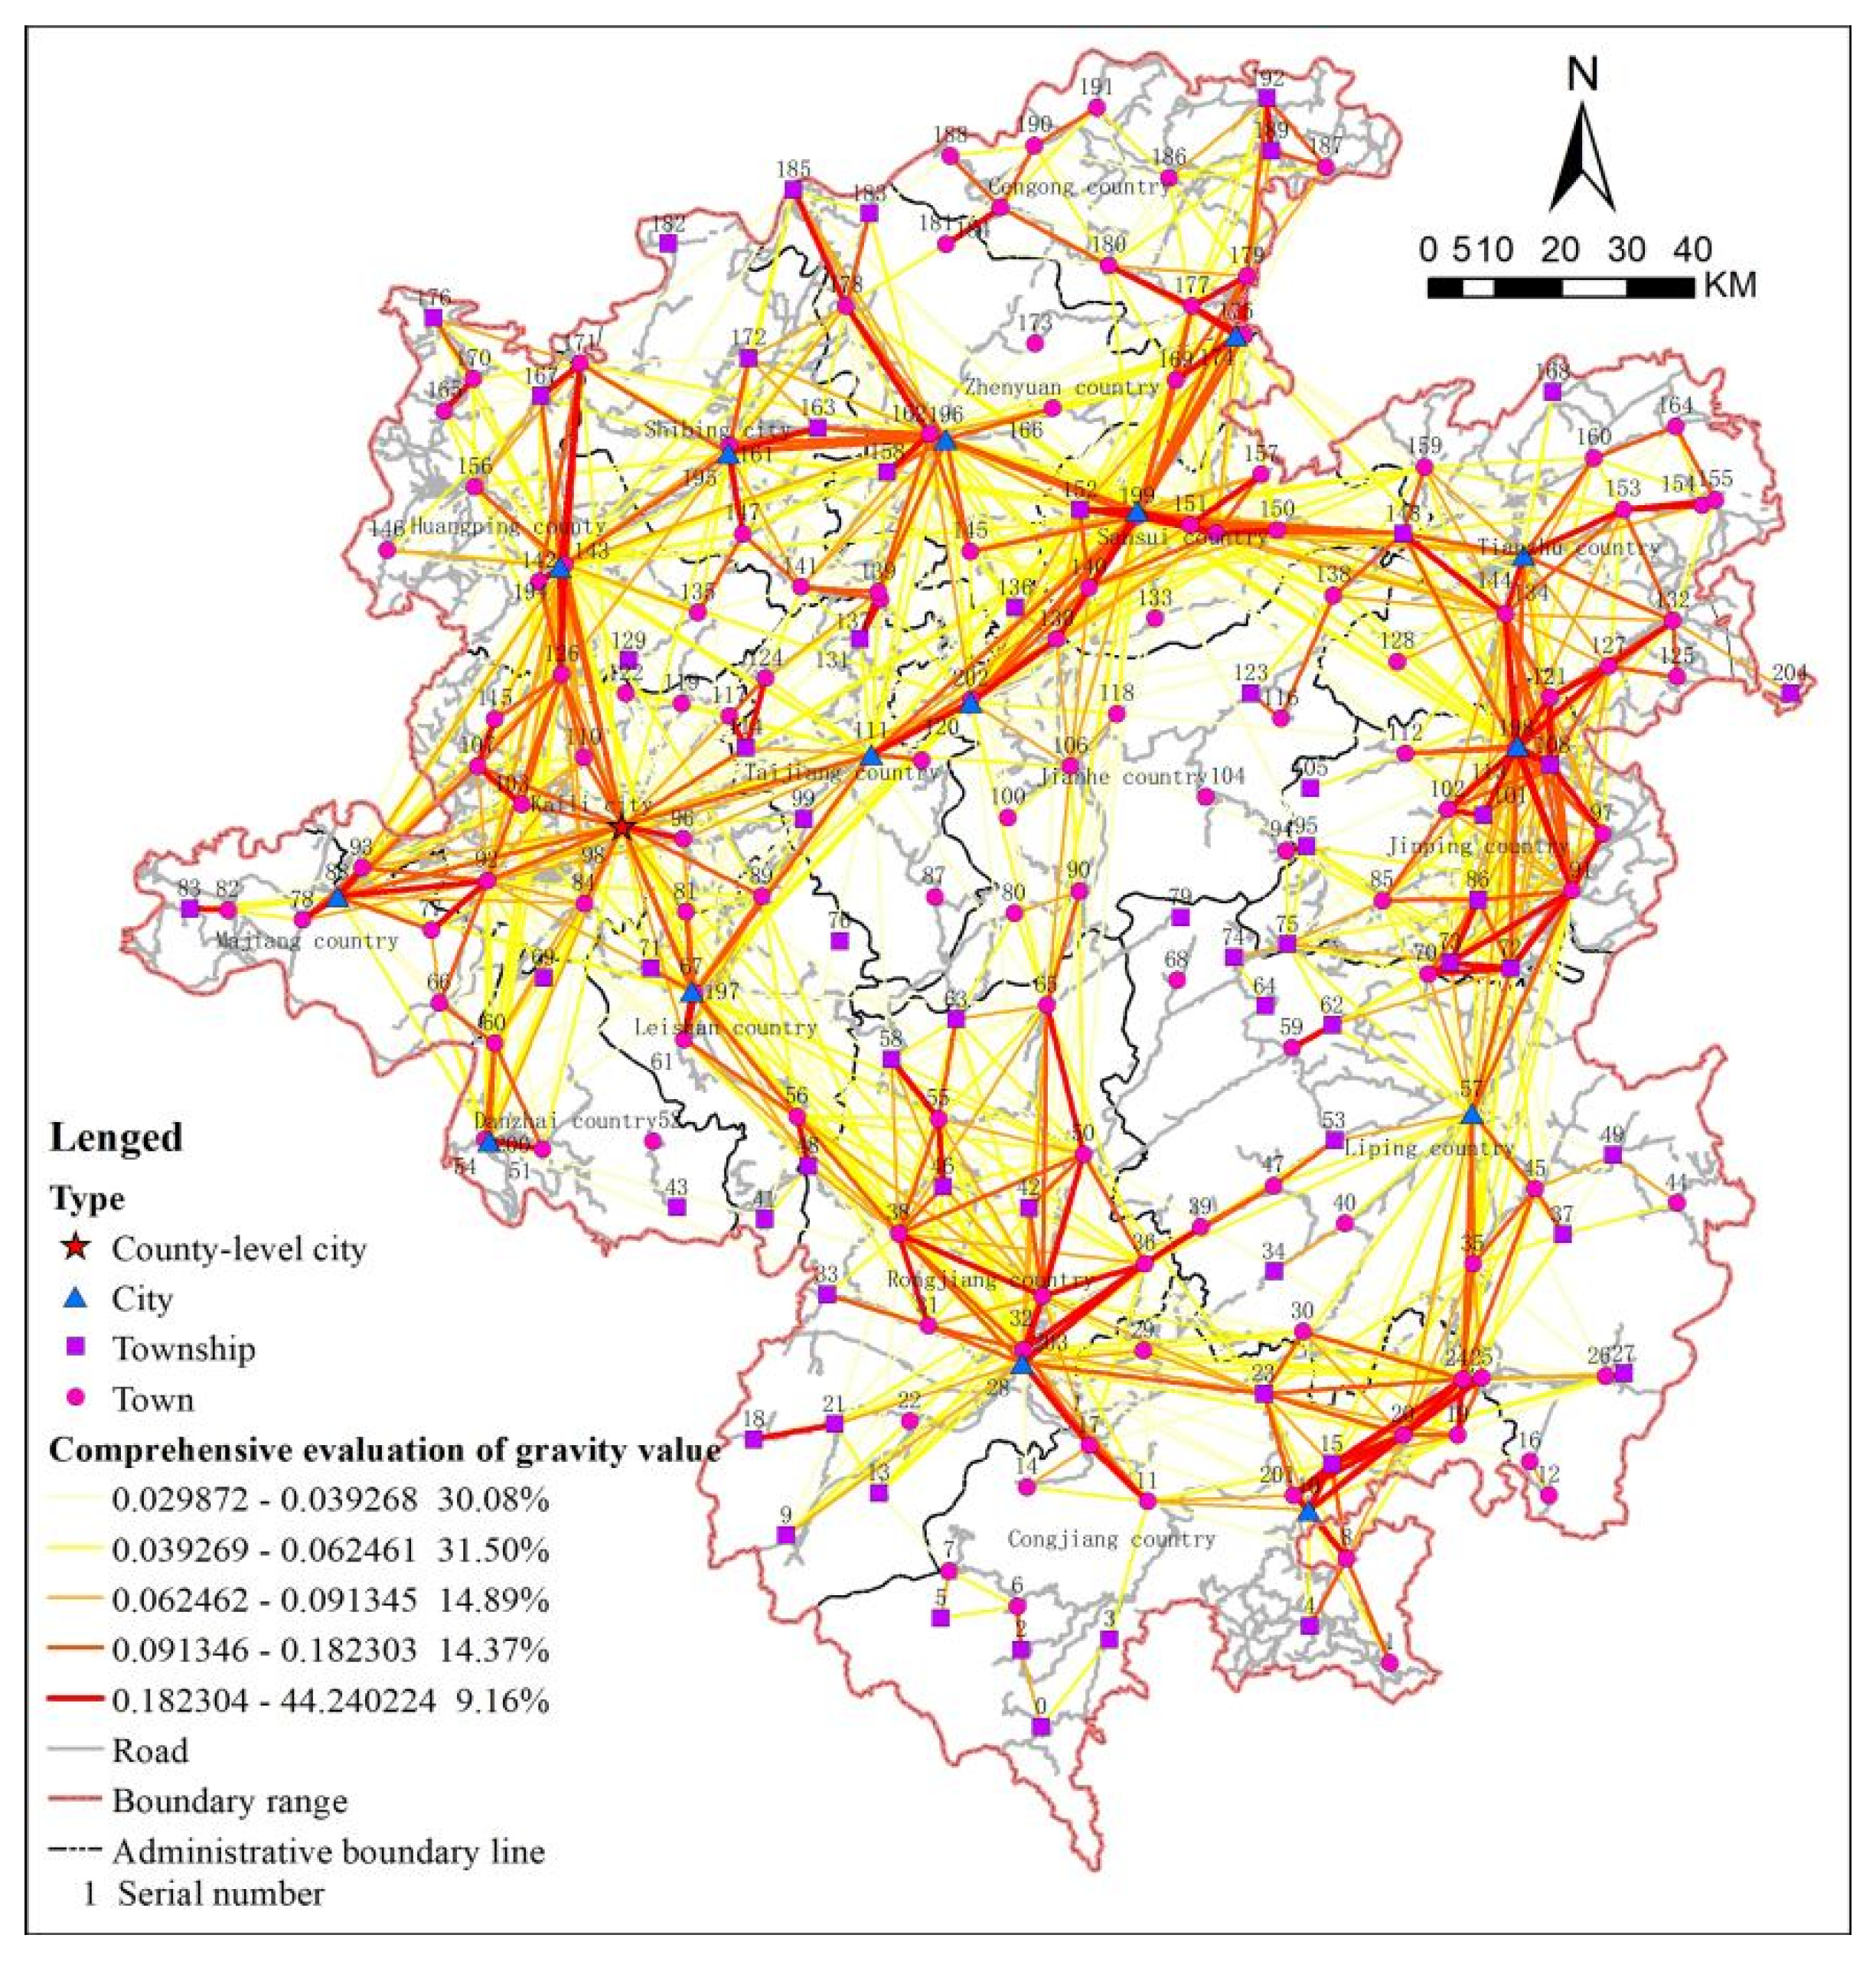
- Analysis of Urban Gravity Relationship
- (2)
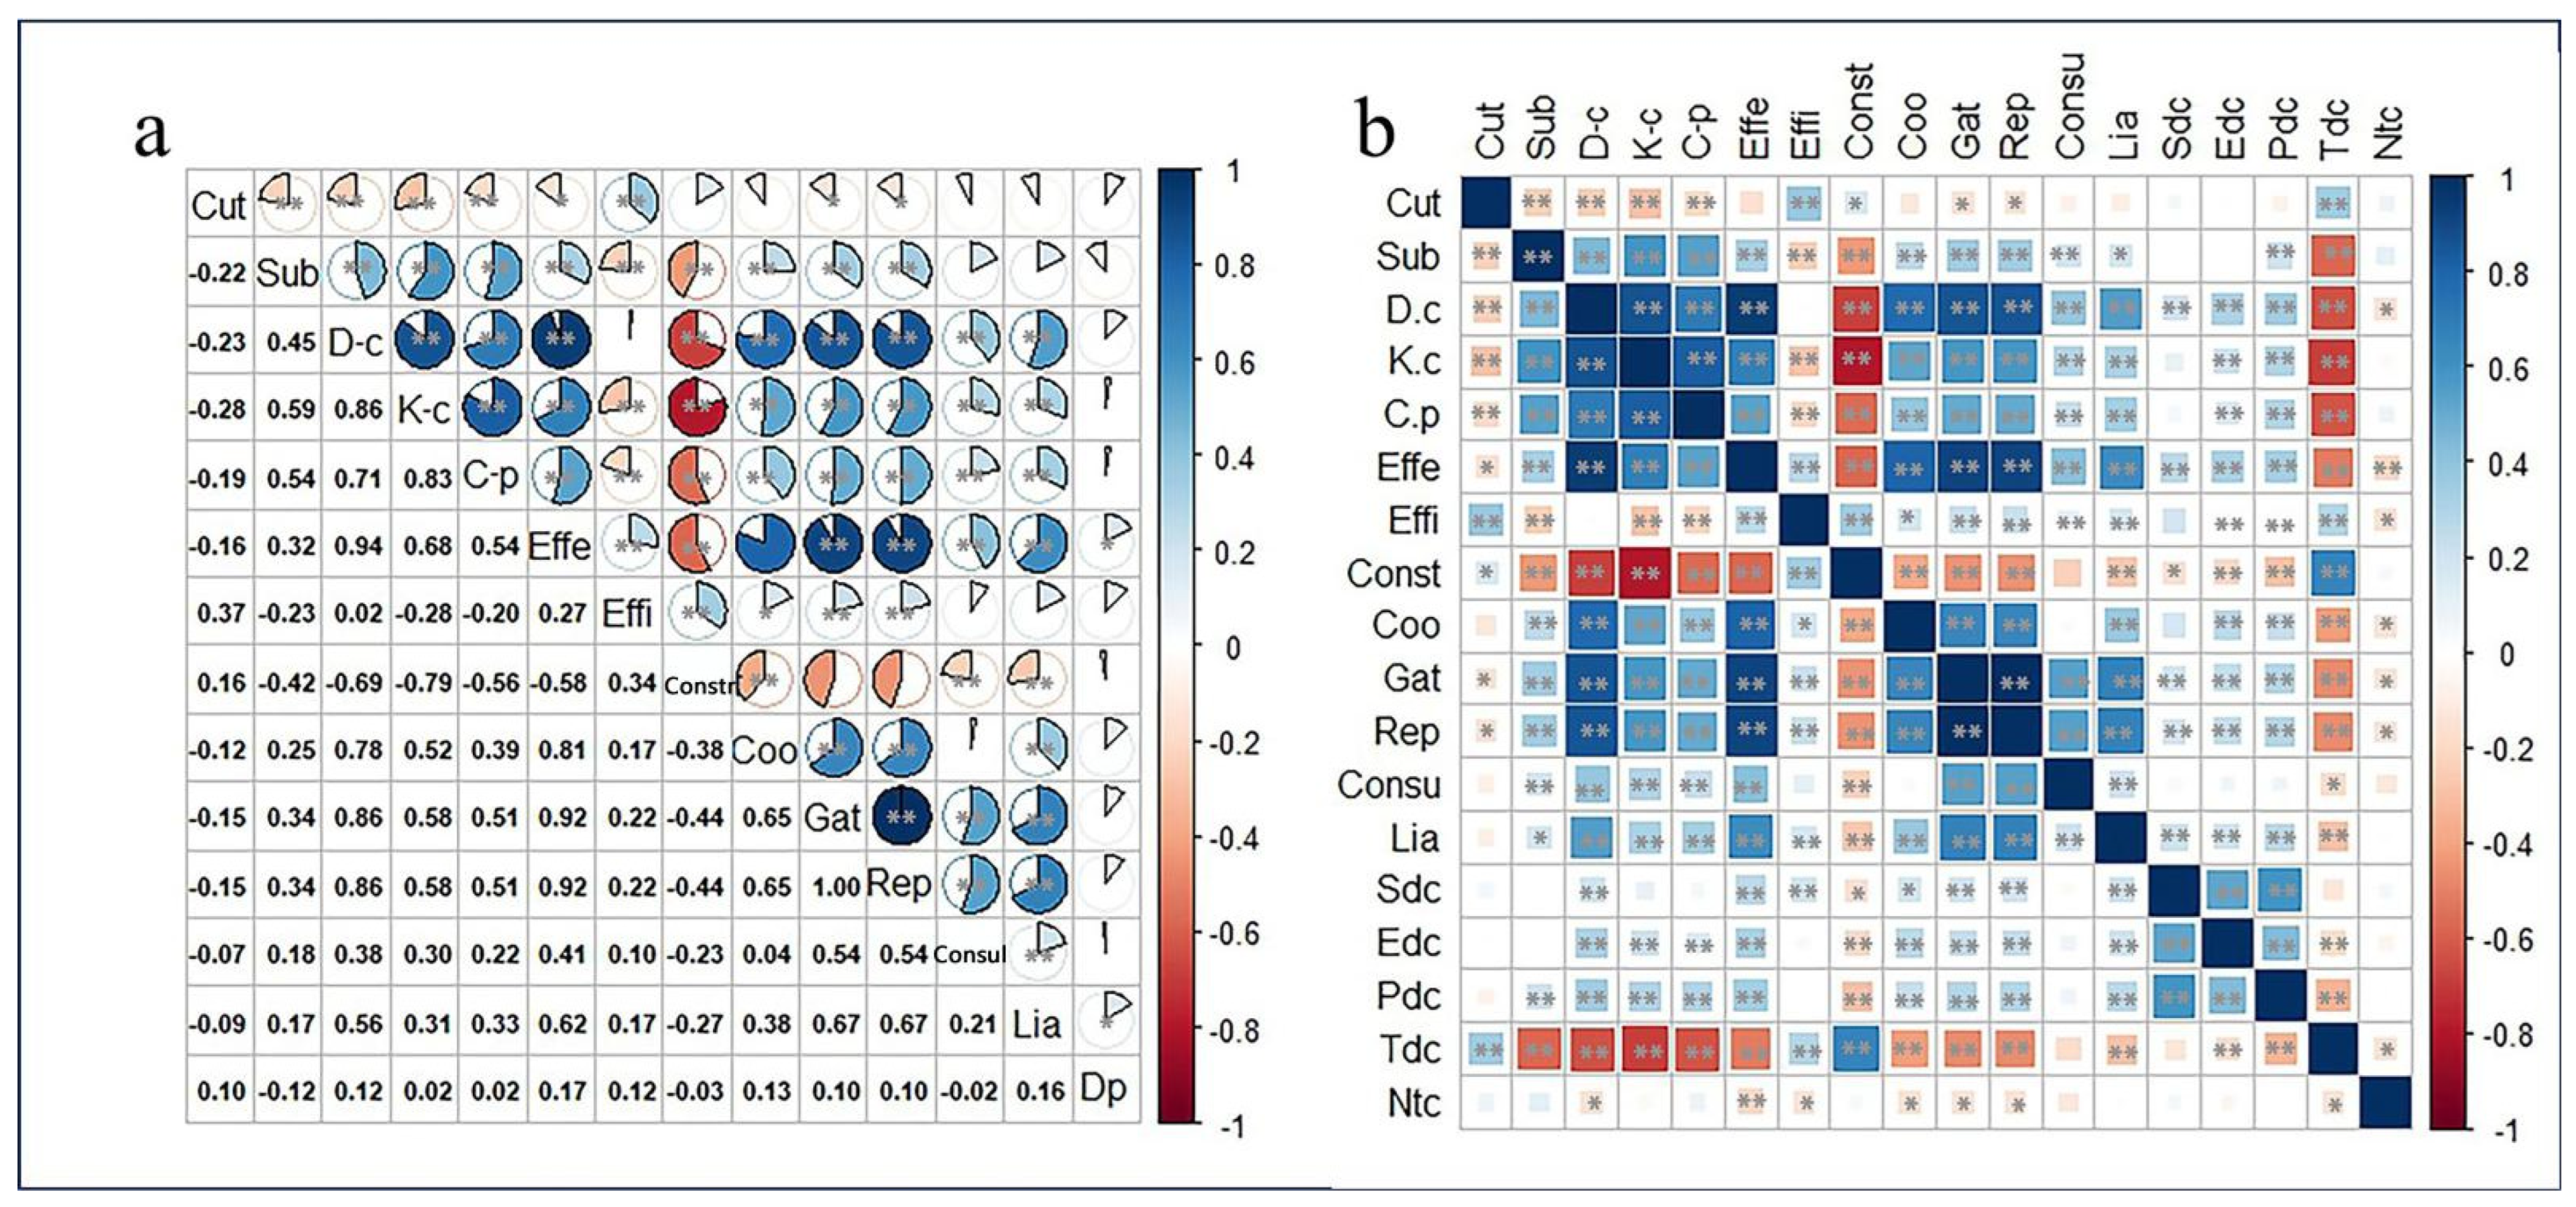
- Relationship Analysis of Related Elements
2.2.6. Data Sources and Processing
3. Results
3.1. Distribution Analysis of Urban Units in Qiandongnan
3.2. Evaluation Index System of Towns in Qiandongnan
| Primary Index | Weight | Secondary Index | Weight | Unit |
|---|---|---|---|---|
| Urbanization Level | 0.22 | Permanent resident urbanization rate | 0.12 | % |
| Registered population urbanization rate | 0.10 | % | ||
| Basic Public Services | 0.28 | Proportion of migrant workers’ children receiving compulsory education | 0.06 | % |
| Coverage rate of free basic vocational training for urban unemployed, migrant workers, and new labor force | 0.06 | % | ||
| Coverage rate of basic pension insurance for urban permanent residents | 0.05 | % | ||
| Coverage rate of basic medical insurance for urban permanent residents | 0.06 | % | ||
| Coverage rate of subsidized housing for low- and middle-income urban households | 0.05 | % | ||
| Infrastructure Level | 0.31 | Proportion of public transportation in motorized travel | 0.04 | % |
| Public water supply coverage rate | 0.07 | % | ||
| Sewage treatment rate | 0.05 | % | ||
| Domestic waste harmless treatment rate | 0.06 | % | ||
| Household broadband access capacity | 0.05 | Mbps | ||
| Coverage rate of community comprehensive service facilities | 0.04 | % | ||
| Resource and Environment Level | 0.19 | Per capita urban construction land area | 0.05 | M2 |
| Proportion of renewable energy consumption | 0.03 | % | ||
| Proportion of green buildings in new constructions | 0.02 | % | ||
| Ace ratio in built-up areas | 0.03 | % | ||
| Proportion of days with air quality meeting national standards | 0.05 | % |
3.3. Analysis of the Urban Network in Qiandongnan
3.3.1. Network Model and Spatial Relationship of Urban Units in Qiandongnan
3.3.2. Analysis of the Overall Network of Urban Units in Qiandongnan
- (1)
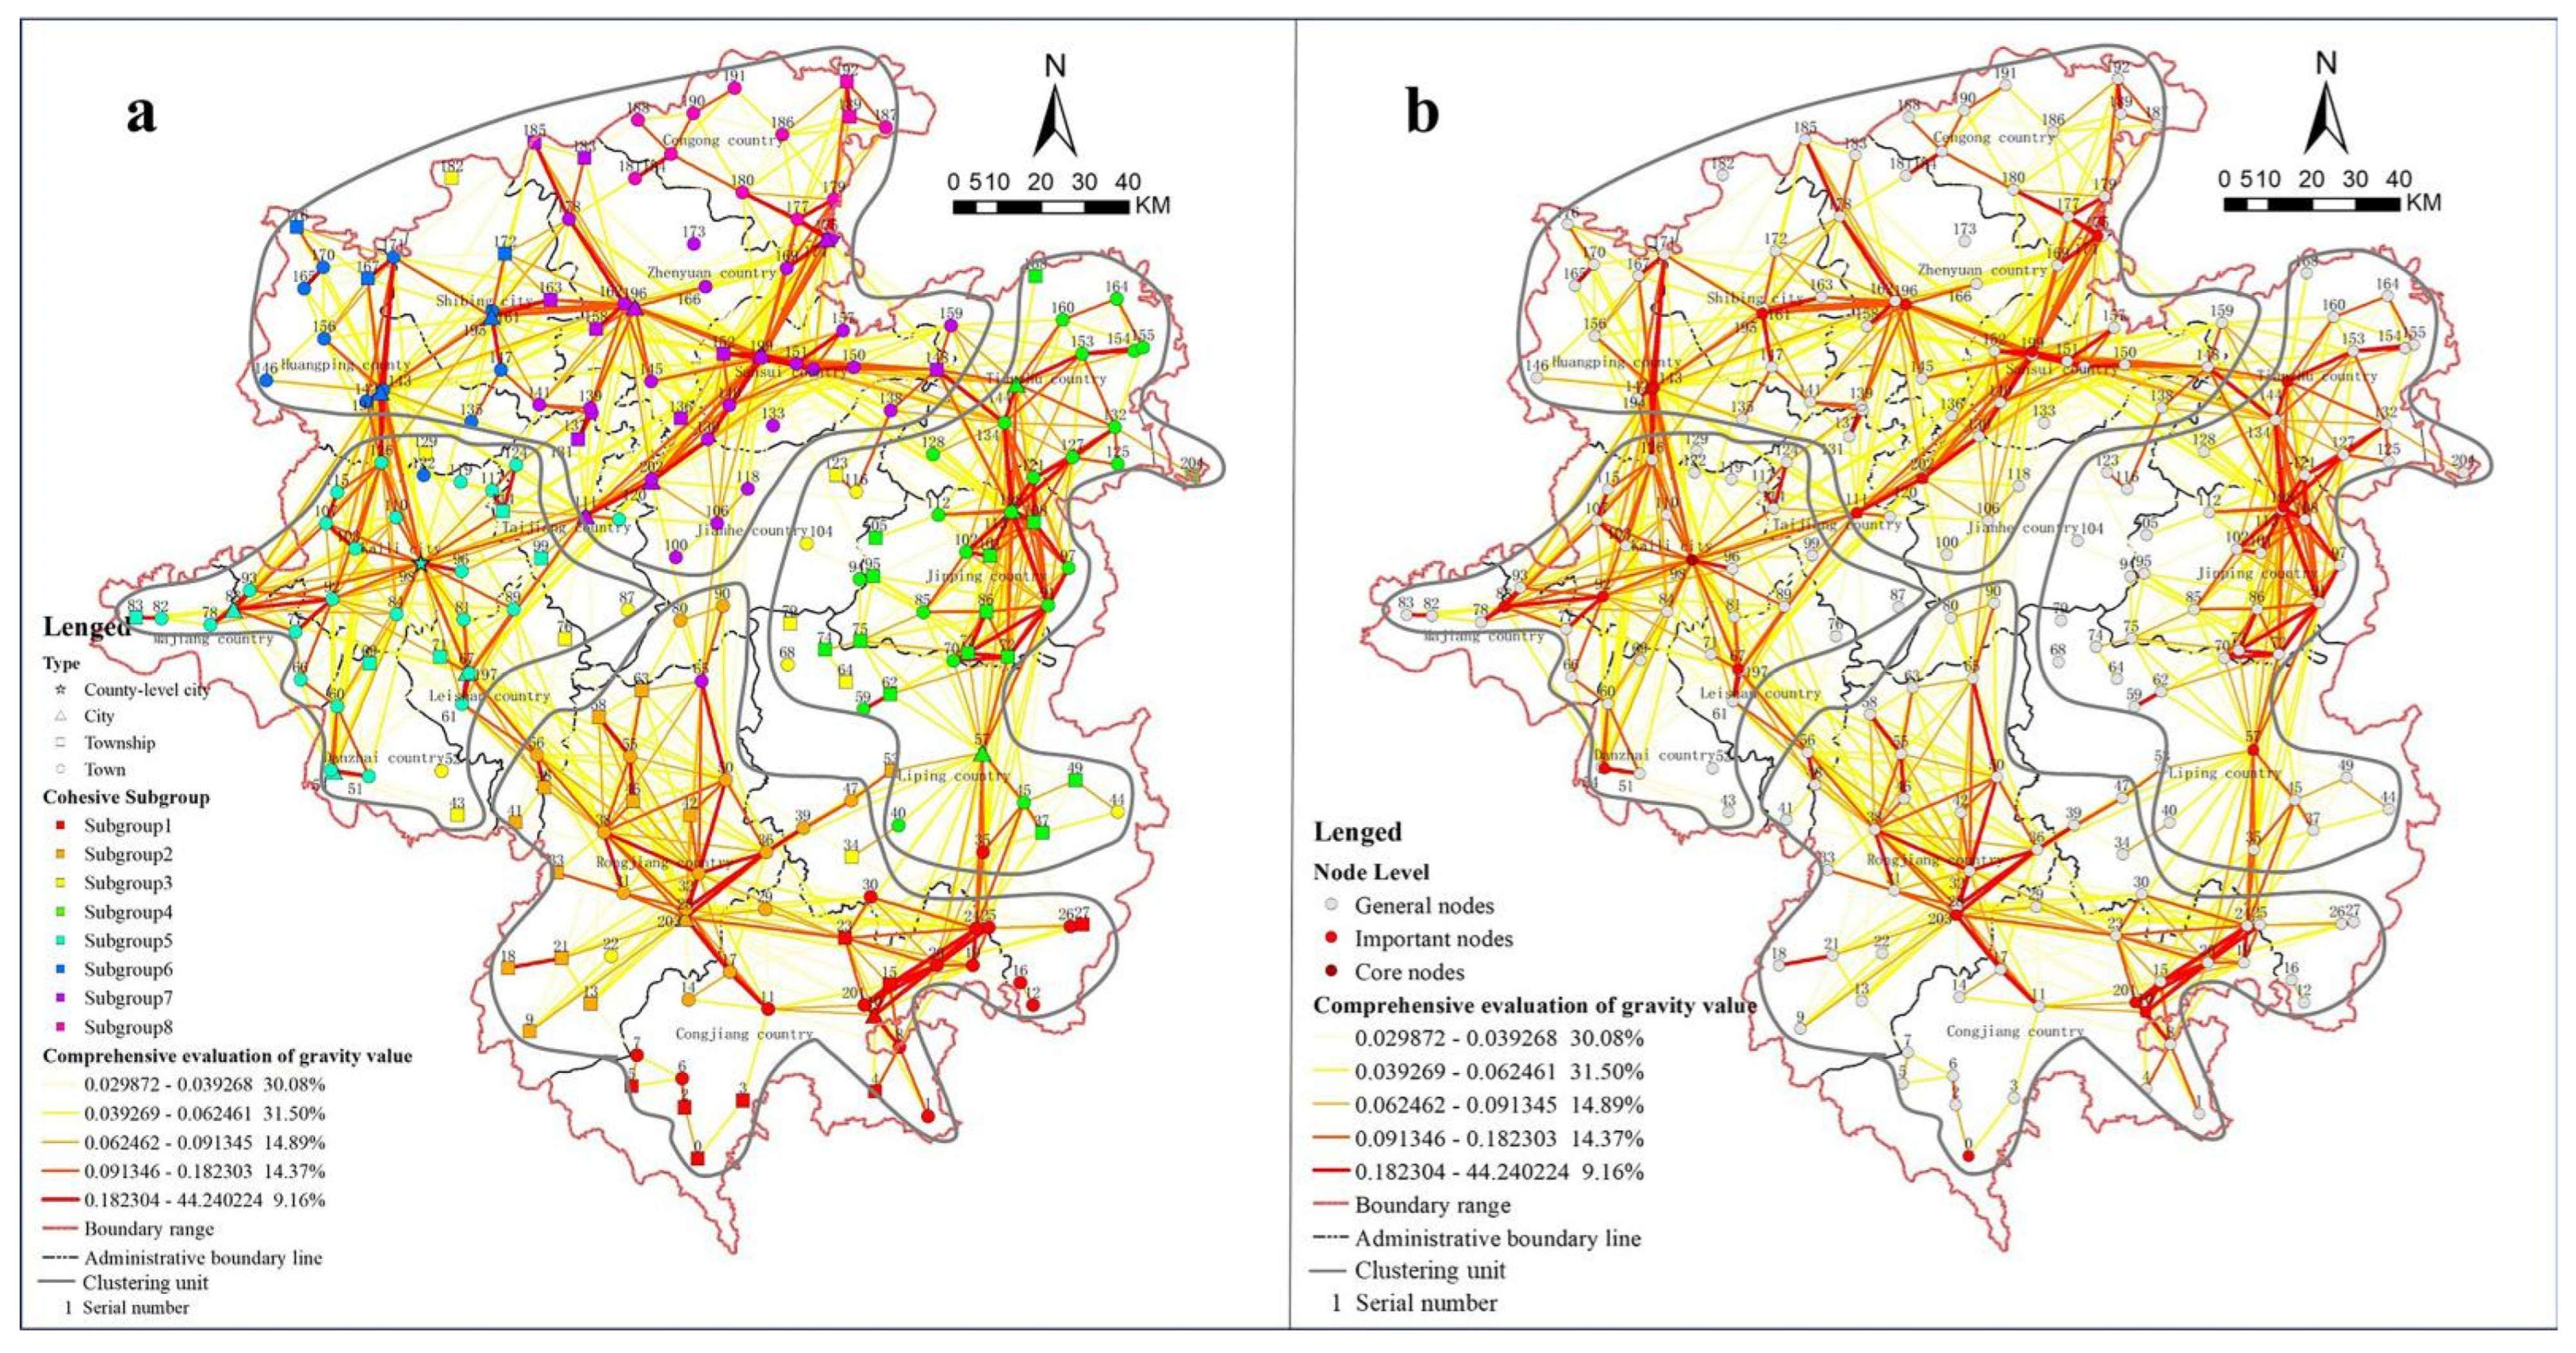
- Analysis of the Overall Structure of the Urban Network in Qiandongnan: Figure 7a shows that there are three levels of cohesive subgroups consisting of eight clusters in the urban units of Qiandongnan, with subgroups of varying sizes, and four clusters of the second level can be formed by two closely related clusters.
- (2)
- Stability Analysis of the Urban Network in Qiandongnan
- (3)
- Analysis of the Completeness of the Urban Network in Qiandongnan
- (4)
- Analysis of Urban Network Balance in Qiandongnan
- (5)
- Vulnerability Analysis of the Urban Network in Qiandongnan
3.3.3. Analysis of Individual Networks of Urban Units in Qiandongnan
- (1)
- Analysis of Individual Competitiveness of the Urban Network in Qiandongnan
- (2)
- Analysis of the Individual Nature of the Urban Network in Qiandongnan.
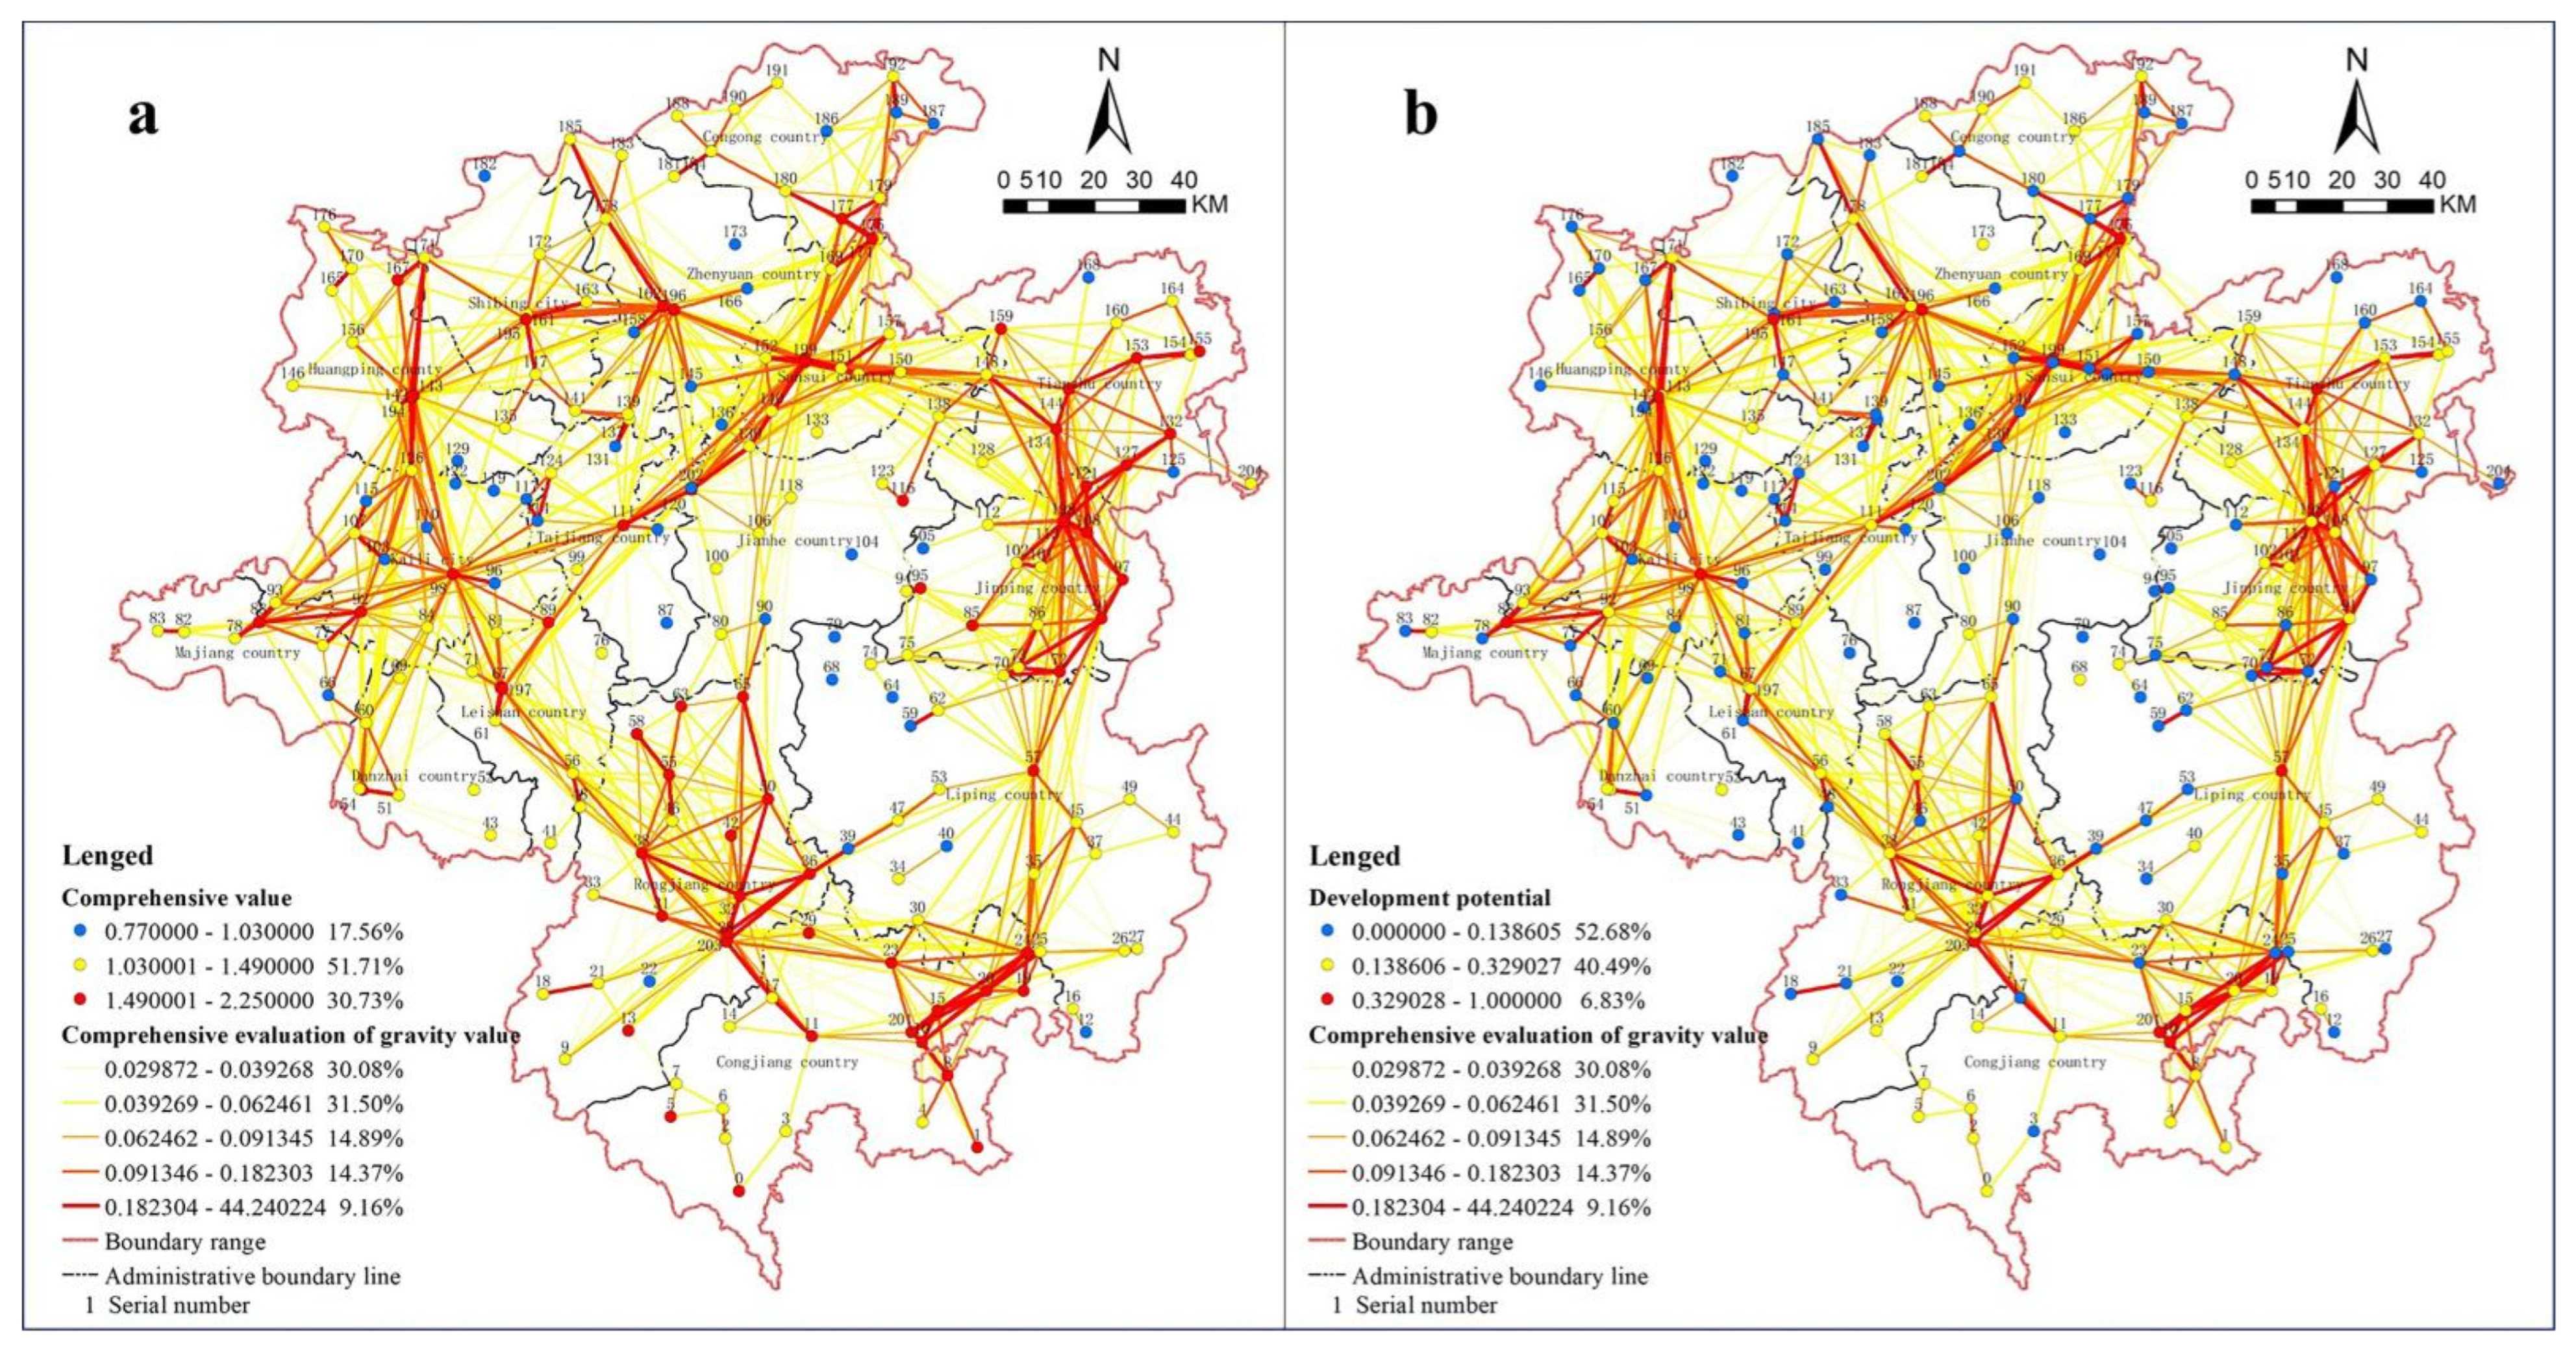
3.4. Analysis of Urban Development Potential in Qiandongnan
3.5. Relationship Between the Development Potential and Network Structure of Urban Areas in Qiandongnan
3.6. Resilience Analysis of Urban Networks in Qiandongnan
3.6.1. Key Node Identification Result
3.6.2. Simulation Analysis of Node Failure
3.7. Planning and Construction of Resilient Urban Systems Based on Social Network Analysis
3.7.1. Development Strategy of Differentiated Resilience and Optimization of Spatial Functional Structure of Urban Units in Qiandongnan
3.7.2. Path and Planning Implementation of Improving Urban Network Resilience in Qiandongnan
4. Discussion
4.1. Characteristics of Urban Distribution and Network Morphology and Structure in Qiandongnan
4.2. Multi-Level Resilience Promotion of Network Structure Optimization and Its Popularization Adaptability
5. Conclusions
Author Contributions
Funding
Data Availability Statement
Acknowledgments
Conflicts of Interest
References
- Shi, Y.; Zhai, G.; Xu, L.; Zhou, S.; Lu, Y.; Liu, H.; Huang, W. Assessment methods of urban system resilience: From the perspective of complex adaptive system theory. Cities 2021, 112, 103141. [Google Scholar] [CrossRef]
- Zhang, J.; Rong, C. Study on Spatial-temporal Differentiation Law of Urban Systems in Guangxi. Guangxi Sci. 2022, 29, 1178–1187. [Google Scholar] [CrossRef]
- Getis, A.; Getis, J. Christaller’s Central Place Theory. J. Geogr. 2007, 65, 220–226. [Google Scholar] [CrossRef]
- Castells, M. GRASSROOTING THE SPACE OF FLOWS. Urban Geogr. 1999, 20, 294–302. [Google Scholar] [CrossRef]
- Taylor, P.; Derudder, B. World City Network: A Global Urban Analysis; Routledge: London, UK, 2015. [Google Scholar] [CrossRef]
- Gao, P.; Ning, Y.; He, D.; Zhang, F. Network externalities of urban economic growth in the Yangtze River Delta from the perspective of enterprises’ non-local investment. Sci. Geogr. Sin. 2023, 43, 1216–1226. [Google Scholar] [CrossRef]
- Freeman, L.C. Centrality in social networks conceptual clarification. Soc. Netw. 1978, 1, 215–239. [Google Scholar] [CrossRef]
- Barabási, A.; Jeong, H.; Néda, Z.; Ravasz, E.; Schubert, A.; Vicsek, T. Evolution of the social network of scientific collaborations. Phys. A-Stat. Mech. Its Appl. 2002, 311, 590–614. [Google Scholar] [CrossRef]
- Vugrin, E.D.; Camphouse, R.C. Infrastructure resilience assessment through control design. Int. J. Crit. Infrastruct. 2011, 7, 243–260. [Google Scholar] [CrossRef]
- Pengju, M. The Co-evolution of Spatial Structure and Regional Governance Model of Urban Agglomeration: Take the Pearl River Delta Urban Agglomeration as an Example. Future Dev. 2019, 43, 5–13. [Google Scholar]
- Yu, P.; Yung, E.H.; Chan, E.H.; Wong, M.S.; Wang, S.; Chen, Y. An integrated approach for examining urban fragmentation in metropolitan areas: Implications for sustainable urban planning. J. Clean. Prod. 2023, 419, 138151. [Google Scholar] [CrossRef]
- Hynes, W.; Purcell, S.M. Security for Critical Infrastructure and Urban Areas: A Holistic Approach to Urban Safety, Security and Resilience. In Proceedings of the 7th Security Research Conference, Future Security 2012, Bonn, Germany, 4–6 September 2012; Aschenbruck, N., Martini, P., Meier, M., Tölle, J., Eds.; Springer: Berlin/Heidelberg, Germany; Volume 318. [Google Scholar] [CrossRef]
- Wang, Y.; Liu, C.; Wang, Y.; Liu, Y.; Liu, T. Climate risk assessment and adaption ability in China’s coastal urban agglomerations-A case study of Guangdong-Hong Kong-Macao greater bay area. J. Clean. Prod. 2024, 142036, 452. [Google Scholar] [CrossRef]
- Chen, G.-H.; Tao, L.; Zhang, H.-W. Study on the methodology for evaluating urban and regional disaster carrying capacity and its application. Saf. Sci. 2009, 47, 50–58. [Google Scholar] [CrossRef]
- Dennis, C.; Marsland, D.; Cockett, T. Central place practice: Shopping centre attractiveness measures, hinterland boundaries and the UK retail hierarchy. J. Retail. Consum. Serv. 2002, 9, 185–199. [Google Scholar] [CrossRef]
- Hillier, B.; Hanson, J. The Social Logic of Space; Cambridge University Press: Cambridge, UK, 1984. [Google Scholar]
- Zang, Z.; Xu, X.; Qu, K.; Chen, R.; Chen, A. Travel time reliability in transportation networks: A review of methodological developments. Transp. Res. Part C Emerg. Technol. 2022, 143, 103866. [Google Scholar] [CrossRef]
- Hou, H.; Liu, Y.; Liu, Y.; Wei, X.; He, Q.; He, Q. Using inter-town network analysis in city system planning: A case study of Hubei Province in China. Habitat Int. 2015, 49, 454–465. [Google Scholar] [CrossRef]
- Li, Y.; Liao, C.; Li, X.; Guo, R. Understanding regional structure through spatial networks: A simulation optimization framework for exploring balanced development. Habitat Int. 2024, 152, 103155. [Google Scholar] [CrossRef]
- Liu, Z.; Wang, S.; Wang, F. Isolated or integrated? Planning and management of urban renewal for historic areas in Old Beijing city, based on the association network system. Habitat Int. 2019, 93, 102049. [Google Scholar] [CrossRef]
- Gong, G.; Wei, Z.; Zhang, F.; Li, Y.; An, Y.; Yang, Q.; Wu, J.; Wang, L.; Yu, P. Analysis of the spatial distribution and influencing factors of China national forest villages. Environ. Monit. Assess. 2022, 194, 428. [Google Scholar] [CrossRef]
- Xiang, H.; Xie, M.; Huang, Z.; Bao, Y. Study on spatial distribution and connectivity of Tusi sites based on quantitative analysis. Ain Shams Eng. J. 2023, 14, 101833. [Google Scholar] [CrossRef]
- Gong, J.; Jian, Y.; Chen, W.; Liu, Y.; Hu, Y. Transitions in rural settlements and implications for rural revitalization in Guangdong Province. J. Rural Stud. 2022, 93, 359–366. [Google Scholar] [CrossRef]
- Lin, Z.; Liang, Y.; Liu, X. Study on spatial form evolution of traditional villages in Jiuguan under the influence of historic transportation network. Herit. Sci. 2024, 12, 29. [Google Scholar] [CrossRef]
- Fan, J.; Zheng, B.; Tang, Q.; Zhang, B.; Liu, N. The Changsha Historic Urban Area: A Study on the Changing Accessibility of the Road Network. Appl. Sci. 2022, 12, 2796. [Google Scholar] [CrossRef]
- Zhao, Y.; Xiang, H.; Huang, Z. Architectural spatial distribution and network connectivity characteristics of ancient military towns in Southwest China: A case study of Qingyan Ancient Town in Guiyang. Herit. Sci. 2024, 12, 403. [Google Scholar] [CrossRef]
- Xia, H.; Li, C.; Zhou, D.; Zhang, Y.; Xu, J. Peasant households’ land use decision-making analysis using social network analysis: A case of Tantou Village, China. J. Rural Stud. 2020, 80, 452–468. [Google Scholar] [CrossRef]
- Zhang, B.; Fan, J.; Zhang, P.; Shen, S.; Ren, Y. The Changsha historic urban area: A study on the evolution characteristics and influencing factors of the connectivity of construction land. Herit. Sci. 2024, 12, 287. [Google Scholar] [CrossRef]
- Liu, Q.; Hao, W.; Xia, M. Spatial association of coastal towns and villages in Funing District, Qinhuangdao: A study using social network analysis. J. Rural Stud. 2024, 107, 103261. [Google Scholar] [CrossRef]
- Burt, R.S. Models of Network Structure. Annu. Rev. Sociol. 2003, 6, 79–141. [Google Scholar] [CrossRef]
- Burt, R.S. Structural Holes: The Social Structure of Competition. Econ. J. 1994, 104, 685. [Google Scholar] [CrossRef]
- Harrison, C.W.; Scott, A.B.; Ronald, L.B. Social Structure from Multiple Networks. I. Blockmodels of Roles and Positions. Am. J. Sociol. 1976, 81, 730–780. [Google Scholar] [CrossRef]
- Sun, H.; Cheng, X.; Dai, M. Regional flood disaster resilience evaluation based on analytic network process: A case study of the Chaohu Lake Basin, Anhui Province, China. Nat. Hazards 2016, 82, 39–58. [Google Scholar] [CrossRef]
- Xiang, Q.; Yu, H.; Huang, H.; Li, F.; Ju, L.; Hu, W.; Yu, P.; Deng, Z.; Chen, Y. Assessing the resilience of complex ecological spatial networks using a cascading failure model. J. Clean. Prod. 2024, 434, 140014. [Google Scholar] [CrossRef]
- Cantarella, G.E.; Cascetta, E. Dynamic Processes and Equilibrium in Transportation Networks: Towards a Unifying Theory. Transp. Sci. 1995, 29, 305–329. [Google Scholar] [CrossRef]
- Zhang, K.; Pan, J. Evaluation of ecological network resilience using OWA and attack scenario simulation in the Gansu section of the Yellow River Basin, NW China. Environ. Res. Commun. 2024, 6, 085016. [Google Scholar] [CrossRef]
- Pavon, W.; Torres, M.; Inga, E. Integrating Minimum Spanning Tree and MILP in Urban Planning: A Novel Algorithmic Perspective. Buildings 2024, 14, 213. [Google Scholar] [CrossRef]
- Yu, J.; Ye, L. Evaluation Index System of New-pattern Urbanization in China:Construction, Measure and Comparison. J. Wuhan Univ. (Philos. Soc. Sci. Ed.) 2018, 71, 145–156. [Google Scholar] [CrossRef]
- Ma, L.; Huang, D.; Jiang, X.; Yang, L.; Zhang, M.; Lin, Y. Does collaborative governance of natural disasters in urban agglomerations enhance urban resilience? Evidence from China. Environ. Dev. Sustain. 2025, 1–22. [Google Scholar] [CrossRef]
- Loizou, E.; Spinthiropoulos, K.; Kalogiannidis, S.; Chatzitheodoridis, F.; Kalfas, D.; Tzilantonis, G. Enhancing Climate Resilience and Food Security in Greece Through Agricultural Biodiversity. Land 2025, 14, 838. [Google Scholar] [CrossRef]
- Li, N.; Jin, P.; Zhao, K. Micro-mechanism and Macro-effect of the Formation of Urban Spatial Structure in “Small Agglomeration and Large Dispersion”. Nankai Econ. Stud. 2024, 170–186. [Google Scholar] [CrossRef]
- Wei, J.; Liu, J.; Li, Q.; Dong, P. Spatial Evolution and Correlation Network of Territory Spatial Efficiency in Counties of Henan Province. Areal Res. Dev. 2025, 44, 54–61. [Google Scholar] [CrossRef]
- Yuan, X.; Bin, W. Analysis of Urban Agglomeration Network Structure Based on Baidu Migration Data: A Case Study of the Guangdong-Hong Kong-Macao Greater Bay Urban Agglomeration. J. Landsc. Res. 2024, 16, 47–50. [Google Scholar] [CrossRef]
- Liu, Z.; Ding, Z.; Bu, S.; Wang, F. The Network Structure Analysis of Zhongyuan Urban Agglomeration Based on Interactive and Traffic Flow Relationship. Hum. Geogr. 2015, 30, 79–86. [Google Scholar] [CrossRef]
- Sharifi, A. Resilience of urban social-ecological-technological systems (SETS): A review. Sustain. Cities Soc. 2023, 99, 104910. [Google Scholar] [CrossRef]
- Huijun, Z. Research on the Relationship Between Towns and Villages in the Suburbs of Big Cities from the Perspective of Social Network. Master’s Thesis, Anhui Jianzhu University, Hefei, China, 2023. [Google Scholar]


| Types | Cv Value | Type of Spatial Distribution | Main Influencing Factors |
|---|---|---|---|
| County-level city and City | 35.86% | Randomized distribution | Natural factor |
| Township | 35.83% | Randomized distribution | Natural factor |
| Town | 37.62% | Randomized distribution | Natural factor |
| Primary Index | Weight | Secondary Index | Weight | Unit |
|---|---|---|---|---|
| Social Development Conditions | 0.16 | Administrative area | 0.05 | Km2 |
| Number of village committees | 0.02 | Units | ||
| Number of residential committees | 0.02 | Units | ||
| Registered population | 0.03 | Persons | ||
| Permanent resident population | 0.04 | Persons | ||
| Economic Development Conditions | 0.30 | Per capita disposable income | 0.08 | CNY |
| Per capita GDP | 0.06 | CNY | ||
| Total fiscal revenue | 0.06 | CNY | ||
| Number of stores or supermarkets with ≥50 m2 business area | 0.05 | Units | ||
| Per capita gross output value | 0.06 | CNY | ||
| Production Development Conditions | 0.18 | Cultivated land area | 0.03 | Hectares |
| Total grain production | 0.03 | Tonnes | ||
| Gross agricultural output value | 0.03 | CNY | ||
| Gross industrial output value | 0.05 | CNY | ||
| Number of industrial enterprises | 0.04 | Units | ||
| Transportation Conditions | 0.20 | Fixed-asset investment in transportation | 0.10 | CNY |
| Commuting time to major central cities | 0.11 | Minutes | ||
| Natural Terrain Conditions | 0.15 | Elevation | 0.05 | Meters |
| Slope gradient | 0.07 | Degrees | ||
| Slope aspect | 0.03 | Degrees |
| Grade | High | Average | Low |
|---|---|---|---|
| Comprehensive evaluation | 36 | 106 | 63 |
| Development potential | 14 | 83 | 108 |
| Index | Key Node |
|---|---|
| Degree centrality | 96, 103, 110, 111, 126, 130, 140, 149, 152, 199 |
| K-core | 106, 120, 130, 136, 140, 145, 148, 149, 150, 151, 152, 162, 169, 175, 193, 196, 199, 202 |
| Effective scale | 96, 103, 110, 111, 126, 130, 134, 140, 149, 162 |
| Efficiency | 0, 1, 2, 3, 12, 43, 52, 68, 79, 105, 123 |
| Functional role | 96, 103, 110, 111, 126, 130, 134, 140, 149, 199 |
| Cutpoint | 0, 2, 3, 6, 8, 11, 16, 52, 54, 68, 112 |
| Comprehensive assessment | 10, 28, 57, 88, 98, 113, 144, 175, 194, 196 |
| Before and After Key Nodes Are Removed | Network Density | Degree Central Potential | Network Average Distance | Aggregation Coefficient | |
|---|---|---|---|---|---|
| Degree centrality node | Front | 0.0670 | 13.03% | 3.591 | 0.640 |
| After | 0.0577 | 7.70% | 2.272 | 0.626 | |
| K-core node | Front | 0.0670 | 13.03% | 3.591 | 0.640 |
| After | 0.0588 | 13.62% | 4.768 | 0.646 | |
| Effective scale node | Front | 0.0670 | 13.03% | 3.591 | 0.640 |
| After | 0.0570 | 8.30% | 3.875 | 0.630 | |
| Efficiency node | Front | 0.0670 | 13.03% | 3.591 | 0.640 |
| After | 0.0740 | 13.47% | 3.280 | 0.671 | |
| Functional role node | Front | 0.0670 | 13.03% | 3.591 | 0.640 |
| After | 0.0570 | 7.78% | 3.873 | 0.629 | |
| Tangent node | Front | 0.0670 | 13.03% | 3.591 | 0.640 |
| After | 0.0723 | 13.11% | 3.245 | 0.664 | |
| Comprehensive evaluation node | Front | 0.0670 | 13.03% | 3.591 | 0.640 |
| After | 0.0628 | 12.92% | 3.668 | 0.635 | |
| Random node | Front | 0.0670 | 13.03% | 3.591 | 0.640 |
| After | 0.0672 | 13.00% | 3.608 | 0.629 |
| Indicator Node | Network Density Change | Degree Centrality Change | Average Distance Variation | Variation of Cluster Coefficient | Main Risks | Optimization Strategy |
|---|---|---|---|---|---|---|
| Degree centrality | ↓ 13.9% | ↓ 40.9% | ↓ 36.7% | ↓ 2.2% | Global fragmentation, power structure collapse | 1. Increase redundant connection of core nodes.2. Decentralized and centralized function |
| K-core | ↓ 12.2% | ↑ 4.5% | ↑ 32.8% | ↑ 0.9% | Long-path fracture reduces the stability of the hierarchy | 1. Strengthen cross-level short paths2. Optimize the core-periphery connection |
| Effective scale | ↓ 11.8% | ↓ 8.2% | ↑ 15.4% | ↓ 1.2% | Non-redundant connection fracture | 1. Enhance alternative paths between nodes.2. Optimize connection diversity |
| Efficiency | ↑ 10.4% | ↑ 3.3% | ↓ 8.7% | ↑ 4.8% | May trigger network reconfiguration. | 1. Optimize the network with reconfiguration potential. |
| Functional role | ↓ 14.9% | ↓ 40.3% | ↑ 7.8% | ↓ 1.7% | Multifunctional service interruption | 1. Establish a functional backup center.2. Improve the functional substitution |
| Point of tangency | ↑ 7.9% | ↑ 0.6% | ↓ 9.6% | ↑ 3.8% | Locally isolated but global optimization | 1. Dynamic monitoring + preset emergency link |
| Comprehensive assessment | ↑ 6.3% | ↓ 0.8% | ↑ 15.4% | ↓ 0.8% | Need to prevent cumulative effects | 1. Multi-index collaborative planning |
| Random node | ↑ 0.3% | ↓ 0.2% | ↑ 0.5% | ↓ 1.7% | The influence is weak, and the benchmark stability is verified. | As a reference value of the control group |
Disclaimer/Publisher’s Note: The statements, opinions and data contained in all publications are solely those of the individual author(s) and contributor(s) and not of MDPI and/or the editor(s). MDPI and/or the editor(s) disclaim responsibility for any injury to people or property resulting from any ideas, methods, instructions or products referred to in the content. |
© 2025 by the authors. Licensee MDPI, Basel, Switzerland. This article is an open access article distributed under the terms and conditions of the Creative Commons Attribution (CC BY) license (https://creativecommons.org/licenses/by/4.0/).
Share and Cite
Yuan, H.; Fan, J.; Luo, J.; Ren, R.; Li, H. Study on Urban System Relationships and Resilience Promotion Strategies in Underdeveloped Mountainous Areas Based on Social Network Analysis: A Case Study of Qiandongnan Miao and Dong Autonomous Prefecture. Land 2025, 14, 1500. https://doi.org/10.3390/land14071500
Yuan H, Fan J, Luo J, Ren R, Li H. Study on Urban System Relationships and Resilience Promotion Strategies in Underdeveloped Mountainous Areas Based on Social Network Analysis: A Case Study of Qiandongnan Miao and Dong Autonomous Prefecture. Land. 2025; 14(7):1500. https://doi.org/10.3390/land14071500
Chicago/Turabian StyleYuan, Huayan, Jinyu Fan, Jie Luo, Rui Ren, and Hai Li. 2025. "Study on Urban System Relationships and Resilience Promotion Strategies in Underdeveloped Mountainous Areas Based on Social Network Analysis: A Case Study of Qiandongnan Miao and Dong Autonomous Prefecture" Land 14, no. 7: 1500. https://doi.org/10.3390/land14071500
APA StyleYuan, H., Fan, J., Luo, J., Ren, R., & Li, H. (2025). Study on Urban System Relationships and Resilience Promotion Strategies in Underdeveloped Mountainous Areas Based on Social Network Analysis: A Case Study of Qiandongnan Miao and Dong Autonomous Prefecture. Land, 14(7), 1500. https://doi.org/10.3390/land14071500