Article

Evaluation of Habitat Quality in Karst Mountainous Areas of Guanling County Based on InVEST and MGWR Models

1
School of Karst Science, Guizhou Normal University, Guiyang 550001, China
2
State Engineering Technology Institute for Karst Desertification Control, Guiyang 550001, China
3
School of Geography & Environmental Science, Guizhou Normal University, Guiyang 550001, China
*
Author to whom correspondence should be addressed.
Land 2025, 14(7), 1445; https://doi.org/10.3390/land14071445
Submission received: 2 June 2025 / Revised: 30 June 2025 / Accepted: 7 July 2025 / Published: 10 July 2025
(This article belongs to the Topic Nature-Based Solutions-2nd Edition)

Abstract

As a core karst region in Southwest China, Guanling County plays a crucial role in regional ecological governance. This study integrates the InVEST model, landscape pattern index analysis, and the MGWR spatial model to systematically explore the dynamic mechanisms of habitat quality in Guanling’s karst mountains. Key findings include: (1) Landscape pattern alterations exhibit significant impacts on habitat quality, characterized by strong spatial heterogeneity; (2) Expansion of forest and grassland effectively buffers the negative effects of construction land expansion, forming an ecological compensation mechanism through enhanced landscape connectivity; (3) Between 2000 and 2020, the proportion of high-importance habitat quality zones increased from 54.79% to 56.16%, with moderate-importance zones stabilizing at approximately 7.80% and general-importance zones growing to 2.46%. The results provide a multi-scale analytical framework for habitat protection and land use optimization in fragile karst ecosystems.

1. Introduction

Karst landforms have garnered global attention owing to their unique geological structures and fragile ecosystems [1,2]. In southern China, karst landforms not only constitute important natural landscapes [3] but also serve as statistically significant ecological protection barriers for the upper reaches of the Yangtze River and the Pearl River [4,5,6]. The environmental vulnerability of karst areas has become increasingly evident due to intensified global climate change and human activities [7,8,9,10]. The terrain in karst mountainous areas is highly undulating, with pronounced spatial heterogeneity. With the rapid progression of urbanization and industrialization, the regional landscape configuration has experienced substantial transformations [11,12]. These alterations in landscape patterns have given rise to a series of environmental challenges [13,14], with soil erosion and desertification being the most pressing issues in this area [15,16], but also threaten biodiversity maintenance. To address the increasingly severe environmental problems, the Chinese government has implemented a series of ecological restoration plans [17,18,19]. At the same time, landscape pattern changes also threaten biodiversity maintenance [20,
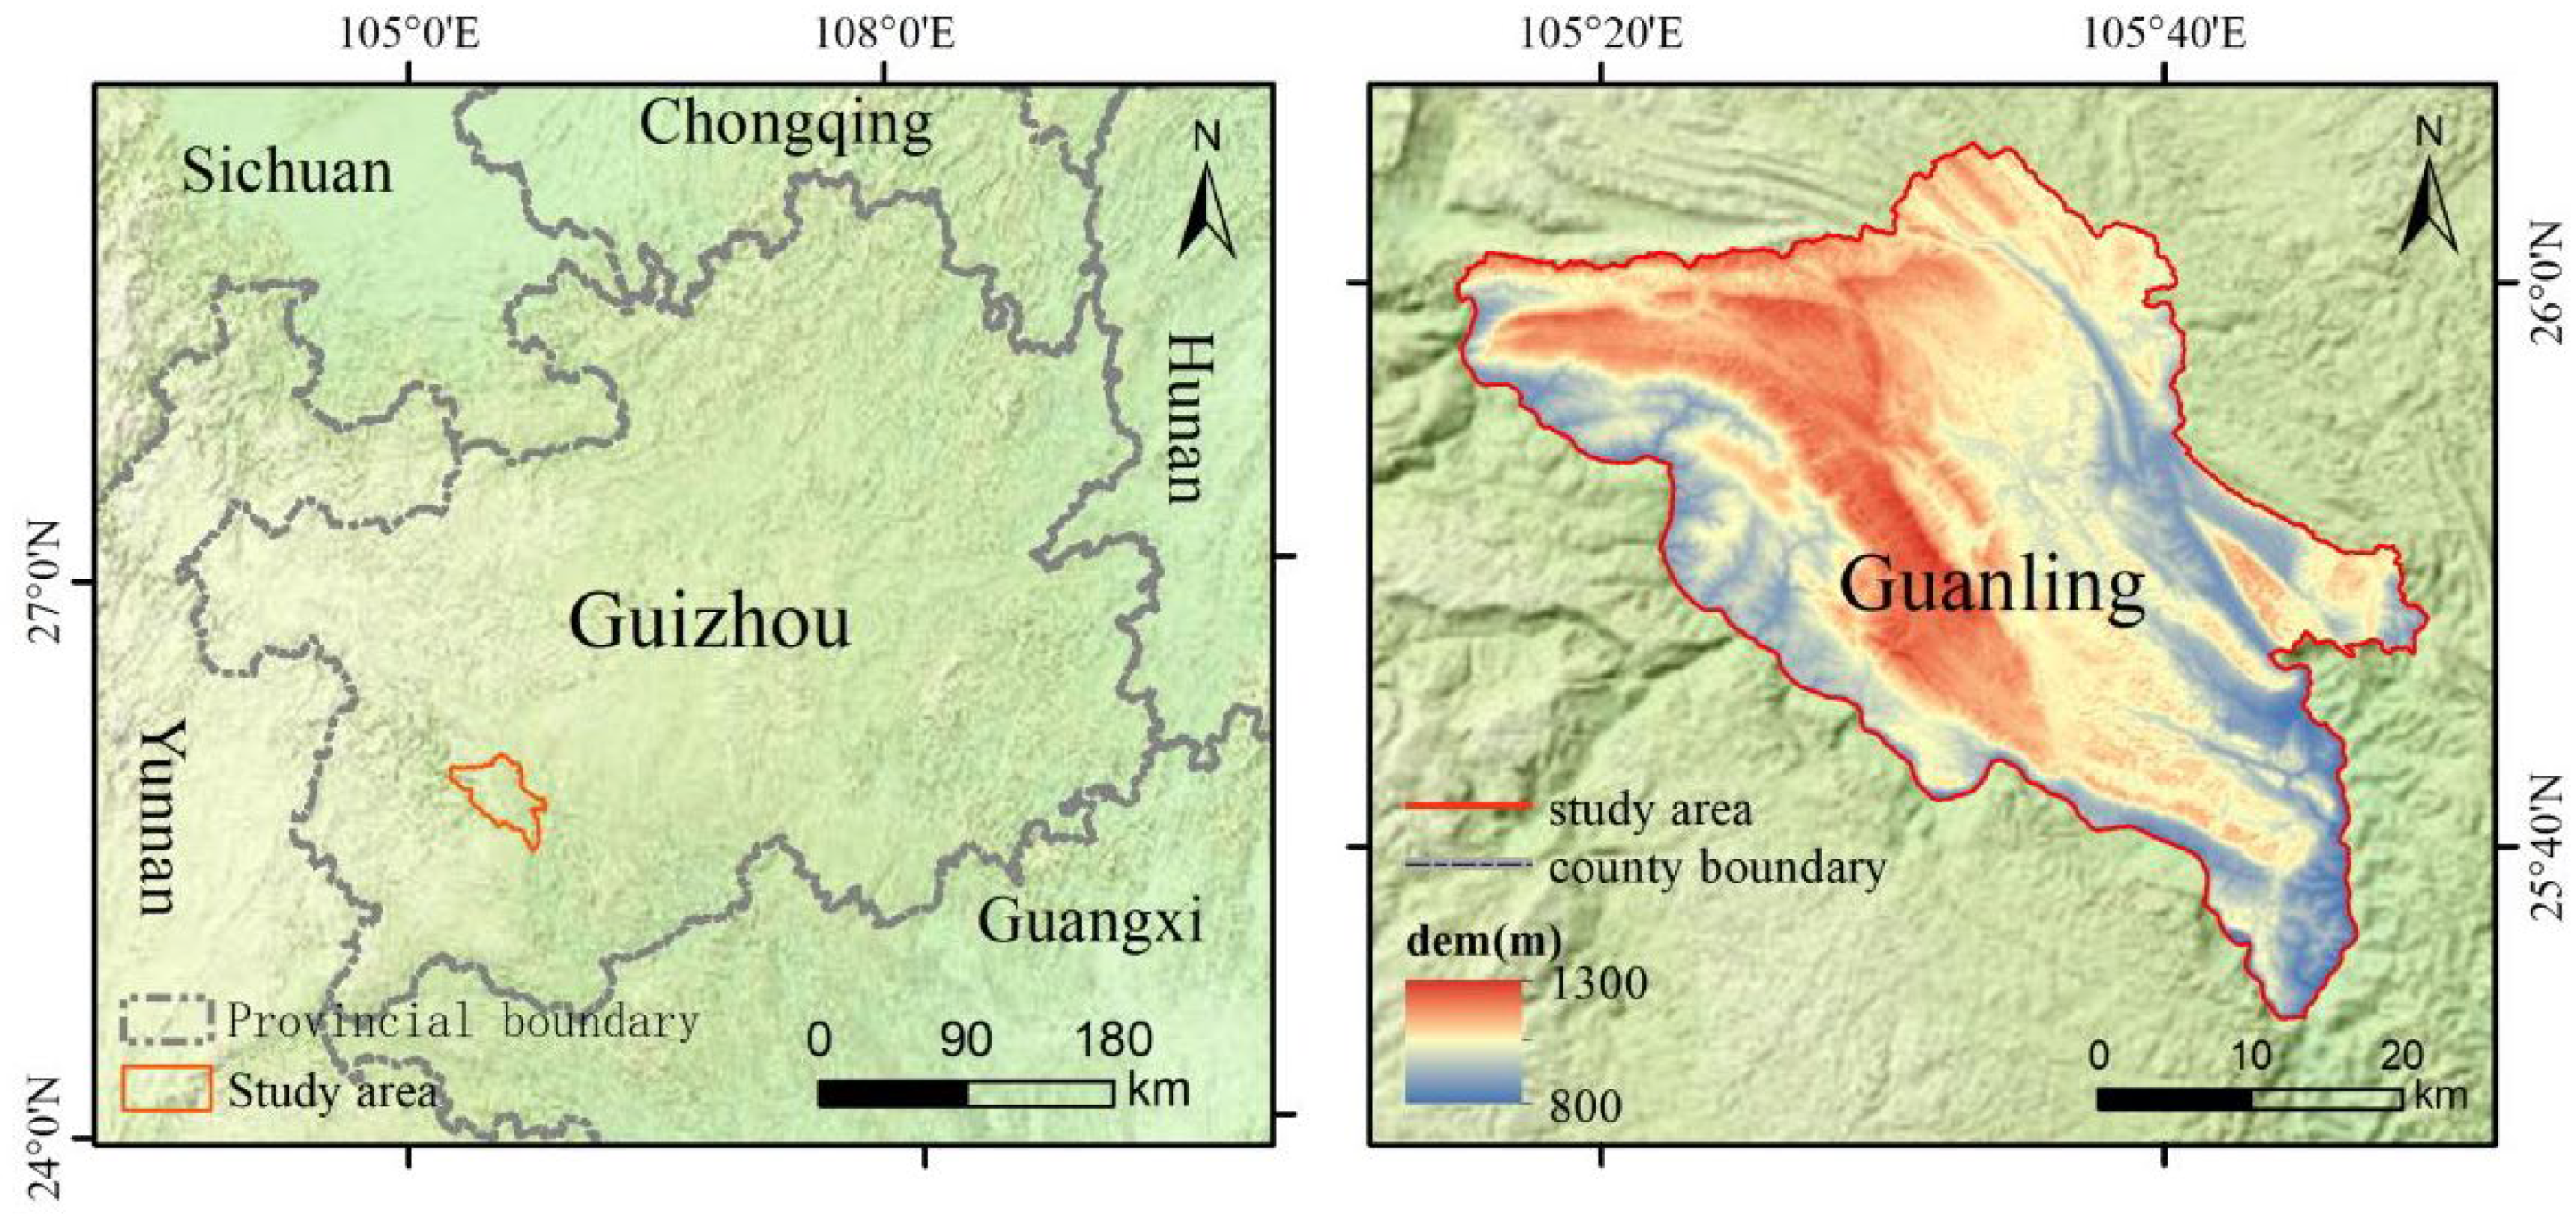
21], seriously endangering regional quality of ecological habitats. Therefore, understanding the impact of landscape pattern changes on quality of ecological habitats is crucial for formulating reasonable natural resource management and protection measures. Guanling County, a representative karst region, is dominated by extensive karst landforms. Fluctuations in its landscape patterns have exerted diverse impacts on habitat quality, threatening the sustainability of socio-economic and ecological functions. Thus, investigating habitat quality and deciphering the response mechanisms of landscape patterns in Guanling County can facilitate a more comprehensive assessment of ecological conditions across the broader southwest karst region. This research offers critical reference value for habitat quality studies in similar karst environments.
In recent years, studies on the impact of landscape pattern changes on quality of ecological habitats have received extensive attention [22]. For instance, Zhu et al. [21] explored the effects of urbanization and landscape patterns on quality of ecological habitats in Hangzhou using OLS and GWR models. They found that rapid urbanization had a statistically significant negative impact on quality of ecological habitats, with the degree and direction of landscape pattern influence varying spatiotemporally. Li et al. [23] studied the spatiotemporal evolution of landscape patterns and their impacts on quality of ecological habitats in Nanchang City, discovering that the rapid expansion of low-habitat-suitability land utilization types (e.g., construction land) increased landscape fragmentation and reduced stability. Gu et al. [24] analyzed quality of ecological habitats and landscape pattern evolution characteristics in Shaanxi Province, finding a clear spatial correlation between them, with statistically significant spatial clustering effects that weakened as urbanization intensified. In related research, models such as OLS [21], GWR [25], and MGWR [26] have been used to analyze landscape changes, each with unique characteristics and application contexts. The OLS model is simple and efficient but lacks precision in areas with strong spatial heterogeneity [27]. The GWR model addresses OLS limitations [28] through localized parameter estimation, though it may still struggle to capture spatial variability for all variables [21]. The MGWR model further enhances GWR functionality [26], allowing explanatory variables to exhibit diverse spatial heterogeneities across scales. This improvement in model flexibility and accuracy [29] makes MGWR particularly suitable for uncovering spatial instabilities in landscape change drivers, offering novel insights for research in karst mountainous regions. The MGWR model effectively captures dynamic processes under spatial heterogeneity [29]. For example, Tang et al. [30] used MGWR to comprehensively study the spatial heterogeneity of climate and landscape change impacts on soil conservation services at county, township, and watershed scales. Rong et al. [31] applied MGWR to explore driving factors of soil and water conservation services in the Beijing-Tianjin-Hebei region, discussing multi-scale mechanisms. Zhou et al. [32] combined Geographical Detector (GD), Random Forest (RF), and MGWR to reveal PM2.5 concentration changes in the Niger River Basin. Hu et al. [29] integrated GTWR and MGWR to explore spatiotemporal driving mechanisms of landscape patterns on quality of ecological habitats in Nanjing.
The InVEST (Integrated Valuation of Ecosystem Services and Tradeoffs) model, as an ecosystem service assessment tool, has been widely applied in ecological research at various scales [33,34]. Its quality of ecological habitats module quantifies the impact of human activities on biodiversity [35], assessing quality of ecological habitats by considering threat sources and their impacts on specific ecosystems [36]. For instance, Wu et al. [37] used InVEST to study spatiotemporal quality of ecological habitats changes in the Guangdong-Hong Kong-Macao Greater Bay Area. Wang et al. [38] explored regional impacts, and Wei et al. [39] analyzed changes in the Aibih Lake Basin. However, for complex terrains such as karst mountainous areas, a single InVEST model may insufficiently represent reality. Integrating InVEST with MGWR facilitates more refined habitat quality assessments in highly heterogeneous landscapes, providing new perspectives for studies on fragmented ecosystems.
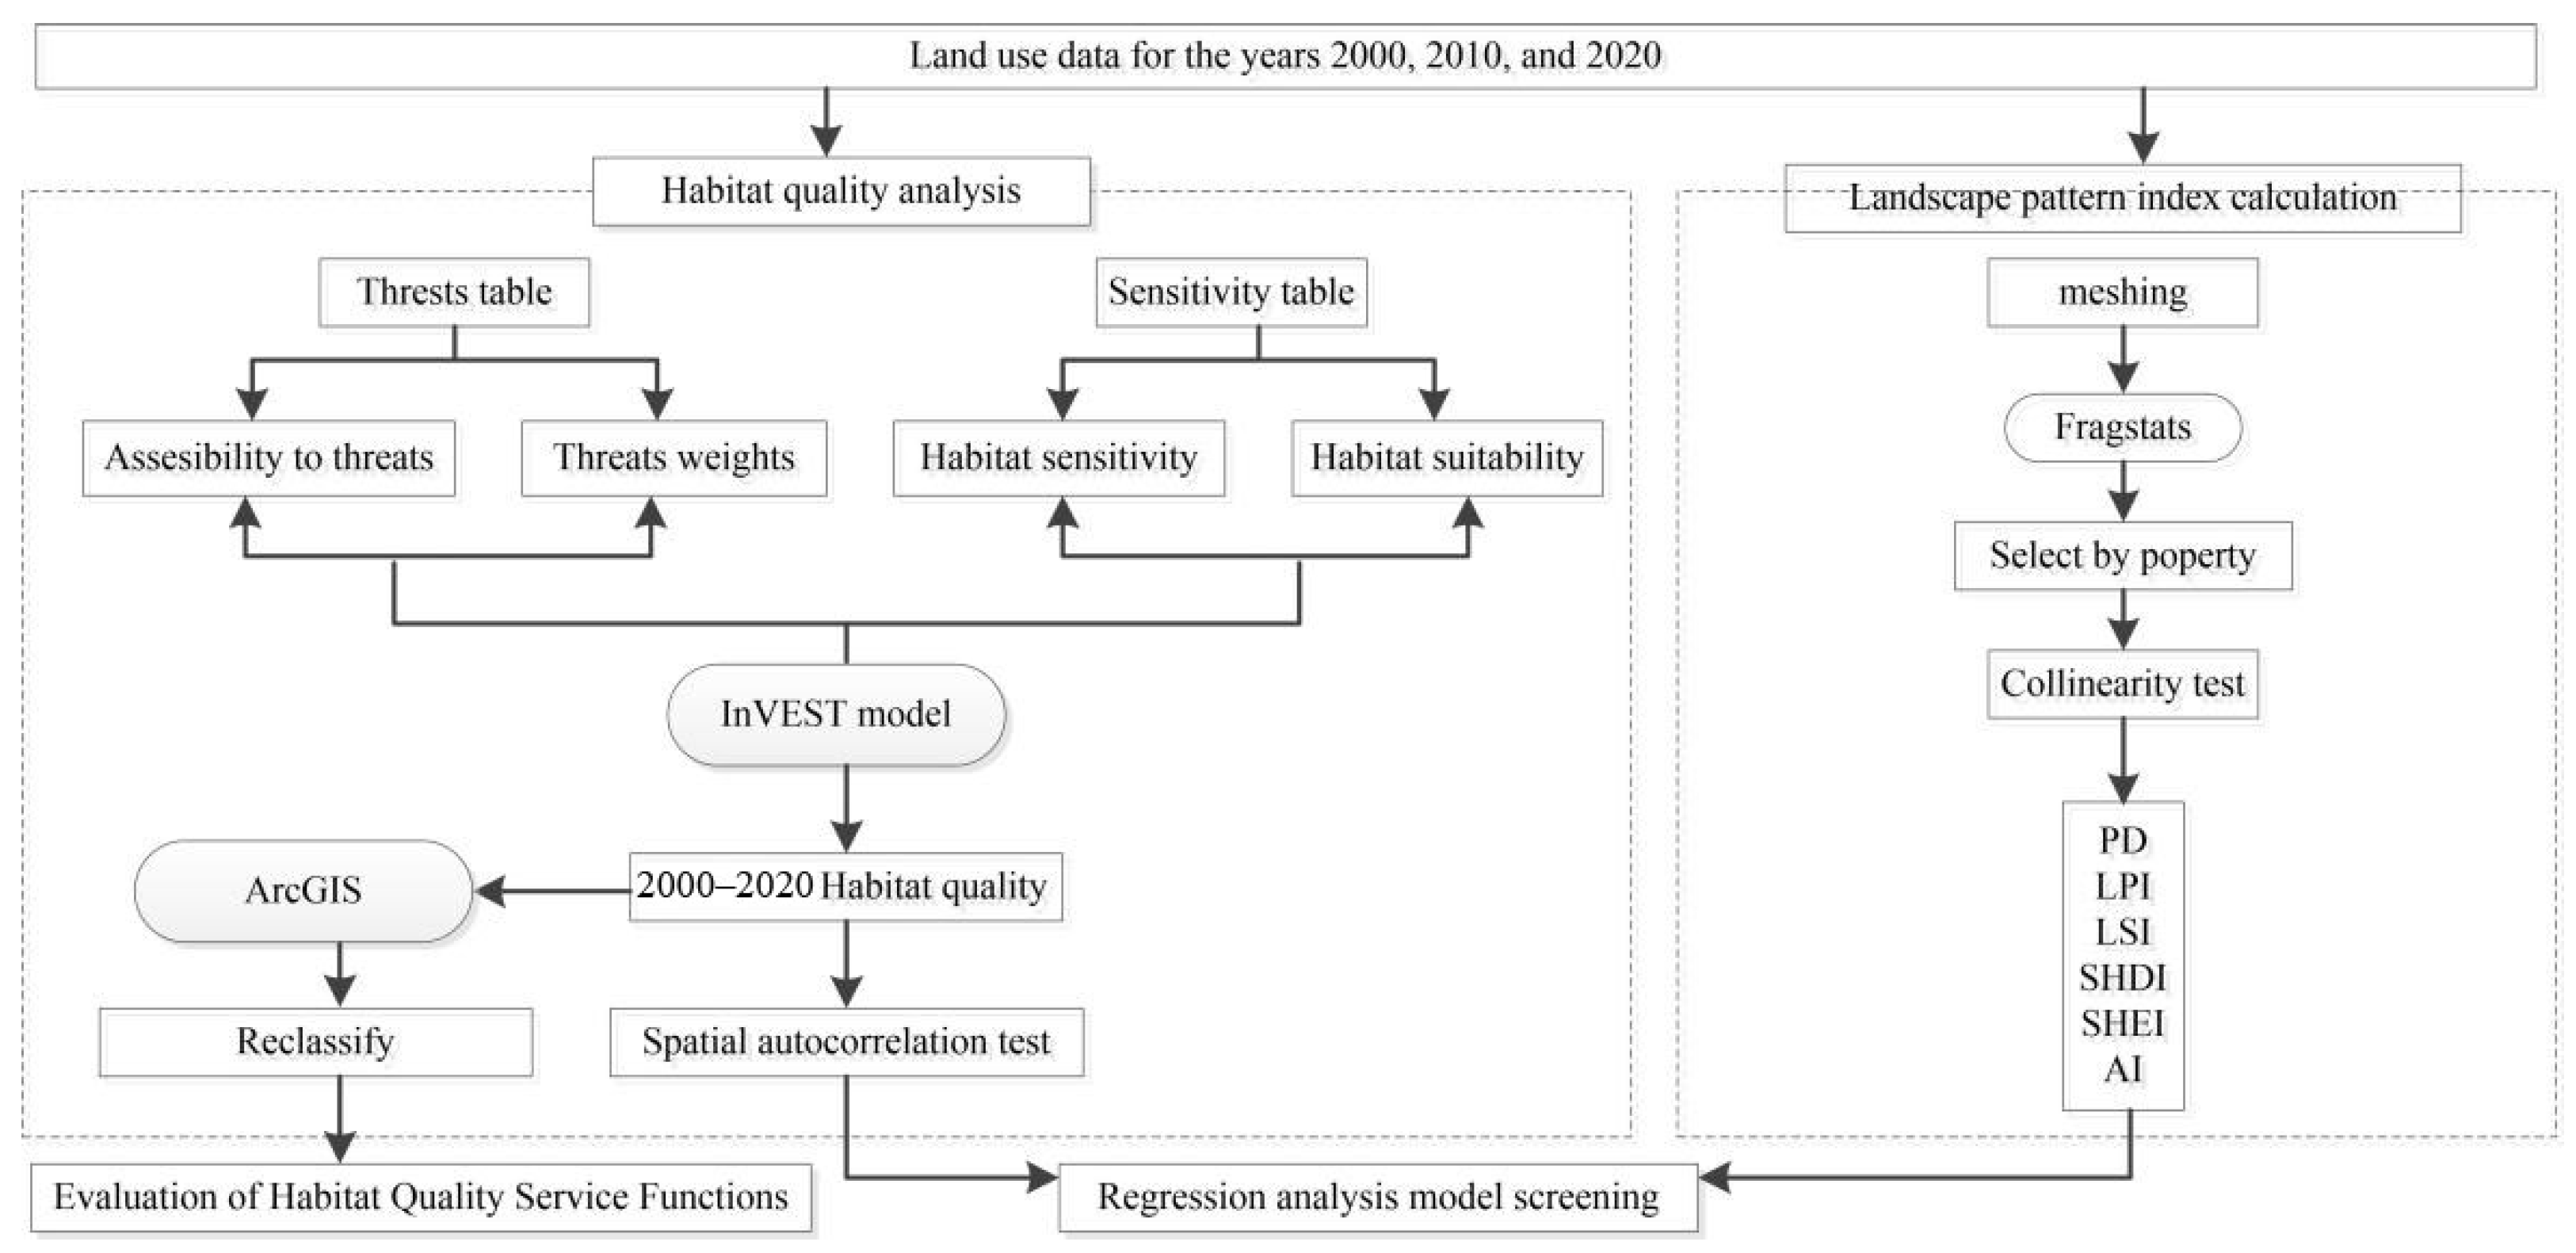
This study is intended to establish a quality of ecological habitats assessment system for karst mountainous areas using InVEST and MGWR spatial examination. It analyzes quality of ecological habitats changes under different landscape patterns and explores response mechanisms to landscape pattern changes, providing a comprehensive framework for karst quality of ecological habitats research. Through case studies, we aim to offer scientific support for ecological protection and policy formulation in these regions.

2. Materials and Methods

2.1. Study Area

Guanling Buyi and Miao Autonomous County (hereafter ‘Guanling County’) is situated in west-central Guizhou Province, China (Figure 1). Its geographical coordinates range from 105°21′ E to 105°56′ E and 25°29′ N to 25°55′ N. The total area of this county is approximately 1468 square kilometers. The terrain is highly undulating, with elevations averaging 800–1300 m. The region has a subtropical humid monsoon climate. The annual average temperature is about 14 °C, and the annual precipitation is around 1100 mm. The frost-free period is relatively long, which is conducive to the growth of various plants. This unique geographical location and climate conditions, combined with abundant natural resources, have enabled Guanling County to have a relatively high biodiversity and ecosystem service functions. The unique geological conditions of karst areas hinder restoration following soil erosion or land degradation [40,41]. In addition, affected by both natural and human activities, the phenomenon of rocky desertification in this region is very serious, causing varying degrees of interference to the integrity and stability of the regional ecosystem. In recent years, with the implementation of land management and ecological protection measures, the area of rocky desertification has statistically significantly decreased, dropping from 47.41% to below 10%. Therefore, this area is not only an ideal place for studying the ecosystem service functions of karst landforms, but also an important region for exploring the interaction relationship between human activities and the natural environment [42].

2.2. Data Sources

Land use data for 2000, 2010, and 2020 were obtained from the Resource and Environmental Science Data Center of the Chinese Academy of Sciences (http://www.resdc.cn (accessed on 1 December 2024)), with a spatial resolution of 30 m [43]. The data were preprocessed and reclassified using ArcGIS 10.8. The DEM data were sourced from the Geospatial Data Cloud Platform (http://www.gscloud.cn (accessed on 1 December 2024)), with a resolution of 10 m. Based on the ecological context of southern China’s karst mountainous areas, we identified four threat sources: cultivated land, urban land, rural settlements, and transportation land. Following the InVEST Model Manual [44] and prior studies [6,45,46], we determined the maximum impact distances, weights, spatial attenuation types, habitat suitability, and sensitivity of each land utilization type to threat sources. Table 1 and Table 2.

2.3. Methods

2.3.1. InVEST Model

The InVEST quality of ecological habitats module evaluates quality of ecological habitats on the basis of land utilization data, incorporating the relative sensitivity of habitat types to threats, threat factor data, maximum impact distances, and weights [47]. The quality of ecological habitats index ranges from 0 to 1. The larger the value, the better the quality of ecological habitats [48]. The calculation formula is:
Q x j = H j 1 ( D x j Z D x j Z + k Z )
D x j = r = 1 R y = 1 Y r ( ω r / r = 1 R ω r ) r y i r x x y β x S j r
i r x y = 1 ( d x y / d r m a x )
where Qxj is the quality of ecological habitats index; Hj is the habitat suitability of the jth place class; Dxj is the habitat degradation index of the xth raster in the jth place class; k is the half-saturation constant; Z is the model transformation coefficient; R is the total number of threat sources; r is the rth threat source; Yr is the total number of rasters for the rth threat source; y is the raster cell where the rth threat source is located; and ωr is the weight of the rth threat source; irxy is the maximum coercive distance of the threat source of category r; βx is the accessibility of the threat source to the xth grid; Sjr is the sensitivity of the jth land class to the threat source of category r; dxy denotes the distance between grids x and y, and drmax is the maximum influence range of the threat factor r.

2.3.2. Spatial Autocorrelation

Spatial autocorrelation can quantitatively describe the degree of similarity of attribute values and their spatial correlation patterns of spatially proximate regional units [49], which is employed to explore the spatial distribution characteristics of a certain geographic phenomenon and the degree of aggregation among variables between neighbouring regions [50], and is divided into global autocorrelation and local autocorrelation. In order to measure and test the degree of spatial dependence and spatial variation of quality of ecological habitats in the study area, this research effort conducted spatial autocorrelation analyses on the distribution pattern of quality of ecological habitats indices of karst mountainous areas in 2000, 2010, and 2020 to explore the spatial and temporal heterogeneity of the quality of ecological habitats in karst mountainous areas, and the indices were calculated to include the global spatial autocorrelation Moran’s I index, as well as local spatial autocorrelation. Moran’s I index, calculated as [51]:
I = N i = 1 N j = 1 N ω i j ( x i x ¯ ) ( x j x ¯ ) ( i = 1 N j = 1 N ω i j ) i = 1 N ( x j x ¯ ) 2
where I is the global Moran’s I in the range [−1, 1]; N refers to the total number of spatially observed objects in the study area; xi and xj represent the observations at the ith and jth spatial locations, respectively; is the mean value of all the observations; and ωij is then used as a spatial weight matrix to describe the spatial proximity of the ith and jth monitoring objects.
Local spatial autocorrelation analysis was performed using LISA clusters. LISA clustering can indicate correlation between spatial variables at a certain level of significance [52], and four spatial distribution patterns were generated by local Moran’s I, including high-high, high-low, low-high, and low-low aggregation [53].

2.3.3. The MGWR Model

Multi-scale geographically weighted regression (MGWR), an extension of traditional GWR [54], models spatial variability by allowing variable-specific bandwidths. Its ability to capture the spatial heterogeneity of data is improved by its ability to have different coefficients in different geographical units [55]. The formula is as follows [56]:
γ i = i = 1 n β b w j ( u i , v i ) X i j + ε i
where: γi denotes quality of ecological habitats; xij denotes natural or socio-economic factors; εi denotes the random error term; (ui, vi) denotes the spatial coordinates of the sample points; βbwj is the regression coefficient of fitting variable j using a specific bandwidth; the larger the absolute value of the regression coefficient, the stronger the effect on the quality of ecological habitats [57].
Reference to existing studies [58,59,60], six landscape pattern indices, PD (patch density), LPI (maximum type patch index), LSI (landscape shape index), SHDI (Shannon diversity index), SHEI (Shannon homogeneity index), and AI (agglomeration index), were selected for data processing and examination

2.3.4. Research Framework

The InVEST model was employed to quantify the spatial distribution of quality of ecological habitats. The quality of ecological habitats index, serving as the dependent variable of the MGWR model, was calculated using InVEST for the years 2000, 2010, and 2020 to generate raster data. Taking a 500 m × 500 m grid as the unit, the average quality of ecological habitats of each grid was extracted as the response variable for MGWR, further revealing the scale dependency of landscape patterns on quality of ecological habitats. The research framework is illustrated in Figure 2:

3. Results

3.1. Analysis of Spatial and Temporal Evolution of Habitat Quality

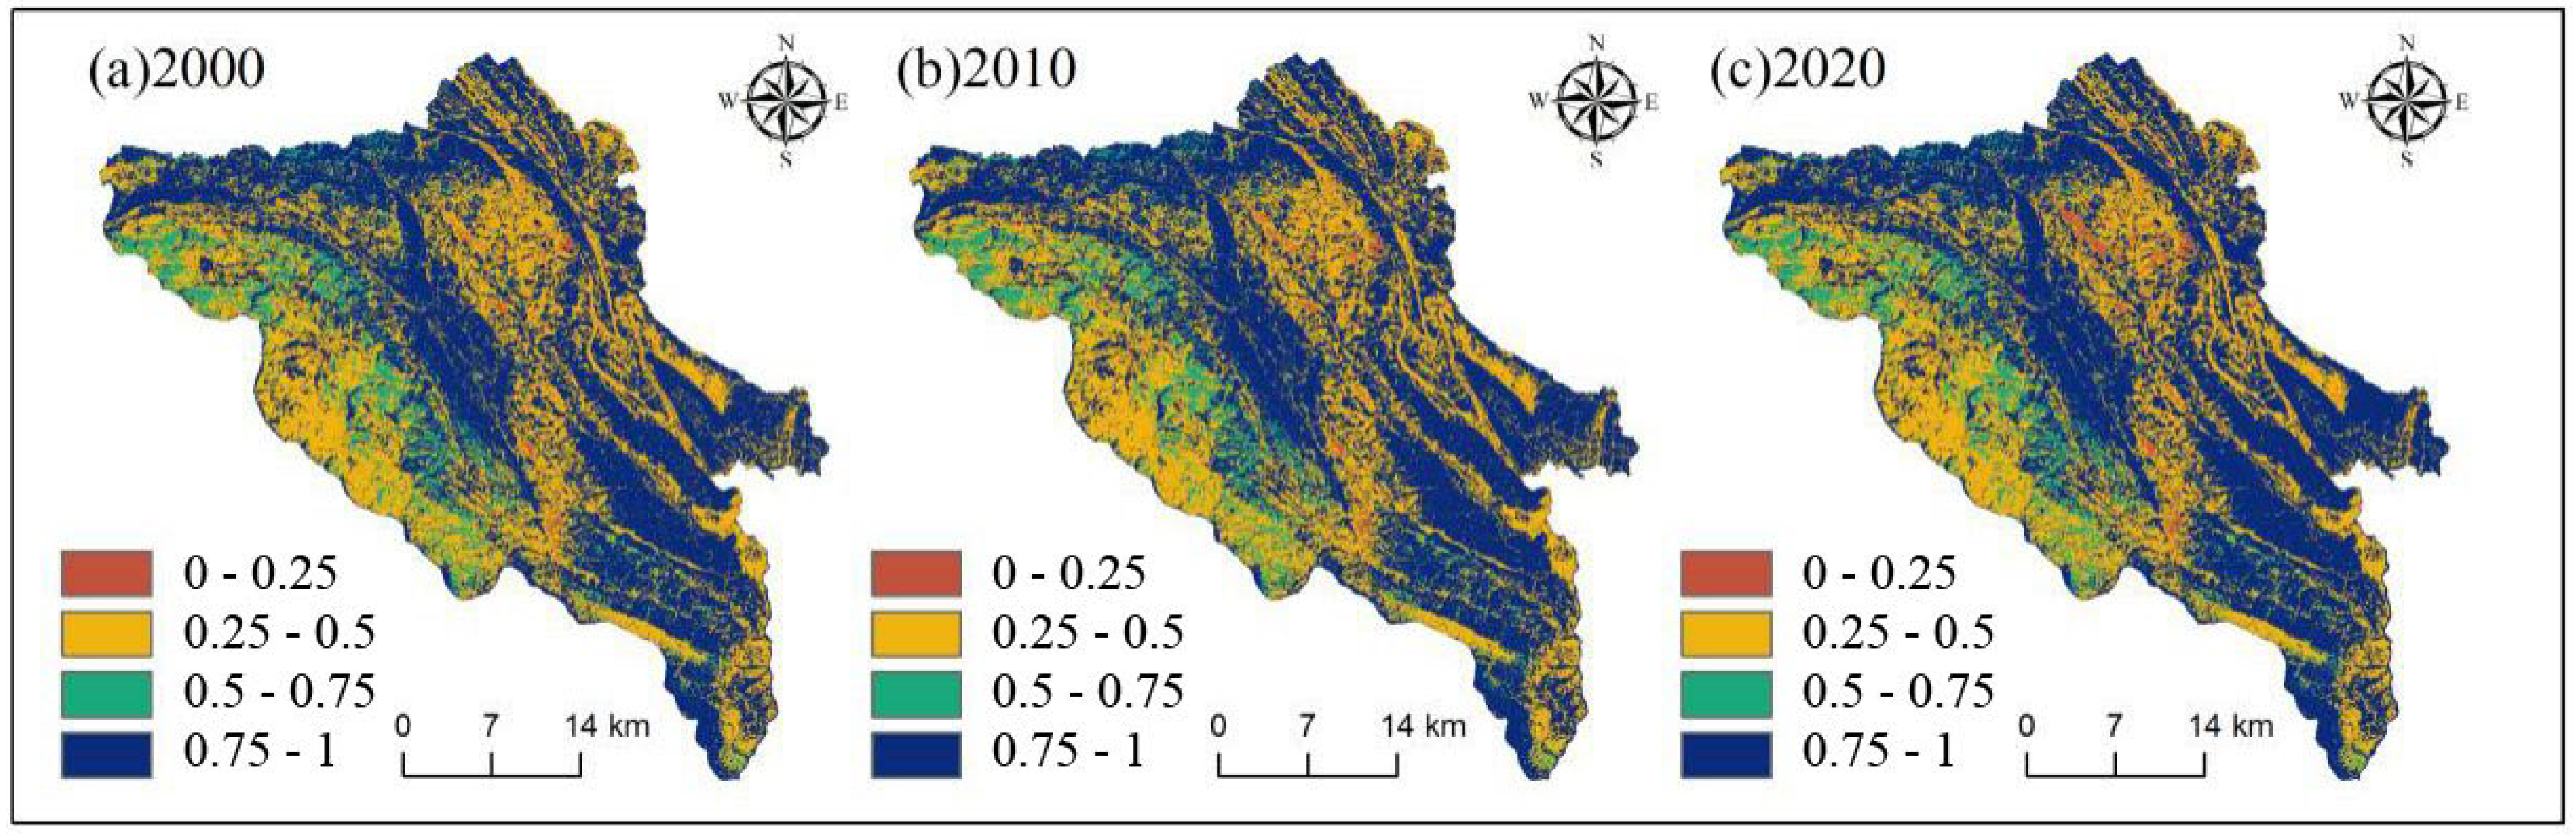
The quality of ecological habitats index effectively reflects the suitability of the regional ecosystem. Using the InVEST model, the quality of ecological habitats of the study area was analyzed and classified into four intervals: low (0–0.25), relatively low (0.25–0.5), relatively high (0.5–0.75), and high (0.75–1).
From 2000 to 2020, the proportions of quality of ecological habitats levels in Guanling County, ranked in descending order, were high-level quality of ecological habitats, relatively high-level quality of ecological habitats, relatively low-level quality of ecological habitats, and low-level quality of ecological habitats (Table 3) Among them, the distribution range of high-level and relatively high-level quality of ecological habitats in Guanling County was larger than that of low-level and relatively low-level quality of ecological habitats. The high-level quality of ecological habitats increased by 0.19% over the 20-year period, and the relatively high-level quality of ecological habitats increased by 1.38%. The continuous expansion of high-level and relatively high-level quality of ecological habitats areas contributed to an overall improvement in regional quality of ecological habitats. The relatively low-level quality of ecological habitats decreased by 2.54%, indicating that the low-level quality of ecological habitats improved year by year. However, low-level quality of ecological habitats increased by 0.97%, indicating an expanding trend, though its impact on overall quality of ecological habitats remained relatively minor.
In terms of space (Figure 3 and 
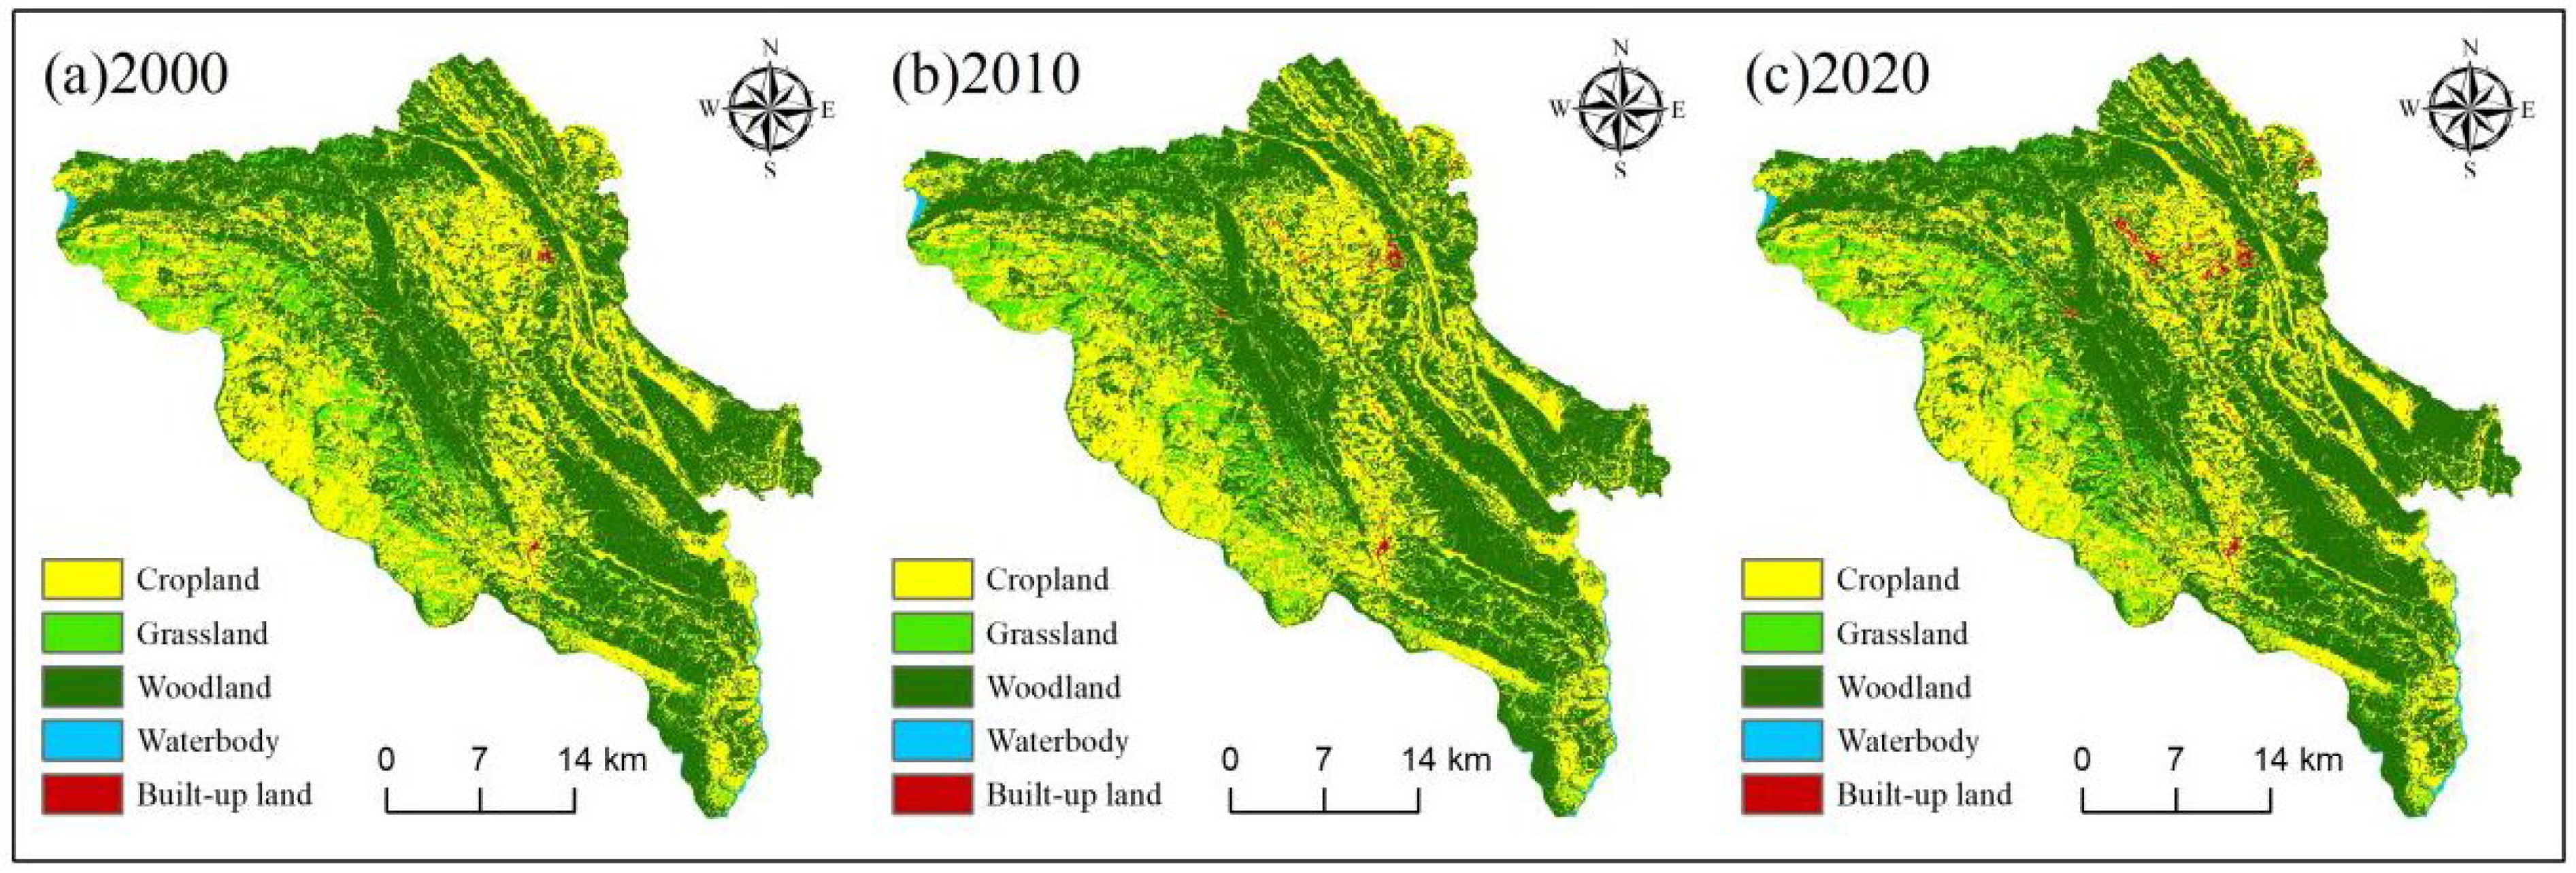
Figure 4), low-level quality of ecological habitats was concentrated in the construction area, low relatively low-level quality of ecological habitats was concentrated in the farmland area, relatively high-level quality of ecological habitats was concentrated in the grassland area, high-level quality of ecological habitats was widely distributed in the forest and water area, and the quality of ecological habitats in the natural ecological areas with less human activities was relatively high. The areas with frequent human activities in the social and economic development regions were the concentrated areas of low quality of ecological habitats. This indicates that the spatial distribution of different levels of quality of ecological habitats in Guanling County has a strong correlation with land utilization, and the quality of ecological land is positively correlated with the quality of habitat, while the result of construction land is the opposite.

3.2. Spatial Autocorrelation Test for Habitat Quality

Prior to applying the MGWR model, spatial autocorrelation of regional quality of ecological habitats was assessed. Using ArcGIS, the study area was divided into 500 m × 500 m grids, and the quality of ecological habitats of each grid was extracted using the Multi-Value Extract to Point tool. Subsequently, spatial autocorrelation examination was performed to derive descriptive statistical parameters for the spatial effects of quality of ecological habitats. As shown in Table 4, the Moran’s I values from 2000 to 2020 all passed the significance test (p < 0.01), with the numerical range being between 0.70 and 0.71, and the Z values were all greater than 25. This suggests that quality of ecological habitats in Guanling County exhibits statistically significant spatial autocorrelation. Further examination revealed a decline in Moran’s I values from 2000 to 2020, indicating a weakening trend in the spatial aggregation of quality of ecological habitats.
In order to better study the internal spatial clustering characteristics of quality of ecological habitats in Guanling County, it is necessary to conduct local spatial autocorrelation examination of the study area. By identifying hotspots (high-high clustering), coldspots (low-low clustering), and spatial outliers (high-low clustering and low-high clustering) [60], the spatial distribution patterns of geographical phenomena in Guanling County can be studied (Figure 5). Among them, hotspots are mainly distributed in forestland and grassland areas, and the quality of ecological habitats shows a high-high clustering state; coldspots are mainly concentrated in cultivated land and construction areas, and the quality of ecological habitats shows a low-low clustering state. Overall, from 2000 to 2020, the quality of ecological habitats in Guanling County has a high degree of spatial clustering in forestland and grassland areas.
The spatial heterogeneity of quality of ecological habitats in Guanling Karst mountainous area requires full consideration of regional land policies. In high-high aggregation areas, more attention should be paid to natural restoration to enhance the resilience of the ecosystem and consolidate the achievements of ecological protection. For instance, adhering to the policies of returning farmland to forest and protecting natural forests, strictly controlling the frequency of human activities to maintain the stability of regional ecological environment. On this basis, appropriate development of ecological tourism and other projects can be carried out as special channels for economic development. In low-low aggregation areas, strict control of environmental pollution and strengthening land utilization management are needed; an ecological compensation mechanism should be established to counterbalance the weakening of habitats caused by the expansion of construction land. For example, adjusting the industrial structure, developing low-carbon industries, building green industrial parks, and developing clean energy can promote the coordinated development of regional human and land resources. In areas with unstable quality of ecological habitats, ecological connections between different regions need to be strengthened. For instance, constructing ecological corridors to enhance the connectivity of habitats to improve the regional habitat function; strengthening land management, etc., targeted ecological restoration should be carried out to gradually improve the regional quality of ecological habitats.

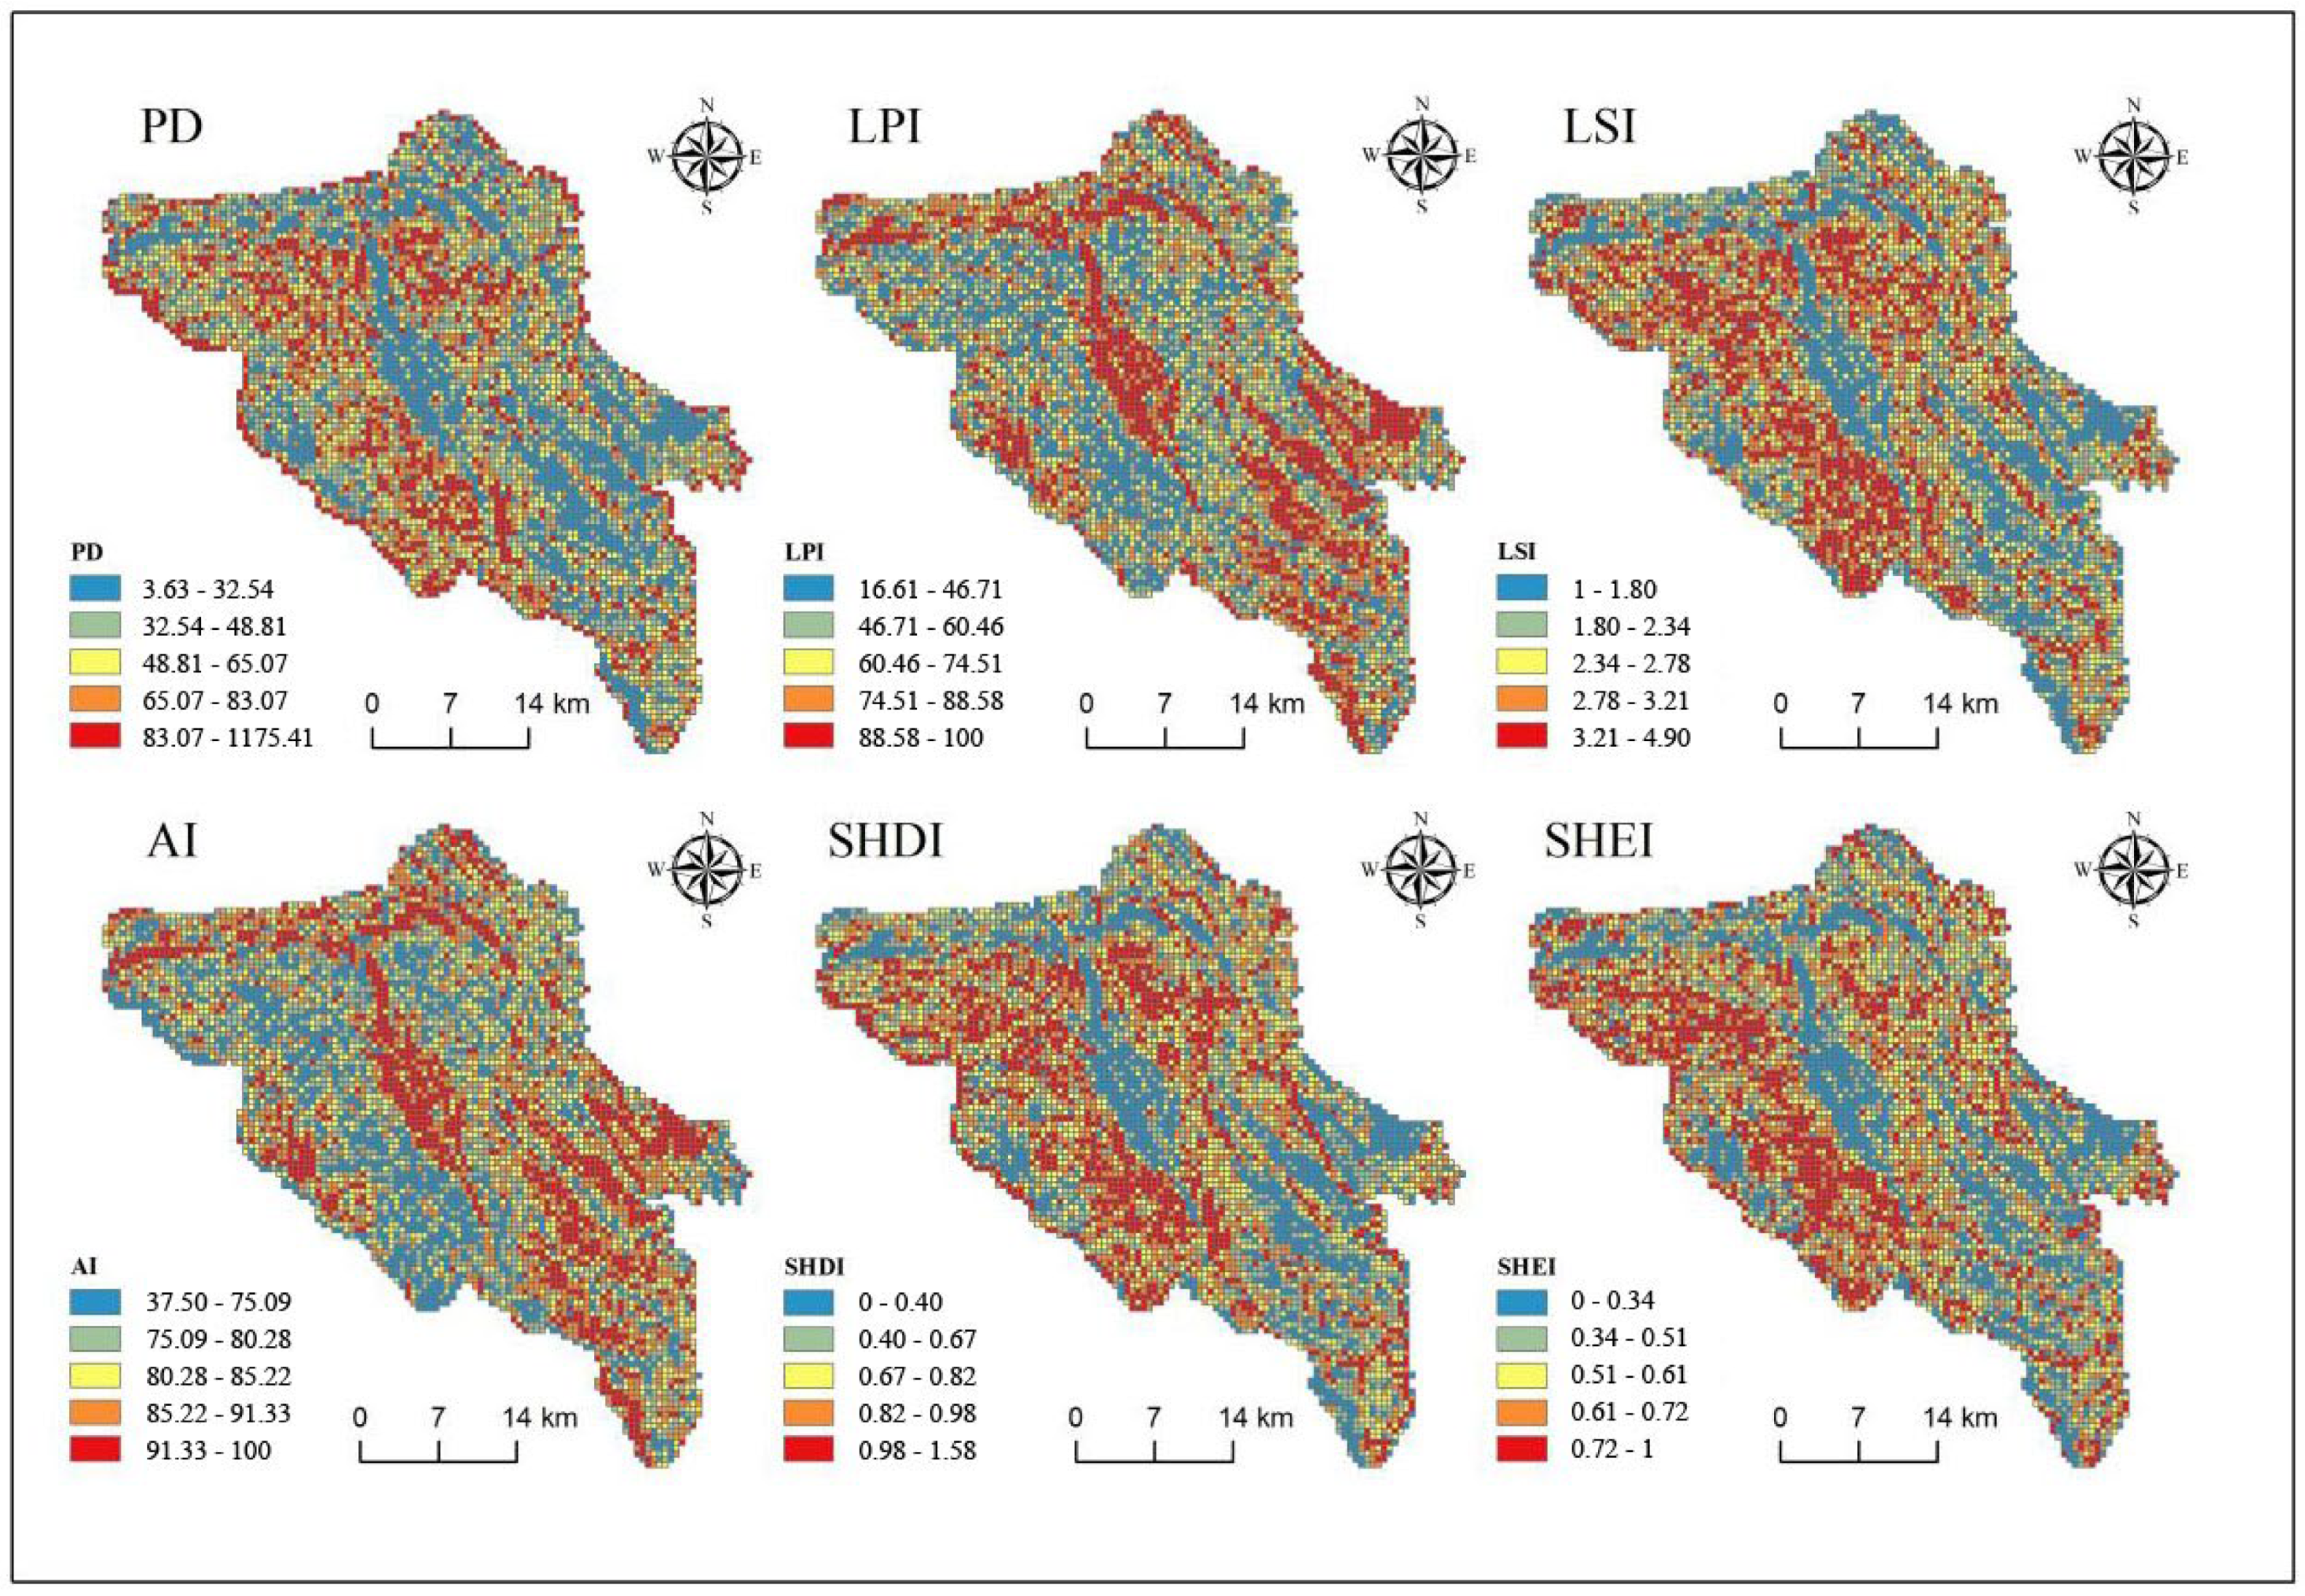
3.3. Landscape Pattern Index Evolution

The landscape pattern indices exhibit distinct spatial distribution patterns in Guanling County (Figure 6). Taking 2020 as an example, the study found that the high values of PD, LSI, SHDI and SHEI were concentrated in the western, southern and northeastern parts of the study area. The land utilization types in these areas were mainly construction land, cultivated land, grassland and water bodies. The low values were mainly distributed in the areas with concentrated forest land. The high and low value distribution patterns of LPI and AI were exactly opposite to those of the above indices. As shown in Table 5, landscape-level calculations reveal statistically significant downward trends in PD, LPI, and LSI values over the past two decades, while the SHDI, SHEI and AI values have shown an upward trend.
A decrease in PD value indicates that the number of patches within the same area has decreased, which usually reflects a decline in the overall heterogeneity or fragmentation degree of the landscape. For instance, large-scale monoculture plantations make the originally diverse landscape more uniform, reducing the number of patches and thereby increasing the average area of each patch. The decrease in the PD value indicates that Guanling County has been affected by natural processes such as forest restoration, or human activities such as agricultural integration. As a result, multiple small patches have merged into larger ones, leading to a reduction in the total number of patches. A decrease in the LPI value indicates that the proportion of the largest patches has decreased relative to the total area of the landscape. A decrease in LSI value means that the shapes of landscape patches become simpler or more regular, which usually reflects the smoothing of patch edges or the tendency of patch shapes to be rectangular or circular, indicating that the shape of the landscape in Guanling County has been affected to some extent by agricultural activities, nature conservation or other human interventions. Among them, large-scale land leveling and farmland integration agricultural activities reduce patch edges, making patch shapes more regular; nature conservation projects promote the restoration of forests or other natural landscapes, reducing fragmentation. An increase in the Shannon diversity index (SHDI) reflects greater diversity in patch types across Guanling County. This is due to the introduction of new land utilization types or ecological restoration measures leading to an increase in the number of different types of patches, making the landscape more diverse. From 2010 to 2020, the emergence of new residential areas around the county towns led to an increase in the diversity of patch types. The fragmentation expansion of construction land within the county was also an important reason for the rise in SHDI. An increase in Shannon evenness index (SHEI) indicates a more uniform distribution of different patch types in the landscape, with no single type of patch occupying an overwhelming proportion, reflecting a more balanced distribution of patch types in Guanling County. An increase in Aggregation Index (AI) means that similar types of patches are more inclined to cluster together, forming larger continuous areas rather than being scattered throughout the landscape.
Collectively, these trends indicate an evolutionary process toward greater diversity and structural complexity in the landscape of Guanling’s karst mountainous area. This evolution is conducive to enhancing the service functions of the ecosystem, such as providing more habitats, strengthening the stability of the ecosystem and its ability to resist disturbances. However, such changes also need to be analyzed in the light of specific circumstances, such as whether they have had adverse effects on specific species and whether they are in line with the local ecological planning goals. If these changes are achieved through sustainable means and taking into account the characteristics and needs of the local ecosystem, they are usually positive. Conversely, if these changes lead to the disruption of certain key ecological processes, such as urban expansion, economic development, ecological protection, land policies and other activities related to them, they may bring negative effects.

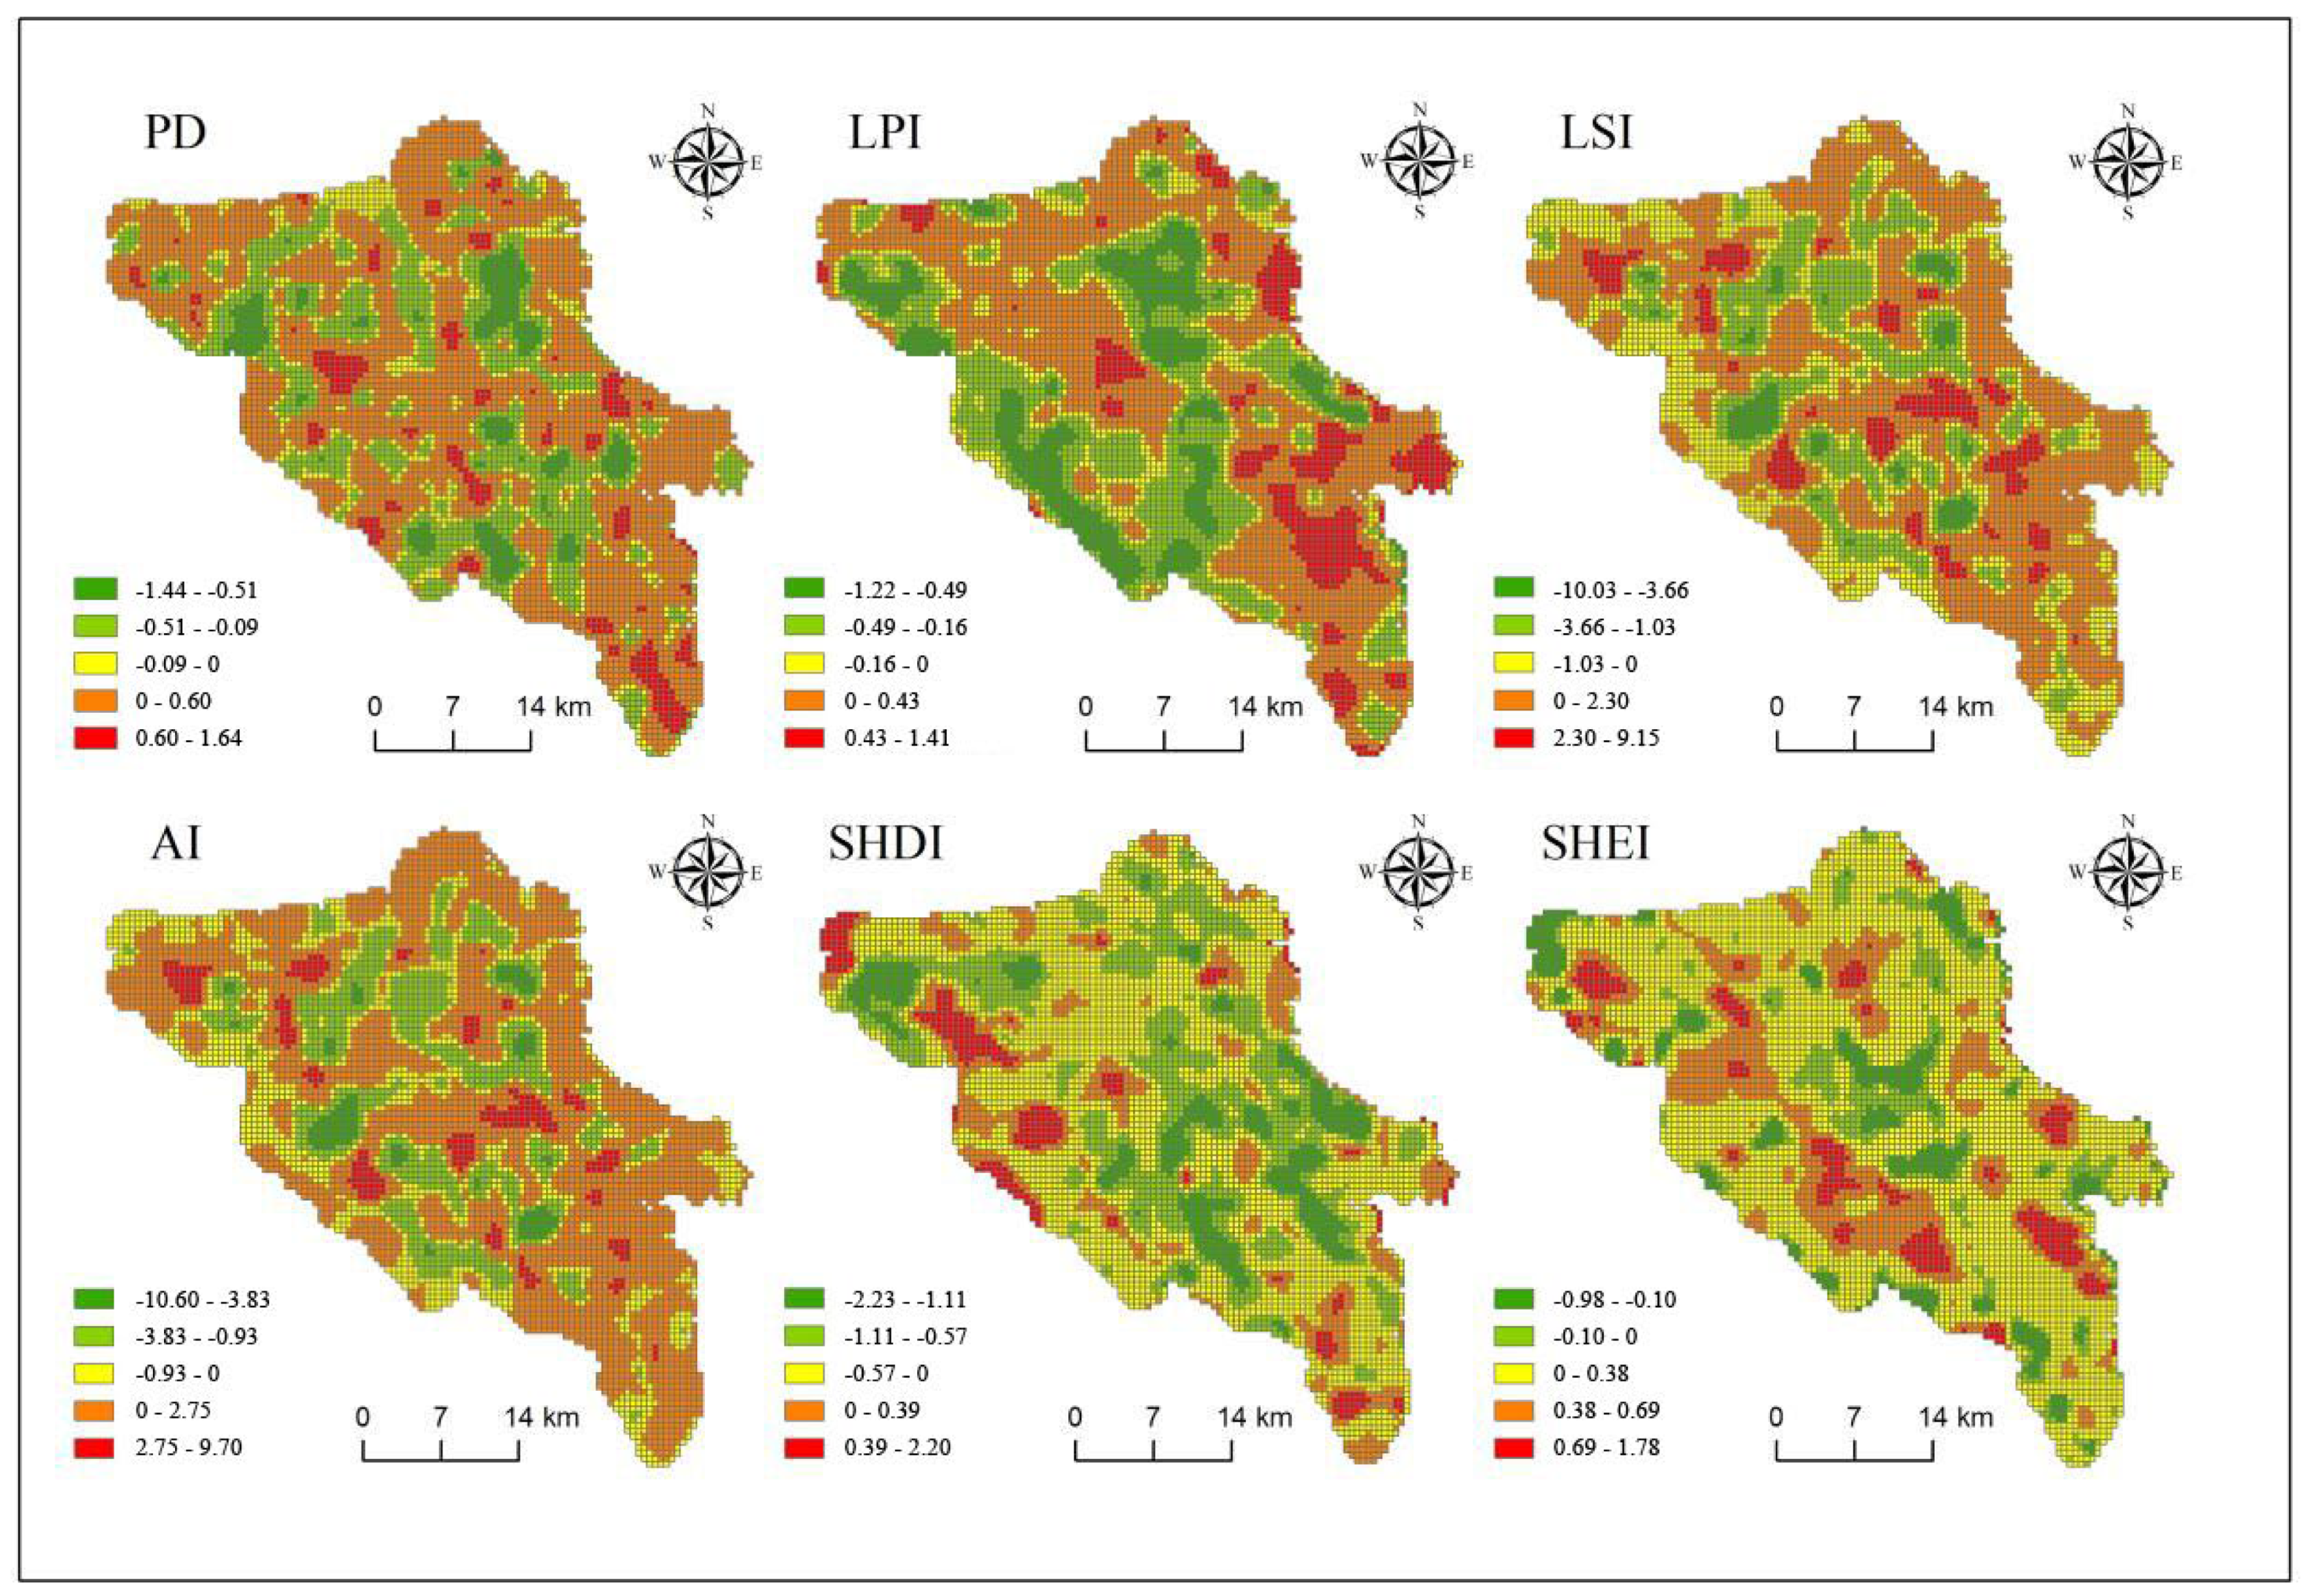
3.4. Analysis of the Relationship Between Habitat Quality and Landscape Pattern

The MGWR model demonstrated high explanatory power (>89%), confirming the suitability of the selected influencing factors for modeling. Table 6 presents the descriptive statistics of the regression coefficients of the six landscape indices. The average and median values of the regression coefficients of PD, SHDI, and SHEI are close, and their impacts on quality of ecological habitats tend to be homogeneous spatially. The average and median values of the regression coefficients of LPI, LSI, and AI differ statistically significantly, and their impacts on quality of ecological habitats have strong heterogeneity spatially. The variation range of the regression coefficients of each landscape index is large, indicating that the differences in the direction and intensity of their spatial impacts are statistically significant, and their impacts on quality of ecological habitats have statistically significant spatial heterogeneity (Figure 7). The six landscape indices have positive or negative impacts on the quality of ecological habitats of different areas in the study area. Among them, PD, LPI, LSI, SHEI, and AI have positive impacts on quality of ecological habitats in the study area, accounting for 59.87%, 51.59%, 54.42%, 81.07%, and 59.14% of the total area, respectively. Among them, the positive impacts of PD and LPI are highly consistent with the distribution areas of forests, gradually weakening outward from the center, and the heterogeneity environment has a positive impact on the quality of ecological habitats of forests. While LSI and AI have different impacts on quality of ecological habitats in different land utilization types. The positive impact of SHEI is mainly concentrated in the cultivated land and grassland areas, indicating that the more balanced the landscape patches are, the more positive the impact on regional quality of ecological habitats is. SHDI has a negative impact on quality of ecological habitats as the main factor, accounting for 79.00% of the total area. Overall, landscape diversity has the greatest negative impact on the quality of ecological habitats of forest and grassland, gradually weakening outward from the center to the areas with forest and grassland, and has positive impacts on construction land and cultivated land, gradually weakening outward from the center. It indicates that the quality of ecological habitats in these areas is relatively higher, but decreases with the reduction of landscape diversity. The main reason for this phenomenon lies in the strong connectivity of ecological land such as forests and grasslands in Guanling Karst mountainous area. The fragmented and diverse landscape patterns to some extent will disrupt the connectivity of the ecosystem, and isolated ecological land is relatively fragile, with a greatly reduced ecological restoration capacity. Eventually, its ecological service functions are reduced. While construction land and cultivated land such as economic construction land are distributed relatively scattered under the influence of the spatial geography of the Karst mountainous area, isolated construction land and cultivated land are bound to be affected in economic development. However, they have great significance in stabilizing the environmental quality of regional species habitats and maintaining biodiversity.

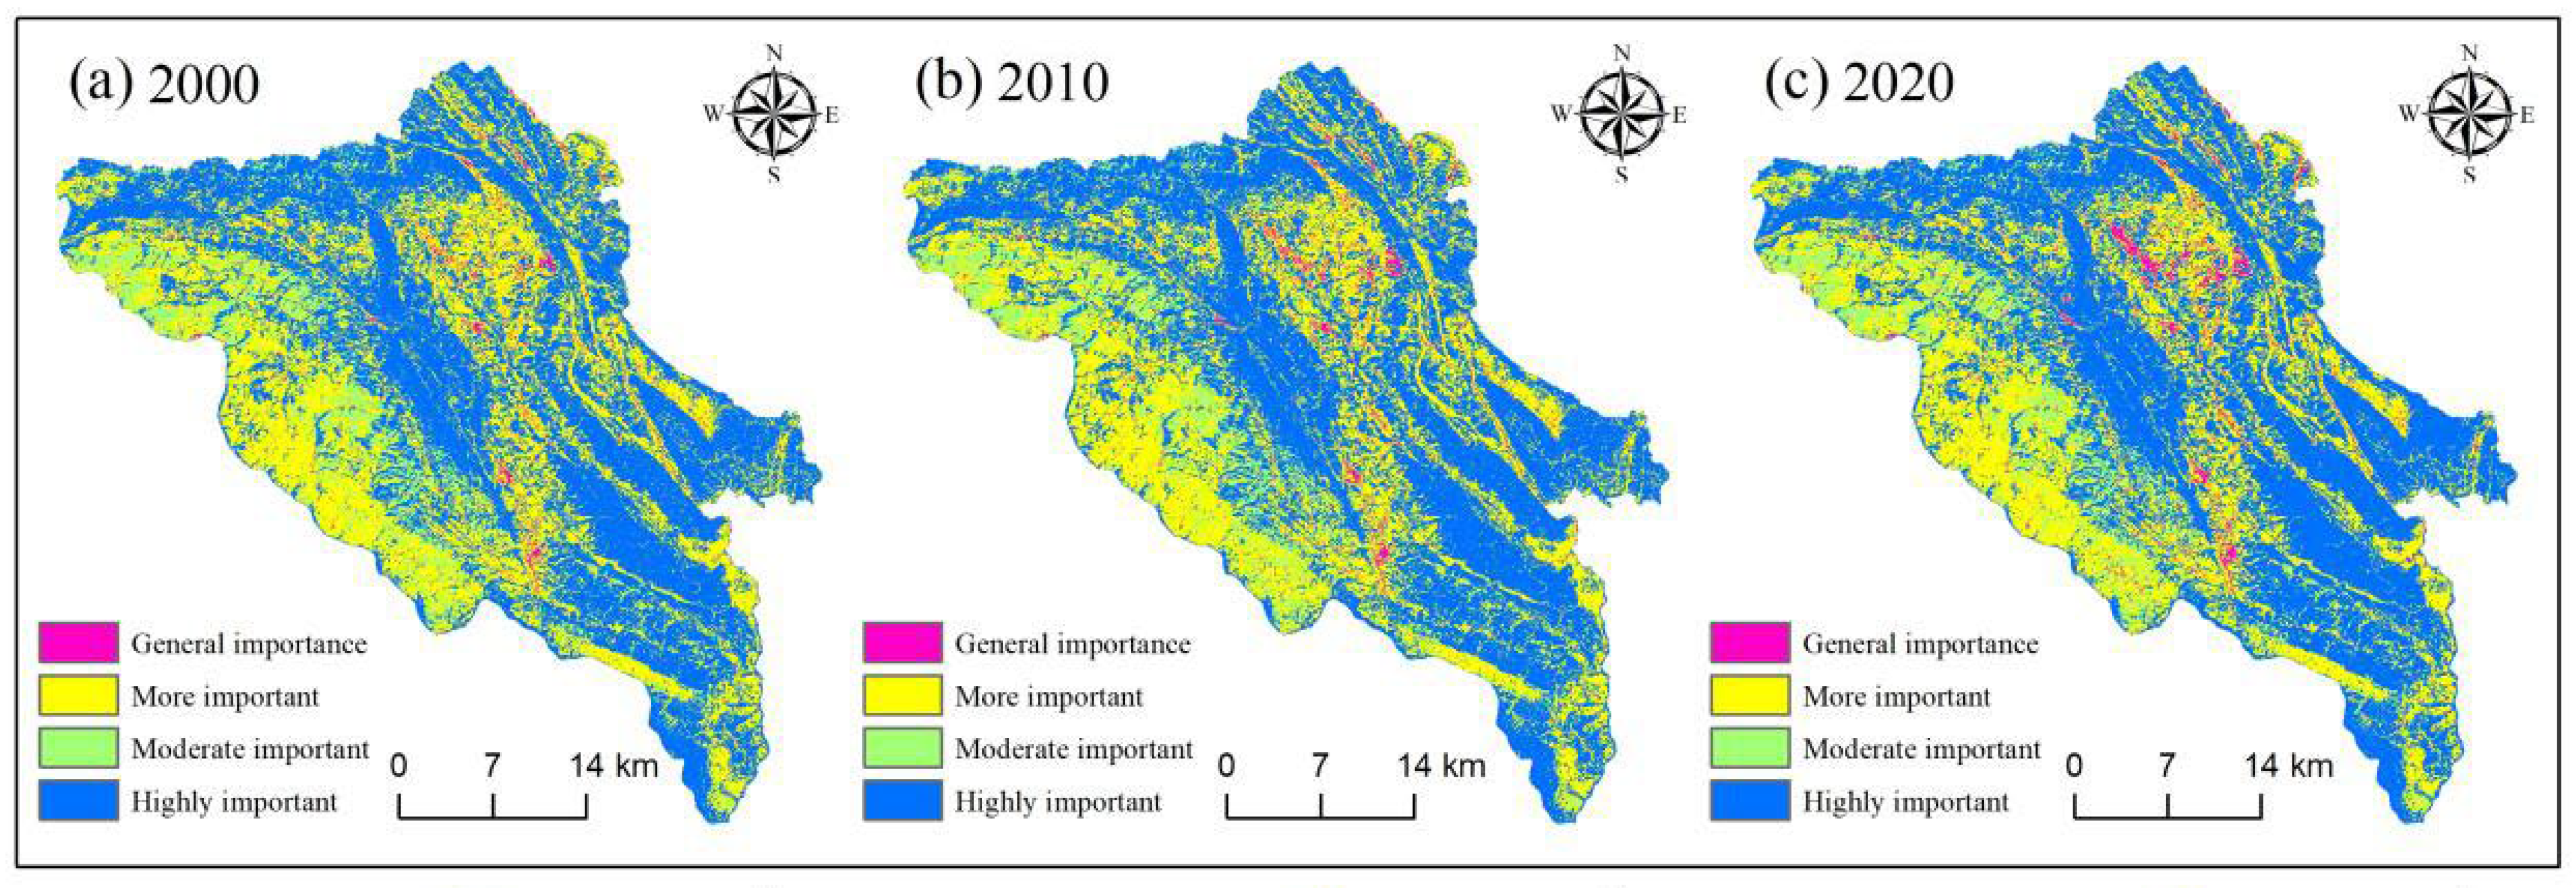
3.5. Analysis of the Importance of Habitat Quality Functions

To systematically and accurately assess the significance of quality of ecological habitats service functions in Guanling County, and to provide scientific basis for the coordinated development of land utilization management, social and economic construction, and ecological environment protection in typical karst areas. Based on the quality of ecological habitats index (0–1) output by InVEST, using ArcGIS 10.8 software, the research results on carbon storage and quality of ecological habitats were reclassified. Using the natural break point method (Jenks), they were reclassified into 4 grades, corresponding to the gradient of the importance of ecological service functions”, the importance of the ecosystem service functions of the quality of ecological habitats in Guanling County was divided into four grades: generally important, relatively important, moderately important, and highly important (as shown in Table 7).
As shown in Figure 8, the spatial distribution of the importance grades of quality of ecological habitats in Guanling County has a very high correlation with land utilization. Among them, the general importance area of quality of ecological habitats is mainly distributed in the construction area, the more important area is mainly concentrated in the grassland area, the moderate importance area is concentrated in the farmland area, and the high importance area is mainly distributed in the forestland and water area.
An examination was conducted on the importance grades of quality of ecological habitats in Guanling County from 2000 to 2020. The general importance area, moderate importance area and high importance area of quality of ecological habitats showed an increasing trend, and the average area increased by 13.81 km2, 3.25 km2 and 20.17 km2 respectively in 20 years, with proportions of 0.94%, 0.22% and 1.37% respectively (Table 8). However, the more important area of quality of ecological habitats showed a decreasing trend, and it decreased by 37.23 km2 in 20 years, with a proportion of 2.54%. Due to the influence of regional land utilization changes and the fragmentation of grassland landscape, the area of the more important area of quality of ecological habitats decreased statistically significantly, but the reduction of the more important area compensated for the moderate and high importance areas of quality of ecological habitats to some extent, promoting the overall improvement of the quality of ecological habitats service function in the karst mountainous area of Guanling County.

4. Discussion

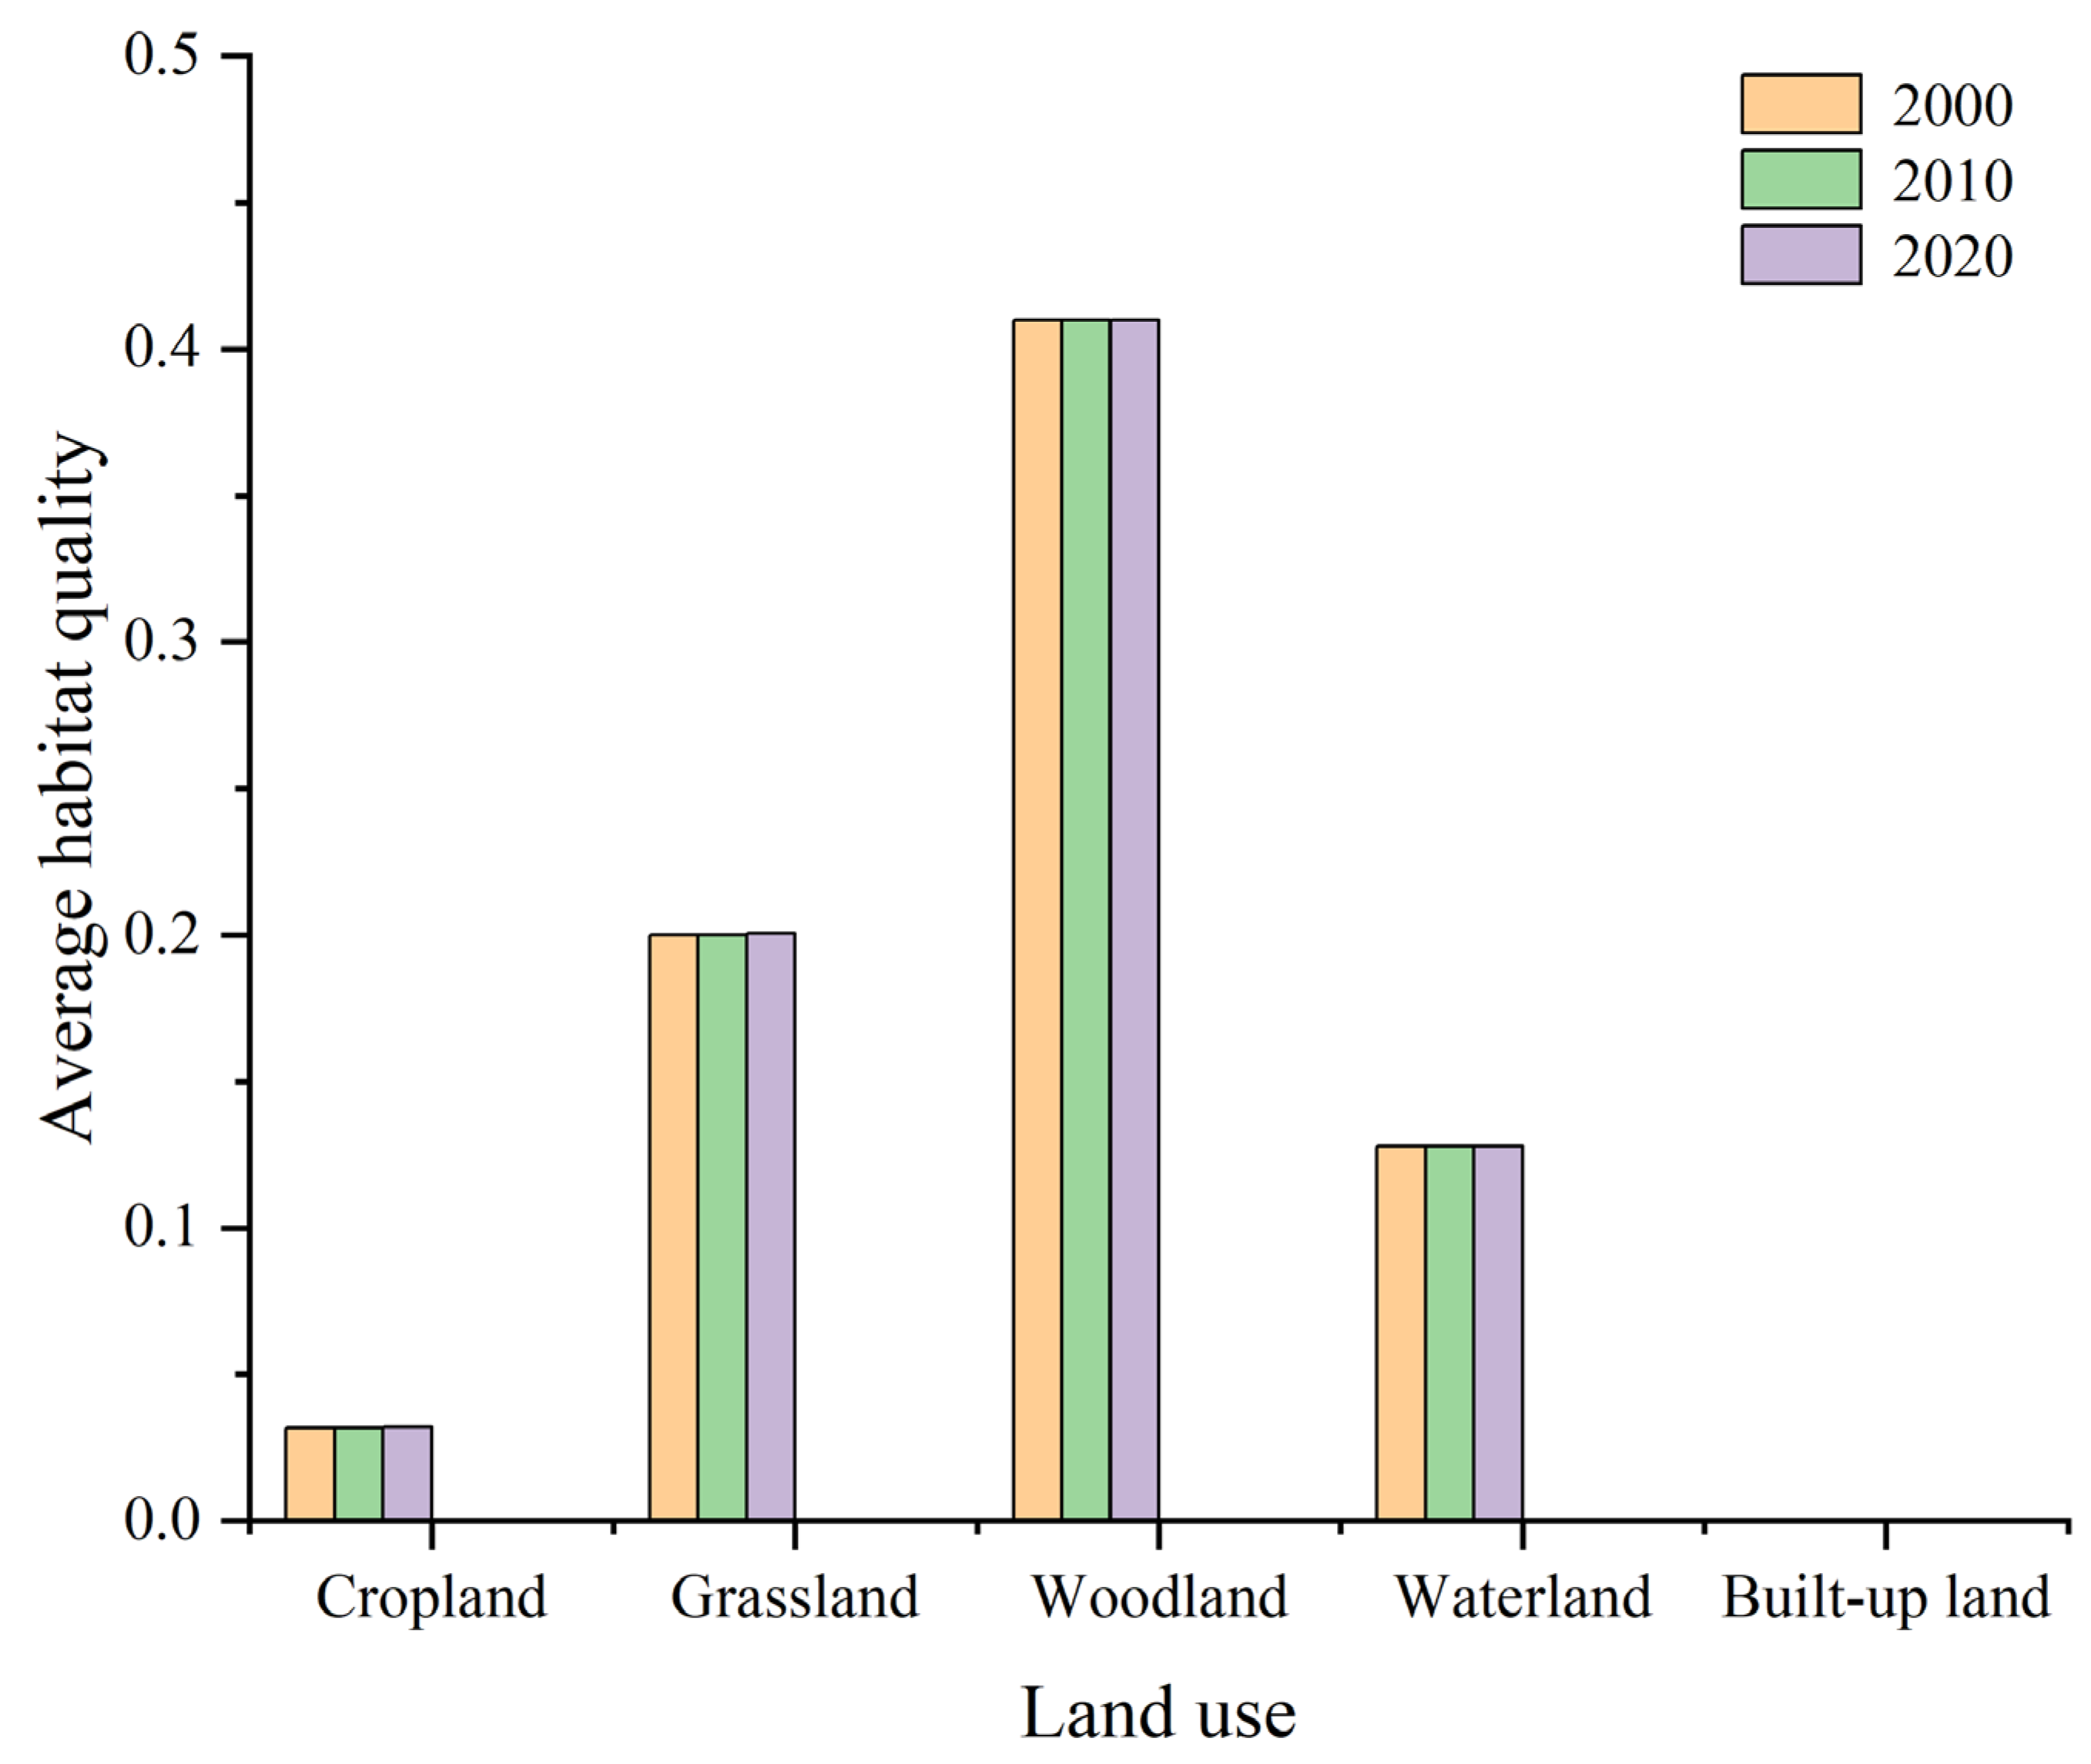
4.1. Impact of Land Use Change on Habitat Quality

The study used the spatial examination tools of ArcGIS 10.8 software to statistically analyze the average quality of ecological habitats across different land utilization/cover types in Guanling County. As shown in Table 9 and Figure 9.
From the perspective of land utilization, with the land utilization changes in Guanling County over the past 20 years, the regional quality of ecological habitats has also changed [61], showing an overall upward trend. This is related to the expansion of land suitable for various habitats such as forest land, grassland and water bodies [62,63]. Since construction land has the lowest habitat suitability among various land utilizations, the threat sources of quality of ecological habitats mainly come from the expansion of construction land [64,65]. However, the expansion of ecological land such as forest land, grassland and water bodies can, to a certain extent, offset the negative impacts of construction lnd [62]. Over the past 20 years, the influence of urbanization has led to the continuous expansion of construction land occupying the cultivated land with higher habitat suitability, which is the main factor causing the expansion of low-level quality of ecological habitats in the region [66]. With the acceleration of urbanization construction and the implementation of the protection policy for cultivated land, construction land is bound to expand towards forest land and grassland with higher habitat suitability, and the range of low-level quality of ecological habitats will further expand to the range of high-level quality of ecological habitats, resulting in a rapid decline trend of the overall quality of ecological habitats in Guanling County [67]. As Liu et al. [68] have confirmed, ecological policies such as returning farmland to forest and grassland can effectively expand the area of forest land and grassland, thereby improving the regional quality of ecological habitats. In future land utilization planning and management, it is necessary to strengthen the implementation of ecological policies such as returning farmland to forest and grassland, increase the coverage of forest land and grassland, and thereby improve the quality of ecological habitats of the karst mountainous area in Guanling. In the process of urbanization, it is necessary to appropriately allocate corresponding ecological land, strengthen the management measures for the expansion of construction land, improve land utilization efficiency, and indirectly improve the regional quality of ecological habitats [69].

4.2. Changes in Habitat Quality and Landscape Pattern Indexes

Based on the MGWR model, a regression examination was conducted on the landscape pattern index and quality of ecological habitats of Guanling County. It was found that quality of ecological habitats and landscape pattern have a high degree of significance, and the changes in landscape pattern have a statistically significant impact on the quality of ecological habitats of Guanling County. The six landscape pattern indices have both positive and negative effects on quality of ecological habitats, indicating that the spatial heterogeneity in the Guanling karst mountainous area is intense, and there are statistically significant differences in the intensity of the influence of landscape patterns in different directions of the region on quality of ecological habitats [22]. This result is consistent with the study by Wang et al. [22] on the karst city of Guiyang, both confirming that the impact of landscape pattern indices on quality of ecological habitats exhibits spatial non-stationarity, but the driving mechanisms show statistically significant differentiation due to differences in regional ecological backgrounds. In this research effort, the compensation effect of forest expansion on quality of ecological habitats was statistically significantly higher than that in the study by Wang et al. [22] in karst mountain cities of Guizhou, which may be attributed to the fact that Wang et al. used 30 m land utilization data and 1000 m grid examination, while this research effort adopted 500 m grid examination. The ecological connectivity of forest patches is more easily captured at a fine scale. In terms of the social environment, the “Rocky Desertification Control Project” implemented in Guanling County in recent years has strengthened the positive effect of ecological land, while the study area of Wang et al. [22]. was more statistically significantly impacted by urbanization. Furthermore, the study by Hu et al. [29] on the rapidly urbanized areas of Nanjing also confirmed the advantage of the MGWR model in capturing spatial heterogeneity, and the positive effect of AI (Aggregation Index) on quality of ecological habitats was more statistically significant in ecological land. However, Hu et al. [29] found that the quality of ecological habitats in Nanjing presented a spatial configuration of “urban center decline-edge fluctuation”, with the core driving force being construction land expansion, which differs from the pattern of “ecological core area aggregation-urban edge degradation” in Guanling County. In terms of data scale, Hu et al. [29]. used 700 m hexagonal grids to capture the landscape fragmentation in Nanjing, while the 500 m grid in this research effort is more suitable for the micro-geomorphological examination of karst peak-cluster depressions. The negative effect of the SHDI on quality of ecological habitats in Nanjing was mainly concentrated in the urban-rural transition zone, whereas in Guanling County, the negative effect of SHDI was more statistically significant in forest-concentrated areas, because the connectivity of forest patches in the karst ecosystem is more sensitive to landscape diversity. From the perspective of social environmental differences, habitat degradation in Nanjing was mainly driven by the rapid expansion of construction land; during the same period, Guanling County implemented the policy of returning farmland to forest, leading to large-scale forest expansion and a slowdown in the expansion rate of construction land, with quality of ecological habitats improvement mainly on the basis of ecological restoration projects.
PD, SHEI, and AI have a statistically significant positive impact on quality of ecological habitats, indicating that there are diverse patch types in the landscape of Guanling County, and these patches are relatively evenly distributed in space, which is conducive to supporting more species and maintaining the stability of the ecosystem. The persistence and migration of patches. In addition, such landscape patterns indicate that patches are aggregated to a certain extent, which helps to maintain the integrity and connectivity of habitats, facilitating the ecosystem of species to be in a relatively healthy state and providing good habitat conditions for various organisms [70,71,72]. The positive effects of these indices work together to form a healthy landscape pattern that can maintain biodiversity and promote ecosystem service functions. However, LPI, LSI, and SHDI have a statistically significant negative impact on quality of ecological habitats, which to a certain extent leads to the landscape of Guanling County being divided into many small patches, which increases the edge effect, reduces the effective area of internal habitats, and is not conducive to the survival of species; the landscape shape is relatively irregular, increasing the edge effect and reducing the quality of internal habitats; although diversity is usually beneficial, in some cases, too many patch types may lead to uneven resource allocation and thereby affect the survival of certain key species. These negative effects jointly indicate that the current landscape pattern is not conducive to certain specific species or ecological processes, and it is necessary to improve quality of ecological habitats through improved landscape planning and management. For example, the number of patches can be reduced, the shape of patches can be optimized, and the distribution of patch types can be adjusted to reduce the influence of LPI and LSI; the combination of patch types in the landscape can be optimized to improve SHDI, especially in areas with the distribution of forests and grasslands, to make them more suitable for the needs of target species. For instance, by establishing ecological protection corridors and enhancing the connectivity of ecological land, the quality of habitats in karst mountainous areas within the region can be directly improved and biodiversity can be maintained. As Liu et al. [73] pointed out in their study on the changes in quality of ecological habitats under land utilization in the Yellow River Delta, establishing a nature reserve in the Yellow River Delta can effectively restrict human development and construction activities, maintaining a high level of quality of ecological habitats within the protected area. In social and economic development, vigorously developing ecological parks, promoting ecological tourism, and ecological agricultural activities, or appropriately dividing ecological land in areas with concentrated construction and development of construction land, can thereby enhance the quality of ecological habitats of the region. Duan et al. [74] found in their study on the evolution of quality of ecological habitats under land utilization changes in the Jialing River Basin that in agricultural concentrated areas, encouraging the development of green agriculture, ecological tourism and other projects can minimize environmental degradation and improve quality of ecological habitats to the greatest extent.

4.3. Evaluation of the Importance of Habitat Quality Functions

The spatial distribution of the importance of quality of ecological habitats service functions in Guanling County and the examination of land utilization have a high correlation. Among them, the general important areas are mainly distributed in construction areas; the relatively important areas are mainly distributed in farmland areas; the medium important areas are mainly distributed in grassland areas; and the highly important areas are mainly distributed in forest areas. In 2020, the area of highly important areas accounted for more than 50%, which is an important area for ecosystem protection in Guanling County. This area is a widely distributed area of forest land in Guanling County and an important area for maintaining quality of ecological habitats and biodiversity of the ecosystem. Due to the influence of social economic development, urbanization, industrialization and other human activities, the area of relatively important areas has decreased year by year, but the implementation of ecological protection policies has provided corresponding compensation for highly important areas and medium important areas. While the importance of ecological service functions in some areas has declined, the importance of ecological service functions in other areas has been statistically significantly increased. The overall ecological benefit is good.
Ecological engineering can statistically significantly increase the carbon storage of terrestrial ecosystems [75]. Since the implementation of the reforestation and returning farmland to forest project in 2003, a large amount of farmland in Guanling County has been transformed into forest land. The expansion of forest land has effectively improved the quality of ecological habitats of the region and improved the habitat environment and increased biodiversity. However, due to the influence of rapid urbanization and industrialization, especially since 2006, Guizhou Province has actively promoted industrialization and urbanization development to achieve the goal of rapid social and economic development. Forest land, farmland and grassland have been extensively developed as construction land. As construction land for serving the social economy, construction land has promoted social and economic development while also causing a decline in quality of ecological habitats. The social and economic development has, in turn, promoted the expansion of construction land to forest land, grassland and farmland with higher quality of ecological habitats, thereby causing a further decline in quality of ecological habitats. Ecological construction projects have effectively improved the importance of ecological service functions and the ecological benefits of the region. However, to a certain extent, they will restrict social and economic development; while purely economic policies accelerate the process of urbanization and industrialization at the cost of sacrificing ecological benefits to meet the excessive demands of social and economic construction, the importance of ecological service functions has been statistically significantly reduced, and thus the ecological benefits are extremely low. In summary, only by taking into account both ecological benefits and social economic benefits at the same time can it be conducive to the harmonious coexistence of humans and nature and ultimately achieve the goal of sustainable development of human society.

4.4. Shortcomings and Prospects

The study established a 500 m × 500 m grid examination for the typical area of the Karst mountainous region in Guanling County to investigate the impact of landscape pattern changes on quality of ecological habitats. It achieved good simulation effects in regions with strong spatial heterogeneity. For small-scale areas, it has a certain degree of high simulation accuracy and calculation accuracy, but its generalization of the overall landscape pattern of Guanling County is limited. For example, the degree of forest fragmentation within a 500 m grid may be averaged, underestimating the actual habitat fragmentation risk; the spatial attenuation effect of threat sources may vary in different topographic areas, and the topographic barriers in karst peak-cluster areas may shorten the actual impact distance. Future research will expand the research scope and fully incorporate more natural and socio-economic factors to explore the overall landscape pattern of Guanling County and comprehensively analyze the impact of landscape pattern changes on quality of ecological habitats.
The study only explores the ecological environment and biodiversity service functions of the Karst mountainous region in Guanling County from the perspective of quality of ecological habitats. Although quality of ecological habitats is currently a hot topic in ecological research, there are still limitations in the research on the overall ecosystem service functions. Based on the above issues, future research will consider adding multiple modules including carbon storage, quality of ecological habitats, soil retention, and water yield to achieve a comprehensive study on the value trade-off and synergy of the entire ecosystem service value of the Southwest Karst region.
Relying on data from three discrete time points in 2000, 2010, and 2020 makes it difficult to capture the transient impacts of short-term ecological disturbances (such as the 2008 southern snow disaster and the mid-term effects of the 2015 rocky desertification control project) on quality of ecological habitats, thus leading to estimation errors in the trend of quality of ecological habitats changes. Future studies could integrate annual land utilization data to enhance temporal continuity.

5. Conclusions

Guanling County, as a core area of the karst mountainous region in the southwest, holds an important position in the regional ecological environment governance and protection. Habitat quality, as a key indicator for maintaining the health and stability of the karst mountainous region’s ecological environment, plays a statistically significant role in the study of quality of ecological habitats and biodiversity in this research area. By combining ArcGIS 10.8 software and the InVEST model, the quality of ecological habitats of Guanling County from 2000 to 2020 was analyzed to explore the spatio-temporal evolution characteristics of quality of ecological habitats and its response to landscape pattern changes, and to analyze the importance of quality of ecological habitats service functions. This was achieved to conduct a comprehensive assessment of the quality of ecological habitats safety and biodiversity maintenance in the karst mountainous area of Guanling County. The main conclusions are as follows:
(1)
Over the past 20 years, the spatial distribution of different levels of quality of ecological habitats in the karst mountainous area of Guanling has demonstrated a strong correlation with land utilization. Influenced by changes in land utilization and landscape pattern, regional quality of ecological habitats has undergone certain changes, which have had a statistically significant impact on the ecological environment quality of the karst mountainous area in Guanling County. Spatially, low-level quality of ecological habitats is concentrated in construction areas, medium-level quality of ecological habitats is concentrated in farmland areas, high-level quality of ecological habitats is concentrated in forest and water area, and high-level quality of ecological habitats is widely distributed in grassland areas. Expanding forest and grassland can, to a certain extent, counteract the negative impact of construction land on quality of ecological habitats. In high-high clustering areas, the “mountain closure for afforestation + artificial replanting” project should be implemented to improve regional quality of ecological habitats through forest expansion. In low-low clustering areas with hotspots of construction land expansion, the strategy of “compact development of construction land + construction of ecological buffer zones” should be adopted to mitigate habitat fragmentation. In areas with high fragmentation indices, ecological corridors should be planned along river corridors to connect isolated forest patches and enhance landscape connectivity.
(2)
The quality of ecological habitats of the karst mountainous area in Guanling also has a high degree of spatial autocorrelation. However, the Moran’s I value is decreasing, indicating that the spatial aggregation of the overall quality of ecological habitats in the karst mountainous area of Guanling County is showing a weakening trend. Compared with the OLS and GWR models, the MGWR model has better efficacy in data fitting. The six landscape indices have positive or negative effects on the quality of ecological habitats of different areas in the study area. The regression coefficients of each landscape index vary greatly, and the differences in the direction and intensity of their spatial effects are statistically significant, and their impact on quality of ecological habitats has statistically significant spatial heterogeneity.
(3)
The landscape pattern of Guanling County is transforming from a relatively complete, highly diverse, and clustered state of patches to a fragmented one with complex shapes, reduced diversity, and more dispersed patch distribution. The spatial distribution of quality of ecological habitats in Guanling County is highly correlated with land utilization, and the changes in landscape pattern are of great significance for the spatio-temporal evolution of quality of ecological habitats. The landscape diversity of Guanling County has a negative impact on the quality of ecological habitats of ecological land utilizations such as forest land and grassland, while it has a positive impact on the quality of ecological habitats of social and economic development land utilizations such as construction land and cultivated land. The sensitivity of quality of ecological habitats to forest fragmentation can be reduced through returning farmland to forest and revegetation of abandoned mines. Patch connectivity can be enhanced by “forest gap renovation + shrub replanting” to maintain ecosystem resilience. A smaller SHDI index indicates a stronger positive correlation between forest quality of ecological habitats and landscape diversity. Implementing the “patch integration” project to convert fragmented cropland into contiguous economic forests can statistically significantly improve quality of ecological habitats.
(4)
The average area of the generally important, moderately important, moderately important, and highly important quality of ecological habitats zones from 2000 to 2020 was 28.84 km2, 513.93 km2, 112.62 km2, and 812.62 km2 respectively. The generally important, moderately important, and highly important quality of ecological habitats zones showed an increasing trend, and the importance of quality of ecological habitats service functions increased.

Author Contributions

All authors contributed to the manuscript. Conceptualization, Z.Z. and S.D.; methodology, S.D.; validation, D.H., F.D. and X.D.; formal analysis, S.D.; data curation, S.D. and D.H.; writing—original draft preparation, S.D.; writing—review and editing, S.D., Z.Z., D.H., F.D., X.D., Y.L.; Q.D. and Y.Y.; visualization, S.D. and D.H.; project administration, Z.Z.; funding acquisition, Z.Z. All authors have read and agreed to the published version of the manuscript.

Funding

Supported by Guizhou Provincial 2025 Central Government—Guided Local Science and Technology Development Fund Project, (Qian Ke He Zhong Yin Di [2025] 031); Guizhou Province Science and Technology Project: (Guizhou Science and Technology Cooperation Support 2023 General 211); Supported by Supported by Guizhou Provincial Key Laboratory Construction Project, (Qian Ke He Ping Tai [2025] 014); Supported by Guizhou Provincial [2023] Central Government—Guided Local Science and Technology Development Fund Project, (Qian Ke He Zhong Yin Di [2023] 005).

Institutional Review Board Statement

Not applicable.

Data Availability Statement

All the data used in this study are mentioned in Section 2 “Materials and Methods”.

Acknowledgments

The authors gratefully acknowledge the financial support of Guizhou Normal University. We would also like to thank the editors and anonymous reviewers for their helpful and productive comments on the manuscript.

Conflicts of Interest

The authors declare no conflict of interest. The funders had a funding role in the design of the study; in the collection, analyses, or interpretation of data; in the writing of the manuscript; or in the decision to publish the results.

References

  1. Chen, F.; Bai, X.; Liu, F.; Luo, G.; Tian, Y.; Qin, L.; Li, Y.; Xu, Y.; Wang, J.; Wu, L. Analysis long-term and spatial changes of forest cover in typical karst areas of China. Land 2022, 11, 1349. [Google Scholar] [CrossRef]
  2. Wu, L.; Wang, S.; Bai, X.; Chen, F.; Li, C.; Ran, C.; Zhang, S. Identifying the multi-scale influences of climate factors on runoff changes in a typical karst watershed using wavelet analysis. Land 2022, 11, 1284. [Google Scholar] [CrossRef]
  3. Liu, Q.; Wang, J.; Xiong, K.; Gong, L.; Chen, Y.; Yang, J.; Xiao, H.; Bai, J. Quantitative assessment of ecological assets in the world heritage karst sites based on remote sensing: With a special reference to South China Karst. Herit. Sci. 2024, 12, 129. [Google Scholar] [CrossRef]
  4. Du, S.; Zhou, Z.; Huang, D.; Zhang, F.; Deng, F.; Yang, Y. The Response of Carbon Stocks to Land Use/Cover Change and a Vulnerability Multi-Scenario Analysis of the Karst Region in Southern China Based on PLUS-InVEST. Forests 2023, 14, 2307. [Google Scholar] [CrossRef]
  5. Niu, L.; Shao, Q. Soil conservation service spatiotemporal variability and its driving mechanism on the Guizhou Plateau, China. Remote Sens. 2020, 12, 2187. [Google Scholar] [CrossRef]
  6. Xie, B.; Zhang, M. Spatio-temporal evolution and driving forces of habitat quality in Guizhou Province. Sci. Rep. 2023, 13, 6908. [Google Scholar] [CrossRef]
  7. Chen, J.; Yu, J.; Bai, X.; Zeng, Y.; Wang, J. Ecosystems, Environment, Fragility of karst ecosystem and environment: Long-term evidence from lake sediments. Agric. Ecosyst. Environ. 2020, 294, 106862. [Google Scholar] [CrossRef]
  8. Pan, S.; Liang, J.; Chen, W.; Li, J.; Liu, Z. Gray forecast of ecosystem services value and its driving forces in Karst Areas of China: A case study in Guizhou Province, China. Int. J. Environ. Res. Public Health 2021, 18, 12404. [Google Scholar] [CrossRef]
  9. Xiong, K.; Chi, Y. The problems in southern China karst ecosystem in southern of China and its countermeasures. Ecol. Econ. 2015, 31, 23–30. [Google Scholar]
  10. Zhang, S.; Bai, X.; Zhao, C.; Tan, Q.; Luo, G.; Wu, L.; Xi, H.; Li, C.; Chen, F.; Ran, C. China’s carbon budget inventory from 1997 to 2017 and its challenges to achieving carbon neutral strategies. J. Clean. Prod. 2022, 347, 130966. [Google Scholar] [CrossRef]
  11. Li, Y.; Geng, H. Evolution of land use landscape patterns in karst watersheds of Guizhou Plateau and its ecological security evaluation. Land 2022, 11, 2225. [Google Scholar] [CrossRef]
  12. Wang, Z.; Dai, L. Assessment of land use/cover changes and its ecological effect in karst mountainous cities in central Guizhou Province: Taking Huaxi District of Guiyang City as a case. Acta Ecol. Sin. 2021, 41, 3429–3440. [Google Scholar]
  13. Du, C.; Bai, X.; Li, Y.; Tan, Q.; Zhao, C.; Luo, G.; Wu, L.; Chen, F.; Li, C.; Ran, C. Inventory of China’s net biome productivity since the 21st Century. Land 2022, 11, 1244. [Google Scholar] [CrossRef]
  14. Song, F.; Wang, S.; Bai, X.; Wu, L.; Wang, J.; Li, C.; Chen, H.; Luo, X.; Xi, H.; Zhang, S. A new indicator for global food security assessment: Harvested area rather than cropland area. Chin. Geogr. Sci. 2022, 32, 204–217. [Google Scholar] [CrossRef]
  15. Deng, Y.; Jiang, Z.C. Characteristic of rocky desertification and comprehensive improving model in karst peak-cluster depression in Guohua, Guangxi, China. Procedia Environ. Sci. 2011, 10, 2449–2452. [Google Scholar] [CrossRef]
  16. Xu, E.; Zhang, H.; Li, M. Mining spatial information to investigate the evolution of karst rocky desertification and its human driving forces in Changshun, China. Sci. Total Environ. 2013, 458, 419–426. [Google Scholar] [CrossRef]
  17. Qi, X.; Wang, K.; Zhang, C. Effectiveness of ecological restoration projects in a karst region of southwest China assessed using vegetation succession mapping. Ecol. Eng. 2013, 54, 245–253. [Google Scholar] [CrossRef]
  18. Peng, J.; Xu, Y.; Cai, Y.; Xiao, H. The role of policies in land use/cover change since the 1970s in ecologically fragile karst areas of Southwest China: A case study on the Maotiaohe watershed. Environ. Sci. Policy 2011, 14, 408–418. [Google Scholar] [CrossRef]
  19. Chen, H.; Liu, J.; Wang, K.; Zhang, W. Spatial distribution of rock fragments on steep hillslopes in karst region of northwest Guangxi, China. Catena 2011, 84, 21–28. [Google Scholar] [CrossRef]
  20. Yohannes, H.; Soromessa, T.; Argaw, M.; Dewan, A. Spatio-temporal changes in habitat quality and linkage with landscape characteristics in the Beressa watershed, Blue Nile basin of Ethiopian highlands. J. Environ. Manag. 2021, 281, 111885. [Google Scholar] [CrossRef]
  21. Zhu, C.; Zhang, X.; Zhou, M.; He, S.; Gan, M.; Yang, L.; Wang, K. Impacts of urbanization and landscape pattern on habitat quality using OLS and GWR models in Hangzhou, China. Ecol. Indic. 2020, 117, 106654. [Google Scholar] [CrossRef]
  22. Wang, Z.; Liu, S.; Su, Y. Spatiotemporal evolution of habitat quality and its response to landscape patterns in karst mountainous cities: A case study of Guiyang City in China. Environ. Sci. Pollut. Res. 2023, 30, 114391–114405. [Google Scholar] [CrossRef]
  23. Li, Y.; Duo, L.; Zhang, M.; Wu, Z.; Guan, Y. Assessment and Estimation of the Spatial and Temporal Evolution of Landscape Patterns and Their Impact on Habitat Quality in Nanchang, China. Land 2021, 10, 1073. [Google Scholar] [CrossRef]
  24. Gu, L.; Yan, J.; Li, Y.; Gong, Z. Evolution, Spatial–temporal evolution and correlation analysis between habitat quality and landscape patterns based on land use change in Shaanxi Province, China. Ecol. Evol. 2023, 13, e10657. [Google Scholar] [CrossRef]
  25. Zhang, X.; Lyu, C.; Fan, X.; Bi, R.; Xia, L.; Xu, C.; Sun, B.; Li, T.; Jiang, C. Spatiotemporal variation and influence factors of habitat quality in Loess Hilly and Gully Area of Yellow River Basin: A case study of Liulin County, China. Land 2022, 11, 127. [Google Scholar] [CrossRef]
  26. Fotheringham, A.S.; Yang, W.; Kang, W. Multiscale geographically weighted regression (MGWR). Ann. Am. Assoc. Geogr. 2017, 107, 1247–1265. [Google Scholar] [CrossRef]
  27. Fotheringham, A.S.; Charlton, M.; Brunsdon, C. The geography of parameter space: An investigation of spatial non-stationarity. Int. J. Geogr. Inf. Syst. 1996, 10, 605–627. [Google Scholar] [CrossRef]
  28. Brunsdon, C.; Fotheringham, S.; Charlton, M. Geographically weighted regression. J. R. Stat. Soc. Ser. D (Stat.) 1998, 47, 431–443. [Google Scholar] [CrossRef]
  29. Hu, J.; Zhang, J.; Li, Y. Exploring the spatial and temporal driving mechanisms of landscape patterns on habitat quality in a city undergoing rapid urbanization based on GTWR and MGWR: The case of Nanjing, China. Ecol. Indic. 2022, 143, 109333. [Google Scholar] [CrossRef]
  30. Tang, Z.; Li, R. Small watersheds are the best control and management unit for improving soil conservation services in karst areas. Sci. Total Environ. 2024, 953, 176162. [Google Scholar] [CrossRef]
  31. Rong, Y.; Li, K.; Guo, J.; Zheng, L.; Luo, Y.; Yan, Y.; Wang, C.; Zhao, C.; Shang, X.; Wang, Z. Multi-scale spatio-temporal analysis of soil conservation service based on MGWR model: A case of Beijing-Tianjin-Hebei, China. Ecol. Indic. 2022, 139, 108946. [Google Scholar] [CrossRef]
  32. Zhou, L.; Wu, T.; Xie, Z. Spatially heterogeneous relationships of PM_(2.5) concentrations with natural and land use factors in the Niger River Watershed, West Africa. J. Clean. Prod. 2023, 394, 136406. [Google Scholar] [CrossRef]
  33. Kafy, A.-A.; Saha, M.; Fattah, M.A.; Rahman, M.T.; Duti, B.M.; Rahaman, Z.A.; Bakshi, A.; Kalaivani, S.; Rahaman, S.N.; Sattar, G.S. Integrating forest cover change and carbon storage dynamics: Leveraging Google Earth Engine and InVEST model to inform conservation in hilly regions. Ecol. Indic. 2023, 152, 110374. [Google Scholar] [CrossRef]
  34. Li, Y.; Liu, Z.; Li, S.; Li, X. Multi-scenario simulation analysis of land use and carbon storage changes in changchun city based on FLUS and InVEST model. Land 2022, 11, 647. [Google Scholar] [CrossRef]
  35. Dale, V.H.; Polasky, S. Measures of the effects of agricultural practices on ecosystem services. Ecol. Econ. 2007, 64, 286–296. [Google Scholar] [CrossRef]
  36. Wen, B.; Liu, C.; Tian, X.; Zhang, Q.; Huang, S.; Zhang, Y. Interactive Effects of Ecological Land Agglomeration and Habitat Quality on Soil Erosion in the Jinsha River Basin, China. Land 2024, 13, 229. [Google Scholar] [CrossRef]
  37. Wu, L.; Sun, C.; Fan, F. Estimating the characteristic spatiotemporal variation in habitat quality using the invest model—A case study from Guangdong–Hong Kong–Macao Greater Bay Area. Remote Sens. 2021, 13, 1008. [Google Scholar] [CrossRef]
  38. Wang, B.; Cheng, W. Effects of land use/cover on regional habitat quality under different geomorphic types based on InVEST model. Remote Sens. 2022, 14, 1279. [Google Scholar] [CrossRef]
  39. Wei, Q.; Abudureheman, M.; Halike, A.; Yao, K.; Yao, L.; Tang, H.; Tuheti, B. Temporal and spatial variation analysis of habitat quality on the PLUS-InVEST model for Ebinur Lake Basin, China. Ecol. Indic. 2022, 145, 109632. [Google Scholar] [CrossRef]
  40. Xu, G.; Xiong, K.; Shu, T.; Shi, Y.; Chen, L.; Zheng, L.; Fan, H.; Zhao, Z.; Yang, Z. Bundling evaluating changes in ecosystem service under karst rocky desertification restoration: Projects a case study of Huajiang-Guanling, Guizhou province, Southwest China. Environ. Earth Sci. 2022, 81, 302. [Google Scholar] [CrossRef]
  41. Wang, S.-J.; Li, Y.-B. Problems and development trends about researches on karst rocky desertification. Adv. Earth Sci. 2007, 22, 573. [Google Scholar]
  42. Qiu, S.; Peng, J.; Zheng, H.; Xu, Z.; Meersmans, J. How can massive ecological restoration programs interplay with social-ecological systems? A review of research in the South China karst region. Sci. Total Environ. 2022, 807, 150723. [Google Scholar] [CrossRef]
  43. Liu, J.; Kuang, W.; Zhang, Z.; Xu, X.; Qin, Y.; Ning, J.; Zhou, W.; Zhang, S.; Li, R.; Yan, C. Spatiotemporal characteristics, patterns, and causes of land-use changes in China since the late 1980s. J. Geogr. Sci. 2014, 24, 195–210. [Google Scholar] [CrossRef]
  44. Sharp, R.; Tallis, H.; Ricketts, T.; Guerry, A.; Wood, S.; Chaplin-Kramer, R.; Nelson, E.; Ennaanay, D.; Wolny, S.; Olwero, N. InVEST Version 3.2. 0 User’s Guide. The Natural Capital Project; The Nature Conservancy, and World Wildlife Fund, Stanford University, University of Minnesota: Minneapolis, MN, USA, 2015; Available online: https://scholar.google.com/scholar?hl=en&as_sdt=0,5&cluster=4950540898464922086#d=gs_cit&t=1752141390234&u=%2Fscholar%3Fq%3Dinfo%3A5nkL07fas0QJ%3Ascholar.google.com%2F%26output%3Dcite%26scirp%3D0%26scfhb%3D1%26hl%3Den (accessed on 1 June 2025).
  45. Xie, B.; Meng, S.; Zhang, M. Evolution of habitat quality and its response to topographic gradient effect in a Karst Plateau: A case study of the Key Biodiversity Conservation Project Area of Wuling Mountains. Int. J. Environ. Res. Public Health 2022, 20, 331. [Google Scholar] [CrossRef] [PubMed]
  46. Gu, Y.-Y.; Huang, X.-F.; Zou, C.-X.; Ye, X.; Lin, N.-F.; Zhang, W.-M. Monitoring habitat quality changes in Yuanjiangyuan Nature Reserve based on Landsat images. J. Ecol. Rural Environ. 2019, 35, 764–772. [Google Scholar]
  47. Zheng, H.; Li, H. Spatial–temporal evolution characteristics of land use and habitat quality in Shandong Province, China. Sci. Rep. 2022, 12, 15422. [Google Scholar] [CrossRef]
  48. Li, S.; Hong, Z.; Xue, X.; Zheng, X.; Du, S.; Liu, X. Evolution characteristics and multi-scenario prediction of habitat quality in Yulin City based on PLUS and InVEST models. Sci. Rep. 2024, 14, 11852. [Google Scholar] [CrossRef]
  49. Li, W.; Zhu, C.; Wang, H.; Xu, B. Multi-scale spatial autocorrelation analysis of cultivated land quality in Zhejiang province. Trans. Chin. Soc. Agric. Eng. 2016, 32, 239–245. [Google Scholar]
  50. Cheng, Z. The spatial correlation and interaction between manufacturing agglomeration and environmental pollution. Ecol. Indic. 2016, 61, 1024–1032. [Google Scholar] [CrossRef]
  51. Mi, Y.; Li, S.; Wang, Z. Spatial distribution and topographic gradient effects of habitat quality in the Chang-Zhu-Tan Urban Agglomeration, China. Sci. Rep. 2024, 14, 22563. [Google Scholar] [CrossRef]
  52. Yang, Y. Evolution of habitat quality and association with land-use changes in mountainous areas: A case study of the Taihang Mountains in Hebei Province, China. Ecol. Indic. 2021, 129, 107967. [Google Scholar] [CrossRef]
  53. Getis, A.; Ord, J.K. The analysis of spatial association by use of distance statistics. Geogr. Anal. 1992, 24, 189–206. [Google Scholar] [CrossRef]
  54. Chen, Z.; Dong, H. Spatial and temporal evolution patterns and driving mechanisms of rural settlements: A case study of Xunwu County, Jiangxi Province, China. Sci. Rep. 2024, 14, 24342. [Google Scholar] [CrossRef] [PubMed]
  55. Li, Z.; Fotheringham, A.S. Computational improvements to multi-scale geographically weighted regression. Int. J. Geogr. Inf. Sci. 2020, 34, 1378–1397. [Google Scholar] [CrossRef]
  56. Yang, Y.; Li, H. Monitoring spatiotemporal characteristics of land-use carbon emissions and their driving mechanisms in the Yellow River Delta: A grid-scale analysis. Environ. Res. 2022, 214, 114151. [Google Scholar] [CrossRef]
  57. Yu, L.; Li, Y.; Yu, M.; Chen, M.; Yang, L. Dynamic changes in agroecosystem landscape patterns and their driving mechanisms in karst mountainous areas of Southwest China: The case of Central Guizhou. Sustainability 2023, 15, 9160. [Google Scholar] [CrossRef]
  58. Wu, L.; Zhou, J.; Xie, B. Comparative analysis of temporal-spatial variation on Mountain-Flatland landscape pattern in karst mountainous areas of southwest China: A case study of Yuxi city. Land 2023, 12, 435. [Google Scholar] [CrossRef]
  59. Luo, Y.; Wang, Z.; Zhou, X.; Hu, C.; Li, J. Spatial-temporal driving factors of urban landscape changes in the karst mountainous regions of southwest China: A case study in central urban area of guiyang city. Sustainability 2022, 14, 8274. [Google Scholar] [CrossRef]
  60. Zhang, D.; Wang, J.; Wang, Y.; Xu, L.; Zheng, L.; Zhang, B.; Bi, Y.; Yang, H. Is there a spatial relationship between urban landscape pattern and habitat quality? Implication for landscape planning of the yellow river basin. Int. J. Environ. Res. Public Health 2022, 19, 11974. [Google Scholar] [CrossRef]
  61. Chen, Y.; Wu, R.; Ma, Y.-W.; Feng, X.-H.; Pan, J.-F.; Chen, Y.-M. Spatial and temporal differentiation and simulation of habitat quality in typical karst areas. J. Ecol. Rural Environ. 2022, 38, 1593–1603. [Google Scholar]
  62. Bai, L.; Xiu, C.; Feng, X.; Liu, D. Influence of urbanization on regional habitat quality: A case study of Changchun City. Habitat Int. 2019, 93, 102042. [Google Scholar] [CrossRef]
  63. Xie, Y.; Gong, J.; Zhang, S.; Ma, X.; Hu, B. Spatiotemporal change of landscape biodiversity based on InVEST model and remote sensing technology in the Bailong river watershed. Sci. Geogr. Sin. 2018, 38, 979–986. [Google Scholar]
  64. Li, W.; Wang, Y.; Xie, S.; Cheng, X. Coupling coordination analysis and spatiotemporal heterogeneity between urbanization and ecosystem health in Chongqing municipality, China. Sci. Total Environ. 2021, 791, 148311. [Google Scholar] [CrossRef] [PubMed]
  65. Wei, W.; Wang, Z.; Bao, Y.; Chen, X.; Sun, Y.; Zeng, M.; Mo, Y. Response of Habitat Quality to Land Use Change in Urban Built-Up Area of Karst Mountainous City; Research Square: Durham, NC, USA, 2022. [Google Scholar]
  66. Zhang, S.; Xiong, K.; Qin, Y.; Min, X.; Xiao, J. Evolution and determinants of ecosystem services: Insights from South China karst. Ecol. Indic. 2021, 133, 108437. [Google Scholar] [CrossRef]
  67. He, J.; Huang, J.; Li, C. The evaluation for the impact of land use change on habitat quality: A joint contribution of cellular automata scenario simulation and habitat quality assessment model. Ecol. Model. 2017, 366, 58–67. [Google Scholar] [CrossRef]
  68. Liu, Z.; Tang, L.; Qiu, Q.; Xiao, L.; Xu, T.; Yang, L. Temporal and spatial changes in habitat quality based on land-use change in Fujian Province. Acta Ecol. Sin. 2017, 37, 4538–4548. [Google Scholar]
  69. Wang, H.; Tang, L.; Qiu, Q.; Chen, H. Assessing the impacts of urban expansion on habitat quality by combining the concepts of land use, landscape, and habitat in two urban agglomerations in China. Sustainability 2020, 12, 4346. [Google Scholar] [CrossRef]
  70. Liu, F.; Wang, W.; Wang, J.; Zhang, X.; Ren, J.; Liu, Y. Multi-scale analysis of the characteristics of the changing landscape of the typical mountainous region of Southwest China over the past 40 years. PeerJ 2021, 9, e10923. [Google Scholar] [CrossRef]
  71. Ntshanga, N.K.; Procheş, S.; Slingsby, J.A. Assessing the threat of landscape transformation and habitat fragmentation in a global biodiversity hotspot. Austral Ecol. 2021, 46, 1052–1069. [Google Scholar] [CrossRef]
  72. Zheng, L.; Wang, Y.; Li, J. Quantifying the spatial impact of landscape fragmentation on habitat quality: A multi-temporal dimensional comparison between the Yangtze River Economic Belt and Yellow River Basin of China. Land Use Policy 2023, 125, 106463. [Google Scholar] [CrossRef]
  73. Yubin, L.; Mei, H.; Min, W.; Chao, F.; Hang, Z. Habitat Quality Assessment in the Yellow River Delta Based on Remote Sensing and Scenario Analysis for Land Use/Land Cover. Sustainability 2022, 14, 15904. [Google Scholar] [CrossRef]
  74. Duan, X.; Chen, B.; Zhang, T.; Guan, Y.; Zeng, K. Habitat Quality Evolution and Multi-Scenario Simulation Based on Land Use Change in the Jialing River Basin. Sustainability 2024, 16, 6968. [Google Scholar] [CrossRef]
  75. Tong, X.; Brandt, M.; Yue, Y.; Horion, S.; Wang, K. Increased vegetation growth and carbon stock in China karst via ecological engineering. Nat. Sustain. 2018, 1, 44–50. [Google Scholar] [CrossRef]
Figure 1. Location of the study area.
Land 14 01445 g001
Figure 2. Technology roadmap.
Land 14 01445 g002
Figure 3. Spatial Distribution of Habitat Quality in Guanling County, 2000, 2010 and 2020.
Land 14 01445 g003
Figure 4. Spatial distribution of land use types in Guanling County, 2000–2020.
Land 14 01445 g004
Figure 5. Spatial Aggregation Characteristics of Habitat Quality in Guanling County, 2000, 2010, and 2020.
Land 14 01445 g005
Figure 6. Spatial Distribution of Landscape Pattern Index in Guanling County.
Land 14 01445 g006
Figure 7. Spatial Distribution of Model Coefficients of MGWR Model in 2020.
Land 14 01445 g007
Figure 8. Spatial Distribution of the Importance Grades of Habitat Quality in Guanling County from 2000 to 2020.
Land 14 01445 g008
Figure 9. Average habitat quality index of different land use/cover types.
Land 14 01445 g009
Table 1. Threat factor parameters.
Threat SourcesMaximum Impact Distance (km)WeightSpatial Attenuation Type
arable land10.7Linear
urban land51Exponential
rural settlements30.6Exponential
transport land30.5Exponential
Table 2. Sensitivity of different landscape types to habitat threat factors.
Land-Use Types
(Level Ⅰ)
Land-Use Types
(Level Ⅱ)
Urban LandCroplandUrban LandRural SettlementsTransport Land
Croplandpaddy0.40.30.70.60.5
dry land0.20.30.70.60.5
Woodlandarbor forest10.60.80.30.7
shrubwood0.80.60.60.30.5
Grasslandgrassland0.70.50.60.50.3
Waterbodyriver0.80.60.60.50.3
lake and reservoir0.90.70.70.60.4
Built-up landurban land00000
rural settlements00000
other built-up land00000
Table 3. Percentage of habitat quality classes, 2000, 2010 and 2020.
Habitat Quality Level2000/%2010/%2020/%
Low1.391.792.36
Relatively low36.1335.3133.59
Relatively high54.7855.1256.16
High7.707.797.89
Table 4. Spatial Autocorrelation Parameters of Habitat Quality in Guanling County, 2000, 2010, and 2020.
YearMoran’s IZ ValueP Value
20000.7178.250
20100.7177.890
20200.7077.140
Table 5. Guanling County Landscape Pattern Index, 2000, 2010, and 2020.
YearPDLPILSISHDISHEIAI
200038.5323.72137.781.060.5479.25
201038.0022.61135.801.080.5579.56
202035.1621.37128.541.100.5780.67
Table 6. Statistical description of regression coefficients of MGWR model.
Landscape IndexMeanMinMedianMax
PD0.06−1.440.071.64
LPI−0.02−1.220.021.41
LSI−0.02−10.030.109.15
SHDI−0.39−2.23−0.342.20
SHEI0.23−0.980.191.78
AI0.05−10.600.219.70
Table 7. Importance Grades of Carbon Storage and Habitat Quality Services in Guanling County.
General ImportantMore ImportantModerate ImportantHighly Important
Habitat quality≤0.250.25–0.500.5–0.75≥0.75
Table 8. Importance Area and Proportion of Habitat Quality in Guilin County.
YearGeneral ImportantMore ImportantModerate ImportantHighly Important
2000/km222.24530.33111.18804.24
%1.51%36.13%7.57%54.79%
2010/km228.22518.34112.24809.19
%1.92%35.31%7.65%55.12%
2020/km236.05493.11114.43824.41
%2.46%33.59%7.80%56.16%
Table 9. Average Habitat Quality Index of Different Land Use/cover Change Types.
Land Use200020102020
Cropland0.130.130.13
Grassland0.200.200.20
Woodland0.410.410.41
Waterbody0.030.030.03
Built-up land0.000.000.00
Disclaimer/Publisher’s Note: The statements, opinions and data contained in all publications are solely those of the individual author(s) and contributor(s) and not of MDPI and/or the editor(s). MDPI and/or the editor(s) disclaim responsibility for any injury to people or property resulting from any ideas, methods, instructions or products referred to in the content.

