
How Do Natural Environmental Factors Influence the Spatial Patterns and Site Selection of Famous Mountain Temple Complexes in China? Quantitative Research on Wudang Mountain in the Ming Dynasty

Abstract
1. Introduction
2. Materials and Methods
2.1. Research Area
2.2. Data Sources
2.2.1. Temple Location Data
- (1)
- POI Data Extraction: Temple Points of Interest (POIs) were collected via the Gaode Map API and visualized in ArcGIS 10.7 (WGS-84 coordinate system). After data cleaning, deduplication, and coordinate calibration, a geospatial database was constructed. The boundary of Wudang Mountain was delineated by integrating official scenic area maps with Ming Dynasty cartographic sources.
- (2)
- Historical Document Mining: To address POI gaps and improve accuracy, temple names and spatial descriptions were extracted from Ming and Qing Mountain records and historical maps. These were georeferenced and cross-validated with known sites. Key sources included Taihe Wudang Mountain Topography [21], A Brief History of Mount Taihe [22], Distribution Map of the Palaces and Temples in Mount Taihe [23], Taihe Mountain Topography [24] and Wudang Mountain Chronicles [25], collectively forming a high-quality geospatial sample of historical architecture for spatial analysis.
- (3)
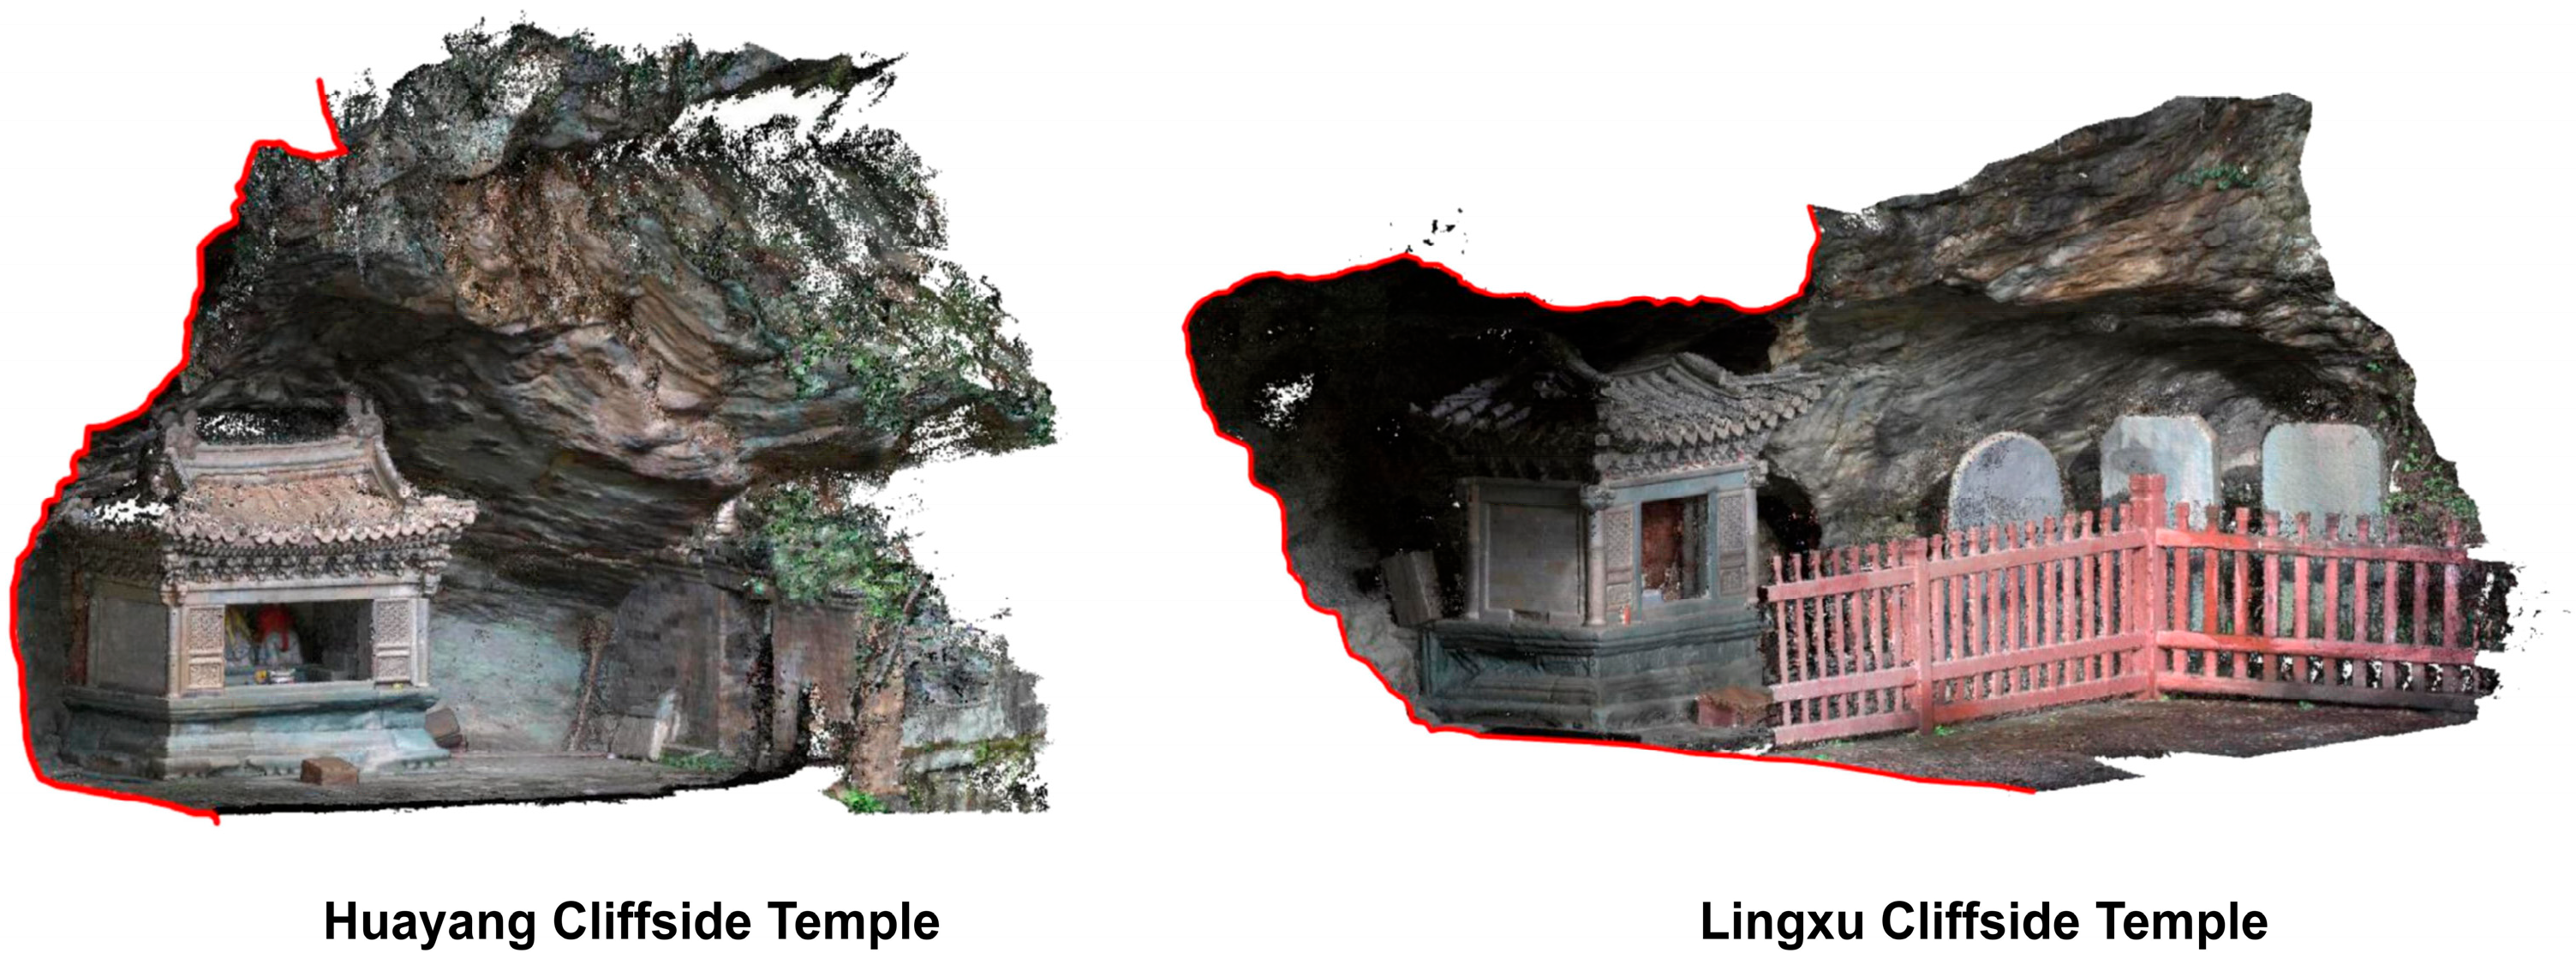
- Field and UAV Surveying: Fieldwork and UAV photogrammetry were used to verify POI data and refine locations, especially for cliffside temples situated on steep terrain. UAV-based 3D point cloud models were generated for 31 extant cliffside sites (see Figure 3). By integrating field measurements, textual evidence, and POI data, the research identified the precise locations of 72 Ming-era temples.
2.2.2. Natural Environment Data
- (1)
- Topographic indicators—including altitude, aspect, slope, and landform type—were extracted from high-resolution Digital Elevation Model (DEM) data. Altitude and slope were calculated using surface gradient algorithms, while aspect was derived as a directional raster in degrees (0–360°), representing slope orientation, which influences solar radiation and microclimatic exposure. Landform types were classified through geomorphometric segmentation, dividing the terrain into categorical zones (e.g., ridges, valleys) using terrain partitioning algorithms.
- (2)
- Hydrological indicators—precipitation and distance from the nearest watershed—were obtained through interpolation of meteorological station data and hydrological network analysis, respectively.
- (3)
- Climate indicators—including average temperature, diffuse solar radiation, and direct solar radiation—were derived from multi-year meteorological raster datasets, ensuring temporal consistency with long-term climatic trends.
- (4)
- Vegetation was represented by NDVImax, the maximum normalized difference vegetation index during the typical growing season, derived from satellite imagery.
- (5)
- Soil indicators—including bulk density, porosity, and pH value—were extracted from regional soil databases and standardized for the 30–60 cm depth range to reflect subsoil properties relevant to structural foundation stability.
2.3. Research Methods
2.3.1. Kernel Density Estimation
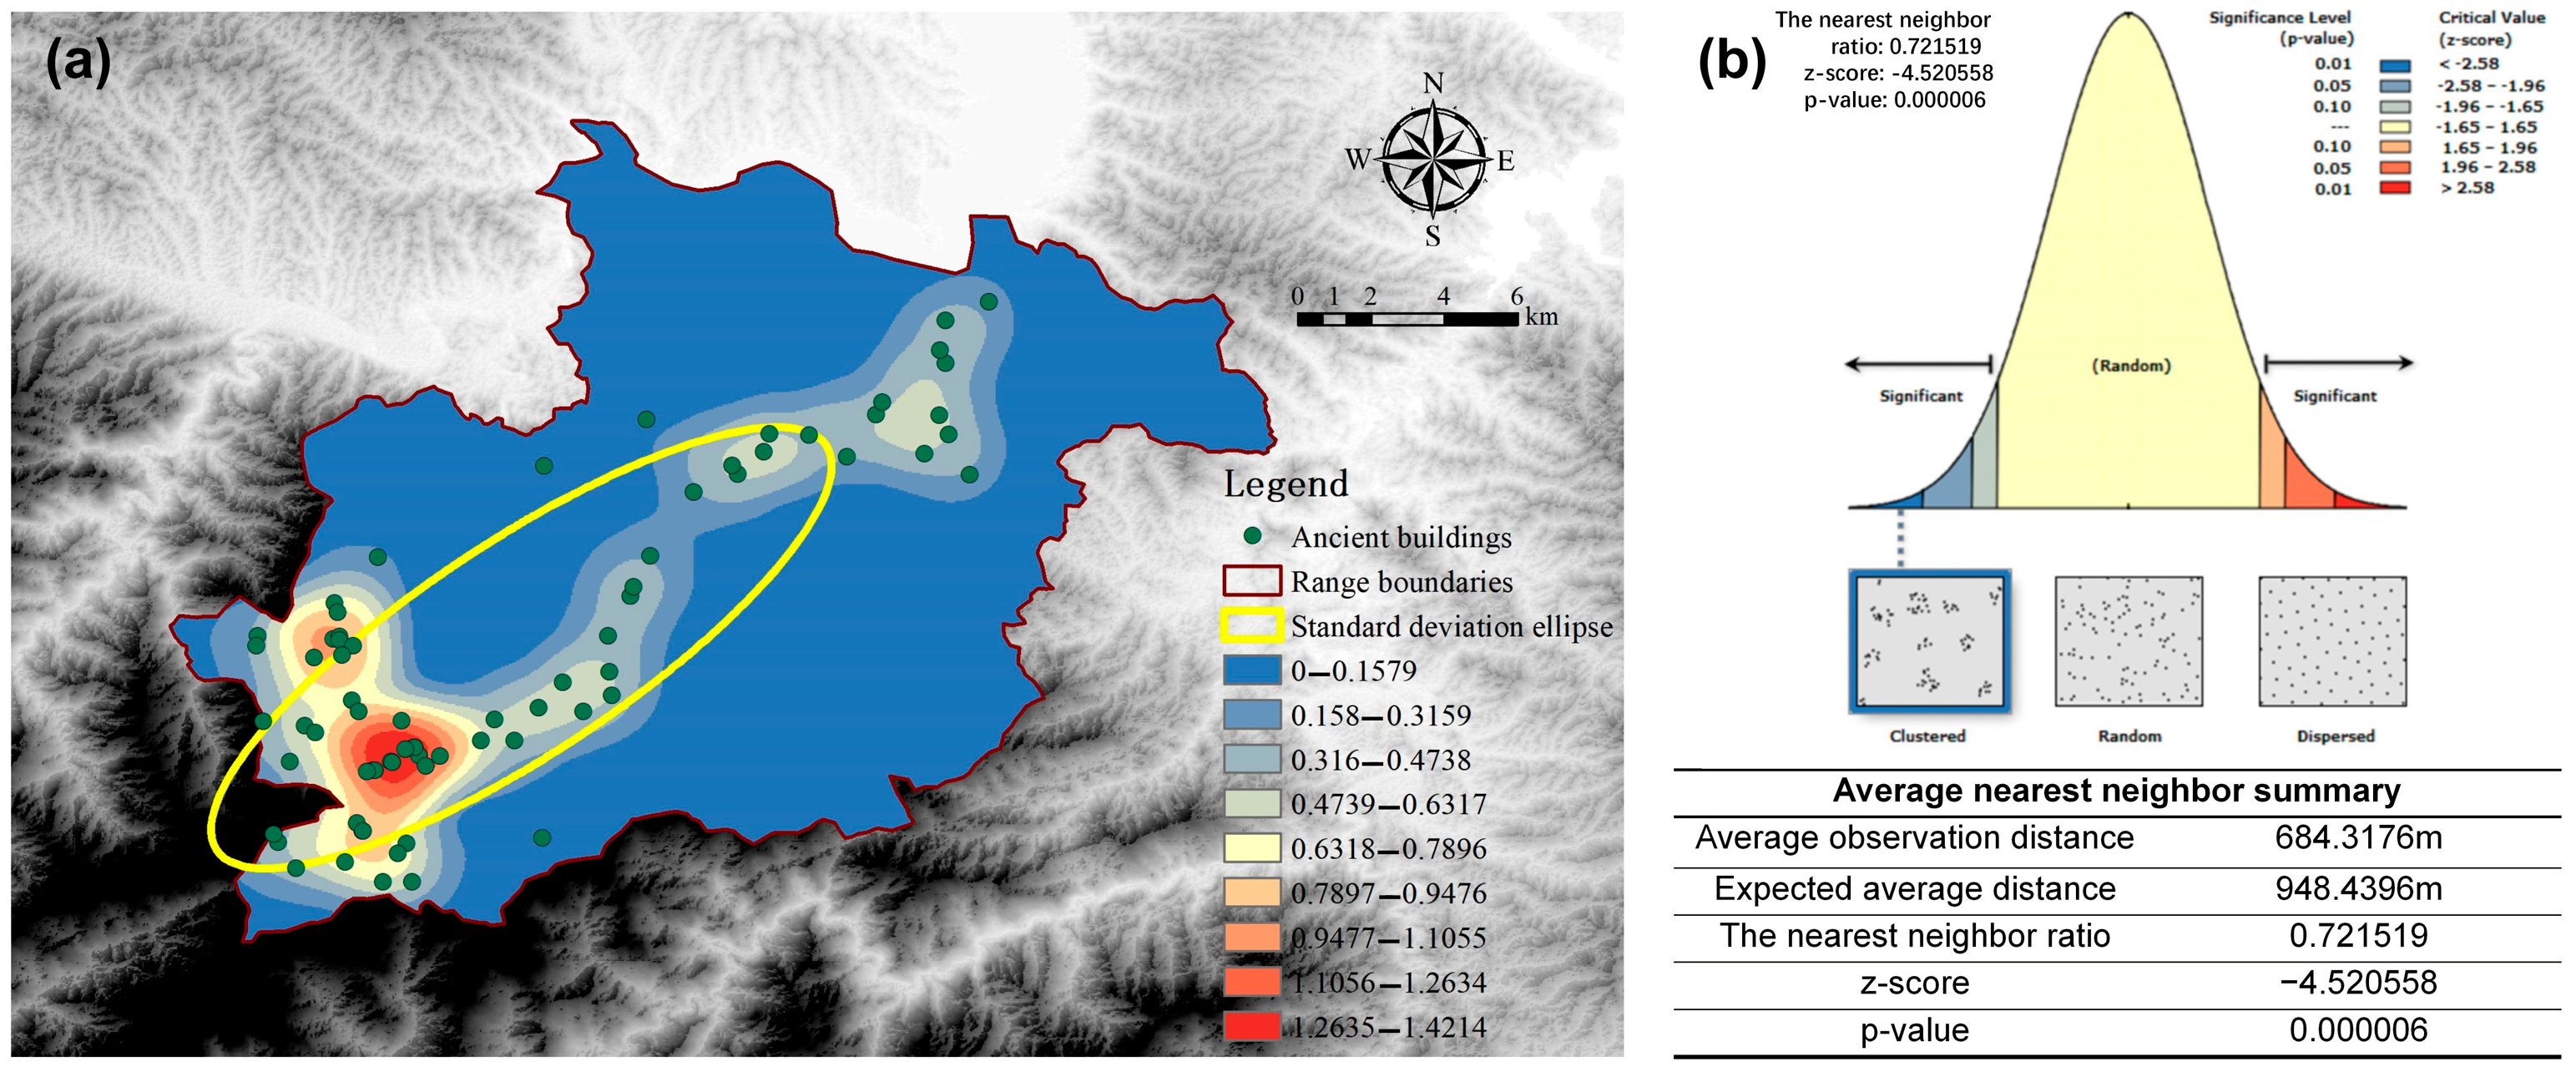
2.3.2. Nearest Neighbor Index
2.3.3. Standard Deviation Ellipse
2.3.4. Buffer Analysis
2.3.5. Geographical Detector
2.3.6. Variable Correlation Analysis
- (1)
- Pearson Correlation Analysis
- (2)
- Regression Analysis Models
3. Results
3.1. Spatial Distribution Characteristics
3.1.1. Overall Spatial Distribution Density
3.1.2. Spatial Distribution Type Characteristics
3.2. Natural Environmental Factors Influencing the Spatial Distribution
3.2.1. Single-Factor Detection Results
- (1)
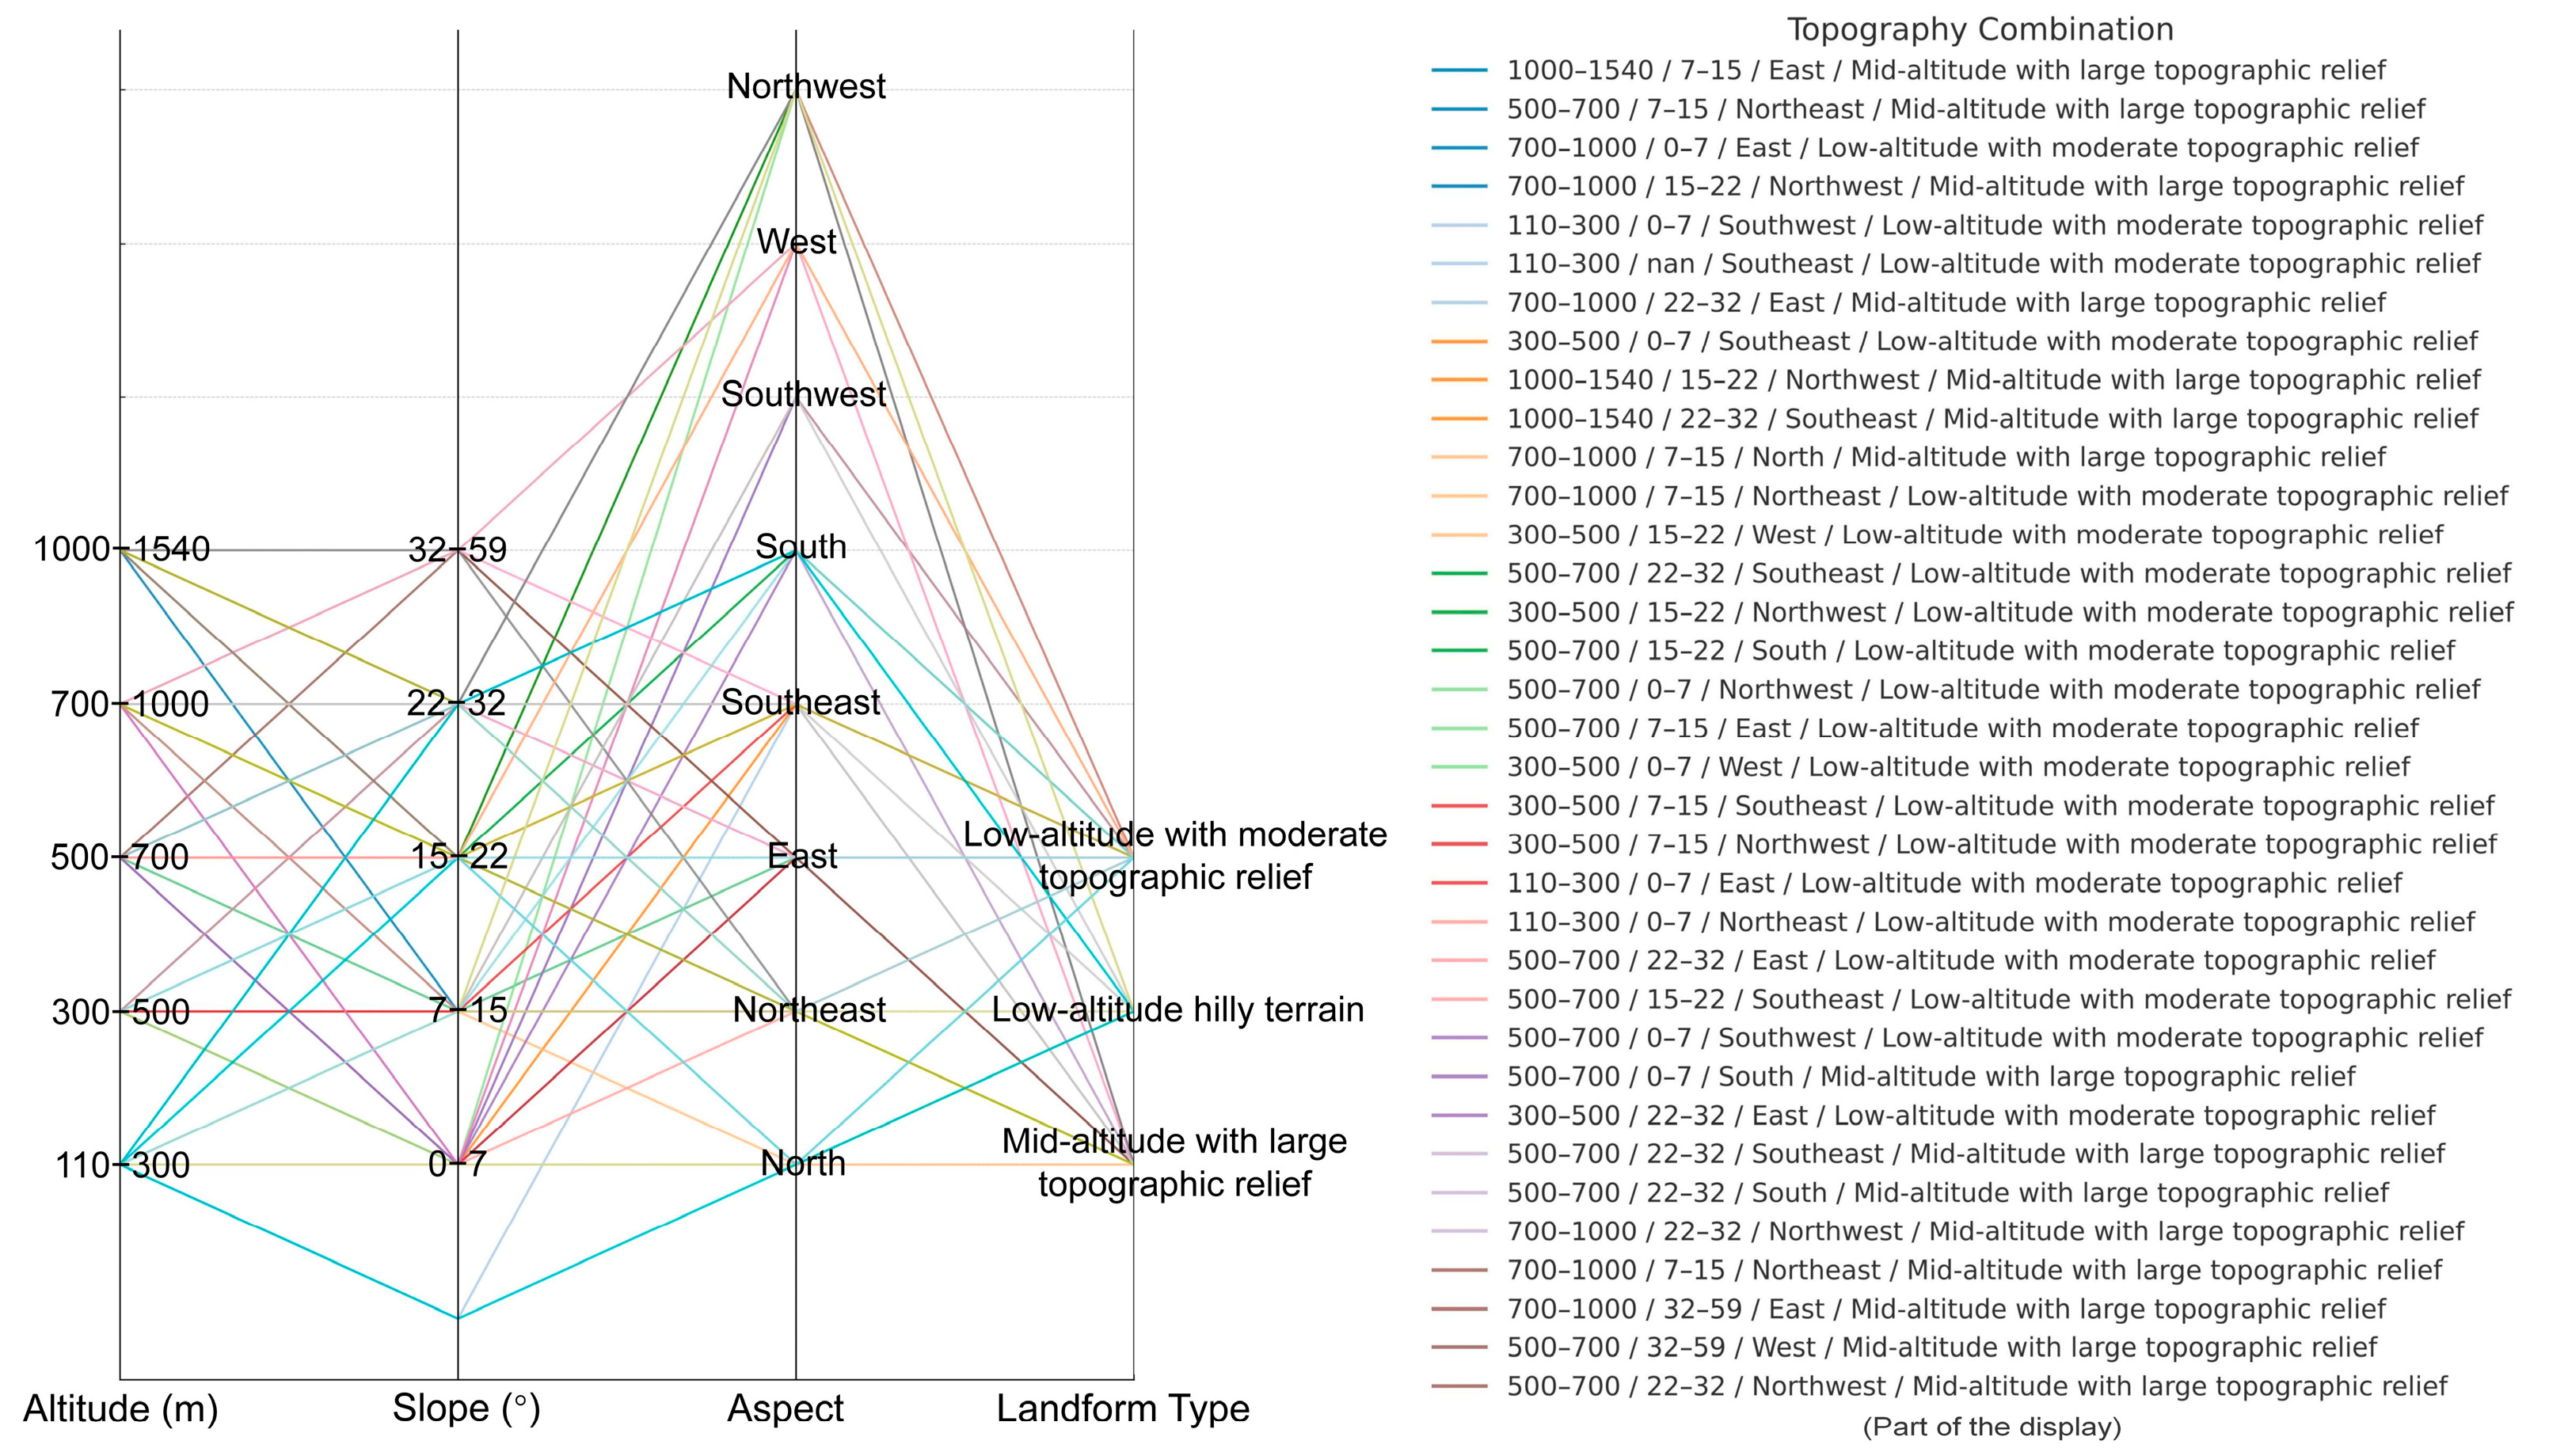
- Topography Factors
- (2)
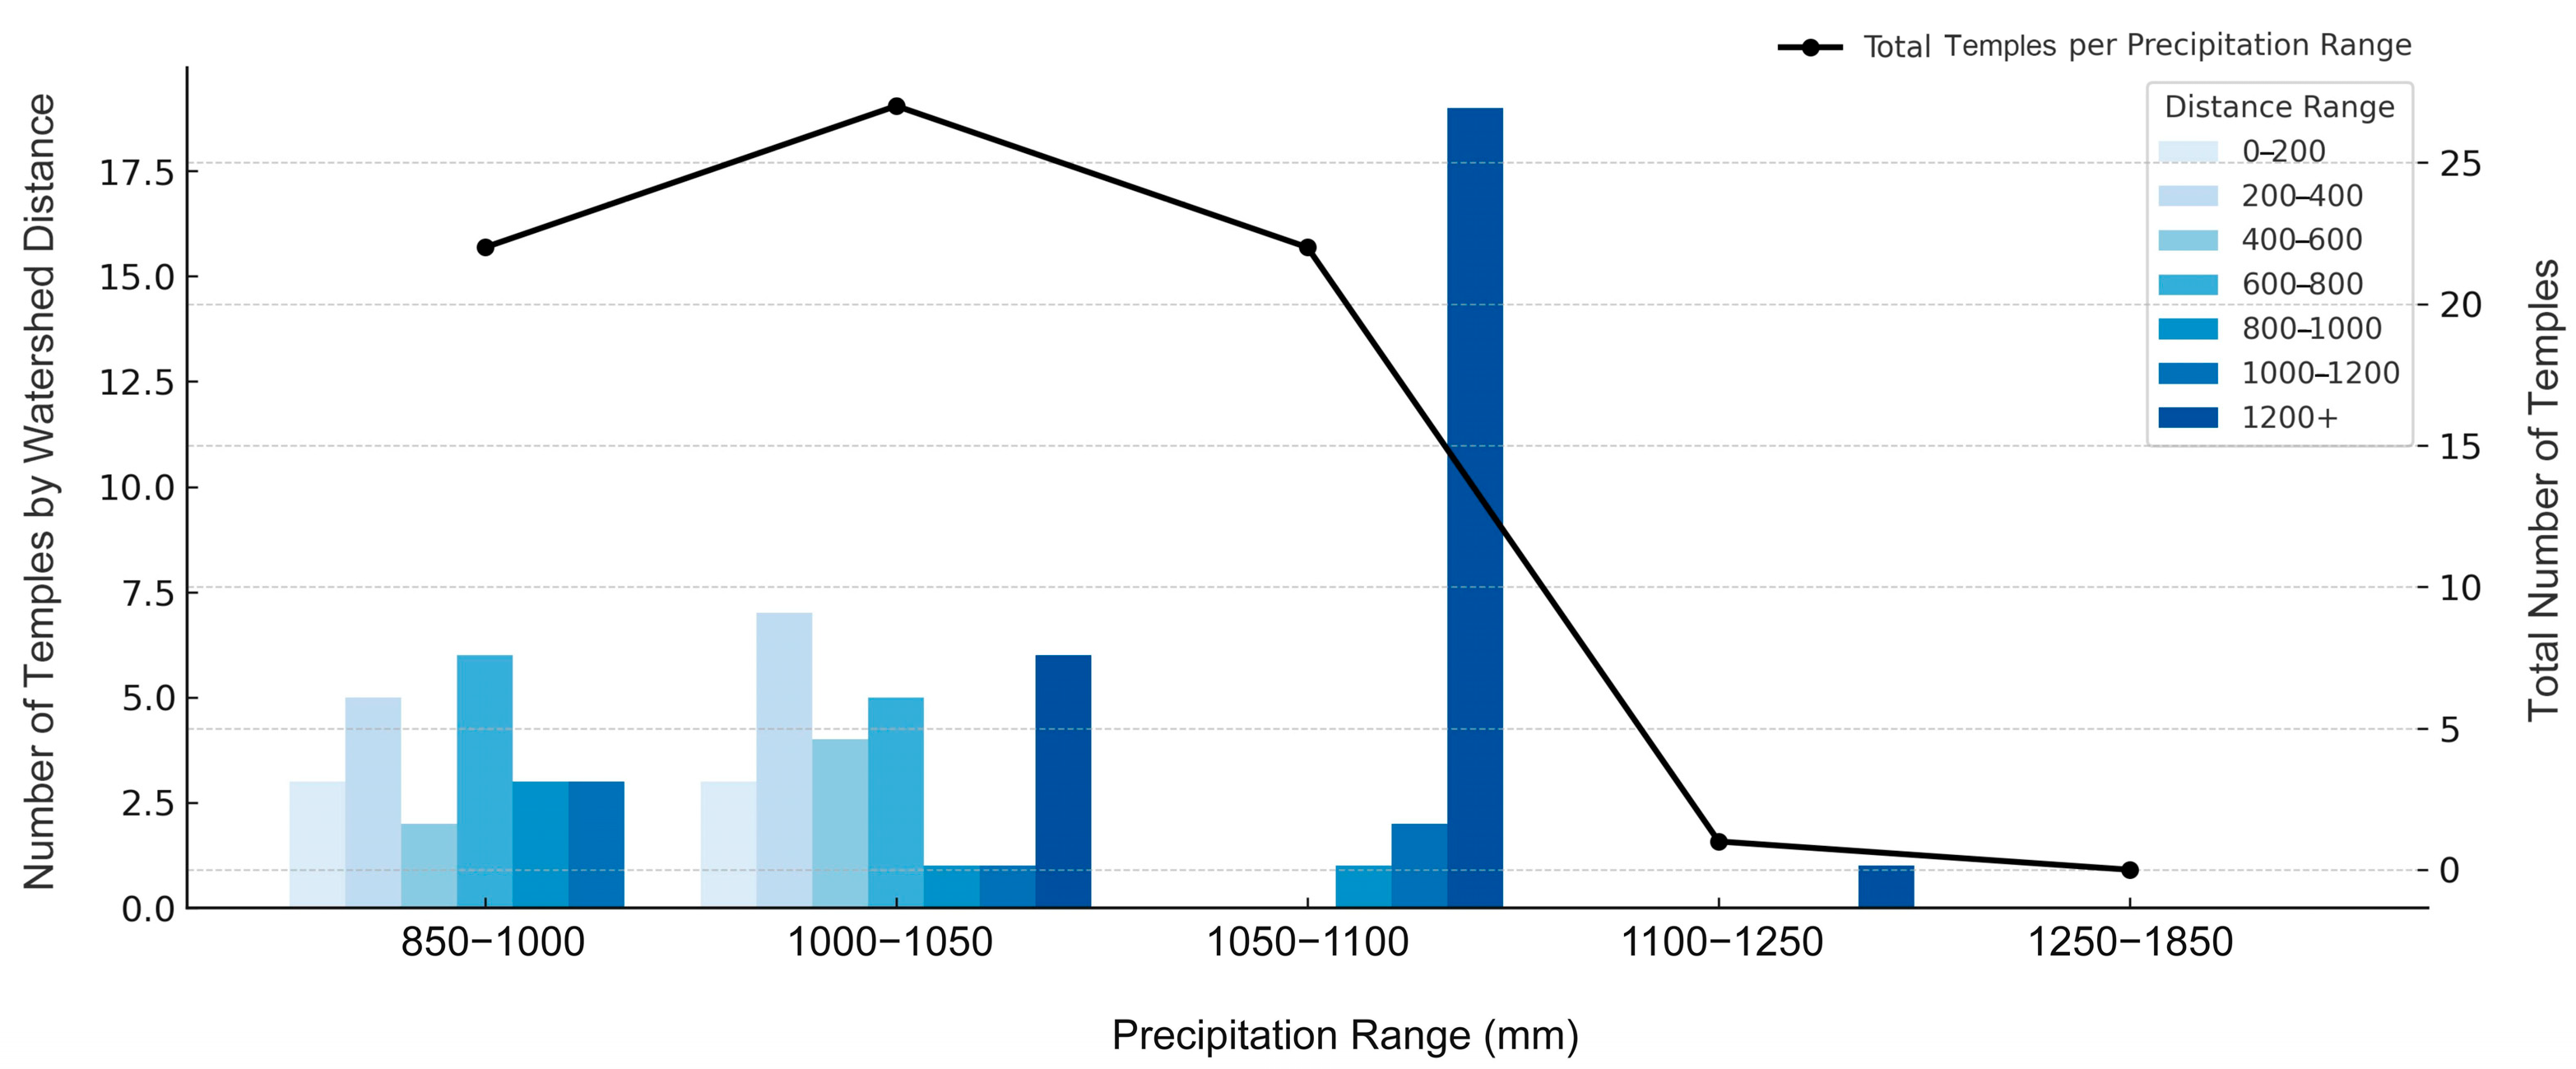
- Hydrology Factors
- (3)
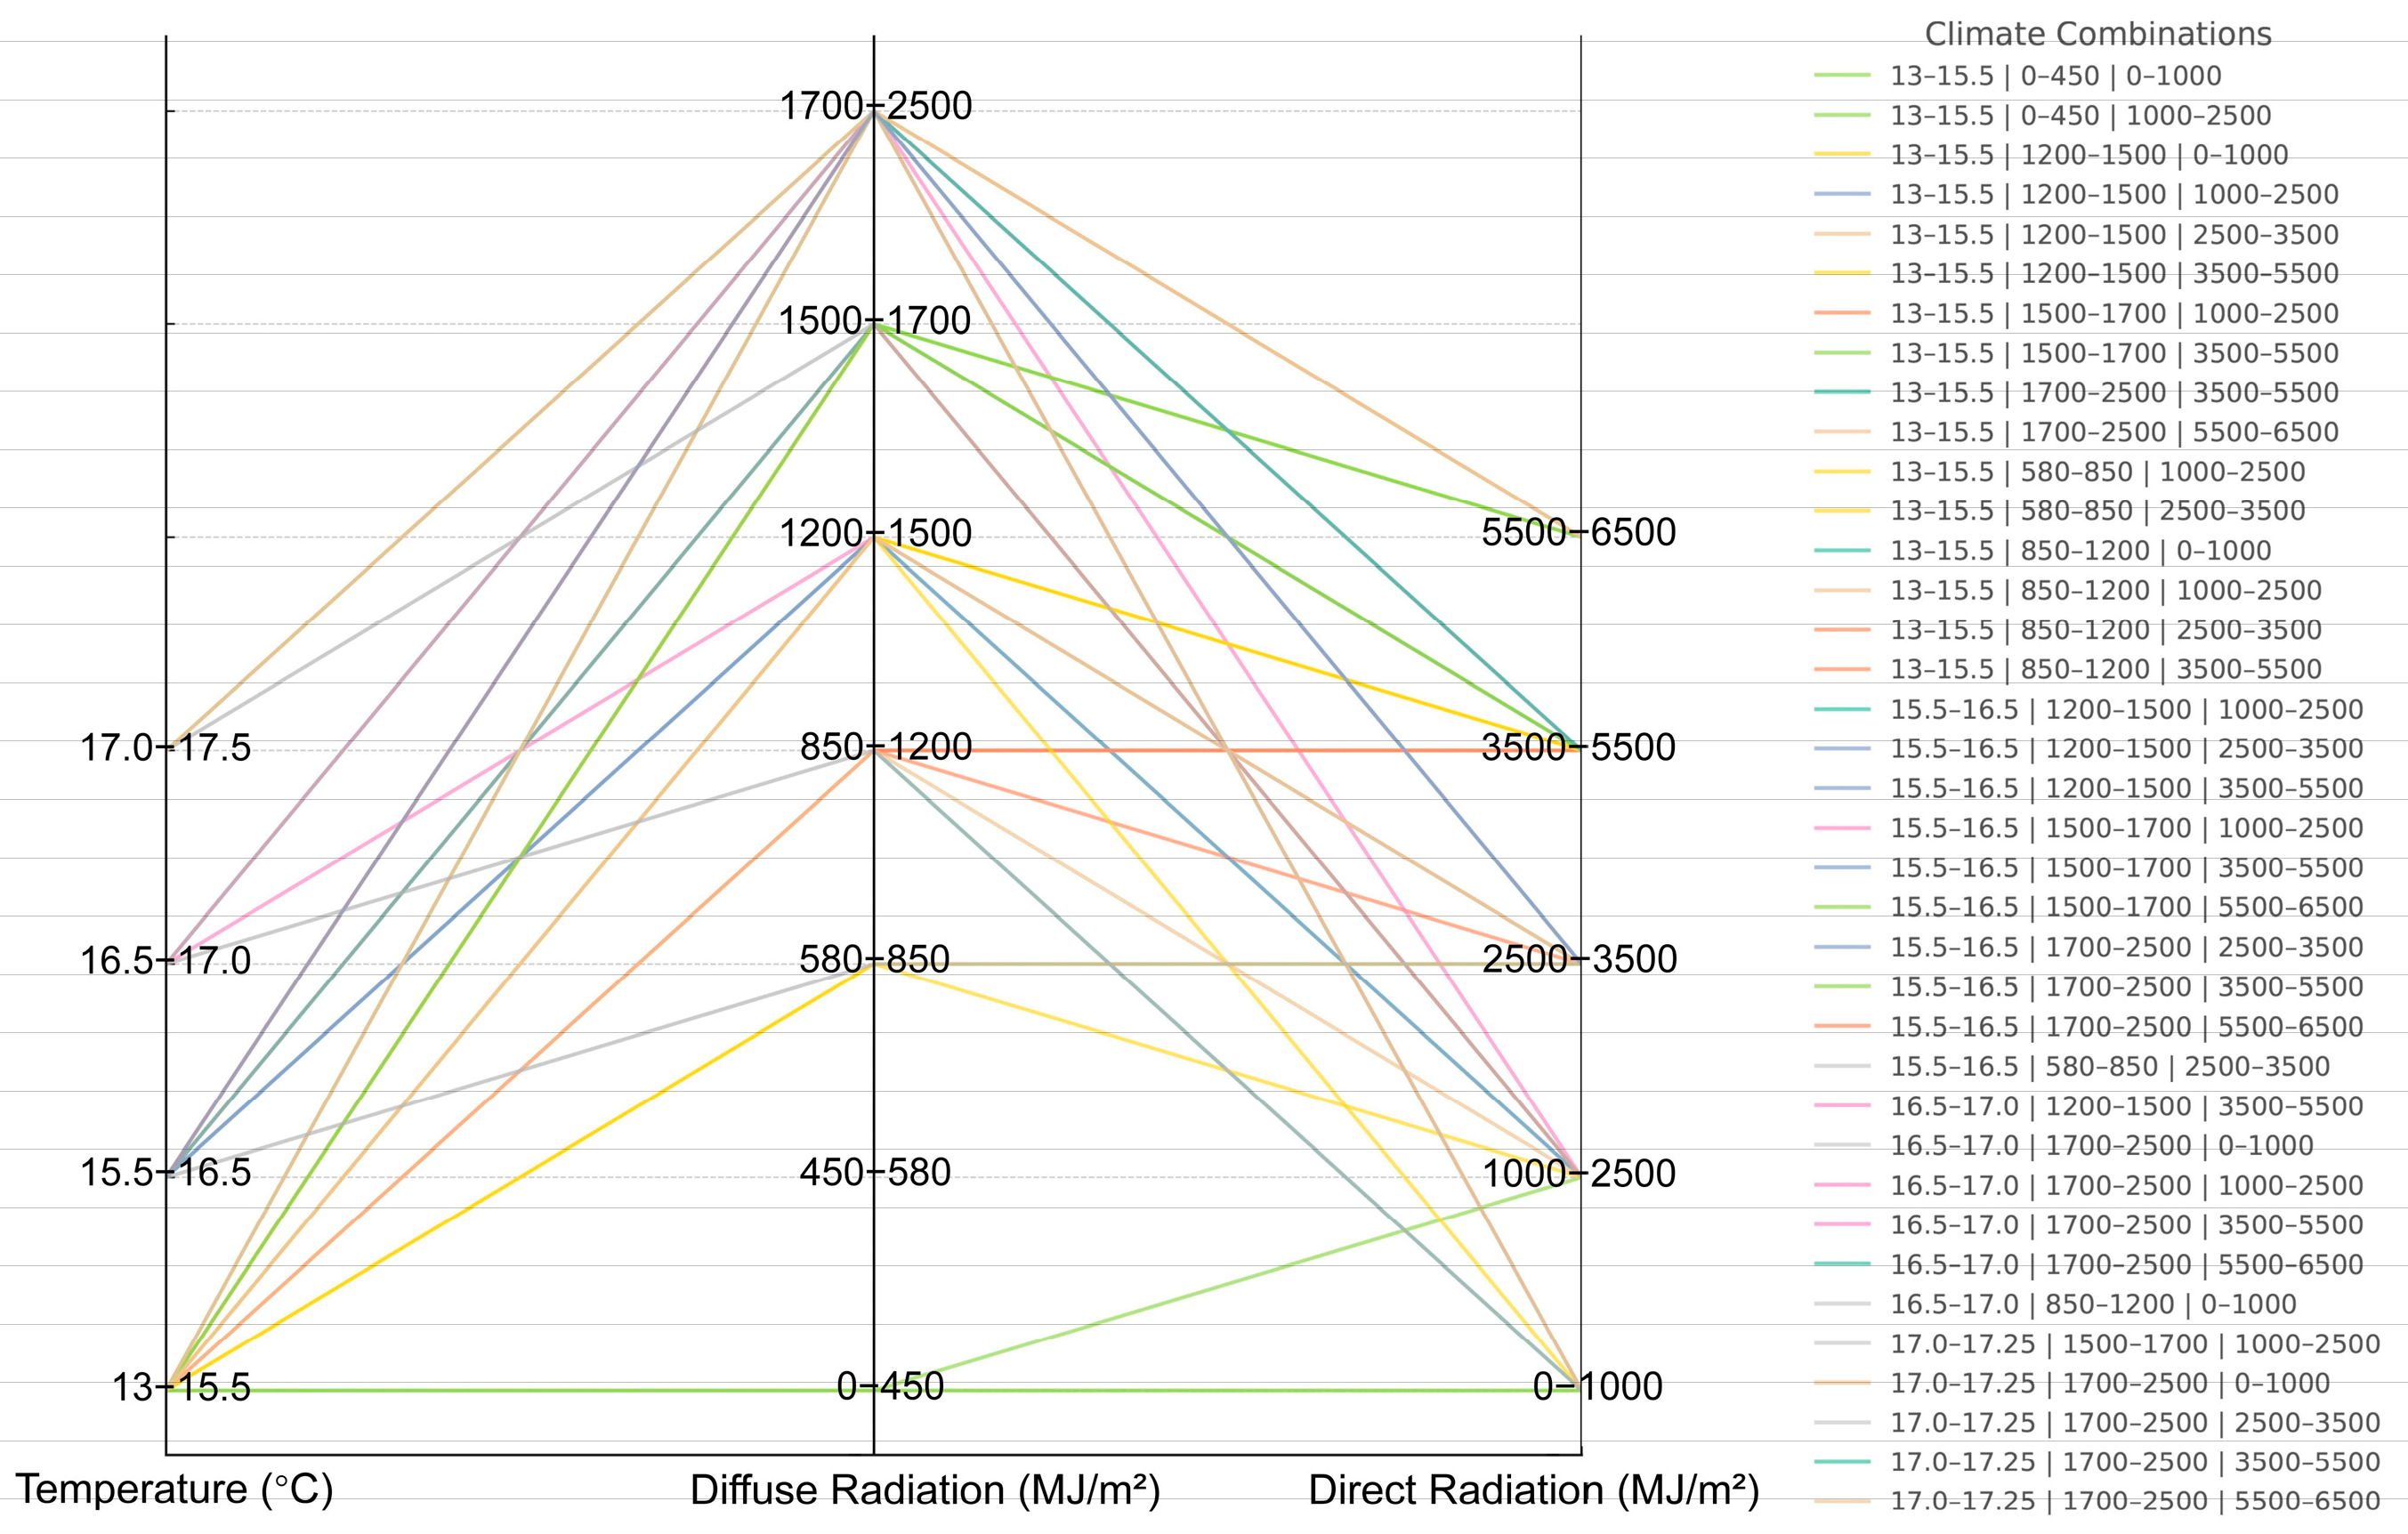
- Climate factors
- (4)
- Vegetation factors
- (5)
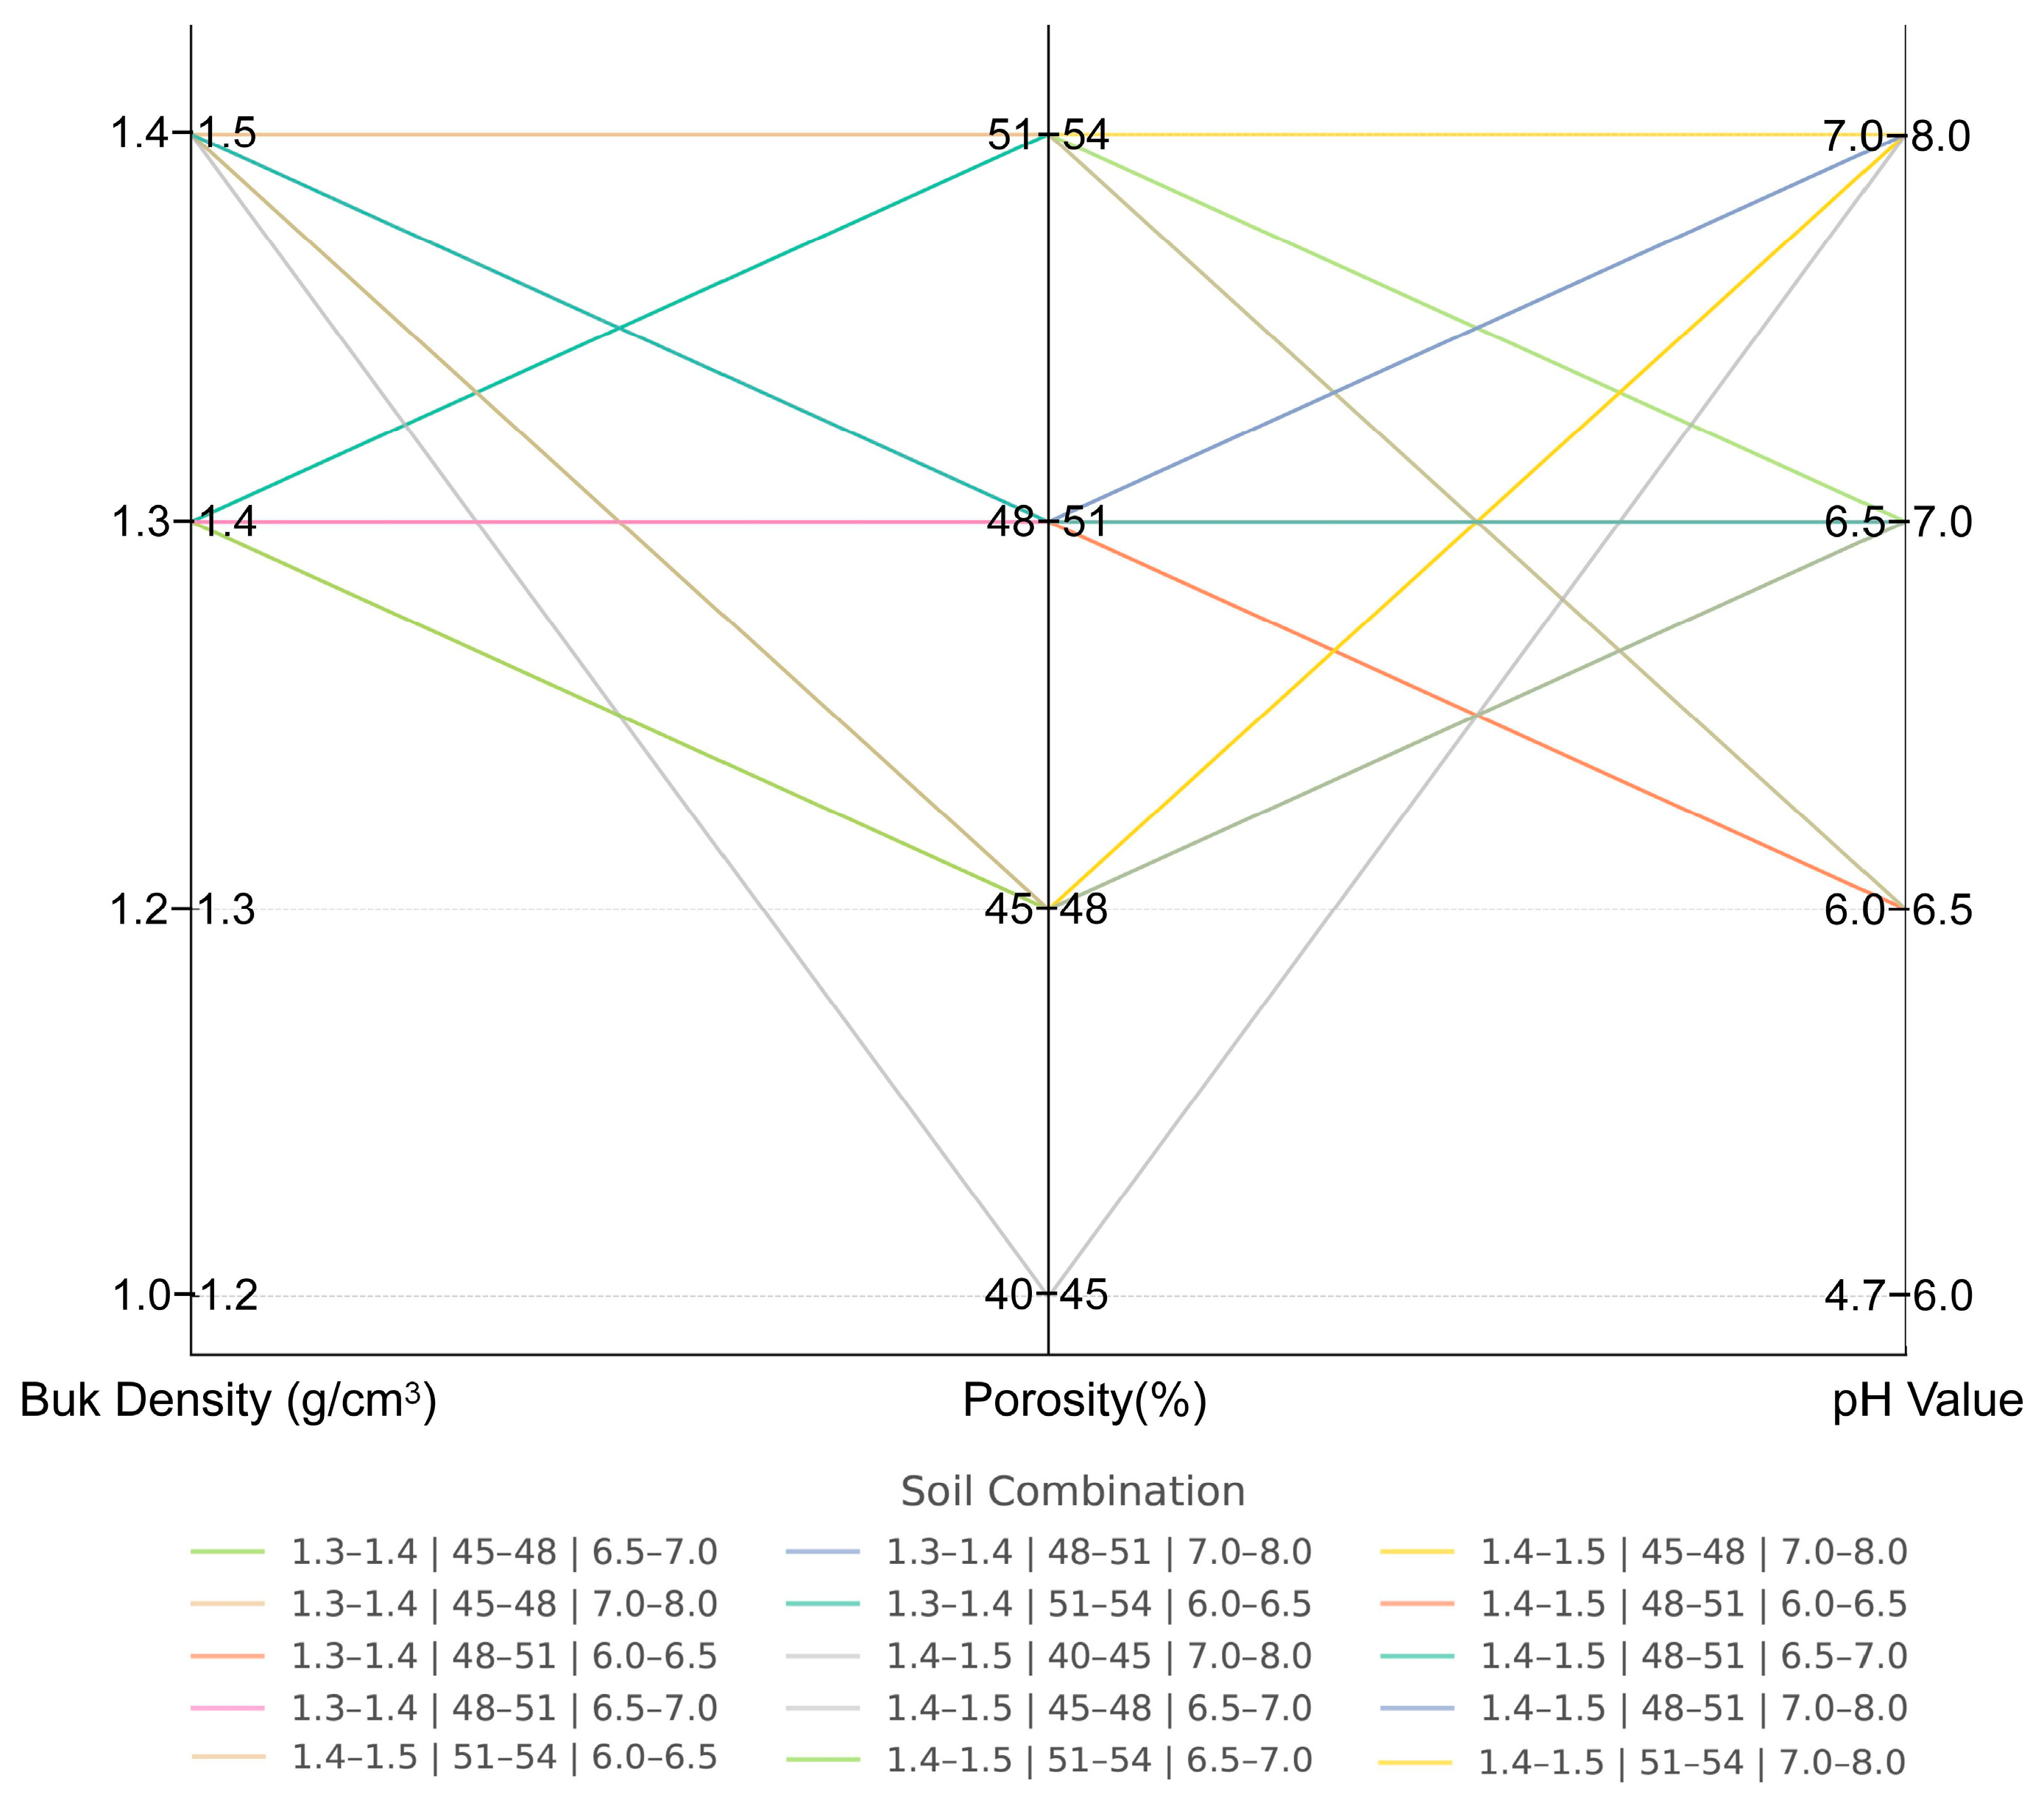
- Soil factors
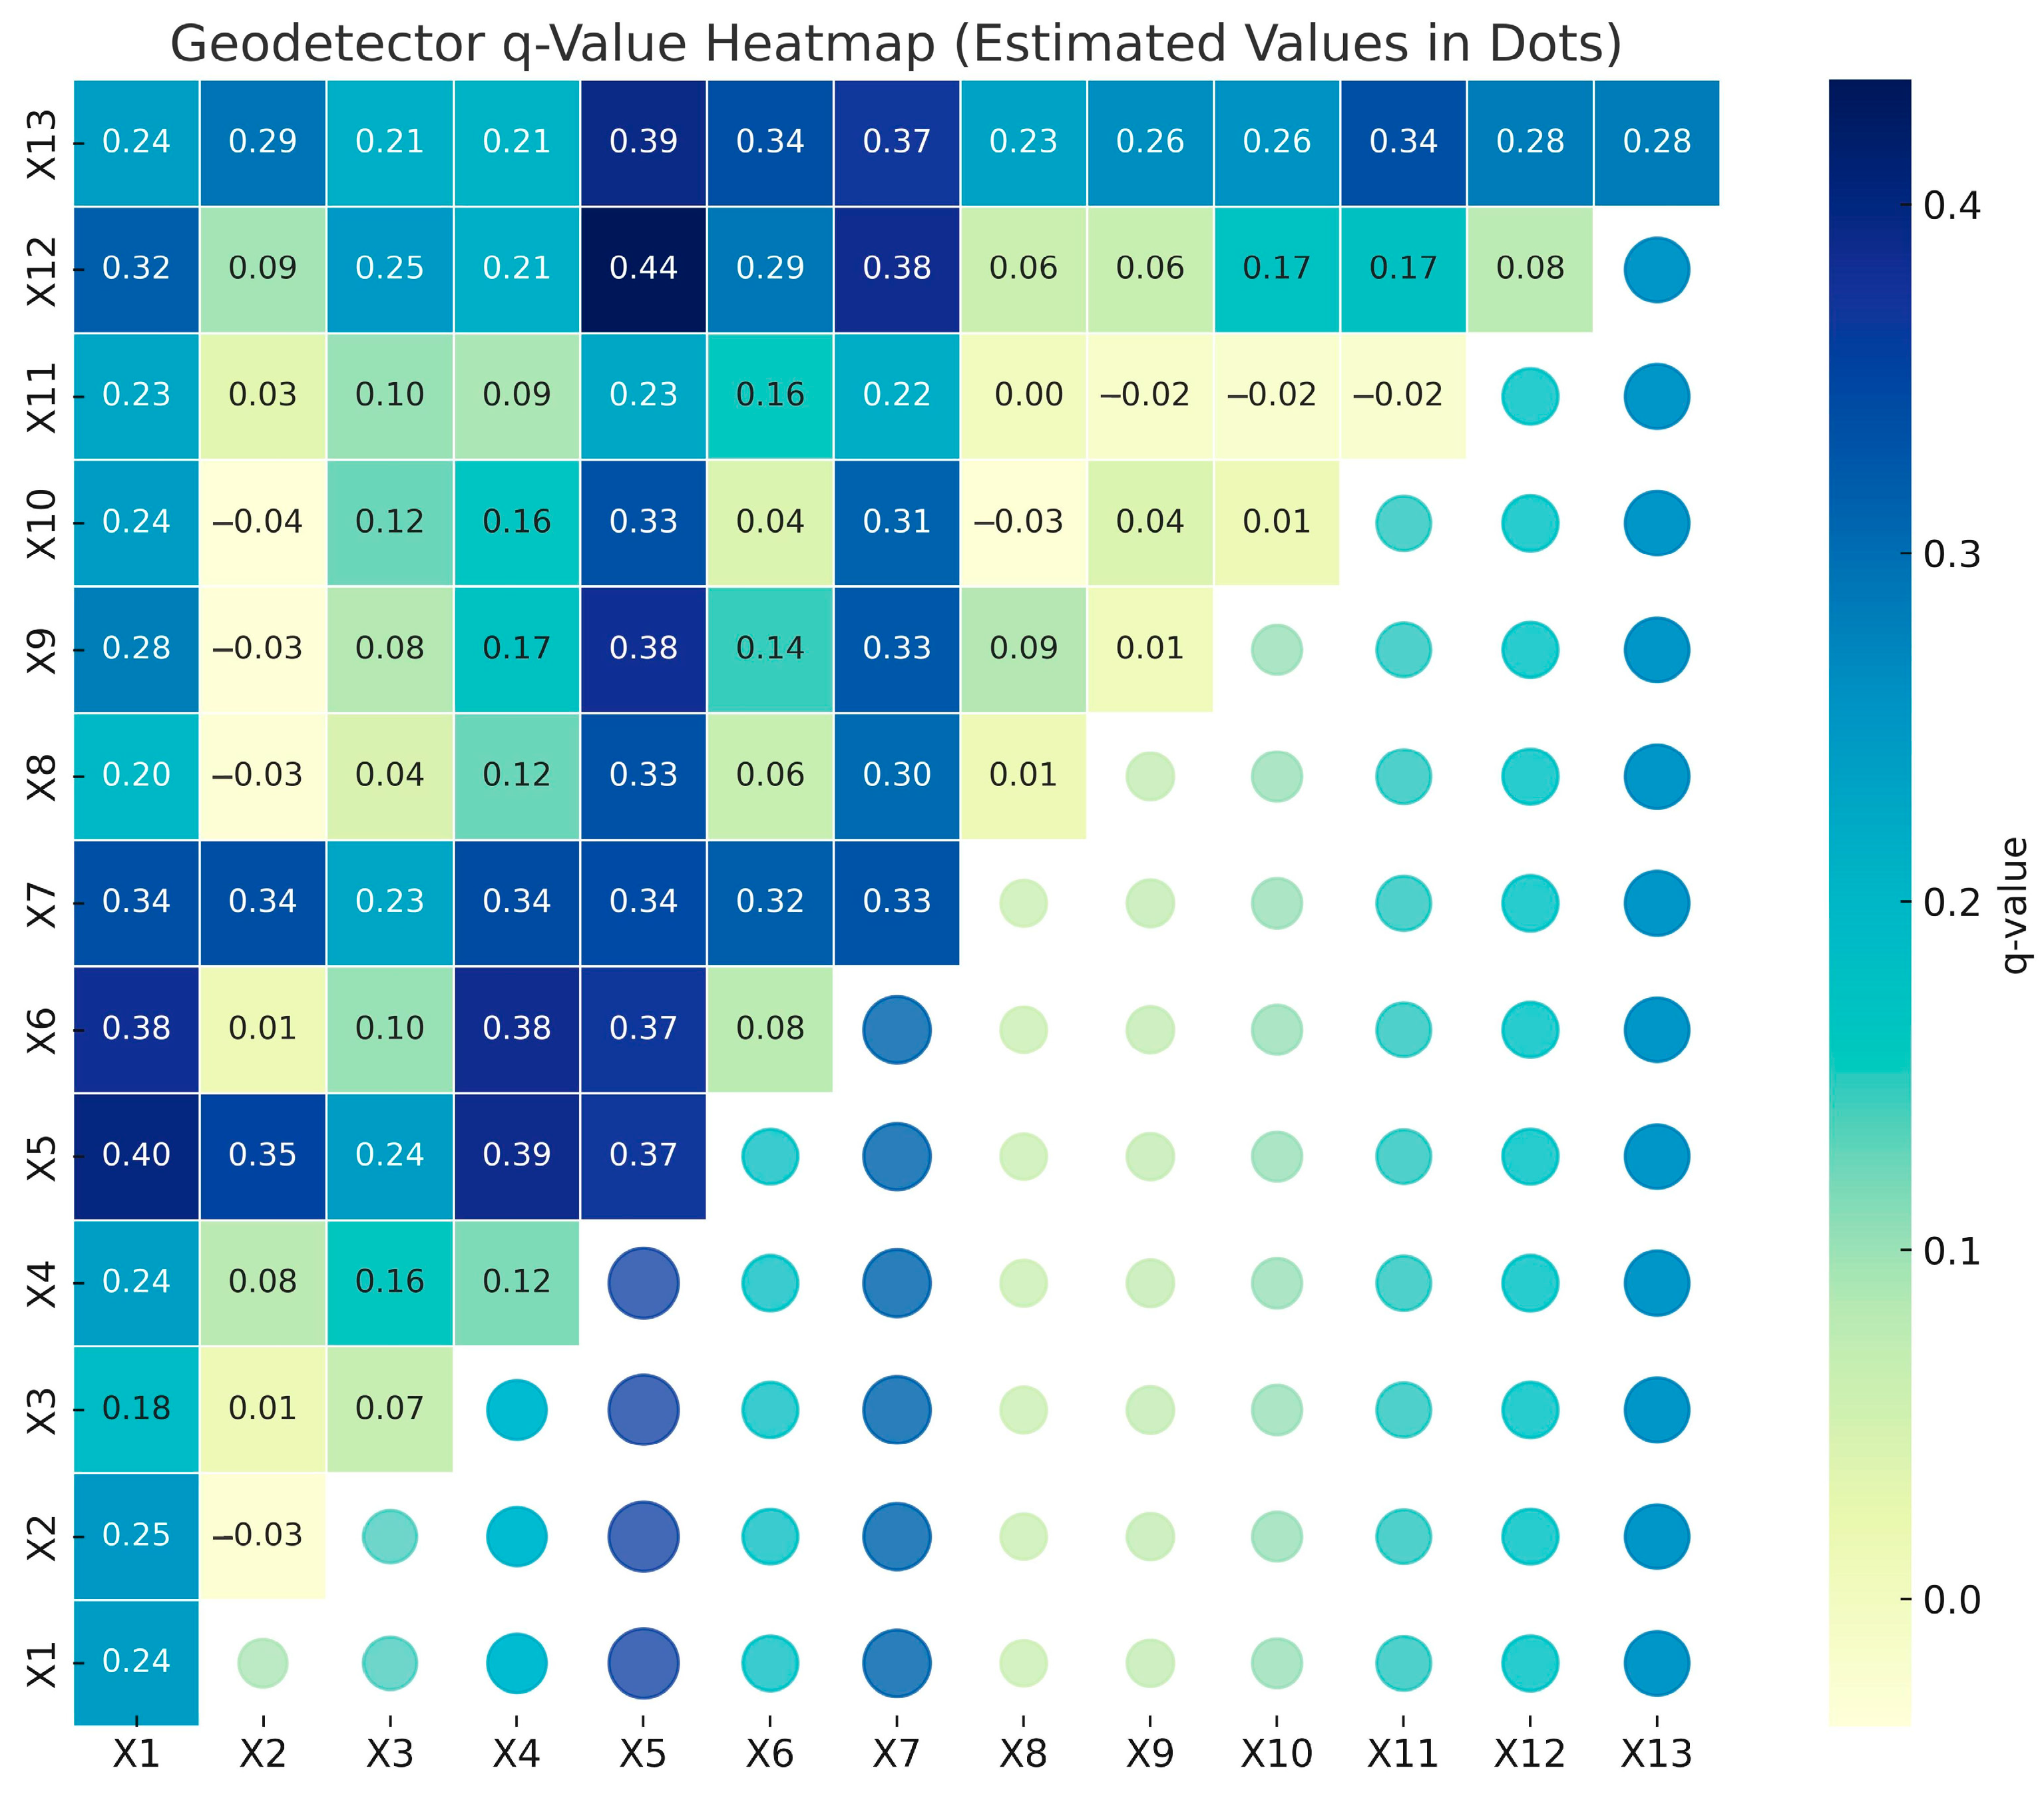
3.2.2. Interaction Analysis of Influencing Factors
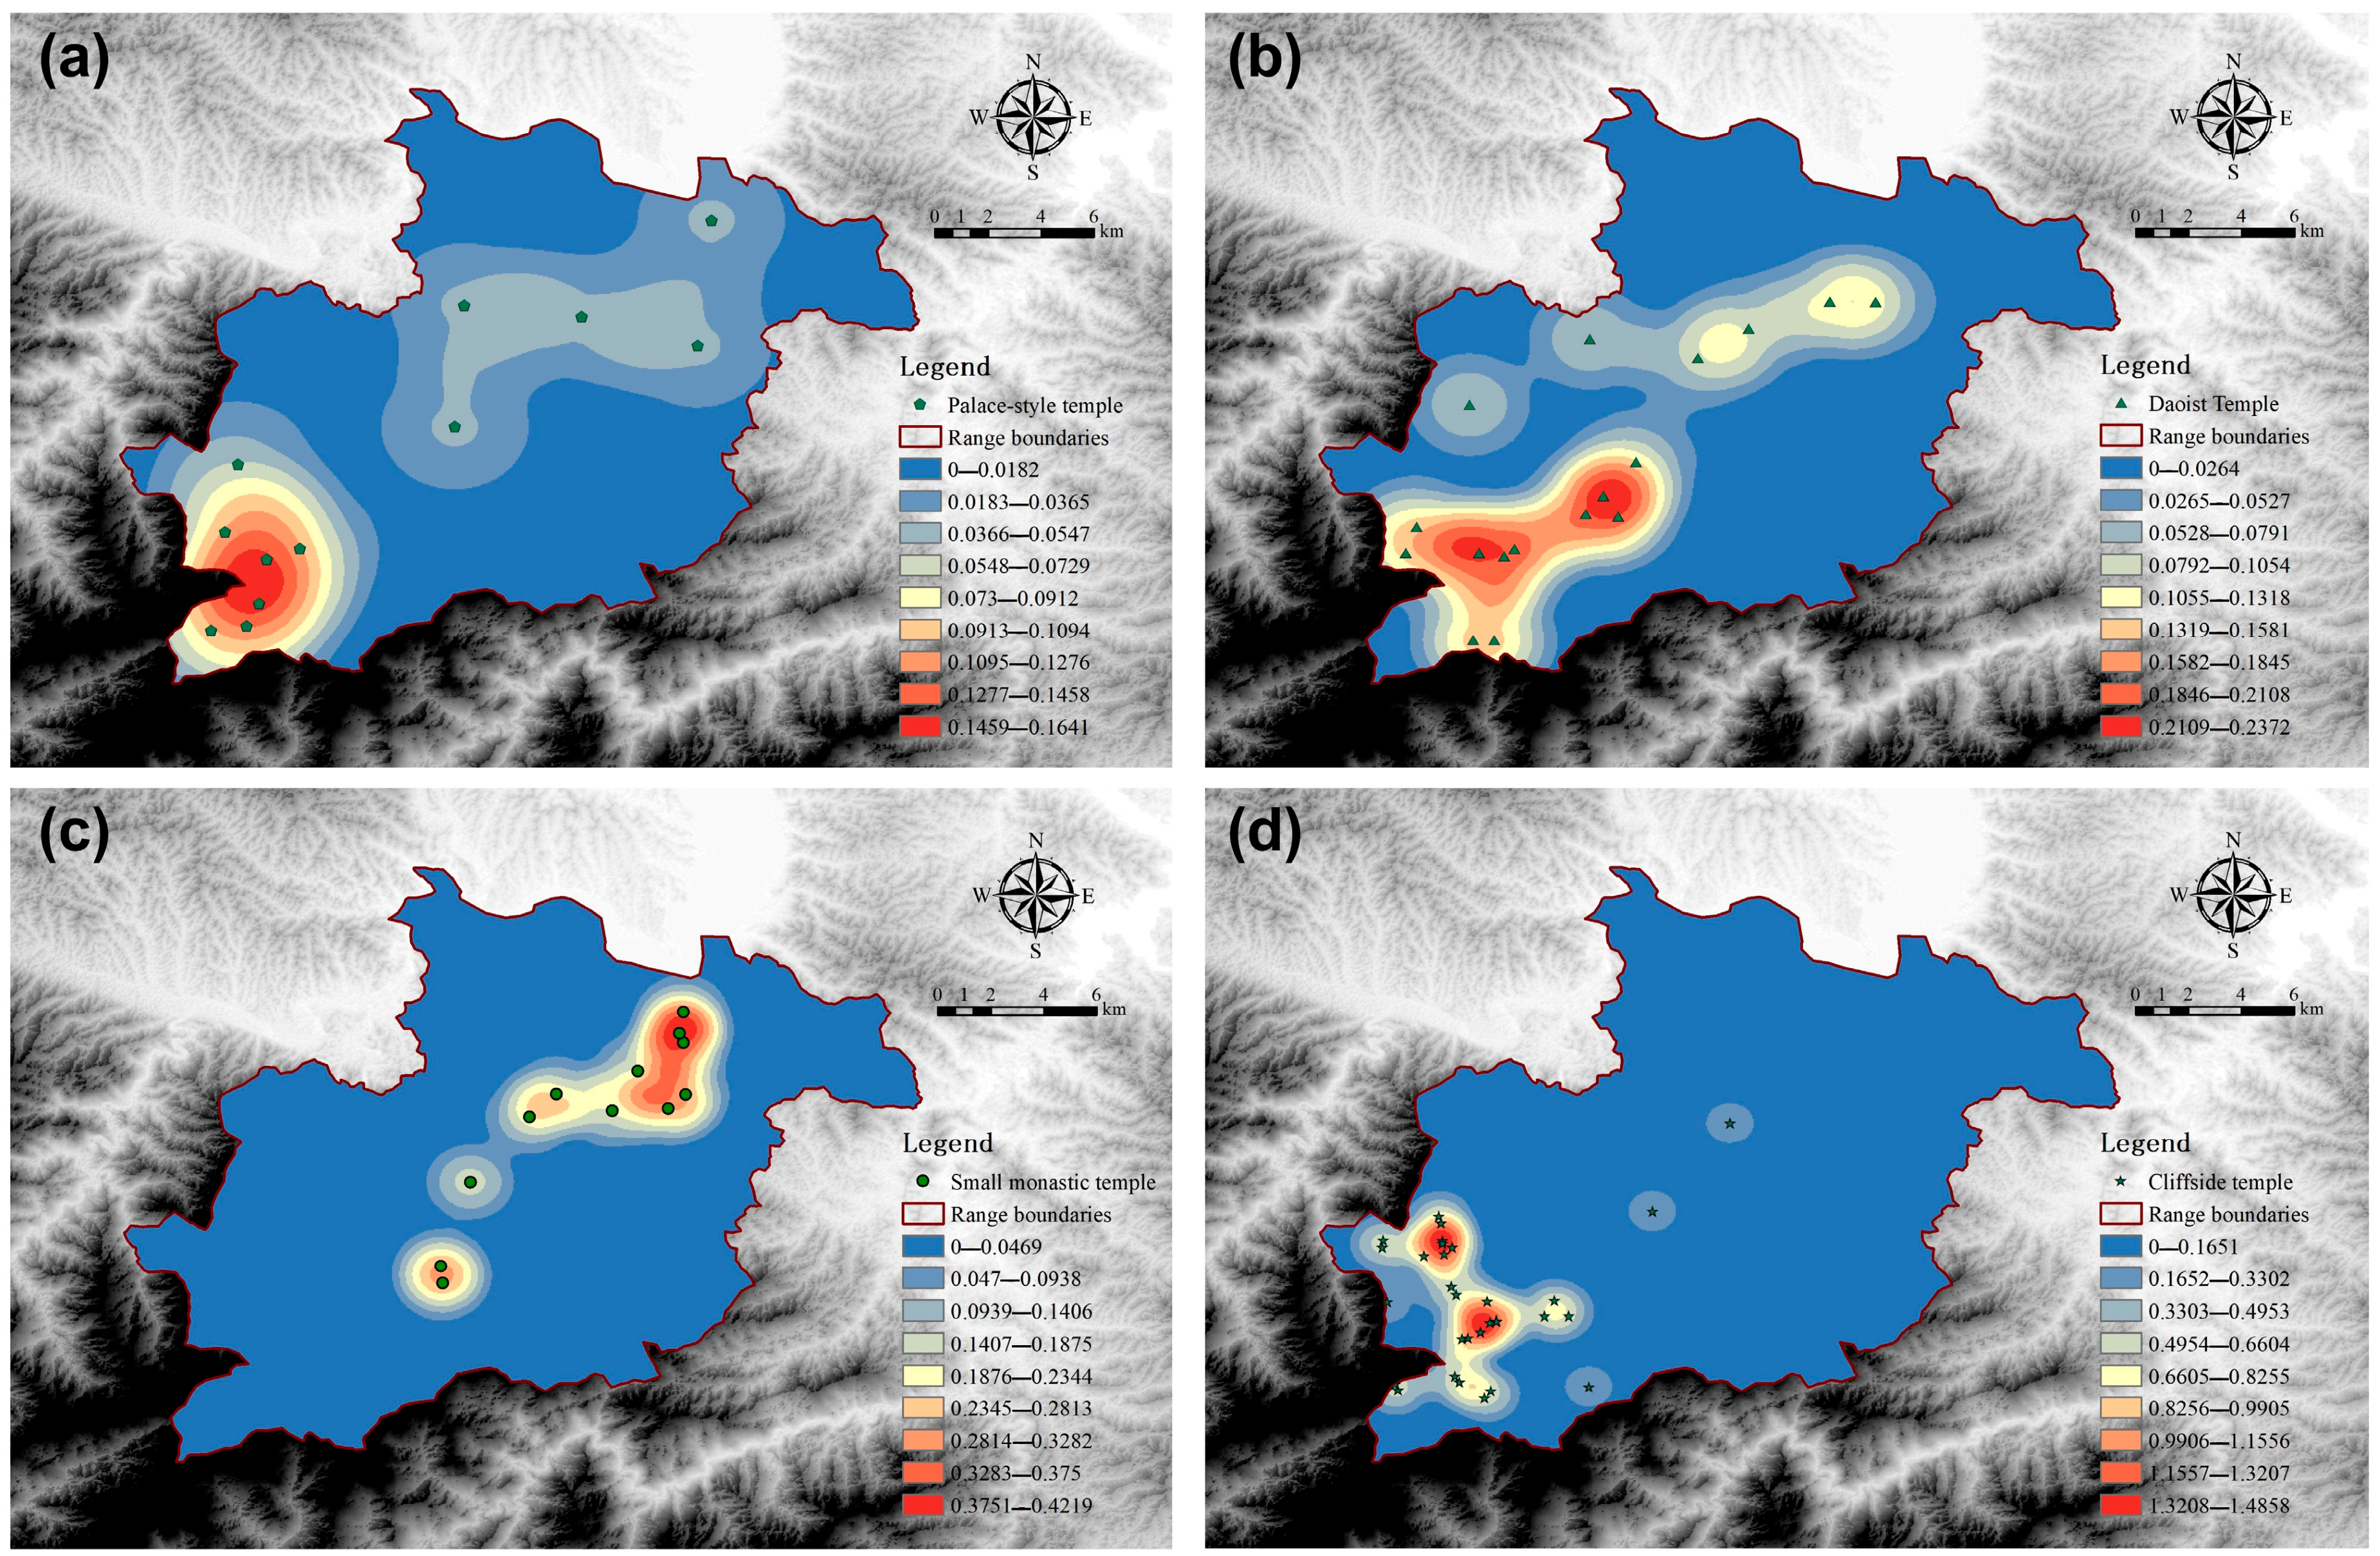
3.3. Natural Factors Shaping the Site Selection of Different Temple Types
4. Discussion
4.1. Ecological Rationality in Temple Site Selection
4.2. The Influence of Cultural Factors in Temple Site Selection
4.3. Research Limitations and Future Directions
- (1)
- Historical Environmental Reconstruction: Incorporate paleoclimate records, historical vegetation data, and ancient soil profiles to better reflect the environmental conditions at the time of temple construction. This will reduce reliance on modern proxy datasets and improve temporal accuracy.
- (2)
- Dynamic Landscape Modeling: Integrate temporal GIS and landscape evolution modeling, as these can simulate environmental changes over time [46], offering a more dynamic understanding of how natural and cultural factors interacted during site selection.
- (3)
- Cultural–Spatial Interaction Analysis: Quantitatively examine how cosmological symbolism, political hierarchy, and religious ritual spaces influenced spatial logic, particularly in comparison with other sacred mountain sites.
5. Conclusions
- (1)
- The spatial layout of Wudang Mountain temples displays a clear hierarchical clustering pattern: dense cores in the southwestern highlands, ridge-aligned belts, and sparse peripheries. Kernel density and nearest neighbor analyses (R = 0.721, p < 0.01) confirm non-random agglomeration, while standard deviation ellipse analysis reveals a southwest–northeast orientation. This direction mirrors the natural balance that was struck in the Wudang range and aligns with historical pilgrimage routes, enhancing both sacred accessibility and visual prominence. These patterns reflect a deliberate balance between symbolic hierarchy and environmental suitability, with the mountain serving as an active agent in spatial planning.
- (2)
- Temple siting in Wudang Mountain reflects an integrated response to multiple environmental thresholds, particularly within the 700–1000 m elevation band. This range provides optimal conditions for visibility, climatic comfort, and symbolic prominence, while avoiding the extremes of lowland humidity and high-altitude exposure. The strongest interaction (porosity × NDVImax, q = 0.436) suggests that temples favored areas where moderately porous soils supported dense vegetation—enhancing slope stability and structural anchorage. Preferred soil conditions (porosity: 45–54%; bulk density: 1.3–1.5 g/cm3) strike a balance between load-bearing capacity and drainage efficiency. The prevalence of mildly acidic soils (pH 6.5–7.0), often associated with exposed bedrock, reflects a material adaptation strategy: such substrates resist biological degradation and provide long-term foundational integrity, particularly for cliffside temples.
- (3)
- The site selection of temple complexes in Wudang Mountain was shaped by the combined influence of multiple environmental variables, with no single factor independently determining suitability. Precipitation, altitude, and soil porosity emerged as key drivers, frequently involved in high-impact interactions. Cliffside temples exhibit the strongest ecological selectivity, favoring steep slopes, high elevations, acidic, low-porosity soils, and dense vegetation. Ridge regression confirmed soil pH, porosity, and bulk density as significant predictors (R2 = 0.444, p < 0.01), highlighting the importance of geotechnical and microclimatic stability in supporting this architectural form. In contrast, small monastic temples are concentrated at lower elevations with warmer temperatures, higher soil compaction, and high-pH soils near water sources—emphasizing accessibility and daily ritual use. Palace-style and Daoist temples show weaker environmental correlations, suggesting their siting was shaped more by symbolic, ritual, or political priorities than by ecological suitability. While these patterns support an ecological adaptation hypothesis, they reflect probabilistic tendencies rather than deterministic rules. Overall, temple siting reflects a synthesis of environmental constraints and intentional cultural selection.
Author Contributions
Funding
Data Availability Statement
Conflicts of Interest
References
- Wang, C.; Chen, M.; Wang, Y. Surface flaking mechanism of stone components of ancient building complex in Wudang Mountain, China. Constr. Build. Mater. 2023, 399, 132611. [Google Scholar] [CrossRef]
- Davis, N. Daoist Ritual, State Religion, and Popular Practices: Zhenwu Worship from Song to Ming (960–1644) by Shin-Yi Chao. J. Chin. Relig. 2012, 40, 100–103. [Google Scholar] [CrossRef]
- Jackson, P. Ideas in Daoism relative to ecology and the environment. In Nature, Environment and Culture in East Asia; Brill: Leiden, The Netherlands, 2013; pp. 41–68. [Google Scholar]
- von Erdberg-Consten, E. Time and Space in Chinese Cosmology. Philipp. Q. Cult. Soc. 1973, 1, 120–131. [Google Scholar]
- Zhu, Y. Contested sacred space: State power, spatial politics, and heritage tourism. Tour. Geogr. 2025, 1–25. [Google Scholar] [CrossRef]
- Magli, G. Sacred Landscapes of Imperial China: Astronomy, Feng Shui, and the Mandate of Heaven; Springer Nature: Berlin/Heidelberg, Germany, 2020. [Google Scholar]
- Xu, Z. Ancient Feng Shui View of Site Construction Site Selection and Layout Study. In Proceedings of the 2017 International Conference on Economics and Management, Education, Humanities and Social Sciences (EMEHSS 2017), Hangzhou, China, 15–16 April 2017; pp. 436–440. [Google Scholar]
- Cui, J.; Liu, Y.; Sun, J.; Hu, D.; He, H. Study on Feng Shui (Geomantic) suitability evaluation of mausoleums in Nanjing City Based on GIS. ISPRS Int. J. Geo-Inf. 2021, 10, 752. [Google Scholar] [CrossRef]
- Baratta, N.C.; Magli, G. The role of astronomy and Feng Shui in the planning of Ming Beijing. Nexus Netw. J. 2021, 23, 767–787. [Google Scholar] [CrossRef]
- Du, Y. Historic Research on Planning Theory and Methods of the Wudang Mountains Scenic Spot in Ming Dynasty. Ph.D. Thesis, Beijing Forestry University, Beijing, China, 2015. [Google Scholar]
- Mak, M.Y.; Ng, S.T. Feng shui: An alternative framework for complexity in design. Archit. Eng. Des. Manag. 2008, 4, 58–72. [Google Scholar] [CrossRef]
- Paton, M. Five Classics of Fengshui: Chinese Spiritual Geography in Historical and Environmental Perspective; Brill: Leiden, The Netherlands, 2013; Volume 110. [Google Scholar]
- Wang, J. Art Research of Scene Space on the Pilgrim’s Progress About Wu Dang Mountain. Ph.D. Thesis, Xi’an University of Architecture and Technology, Xi’an, China, 2012. [Google Scholar]
- Wei, G.; Han, G.-S.; Lang, X. Cultural heritage site selection characteristics and the impact of the natural environment in Jinan city, China. Sci. Rep. 2024, 14, 31038. [Google Scholar] [CrossRef]
- Gao, J.; Wang, J.; Wang, Q.; Cao, Y. Spatio-Temporal Distribution Characteristics of Buddhist Temples and Pagodas in the Liaoning Region, China. Buildings 2024, 14, 2765. [Google Scholar] [CrossRef]
- Ma, X.; Zhang, Y.; Li, Y.; Li, Y.; Lin, F. Spatial–temporal distribution and evolution of the socialist built heritage in China, 1949–1978. Herit. Sci. 2023, 11, 214. [Google Scholar] [CrossRef]
- Zhang, T.; Hu, Y.; Lei, T.; Hu, H. A GIS-based study on the spatial distribution and influencing factors of monastic gardens in Jiangxi Province, China. Front. Environ. Sci. 2023, 11, 1252231. [Google Scholar] [CrossRef]
- Liao, Y.; Cenci, J.; Zhang, J. Chinese modern architectural heritage resources: Perspectives of spatial distribution and influencing factors. ISPRS Int. J. Geo-Inf. 2023, 12, 358. [Google Scholar] [CrossRef]
- Kang, J.; Li, C.; Zhang, B.; Zhang, J.; Li, M.; Hu, Y. How do natural and human factors influence ecosystem services changing? A case study in two most developed regions of China. Ecol. Indic. 2023, 146, 109891. [Google Scholar] [CrossRef]
- Li, X. Determination of the temporal–spatial distribution patterns of ancient heritage sites in China and their influencing factors via GIS. Herit. Sci. 2024, 12, 143. [Google Scholar] [CrossRef]
- Wang, M. Taihe Wudang Mountain Topography. 1681. (In Chinese) [Google Scholar]
- Wang, G. A Brief History of Mount Taihe. 1744. (In Chinese) [Google Scholar]
- Fang, S. Distribution Map of the Palaces and Temples in Mount Taihe. 1536. (In Chinese) [Google Scholar]
- Fang, S.; Wang, Z.; Shen, G. Taihe Mountain Topography; Hubei Science and Technology Press: Wuhan, China, 2021. (In Chinese) [Google Scholar]
- Gao, K. Wudang Mountain Chronicles; Xinhua Publishing House: Beijing, China, 1994. (In Chinese) [Google Scholar]
- Geospatial Data Cloud, C.N.I.C., Chinese Academy of Sciences. Digital Altitude Model (DEM) Digital Altitude Data. 2025. Available online: https://www.gscloud.cn (accessed on 1 May 2025).
- Resources Environmental Science Data Center, C.A.o.S. Spatial Distribution Data of One Million Landform Types in China. 2024. Available online: https://www.resdc.cn/data.aspx?DATAID=124 (accessed on 1 May 2025).
- Shouzhang, P. 1-km Monthly Precipitation Dataset for China (1901–2023); National Tibetan Plateau Data Center: Beijing, China, 2024. [Google Scholar]
- Shouzhang, P. 1-km Monthly Maximum Temperature Dataset for China (1901–2023); National Tibetan Plateau Data Center: Beijing, China, 2024. [Google Scholar] [CrossRef]
- Dong, J.W.; Zhou, Y.; You, N.S. 30-Meter Annual Maximum NDVI Dataset of China from 2000 to 2022. 2021. Available online: https://www.nesdc.org.cn/sdo/detail?id=60f68d757e28174f0e7d8d49 (accessed on 1 May 2025).
- Shi, G.; Shangguan, W. A China Dataset of Soil Properties for Land Surface Modeling (Version 2, CSDLv2); National Tibetan Plateau/Third Pole Environment Data Center: Beijing, China, 2024. [Google Scholar] [CrossRef]
- Zhong, Z.; Peng, B.; Elahi, E. Spatial and temporal pattern evolution and influencing factors of energy–environmental efficiency: A case study of Yangtze River urban agglomeration in China. Energy Environ. 2021, 32, 242–261. [Google Scholar] [CrossRef]
- Liu, C.; Wang, H.; Song, L.; Fu, Q. Spatial Pattern and Influencing Factors of Hong Kong, Macao and Taiwan’s Direct Investment in the Pearl River-Xijiang River Economic Belt. DEStech Trans. Soc. Sci. Educ. Hum. Sci. 2018. [Google Scholar] [CrossRef]
- Xu, Z.; Tian, G.; Wei, K.; Ma, Y.; Zhang, S.; Huang, Y.; Yao, X. The influence of environment on the distribution characteristics of historical buildings in the Songshan Region. Land 2022, 11, 2094. [Google Scholar] [CrossRef]
- Huang, Y.; Xue, Q. Analysis of the Spatial Distribution Characteristics and Influencing Factors of Traditional Mosque Architecture in the Hehuang Area (China). Buildings 2024, 14, 1258. [Google Scholar] [CrossRef]
- Zhu, J.; Xu, W.; Xiao, Y.; Shi, J.; Hu, X.; Yan, B. Temporal and spatial patterns of traditional village distribution evolution in Xiangxi, China: Identifying multidimensional influential factors and conservation significance. Herit. Sci. 2023, 11, 261. [Google Scholar] [CrossRef]
- Gong, G.; Wei, Z.; Zhang, F.; Li, Y.; An, Y.; Yang, Q.; Wu, J.; Wang, L.; Yu, P. Analysis of the spatial distribution and influencing factors of China national forest villages. Environ. Monit. Assess. 2022, 194, 428. [Google Scholar] [CrossRef]
- Zhu, L.; Hu, J.; Xu, J.; Li, Y.; Liang, M. Spatial distribution characteristics and influencing factors of pro-poor tourism villages in China. Sustainability 2022, 14, 15953. [Google Scholar] [CrossRef]
- Chen, J.; Xu, C.; Lin, S.; Wu, Z.; Qiu, R.; Hu, X. Is there spatial dependence or spatial heterogeneity in the distribution of vegetation greening and browning in southeastern China? Forests 2022, 13, 840. [Google Scholar] [CrossRef]
- Shi, Y.; Mao, Y.; Zhou, L. Research on the Relationship between Public Open Space and the Thermal Environment in Shanghai Based on Multisource Data Integration. Sustain. Cities Soc. 2025, 106415. [Google Scholar] [CrossRef]
- Zhao, Y. Research on Landscape Character Identification for Famous Mountains Based on Integrity of Nature and Culture. Ph.D. Thesis, Huazhong Agricultural University, Wuhan, China, 2019. [Google Scholar]
- Parkes, G. Winds, waters, and earth energies: Fengshui and sense of place. In Nature Across Cultures: Views of Nature and the Environment in Non-Western Cultures; Springer: Berlin/Heidelberg, Germany, 2003; pp. 185–209. [Google Scholar]
- Wei, K.; Jiang, X.; Zhu, R.; Duan, X.; Yang, J. Spatial and Temporal Distribution Characteristics of Heritage Buildings in Yangzhou and Influencing Factors and Tourism Development Strategies. Buildings 2025, 15, 1081. [Google Scholar] [CrossRef]
- Van Nguyen, M.; Duy, K.H. Prioritizing barriers to the conservation of cultural heritage buildings in adaptation to urbanization and climate change. J. Clean. Prod. 2024, 473, 143529. [Google Scholar]
- Jia, J. Formation of the traditional Chinese state ritual system of sacrifice to mountain and water spirits. Religions 2021, 12, 319. [Google Scholar] [CrossRef]
- Chen, D.; Zhang, F.; Jim, C.Y.; Bahtebay, J. Spatio-temporal evolution of landscape patterns in an oasis city. Environ. Sci. Pollut. Res. 2023, 30, 3872–3886. [Google Scholar] [CrossRef]


| Types | Definition | Quantity |
|---|---|---|
| Palace-style temple | A palace-style temple often established by imperial decree, characterized by a grand scale and formal axial layout, typically dedicated to major deities from Taoism or the state religion. | 12 |
| Daoist temple | A Taoist temple or monastery where priests reside and conduct rituals, usually featuring a courtyard layout and dedicated to Taoist deities. | 17 |
| Small monastic temple | A small Buddhist nunnery or modest monastic temple, often inhabited by nuns and characterized by a simple architecture and secluded settings. | 12 |
| Cliffside temple | A temple built into or against a cliff or rock face, often carved into the mountain itself, integrating natural topography with religious function, typically Buddhist or Taoist. | 31 |
| Factor | Indicator | Indicator Interpretation |
|---|---|---|
| Topography | Altitude | The vertical height above sea level, influencing temperature, air pressure, and vegetation types. |
| Aspect | The orientation of a slope, which affects solar radiation exposure and microclimate. | |
| Slope | The steepness or inclination of the terrain, affecting water runoff, erosion risk, and land stability. | |
| Landform types | Categorical classification of surface morphology (e.g., hills, valleys, plains) reflecting terrain formation processes and influencing hydrology and land use. | |
| Hydrology | Precipitation | The amount of rainfall or snowfall received, affecting soil moisture, vegetation growth, and runoff. |
| Distance from watershed | Proximity to the nearest drainage divide or river network, influencing hydrological connectivity and soil water availability. | |
| Climate | Temperature | The average thermal condition over time, determining vegetation zones and biological activity. |
| Diffuse solar radiation | The portion of solar radiation scattered by the atmosphere before reaching the surface, important for photosynthesis under cloud cover. | |
| Direct solar radiation | The unscattered solar energy received directly from the sun, strongly influencing surface heat and evapotranspiration. | |
| Vegetation | NDVImax | The maximum normalized difference vegetation Index during the growing season, used as a proxy for vegetation vigor and productivity. |
| Soil | Bulk density | The mass of dry soil per unit volume, indicating soil compaction and influencing root growth and water infiltration. |
| Porosity | The proportion of void space in the soil, affecting its capacity to retain air and water. | |
| pH value | A measure of soil acidity or alkalinity, affecting nutrient availability and microbial activity. |
| Data Type | Name | Source | References |
|---|---|---|---|
| Topography data | Digital Altitude Model (DEM) digital altitude data | Geospatial Data Cloud platform of the Chinese Academy of Sciences (https://www.gscloud.cn (accessed on 1 May 2025)) | [26] |
| Spatial distribution data of one million landform types in China | Resources and Environmental Science Data Center of the Chinese Academy of Science (https://www.resdc.cn/data.aspx?DATAID=124 (accessed on 1 May 2025)) | [27] | |
| Hydrology data | 1 km monthly precipitation dataset for China (1901–2023) | National Tibetan Plateau/Third Pole Environment Data Center. (https://data.tpdc.ac.cn/zh-hans/data/faae7605-a0f2-4d18-b28f-5cee413766a2 (accessed on 1 May 2025)) | [28] |
| Climate data | 1 km monthly maximum temperature dataset for China (1901–2023) | National Tibetan Plateau/Third Pole Environment Data Center (https://data.tpdc.ac.cn/zh-hans/data/35ffff9f-8e1b-4296-801f-d8231e4f8dc3 (accessed on 1 May 2025)) | [29] |
| Vegetation data | China 30 m maximum NDVI annual dataset (2000–2022) | National Ecosystem Science Data Center, National Science & Technology Infrastructure of China (https://www.nesdc.org.cn/sdo/detail?id=60f68d757e28174f0e7d8d49 (accessed on 1 May 2025)) | [30] |
| Soil data | Chinese dataset of soil properties for land surface modeling (version 2, CSDLv2) | National Tibetan Plateau/Third Pole Environment Data Center (https://data.tpdc.ac.cn/en/data/46ddd893-3b2b-4bb3-b9e6-b043f3c5c3a2 (accessed on 1 May 2025)) | [31] |
| Dimension | Specific Indicators | Palace-Style Temple | Daoist Temple | Small Monastic Temple | Cliffside Temple | ||||
|---|---|---|---|---|---|---|---|---|---|
| Pearson Correlation | p-Value | Pearson Correlation | p-Value | Pearson Correlation | p-Value | Pearson Correlation | p-Value | ||
| Topography | Altitude | 0.055 | 0.649 | −0.104 | 0.384 | −0.478 | 0.000 ** | 0.408 | 0.000 ** |
| Aspect | 0.043 | 0.718 | −0.031 | 0.799 | −0.111 | 0.355 | 0.077 | 0.522 | |
| Slope | −0.215 | 0.070 | −0.153 | 0.201 | −0.182 | 0.126 | 0.429 | 0.000 ** | |
| Landform types | −0.124 | 0.298 | 0.129 | 0.279 | 0.467 | 0.000 ** | −0.349 | 0.003 ** | |
| Hydrology | Precipitation | 0.041 | 0.730 | −0.055 | 0.645 | −0.489 | 0.000 ** | 0.384 | 0.001 ** |
| Distance from watershed | 0.073 | 0.544 | −0.088 | 0.460 | −0.270 | 0.022 * | 0.224 | 0.058 | |
| Climate | Temperature | −0.068 | 0.570 | 0.085 | 0.476 | 0.501 | 0.000 ** | −0.399 | 0.001 ** |
| Diffuse solar radiation | 0.051 | 0.668 | 0.133 | 0.265 | 0.162 | 0.173 | −0.275 | 0.019 * | |
| Direct solar radiation | −0.111 | 0.352 | 0.091 | 0.447 | −0.156 | 0.191 | 0.123 | 0.303 | |
| Vegetation | NDVImax | −0.183 | 0.123 | −0.046 | 0.700 | −0.276 | 0.019 * | 0.386 | 0.001 ** |
| Soil | Bulk density | −0.114 | 0.340 | 0.216 | 0.069 | 0.353 | 0.002 ** | −0.365 | 0.002 ** |
| Porosity | 0.114 | 0.340 | −0.088 | 0.464 | −0.367 | 0.002 ** | 0.266 | 0.024 * | |
| pH value | −0.025 | 0.833 | 0.175 | 0.141 | 0.500 | 0.000 ** | −0.507 | 0.000 ** | |
| Indicator | Non-Standardized Coefficient | Standardized Coefficient | t-Statistic | p-Value | VIF Value |
|---|---|---|---|---|---|
| Altitude | −0.195 | 0.005 | −0.741 | 0.411 | 3.877 |
| Aspect | −0.009 | 0.025 | −0.122 | 0.887 | 5.717 |
| Slope | 0.076 | 0.083 | 0.972 | 0.307 | 5.234 |
| Landform types | −0.056 | −0.047 | −0.757 | 0.398 | 2.031 |
| Precipitation | −0.468 | −0.01 | −0.935 | 0.306 | 1.890 |
| Distance from watershed | −0.028 | −0.034 | −0.249 | 0.780 | 1.898 |
| Temperature | −0.535 | −0.009 | −0.918 | 0.286 | 3.581 |
| Diffuse solar radiation | −0.128 | −0.056 | −1.198 | 0.175 | 5.227 |
| Direct solar radiation | 0.113 | 0.056 | 1.342 | 0.130 | 3.665 |
| NDVImax | 0.058 | 0.041 | 0.688 | 0.457 | 2.997 |
| Bulk density | −0.175 | −0.077 | −1.977 | 0.034 * | 1.645 |
| Porosity | −0.209 | −0.068 | −2.134 | 0.026 * | 3.334 |
| pH value | −0.297 | −0.132 | −2.217 | 0.013 * | 3.273 |
| R2 | 0.444 | ||||
| Adjusted R2 | 0.308 | ||||
| F-statistic | 3.254 | ||||
| F p-value | 0.001 ** |
Disclaimer/Publisher’s Note: The statements, opinions and data contained in all publications are solely those of the individual author(s) and contributor(s) and not of MDPI and/or the editor(s). MDPI and/or the editor(s) disclaim responsibility for any injury to people or property resulting from any ideas, methods, instructions or products referred to in the content. |
© 2025 by the authors. Licensee MDPI, Basel, Switzerland. This article is an open access article distributed under the terms and conditions of the Creative Commons Attribution (CC BY) license (https://creativecommons.org/licenses/by/4.0/).
Share and Cite
Yan, Y.; Bai, Z.; Hu, X.; Wang, Y. How Do Natural Environmental Factors Influence the Spatial Patterns and Site Selection of Famous Mountain Temple Complexes in China? Quantitative Research on Wudang Mountain in the Ming Dynasty. Land 2025, 14, 1441. https://doi.org/10.3390/land14071441
Yan Y, Bai Z, Hu X, Wang Y. How Do Natural Environmental Factors Influence the Spatial Patterns and Site Selection of Famous Mountain Temple Complexes in China? Quantitative Research on Wudang Mountain in the Ming Dynasty. Land. 2025; 14(7):1441. https://doi.org/10.3390/land14071441
Chicago/Turabian StyleYan, Yu, Zhe Bai, Xian Hu, and Yansong Wang. 2025. "How Do Natural Environmental Factors Influence the Spatial Patterns and Site Selection of Famous Mountain Temple Complexes in China? Quantitative Research on Wudang Mountain in the Ming Dynasty" Land 14, no. 7: 1441. https://doi.org/10.3390/land14071441
APA StyleYan, Y., Bai, Z., Hu, X., & Wang, Y. (2025). How Do Natural Environmental Factors Influence the Spatial Patterns and Site Selection of Famous Mountain Temple Complexes in China? Quantitative Research on Wudang Mountain in the Ming Dynasty. Land, 14(7), 1441. https://doi.org/10.3390/land14071441