Article

From Stated Importance to Revealed Preferences: Assessing Residential Property Features

Faculty of Geoengineering, University of Warmia and Mazury in Olsztyn, 10-720 Olsztyn, Poland
*
Author to whom correspondence should be addressed.
Land 2025, 14(7), 1339; https://doi.org/10.3390/land14071339
Submission received: 26 April 2025 / Revised: 9 June 2025 / Accepted: 23 June 2025 / Published: 24 June 2025
(This article belongs to the Special Issue Optimizing Land Development: Trends and Best Practices)

Abstract

The optimization of land development requires a deep understanding of end-user expectations to ensure that new residential environments are both market-responsive and socially sustainable. This paper presents a novel prioritization-based technique for identifying and ranking property features according to buyer preferences. Using the MoSCoW method in combination with conjoint analysis, the study evaluates the relative importance of various housing attributes, such as layout, number of rooms, access to transportation, and availability of parking or green areas. The results provide structured insights into demand-side priorities and offer actionable guidelines for developers, urban planners, and decision-makers engaged in land use planning. By linking individual housing preferences with broader planning strategies, the proposed framework contributes to the creation of better-aligned, user-centric urban developments. The approach is tested on a local property market, and its potential applications in strategic zoning, infrastructure placement, and residential density modeling are discussed.

1. Introduction

One of the stages of developing either decision-making models, decision-support systems, or computational solutions, and, in fact, any analysis, is the stage of collecting and appropriately processing adequate information describing the phenomenon being studied. When real estate market analysis is the subject of investigation, the selection of data for substantive assessment and mathematical examination is an indispensable stage. This stage is especially important in terms of assessing the significance of real estate features; therefore, the appropriate selection of methods and techniques for this purpose is undoubtedly a challenge, especially in terms of the quality, availability, and reliability of information [1,2,3]. Adequate information collected and prepared for further processing constitutes the basis for obtaining results that reflect the analyzed part of the market. Studies investigating approaches utilized in the selection and assessment of the significance of real estate features highlight the necessity of exploring methods and techniques that are more apt for comprehending the specificity of the real estate market [4,5,6]. Additionally, these methods should consider the crucial role played by individual decision-makers in shaping the processes occurring within the market.
The difficulty in identifying these attributes is primarily due to two reasons. Firstly, a multitude of factors influence the real estate market and property prices. These factors are associated with economic, social, technical, and behavioral aspects, making them challenging to define, particularly in quantified and graded forms. Secondly, there are no unified and effective methods available for analyzing the real estate market, owing to its unique characteristics. The literature indicates that some of the most frequently mentioned features in Poland in the context of predicting real estate prices are location, usable area, distance from the city center, access to transportation, and access to utilities [7,8,9]. These property features often form the basis of analyses conducted in the real estate market. However, considering these features as significant without a thorough analysis of the local market’s nature and changes in the preferences of market participants can be problematic. Other features that appear less frequently in real estate price analyses include building type, construction technology, elevators, functionality, technical conditions, storage rooms, type of heating system, distance from green areas, technical infrastructure, trends, and building density [10]. Additionally, the scientific literature points to other property features that have been analyzed both in the Polish market and foreign markets in the context of real estate price formation: building architecture, plot area, building age, number of rooms, number of bathrooms, floor level, walking and cycling paths, distance to school, distance from shopping facilities, distance from the road, distance from the metro, commute time to work, access to public facilities, access to social infrastructure, parking availability, friendly neighborhood, safety of the area, view from the window, orientation, noise, odor, pools, gyms, land topography, plot shape, and soil bearing capacity [11,12,13,14].
The cited scientific studies point to certain general trends regarding property features considered as the basis for predicting real estate prices and highlight areas for further research. A comprehensive review of the scientific literature addressing real estate market issues indicates that assessing the significance of features, due to their fluid, ambiguous, and imprecise nature, is a relatively infrequent topic of research and consideration.
The purpose of this paper was to propose a methodology for selecting and assessing the relevance of property features based on the prioritization technique in the study of the preferences of potential property buyers; therefore, the following hypothesis was the subject of verification: the prioritization technique is a valuable tool in property buyers’ preference analysis. The objective of the proposed solution was to enable the identification of property feature sets that are important in the investment decision-making process and might shape the price and value of the property in relation to the selected local market at a given time. Additionally, the authors intended to indicate that the lack of a thorough analysis of information from entities on the property market may result in the perpetuation of stereotypes regarding the significance of property features, as well as the belief that there is one constant set of property features influencing their value and prices.
The authors of this article point out differences in approaches to selecting important features based on the prioritization technique and the classic assumptions of preference research used in property valuation practice. This study is structured as follows: Section 2 presents the problem of property features’ significance in property valuation procedures. In Section 3, the importance of property market participants’ preferences is discussed from different perspectives. Section 4 presents the applied methodology and used data. Section 5 concentrates on the verification of the results. Finally, Section 6 focuses on the comparison and discussion of the results.

2. Property Features’ Significance in Property Valuation Procedures

Property valuation is one of the current state-of-the-art research areas that concentrates on the in-depth analysis of property attributes’ significance since the analysis constitutes an obligatory stage of every valuation report’s preparation based on a comparative approach [15,16,17,18]. Through this approach, the market value of the property is determined, which is understood internationally as the “estimated amount for which an asset or liability should exchange on the valuation date between a willing buyer and a willing seller in an arm’s length transaction, after proper marketing and where the parties had each acted knowledgeably, prudently and without compulsion” [16]. According to this interpretation, it is assumed that the value of real estate determined through the comparative approach corresponds to the prices obtained for similar real estate traded on the market and adjusted due to the differences between this real estate’s attributes and changes in price levels due to the passage of time. In practice, the strength of the impact of market features on differences in transaction prices and the scale of the assessment of a given feature can be determined depending on certain conditions [19,20], especially taking into account the following:
  • The results of the analysis of data on prices and market characteristics of similar properties traded on the real estate market specified for valuation purposes;
  • Comparison to local markets that are similar in terms of type and area;
  • Research and/or observation of the preferences of potential real estate buyers.
This list of methods is not exhaustive. Other solutions can also be used as long as their use is justified in an appropriate way.
The variety of properties accepted for analysis or the insufficient amount of data often does not allow for the classic determination of the percentage weights of the impact of individual features on the value of real estate based on the analysis of data regarding prices and features [21,22]. The weight shares should then be determined based on a survey of the preferences of potential buyers. This involves conducting market interviews among real estate agents, experienced property appraisers, and potential real estate buyers.
Heterogeneous goods, such as residential real estate, have a number of built-in features and, as a commodity, constitute a set of them. When selecting methods and inference procedures to analyze the significance of real estate features, one should take into account the specificity of the subject of research and possible difficulties arising from this specificity, including, amongst others, the following [23]:
  • Significant differences in the amount of information available depending on the type of market analyzed;
  • Ambiguous and imprecise assumptions and principles behind appropriate methods for analyzing the significance of real estate features (e.g., differences in the scale of the description of real estate features, description of real estate features being fully dependent on the expert performing the analysis);
  • Lack of comprehensive (full) information;
  • Imprecise nature of real estate data;
  • Lack of uniform functional dependencies between the features of a property;
  • Non-linear nature of real estate data.

3. Significance of Real Estate Features and Buyers’ Preferences

Real estate market analyses often assume that when making decisions, buyers are guided by a rational (from an economic point of view) choice. The main problem in this approach lies largely in the assumption of market entities having uniform behavior [24], uniform access to information, equal will to process information, and the exclusion of any individual conditions. Being human, however, is not being completely manipulated by information [25]. In the thinking process, a person independently processes their knowledge about the external world and their actions. Additionally, developments in the field of psychology provide us with the knowledge that internal information, i.e., experience, knowledge from the past, and satisfaction with previously made decisions, often influences the way a decision-maker perceives external information, the availability of which varies depending on the market being analyzed. Preferences, in general, refer to a specific phenomenon and guide human decisions [26]. A person’s relationship with the surrounding world is a system of preferences towards objects, goods, people, phenomena, goals, etc.
Classical decision theories largely assume “preference completeness”, i.e., a clear attitude of the decision-maker towards individual alternatives. When determining preferences, the decision-maker should be able to compare at least two objects, i.e., have a specific view of them, called a complete relationship. However, the decision-making process may require the decision-maker to make a choice in a situation in which they not only do not have complete information about a specific phenomenon but also do not have knowledge about their preferences towards it. When making decisions, they may face the dilemma “I don’t know whether I consider the assessed object to be better, worse, or as good as the object with which I compare it.” In such a situation, we are dealing with an incomplete relationship [26]. Perhaps as decision-makers gain more experience and knowledge, these preferences will change, but in many situations, unspecified preferences may be sufficient to guide a person’s actions. As analyses of decision-making processes have shown, decision-makers strive to satisfy their goals—they are guided by motivations, expectations, and needs that influence their preferences.
Following Kahneman’s train of thought [27], inconsistency is inherent to the specificity of humans—evolutionarily shaped in such a way that they only store in memory a representation of feelings related to particular experiences. When making decisions based largely on their own experiences, the decision-maker is never sure whether the choices made will be consistent with their interests. In order to objectify preferences, the decision-maker should analyze their own needs and desires in relation to the analyzed objects and phenomena. The individuality of all human beings means that although need results from the significance of their nature and, in a general sense, is the same for all, in a specific sense, it differs from person to person. What is a need for one person may be a want for another, and some people do not want what others consider necessary in the same circumstances. There are even cases when a given thing satisfies a need and a want at the same time. Moreover, the needs and desires of each person change with age, external conditions, financial conditions, fashion, etc. Needs result from the specificity of human existence, and, in the modern world, they are a superior issue, which, however, eludes formal recognition.
Due to the fact that in everyday life a person makes decisions in response to their needs and desires, they can be considered components of that person’s preferences. People’s preferences constitute one dimension of economic life and, therefore, the real estate market; attempting to identify them and take them into account in analyses currently seems to be a significant challenge and represents an opportunity to further develop real estate market analyses. Before a buyer decides to purchase a property, they must conduct a decision-making process based on their own judgments about the importance of the property’s particular features [28,29]. The decision-maker must determine what criteria to use in evaluating the alternatives in the set to make a final choice. Some criteria are more important than others, and these property features will have a greater impact on the decision-maker’s final choice [30]. The aim of the decision-making process is to select the most advantageous object based on individual judgments about the value of individual features.
The preferences of potential real estate buyers are one of the factors determining demand in the real estate market [2,31]; therefore, they are considered to be the most reliable source of information about the importance of real estate features. Strączkowski [32] emphasizes that due to the fact that the modern real estate market places high demands on its participants, it is necessary to conduct research on buyers’ preferences in both theoretical and practical dimensions.
The results of potential buyers’ preferences analysis may provide valuable information, but they do not directly indicate the importance of the property’s features. Determining preferences may involve indicating one alternative and rejecting the others, but preferences may also be divided into a set of analyzed alternatives. In such a case, a numerical representation of preferences is used, which, by assigning appropriate numbers to individual variants (e.g., percentages, monetary amounts, etc.) reflecting the decision-maker’s preferences, allows a relationships to be built between objects, numerical analyses to be conducted, and the results to be implemented in computational models. A problem arises in determining preferences when the set of analyzed variants concerns a complex, multi-threaded problem. Additionally, in many cases, there is no clear explanation of what the numerical values assigned to individual alternatives are [26].
In the case of examining preferences for entities in the real estate market, the perception of individual numerical values corresponding to the significance of real estate features may be different for each respondent due to the lack of a clear and uniform interpretation. The approach to analysis based on a closed set of solutions in researching the preferences of potential buyers may cause a distortion of real preferences and an unconscious shift in attention from the preferred solution—which is not available in the set—to solutions that are available in the set but much less preferred in the comparative analysis. Therefore, this research aimed to propose an approach to collecting information about preferences for entities in the real estate market in relation to housing needs, which constitute a basis for obtaining knowledge about the importance of real estate features in the decision-making process.

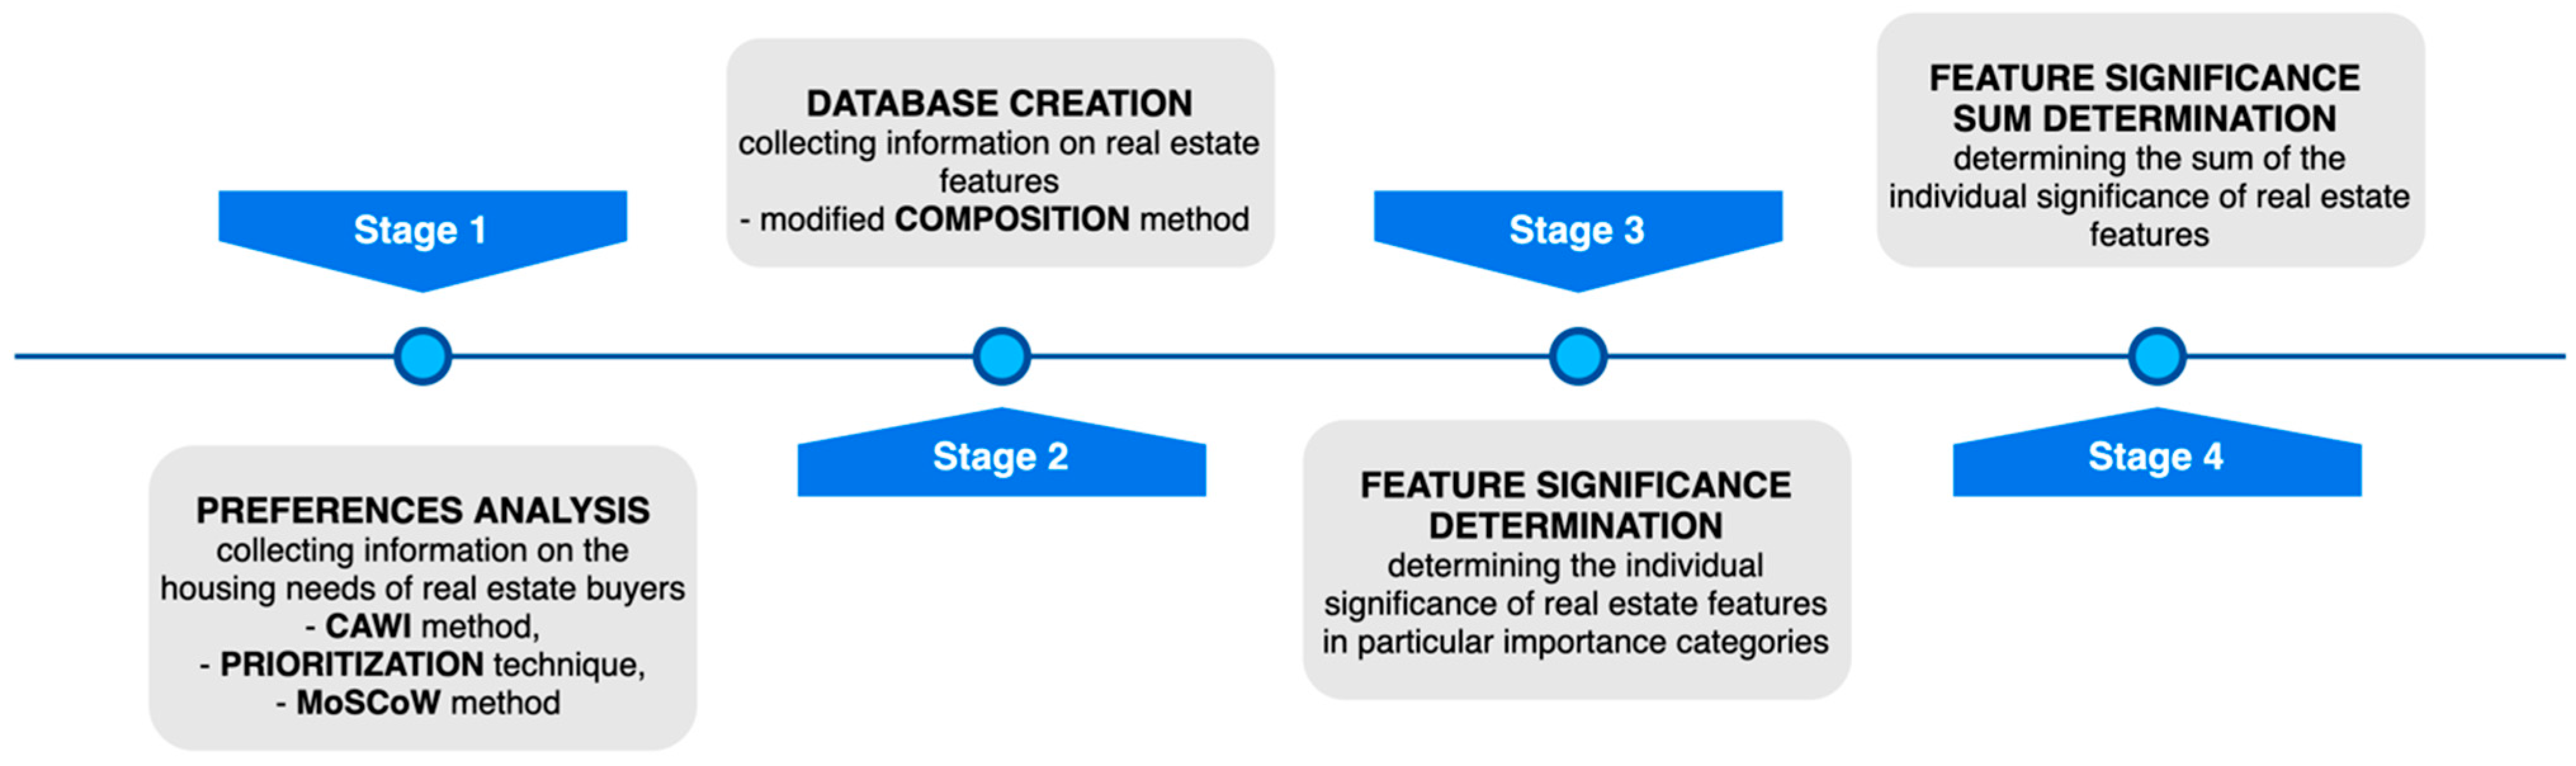
4. Methodology and Data

One of the stages of almost every analysis is the stage of collecting and appropriately processing adequate information describing the phenomenon under study. Adequate information collected and prepared for further processing constitutes the basis for obtaining full, detailed conclusions that reflect the analyzed part of reality. The diagram below presents the procedure for analyzing information collected from potential buyers in the real estate market (Scheme 1).

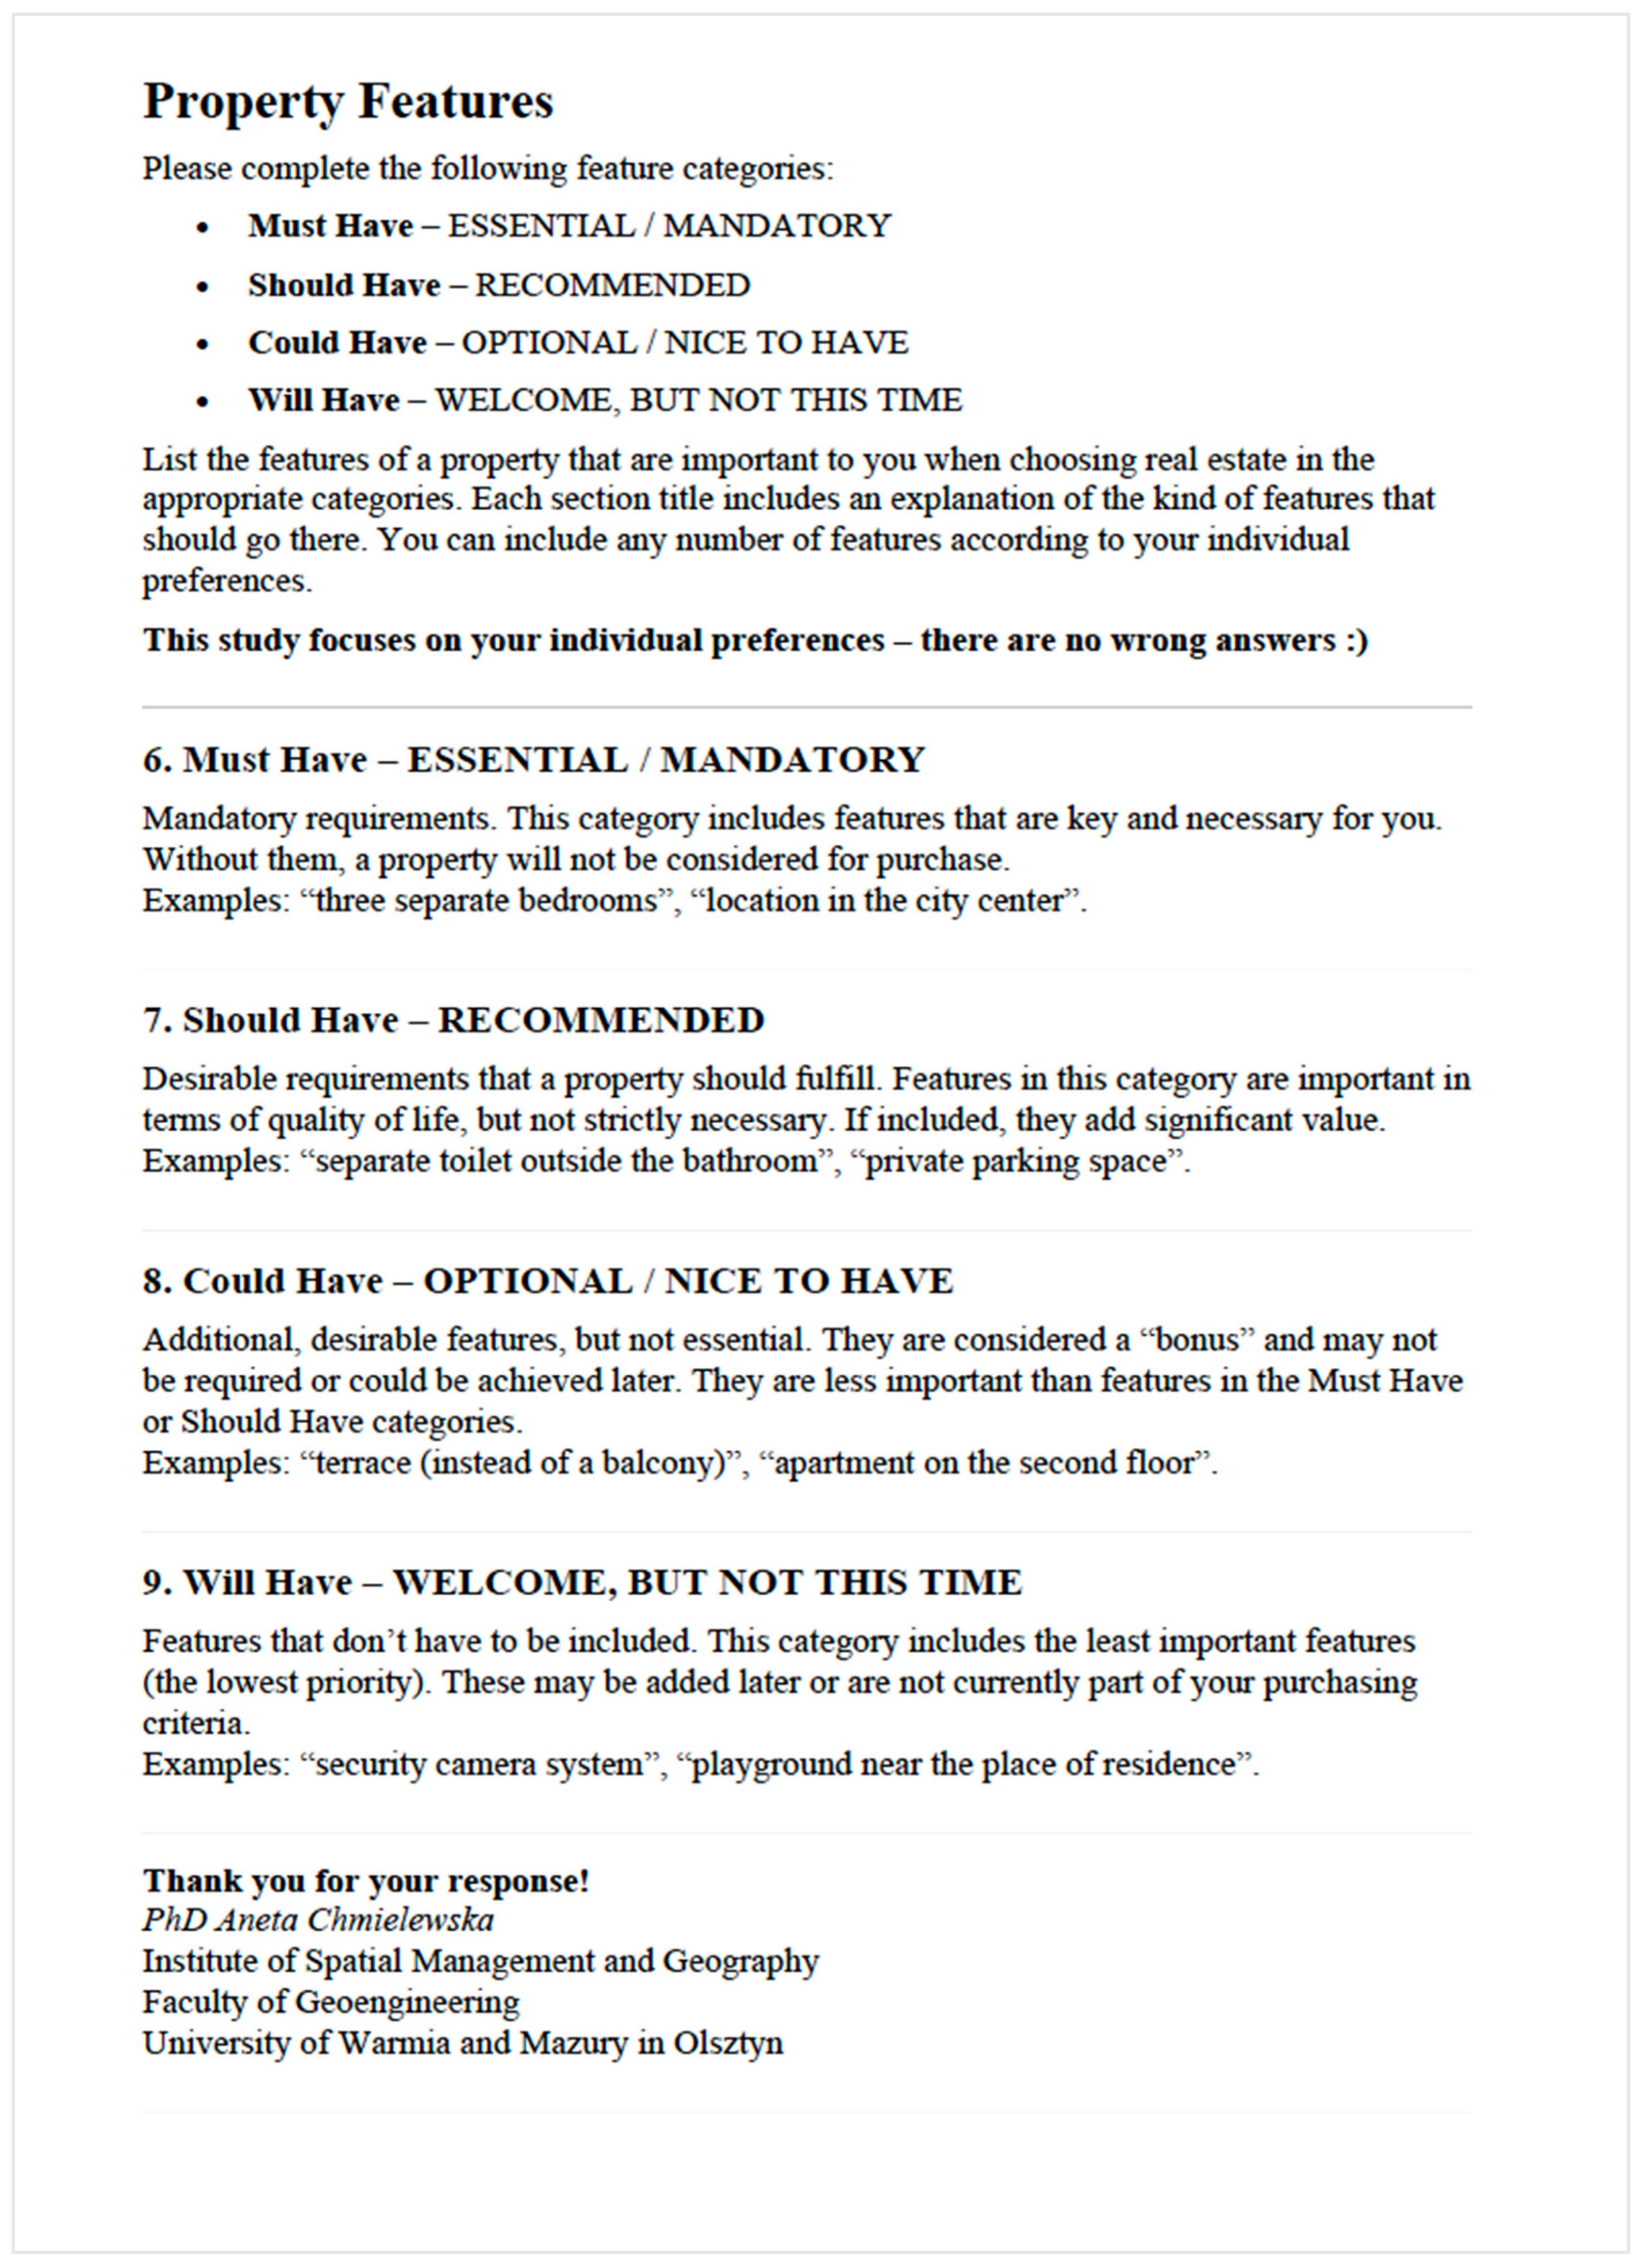
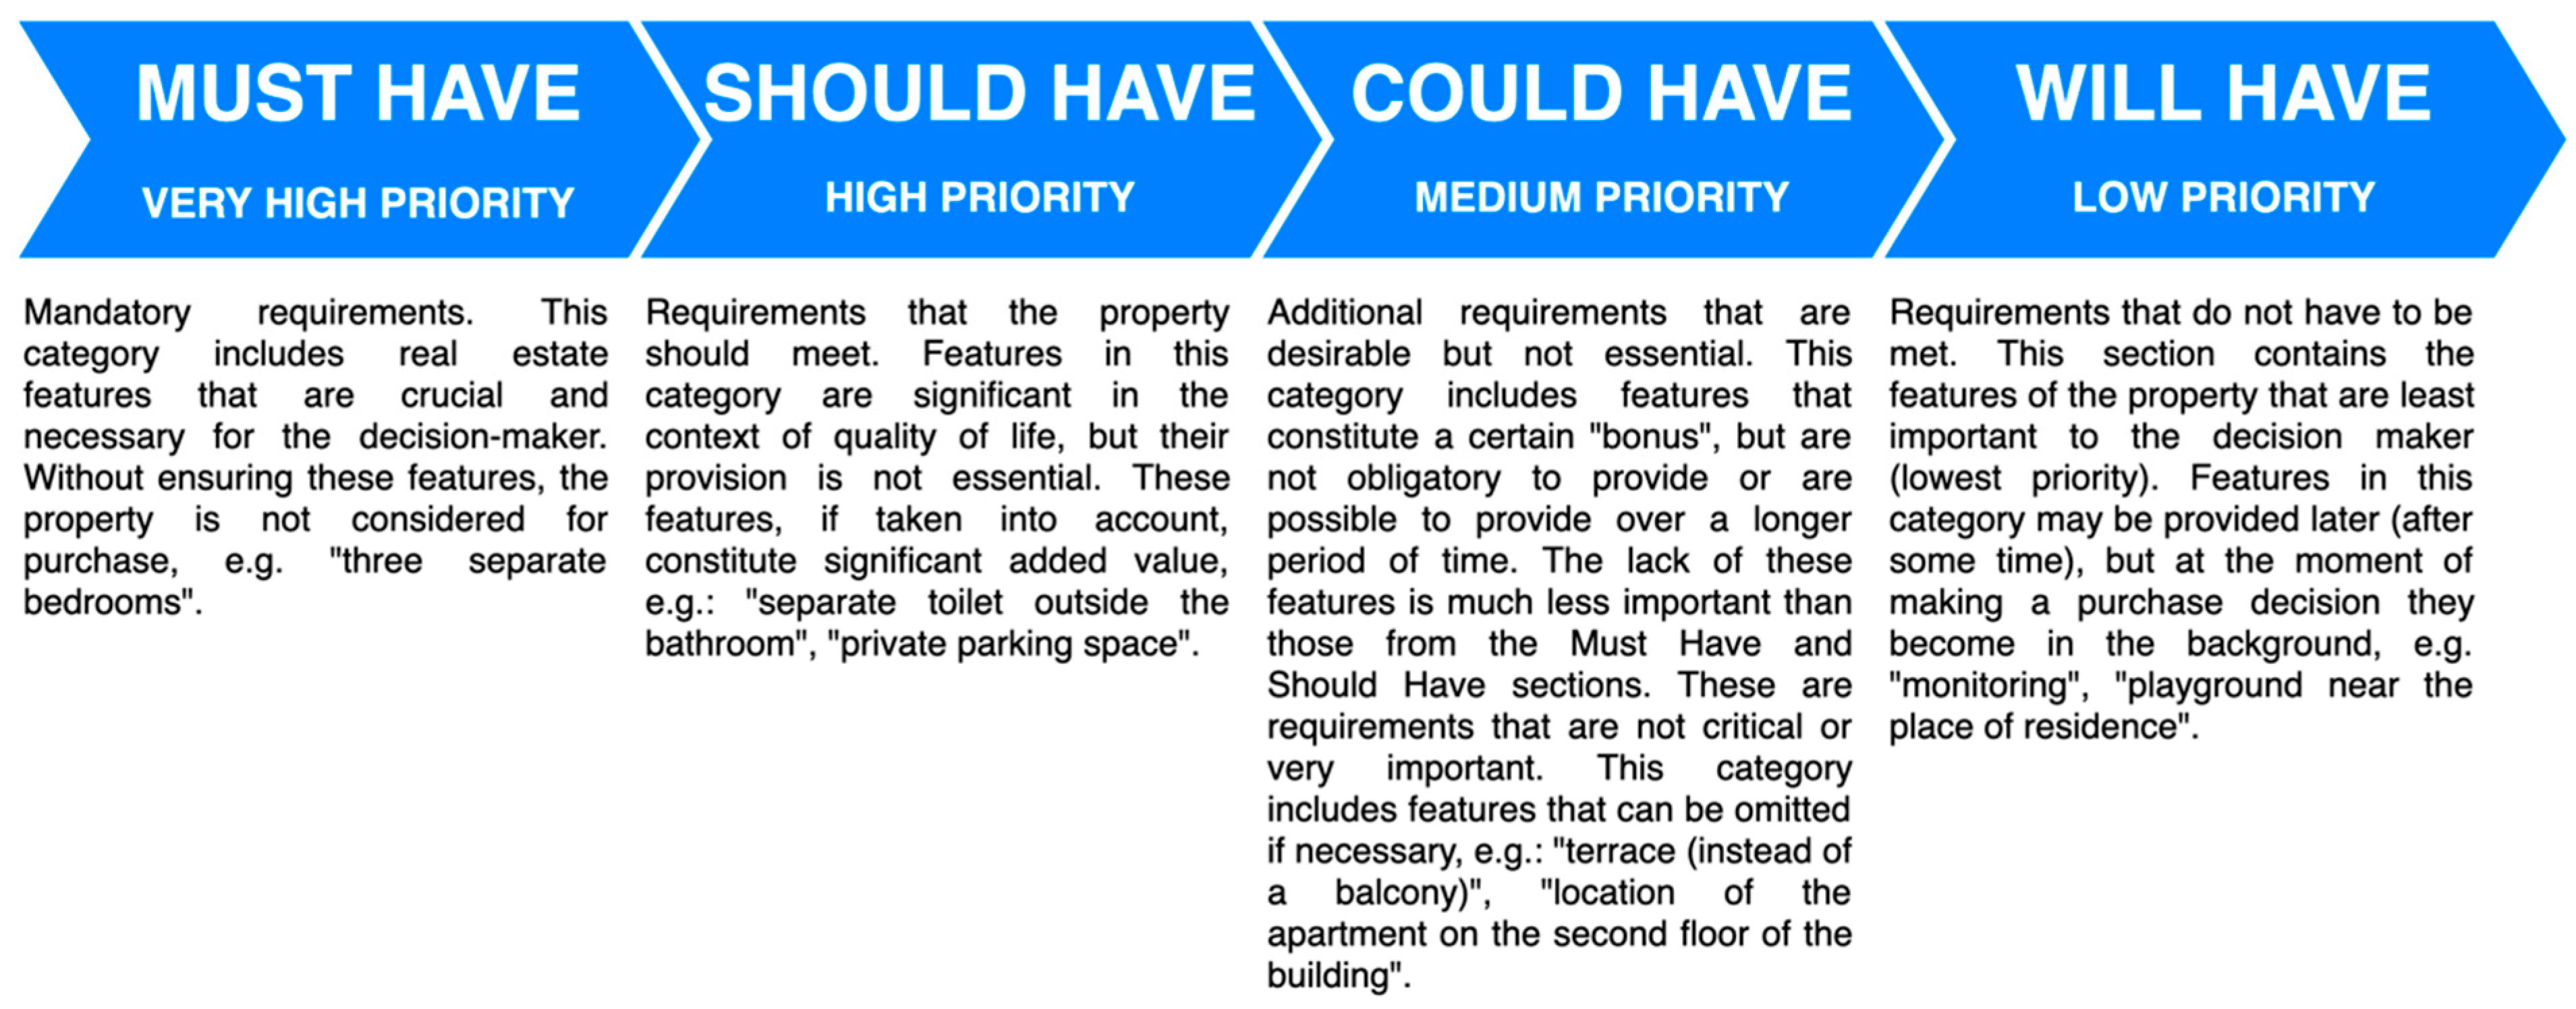
4.1. Prioritization Technique Implementation in Real Estate Buyers’ Preferences

In order to build a reliable and realistic analytical model for assessing the significance of real estate features, it is necessary to obtain appropriate knowledge from entities that shape this market. The research stage consisting of collecting information about preferences for entities in the real estate market for further processing involved conducting an online CAWI (Computer-Assisted Web Interview) study based on an original scenario inspired by the assumptions of individual in-depth interviews using the prioritization technique. The approach used to research entities in the real estate market was based on the assumptions of the MoSCoW method.
The CAWI study involved conducting indirect research on a selected group of potential property buyers in order to identify their preferences for real estate features. The questionnaire was designed in a way that allowed the respondent to express themself freely and without any constraints. The open questions included in the questionnaire were formulated in a way that allowed for comprehensive answers. The adopted form of the questionnaire allowed for obtaining multidimensional (based on four categories of importance) opinions about entities on the real estate market, relating directly to their individual housing needs, which directly affect the phenomenon of the importance of real estate features. A prioritization technique represented by the MoSCoW method was used to build the CAWI questionnaire, the name of which is an acronym of individual priority categories, i.e., Must Have, Should Have, Could Have, and Will Have. The MoSCoW method was created by software specialist Dai Clegg [33], and initially, it was a platform for managing tasks in projects with a specific implementation time [34,35].
The CAWI questionnaire (Appendix B: Figure A1 and Figure A2) was prepared in such a way as to enable the respondent to thoroughly analyze their own needs and desires in relation to the features of a property. The study, in accordance with the assumptions of the MoSCoW method, adopted four categories for the importance of real estate features corresponding to individual priorities (Scheme 2). The individual importance categories used in this study were intended to reflect the different degrees of importance assigned to features by decision-makers in the real estate market. The questionnaire was based on the assumption of integrating the analysis of the respondent’s needs via prioritization techniques.
The objective of this study was to assign the individual housing needs of each respondent to a category corresponding to the priority level. The adopted CAWI qualification structure differs from the classically used scaling; it ranks real estate features in favor of their categorization according to separate criteria with specific regulations and discusses the properties as a whole—a set of features. The use of this type of structure distinguishes the individual features of properties through their categorization, making it possible to isolate the main priorities determining the selection of separate properties in the decision-making process.
At this stage of the research, appropriately selected tools allowed the respondents to make an unlimited (on the part of the person conducting the research) selection of real estate features that, for individual reasons, were a priority in their decision-making process regarding the real estate market. Additionally, this study was constructed in a way that encouraged the respondents to conduct an integral analysis of the co-occurring features of the property.

4.2. Scope of Research

The structured methodological framework required an experimental approach, resulting in empirical research focused on a selected case study area. In order to carry out the analysis with due care and detail, the research was limited to urban and suburban areas of Olsztyn, one of the largest cities in northeast Poland, within the Warmia and Mazury Voivodeship. According to the authors, this case study area was suitable for research because the residential property market there is mature and well-established, with over 1000 free market transactions in 2023, and features a high demand-to-supply ratio. The choice of the research area was dictated by the specifics of the city of Olsztyn and its surroundings, as well as the availability of reliable information. Olsztyn is the capital of the Warmia–Masuria Voivodeship, with a population of approximately 170,000 people. It is rich in all the infrastructure characteristic of such centers. Additionally, Olsztyn stands out among other voivodeship cities due to its unique natural features, and it serves as the main economic, educational, and cultural center of the region with significant development potential. The real estate market in Olsztyn County is characterized by a growing number of transactions, increasing interest from buyers, and a rising trend in property values. Due to its diverse nature, the area selected for analysis provided a reliable source of information and a reference point with representative characteristics for studying decision-makers’ preferences in the real estate market. A total of 196 respondents participated in the research, comprising 102 women and 94 men. The choice of the research group was determined by the respondents’ involvement in making decisions on the real estate market. The study was conducted between April 2021 and January 2022.
The structure of the anonymous CAWI questionnaire consisted of fields allowing for the respondent’s free expression on individual housing preferences (in terms of housing premises) in four categories of importance for real estate features corresponding to the adopted priority levels. For security reasons, the protection of personal data, and convenience and comfort in providing responses, the survey was conducted using the Google Forms tool. The duration of individual interviews depended on the individual needs of the respondents. Some records had to be removed from the database, composed of 120 submitted questionnaires, due to empty or incomplete answers. Ultimately, the size of the research sample was 98 respondents (51 women, 47 men) aged 35–45. All respondents were asked to indicate their individual housing needs by assigning them in writing to the appropriate category of importance—according to their own assessment. The unique set of information collected was analyzed in detail and processed in order to build a database of real estate features in a form suitable for further numerical processing and statistical analysis. The specificity of the proposed study stood out from traditional forms of survey questionnaires in that the number of responses obtained in relation to individual housing needs was completely dependent on the individual preferences of the respondents; therefore, the size and structure of the resulting database were difficult to predict at the research stage. Individual categories of importance could contain an unlimited number of responses for each respondent; therefore, each questionnaire required a separate, in-depth analysis. A preliminary analysis of the received questionnaires allowed for the selection of a total of 318 responses (Must Have—132 responses; Should Have—82 responses; Could Have—56 responses; Will Have—48 responses).
The adopted solution allowed for a detailed analysis of the preferences of the selected research sample in relation to the local real estate market. If the analysis aims to determine individual preferences for entities in the real estate market, each respondent, and therefore their preferences, is treated as a separate point in the research space. The next stages of the research consisted of the analysis of individual answers and their unification into the form of names of real estate features.

4.3. Modified Compositional Method of Preference Analysis

At this stage, information about individual housing needs was unified into names of property features for their objective interpretation (e.g., ‘three separate rooms = the number of rooms’, ‘gas network = utilities/utility’, ‘furnished house = equipment’, ‘no tall buildings around = building height’). Due to the lack of applicable standards regarding the names of features and their definitions, the names of real estate features were used for the analysis, which accurately reflected the nature of the preference indicated for the entity, by adopting appropriately expressed “raw data”. The main goal at this stage was to minimize the risk of generalization/aggregation of the respondents’ answers by categorizing them into the names of real estate features, constituting an inadequate generalized representation. Consequently, in the process of analyzing the questionnaires, information was obtained for a total of 72 detailed features of residential properties, which were indicated by the respondents as important in the decision-making process on the real estate market.
The type of preferential choice data is characterized by the multidimensionality of preference scaling and refers to differences between individual features of an object. The analysis of this type of data can be performed using compositional methods, which involve an independent, weighted assessment of the property’s features based on adopted scales. In the classic compositional approach, the total utility of the multidimensional profile of the examined object is determined by, among others, adopted weights for the individual features of a facility. The weights are intended to emphasize the individual importance of features for people participating in the study [36,37]. The main advantage of using an approach based on compositional methods is the fact that they are less complicated in the data collection phase, which is particularly important when the modeling process concerns many features of objects and their levels. The modification of the analytical procedure in compositional methods used at this stage of the research consisted in determining the weight not for individual features of the object, as assumed in the classical solution, but for the adopted categories of importance corresponding to individual priorities, i.e., Must.; Have—4; Should Have—3; Could Have—2; Will Have—1. This approach enabled the identification of the general structure of preferences for entities on the real estate market based on the assessment of individual housing needs, appropriately processed in the form of names of real estate features.
The structure of the database was based on a 98 × 72 matrix, where the number of rows corresponded to the number of respondents and the number of columns corresponded to the total number of features selected at the stage of the preliminary analysis of the questionnaires. In accordance with the assumptions of the proposed modified compositional approach, individual importance categories were assigned weights to determine their importance in the decision-making process. As a result, the matrix elements constituted values corresponding to the importance categories to which the property features were assigned by the respondents:
  • 0—meaning the absence of a given feature in the respondent’s questionnaire;
  • 1—meaning the occurrence of a feature in the respondent’s questionnaire in the Will Have category, corresponding to the lowest priority;
  • 2—meaning the occurrence of a feature in the respondent’s questionnaire in the Could Have category, corresponding to medium priority;
  • 3—meaning the occurrence of a feature in the respondent’s questionnaire in the Should Have category, corresponding to high priority;
  • 4—meaning the presence of a feature in the respondent’s questionnaire in the Must Have category, corresponding to a very high priority.
The implemented method for presenting the occurrence of individual features in the matrix allowed for maintaining the nature of the relationship of the dominance of individual categories of real estate features. Table 1 shows a fragment of the developed database.
The proposed database structure made it possible to reflect the number of occurrences of appropriate property features in particular categories of importance. The method of assigning numerical values to qualitative information in an appropriately unified way minimized the risk loosing information and repeating errors regarding the incorrect interpretation of information, and it also allowed the real nature of the expressed preferences of the respondents regarding the features of the property to be maintained.

4.4. Individual Significance of Real Estate Features

Determining the significance of real estate features in decision-making processes in the real estate market is a complex issue and can be considered from many points of view. Coherent analyses in this area require a broader look at the phenomenon under study and an attempt to reflect the significance of real estate features in accordance with the scope of how they are perceived by decision-makers on the real estate market. The individual significance of real estate features was determined based on the number of times they appeared in the questionnaires and the weights for individual significance categories adopted according to the modified compositional method (Must Have, Should Have, Could Have, Will Have). The number of occurrences is understood in this case as the sum of occurrences (responses) of a given property feature in all analyzed questionnaires, divided into individual categories of significance. Table 2 presents a fragment of the table showing the number of property features in the discussed significance categories. The entire table is presented in Appendix A: Table A1.
The number of features indicates the general interest in real estate market entities in the decision-making process on the real estate market.
In the next step of the analysis, the weights adopted in accordance with the assumptions of the modified composition method were taken into account. The determined weight values were used to intensify the number of occurrences of features in individual significance categories. This solution allowed for determining the individual significance of real estate features (Table 3); however, unlike in classically used methods, the significance value was determined assuming the multidimensionality of the phenomenon. The entire table of individual significance is presented in Appendix A: Table A2.
The analyses showed that in the Must Have category, i.e., the category of key and necessary features at the stage of deciding to purchase real estate, according to the respondents, among the features with the highest values of individual importance were the number of rooms, room layout, access to communication, floor, a basement, a balcony, and a quiet neighborhood. As for real estate features that significantly affect quality of life but are not essential (Should Have), the highest in the ranking were access to parking spaces, room layout, floor, a balcony, an elevator, and a private parking space. According to the respondents, additional requirements that are desirable but not necessary in the decision-making process (Could Have) are best met by the following property features: multiple storeys, a balcony, a terrace, a good distance from commercial establishments, access to parking spaces, a basement, access to recreational areas, a private parking space, and access to greenery. The property features with the highest individual importance in the least important category include a garage, a playground, and a good distance from commercial establishments.
The conducted analysis indicates that due to the multidimensionality of property features’ significance stemming from individual preferences for entities in the real estate market, specific property characteristics can simultaneously exist in multiple categories of importance (due to diverse individual preferences for entities in the real estate market).

5. Verification of the Results

In order to verify the validity and effectiveness of the proposed prioritization technique, an alternative analytical approach was applied—conjoint analysis, a widely recognized method for assessing consumer preferences. The objective of this verification was to confirm the consistency of the results obtained through the MoSCoW prioritization technique with the experimentally simulated decision-making behavior of potential property buyers. Conjoint analysis is a decompositional technique that allows for the evaluation of individual feature importance based on how respondents assess the overall attractiveness of various combinations of features. Unlike direct questioning techniques, conjoint analysis captures trade-offs that respondents are willing to make among different property attributes, which makes it a robust tool for modeling actual decision-making processes in the real estate market.
The use of conjoint analysis in this study is grounded in established models of consumer theory. Following Lancaster’s approach [38], we assume that utility is derived not from goods per se, but from their attributes. In the context of housing, this means that buyers assess combinations of features such as location, floor area, or access to services—each contributing to overall satisfaction. Conjoint analysis allows us to simulate trade-offs between these features and infer the relative importance (or marginal utility) of each.
Furthermore, by placing respondents in forced-choice scenarios, the method enables us to observe revealed preferences in the Samuelsonian sense [39], where actual choices under constraints are treated as expressions of underlying utility functions. This theoretical foundation justifies our interpretation of the conjoint results as reflecting behavioral (rather than merely declarative) priorities.

Methodological Framework

The verification process was structured as follows:
  • The selection of features and their levels: In the first step, it was necessary to determine the total value of the individual significance of the features selected in the process of analyzing the MoSCoW questionnaires in order to determine the features with the highest total significance. The threshold of significance, including both the diversity within the Must/Should/Could/Will Have categories and weighted individual significances, was assumed at the level of 20, leaving 15 property features to be included in further analysis—Table 4. The values for all features selected at the stage of questionnaire analysis are presented in Appendix A: Table A3.
Based on the results of the MoSCoW prioritization, seven key attributes commonly affecting residential property preferences were selected. The number of attributes were selected on the basis of maximum efficiency in relation to the number of features that a person can consider when making a decision. According Ries and Trout [40], there are no more than seven attributes. The objective of this study is to determine the significance of attributes; thus, the number of features should not exceed seven. Each feature was assigned three example attribute values that most frequently appear in the analyzed market (Table 5).
2.
The construction of property profiles: In order to verify the obtained results, using an orthogonal design approach, a total of 14 distinct profiles (from the full set of possible combinations: 37 = 2187) were created by combining different levels of the above features. Each profile represented a hypothetical property that could be realistically encountered in the local market (Table 6).
3.
Survey and data collection: Respondents were asked to evaluate the attractiveness of each property profile on a standardized 10-point Likert scale (1 = very unattractive; 10 = very attractive). The distribution of responses for each property profile is presented in Table 7.
The results demonstrate noticeable differences in the perceived attractiveness among the profiles. Profiles 7, 9, and 10 achieved the highest average ratings, with values of 7.25, 8.17, and 7.00, respectively. These profiles were characterized by features such as a large balcony, good or excellent access to communication, and the availability of private or public parking spaces. Particularly, Profile 9, which achieved the highest average score (8.17), combined a large balcony, private parking, and moderate access to communication. In contrast, Profiles 4, 11, and 13 received the lowest average ratings, at 3.50, 2.92, and 3.50, respectively. These profiles typically lacked desirable attributes such as a large balcony or good access to communication and were often associated with unfavorable layouts or the absence of basement facilities. Profile 11, rated the lowest, was notably characterized by poor access to communication and the absence of both a balcony and a basement. A closer inspection of the response distribution indicates that higher-rated profiles accumulated a significant proportion of scores in the upper range (7–10), whereas lower-rated profiles were more frequently rated in the bottom half of the scale (1–5). For example, Profile 7 had over 70% of its ratings at 7 or above, while Profile 11 had over 70% of responses at 1–4. These findings reflect clear preferences among respondents, favoring properties offering enhanced outdoor space, convenient transport connections, and parking accessibility. The results also suggest that a lack of key amenities, such as balconies, good communication, and storage areas, substantially reduces the perceived attractiveness of residential units.
4.
Data transformation and analysis: The categorical features were converted into numerical variables using one-hot encoding. A linear regression model (OLS) was then fitted to the average ratings to estimate the relative contribution (partworth utilities) of each attribute level. The results of the linear regression analysis are presented in Table 8. The estimated partworth coefficients indicate the relative contribution of each attribute level to the attractiveness ratings assigned by respondents.
The most influential positive factors were the presence of private parking spaces (+2.22), public parking spaces (+2.10), and a private basement (+1.43). These features substantially increased the perceived attractiveness of the property profiles. Additionally, a layout with separate rooms (+1.39) and moderate access to communication infrastructure (+0.62) were positively valued by respondents. An open layout of rooms (+0.54) and a higher number of rooms (+0.44) also had a positive, albeit smaller, impact on attractiveness. Conversely, the absence of a balcony (−2.50) and the presence of only a small balcony (−0.92) were strongly associated with a decrease in perceived attractiveness. Poor access to communication (−0.73) and unfavorable floor levels, such as ground floor (−0.54) or third floor and above (−0.36), also contributed negatively to the attractiveness of the profiles. The linear regression model showed a high explanatory power, with R2 = 0.885 and adjusted R2 = 0.879. All predictors were tested for multicollinearity using the Variance Inflation Factor (VIF), with results ranging between 1.03 and 1.09, indicating no concerning collinearity. The Breusch–Pagan test yielded a p-value of 0.654, confirming the absence of heteroskedasticity in the residuals. These diagnostics support the statistical robustness of the model.
The relative importance of each feature, calculated based on the range of partworth utilities, is shown in Table 9.
The presence and size of a balcony emerged as the most critical factors, accounting for 29.48% of the total importance. Access to communication infrastructure (25.19%) and the availability of a basement (23.88%) also played significant roles in shaping respondents’ preferences. The layout of rooms contributed 15.86% to the overall importance, while the storey location (3.36%) and access to parking (2.24%) had a minor impact. The number of rooms showed no discernible effect (0.00%) on the perceived attractiveness in the conjoint model. These results emphasize that respondents placed the greatest value on features enhancing usability and comfort, particularly outdoor amenities and storage solutions. While certain traditional metrics, such as the number of rooms, were declared important in initial prioritization (e.g., via the MoSCoW method), their actual influence on decision-making appears negligible when real trade-offs are considered.
5.
The Interpretation of the results and integration with previous findings: The coefficients from the regression model were interpreted as indicators of marginal utility for each level of property features [41]. Higher coefficients indicate a stronger positive influence on overall perceived attractiveness, while negative values suggest reduced appeal. The analysis of the conjoint study revealed that the most influential features determining the perceived attractiveness of residential properties were the presence and type of balcony (29.5%), the quality of access to communication infrastructure (25.2%), and the availability of a basement (23.9%). Other factors such as the layout of rooms (15.9%), storey location (3.4%), and parking availability (2.2%) played a comparatively minor role. The number of rooms showed no significant effect in this sample.
The partworth weights obtained via conjoint analysis were compared to the weighted feature scores derived from the MoSCoW matrix (Table 10).
This comparative approach enables the triangulation of results and highlights the consistency—or potential inconsistencies—between declared preferences and simulated behavior.
The MoSCoW method revealed that respondents considered the number of rooms, the layout of rooms, and the number of storeys to be the most critical features, with the highest weighted scores. In contrast, the conjoint analysis—which measured actual trade-offs in profile preferences—identified a balcony, access to communication, and a basement as the most influential attributes. Interestingly, both methods demonstrated a convergence in several key areas. The layout of rooms was ranked as highly important in both approaches, reflecting its fundamental role in functional housing design. Although the balcony was placed fourth in the MoSCoW ranking, it turned out to be the most impactful feature in the conjoint analysis, highlighting a strong alignment between declared and revealed preferences. The basement feature, while underestimated in the MoSCoW method, also emerged in both approaches as increasingly relevant in purchasing decisions. The number of rooms, which was ranked the most highly in the MoSCoW prioritization, had a negligible effect in the conjoint model. This discrepancy suggests that while users perceive certain features as essential in theory, their actual influence on decision-making may differ when real trade-offs are considered. Similarly, the importance of access to communication infrastructure was undervalued in the MoSCoW method but was shown to be a major determinant in the conjoint evaluation.
The observed discrepancy between the high prioritization of room count in the MoSCoW responses and its relatively lower weight in the conjoint model may be partially explained by sociocultural influences. In many Central and Eastern European urban settings, the number of rooms is often perceived as a symbolic indicator of family stability, comfort, and long-term security. This may lead respondents to overstate its importance in declarative settings, even when trade-offs in practice reveal other priorities, such as spatial layout or access to green areas. Conversely, outdoor amenities—such as balconies or green surroundings—may be undervalued in the stated preferences due to their historical underrepresentation in housing stock or a lack of cultural emphasis on outdoor living. These nuances highlight the relevance of combining declarative and behavioral data to capture both cultural aspirations and functional needs.
Where inconsistencies were found, they may be attributed to factors such as hypothetical bias or variation in the individual interpretation of feature relevance. The comparison between the MoSCoW prioritization and the results of the conjoint analysis reveals some discrepancies between declarative preferences and actual impact on property attractiveness. Attributes such as the presence of a balcony and the quality of communication infrastructure were found to have a much stronger influence in the conjoint study than suggested by the MoSCoW ratings. Equally, the number of rooms, although declared as crucial in the MoSCoW method, exhibited no significant impact on attractiveness in the conjoint analysis. These results highlight the necessity of supplementing declarative methods with empirical techniques like conjoint analysis to obtain a more accurate and realistic understanding of buyer preferences in property development planning.
The use of conjoint analysis in this context provides a rigorous experimental validation of preference structures inferred from declarative data (MoSCoW categorization). While the MoSCoW technique captures subjective priority levels as perceived by buyers, the conjoint analysis reveals how these priorities manifest in behavioral choices when trade-offs between features are required.

6. Discussion

The objective of this study was to assign the individual housing needs of a respondent to a category corresponding to the priority level. The adopted CAWI qualification structure differs from classically used scaling; it ranks real estate features in favor of their categorization according to separate criteria with specific regulations and discusses properties as a whole—a set of features. The use of this type of structure distinguishes the individual features of properties through their categorization, making it possible to isolate the main priorities determining the selection of separate properties in the decision-making process. At this stage of the research, appropriately selected tools allowed the respondents to make an unlimited (on the part of the person conducting the research) selection of real estate features that, for individual reasons, are a priority in the decision-making process for the real estate market. Additionally, this study was constructed in a way that encouraged the respondent to conduct an integral analysis of the co-occurring features of a property. The solutions adopted at the stage of the analysis of the questionnaires assumed the minimization of interference in the structure of the answers, thanks to which the obtained property features could appear to be partially identical (according to commonly used assumptions for describing property features). In practice, however, the actual preferences for entities in the real estate market are the result of individual perceptions, which may differ from established general assumptions. As a consequence, the analysis of the actual preferences for entities in the real estate market may provide new knowledge about the relationships between real estate features in individual decision-making processes. The idea behind the proposed method was to move away from the assumptions of mass analysis in favor of a special focus on the individual responses of respondents in order to indicate the profile of buyers’ preferences specific to the market under study.
While the sample size of 98 respondents may be considered limited from a traditional statistical perspective, it was deliberately used to ensure that all participants met two key criteria: (1) being in the demographically active age range of 30–45 years and (2) having prior experience with purchasing or renting residential property. These conditions ensured that responses were grounded in real decision-making experience, which is particularly valuable in a study focusing on preference formation. The aim of the study was not to produce generalizable findings for the entire population but to explore decision patterns and value structures within a demographically and behaviorally relevant subgroup. We acknowledge this limitation and recommend caution in extrapolating the findings beyond similar urban contexts and respondent profiles.
The problem of analytically assessing the impact of real estate features results from the difficulty of capturing the nature of their perception by real estate market entities in an appropriately defined and quantified form. Each person making decisions on the real estate market has their own idea of the degree of importance of the individual features of the analyzed object—real estate—which determines their individual preferences.
The prioritization technique is important in the decision-making process because its skillful use can determine the success or failure of the assumed decision-making goal. Priorities indicate which tasks should be implemented first and which can be postponed to a later date. The application of the MoSCoW method, in comparison to other known methods of property feature analysis, takes a relatively long time, for example, due to the fact that it allows for a relatively large amount of information on housing needs to be analyzed. The answers obtained, in their rough form, require unification into the names of real estate characteristics, so expert knowledge of the real estate market is necessary in this case. The MoSCoW method, due to its simple and understandable structure, shows great usefulness in real estate market research, where the problem requires an assessment of relevance, categorization, or indication of the priority/superiority of one quantity over another.
The MoSCoW method was used as an exploratory tool to collect raw, subjective prioritization data, which allowed respondents to express individualized, unstructured needs without being constrained by predefined options. This stage captured the richness of lived preferences and offered an open-ended, qualitative insight into what buyers believe they value.
To validate these findings, we applied conjoint analysis to simulate realistic decision-making scenarios and quantify the actual impact of features when trade-offs are introduced. The convergence of the results—e.g., the importance of a balcony, the layout, and access to communication—demonstrates consistency between the subjective categorization and the revealed behavior. However, discrepancies—such as the overvaluation of the number of rooms in the MoSCoW categorization—highlighted the distinction between perceived and behavioral importance. This divergence is not a methodological flaw but rather an expected and analytically valuable phenomenon that reflects the cognitive gap between declarative judgment and situational choice.
Thus, rather than conflicting, the two methods provide complementary lenses: The MoSCoW method offers a nuanced mapping of internal priorities, while the conjoint analysis imposes a decision-theoretic structure that tests the stability of these priorities under constrained conditions. Together, they reinforce the robustness of the findings and offer a more holistic understanding of user preferences.

7. Conclusions

Regardless of the purpose of the analysis, the stage of collecting and appropriately processing information for the further use of statistical tools is crucial for obtaining reliable results and, as a result, for their correct interpretation. However, in numerical analyses, there is a discrepancy between the “richness” of digital data and the real world. Transforming information from the multidimensional and multi-aspect reality surrounding us into numerical data is a significant challenge. Advanced analytical tools in current research methods may provide satisfactory results, but many doubts are raised about the reliability and adequacy of the data describing the phenomenon under study. The analysis of the individual significance of features in terms of isolated categories provides a general picture of the phenomenon in a selected area of the real estate market. In order to fully capture the phenomenon of the significance of real estate features, the subsequent stages of analysis should simultaneously take into account the values for all analyzed categories of importance, providing the multidimensional significance of the features. Research into the potential of the proposed methodology will continue in the future.
Although this study was conducted in the specific context of Olsztyn, the proposed methodological framework is highly adaptable and can be replicated in other urban environments. The modular structure of MoSCoW-based prioritization combined with the conjoint experiment allows for flexible adjustment to local housing conditions, planning challenges, and cultural preferences. Applying the approach in different cities would enable comparative research, revealing both universal patterns and context-dependent variations in residential preferences. Such cross-city applications could enhance the relevance of housing policy and urban development strategies at regional and national scales.
The prioritization of residential property features based on buyer preferences can serve as a strategic input in optimizing land development projects. The results presented in this paper can highlight which housing attributes are perceived as critical by buyers in a given local market. These findings can inform zoning decisions, land use allocation, and infrastructure planning. For example, the high prioritization of access to public transport or green spaces suggests that future developments in urban or suburban areas should integrate mobility and environmental quality as foundational elements of land development strategies. Furthermore, local governments and private developers can integrate buyer preference data into multicriteria decision-making models for site selection, housing density, and utility network planning. The proposed methodology, by capturing nuanced user-centric data, complements traditional top-down approaches to urban planning, contributing to more resilient, market-responsive development patterns. The analytical framework used in this research—based on prioritized buyer needs—can support public planners and private investors in identifying optimal combinations of property features that align with demand-side pressures. Integrating such approaches into the early stages of land development projects can reduce the risk of mismatches between supply and demand, enhance residential satisfaction, and improve the socioeconomic sustainability of new neighborhoods. The findings presented in this study offer relevant insights for practical applications in housing policy and urban planning. By quantifying the relative importance of specific property attributes—such as access to green spaces, layout, or balcony presence—the model provides a preference-based foundation for evaluating the desirability of residential features across buyer profiles. Urban planners may use such insights to simulate the potential impact of planned interventions (e.g., increasing green areas, enhancing public transport connectivity, modifying building typologies) on residential attractiveness and property value.
A potential limitation of the MoSCoW method, as applied in this study, is its reliance on open-ended self-reported responses. While this approach enriches the dataset with respondent-specific prioritizations, it may be subject to social desirability bias—particularly if participants feel compelled to report socially acceptable housing needs rather than authentic personal preferences. This bias can distort the interpretation of what buyers truly value in practice. Future research could benefit from the triangulation of the stated preferences with observational datasets, such as actual property transaction records or behavioral tracking data. Such approaches would allow for a more objective assessment of the revealed preferences and reduce the influence of declarative bias in self-reporting.
The findings emphasize the complementary value of both methods. The MoSCoW method provides an accessible and intuitive tool for initial prioritization, especially during the early planning stages, whereas the conjoint analysis delivers refined, evidence-based insights for more accurate decision-making. Together, they form a robust framework that combines stated needs with actual preferences, supporting developers and urban planners in creating more aligned and market-responsive residential environments. In summary, the research confirms the validity of integrating both declarative and empirical approaches. The overlapping findings reinforce the credibility of the identified priorities, while the differences point to the necessity of multidimensional evaluation when planning housing features. The combined use of MoSCoW and conjoint analysis offers a balanced strategy for optimizing land and housing development.
In comparison to other multicriteria preference methods such as the Analytic Hierarchy Process (AHP) [42] or Discrete Choice Experiments (DCEs) [43], the combined MoSCoW–conjoint approach offers several advantages. The AHP requires respondents to perform complex pairwise comparisons and is sensitive to inconsistency in judgments, which may limit its practicality in large-scale housing surveys. DCEs, while methodologically rigorous, typically involve strictly predefined choice sets, which may restrict the exploration of personalized or emergent preferences. In contrast, the MoSCoW method allows for the free, user-generated prioritization of attributes, while the conjoint component introduces statistical structure and choice realism. This hybrid design enables a more flexible and respondent-driven understanding of preference hierarchies. The structured preference data obtained through the MoSCoW–conjoint pipeline also offers potential applications in the development of Automated Valuation Models (AVMs). By converting qualitative prioritizations into quantifiable feature weights, the model supports more responsive and user-centered valuation approaches. Future AVMs could incorporate these weights to reflect context-sensitive, demand-driven value modifiers, improving both predictive accuracy and transparency in residential property valuation.

Author Contributions

Conceptualization, A.C.; methodology, A.C. and M.W.; software, A.C.; validation, A.C., M.W. and A.S.; formal analysis, A.C.; investigation, A.C. and M.W.; resources, A.C.; data curation, A.C.; writing—original draft preparation, A.C., M.W. and A.S.; writing—review and editing, A.C. and A.S.; visualization, A.C.; supervision, A.C. All authors have read and agreed to the published version of the manuscript.

Funding

This research was funded in whole by NATIONAL SCIENCE CENTRE, POLAND [2025/09/X/HS4/00100]. For the purpose of Open Access, the author has applied a CC-BY public copyright license to any Author Accepted Manuscript (AAM) version arising from this submission. This research was also supported by University of Warmia and Mazury in Olsztyn Rector’s Research Grant.

Institutional Review Board Statement

Not applicable.

Informed Consent Statement

Not applicable.

Data Availability Statement

The original contributions presented in this study are included in the article. Further inquiries can be directed to the corresponding author.

Conflicts of Interest

The authors declare no conflicts of interest.

Appendix A

Table A1. Table of the number of features in individual significance categories.
No.Property FeatureCategory of Importance
Must HaveShould HaveCould HaveWill Have
1fashion1000
2type of market (secondary/primary)2100
3construction type2001
4type of building0100
5storey7470
6exposition2200
7standard0200
8technical condition2100
9age of the property2000
10height of rooms1000
11number of toilets0100
12number of rooms21000
13number of bathrooms2100
14number of kitchens0100
15number of storeys2200
16number of balconies0010
17layout of rooms11500
18basement6032
19garage1318
20larder0100
21wardrobe0310
22terrace1141
23balcony6470
24loggia0011
25storage cell2111
26garden0111
27equipment0002
28lift1412
29waste chute0001
30plot area1000
31area of the apartment3210
32balcony area1320
33size of windows0100
34distance from busy road1200
35distance from place of work1110
36distance from commercial establishments2243
37distance from city center4312
38distance from neighboring buildings1000
39distance from schools and kindergartens1001
40distance from recreational areas 1031
41distance from the lake0001
42distance from public facilities0100
43playground0216
44access1000
45parking spaces0110
46access to communication8111
47access to parking spaces 4840
48underground parking space0100
49private parking spaces2430
50access to urban infrastructure1000
51access to entertainment0002
52access to culture0001
53access to the gym0001
54access to green areas4231
55access to the lake0002
56communication with the workplace2000
57quiet neighborhood5000
58friendly neighborhood1010
59safe neighborhood1100
60attractive neighborhood1001
61Internet2000
62media2100
63type of heating system2110
64developed technical infrastructure0002
65sources of pollution1000
66planning considerations 1000
67regularized legal status 1000
68development intensity1110
69view from the window0300
70gated community0101
71guarded housing estate0001
72smart home infrastructure 0001
Table A2. Table of individual significance of features in particular significance categories.
No.Property FeatureCategory of Importance
Must HaveShould HaveCould HaveWill Have
1fashion4000
2type of market (secondary/primary)8300
3construction type8001
4type of building0300
5storey2812140
6exposition8600
7standard0600
8technical condition8300
9age of the property8000
10height of rooms4000
11number of toilets0300
12number of rooms84000
13number of bathrooms8300
14number of kitchens0300
15number of storeys8600
16number of balconies0020
17layout of rooms441500
18basement24062
19garage4928
20larder0300
21wardrobe0920
22terrace4381
23balcony2412140
24loggia0021
25storage cell8321
26garden0321
27equipment0002
28lift41222
29waste chute0001
30plot area4000
31area of the apartment12620
32balcony area4940
33size of windows0300
34distance from busy road4600
35distance from place of work4320
36distance from commercial establishments8683
37distance from city center16922
38distance from neighboring buildings4000
39distance from schools and kindergartens4001
40distance from recreational areas 4061
41distance from the lake0001
42distance from public facilities0300
43playground0626
44access4000
45parking spaces0320
46access to communication32321
47access to parking spaces 162480
48underground parking space0300
49private parking spaces81260
50access to urban infrastructure4000
51access to entertainment0002
52access to culture0001
53access to the gym0001
54access to green areas16661
55access to the lake0002
56communication with the workplace8000
57quiet neighborhood20000
58friendly neighborhood4020
59safe neighborhood4300
60attractive neighborhood4001
61Internet8000
62media8300
63type of heating system8320
64developed technical infrastructure0002
65sources of pollution4000
66planning considerations 4000
67regularized legal status 4000
68development intensity4320
69view from the window0900
70gated community0301
71guarded housing estate0001
72smart home infrastructure0001
Table A3. Table of individual significance of features in particular significance categories.
No.Property FeatureCategory of ImportanceWeighted Sum
Must HaveShould HaveCould HaveWill Have
1number of rooms8400084
2layout of rooms44150059
3storey281214054
4balcony241214050
5access to parking spaces 16248048
6access to communication3232138
7basement2406232
8distance from city center1692229
9access to green areas1666129
10private parking spaces8126026
11distance from commercial establishments868325
12garage492823
13lift4122220
14area of the apartment1262020
15quiet neighborhood2000020
16balcony area494017
17terrace438116
18exposition860014
19number of storeys860014
20storage cell832114
21playground062614
22type of heating system832013
23type of market (secondary/primary)830011
24technical condition830011
25number of bathroom830011
26wardrobe092011
27distance from recreational areas 406111
28media830011
29distance from busy road460010
30construction type80019
31distance from place of work43209
32development intensity43209
33view from the window09009
34age of the property80008
35communication with the workplace80008
36Internet80008
37safe neighborhood43007
38standard06006
39garden03216
40friendly neighborhood40206
41distance from schools and kindergartens40015
42parking spaces03205
43attractive neighborhood40015
44fashion40004
45height of rooms40004
46plot area40004
47distance from neighboring buildings40004
48access40004
49access to urban infrastructure40004
50sources of pollution40004
51planning considerations 40004
52regularized legal status 40004
53gated community03014
54type of building03003
55number of toilets03003
56number of kitchens03003
57larder03003
58loggia00213
59size of windows03003
60distance from public facilities03003
61underground parking space03003
62number of balconies00202
63equipment00022
64access to entertainment00022
65access to the lake00022
66developed technical infrastructure00022
67waste chute00011
68distance from the lake00011
69access to culture00011
70access to the gym00011
71guarded housing estate00011
72smart home infrastructure00011

Appendix B

Figure A1. Survey form part 1. Source: own elaboration.
Land 14 01339 g0a1
Figure A2. Survey form part 2. Source: own elaboration.
Land 14 01339 g0a2

References

  1. García, J.L.; Alvarado, A.; Blanco, J.; Jiménez, E.; Maldonado, A.A.; Cortés, G. Multi-attribute evaluation and selection of sites for agricultural product warehouses based on an Analytic Hierarchy Process. Comput. Electron. Agric. 2014, 100, 60–69. [Google Scholar] [CrossRef]
  2. Ghumare, P.N.; Chauhan, K.A.; Yadav, S.K.M. Housing attributes affecting buyers in India: Analysis of perceptions in the context of EWS/LIG consumers view. Int. J. Hous. Mark. Anal. 2020, 13, 533–552. [Google Scholar] [CrossRef]
  3. Głuszak, M.; Małkowska, A. Preferencje mieszkaniowe młodych najemców lokali mieszkalnych w Krakowie. Świat Nieruchom. 2017, 2, 39–44. [Google Scholar] [CrossRef]
  4. Opoku, R.A.; Abdul-Muhmin, A.G. Housing preferences and attribute importance among low-income consumers in Saudi Arabia. Habitat Int. 2010, 34, 219–227. [Google Scholar] [CrossRef]
  5. Renigier-Biłozor, M.; Janowski, A.; Walacik, M.; Chmielewska, A. Human emotion recognition in the significance assessment of property attributes. J. Hous. Built Environ. 2022, 37, 23–56. [Google Scholar] [CrossRef]
  6. Nilsson, P. Prediction of residential real estate selling prices using neural networks. Comput. Inf. Sci. 2019, 70, 37. [Google Scholar]
  7. Szopińska, K.; Krajewska, M.; Kwiecień, J. The Impact of Road Traffic Noise on Housing Prices-Case Study in Poland. Real Estate Manag. Valuat. 2020, 28, 21–36. [Google Scholar] [CrossRef]
  8. Szczepańska, A. Expansion of the Transport System as a Factor Affecting the Real Estate Market, with the Construction of the Olsztyn Ring-Road as an Example. Real Estate Manag. Valuat. 2019, 27, 39–52. [Google Scholar] [CrossRef]
  9. Doszyn, M. Individual Capacities of Hellwig’s Information Carriers and the Impact of Attributes in the Szczecin Algorithm of Real Estate Mass Appraisal. Real Estate Manag. Valuat. 2019, 27, 15–24. [Google Scholar] [CrossRef]
  10. Rącka, I.; Szopińska, K. Investment Decisions on the Local Housing Market vs. Road Noise; Wydawnictwo Uniwersytetu Ekonomicznego we Wrocławiu: Wrocław, Poland, 2017; pp. 100–117. [Google Scholar] [CrossRef]
  11. Trojanek, R.; Gluszak, M. Spatial and time effect of subway on property prices. J. Hous. Built Environ. 2018, 33, 359–384. [Google Scholar] [CrossRef]
  12. Lee, C.; Park, K.K.H. Representing Uncertainty in Property Valuation through a Bayesian Deep Learning Approach. Real Estate Manag. Valuat. 2020, 28, 15–23. [Google Scholar] [CrossRef]
  13. Bich, H.N.T.; Trong, H.N.; Thanh, H.T. The Role of Listing Price Strategies on the Probability of Selling a House: Evidence from Vietnam. Real Estate Manag. Valuat. 2020, 28, 63–75. [Google Scholar] [CrossRef]
  14. Chou, J.S.; Fleshman, D.B.; Truong, D.N. Comparison of machine learning models to provide preliminary forecasts of real estate prices. J. Hous. Built Environ. 2022, 37, 2079–2114. [Google Scholar] [CrossRef]
  15. The Appraisal Foundation. The Uniform Standards of Professional Appraisal Practice (USPAP); The Appraisal Foundation: Washington, DC, USA, 2024. [Google Scholar]
  16. IVS. International Valuation Standards; IVSC: London, UK, 2021. [Google Scholar]
  17. EVS. EVS European Valuation Standards; The European Group of Valuers’ Associations: Brussels, Belgium, 2016; ISBN 9789081906012. [Google Scholar]
  18. RICS. RICS Valuation—Global Standards; RICS: London, UK, 2021. [Google Scholar]
  19. Walacik, M.; Cellmer, R.; Źróbek, S. Mass Appraisal—International Background, Polish Solutions and Proposal of new Methods Application. Geod. List 2013, 67, 255–269. [Google Scholar]
  20. Grover, R.; Walacik, M. Property Valuation and Taxation for Fiscal Sustainability—Lessons for Poland. Real Estate Manag. Valuat. 2019, 27, 35–48. [Google Scholar] [CrossRef]
  21. Renigier-Biłozor, M.; Chmielewska, A.; Walacik, M.; Janowski, A.; Lepkova, N. Genetic algorithm application for real estate market analysis in the uncertainty conditions. J. Hous. Built Environ. 2021, 36, 1629–1670. [Google Scholar] [CrossRef]
  22. Walacik, M.; Renigier-Biłozor, M.; Chmielewska, A.; Janowski, A. Property sustainable value versus highest and best use analyzes. Sustain. Dev. 2020, 28, 1755–1772. [Google Scholar] [CrossRef]
  23. McCluskey, W.J.; McCord, M.; Davis, P.T.; Haran, M.; McIlhatton, D. Prediction accuracy in mass appraisal: A comparison of modern approaches. J. Prop. Res. 2013, 30, 239–265. [Google Scholar] [CrossRef]
  24. Brzezicka, J.; Wiśniewski, R. Ekonomia behawioralna a rynek nieruchomości—Teoria i praktyka. Psychol. Ekon. 2013, 3, 6–18. [Google Scholar] [CrossRef]
  25. Dimopoulos, T. Traditional Valuations vs. Automated Valuation Models; AXIA Chartered Surveyors: Nicosia, Cyprus, 2023. [Google Scholar]
  26. Hansson, S.O. Decision Theory: A Brief Introduction; Royal Institute of Technology: Stockolm, Sweden, 2005. [Google Scholar]
  27. Kahneman, D. Pułapki Myślenia. O myśleniu Szybkim i Wolnym; Media Rodzina: Poznań, Poland, 2011. [Google Scholar]
  28. Źróbek-Różańska, A. Proces decyzyjny na rynku nieruchomości na przykładzie zakupu działki pod budowę własnego domu [A Decision Making Process on the Real Estate Market—The Case of Buying a Residential Plot for Building own House]. Świat Nieruchom. 2016, 95, 11–16. [Google Scholar] [CrossRef]
  29. Shrestha, Y.R.; Ben-Menahem, S.M.; von Krogh, G. Organizational Decision-Making Structures in the Age of Artificial Intelligence. Calif. Manag. Rev. 2019, 61, 66–83. [Google Scholar] [CrossRef]
  30. Engel, J.F.; Blackwell, R.D.; Miniard, P.W. Consumer Behavior; Dryden Press: Fort Worth, TX, USA, 1995. [Google Scholar]
  31. Ben-Shahar, D. Tenure Choice in the Housing Market. Environ. Behav. 2007, 39, 841–858. [Google Scholar] [CrossRef]
  32. Strączkowski, Ł. Preferencje Nabywców Mieszkań na Lokalnym Rynku Nieruchomości; Wydawnictwo UEP, Uniwersytet Ekonomiczny w Poznaniu: Poznań, Poland, 2021; ISBN 978-83-8211-043-2. [Google Scholar]
  33. Clegg, D.; Barker, R. Case Method Fast-Track: A Rad Approach; Addison-Wesley: Boston, MA, USA, 1994; ISBN 020162432X. [Google Scholar]
  34. Brennan, K. A Guide to the Business Analysis Body of Knowledge; 2.0.; International Institute of Business Analysis: Pickering, ON, Canada, 2009. [Google Scholar]
  35. Wilczewski, S. Zarządzanie Projektami w Podejściu Zwinnym; Wydawnictwo Politechniki Gdańskiej: Gdańsk, Poland, 2022; Volume 1, ISBN 978-83-7348-877-9. [Google Scholar]
  36. Szymańska, A.I. Podejście kompozycyjne i dekompozycyjne w pomiarze wyrażonych preferencji konsumentów. Pract. Kom. Geogr. Przem. Pol. Tow. Geogr. 2013, 21, 239–252. [Google Scholar] [CrossRef]
  37. Cai, C.; Yang, C.; Lu, S.; Gao, G.; Na, J.; Cai, C.; Yang, C.; Lu, S.; Gao, G.; Na, J. Human motion pattern recognition based on the fused random forest algorithm. Measurement 2023, 222, 113540. [Google Scholar] [CrossRef]
  38. Lancaster, K.J. A New Approach to Consumer Theory. J. Polit. Econ. 1966, 74, 132–157. [Google Scholar] [CrossRef]
  39. Samuelson, P.A. Consumption Theory in Terms of Revealed Preference. Economica 1948, 15, 243. [Google Scholar] [CrossRef]
  40. Ries, A.; Trout, J. The 22 Immutable Laws of Marketing Violate Them at Your Own Risk! HarperBusiness: New York, NY, USA, 1996. [Google Scholar]
  41. Dimopoulos, T.; Ioakim, V. A discussion on mass appraisals: Case study on land plots, views of local appraisers and the future in property valuations. J. Prop. Tax Assess. Adm. 2024, 21, 5–20. [Google Scholar] [CrossRef]
  42. Ho, W.; Ma, X. The state-of-the-art integrations and applications of the analytic hierarchy process. Eur. J. Oper. Res. 2018, 267, 399–414. [Google Scholar] [CrossRef]
  43. Clark, M.D.; Determann, D.; Petrou, S.; Moro, D.; de Bekker-Grob, E.W. Discrete Choice Experiments in Health Economics: A Review of the Literature. Pharmacoeconomics 2014, 32, 883–902. [Google Scholar] [CrossRef]
Scheme 1. Procedure for determining the significance of real estate features. Source: own elaboration.
Land 14 01339 sch001
Scheme 2. Categories of the importance of real estate features in the MoSCoW method. Source: own elaboration.
Land 14 01339 sch002
Table 1. Part of the database of residential property features.
Property Feature1234567891098
Fashion00000000000
Type of market (secondary/primary)40000000000
Construction type00004000100
Type of building00000000000
Storey42203003200
Exposition40000000000
Standard30030000000
Technical condition00000000430
Age of the property00000000000
Height of rooms00000000000
Number of toilets00300000000
Number of rooms40444000404
Number of bathrooms00000000000
Number of kitchens00300000000
Number of storeys00000000040
Number of balconies00000000000
Smart home infrastructure00000000000
Table 2. Example of the number of features in individual significance categories.
No.Property FeatureCategory of Significance
Must HaveShould HaveCould HaveWill Have
1fashion1000
2type of market (secondary/primary)2100
3construction type2001
4type of building0100
5storey7470
6exposition2200
7standard0200
8technical condition2100
9age of the property2000
72smart home infrastructure0001
Table 3. Example of individual significance of features in particular significance categories.
No.Property FeatureCategory of Significance
Must HaveShould HaveCould HaveWill Have
1fashion4000
2type of market (secondary/primary)8300
3construction type8001
4type of building0300
5storey2812140
6exposition8600
7standard0600
8technical condition8300
9age of the property8000
72smart home infrastructure0001
Table 4. Example of the individual significance of features in particular significance categories.
No.Property FeatureCategory of SignificanceWeighted Sum
Must HaveShould HaveCould HaveWill Have
1number of rooms8400084
2layout of rooms44150059
3storey281214054
4balcony241214050
5access to parking spaces16248048
6access to communication3232138
7basement2406232
8distance from the city center1692229
9access to green areas1666129
10private parking spaces8126026
11distance from commercial establishments868325
12garage492823
13lift4122220
14area of the apartment1262020
15quiet neighborhood2000020
Table 5. Selected features and their levels.
No.Key Property FeatureLevels
1number of rooms(2, 3, 4)
2layout of rooms(open, separate, mixed)
3storey(ground, 1–2, 3+)
4balcony(none, small, large)
5access to parking spaces(public, none, private)
6access to communication(excellent, moderate, poor)
7basement(private, shared, none)
Table 6. Construction of property profiles.
ProfileNumber of RoomsLayout of RoomsStoreyBalconyAccess to Parking SpacesAccess to CommunicationBasement
Profile 12opengroundsmallpublicexcellentnone
Profile 23separategroundsmallnoneexcellentprivate
Profile 33mixed1–2smallpublicmoderateshared
Profile 44mixed3+smallnonemoderatenone
Profile 53open3+largenonemoderateshared
Profile 64opengroundnonenonemoderateprivate
Profile 73open1–2largeprivatemoderateshared
Profile 82separate1–2largenoneexcellentnone
Profile 93open3+largeprivatemoderateprivate
Profile 103separate3+largepublicexcellentshared
Profile 113separategroundsmallnonepoornone
Profile 122mixed1–2largeprivatepoorshared
Profile 133mixed1–2smallnonepoorprivate
Profile 144mixed1–2smallnoneexcellentprivate
Table 7. The distribution of responses for each property profile.
ProfileRATEAverage Rating
12345678910
Profile 14.2%12.5%16.7%12.5%29.2%8.3%12.5%4.2%0.0%0.0%4.46
Profile 212.5%4.2%0.0%12.5%25.0%20.8%16.7%4.2%4.2%0.0%5.08
Profile 30.0%4.2%12.5%4.2%20.8%25.0%20.8%8.3%4.2%0.0%5.67
Profile 420.8%8.3%16.7%29.2%12.5%4.2%8.3%0.0%0.0%0.0%3.50
Profile 516.7%0.0%4.2%29.2%12.5%16.7%16.7%0.0%0.0%4.2%4.67
Profile 612.5%8.3%20.8%16.7%37.5%4.2%0.0%0.0%0.0%0.0%3.71
Profile 70.0%0.0%0.0%8.3%12.5%8.3%25.0%16.7%20.8%8.3%7.25
Profile 88.3%4.2%12.5%16.7%20.8%29.2%4.2%0.0%4.2%0.0%4.67
Profile 90.0%0.0%0.0%0.0%0.0%12.5%33.3%8.3%16.7%29.2%8.17
Profile 100.0%0.0%0.0%8.3%4.2%33.3%20.8%8.3%16.7%8.3%7.00
Profile 1120.8%33.3%16.7%12.5%8.3%0.0%4.2%4.2%0.0%0.0%2.92
Profile 120.0%0.0%29.2%12.5%16.7%25.0%12.5%4.2%0.0%0.0%4.92
Profile 1320.8%8.3%20.8%20.8%12.5%12.5%4.2%0.0%0.0%0.0%3.50
Profile 1416.7%0.0%0.0%25.0%29.2%8.3%12.5%8.3%0.0%0.0%4.67
Table 8. The results of the linear regression.
R2 = 0.885|Adjusted R2 = 0.879|Breusch–Pagan p = 0.654|All VIFs < 1.10
FeaturePartworth Coefficient
Access to parking spaces—private+2.22
Access to parking spaces—public+2.10
Basement—private+1.43
Layout of rooms—separate+1.39
Access to communication—moderate+0.62
Layout of rooms—open+0.54
Number of rooms+0.44
Basement—shared+0.15
Storey—3+−0.36
Storey—ground−0.54
Access to communication—poor−0.73
Balcony—small−0.92
Balcony—none−2.50
Table 9. The importance of features.
FeaturePathworth RangeImportance (%)
Balcony1.5829.48%
Access to communication1.3525.19%
Basement1.2823.88%
Layout of rooms0.8515.86%
Storey0.183.36%
Access to parking spaces0.122.24%
Number of rooms0.000.00%
Table 10. The comparison of obtained results.
FeatureMoSCoW ValidityConjoint ValidityConclusion
Number of roomsVery highVery lowovervaluation
Layout of roomsHighMeanpartial compliance
StoreyHighLowovervaluation
BalconyMeanVery highunderestimation
Access to parking spacesMeanVery lowovervaluation
Access to communicationLowVery highunderestimation
BasementLowHighunderestimation
Disclaimer/Publisher’s Note: The statements, opinions and data contained in all publications are solely those of the individual author(s) and contributor(s) and not of MDPI and/or the editor(s). MDPI and/or the editor(s) disclaim responsibility for any injury to people or property resulting from any ideas, methods, instructions or products referred to in the content.

