Article

Spatial Association Network of Land-Use Carbon Emissions in Hubei Province: Network Characteristics, Carbon Balance Zoning, and Influencing Factors

1
School of Public Administration, China University of Geosciences, Wuhan 430074, China
2
School of Economics and Management, Beijing Jiaotong University, Beijing 100044, China
3
School of Business Administration and Tourism Management, Yunnan University, Kunming 650500, China
*
Authors to whom correspondence should be addressed.
Land 2025, 14(7), 1329; https://doi.org/10.3390/land14071329
Submission received: 26 May 2025 / Revised: 13 June 2025 / Accepted: 20 June 2025 / Published: 23 June 2025
(This article belongs to the Section Land Use, Impact Assessment and Sustainability)

Abstract

Understanding the spatial association network structure and carbon balance zoning of land-use carbon emissions (LUCEs) is essential for guiding regional environmental management. This study constructs a LUCE spatial association network for Hubei Province using a modified gravity model to uncover the spatial linkages in carbon emissions. Carbon balance zones are delineated by integrating LUCE network characteristics with economic and ecological indicators. To further examine the network dynamics, link prediction algorithms are employed to anticipate potential emission connections, while quadratic assignment procedure (QAP) regression analyzes how intercity differences in socioeconomic, ecological, and land-use attributes influence LUCE connectivity. The results reveal a pronounced core–periphery structure, with potential carbon spillover pathways extending toward both eastern and western cities. Based on the carbon balance analysis, six functional zones are identified, each aligned with targeted collaborative mitigation strategies. The QAP results indicate that intercity differences in innovation capacity, industrial structure, and economic development are positively associated with the formation of LUCE spatial networks, whereas disparities in urbanization level, government expenditure, and construction land use are negatively associated with LUCE connectivity. This study provides a differentiated governance framework to address the dual challenges of carbon emissions and land-use transformation in agro-urban regions.

1. Introduction

Land-use carbon emissions (LUCEs) are a significant contributor to climate change, accounting for about one-third of worldwide anthropogenic emissions [1]. In response to carbon-driven global warming, the United Nations 2030 Agenda for Sustainable Development emphasizes the goals of SDG11 (building sustainable cities and human settlements) and SDG13 (taking urgent action to combat climate change and its impacts), highlighting the need to integrate low-carbon principles and adaptive governance into land-use and urbanization practices [2,3].
In China, urban areas contribute nearly 85% of total carbon emissions [4], largely driven by intensive land development and associated energy consumption [5]. Research has demonstrated that the rate of land expansion in China is 1.8 times greater than the rate of population growth [6,7]. In 2020, China announced its dual-carbon goals of achieving carbon peaking and carbon neutrality and launched several land-use policies aimed at low-carbon development [8], including the Regulations on Economical and Intensive Land Use, the Synergistic Plan for Pollution and Carbon Reduction, and the National Climate Change Adaptation Strategy 2035. However, the 2023 Statistical Review of World Energy revealed that China still accounts for over 30% of global carbon emissions [9]. This dramatic rise emphasizes the need for efficient carbon control in addition to reflecting China’s fast industrialization and urbanization [6,10].
Considerable attention has been given in recent years to the impact of land use on carbon emissions [11,12]. Lambin and Meyfroidt (2013) emphasized that globalized trade and distant consumption increasingly drive land-use changes, highlighting the importance of accounting for indirect land-use changes and cross-border displacement in carbon emission assessments [13]. To quantify land-use carbon emissions, researchers have primarily employed methods such as carbon emission coefficients [14,15], life cycle assessment [16], and remote sensing technology [17]. These methods have been widely applied to analyze the spatiotemporal dynamics of LUCEs across various spatial scales [18]. Over time, the research scale has gradually shifted from national and regional levels to more refined spatial units [19,20,21]. To identify the drivers of LUCEs, a wide range of analytical approaches have been adopted, including the Environmental Kuznets Curve and the Spatial Durbin Model [18,22,23], the LMDI model [24], the TAPIO decoupling model, and the Geographical Detector method [5]. Key influencing factors identified in the literature include urban expansion [6], landscape structure [25], industrial structure [10], and land-use structure [26]. Recent advances have further emphasized the importance of cross-boundary processes. Fendrich et al. (2024) incorporated land management, soil erosion, and lateral carbon transfers into a continental-scale carbon model, emphasizing the importance of accounting for cross-boundary carbon flows in LUCE assessments [27]. Su et al. (2025) revealed that cropland encroachment on ecological land in Mainland Southeast Asia caused substantial CO2 emissions over the past 30 years, highlighting the critical need to integrate land-use planning with carbon mitigation strategies under different SSP-RCP scenarios [28].
Despite the previous research enhancing the estimation of LUCEs, several limitations remain. Most existing studies have concentrated on national-level patterns [29] or focused on megaregions such as the Yangtze River Delta [30,31,32], the Beijing-Tianjin-Hebei urban agglomeration [33], and the Yellow River Basin [34], while insufficient scholarly attention has been devoted to the spatial governance challenges in China’s central regions, often overlooking whether provinces that simultaneously exhibit high agricultural productivity and rapid urban-industrial expansion possess distinct LUCE network structures. Additionally, the majority of LUCE studies have employed spatial econometric models based on geographic proximity, which often obscure the complex, multi-scalar interactions driven by labor mobility, industrial supply chains, and cross-regional land flows [20,35,36]. Traditional attribute-based models struggle to capture these dynamic interdependencies and are thus limited in uncovering the structural patterns of LUCEs [22,23,37].
Social network analysis (SNA) provides a relational framework to analyze LUCEs by capturing intercity connectivity and topological structures [38,39,40,41,42]. Unlike traditional models, SNA captures intercity linkages and centrality patterns, allowing for a more relational understanding of carbon flows [20,43]. Li et al. (2024) applied MRIO and ecological network analysis to global trade-embedded land use, revealing that the EU, the US, and other developed economies benefit from land-use shifts, while emerging economies like China bear greater ecological burdens [44]. Recent studies have adopted SNA to explore LUCE spatial structures and their temporal evolution, highlighting its potential for capturing interregional carbon linkages [15,45]. While these contributions have enriched the analytical toolkit for LUCE research, several areas warrant further exploration. Prior studies have largely focused on static network structures, often overlooking the dynamic evolution and potential expansion of LUCE connections [20]. To address the limitations of static network analysis, recent studies have introduced link prediction techniques to uncover potential future connections within carbon-related spatial networks [46]. Zhang et al. (2024) employed spatial complexity analysis and link prediction algorithms to investigate synergistic carbon emissions reduction among cities in the Pearl River Basin, revealing that core cities exhibit strong spillover effects and enhanced network cohesion, thereby enabling more effective intercity collaboration on emission mitigation [47].
Urban low-carbon transitions have increasingly emphasized development quality and refined land-use management, driven by the growing imperative for compact, efficient, and low-emission urban strategies [48]. In this context, land-use carbon balance zoning has emerged as a crucial tool for optimizing the spatial allocation of carbon sources and sinks, thereby enhancing the effectiveness of regional low-carbon governance [21,49,50]. Carbon balance refers to a steady state in which carbon sources and carbon sinks are quantitatively or qualitatively equivalent [51]. Carbon balance zoning involves the spatially categorization of regions based on the relationship between carbon sources and sinks, with the aim of identifying and mitigating spatial mismatches to support the development of differentiated low-carbon policies [15]. Vaccari et al. (2013) conducted a carbon balance study of the city of Florence and found that green spaces offset 6.2% of direct carbon emissions, highlighting the mitigation potential of urban vegetation and providing important insights for subsequent sustainable urban planning [52]. Lu et al. (2012) proposed a zoning framework that addressed mismatches between carbon emissions and economic development by introducing two indicators, the ecological support coefficient (ESC) and the economic contribution coefficient (ECC) [53]. The ESC reflects a region’s capacity to absorb or offset emissions through ecosystems such as forests, wetlands, and cropland, and is increasingly applied in ecological zoning and carbon sink assessments. In contrast, ECC measures the carbon intensity of economic activity, capturing the trade-off between emission output and economic productivity [31]. By incorporating both the ecological capacity and economic efficiency into a unified framework, this approach addresses the limitations of earlier models that focused solely on either emissions or absorption. Based on the spatial relationship between ECC and ESC, regions can be categorized into carbon sink development zones, economic development zones, and low-carbon conservation zones [53,54].
However, existing zoning frameworks predominantly adopt attribute-based approaches that treat carbon sources and sinks as static and independent elements. These methods often overlook how ECC and ESC interact with a region’s structural position within the broader carbon flow network. This oversight limits the capacity of zoning schemes to reflect intercity dependencies and spatial spillover effects, which are essential for designing coordinated regional mitigation strategies and allocating differentiated emission responsibilities [37,55,56]. The absence of network-based perspectives impedes the development of integrated carbon governance mechanisms that align ecological capacity with economic development. For instance, Huang et al. (2024) proposed a classification system based on ecological and socioeconomic indicators; however, their model did not incorporate network structural characteristics such as node centrality or connectivity [15].
Hubei Province, as both a major grain-producing region and a strategic hub within the Yangtze River Economic Belt, shoulders the dual task of advancing China’s “dual carbon” goals and fostering green, low-carbon, and high-quality development. From 2000 to 2023, its urbanization rate rose markedly from 40.22% to 65.47%, intensifying the conversion of agricultural land to non-agricultural uses and exerting growing pressure on land-use carbon emissions [5]. Hubei Province is selected as the empirical focus due to its distinctive characteristics. It represents a prototypical transitional region where industrially intensive areas (e.g., the Wuhan metropolitan cluster) coexist with ecologically vital and agriculturally productive zones. This dual structure generates significant heterogeneity in LUCE patterns, along with governance complexity in balancing development and emission control. Thus, the insights from Hubei provide valuable references for other agro-urban regions undergoing similar transitions [57].
This research offers three main contributions. First, it advances an integrated zoning framework that combines attribute indicators with relational network characteristics to delineate functional zones of carbon balance. Unlike previous studies that have relied solely on static emission data or local attributes, this framework incorporates spatial spillovers and cross-regional linkages by combining network centrality positions with ECC and ESC indices. Second, this study introduces link prediction techniques to model potential future carbon flows, addressing a key limitation in current LUCE network studies that treat intercity connections as temporally static. By identifying emerging carbon spillover pathways, this approach enhances forward-looking LUCE governance. Third, this study employs quadratic assignment procedure (QAP) regression to assess how multidimensional attribute disparities shape the LUCE network. This method overcomes the limitations of traditional spatial econometric models that depend on fixed geographic contiguity, providing a more nuanced picture of interregional LUCE dynamics.
The remainder of this study is organized as follows. Section 2 describes the study area, data sources, and specific research methods. Section 3 presents the empirical results. Section 4 reviews the relevant literature and discusses the main findings, as well as this study’s limitations. Finally, Section 5 offers conclusions and policy recommendations.
Although this study focuses on Hubei Province, the analytical framework and key findings may offer valuable references for other agro-urban regions that exhibit similar structural characteristics, such as the coexistence of rapid urban expansion, agricultural functions, and ecological endowments. However, due to potential differences in policy environments, governance capacities, and land-use patterns, the applicability of this framework to other settings should be assessed with appropriate contextual adaptations.

2. Materials and Methods

2.1. Study Area

Hubei Province, located in central China (29°01′53″–33°6′47″ N, 108°21′42″–116°07′50″ E), serves as the study area for this research (see Figure 1). The province spans approximately 185,900 km2, accounting for about 1.94% of China’s total land area, and includes 17 prefecture-level divisions. In 2022, it recorded an urbanization rate of 64.67% and a gross regional product of CNY 5373.492 billion. Due to its geographic location and strategic significance, Hubei plays a pivotal role in promoting ecological civilization within the Yangtze River Economic Belt. It is recognized as one of China’s 13 major grain-producing provinces and is often referred to as the “Land of Fish and Rice” and the “Province of a Thousand Lakes.” In 2022, the province reported a total grain output of 27.41 million tons and a sown area of 4.69 million hectares. In terms of land-use structure, cropland and forest dominate the landscape, accounting for 43.57% and 48.93% of the total area, respectively. These are followed by water bodies (3.79%) and construction land (3.60%). As land-use transitions continue to intensify alongside economic development, their impacts on land-use carbon emissions have become increasingly evident in Hubei [5].

2.2. Data

This study utilizes the following four main data sources:
(1)
Geospatial base and topographic data were obtained from the National Geospatial Information Public Service Platform of Tianditu (https://cloudcenter.tianditu.gov.cn/administrativeDivision, accessed on 20 December 2024). Digital Elevation Model (DEM) data were sourced from the Geospatial Data Cloud (https://www.gscloud.cn/search, accessed on 20 December 2024).
(2)
Land use data were derived from the annual 30 m resolution China Land-Use/Cover Dataset (CLDC) for the period 1985–2023, released by Yang J. et al. (2021) at Wuhan University [58] (https://zenodo.org/records/12779975, accessed on 20 December 2024). This dataset classifies land into the following nine categories: cropland, forest, shrubland, grassland, water bodies, glaciers, barren land, built-up land, and wetlands.
(3)
Night-time light data were obtained from the dataset developed by Wu et al. (2022) [59], accessible at https://dataverse.harvard.edu/dataset.xhtml?persistentId=doi:10.7910/DVN/GIYGJU, accessed on 20 December 2024.
(4)
Socioeconomic data were collected from the China Urban Statistical Yearbook (https://data.cnki.net/yearBook/single?id=N2025020156&pinyinCode=YZGCA, accessed on 20 December 2024), the Hubei Statistical Yearbook (https://data.cnki.net/yearBook/single?id=N2024030083&pinyinCode=YQOEN, accessed on 20 December 2024), the statistical yearbooks of prefecture-level cities in Hubei Province (https://tjj.hubei.gov.cn/tjsj/sjkscx/tjnj/gsztj/whs/, accessed on 20 December 2024), and their corresponding statistical bulletins (https://tjj.hubei.gov.cn/tjsj/tjgb/ndtjgb/sztjgb/index.shtml, accessed on 20 December 2024).
All data used in this study cover the period from 2010 to 2022.

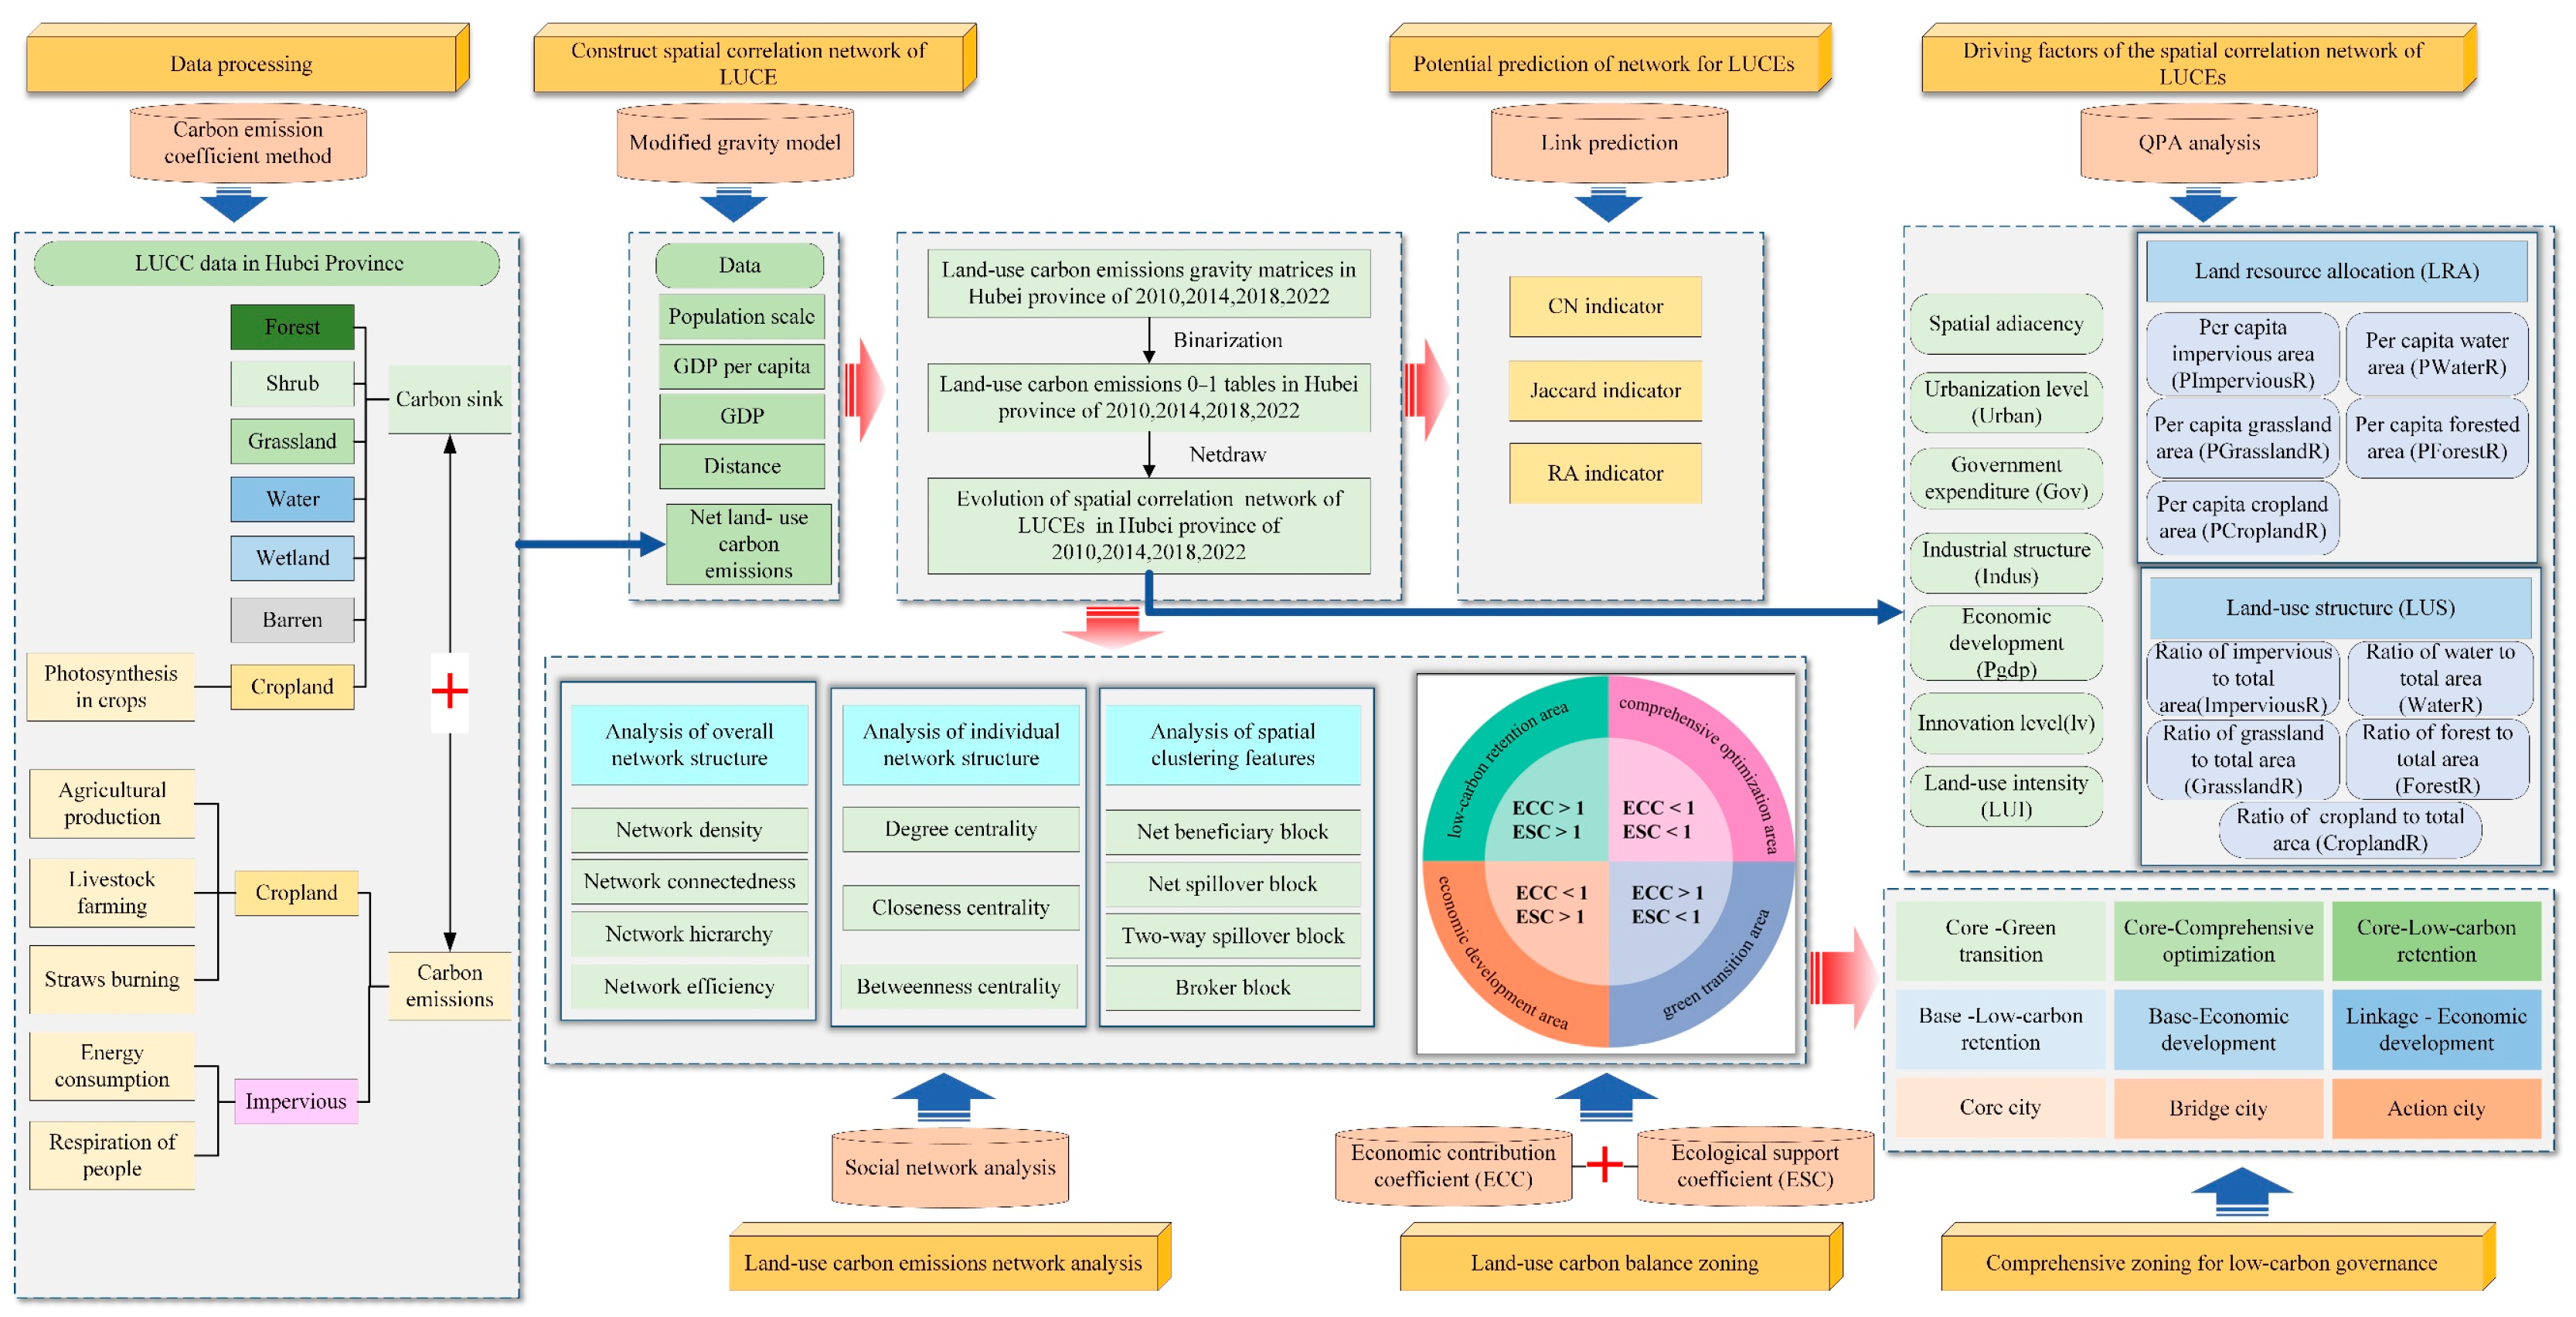
2.3. Analysis Framework

Based on socioeconomic and land-use data, this study first constructed a spatial correlation network of LUCEs using an improved gravity model. Subsequently, complex network analysis and link prediction methods were employed to examine the structural characteristics and potential evolution of the LUCE network. By integrating the structural features of the LUCE network with carbon balance zoning, the 17 prefecture-level cities in Hubei Province were then classified into six low-carbon governance zones and three city types. Finally, a QAP regression was conducted to explore the formation mechanisms of the LUCE spatial correlation network. The analytical framework of this study is illustrated in Figure 2.

2.4. Methodology

2.4.1. Net Carbon Emissions from Land Use

Net carbon emissions are determined by the disparity between carbon sources and carbon sinks [57,60]. Construction land is classified as a carbon source, while forests, shrublands, grasslands, water bodies, barren ground, and wetlands are designated as carbon sinks. Cropland serves as both a source and a sink.
(1) The direct estimation of carbon sinks [61,62].
C c = S i × k i + n = 1 m e n × S n × ( 1 P n ) / V n
In Equation (1), Cc represents the carbon sequestration of the ith land-use type; Si is the area of the ith land-use type; ki is the carbon sequestration coefficient for the ith land-use type; en is the carbon sequestration rate of crop n; Sn is the economic yield of crop n; Pn is the moisture coefficient of crop n; and Vn is the economic coefficient of crop n.
(2) Carbon emissions from farmland including those produced by agricultural activity, livestock and poultry raising, and straw combustion [63,64,65,66].
E i = G i × C i + R k ( B k + E k ) + i = 1 n P i × S c × θ i × a × b
In Equation (2), Gi is the quantity or area of input i, and Ci is its emission coefficient. Ri represents the annual stock of pigs, cattle, sheep, and poultry. Bk and Ek are the carbon emission coefficients for respiration and excretion corresponding to livestock type k (k = 1, 2, 3, 4). Pi is the yield of crop i; Sc represents the grain-to-straw ratio of crop i; θi is the carbon emission coefficient for straw burning of crop i; a is the open-field straw burning ratio, set at 0.165; and b is the combustion efficiency of straw burning, set at 0.8.
(3) Estimation of indirect carbon emissions from construction land
Carbon emissions from construction land include indirect emissions from human respiration and household energy consumption.
E p = P i × λ
In Equation (3), Ep represents the carbon emissions from human respiration; Pi denotes the permanent population in region i; and λ is the carbon emission coefficient. The coefficient is set at 790 t·10,000 persons−1 [66,67].
Energy-related carbon emissions were estimated via night-time light–based regression modeling due to data limitations at the prefecture level [59,61,68].
E m = i = 1 8 α i × β i × N C V i × C C i × C O F i
In Equation (4), Em represents the total carbon dioxide emissions resulting from energy consumption in Hubei Province; NCVi indicates the average net calorific value of the i-th energy source; CCi is the carbon content per unit of energy; COFi represents the carbon oxidation factor of the i-th energy source.
The specific carbon emission coefficients and related parameters used in this study are provided in Supplementary Materials (Tables S1–S6).

2.4.2. Kernel Density Estimation

Kernel density estimation (KDE) is a non-parametric method used to characterize the distribution of random variables via continuous density functions [46]. KDE is well-suited for analyzing the spatial distribution characteristics of LUCEs, facilitating a macro-level understanding of the variations across geographic spaces.
f ( x ) = 1 N h i = 1 N k ( X i x h )
K ( X ) = 1 2 π exp ( x 2 2 )
In Equations (5) and (6), f(x) denotes the probability density function of the random variable X, and h represents the bandwidth. Xi represents independently and identically distributed observations, while x denotes the evaluation point. K(X) is the kernel function, typically estimated using a Gaussian kernel.

2.4.3. Modified Gravity Model

This study utilizes an enhanced gravity model to develop a LUCE association matrix for 17 prefecture-level cities in Hubei Province. Informed by previous research [15,20], the modified model is formulated as follows:
y i j = k i j P i C i G i 3 P j C j G j 3 D i j 2
k i j = C i C i + C j , D i j = d i j g i g j
In Equation (7), Yij represents the spatial association strength of LUCEs between cities i and j. kij denotes the proportion of city i’s LUCEs in the total LUCEs of cities i and j. P, C, G, and g represent the resident population, LUCEs, gross domestic product, and per capita GDP, respectively. Dij is the economic–geographical distance between cities i and j. In Equation (8), dij indicates the spherical distance between cities, gi − gj refers to the difference in per capita GDP. The resulting gravity matrix is binarized using the row mean as the threshold: values ≥ threshold are set to 1, otherwise 0.

2.4.4. Social Network Analysis

(1) Overall network characteristics.
This study utilizes four indicators, network density, network connectivity, network hierarchy, and network efficiency, to evaluate the overall structural characteristics [37,69,70]. The definitions and calculation methods of these indicators are detailed in Supplementary Materials, Table S7.
(2) Individual network characteristics.
This study employs three indicators including degree centrality, betweenness centrality, and closeness centrality to evaluate the individual structural characteristics [15,71]. Descriptions of these indicators can be found in Supplementary Materials, Table S8.
(3) The block model.
Following the theoretical framework of block modeling [39], this study sets the maximum segmentation density to 2 and the convergence criterion to 0.2. Blocks were classified into four types based on density and convergence [71,72]. Descriptions of these indicators can be found in Supplementary Materials, Table S8.

2.4.5. Link Prediction

Link prediction estimates the likelihood of potential connections between previously unlinked nodes based on topological similarity [47,73]. In this study, link probabilities were estimated using CN, Jaccard, and RA indices. These indices have been widely used in network structure prediction studies due to their interpretability and suitability for topological analysis when attribute data are limited [74]. In Equations (9) to (11), Γ(i) denotes the set of neighbors of node i, Γ(j) represents the set of neighbors of node j, and Γ(i) ∩ Γ(j) indicates the set of common neighbors shared by nodes i and j.
The CN index estimates link probability based on the count of common neighbors.
S i j C N = Γ ( i ) Γ ( j )
The Jaccard index calculates the ratio of shared neighbors to the union of neighbor sets, capturing normalized similarity.
S i j J C = Γ ( i ) Γ ( j ) Γ ( i ) Γ ( j )
The RA index measures similarity as the sum of allocated resources transmitted through common neighbors, weighted by their degree Dz. A lower Dz increases the contribution of node z to the similarity score.
S i j R A = Z Γ ( i ) Γ ( j ) 1 D z

2.4.6. Carbon Balance Zone

ECC and ESC have been widely employed in previous studies to capture the socioeconomic and ecological attributes of carbon compensation [31]. In this study, these indicators were introduced to facilitate the spatial delineation of carbon balance zones.
The economic contribution coefficient (ECC) reflects regional disparities in carbon emissions from the perspective of economic efficiency and serves as a measure of the equity of economic contribution relative to carbon output [32,75]. It is calculated as follows:
E C C = G D P i G D P / C i C
In Equation (12), GDPi and Ci represent the GDP and carbon emissions of city i, respectively, while GDP and C denote the total GDP and total carbon emissions of Hubei Province. When the ECC value is greater than 1, it indicates that the city’s economic contribution exceeds its carbon emissions; conversely, an ECC value less than 1 suggests that the economic contribution is lower than its carbon emissions.
The ecological support coefficient (ESC) measures the balance between a region’s carbon sequestration and its carbon emissions, indicating its ecological support capacity [15]. It is computed as follows:
E S C = C S i C S / C i C
In Equation (13), CSi denotes the carbon sink of city i, while CS denotes the total carbon sink of Hubei. When ESC > 1, it indicates that city i contributes more to carbon sequestration than its proportional share of carbon emissions. Conversely, ESC < 1 suggests a relatively weak capacity for carbon sequestration.
Following prior studies [19,21,34], this study adopts 1 as the threshold value for both ECC and ESC. An ECC (or ESC) greater than 1 suggests a city contributes more than its fair share of GDP (or carbon sinks) relative to emissions, while values below 1 indicate underperformance. Although this binary classification is commonly used due to its clarity and policy relevance, it inevitably introduces some subjectivity. Future studies may consider employing machine learning-based clustering methods (e.g., K-means or SOM-K-means) to derive more adaptive and data-driven zoning schemes [32,76,77].
Carbon balance zones are defined utilizing ECC and ESC to categorize the comparative functions of cities as carbon sources or sinks (see Figure 3 and Table 1).

2.4.7. Quadratic Assignment Procedure

This study employs QAP regression to analyze the relationship between the LUCE spatial association matrix (dependent variable) and a series of explanatory difference matrices [71]. The model is specified as follows:
Y = f ( X 1 , X 2 , X 3 , , X n )
In Equation (14), Y represents the dependent variable matrix, and Xi (i = 1, 2, 3, …, n) denotes the difference matrices of the independent variables. Drawing on the relevant literature, this study focuses on five key dimensions: spatial adjacency, socio-economic development, resource utilization, land-use structure, and ecological environment. The selected indicators aim to capture both direct and indirect drivers of LUCE spatial associations across different urban and ecological contexts.
Spatial adjacency:
Geographical proximity reduces the time and cost of the carbon transfer process, thereby fostering spatial interdependence and spillover effects between neighboring regions [71].
Socio-economic development:
(1)
Urbanization rate (UR): the urbanization rate serves as an indicator of the general level of urban development. Compared to rural regions, urban areas offer enhanced potential for economies of scale and industrial concentration. As population migration intensifies, the redistribution and utilization of resources become more efficient, which in turn facilitates the transfer of carbon emissions across regions, resulting in carbon spillover effects from areas of population outflow to areas of inflow [77].
(2)
Government expenditure (Gov): government expenditures may influence carbon emissions by affecting economic activities and land-use patterns. Controlling government budget expenditures and adjusting industrial structures are essential strategies for reducing land-use carbon emissions [78,79].
(3)
Per capita gross domestic product (PGDP): the higher the degree of economic development of a city, the more likely it is to radiate neighboring cities, thus driving the economic development of the surrounding areas. Therefore, the economic difference between cities is an important factor in the formation of carbon balance correlation [10].
(4)
Innovation level (lv): innovation levels indirectly affect carbon emissions by driving technological advancement and industrial upgrading [45,80].
Resource utilization:
(1)
Industrial structure (Indus): in major grain-producing areas, the dynamic changes in grain yield per unit of cultivated land can reveal the impact pathway of shifting from extensive to intensive agricultural practices on land resource pressure and carbon emission intensity [45].
(2)
Land-use intensity (LUI): variations in land-use intensity inevitably result in differing configurations of carbon sources and sinks, thereby influencing the magnitude of regional carbon emissions and carbon sequestration. These disparities further give rise to inter-regional carbon interactions and spatial linkages [71].
Land-use structure:
Variations in land resource endowments such as the shares of impervious surfaces, cropland, forest, water, and grassland directly affect carbon sequestration potential and emission intensity. The differences in land endowment and allocation structure are therefore important factors influencing regional land-use carbon emissions [9].
Ecological environment:
The per capita area of different land-use types serves as an indicator of regional land resource carrying capacity and ecological environmental quality. The existing studies have shown that under a given total population, rural residents typically occupy more land per capita than urban residents. Therefore, rural-to-urban migration may theoretically release a greater amount of non-construction land, thereby influencing the region’s carbon sink capacity [81].
Seventeen explanatory variables were used, see Table 2 for variable definitions. Absolute difference matrices were computed for each year (2010, 2014, 2018, 2022). All matrices were standardized using the Z-score method, except for Distance.

3. Results

3.1. Spatial Evolution of LUCEs

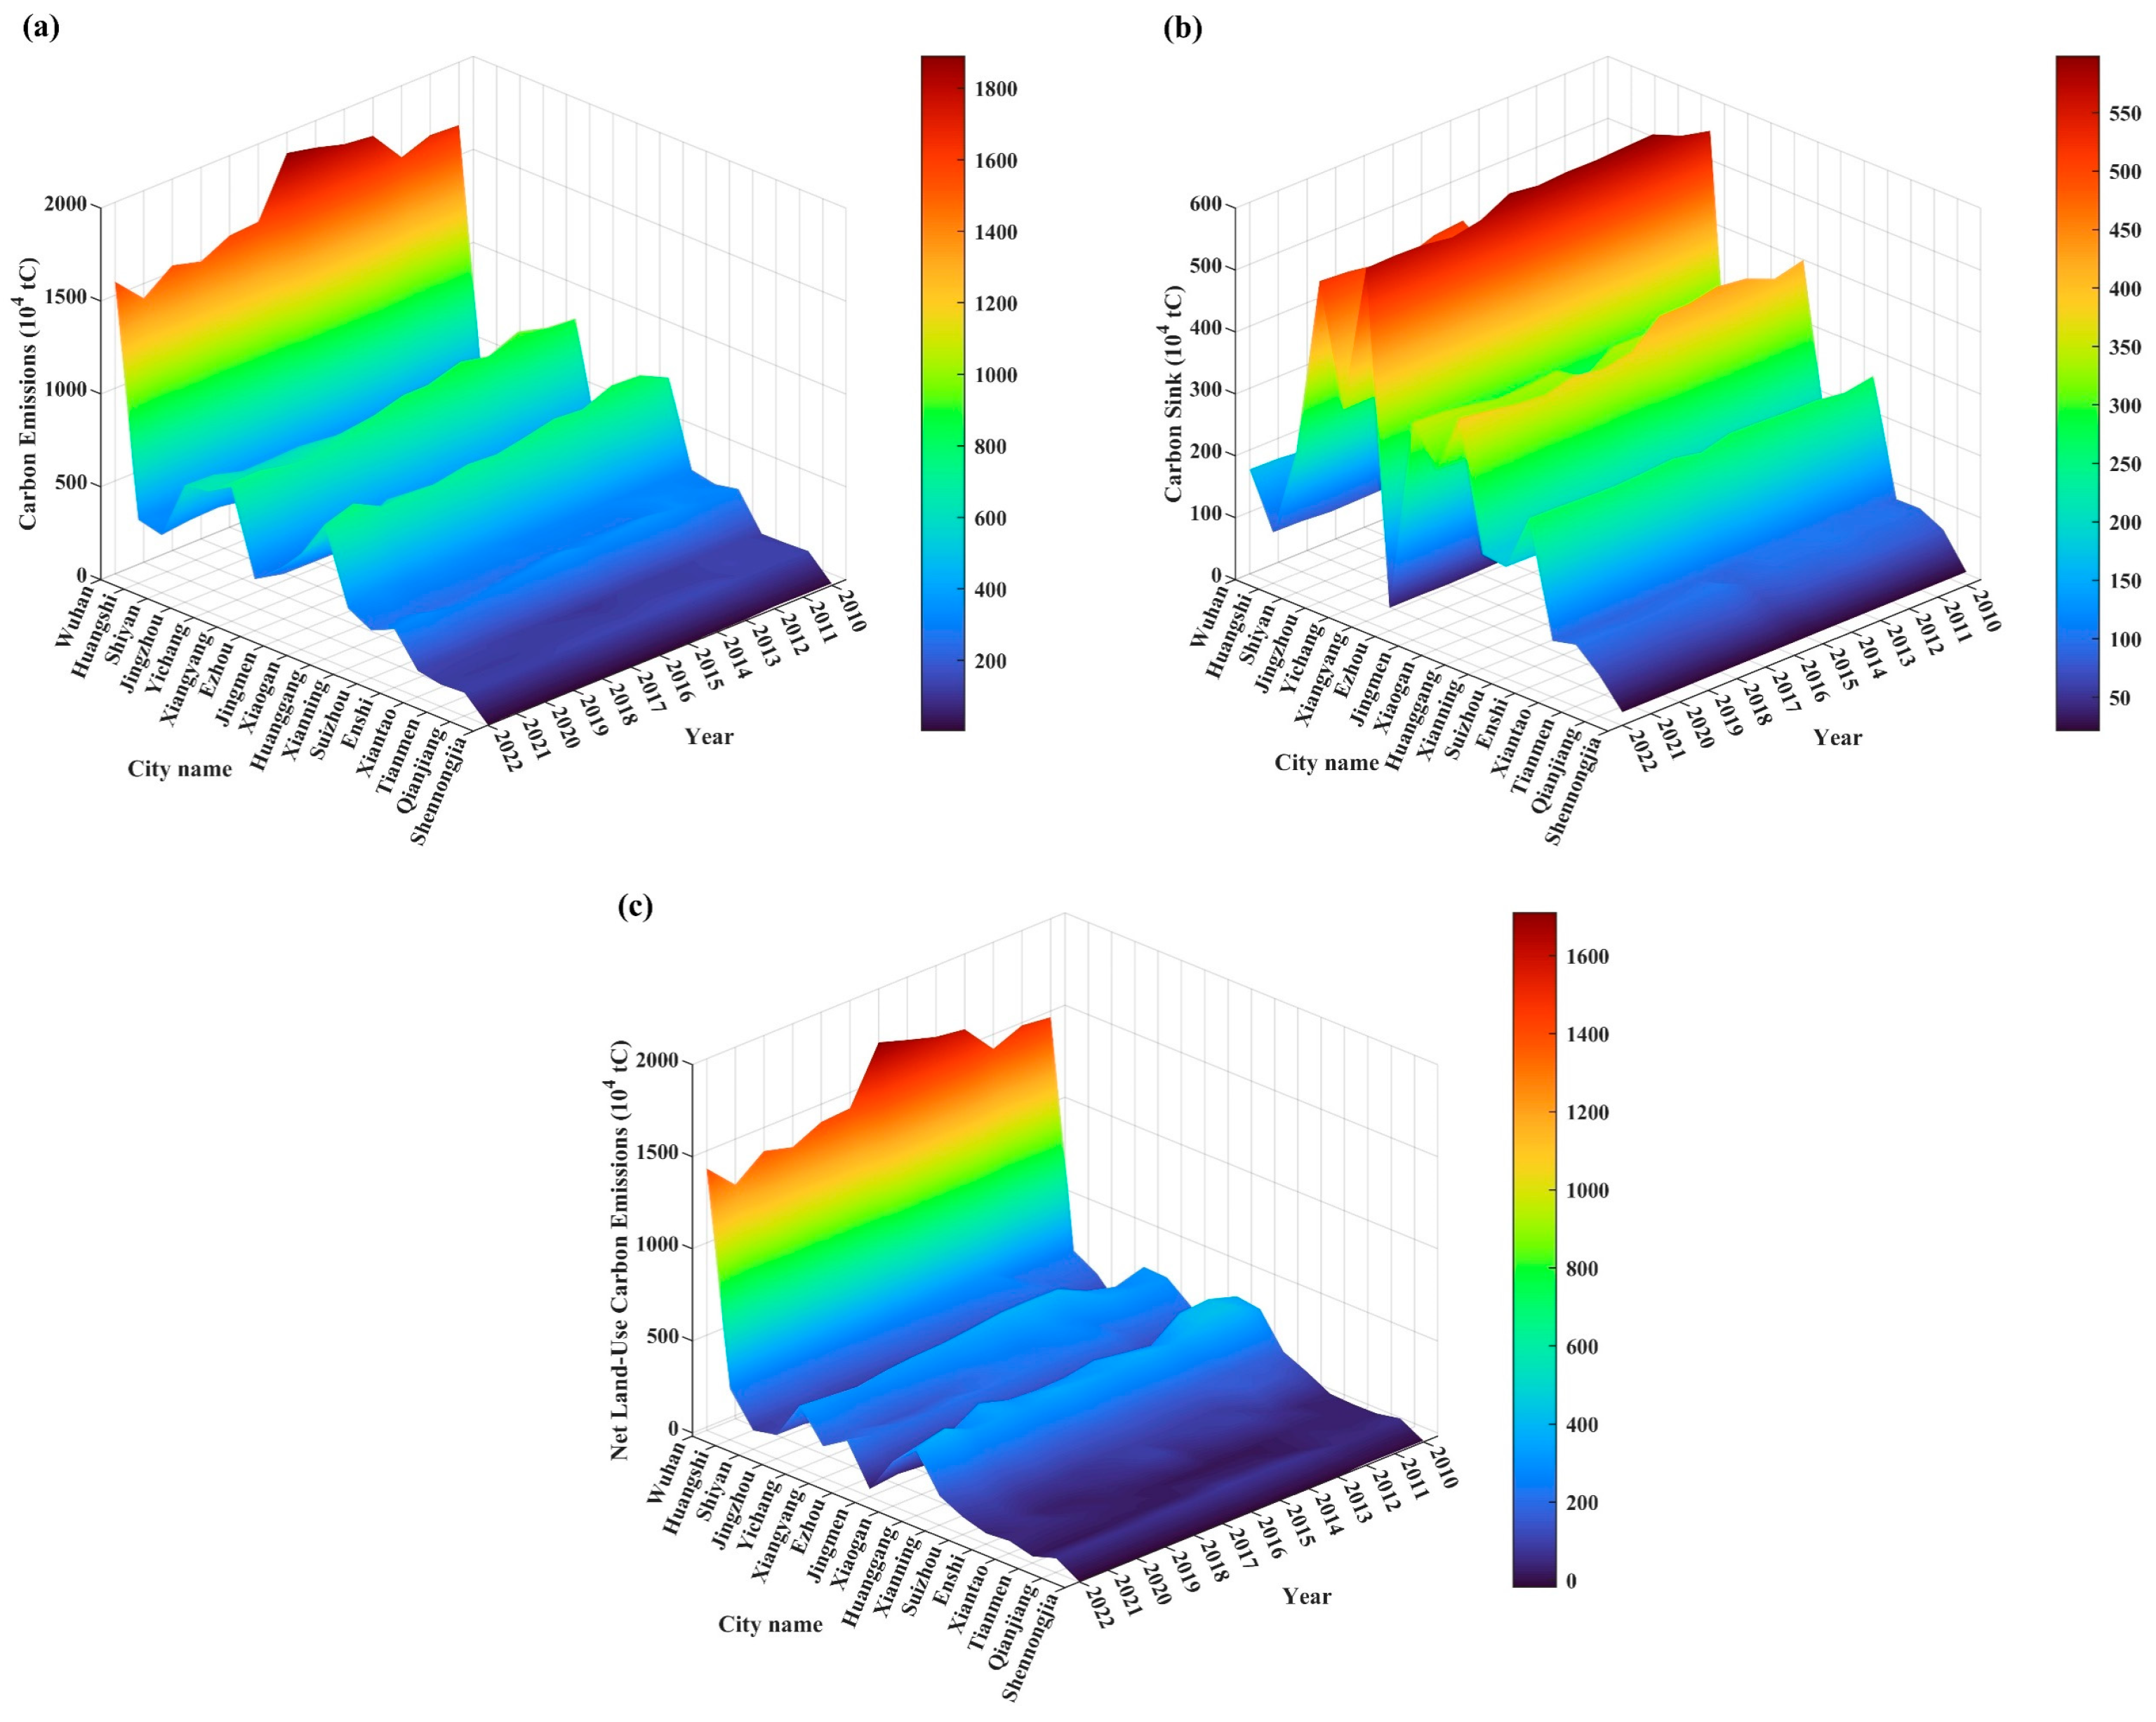
3.1.1. Temporal Change Characteristics of LUCEs

The temporal trends of LUCEs in Hubei Province from 2010 to 2022 are depicted in Figure 4. In 2010, total carbon emissions reached 70.96 million tons, rising to 88.97 million tons by 2022, with an average annual growth rate of 1.70%. In contrast, carbon sinks increased more slowly, from 34.70 million tons to 39.07 million tons over the same period, corresponding to an average annual growth rate of just 0.99%. Due to the slower growth of carbon sinks relative to emissions, net carbon emissions exhibited a continuous upward trend, increasing from 36.27 million tons in 2010 to 47.85 million tons in 2022. These findings highlight the ongoing challenges Hubei Province faces in mitigating carbon emissions and achieving carbon balance.

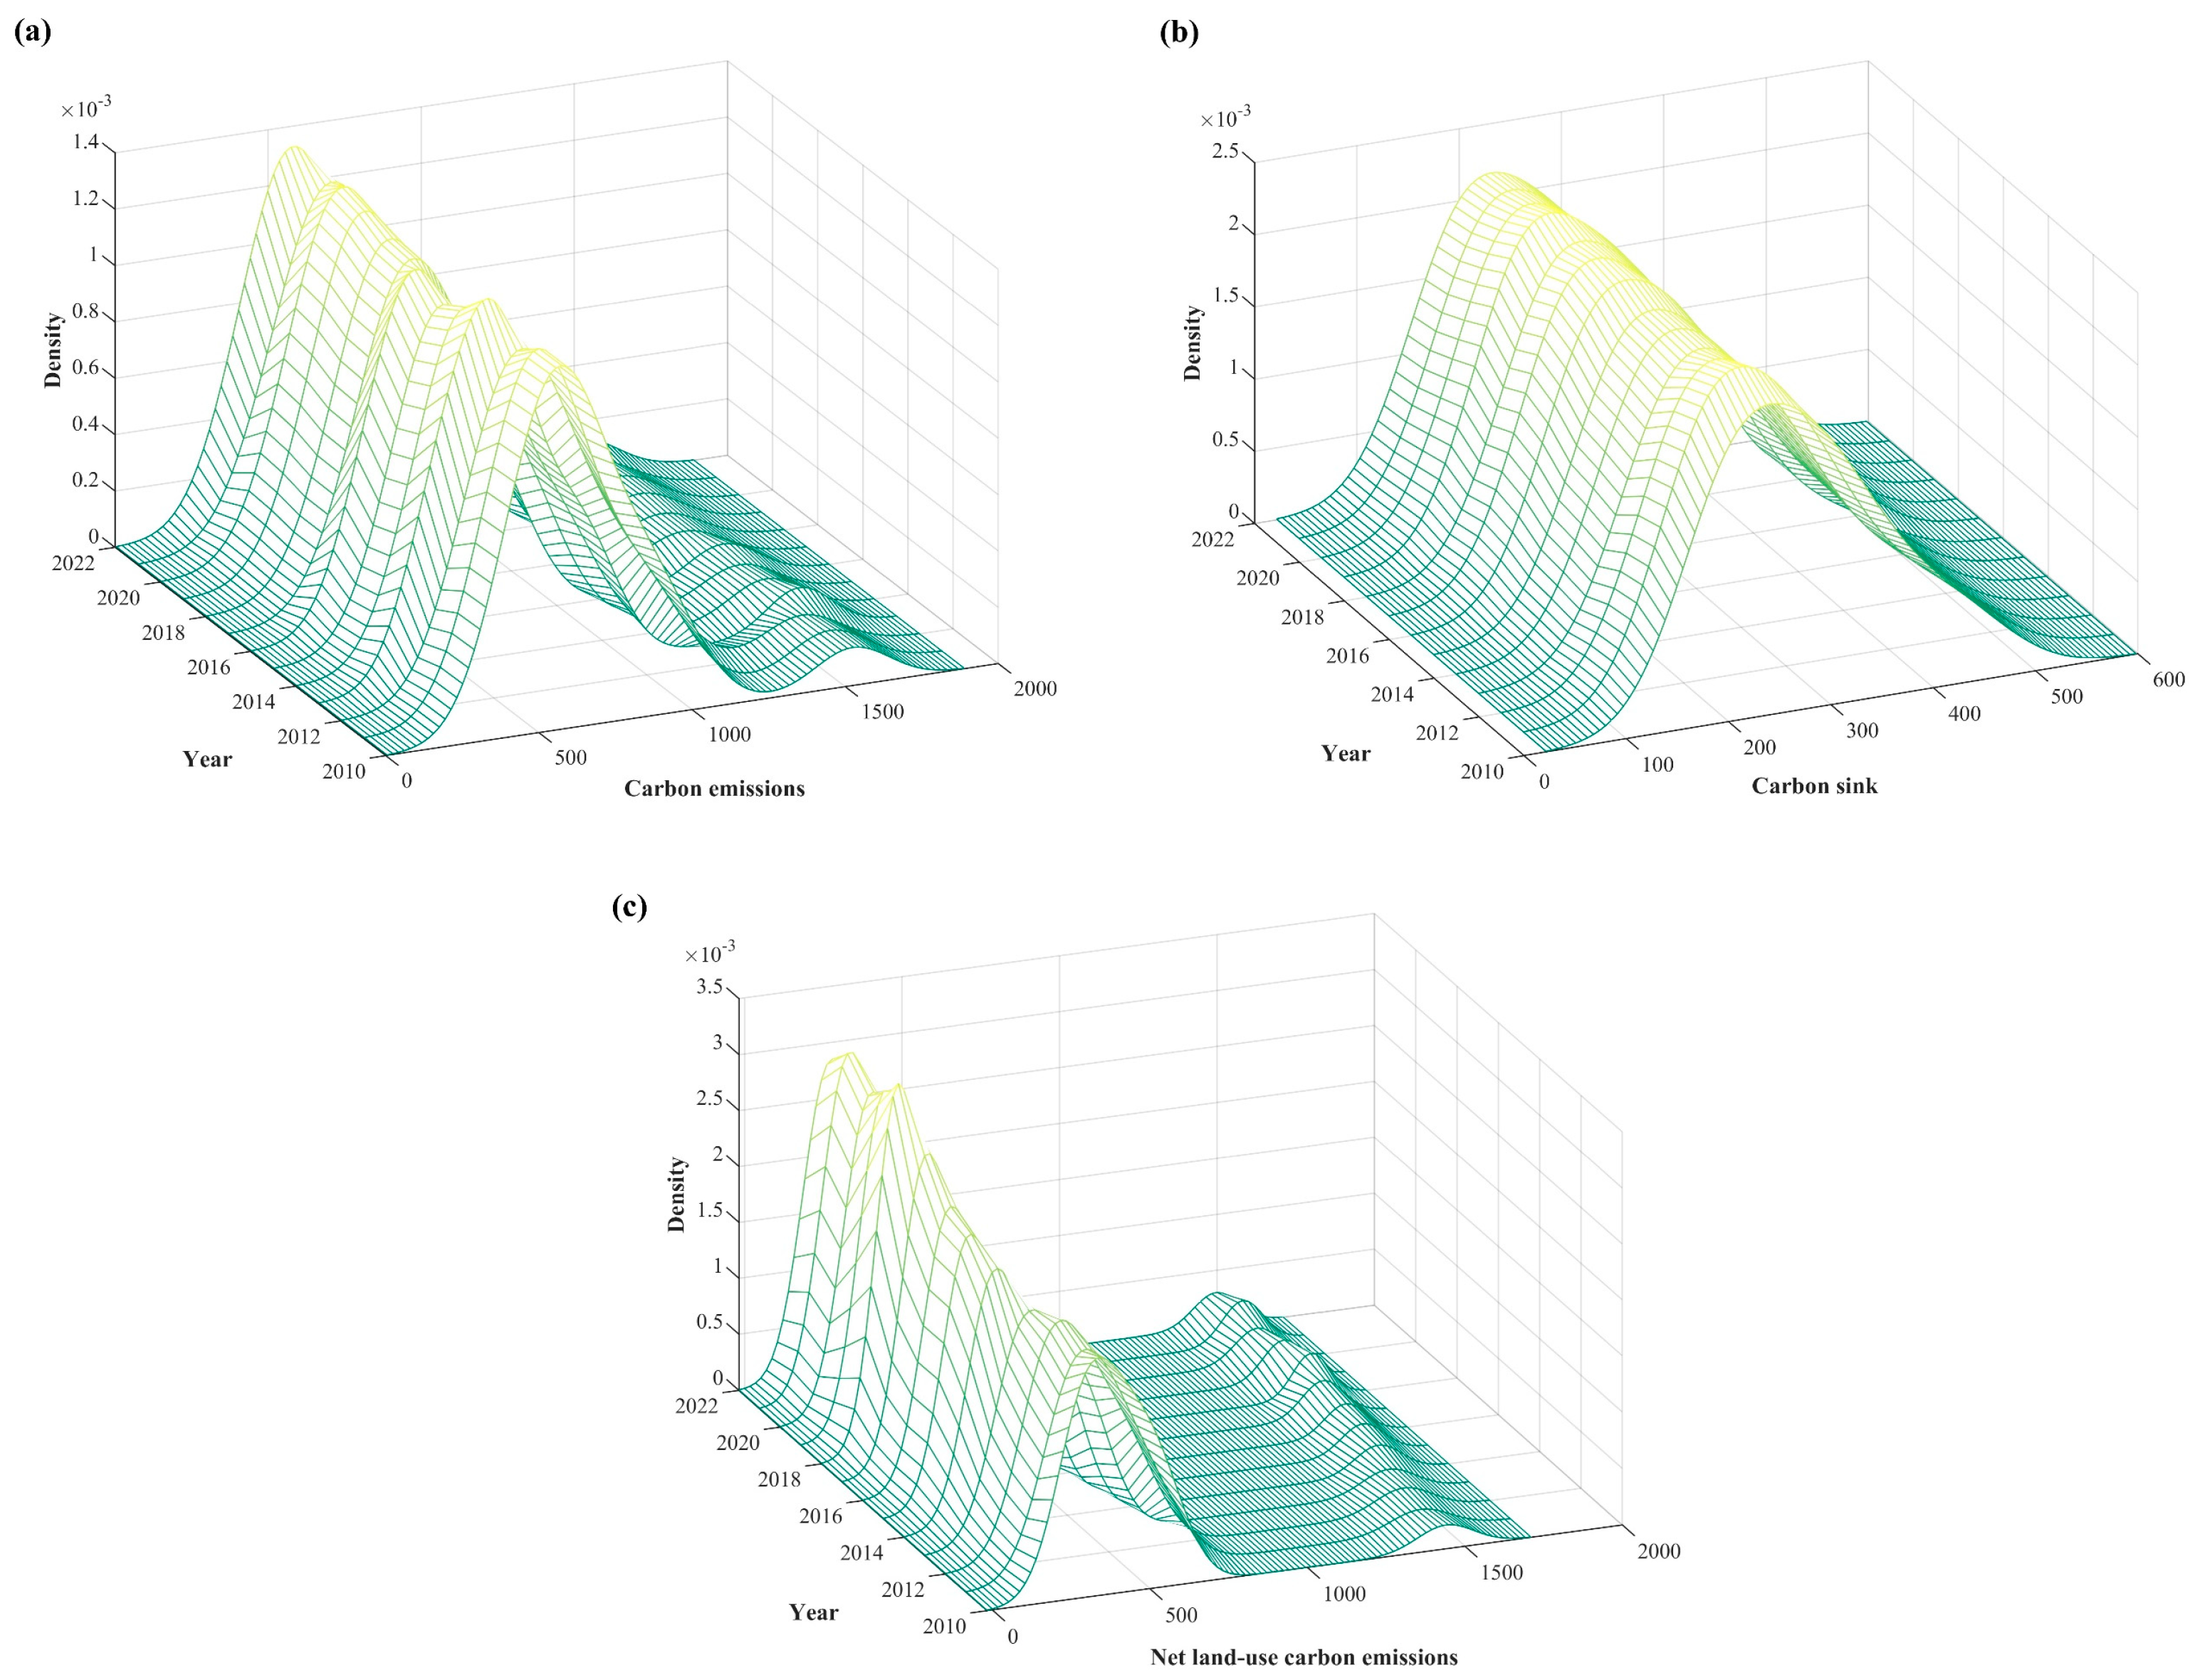
3.1.2. Distributional Characteristics and Evolution of LUCE

The kernel density estimation (KDE) plots of carbon emissions, carbon sinks, and net carbon emissions in Hubei Province from 2010 to 2022 are illustrated in Figure 5.
As shown in Figure 5, the distributions of carbon emissions (a), carbon sinks (b), and net land-use carbon emissions (c) across Hubei’s prefecture-level cities from 2010 to 2022 all exhibit a distinct unimodal pattern. The unimodal peak around a density value of 3 suggests a generally elevated LUCE level across cities, with persistent regional disparities. In addition, the peak heights in all three subplots display a “decline–then-rise” pattern over time, suggesting that regional low-carbon land-use policies had an initial impact during specific periods. However, this progress was later undermined by rapid urbanization and continued expansion of construction land, resulting in a rebound in overall emissions. Notably, all KDE curves exhibit a pronounced right-side tailing effect, implying that a few cities have persistently exhibited carbon emissions or net emissions levels above the provincial average. This highlights persistent disparities in LUCEs among cities, revealing spatial disparities and structural heterogeneity in LUCEs across Hubei Province. Therefore, it is imperative to formulate region-specific carbon reduction policies and implement context-specific land management strategies.

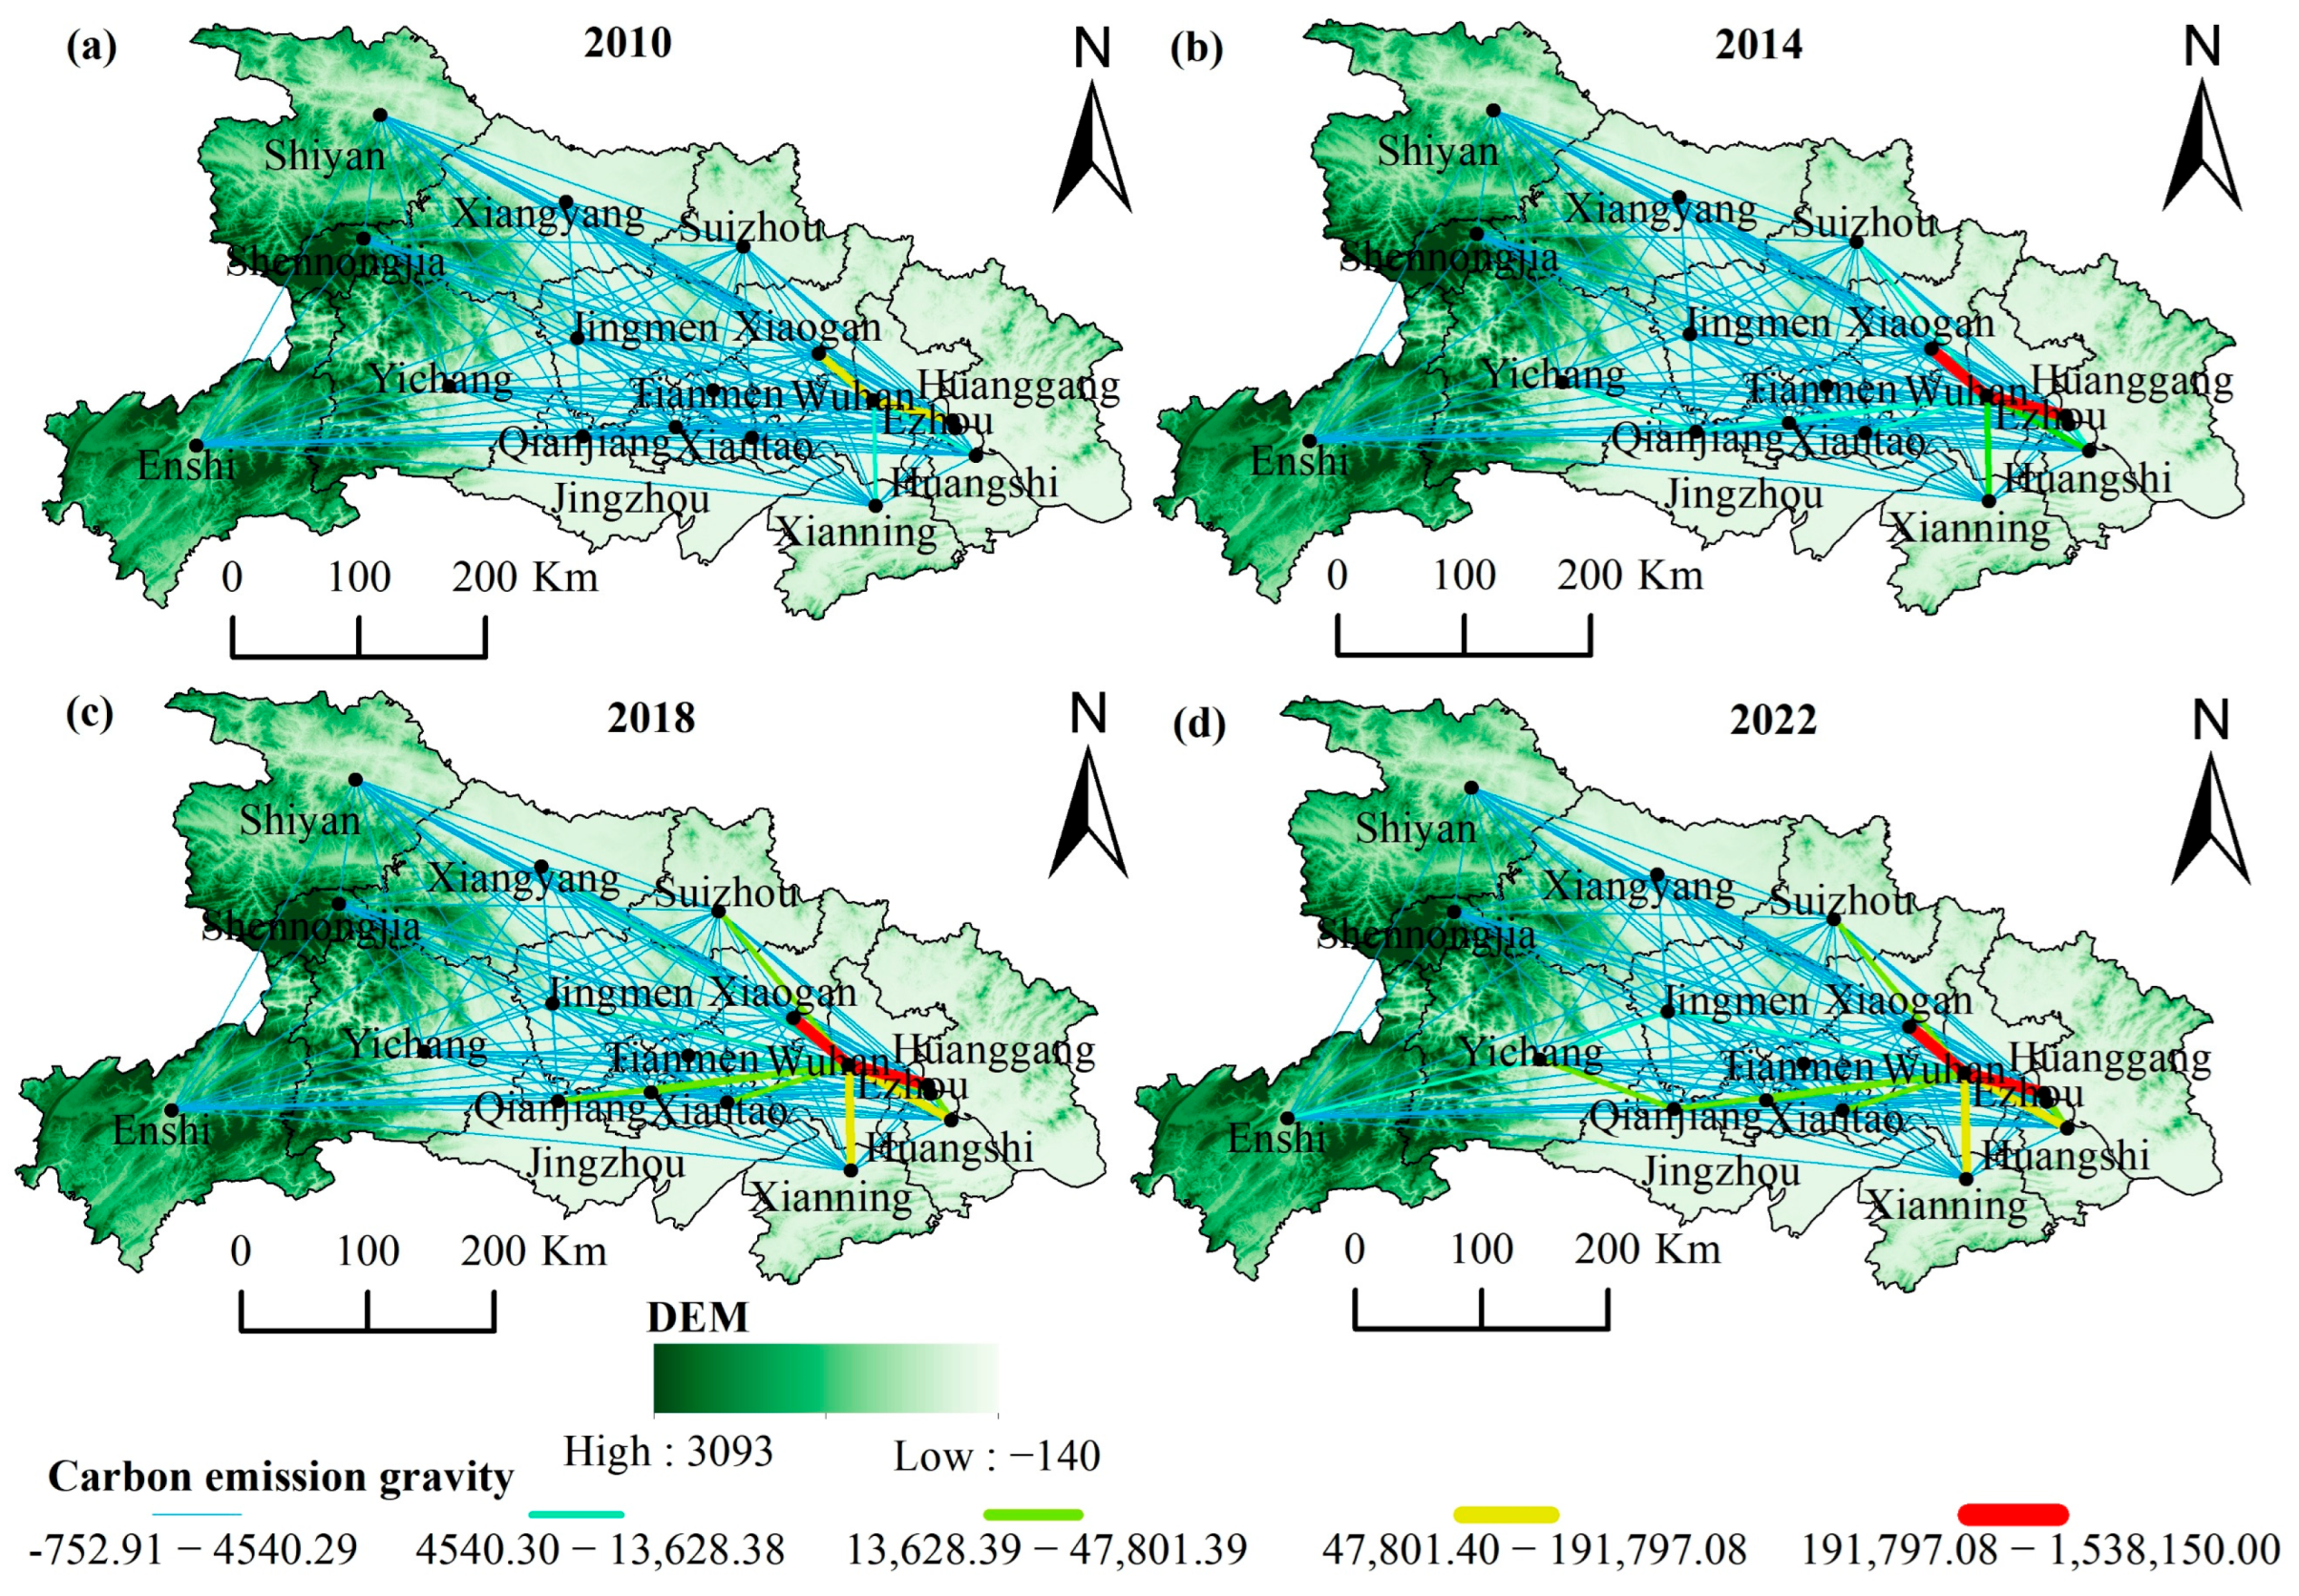
3.1.3. Spatial Change Characteristics of LUCEs

Figure 6 illustrates the spatiotemporal dynamics of LUCEs, showing an upward trajectory in net emissions across most cities, with Wuhan consistently standing out as the dominant emitting city. Spatially, high carbon-emitting cities are mainly concentrated in the central part of Hubei Province, including Wuhan, Yichang, Huanggang, Huangshi, and Ezhou. These areas are characterized by well-developed manufacturing and transportation sectors and rapid urbanization, which have led to increased energy consumption from construction, transport, and residential sectors, thereby driving carbon emissions. In contrast, cities with strong carbon sink capacities are mostly located in ecologically advantageous areas such as Enshi, Shennongjia Forest District, Shiyan, Jingmen, and Tianmen. These regions possess large areas of forest, cropland, and water bodies, providing a strong ecological foundation for carbon sequestration. From 2010 to 2022, the lowest carbon source emission occurred in Shennongjia Forest District in 2019 (3.840 × 10⁴ tons), and the highest in Wuhan in 2016 (18.887 × 10⁶ tons). The lowest carbon sink was recorded in Shennongjia in 2022 (2.144 × 10⁵ tons), while the highest appeared in Xiangyang in 2012 (5.980 × 10⁶ tons). Net carbon emissions ranged from a minimum of −1.789 × 10⁵ tons in Shennongjia in 2019 to a maximum of 17.093 × 10⁶ tons in Wuhan in 2016. Wuhan’s net carbon emissions were significantly higher than those of other cities, forming a distinct peak and indicating that its carbon emissions far exceed its carbon sink capacity. This disparity underscores Wuhan’s dominant role as a carbon source center in the region and highlights the urgency of city-level mitigation policies. In contrast, ecologically rich regions such as Shiyan, Enshi, and Shennongjia exhibited low or even negative net carbon emissions, demonstrating strong carbon sink performance.

3.2. Spatial Distribution of LUCEs and Evolutionary Analysis of Gravity Networks

The structural evolution of the LUCE spatial association network in Hubei Province from 2010 to 2022 is illustrated in Figure 7. Over this period, intercity gravitational values increased steadily, indicating a growing intensity of spatial interactions in carbon emissions. Strong linkages were observed between city pairs such as Huanggang–Ezhou, Wuhan–Huanggang, and Wuhan–Xiaogan. In recent years, cities within the Wuhan metropolitan area have actively expanded their transportation infrastructure, including expressways such as Wuhan–Ezhou, Wuhan–Huangshi, and Wuhan–Yangxin, thereby enhancing intercity connectivity. This improved accessibility has facilitated industrial chain integration and the flow of resources. Peripheral cities have increasingly absorbed industrial spillovers from Wuhan, accelerating their urbanization and contributing to LUCE growth.
As shown in Figure 8, the overall LUCE spatial association network exhibits a clear “core–periphery” structure. Wuhan serves as the central hub, maintaining strong carbon emission linkages with adjacent cities such as Huanggang, Ezhou, and Xiaogan, thereby forming a regional carbon emission cluster. Huanggang and Ezhou have gradually emerged as secondary centers, developing close sub-network ties with both Wuhan and other surrounding cities. In contrast, peripheral cities such as Shennongjia and Qianjiang, characterized by smaller economic scales and limited land-use changes, display lower gravitational values and weaker connectivity with the core cities, reflecting their marginalized positions within the network.

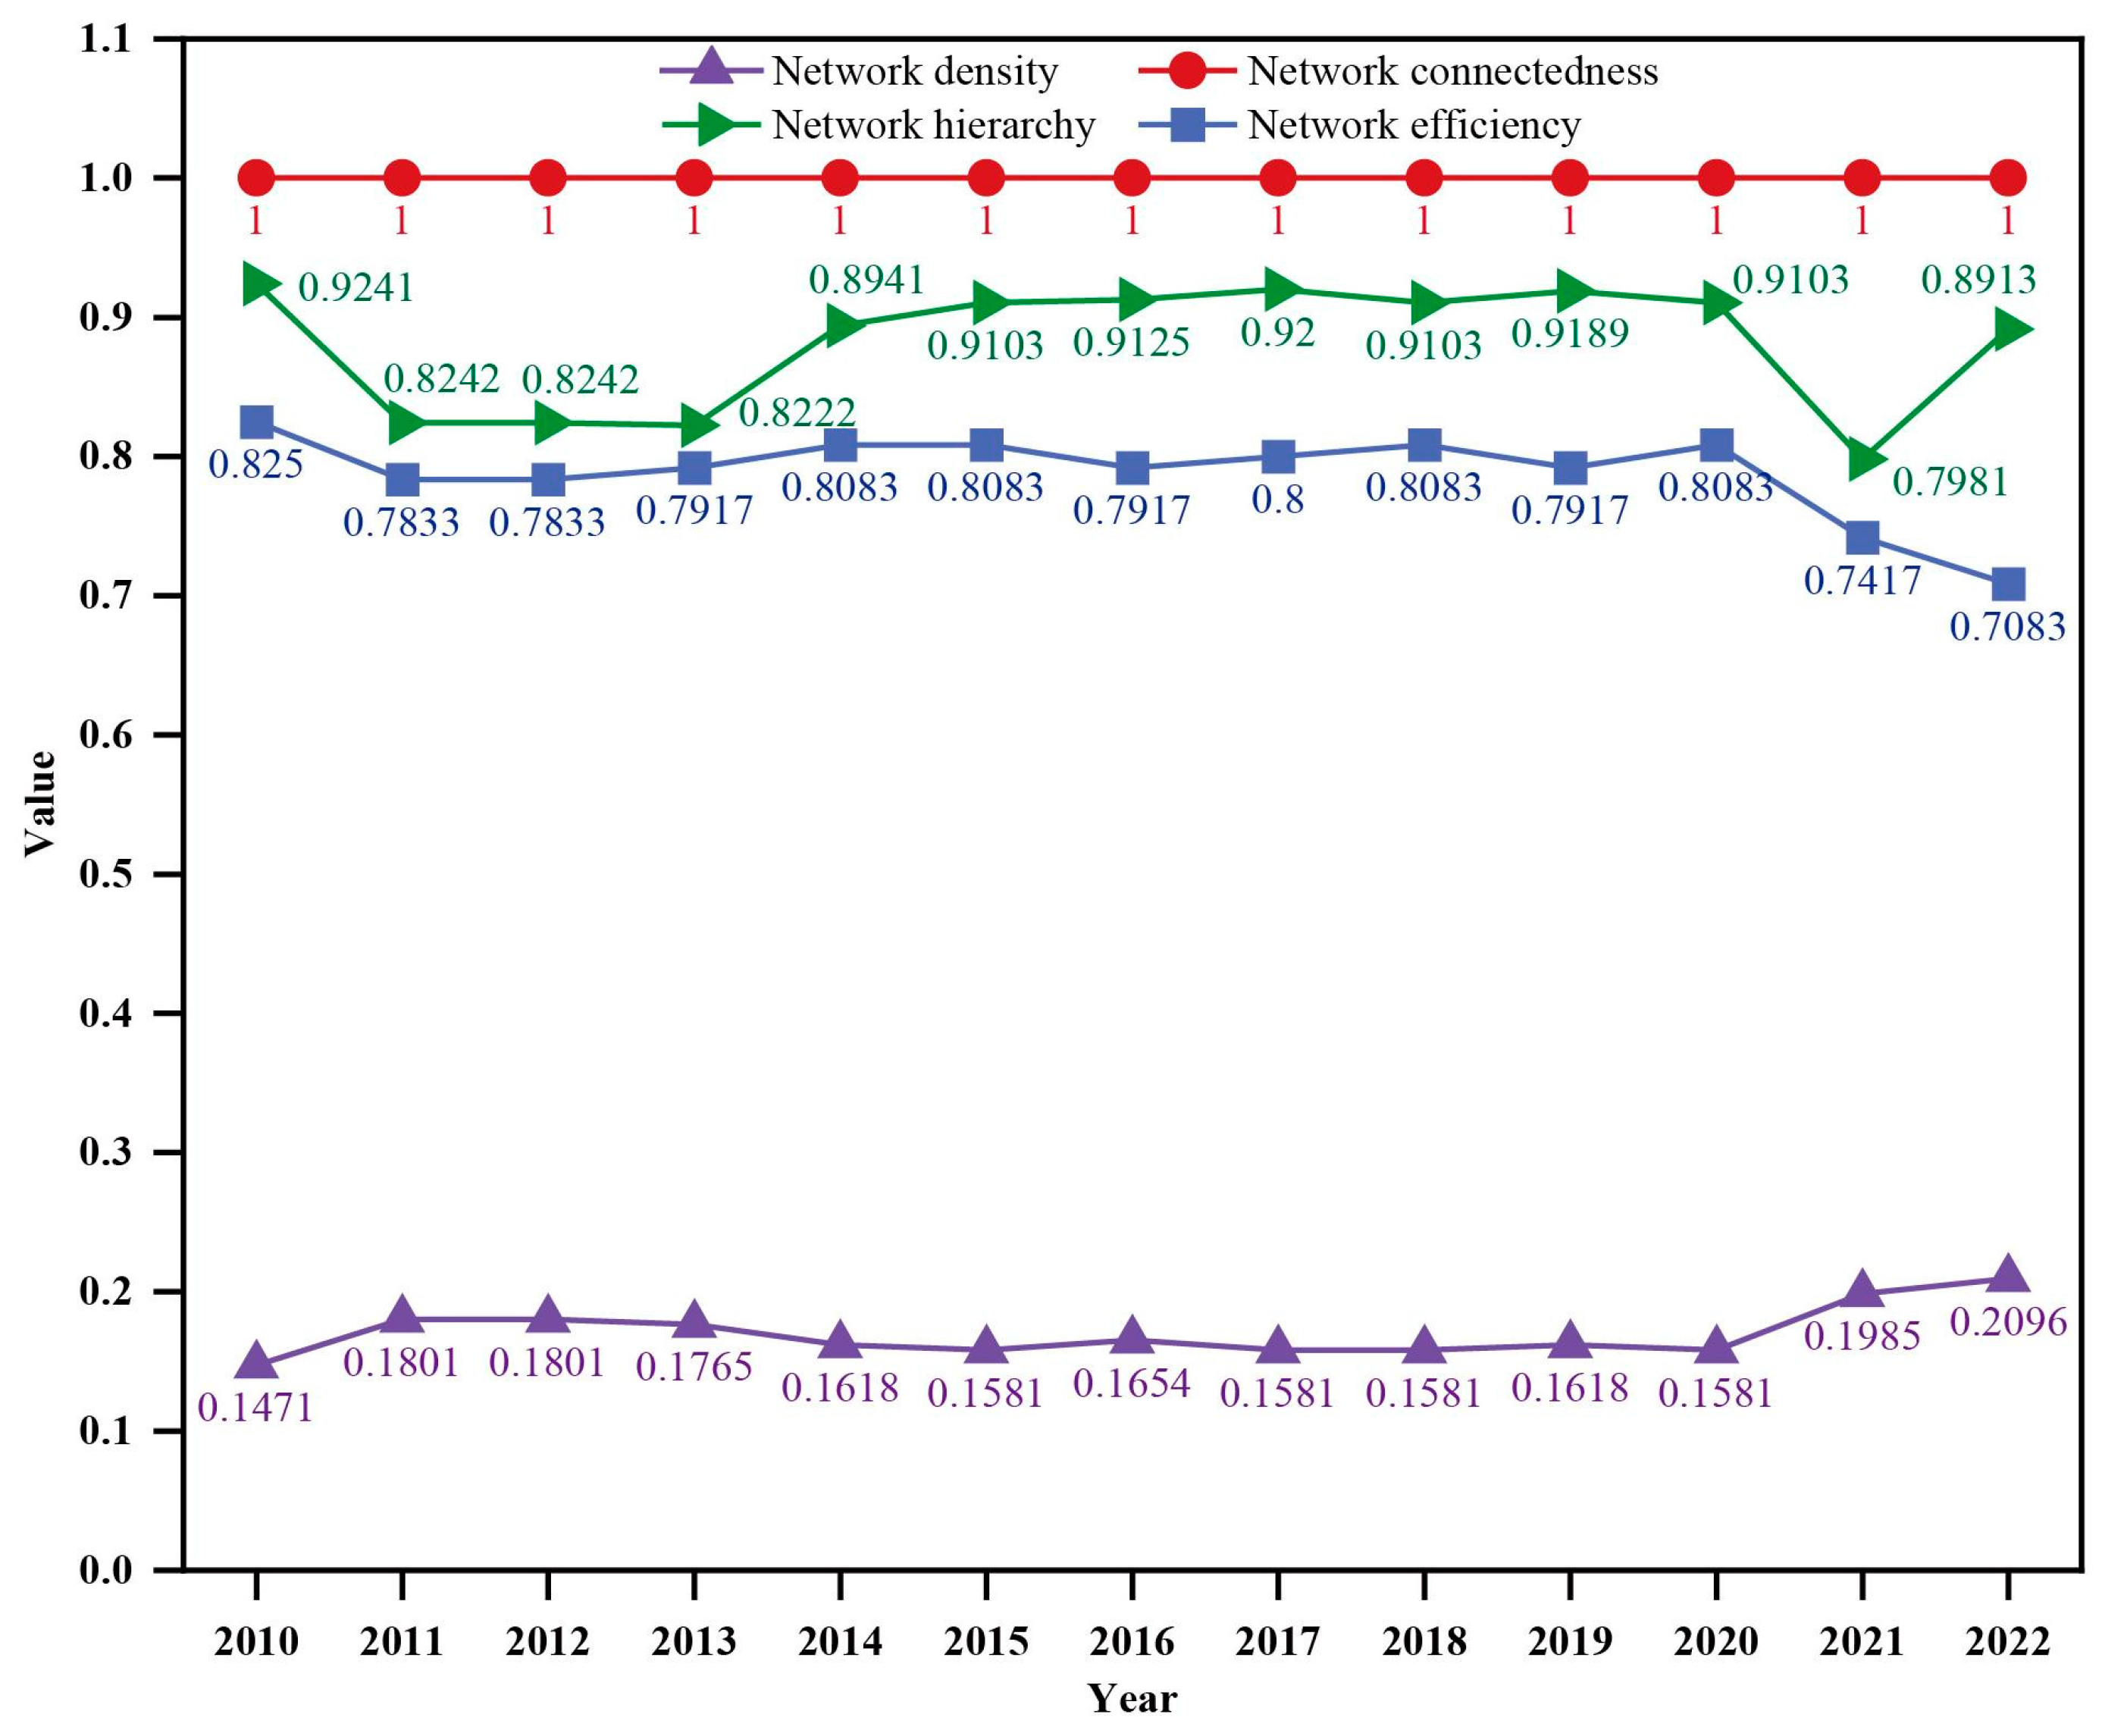
3.2.1. Overall Network Characteristics

As shown in Figure 9, the LUCE spatial association network exhibited increasing integration and structural complexity from 2010 to 2022. Network density rose from 0.1471 to 0.2096, indicating stronger intercity LUCE connections. Network connectedness remained consistently at 1, reflecting a stable overall structure. Network efficiency declined from 0.825 to 0.7083 over the same period, implying reduced direct connections and increased reliance on intermediary nodes. This may be attributed to land-use policy implementation that elevated the bridging role of certain cities, thereby increasing network complexity.

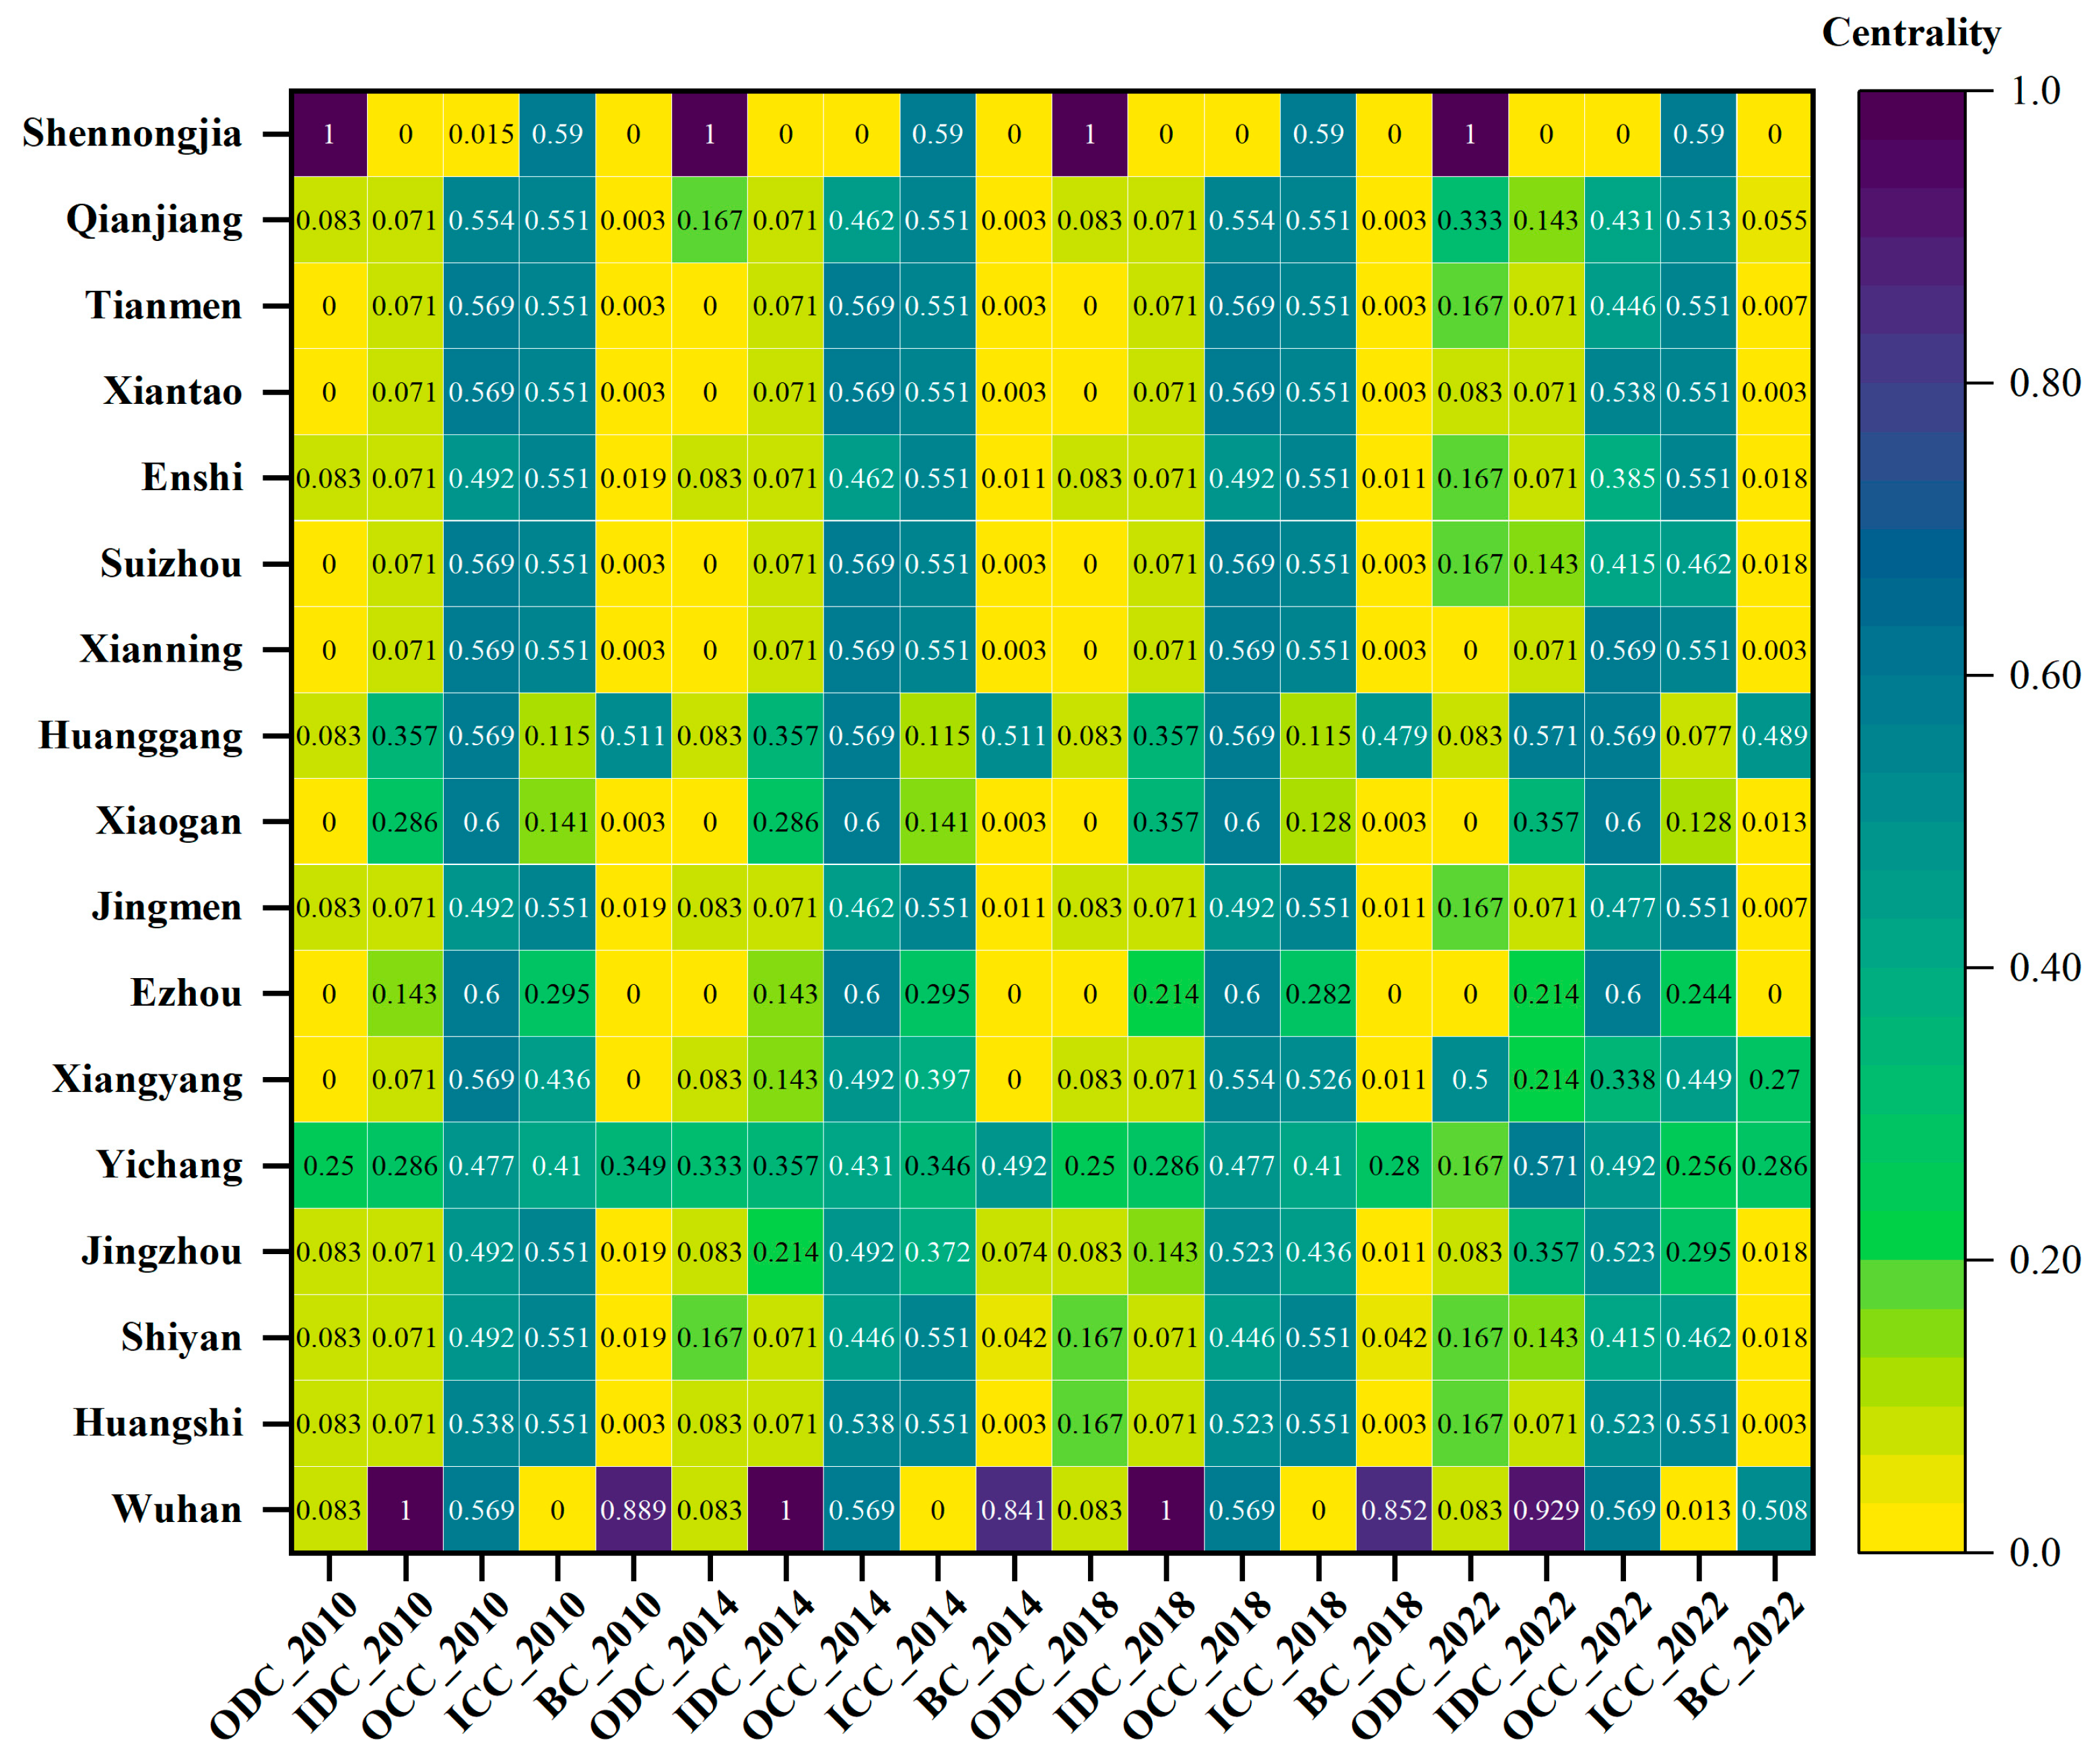
3.2.2. Individual Network Characteristics

The individual network characteristics are shown in Figure 10. Given the network’s directionality, both degree and closeness centrality are further divided into in and out measures.
In-degree centrality reflects the extent to which a city receives LUCEs from other cities. Cities with high in-degree centrality are typically located at the network core and correspond to regions with elevated LUCE values. Economically advanced cities such as Wuhan, Huanggang, Yichang, and Jingzhou rank high in in-degree centrality, indicating their central positions in the LUCE spatial network as major recipients of external LUCE spillovers. Out-degree centrality reflects a city’s capacity to export LUCEs to other nodes within the network. Cities with high out-degree centrality are often situated adjacent to major carbon-emitting agglomerations. For instance, Shennongjia demonstrates relatively high out-degree centrality, likely due to its abundant ecological resources and low demand for LUCE absorption, positioning it as a key LUCE-exporting region.
Closeness centrality, defined as the inverse of the average shortest path distance to all other nodes, indicates a city’s overall accessibility within the network. Cities such as Shennongjia, Xiantao, Xianning, and Huangshi exhibit high in-closeness centrality, reflecting favorable ecological conditions and strategic positions that may enable them to serve as responsive hubs for regional low-carbon policies. Under the framework of low-carbon urban transitions, these cities are well-positioned to lead emission reduction efforts and influence broader LUCE governance. In contrast, cities such as Ezhou and Xiaogan show high out-closeness centrality, suggesting limited access to external resources such as technology, capital, and skilled labor, as well as weak responsiveness to LUCE dynamics in other cities. These cities tend to occupy passive positions in the spatial network and may require targeted support to enhance their integration and adaptive capacity.
Betweenness centrality reflects a city’s role as an intermediary or conduit in facilitating indirect LUCE linkages among other city pairs. Cities with high in-degree or betweenness centrality—such as Wuhan and Huanggang—serve as dominant nodes for both LUCE reception and network bridging. These cities exert substantial influence over the allocation of strategic resources, including R&D personnel, technological investment, industrial relocation, and low-carbon technologies. Their strong capacity to build cooperative ties with surrounding cities, coupled with high carbon emission volumes and flows, positions them as ideal candidates for pilot carbon trading schemes, with significant implications for intercity LUCE dynamics. In contrast, Shennongjia, due to its remote location and ecological conservation orientation, remains peripheral in the network, exhibiting limited connectivity and influence.

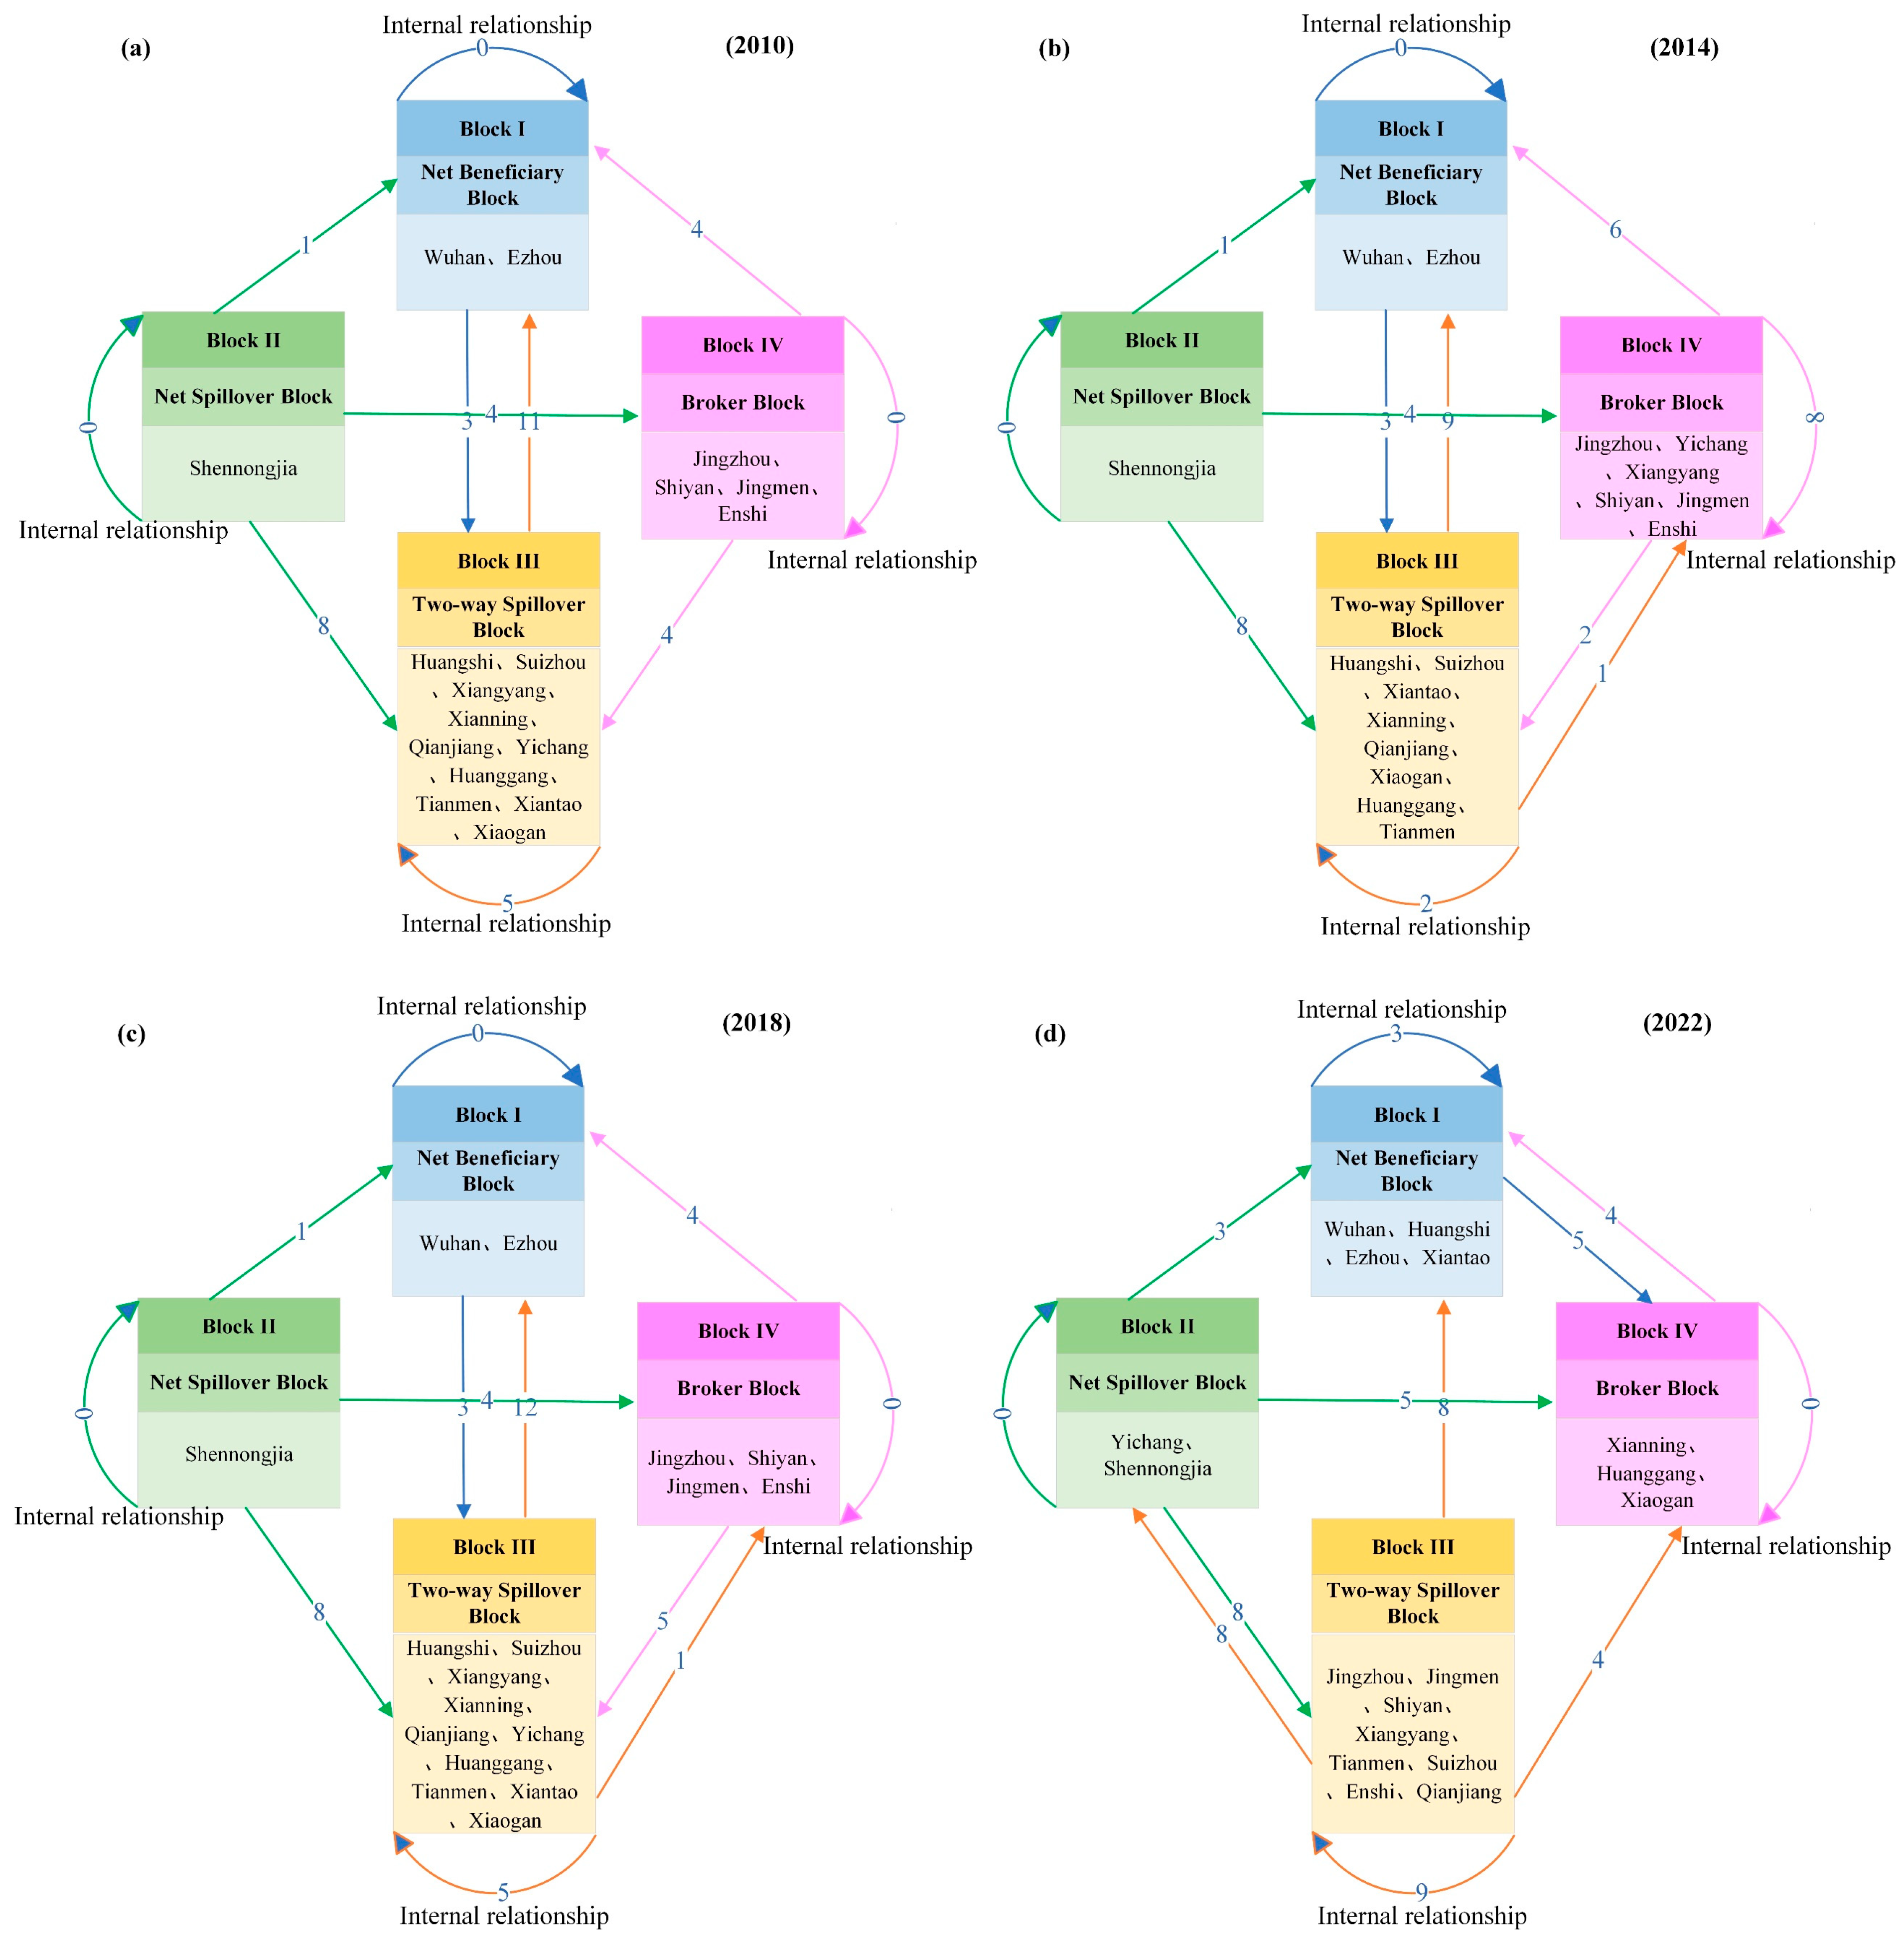
3.3. Cluster Analysis of LUCE Network

The 17 cities in Hubei Province were divided into four functional blocks based on block model study (see Figure 11). From 2010 to 2018, the net beneficiary block consisted of Wuhan and Ezhou. Owing to their active economic activities and dominant positions within the LUCE network, these cities absorbed a substantial amount of LUCEs from surrounding regions. By 2022, Huangshi and Xiantao were incorporated into this block, increasing the number of member cities from two to four, while the internal connection ratio rose from 0% in 2010 to 37.5% in 2022. From 2010 to 2018, the net spillover block included only Shennongjia; however, Yichang joined the block in 2022. The number of cities in the bidirectional spillover block decreased from ten in 2010 to eight in 2022, with the proportion of internal connections slightly declining from 31.25% to 31.03%, the bidirectional spillover block saw a slight reduction in membership, possibly indicating a shift toward more independent carbon governance in some cities. The broker block also experienced significant restructuring. Jingzhou, Shiyan, Jingmen, and Enshi were gradually replaced by Xianning, Huanggang, and Xiaogan; therefore, the newly emerged brokers may be playing pivotal roles in facilitating regional LUCE flows through mechanisms such as carbon trading, industrial cooperation, or green development initiatives.

3.4. Network Prediction of LUCE

Potential intercity carbon emission linkages in Hubei Province were estimated using link prediction algorithms based on the 2022 LUCE spatial association network (see Figure 12). The cumulative probabilities of potential link formation between each pair of cities were normalized to a range between 0 and 1. Higher probability values indicate a greater likelihood of future carbon emission linkages emerging between corresponding city pairs.
According to the common neighbors (CNs) index, future LUCE linkages between cities in eastern and western Hubei appear relatively more likely. Among them, Huangshi shows a comparatively high potential for forming new connections, with notable probabilities linked to nine other cities. Ezhou and Xiaogan follow closely, each associated with five potential linkages. The Jaccard index also suggests relatively strong LUCE connection probabilities for city pairs such as Xianning–Huangshi and Ezhou–Jingmen, both registering scores of 0.76. Furthermore, the resource allocation (RA) index indicates that the potential linkage between Shennongjia and Wuhan (RA = 0.78) warrants particular attention, as it may reflect an emerging spatial interaction between ecological and urban nodes. These observations point to the value of exploring integrated governance frameworks that connect forest carbon sinks with urban emission reduction strategies. The development of carbon compensation and trading mechanisms between ecological zones and high-emission urban areas may contribute to more balanced and coordinated regional carbon governance.

3.5. Carbon Balance Zoning for Land Use

To complement the block-level structural classification, we further identified three functional city types based on node-level centrality metrics. While the block model, which is informed by structural equivalence theory, groups cities according to similar LUCE linkage patterns (e.g., net spillover, brokers, and beneficiaries), the functional classification emphasizes individual influence by leveraging centrality measures such as in-degree, betweenness, and closeness. The former captures intergroup structural positioning, whereas the latter highlights node-specific functional roles. Although certain overlaps exist between the two approaches, they serve distinct analytical purposes and offer complementary perspectives on the spatial dynamics of LUCEs. Accordingly, this study integrates network centrality metrics, block classifications, and carbon balance indicators to categorize the 17 prefecture-level cities in Hubei Province into six carbon balance zones and three functional city types (see Table 3 and Figure 13).
The broker block maintains both sending and receiving relationships with other blocks and functions as an intermediary within the spatial LUCE network. Accordingly, it is designated as the “interactive zone” in the low-carbon governance zoning framework. The net beneficiary block demonstrates high demand for economic resources, energy, and carbon-intensive goods, leading to frequent connections with other blocks. As it predominantly receives carbon spillovers, this block is defined as the “core zone”, representing key urban areas with intensive LUCE inflows. In contrast, the net spillover and two-way spillover blocks are characterized by abundant natural resources and relatively limited emission reduction obligations. These cities tend to attract energy-intensive and carbon-intensive industries, thereby potentially generating a “pollution haven” effect. These blocks are thus conceptualized as the “base zone” of the low-carbon governance structure, serving as the spatial foundation for regional emission redistribution and ecological buffering.
Wuhan forms the core green transition zone, marked by the highest carbon emissions and limited ecological capacity. As a net beneficiary city, it assimilates LUCEs from its environment, exacerbating its mitigation responsibilities. The efficacy of its low-carbon governance relies on regional cooperation and governmental endorsement. Huangshi and Ezhou constitute the core comprehensive optimization zone, combining limited carbon sinks with modest economic output. These cities, though also net beneficiaries, require targeted policy interventions and are suitable as priority governance pilots. The base low-carbon retention zone includes Shiyan, Yichang, Xiangyang, Tianmen, Qianjiang, and Shennongjia, featuring strong ecological and economic capacities (ECC and ESC > 1). These cities serve as anchors for ecological transitions and regional diffusion of low-carbon practices. Xiaogan, Huanggang, and Xianning, as part of the interactive economic development zone, serve as transitional nodes with broker functions, supporting regional integration and acting as industrial transfer hubs linked to Wuhan.

3.6. Influencing Factors of the Spatial Association Network of LUCE

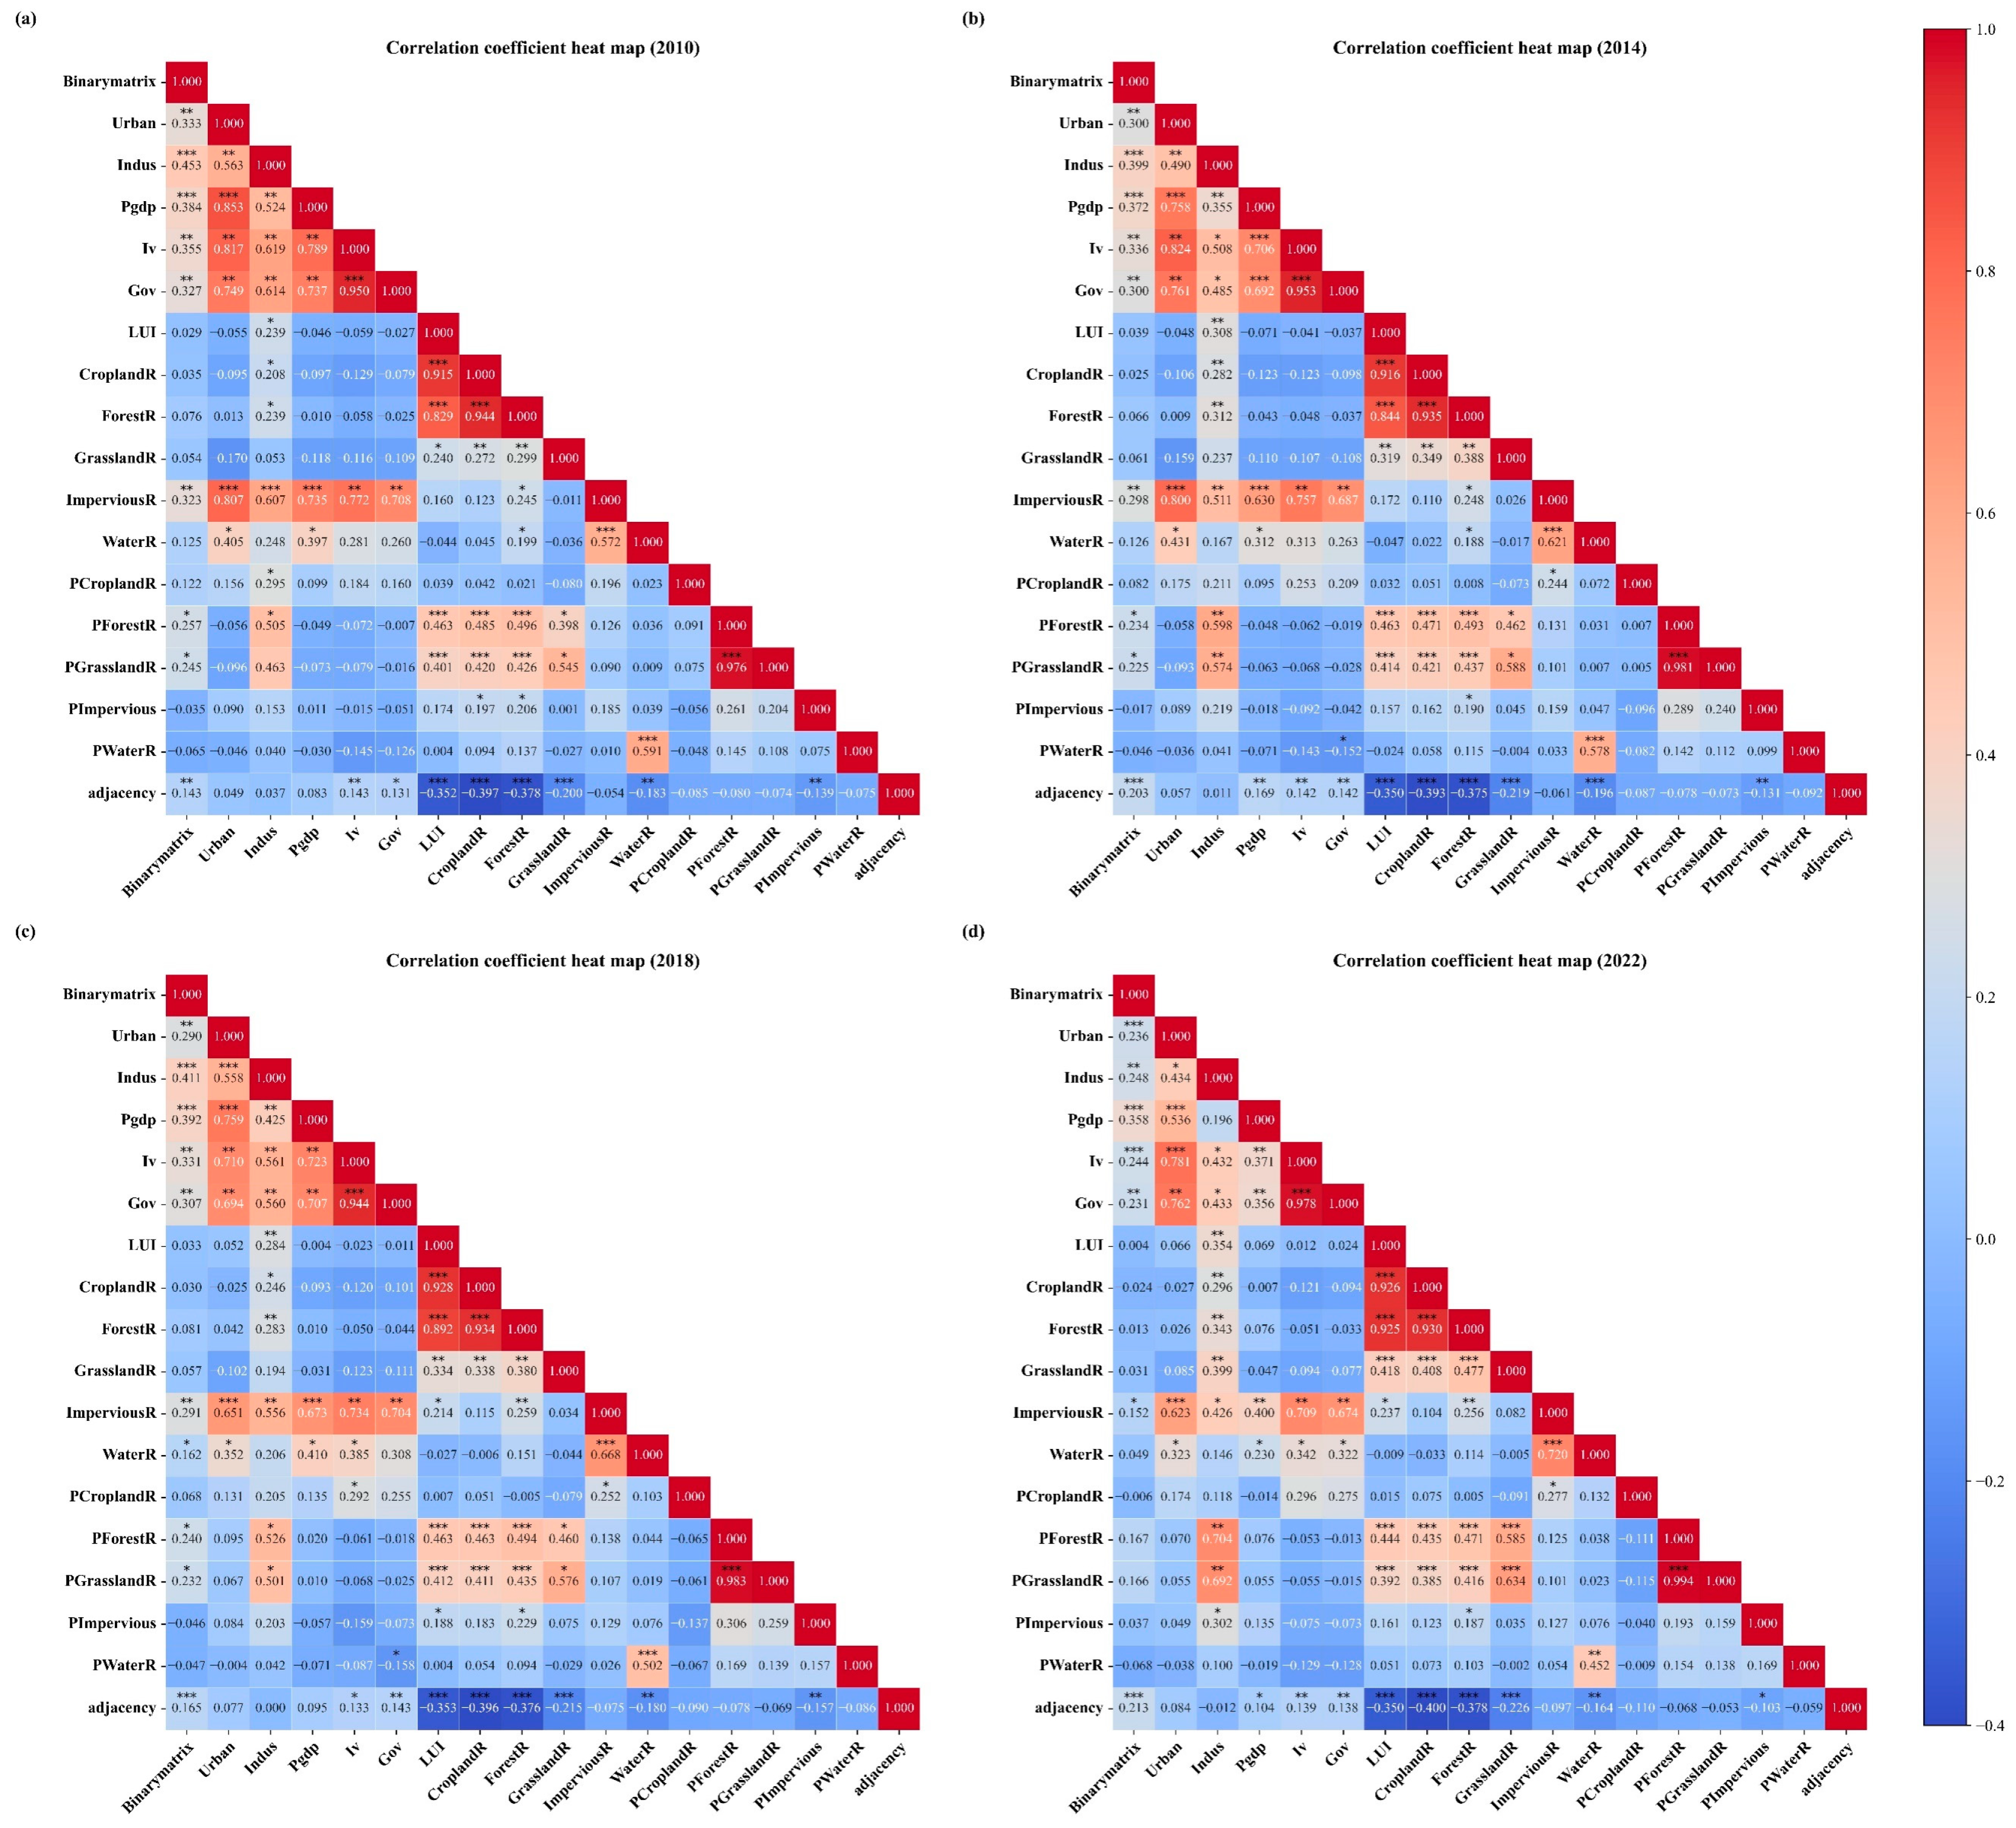
3.6.1. The QAP Correlation Analysis

Prior to conducting the QAP regression, this study employed QAP correlation analysis to identify the principal determinants of LUCE spatial associations. As shown in Figure 14, the variables Urban, Indus, Pgdp, Adjacency, IV, Gov, ImperviousR, PGrasslandR, and PForestR were found to be statistically significant at the 10% level. Variables that did not exhibit statistical significance were excluded from the subsequent regression analysis.

3.6.2. QAP Regression Analysis

Based on the QAP correlation results and established selection criteria [72,83], ten significant variables were retained for regression analysis. The results are shown in Figure 15.
The variable adjacency is consistently positive and statistically significant (p < 0.01) across all years, suggesting that geographical proximity tends to be associated with stronger LUCE spatial linkages. This pattern may reflect lower transaction costs and enhanced spatial spillovers among neighboring regions, which could facilitate similar carbon emission dynamics [45,71]. Pgdp shows consistently positive and significant associations (p < 0.01), suggesting that intercity economic disparities may correspond with more extensive LUCE connectivity, possibly due to development asymmetries and regional economic interdependence [37]. Iv demonstrates positive and significant associations in 2010, 2014, and 2022, implying that technological differentiation may be linked with cross-regional emission patterns, potentially due to varying capacities for industrial upgrading or carbon mitigation. Urban exhibits negative and statistically significant coefficients in multiple years, suggesting that cities with similar levels of urbanization are more likely to exhibit spatial LUCE connections. Gov is negatively and significantly associated with LUCE connectivity, especially in earlier years. This may indicate that greater fiscal alignment between cities is associated with more integrated carbon emission networks. Indus shows positive and significant associations in 2010, 2014, and 2018, indicating that industrial heterogeneity may correspond with stronger LUCE associations. ImperviousR becomes significant in 2018 and 2022 with a negative coefficient, suggesting that greater similarity in land development intensity is associated with increased LUCE connectivity. WaterR, PForestR, and PGrasslandR generally exhibit non-significant coefficients, implying that ecological land-use differences do not show consistent statistical associations with LUCE network formation during the study period.

4. Discussion

This research employed kernel density estimation (KDE), social network analysis (SNA), and link prediction methods to explore the structural characteristics of the LUCE spatial association network and to estimate potential intercity carbon emission linkages in Hubei Province. Based on the network structure, as well as the economic contribution coefficient (ECC) and the ecological support coefficient (ESC), a carbon balance zoning framework was proposed to reflect differentiated carbon emission and absorption capacities across the region. In addition, this study applied the quadratic assignment procedure (QAP) regression to examine the influencing factors of LUCE spatial associations, aiming to enhance the objectivity of variable selection and contribute to the ongoing development of complex network research in the LUCE field.
The LUCE network in Hubei exhibits a core–periphery structure, with Wuhan serving as the principal hub and Huanggang and Ezhou as subordinate nodes [20,84]. Peripheral cities such as Shennongjia and Qianjiang, despite their limited connectivity, present carbon sink potential and may acquire strategic significance via offset or compensation methods [85]. The post-2020 decline in network efficiency suggests increasing fragmentation in carbon linkages. To improve governance outcomes, policy emphasis should shift from isolated mitigation efforts toward coordinated, network-based strategies that address intercity spillovers and ensure equitable carbon reductions [15]. Unlike prior LUCE studies, this research combines economic and ecological indicators with block model outputs to classify urban carbon zones [15,56], The framework links emission patterns with spatial roles, supporting zone-specific governance strategies.
To explore the potential evolution of LUCE spatial associations, this study applied three classical link prediction algorithms: common neighbors (CNs), Jaccard, and resource allocation (RA). These algorithms evaluate the similarity between node pairs based on topological features and have been widely adopted in ecological efficiency, carbon emissions reduction connections, and green technology innovation networks [46,47,73]. Their scientific value lies in the ability to uncover latent connections that are not directly observable but can be inferred through structural patterns. The application of these algorithms provides further insight into the potential expansion of the LUCE network. In this study, the CN index indicates that eastern cities are likely to form new carbon linkages with central and western counterparts. The Jaccard index highlights the proximity of Xianning to cities with similar industrial structures (e.g., Ezhou, Huangshi), supporting collaborative low-carbon transitions. Notably, the RA index predicts a future connection between Wuhan and the Shennongjia Forest District, with a high score of 0.78. This likely reflects complementary ecological and economic attributes between the two areas and implies a strategic opportunity to design an integrated governance mechanism that connects urban carbon sources with forest-based carbon sinks. The integration of link prediction into urban planning tools may enhance forward-looking policy simulation and improve the spatial coordination of carbon mitigation efforts. However, several limitations of traditional link prediction methods must be acknowledged. First, most algorithms are based on static network assumptions and do not incorporate temporal dynamics, such as policy interventions, technological innovation, or land-use change. As Lü and Zhou (2011) observed, static models may fail to capture the evolution of complex spatial systems [86]. Second, common algorithms such as CN and Jaccard prioritize local topological similarity, which may overlook long-distance or institutional interactions driven by administrative coordination or market mechanisms [74]. Third, link prediction results are sensitive to network construction parameters, including threshold settings, time window selection, and network density, which may affect the stability and generalizability of predictions [87,88].
The QAP regression results reveal that LUCE network connectivity is positively associated with economic disparities, which may reflect the tendency of more developed cities to attract greater volumes of energy, labor, and material resources. Geographic proximity is significantly associated with LUCE connectivity [45,71]. The negative coefficient for urbanization rate differences indicates that greater similarity in urban development levels among cities is associated with stronger carbon emission linkages [71,89]. Disparities in government expenditure show a significant negative association with LUCE connectivity, which may correlate with cities’ ability to jointly pursue carbon reduction objectives [90]. In such contexts, firms may be more likely to adopt long-term emission reduction strategies aligned with government environmental expectations [91]. Interestingly, in contrast to previous county-level studies, this analysis finds a positive association between technological innovation disparities and LUCE connectivity at the prefecture level [61]. One possible explanation lies in the industrial composition of cities in Hubei, where sectors such as manufacturing and transportation are dominant. Innovations in these fields often involve energy efficiency improvements and industrial upgrading, which may lead to increased carbon flows and stronger intercity linkages [92]. By contrast, technological innovation at the county level tends to center on green agriculture or ecological management, which generally exhibits limited spatial spillover effects and thus shows weaker associations with LUCE network formation [10].
Despite its contributions, this study has several limitations that warrant consideration. First, the analysis does not fully explore node-level structures or clustering dynamics, which are essential for capturing the complexity of intercity carbon relationships. Future research could incorporate temporal network models or dynamic block modeling to better capture structural evolution and regional coordination mechanisms [47]. Second, due to methodological constraints and limited data granularity, this study focuses solely on the prefecture-level scale. Expanding the analysis to the county level in future work may yield more precise and context-sensitive policy insights. Third, the carbon balance zoning framework proposed in this study relies on a comparative evaluation of the economic contribution coefficient (ECC) and the ecological support coefficient (ESC), which may introduce a degree of subjectivity [19]. To enhance classification robustness, future studies are encouraged to apply machine learning clustering algorithms or multi-criteria decision-making approaches to better distinguish functional carbon roles among cities [32,51].
While the proposed governance strategies are grounded in empirical network structures and spatial zoning frameworks, their implementation may face considerable challenges due to differences in administrative capacity among cities. Advanced approaches such as real-time LUCE monitoring, regional carbon trading systems, and interjurisdictional collaboration require strong institutional support, technical capabilities, and stable financial resources. However, many cities, especially those in peripheral areas, may not yet possess the necessary infrastructure or coordination mechanisms to support these complex initiatives. Additional barriers may include overlapping government responsibilities, limited coordination across departments, and a lack of consistent policy guidance. These institutional constraints can hinder the effectiveness of policy delivery and delay the intended impacts. To address these issues, it is important to promote a phased and flexible approach to policy implementation. This includes prioritizing pilot programs in cities with stronger governance readiness, providing capacity-building support to less prepared regions, and encouraging collaborative learning among municipalities.

5. Conclusions and Policy Implications

5.1. Conclusions

This study first constructed a spatial correlation network of LUCEs in Hubei Province using an improved gravity model. Subsequently, social network analysis and link prediction techniques were employed to examine the structural characteristics and potential evolution of the LUCE network. Based on the network topology, a carbon balance zoning framework was proposed by integrating network properties with the economic contribution coefficient (ECC) and ecological support coefficient (ESC). Finally, a quadratic assignment procedure (QAP) regression was conducted to identify the key socioeconomic, ecological, and land-use factors driving the formation of spatial LUCE linkages. The main findings of this study are as follows:
Firstly, LUCEs in Hubei Province have shown a consistent upward trend from 2010 to 2022, with total carbon emissions increasing faster than carbon sinks, leading to widening carbon deficits in core urban areas. Spatial heterogeneity is evident, with high-intensity emissions concentrated in cities such as Wuhan, Huanggang, and Xiangyang, while ecological regions such as Shennongjia and Enshi act as important carbon sinks.
Secondly, the LUCE network exhibits a stable core–periphery structure, Wuhan serves as the core node of the LUCE network, with Huanggang, Ezhou, and Xiaogan acting as secondary hubs. Peripheral cities such as Shennongjia and Qianjiang exhibit weaker connections. Over time, the network’s complexity has increased, characterized by growing density and rising dependence on intermediary cities. In terms of link prediction, the CN index suggests that Huangshi, Ezhou, and Xiaogan are likely to become emerging active nodes. The Jaccard index identifies strong linkage potential between Xianning and Huangshi, Ezhou, and Jingmen. The RA index indicates promising collaborative emission reduction opportunities between Shennongjia and Wuhan.
Thirdly, by combining node-level centrality with block model roles, cities were classified into three functional types: core cities, bridge cities, and action cities. Then, this study further developed a carbon balance zoning framework by integrating block model classifications with two key indicators: the economic contribution coefficient (ECC) and the ecological support coefficient (ESC). As a result, the 17 prefecture-level cities were categorized into six distinct governance zones: core green transition zone (Wuhan), core comprehensive optimization zone (Huangshi and Ezhou), base low-carbon retention zone (Shiyan, Yichang, Xiangyang, Tianmen, Qianjiang, and Shennongjia), base economic development zone (Jingzhou, Jingmen, Suizhou, and Enshi), linkage-economic development zone (Xiaogan, Huanggang, and Xianning), and core low-carbon retention zone (Xiantao).
Finally, the QAP regression results reveal that disparities in technological innovation capacity, industrial structure, and per capita GDP are positively and significantly associated with LUCE connectivity. Similarities in urbanization rates, government expenditure, and construction land intensity also show positive correlations with the formation of LUCE spatial networks. In contrast, ecological variables such as differences in water area, grassland, and forest cover do not exhibit statistically significant associations with LUCE connectivity during the study period.

5.2. Policy Implications

This study proposes the following policy implications based on its key findings:
Firstly, low-carbon policy design should consider both geographical proximity and each city’s role within the LUCE spatial network [47]. Core cities like Wuhan and Huanggang must take the initiative in promoting low-carbon technology, coordinating regional carbon trading, and implementing ecological compensation frameworks. Integrating these initiatives with the Yangtze River Protection and Green Development Strategy will facilitate intercity platforms for carbon quota trading and ecological goods markets.
Secondly, to improve the scientific foundation for low-carbon spatial planning, Hubei Province should establish a comprehensive LUCE monitoring and early warning platform utilizing its existing “One Map” natural resource infrastructure. The system must integrate remote sensing, terrestrial observations, and predictive modeling to encompass various land types, including construction, agricultural, forest, and ecological areas. The integration of big data and artificial intelligence can enhance the detection of high-emission regions and facilitate prompt policy modifications. Furthermore, the policymaking process should promote coordination among multiple stakeholders, including universities, research institutions, enterprises, and communities, to jointly develop land-use and carbon governance strategies. Such collaboration is essential to facilitating innovation diffusion and narrowing the intercity technological gap [37].
Thirdly, as one of the first provinces designated for low-carbon pilot programs in China, it is recommended that Hubei Province implement a classification-based strategy based on the carbon balance zoning framework and informed by the LUCE network structure. This approach would support the development of targeted governance strategies tailored to the specific characteristics of each city, thereby enhancing the overall effectiveness of regional low-carbon governance:
Core Green Transition Zone (Wuhan): Wuhan should take the lead in establishing regional carbon trading systems and integrating forest carbon sinks with urban emission reduction strategies. Given its technological and institutional capacity, Wuhan’s practices in green finance and low-carbon governance could serve as transferable models for other cities undergoing early-stage green transformation, such as Xianning and Huangshi. Moreover, cross-regional collaborations with ecological zones like Shennongjia in developing low-carbon tourism and sustainable supply chains should be strengthened.
Core Comprehensive Optimization Zone (Huangshi and Ezhou): As key industrial centers undergoing ecological transformation, Huangshi and Ezhou should prioritize restricting the expansion of high-emission industries such as steel, cement, and petrochemicals. A targeted transition toward low-carbon industries can be achieved through policy tools such as tax incentives, fiscal subsidies, and preferential green financing. Both cities are well-positioned to pilot advanced green building standards and circular economy practices, including zero-waste city models [93].
Base Low-Carbon Retention Zone (Shiyan, Yichang, Xiangyang, Tianmen, Qianjiang, and Shennongjia): This zone comprises ecologically significant cities with substantial forest and agricultural resources. It is recommended that cities such as Shennongjia and Yichang focus on enhancing forest-based carbon sink functions and developing ecological tourism, leveraging their rich natural landscapes and protected areas. Meanwhile, Xiangyang and Shiyan could advance ecological agriculture practices by collaborating with upstream cities to promote sustainable food production and land use. To further capitalize on ecological strengths, this zone could establish a regional ecological value transfer system, whereby cities with strong carbon sequestration capacity provide quantified emission allowances to high-emission cities. A pilot carbon credit mechanism based on regional carbon balance accounting is proposed to generate tradable certificates, transforming ecological services such as forest and farmland carbon sinks into measurable economic value [94].
Base Economic Development Zone (Jingzhou, Jingmen, Suizhou, and Enshi): Strictly control the expansion of construction land, improve land-use efficiency, and optimize industrial layout to support the development of low-carbon industries and the establishment of low-carbon industrial parks. Incorporate green GDP indicators into local government performance assessments. Promote interregional collaboration on low-carbon development projects. Expand financing options by leveraging green credit tools, land-use policy incentives, and preferential tax measures. Actively attract low-carbon manufacturing and high-tech enterprises to co-develop green industrial demonstration parks, thereby fostering scalable models of green industrial transformation [5,95].
Linkage-economic development zone (Xiaogan, Huanggang, and Xianning): Promote eco-tourism by establishing low-carbon tourism demonstration zones anchored in regional ecological and cultural assets. Develop cross-city tourism corridors and green service supply chains. Integrate digital platforms to support carbon footprint tracking and green certification of tourism activities, enhancing both sustainability and economic vitality.
Core Low-Carbon Retention Zone (Xiantao): Set clear agricultural emission reduction targets and introduce incentive mechanisms to support the adoption of low-carbon farming practices, including precision fertilization, water-saving irrigation, and organic agriculture. Further, optimize land-use allocation and crop structure by promoting the cultivation of leguminous crops to improve soil quality and enhance the ecological resilience of agricultural systems [18,95].
Finally, although the proposed zoning strategies reflect local carbon patterns and network structures, their implementation should be adapted to the governance capacities of local governments, which vary significantly across regions. In cities with limited technical or institutional readiness, more standardized and centralized instruments such as top-down emission control mandates, regulatory zoning, or performance-based environmental incentives may serve as transitional or complementary governance tools. These instruments can help maintain policy coherence while gradually building capacity for more decentralized and network-oriented approaches.

6. Patents

There are no patents resulting from the work reported in this manuscript.

Supplementary Materials

The following supporting information can be downloaded at: https://www.mdpi.com/article/10.3390/land14071329/s1, Table S1. Carbon sequestration coefficients for different land use types; Table S2. Economic coefficients, moisture content, and carbon absorption rates of major crops; Table S3. Carbon emission coefficients for agricultural activities on arable land; Table S4. Carbon emission coefficients from livestock and poultry respiration and excretion; Table S5. Grain-to-straw ratios and carbon emission coefficients from straw burning; Table S6. Conversion coefficients for standard coal equivalent and carbon emission factors of various energy types; Table S7. Indicators of overall network characteristics; Table S8. Indicators of individual network characteristics; Table S9. Block types and classification criteria in the LUCEs network; Table S10. Characteristics of carbon balance zones; Table S11. Identification and characteristics of key cities in the carbon emission network; Table S12. Influencing factors; Table S13. Density matrix and image matrix; Table S14. QAP regression analysis results in 2010; Table S15. QAP regression analysis results in 2014; Table S16. QAP regression analysis results in 2018; Table S17. QAP regression analysis results in 2022.

Author Contributions

Y.H.: writing—original draft, visualization, methodology, conceptualization; Z.W.: writing—review and editing, resources, methodology, funding acquisition; H.Z.: validation, resources, investigation; D.Y.: software, investigation, data curation; W.W.: conceptualization, investigation; Y.P.: supervision, visualization. All authors have read and agreed to the published version of the manuscript.

Funding

This research was funded by the National Social Science Fund of China (Grant No. 23BGL248).

Data Availability Statement

Data will be made available on request.

Acknowledgments

The authors have reviewed and edited the output and take full responsibility for the content of this publication.

Conflicts of Interest

Z.W. received funding from the National Social Science Fund of China, which supported the data collection and analysis. The funders had no influence on the interpretation of results or the decision to publish the manuscript. The authors declare no other conflicts of interest.

Abbreviations

The following abbreviations are used in this manuscript:
LUCELand-use carbon emissions
SNASocial network analysis
QAPQuadratic Assignment Procedure
ECCEconomic Contribution Coefficient
ESCEcological Support Coefficient

References

  1. Liu, M.; Chen, Y.; Wang, J. The Spatial Association Network and Driving Factors of Land Use Carbon Emission Efficiency in China: An Investigation in the National Major Strategic Regions. Resour. Sci. 2024, 46, 2462–2476. [Google Scholar] [CrossRef]
  2. Wang, C.; Liu, S.; Feng, T.; Liu, Y.; Liu, Y.; Hu, Z.; Yang, L.; Niu, Q.; Mao, X. Is the Assessment Approach of Sustainable Development Goal 11.3.1 Justified? Evidence from the Drivers of Future Urban Land Use Efficiency. J. Clean. Prod. 2024, 444, 141147. [Google Scholar] [CrossRef]
  3. UN. Transforming Our World: The 2030 Agenda for Sustainable Development: Resolution: Adopted by the General Assembly; UN: New York, NY, USA, 2015. [Google Scholar]
  4. Xia, C.; Chen, B. Urban Land-Carbon Nexus Based on Ecological Network Analysis. Appl. Energy 2020, 276, 115465. [Google Scholar] [CrossRef]
  5. Fan, M.; Wang, Z.; Xue, Z. Spatiotemporal Evolution Characteristics, Influencing Factors of Land Use Carbon Emissions, and Low-Carbon Development in Hubei Province, China. Ecol. Inform. 2024, 81, 102567. [Google Scholar] [CrossRef]
  6. Wang, Z.; Zhu, C. Does Urban Sprawl Lead to Carbon Emission Growth?—Empirical Evidence Based on the Perspective of Local Land Transfer in China. J. Clean. Prod. 2024, 455, 142319. [Google Scholar] [CrossRef]
  7. Liu, X.; Xu, H.; Zhang, M. The Effects of Urban Expansion on Carbon Emissions: Based on the Spatial Interaction and Transmission Mechanism. J. Clean. Prod. 2024, 434, 140019. [Google Scholar] [CrossRef]
  8. Wei, J.; Xia, L.; Chen, L.; Zhang, Y.; Yang, Z. A Network-Based Framework for Characterizing Urban Carbon Metabolism Associated with Land Use Changes: A Case of Beijing City, China. J. Clean. Prod. 2022, 371, 133695. [Google Scholar] [CrossRef]
  9. Jin, X.; Jiang, P.; Li, M.; Gao, Y.; Yang, L. Mapping Chinese Land System Types from the Perspectives of Land Use and Management, Biodiversity Conservation and Cultural Landscape. Ecol. Indic. 2022, 141, 108981. [Google Scholar] [CrossRef]
  10. Liu, C.; Hu, S.; Wu, S.; Song, J.; Li, H. County-Level Land Use Carbon Emissions in China: Spatiotemporal Patterns and Impact Factors. Sustain. Cities Soc. 2024, 105, 105304. [Google Scholar] [CrossRef]
  11. Schulp, C.J.E.; Nabuurs, G.-J.; Verburg, P.H. Future Carbon Sequestration in Europe—Effects of Land Use Change. Agric. Ecosyst. Environ. 2008, 127, 251–264. [Google Scholar] [CrossRef]
  12. Dumortier, J.; Elobeid, A. Effects of a Carbon Tax in the United States on Agricultural Markets and Carbon Emissions from Land-Use Change. Land Use Policy 2021, 103, 105320. [Google Scholar] [CrossRef]
  13. Meyfroidt, P.; Lambin, E.F.; Erb, K.-H.; Hertel, T.W. Globalization of Land Use: Distant Drivers of Land Change and Geographic Displacement of Land Use. Curr. Opin. Environ. Sustain. 2013, 5, 438–444. [Google Scholar] [CrossRef]
  14. Shirkey, G.; John, R.; Chen, J.; Kolluru, V.; Goljani Amirkhiz, R.; Marquart-Pyatt, S.T.; Cooper, L.T.; Collins, M. Land Cover Change and Socioecological Influences on Terrestrial Carbon Production in an Agroecosystem. Landsc. Ecol. 2023, 38, 3845–3867. [Google Scholar] [CrossRef]
  15. Huang, H.; Jia, J.; Chen, D.; Liu, S. Evolution of Spatial Network Structure for Land-Use Carbon Emissions and Carbon Balance Zoning in Jiangxi Province: A Social Network Analysis Perspective. Ecol. Indic. 2024, 158, 111508. [Google Scholar] [CrossRef]
  16. Zhao, J.; Xu, S.; Ren, Y.; Tang, X. A Breakthrough Land-Use-Based Carbon Accounting Framework for Multi-Scale Evaluation: Coupling Optimization Algorithm and LCA. Sustain. Cities Soc. 2025, 120, 106132. [Google Scholar] [CrossRef]
  17. Zheng, Y.; Fan, M.; Cai, Y.; Fu, M.; Yang, K.; Wei, C. Spatio-Temporal Pattern Evolution of Carbon Emissions at the City-County-Town Scale in Fujian Province Based on DMSP/OLS and NPP/VIIRS Nighttime Light Data. J. Clean. Prod. 2024, 442, 140958. [Google Scholar] [CrossRef]
  18. Bai, J.; Chen, H.; Gu, X.; Ji, Y.; Zhu, X. Temporal and Spatial Characteristics of Carbon Emissions from Cultivated Land Use and Their Influencing Factors: A Case Study of the Yangtze River Delta Region. Int. Rev. Econ. Financ. 2024, 96, 103501. [Google Scholar] [CrossRef]
  19. Wang, W.; Wang, W.; Xie, P.; Zhao, D. Spatial and Temporal Disparities of Carbon Emissions and Interregional Carbon Compensation in Major Function-Oriented Zones: A Case Study of Guangdong Province. J. Clean. Prod. 2020, 245, 118873. [Google Scholar] [CrossRef]
  20. Yu, Z.; Chen, L.; Tong, H.; Chen, L.; Zhang, T.; Li, L.; Yuan, L.; Xiao, J.; Wu, R.; Bai, L.; et al. Spatial Correlations of Land-Use Carbon Emissions in the Yangtze River Delta Region: A Perspective from Social Network Analysis. Ecol. Indic. 2022, 142, 109147. [Google Scholar] [CrossRef]
  21. Liu, X.; Wei, Y.; Jin, X.; Luo, X.; Zhou, Y. County-Level Carbon Compensation Zoning Based on China’s Major Function-Oriented Zones. J. Environ. Manag. 2024, 367, 121988. [Google Scholar] [CrossRef]
  22. Qiao, W.; Huang, X. The Impact of Land Urbanization on Ecosystem Health in the Yangtze River Delta Urban Agglomerations, China. Cities 2022, 130, 103981. [Google Scholar] [CrossRef]
  23. Li, X.; Zhao, H.; Gu, B.; Chen, Y. Carbon Sinks/Sources’ Spatiotemporal Heterogeneity and Their Spatial Response to Economic-Social Factors in Relatively Developed Regions: A Case of China’s Coastal Area. J. Environ. Manag. 2024, 354, 120494. [Google Scholar] [CrossRef]
  24. Huang, Y.; Wang, Y.; Peng, J.; Li, F.; Zhu, L.; Zhao, H.; Shi, R. Can China Achieve Its 2030 and 2060 CO2 Commitments? Scenario Analysis Based on the Integration of LEAP Model with LMDI Decomposition. Sci. Total Environ. 2023, 888, 164151. [Google Scholar] [CrossRef]
  25. Massad, R.S.; Lathière, J.; Strada, S.; Perrin, M.; Personne, E.; Stéfanon, M.; Stella, P.; Szopa, S.; de Noblet-Ducoudré, N. Reviews and Syntheses: Influences of Landscape Structure and Land Uses on Local to Regional Climate and Air Quality. Biogeosciences 2019, 16, 2369–2408. [Google Scholar] [CrossRef]
  26. Ge, K.; Wang, Y.; Liu, X.; Hu, L.; Ke, S.; Jiang, X.; Zhang, W. Spatial Effects and Influence Mechanisms of Urban Land Use Green Transition on Urban Carbon Emissions. Ecol. Indic. 2025, 172, 113261. [Google Scholar] [CrossRef]
  27. Fendrich, A.N.; Ciais, P.; Panagos, P.; Martin, P.; Carozzi, M.; Guenet, B.; Lugato, E. Including Land Management in a European Carbon Model with Lateral Transfer to the Oceans. Environ. Res. 2024, 245, 118014. [Google Scholar] [CrossRef] [PubMed]
  28. Su, D.; Yang, K.; Peng, Z.; Sun, R.; Zhang, M.; Yang, X.; Ma, L.; Ma, J. Cropland Encroachment on Ecological Land in Mainland Southeast Asia Leads to Massive Carbon Emissions. Ecol. Indic. 2025, 174, 113505. [Google Scholar] [CrossRef]
  29. Garvey, A.; Norman, J.B.; Büchs, M.; Barrett, J. A “Spatially Just” Transition? A Critical Review of Regional Equity in Decarbonisation Pathways. Energy Res. Soc. Sci. 2022, 88, 102630. [Google Scholar] [CrossRef]
  30. Guo, Y.; Tong, Z.; Chen, H.; Wang, Z.; Yao, Y. Heterogeneity Study on Mechanisms Influencing Carbon Emission Intensity at the County Level in the Yangtze River Delta Urban Agglomeration: A Perspective on Main Functional Areas. Ecol. Indic. 2024, 159, 111597. [Google Scholar] [CrossRef]
  31. Zhang, Z.; Jin, G. Spatiotemporal Differentiation of Carbon Budget and Balance Zoning: Insights from the Middle Reaches of the Yangtze River Urban Agglomeration, China. Appl. Geogr. 2024, 167, 103293. [Google Scholar] [CrossRef]
  32. Feng, X.; Wang, S.; Wu, N.; Li, Y.; Yang, J. Urban Low-Carbon Governance Zoning Coupled with Urban Attributes and Spatial Networks: Theoretical Framework and Practical Path. J. Environ. Manag. 2025, 373, 123865. [Google Scholar] [CrossRef] [PubMed]
  33. Xia, S.; Yang, Y. Spatio-Temporal Differentiation of Carbon Budget and Carbon Compensation Zoning in Beijing-Tianjin-Hebei Urban Agglomeration Based on the Plan for Major Function-Oriented Zones. Acta Geogr. Sin. 2022, 77, 679–696. [Google Scholar] [CrossRef]
  34. Wang, Y.; Zhen, W. Spatiotemporal Differentiation of Carbon Budget and Carbon Compensation Zoning Based on the Plan for Major Function-Oriented Zones: A Case Study of Counties in the Yellow River Basin. Environ. Sci. 2024, 45, 5015–5026. [Google Scholar] [CrossRef]
  35. Zhang, M.; Liu, X.; Peng, S.; Zhang, Y.; Chen, Y.; Wen, L. Evolution Characteristics and Formation Mechanism of Spatial Correlation Network of Provincial Land Use Carbon Emission Efficiency in China. China Land Sci. 2023, 37, 91–101. [Google Scholar] [CrossRef]
  36. Wei, W.; Ye, C.; Cai, X.; Xiao, W. Characteristics of Carbon Metabolism of Production-Living-Ecological Space in Wuhan City of Hubei Province, China Based on Ecological Network Analysis Model. J. Earth Sci. Environ. 2024, 46, 528–543. [Google Scholar]
  37. Yang, Y.; Su, X. Spatial Correlation Network Structure of Carbon Emission Reduction Capacity on Urban Agglomerations and Its Driving Factors: A Perspective of Sustainable Development Goals. Sustain. Cities Soc. 2024, 113, 105646. [Google Scholar] [CrossRef]
  38. Scott, J. Social Network Analysis: A Handbook; Sage Publications Ltd.: Thousand Oaks, CA, USA, 1991. [Google Scholar]
  39. Wasserman, S.; Faust, K. Social Network Analysis: Methods and Applications; Social network analysis: Methods and applications; Cambridge University Press: New York, NY, USA, 1994; pp. xxxi, 825. ISBN 978-0-521-38269-4. [Google Scholar]
  40. Glückler, J.; Doreian, P. Editorial: Social Network Analysis and Economic Geography—Positional, Evolutionary and Multi-Level Approaches. J. Econ. Geogr. 2016, 16, 1123–1134. [Google Scholar] [CrossRef]
  41. Shen, W.; Liang, H.; Dong, L.; Ren, J.; Wang, G. Synergistic CO2 Reduction Effects in Chinese Urban Agglomerations: Perspectives from Social Network Analysis. Sci. Total Environ. 2021, 798, 149352. [Google Scholar] [CrossRef]
  42. Dong, J.; Li, C. Structure Characteristics and Influencing Factors of China’s Carbon Emission Spatial Correlation Network: A Study Based on the Dimension of Urban Agglomerations. Sci. Total Environ. 2022, 853, 158613. [Google Scholar] [CrossRef]
  43. Chen, J.; Li, J.; Li, G.; Zhang, J. How to Recognize and Characterize Land Use-Based Carbon Emissions within City Networks in the Beijing-Tianjin-Hebei Region of China. Urban Clim. 2024, 53, 101789. [Google Scholar] [CrossRef]
  44. Li, W.; Bai, M.; Wang, J. Ecological Burden Shifting Associated with Land Transfer Embodied in Global Trade: An Ecological Network Analysis. Land Use Policy 2024, 139, 107071. [Google Scholar] [CrossRef]
  45. Ji, X.; Liu, H.; Zhang, Y. Spatiotemporal Evolution and Driving Factors of Spatial Correlation Network Structure of China’s Land-Use Carbon Emission. Econ. Geogr. 2023, 43, 190–200. [Google Scholar] [CrossRef]
  46. Zou, J.; Ding, R.; Zhu, Y.; Peng, L.; Jiang, S. Urban Eco-Efficiency of China: Spatial Evolution, Network Characteristics, and Influencing Factors. Ecol. Indic. 2024, 167, 112641. [Google Scholar] [CrossRef]
  47. Zhang, B.; Yin, J.; Ding, R.; Chen, S.; Luo, X.; Wei, D. Urban Synergistic Carbon Emissions Reduction Research: A Perspective on Spatial Complexity and Link Prediction. J. Environ. Manag. 2024, 370, 122505. [Google Scholar] [CrossRef] [PubMed]
  48. Liu, Y.; Xia, C.; Ou, X.; Lv, Y.; Ai, X.; Pan, R.; Zhang, Y.; Shi, M.; Zheng, X. Quantitative Structure and Spatial Pattern Optimization of Urban Green Space from the Perspective of Carbon Balance: A Case Study in Beijing, China. Ecol. Indic. 2023, 148, 110034. [Google Scholar] [CrossRef]
  49. Williges, K.; Meyer, L.H.; Steininger, K.W.; Kirchengast, G. Fairness Critically Conditions the Carbon Budget Allocation across Countries. Glob. Environ. Change 2022, 74, 102481. [Google Scholar] [CrossRef]
  50. Ma, L.; Wang, C.; Xiang, L.; Liu, J.; Dang, C.; Wu, H. Chinese Cities Show Different Trend toward Carbon Peak. Sci. Total Environ. 2024, 934, 173156. [Google Scholar] [CrossRef]
  51. Wu, J.; Liu, C.; Guo, H.; Li, P.; Sun, W. Examining Intra-City Carbon Budget and Carbon Balance Zoning Based on Firm-Level Big Data: A Case Study of Nanjing, China. Ecol. Indic. 2024, 166, 112304. [Google Scholar] [CrossRef]
  52. Vaccari, F.P.; Gioli, B.; Toscano, P.; Perrone, C. Carbon Dioxide Balance Assessment of the City of Florence (Italy), and Implications for Urban Planning. Landsc. Urban Plan. 2013, 120, 138–146. [Google Scholar] [CrossRef]
  53. Lu, J.; Huang, X.; Chen, Y.; Xiao, X. Spatiotemporal Changes of Carbon Footprint Based on Energy Consumption in China. Geogr. Res. 2013, 32, 326–336. [Google Scholar]
  54. Mancini, M.S.; Galli, A.; Niccolucci, V.; Lin, D.; Bastianoni, S.; Wackernagel, M.; Marchettini, N. Ecological Footprint: Refining the Carbon Footprint Calculation. Ecol. Indic. 2016, 61, 390–403. [Google Scholar] [CrossRef]
  55. Yang, J.; Zhang, M.; Duo, L.; Xiao, S.; Zhao, Y. Spatial Pattern of Land Use Carbon Emissions and Carbon Balance Zoning in Jiangxi Province. Res. Environ. Sci. 2022, 35, 2312–2321. [Google Scholar] [CrossRef]
  56. Li, J.; Chen, H.; Zhang, C.; Chuai, X.; Zhou, Y. Spatiotemporal Evolution Characteristics of Carbon Sources and Carbon Sinks and Carbon Balance Zoning in the Yangtze River Delta Region. Environ. Sci. 2024, 45, 4090–4100. [Google Scholar] [CrossRef]
  57. Lin, X.; Zhang, L.; Wang, M.; Li, J.; Qin, J.; Lin, J. The Ecological Utility Study on Carbon Metabolism of Cultivated Land: A Case Study of Hubei Province, China. J. Environ. Manag. 2024, 365, 121531. [Google Scholar] [CrossRef]
  58. Yang, J.; Huang, X. The 30&thinsp;m Annual Land Cover Dataset and Its Dynamics in China from 1990 to 2019. Earth Syst. Sci. Data 2021, 13, 3907–3925. [Google Scholar] [CrossRef]
  59. Wu, Y.; Shi, K.; Chen, Z.; Liu, S.; Chang, Z. Developing Improved Time-Series DMSP-OLS-Like Data (1992–2019) in China by Integrating DMSP-OLS and SNPP-VIIRS. IEEE Trans. Geosci. Remote Sens. 2022, 60, 1–14. [Google Scholar] [CrossRef]
  60. Wang, N.; Chen, X.; Zhang, Y.; Pang, J.; Long, Z.; Chen, Y.; Zhang, Z. Integrated Effects of Land Use and Land Cover Change on Carbon Metabolism: Based on Ecological Network Analysis. Environ. Impact Assess. Rev. 2024, 104, 107320. [Google Scholar] [CrossRef]
  61. Shan, Y.; Cheng, Q.; Ke, X.; Zheng, D. Research on the Correlation Pattern and Trend of Land Use Carbon Emissions and Its Influencing Factors in Counties of Hubei Province from the Perspective of Flow Space. China Land Sci. 2024, 38, 48–59. [Google Scholar] [CrossRef]
  62. Zhang, N.; Sun, F.; Hu, Y. Carbon Emission Efficiency of Land Use in Urban Agglomerations of Yangtze River Economic Belt, China: Based on Three-Stage SBM-DEA Model. Ecol. Indic. 2024, 160, 111922. [Google Scholar] [CrossRef]
  63. West, T.O.; Marland, G. A Synthesis of Carbon Sequestration, Carbon Emissions, and Net Carbon Flux in Agriculture: Comparing Tillage Practices in the United States. Agric. Ecosyst. Environ. 2002, 91, 217–232. [Google Scholar] [CrossRef]
  64. Xia, C.; Li, Y.; Ye, Y.; Shi, Z.; Liu, J.; Li, X. Analyzing Urban Carbon Metabolism Based on Ecological Network Utility: A Case Study of Hangzhou City. Acta Ecol. Sin. 2018, 38, 73–85. [Google Scholar] [CrossRef]
  65. Du, J.; Fu, J.; Hao, M. Analyzing the Carbon Metabolism of “Production-Living Ecological” Space Based on Ecological Network Utility in Zhaotong. J. Nat. Resour. 2021, 36, 1208–1223. [Google Scholar] [CrossRef]
  66. Hu, A.; Wang, S.; He, Y.; Liu, X.; Yan, L.; Zhao, Y. Spatial Analvsis of Carbon Metabolism in Yulin Based on Ecological Network Utility. Chin. J. Ecol. 2024, 43, 3754–3762. [Google Scholar] [CrossRef]
  67. Zhao, M.; Qin, J.; Zhang, Y. Carbon Metabolism Modelling and Regulation in Beijing. J. Clean. Prod. 2024, 476, 143650. [Google Scholar] [CrossRef]
  68. Wei, Y.; Chen, S. Spatial Correlation and Carbon Balance Zoning of Land Use Carbon Emissions in Fujian Province. Acta Ecol. Sin. 2021, 41, 5814–5824. [Google Scholar] [CrossRef]
  69. He, Y.-Y.; Wei, Z.-X.; Liu, G.-Q.; Zhou, P. Spatial Network Analysis of Carbon Emissions from the Electricity Sector in China. J. Clean. Prod. 2020, 262, 121193. [Google Scholar] [CrossRef]
  70. Huo, T.; Cao, R.; Xia, N.; Hu, X.; Cai, W.; Liu, B. Spatial Correlation Network Structure of China’s Building Carbon Emissions and Its Driving Factors: A Social Network Analysis Method. J. Environ. Manag. 2022, 320, 115808. [Google Scholar] [CrossRef]
  71. Ren, X.; Xiong, R.; Ni, T. Spatial Network Characteristics of Carbon Balance in Urban Agglomerations—A Case Study in Beijing-Tianjin-Hebei City Agglomeration. Appl. Geogr. 2024, 169, 103343. [Google Scholar] [CrossRef]
  72. Lv, K.; Feng, X.; Kelly, S.; Zhu, L.; Deng, M. A Study on Embodied Carbon Transfer at the Provincial Level of China from a Social Network Perspective. J. Clean. Prod. 2019, 225, 1089–1104. [Google Scholar] [CrossRef]
  73. Chen, S.; Ding, R.; Shen, S.; Zhang, B.; Wang, K.; Yin, J. Coordinated Development of Green Finance and Green Technology Innovation in China: From the Perspective of Network Characteristics and Prediction. Environ. Sci. Pollut. Res. 2024, 31, 10168–10183. [Google Scholar] [CrossRef]
  74. Liben-Nowell, D.; Kleinberg, J. The Link-prediction Problem for Social Networks. J. Am. Soc. Inf. Sci. 2007, 58, 1019–1031. [Google Scholar] [CrossRef]
  75. Liu, J.; Pei, X.; Zhu, W.; Jiao, J. Multi-Scenario Simulation of Carbon Budget Balance in Arid and Semi-Arid Regions. J. Environ. Manag. 2023, 346, 119016. [Google Scholar] [CrossRef]
  76. Licen, S.; Franzon, M.; Rodani, T.; Barbieri, P. SOMEnv: An R Package for Mining Environmental Monitoring Datasets by Self-Organizing Map and k-Means Algorithms with a Graphical User Interface. Microchem. J. 2021, 165, 106181. [Google Scholar] [CrossRef]
  77. Huang, Y.; Matsumoto, K. Drivers of the Change in Carbon Dioxide Emissions under the Progress of Urbanization in 30 Provinces in China: A Decomposition Analysis. J. Clean. Prod. 2021, 322, 129000. [Google Scholar] [CrossRef]
  78. Huang, H.; Tang, Y.; Gong, Z.; Chen, X. Dynamic Evolution and Influencing Factors of Land Use Carbon Emissions in Chongqing Based on STIRPAT GWR Model. J. Environ. Eng. Technol. 2024, 14, 1195–1205. [Google Scholar] [CrossRef]
  79. Oh, J. The Effects of Local Government Expenditures on Carbon Dioxide Emissions: Evidence from Republic of Korea. Sustainability 2023, 15, 14913. [Google Scholar] [CrossRef]
  80. Zambrano-Monserrate, M.A.; Soto, G.H.; Ahakwa, I.; Manigandan, P. Dynamic Effects on Modern Renewable Energy Generation: The Role of Patents in Clean Energy Technology. Energy 2024, 311, 133340. [Google Scholar] [CrossRef]
  81. Wang, T.; Yue, W. Optimizing Territorial Spatial Pattern for Carbon Sink Growth: Theoretical Framework and Action Logic. J. Nat. Resour. 2024, 39, 1008–1021. [Google Scholar] [CrossRef]
  82. Lu, Z.; Lei, G.; Guo, Y.; Ma, Q. Changes of Land Use Intensity in the Songnen Plain of Different Spatial Scales and Their Effects on Climatic Factors. Acta Ecol. Sin. 2021, 41, 1894–1906. [Google Scholar] [CrossRef]
  83. Bai, C.; Zhou, L.; Xia, M.; Feng, C. Analysis of the Spatial Association Network Structure of China’s Transportation Carbon Emissions and Its Driving Factors. J. Environ. Manag. 2019, 253, 109765. [Google Scholar] [CrossRef]
  84. Li, W.; Chen, Z.; Li, M.; Zhang, H.; Li, M.; Qiu, X.; Zhou, C. Carbon Emission and Economic Development Trade-Offs for Optimizing Land-Use Allocation in the Yangtze River Delta, China. Ecol. Indic. 2023, 147, 109950. [Google Scholar] [CrossRef]
  85. Yi, R.; Chen, Y.; Chen, A. Evaluating Urban Climate Resilience in the Yangtze River Delta Urban Agglomeration: A Novel Method Integrating the DPSIR Model and Sustainable Development Goals. J. Environ. Manag. 2025, 376, 124517. [Google Scholar] [CrossRef] [PubMed]
  86. Lü, L.; Zhou, T. Link Prediction in Complex Networks: A Survey. Phys. A Stat. Mech. Its Appl. 2011, 390, 1150–1170. [Google Scholar] [CrossRef]
  87. Güneş, İ.; Gündüz-Öğüdücü, Ş.; Çataltepe, Z. Link Prediction Using Time Series of Neighborhood-Based Node Similarity Scores. Data Min. Knowl. Discov. 2016, 30, 147–180. [Google Scholar] [CrossRef]
  88. Wu, X.; Wu, J.; Li, Y.; Zhang, Q. Link Prediction of Time-Evolving Network Based on Node Ranking. Knowl.-Based Syst. 2020, 195, 105740. [Google Scholar] [CrossRef]
  89. Yao, F.; Zhu, H.; Wang, M. The Impact of Multiple Dimensions of Urbanization on CO2 Emissions: A Spatial and Threshold Analysis of Panel Data on China’s Prefecture-Level Cities. Sustain. Cities Soc. 2021, 73, 103113. [Google Scholar] [CrossRef]
  90. Gao, Y.; Yang, Z.; Huang, K.-F.; Gao, S.; Yang, W. Addressing the Cross-Boundary Missing Link between Corporate Political Activities and Firm Competencies: The Mediating Role of Institutional Capital. Int. Bus. Rev. 2018, 27, 259–268. [Google Scholar] [CrossRef]
  91. Jin, J.; Wang, F. Impact of Government Support on Firm Carbon Emission Efficiency: The Transmission Channel of Green Innovation. Financ. Res. Lett. 2024, 68, 105980. [Google Scholar] [CrossRef]
  92. Yang, C.; Liu, S. Spatial Correlation Analysis of Low-Carbon Innovation: A Case Study of Manufacturing Patents in China. J. Clean. Prod. 2020, 273, 122893. [Google Scholar] [CrossRef]
  93. Su, P.; Cong, X.; Wang, L.; Šaparauskas, J.; Ustinovičius, L.; Skibniewski, M.J. Spatial Network Characteristics and Influencing Factors of the Synergistic Effects of Pollution Reduction and Carbon Emission Reduction in “Zero Waste City” Clusters. J. Clean. Prod. 2025, 493, 144924. [Google Scholar] [CrossRef]
  94. Han, W.; Zhang, X.; Zheng, X. Land Use Regulation and Urban Land Value: Evidence from China. Land Use Policy 2020, 92, 104432. [Google Scholar] [CrossRef]
  95. Han, F.; Javed, T.; Hussain, S.; Guo, S.; Guo, R.; Yang, L.; Liu, X.; Cai, T.; Zhang, P.; Jia, Z.; et al. Maize/Peanut Rotation Intercropping Improves Ecosystem Carbon Budget and Economic Benefits in the Dry Farming Regions of China. J. Environ. Manag. 2024, 353, 120090. [Google Scholar] [CrossRef] [PubMed]
Figure 1. Geographical location of the study area.
Land 14 01329 g001
Figure 2. Research framework.
Land 14 01329 g002
Figure 3. Carbon balance zones.
Land 14 01329 g003
Figure 4. Carbon emissions from land use in Hubei Province from 2010 to 2022.
Land 14 01329 g004
Figure 5. KDE maps of LUCEs in Hubei Province (2010–2022). (a) Kernel density distribution of carbon emissions; (b) Kernel density distribution of carbon sinks; (c) Kernel density distribution of net land-use carbon emissions.
Land 14 01329 g005
Figure 6. Spatiotemporal evolution of LUCEs in Hubei Province. (a) Carbon emissions; (b) Carbon sinks; (c) Net land-use carbon emissions.
Land 14 01329 g006
Figure 7. Evolution of the LUCE spatial gravity structure in Hubei Province. Subfigures (ad) represent the spatial gravity networks of land-use carbon emissions for the years 2010 (a), 2014 (b), 2018 (c), and 2022 (d).
Land 14 01329 g007
Figure 8. LUCE network structure in Hubei Province. (a,c,e,g) represent weighted networks, while (b,d,f,h) represent binary networks. Larger nodes indicate higher centrality, and thicker edges represent stronger gravitational interactions.
Land 14 01329 g008
Figure 9. Evolutionary trend of the overall network characteristics.
Land 14 01329 g009
Figure 10. Evolutionary trend of the individual network characteristics. ODC denotes out-degree centrality; IDC denotes in-degree centrality; OCC denotes out-closeness centrality; ICC denotes in-closeness centrality; and BC denotes betweenness centrality.
Land 14 01329 g010
Figure 11. Block model analysis. (a) Block model structure in 2010; (b) Block model structure in 2014; (c) Block model structure in 2018; (d) Block model structure in 2022.
Land 14 01329 g011
Figure 12. The network prediction results of LUCEs. (ac) show the LUCEs spatial association networks constructed using the CN, Jaccard, and RN indicators, each reflecting connection strength from different perspectives.
Land 14 01329 g012
Figure 13. Carbon balance zoning in Hubei.
Land 14 01329 g013
Figure 14. QAP correlation analysis results. Subfigures (ad) show the correlation coefficient heat maps for the years 2010, 2014, 2018, and 2022. (Abbreviations: LUCEs (Binarymatrix); geographical proximity (Distance); economic development (Pgdp); industrial structure (Indus); urbanization rate (Urban); government expenditure (Gov); innovation level (Iv); land-use intensity (LUI); land-use type proportions (ImperviousR, WaterR, GrasslandR, ForestR, CroplandR); and per capita land-use availability (PImperviousR, PWaterR, PGrasslandR, PForestR, PCroplandR). Significance < 0.1 at the 10% level (*), significance < 0.05 at the 5% (**) level and significance < 0.01 at the 1% level (***)).
Land 14 01329 g014
Figure 15. QAP regression results. Significance < 0.1 at the 10% level (*), significance < 0.05 at the 5% (**) level and significance < 0.01 at the 1% level (***).
Land 14 01329 g015
Table 1. Characteristics of carbon balance zoning.
Regional TypeClassification CriteriaImplication
Low-carbon retention areaECC > 1, ESC > 1Both the economic contribution coefficient (ECC) and ecological support coefficient (ESC) are high, indicating that overall carbon sequestration exceeds emissions. This reflects a solid foundation for green development and balanced carbon performance.
Economic development areaECC < 1, ESC > 1The region exhibits strong ecological support and high carbon sequestration capacity, yet demonstrates low carbon emission efficiency, with high emissions per unit of GDP. This type is suitable for prioritizing economic growth while maintaining ecological stability.
Green transition areaECC > 1, ESC < 1The carbon emissions make a significant economic contribution, but the region lacks sufficient ecological carrying capacity. Total emissions surpass sequestration levels. Policy should focus on enhancing carbon sink capacity and accelerating the green transition.
Comprehensive optimization areaECC < 1, ESC < 1Both economic and ecological capacities related to carbon are weak. A comprehensive and coordinated optimization strategy is required to support balanced and sustainable development.
Table 2. Influencing factors.
SystemIndicatorImplicationUnit
Spatial adjacency Spatial adjacency (SA)Two neighboring cities are marked as 1, otherwise as 0.\
Socio-economicUrbanization rate (UR)Proportion of urban population to total population (both agricultural and non-agricultural)%
Government expenditure (Gov)Local Public Financial Expenditure100 million yuan
Per capita gross domestic product (PGDP)Per capita GDP by regionYuan
Innovation level (lv)Total patents granted (three types)item
Resource utilizationIndustrial structure (Indus)The proportion of tertiary
industry GDP to regional GDP
%
Land-use intensity (LUI)Following previous research [82], the land-use intensity index is ranked from highest to lowest as 1 to 7 accordingly.
Q = ( S i × A i ) / S i
Where Si is the area of land use in category i; Ai is the leveling index of land use in category i.
\
Land-use structure The proportion of impervious and total area (ImperviousR)Ratio of impervious to total area%
The proportion of water and total area (WaterR)Ratio of water to total area%
The proportion of grassland and total area (GrasslandR)Ratio of grassland to total area%
The proportion of grassland and total area (ForestR)Ratio of forest to total area%
The proportion of grassland and total area (CroplandR)Ratio of cropland to total area %
Ecological environmentPer capita impervious area (PImperviousR)Ratio of impervious land area to resident populationhm2/10,000 persons
Per capita water area (PWaterR)Ratio of water land area to resident populationhm2/10,000 persons
Per capita grassland area (PGrasslandR)Ratio of grassland land area to resident populationhm2/10,000 persons
Per capita forested area (PForestR)Ratio of forested land area to resident populationhm2/10,000 persons
Per capita cropland area (PCroplandR)Ratio of cropland land area to resident populationhm2/10,000 persons
Table 3. Identification and characteristics of key cities.
City TypeIdentification BasisRegional Characteristics
Core cityCities with high in-degree centrality and located at the core of the networkPositioned at the center of the carbon emission network, these cities have a significant influence on the emission behavior of other cities within the network.
Bridge cityCities with high betweenness centrality and classified within the “brokerage block”Act as key hubs linking the core and peripheral areas of the carbon emission network, playing a crucial role in maintaining the overall stability of the network.
Action cityCities with high inward closeness centrality and located in the “net spillover block”Maintain the shortest paths to other cities in the network, enabling them to more quickly influence the carbon emission behavior of other cities.
Disclaimer/Publisher’s Note: The statements, opinions and data contained in all publications are solely those of the individual author(s) and contributor(s) and not of MDPI and/or the editor(s). MDPI and/or the editor(s) disclaim responsibility for any injury to people or property resulting from any ideas, methods, instructions or products referred to in the content.

