Review

Towards an Application of the Life Cycle Assessment Framework for GHG Emissions of the Dairy System: A Literature Review

Department of Life and Environmental Sciences, Bournemouth University, Poole BH12 5BB, UK
*
Author to whom correspondence should be addressed.
Land 2025, 14(6), 1207; https://doi.org/10.3390/land14061207
Submission received: 5 April 2025 / Revised: 19 May 2025 / Accepted: 26 May 2025 / Published: 4 June 2025
(This article belongs to the Section Land Use, Impact Assessment and Sustainability)

Abstract

Farm simulation models are a popular form of measuring greenhouse gas emissions (GHGe) from the agricultural industry as they are holistic and cost effective. The simulation models often follow the well-accepted life cycle assessment (LCA) framework to estimate the GHGe from the complete system from cradle to farm-gate. However, several studies have highlighted flaws in the methodology and accuracy of the application of the LCA tool, underestimating emissions based on the scope of the study. GHGe vary considerably across livestock species, with cattle contributing to the highest proportion, from dairy and beef production. An extensive literature review evaluating the application of the LCA tool for measuring and comparing dairy farm GHGe has not been conducted. The current review evaluates the literature on LCAs of the dairy system across the globe, to highlight the flaws in poor scope design, the potential to underestimate emissions, and significant trade-offs disregarding vital variables.

1. Introduction

Farm simulation models are important for holistically evaluating mitigation strategies for reducing the environmental footprint of a farm, to limit negative trade-offs. They are also less time consuming and more cost-effective than real-life experiments on-farm, to assess the holistic impact before implementing on living beings, humanity’s food supply and a farmer’s livelihood [1]. Farm simulation models are often based on the life cycle assessment (LCA) framework, following the four stages of the official International Organisation for Standardisation methodology [2]. It is a well-regarded methodology for calculating the environmental impact of an item or being, such as livestock [3], and is considered a world-leading approach for accurately assessing the environmental footprint of milk produced by dairy cattle [4,5].
Although the LCA methodology is well-established and highly regarded, limitations have been highlighted with the application of the LCA framework. The issues reside with the fact that stage one, the goal and scope design, is determined by the investigator. When not developed holistically, this can result in a poor scope design, leading to trade-offs between environmental factors and insufficient data resulting in the underestimation of overall greenhouse gas emissions (GHGe). The limited application of stage one can then impact the remaining three stages, particularly stage four: the interpretation of results. If the scope is limited and leads to an underestimation of overall GHGe or lack of consideration for vital variables, the recommendations based on the results could have serious consequences on real-life dairy farms, livelihoods, and food security. It is crucial that the first stage: goal and scope design are based on current knowledge, informed by the known limitations and mitigation strategies designed to improve the application and accuracy of future dairy LCAs and farm simulation models. Accurate simulation and application will ensure GHGe mitigation strategies are evaluated holistically to avoid negative trade-offs and implications before recommendation and on-farm experiments. The results are used to inform governmental policies and must be accurate to ensure valuable recommendations and benficial outputs [6]. Yet, an extensive literature review assessing the limitations of the application of the LCA framework in stage one on the overall LCA study and developing guidance on the mitigation strategies to overcome these limitations has not been conducted.
This review examines the literature on international LCAs of the dairy system to highlight the weaknesses of the application of the LCA methodology to stage 1: goal and scope design on the overall LCA study. The review identifies several issues with the application of the LCA framework and presents mitigation strategies to overcome these issues to improve the first stage of the ISO LCA methodology. The recommendations from the paper can then be applied as optional guiding principles, to create a well-developed and inclusive scope and study design for future studies. It is imperative that the principles are used as guidance to ensure adaptability to the diverse conditions and methodologies applied across LCA applications. The guidance will ensure future investigators are aware of the possible weaknesses of scope design and application to restrict the possible limitations. Future studies will benefit from the limited weaknesses to improve the accuracy and robustness of their study design and consequent results and recommendations, to improve future LCAs of the dairy system before being implemented on-farm.

2. Methodology

Science Direct, Google Scholar and PubMed were used to search for relevant articles applying the LCA framework on the greenhouse gas emissions of the dairy systems, using the terms “Life cycle assessment”, “life cycle analysis”, “dairy cattle”, “milk production”, “greenhouse gas emissions”. An inclusion criterion was used of those peer-reviewed, published in English between 2006 and 2023 that were based on dairy cattle. The purpose was to identify the weaknesses and strengths of an LCA when applied to the carbon footprint of dairy farm systems. From each review, perceived weaknesses and strengths of the LCA studies were pinpointed to highlight areas that an effective scope can overcome and improve the quality of the results.
A literature review was selected to provide an overview of the limitations of the LCA methodology, with its main objective to illustrate how inherent weaknesses can be mitigated. A literature review offers a synthesis of the general debates within the existing body of knowledge and indicates potential gaps or inconsistences that need to be addressed in future research or indicate alternatives to issues arising [7]. Literature reviews have become increasingly prevalent in sustainability and food studies [8]. Given the speed at which applications of LCAs progress, a literature review covering the period between 2006 and 2023 was considered to be appropriate. Snyder [9] suggests that a literature review as a methodology is, therefore, effective to create a firm foundation for advancing knowledge and facilitating theory development or presenting alternative solutions. Evans and Kowanko [10] states that literature reviews have seen a progressive evolution in review methodology, to the point where they are considered research in their own right.
Consequently, this review does provide an element of novelty, given that most studies tend to focus on the fourth stage of an LCA (interpretation of results). This review, however, focuses on Stage 1 (the initial goal and scope definition), which is frequently overlooked in academic studies. This paper highlights the negative impacts this has for the validity of outputs and their robustness. The study brings the initial stage of the LCA into focus, illustrating potential weaknesses of a poorly developed scope and presenting guiding principles to improve future LCA studies in terms of their accuracy and quality.

3. Contextualising GHG Emissions of Dairy Production Management Systems and Farm Simulation Models

There are three main management systems in high income countries: pasture-based systems and housed systems, as well as a mixture of the two, known as mixed systems [11]. Pasture-based systems being defined in a meta-analysis, by Lorenz et al. [11] as low input, with a 50% minimum pasture feed and maximum 25% concentrate feed. Compared to a mixed system of a maximum 50% pasture feed and at least 25% concentrate feed, where the cattle are housed in barns but allowed to graze in the warmer summer months [1]. In contrast, cattle in housed systems have no access to grazing when the cattle are lactating [11] and are housed in barns, except heifers that are sometimes pasture-based during maturation [1].
Greenhouse gas emissions from the dairy system consist of direct and indirect emissions. Indirect emissions are those generated from the inputs [1,12], such as the growing and transporting of animal feed for the livestock [13]. Direct emissions on the other hand, are those produced on the farm [12], which consist of mainly methane (CH4) from enteric fermentation [14,15,16,17,18] and manure management [5,13,17]. CH4 being the main contributor to the carbon footprint (CF) of the end milk product [6]. The breakdown of emissions from dairy farms, show the largest proportion of emissions from EF contributing to between 32 and 51% [19,20,21,22]. CH4 and nitrous oxide (N2O) from manure equated to 13 and 19%, soil and crops 28 to 29% [19,22], fertiliser 2% to 16% [21], energy 2% [19], and indirect N2O 7%.
Manure from dairy cows equates to around seven to ten percent of emissions from milk production [23], consisting of mainly CH4 and N2O emissions [1,15]. Manure emissions are impacted by multiple factors, such as dietary composition, soil when spread on land, storage and weather conditions, like temperature [3]. Research suggests the main difference effecting the emissions from manure management systems are the type of storage used and length of time it is stored. For instance, manure can be stored in liquid or solid systems, also known as dry systems [24,25], which produce different quantities of CH4 [26]. They are often stored in different conditions, as solid manure tends to be collected in stockpiles and decomposes aerobically [26]. By contrast, liquid manure is stored in anaerobic conditions, an optimum environment for microbes to break down the substance, such as ponds or lagoons, leading to higher CH4 production [26]. However, N2O emissions are higher when solid systems or dry manure systems are used [27].
A previous review by Segerkvist et al. [12] on the environmental impacts associated with cattle, highlighted one of the focal points, as N from fertilisers, likely because fertilisers are one of the lead causes of N2O emissions in dairy systems [5]. The main components of fertilisers are N, potassium, and phosphorus, as well as the macronutrients calcium, magnesium, and sulphur to improve the productivity of the soil [13]. It is important that the amount of fertiliser used is monitored, as excess use can lead to poor soil quality. The organic matter in fertilisers absorbs water, meaning that excessive usage can lead to the oversaturation of soil, leading to poor drainage and the soil becoming waterlogged, which can even lead to a reduction in micronutrients [28]. Fertilisers can also cause eutrophication [29], where fertilisers, including manure, leach into water systems and negatively impact marine life by decreasing the quantity of oxygen in the water [30]. However, in the 2021 Farm Practices Survey (FPS), 62% of English farmers had reported improving the precision of their N fertiliser application [31].
To encourage high productivity and limit crop losses, pesticides are commonly used in agriculture and consist of nematicides, herbicides, fungicides, and insecticides [32]. These agents prevent weeds from growing to decrease competition over the area, as well as fungi and pests such as insects and rats [32,33]. However, the toxins can also enter the food chain, from organisms eating the plants and predators eating those animals, or by leaching into water systems [34,35]. The pesticides can increase in concentration through biomagnification and lead to long term health problems. These chemicals are also dangerous to the bee population, as alcohol ethoxylates in fungicides have been linked to gut damage, weight loss and a 30% fatality rate in the species [36].
GHGe are also produced on-farm from energy used, such as from housing cattle, the milking process and fuel, which is higher when obtained from fossil fuels [37]. The management system can impact the emissions generated from energy use, such as purchased feed transported to the farm has higher emissions than pasture [37]. While housed systems have the largest energy demand, from feed and housing requirements. In a study in China, the main energy use consisted of transportation and feed production, responsible for 95% of energy use [5]. The production of feed being the second largest contributor to GHGe in livestock, responsible for approximately 41% of emissions from global livestock [27]. In England, increasing energy efficiency was one of the most used strategies to reduce emissions, by 79% of English farmers surveyed in 2021 [31].
Considering the life cycle of milk production to the farm-gate, transportation has a minimal impact [38]. Fuel is considered the main cause of carbon dioxide (CO2) emissions from the agriculture industry, but this accounted for less than 2% of the UK’s emissions in 2019 [39]. In the dairy industry in China, feed transportation accounted for 0.7% of the total GHGe of the dairy system, having the lowest impact on emissions [5]. The efficiency of vehicles is also improving, so it is presumed that transport emissions will decline in the future, rather than increase or stabilise [32]. In addition to this, transportation emissions from feed are often out of the farmers’ control [32], so it is not an easy way to reduce emissions from the system. However, LCAs past the farm-gate must acknowledge that milk requires refrigeration, which contributes to the ozone layer depletion from chlorofluorocarbons (CFCs), which increase as miles of transportation increase [39]. However, improving transport routes and expanding the use of low carbon vehicles will reduce transport emissions [39].
GHGe from various constitutes of the farm system are often analysed separately, using equations such as enteric CH4 from feed and manure emissions; however, farm simulation models are fitting for holistically evaluating the environmental, economic, and technical repercussions of changing management methods [3,21]. The models consider the possible negative consequences of improving one aspect, across the system [40,41,42], to avoid compromising the efficiency of the farm [43]. The models are valuable and mostly used in research for analysing the effectiveness of mitigation schemes [3] and economic viability [40], to capture the impact on the complete system [44]. Models can also vary in the level of detail they require and portray [3], to be modified to suit the aim and objectives of the study. Thus, simulation farm models are the best approach for showing a holistic view of the operations, considering multiple factors, in addition to the environmental impacts of the strategies [12,27].
It is important that mitigation strategies are evaluated on the system as a whole to avoid inaccurate assumptions, as shown in a study using the Holos model, to compare the whole farm emissions between corn silage and alfalfa/lucerne silage [45]. The model showed corn silage reduced enteric methane emissions (EME) and CH4 from manure by 6% each, N2O from manure by 17%, soil N2O by 2% and N2O from indirect sources by 5% compared to lucerne silage. However, the lucerne silage had lower CO2 emissions from energy by 91%, from liming by 168% and the importation of feed by 8%. In total, the difference in silage only resulted in 10 kg CO2e less for the lucerne silage, than the corn silage per cycle. Nonetheless, if the EME were analysed alone, the corn silage diet would appear to be the most favourable silage to reduce CH4 emissions. Even though enteric CH4 was the main cause of emissions from the sector, contributing to 46 and 44% of GHGe, the difference was not the largest between the silages. Fat protein corrected milk (FPCM) was not significantly different between the silages, but the corn silage diet had a lower CP content than lucerne, which meant it needed supplementing with soya bean meal (SBM). The study highlights the importance of an efficient model to ensure the suitability of the approaches and prevent possible consequences [46].

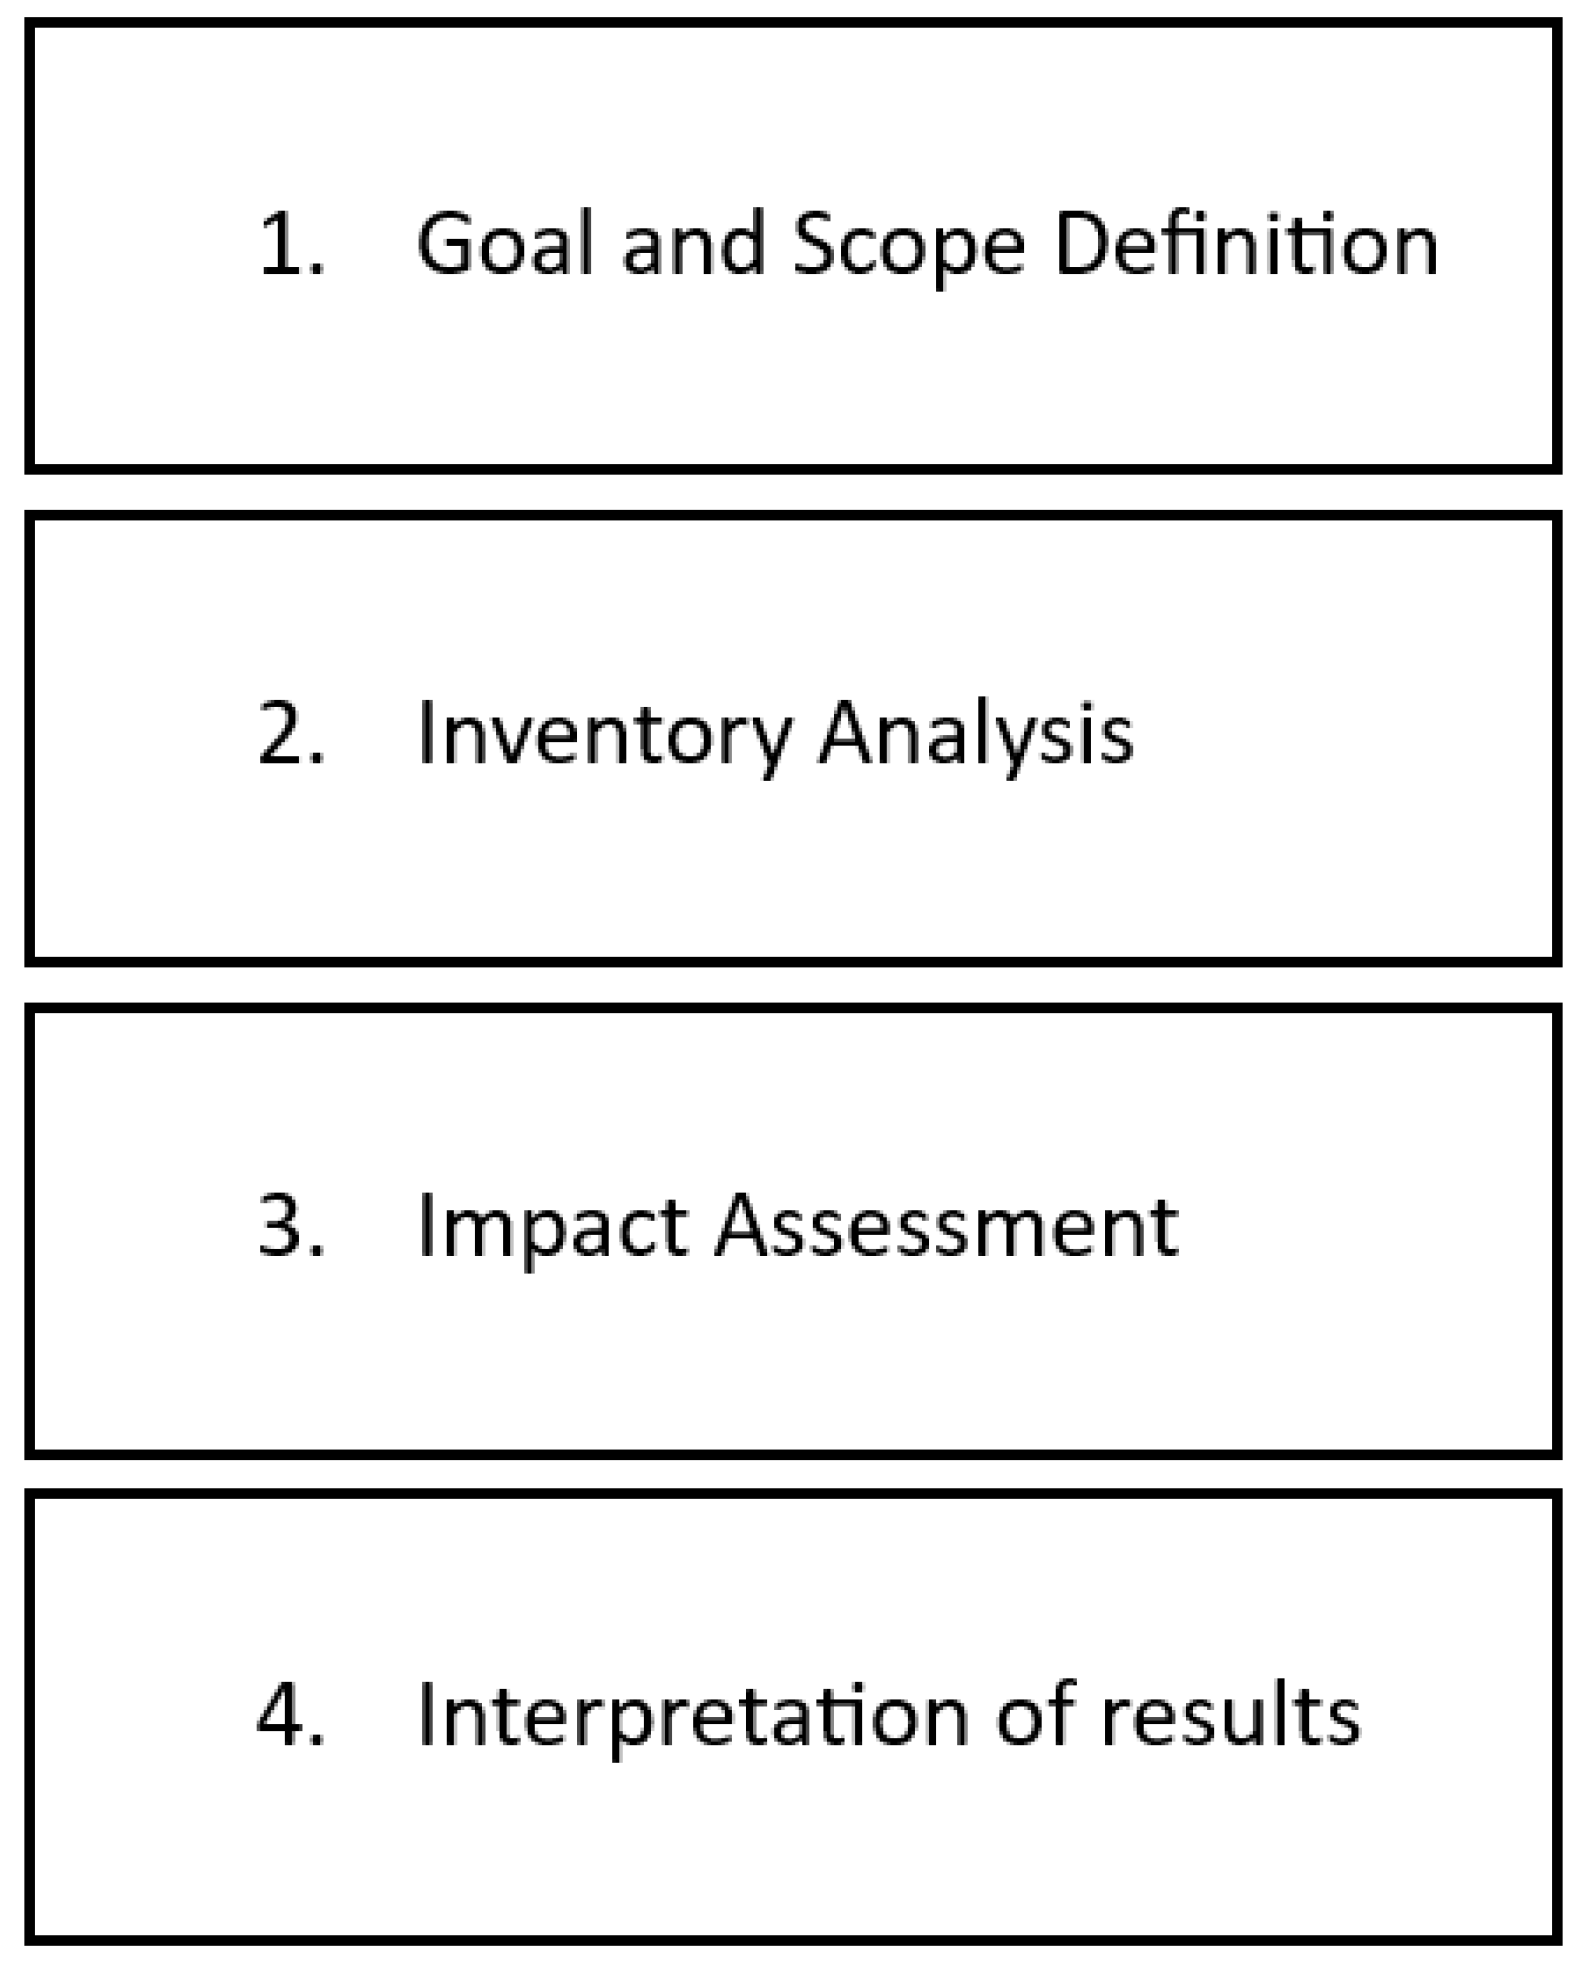
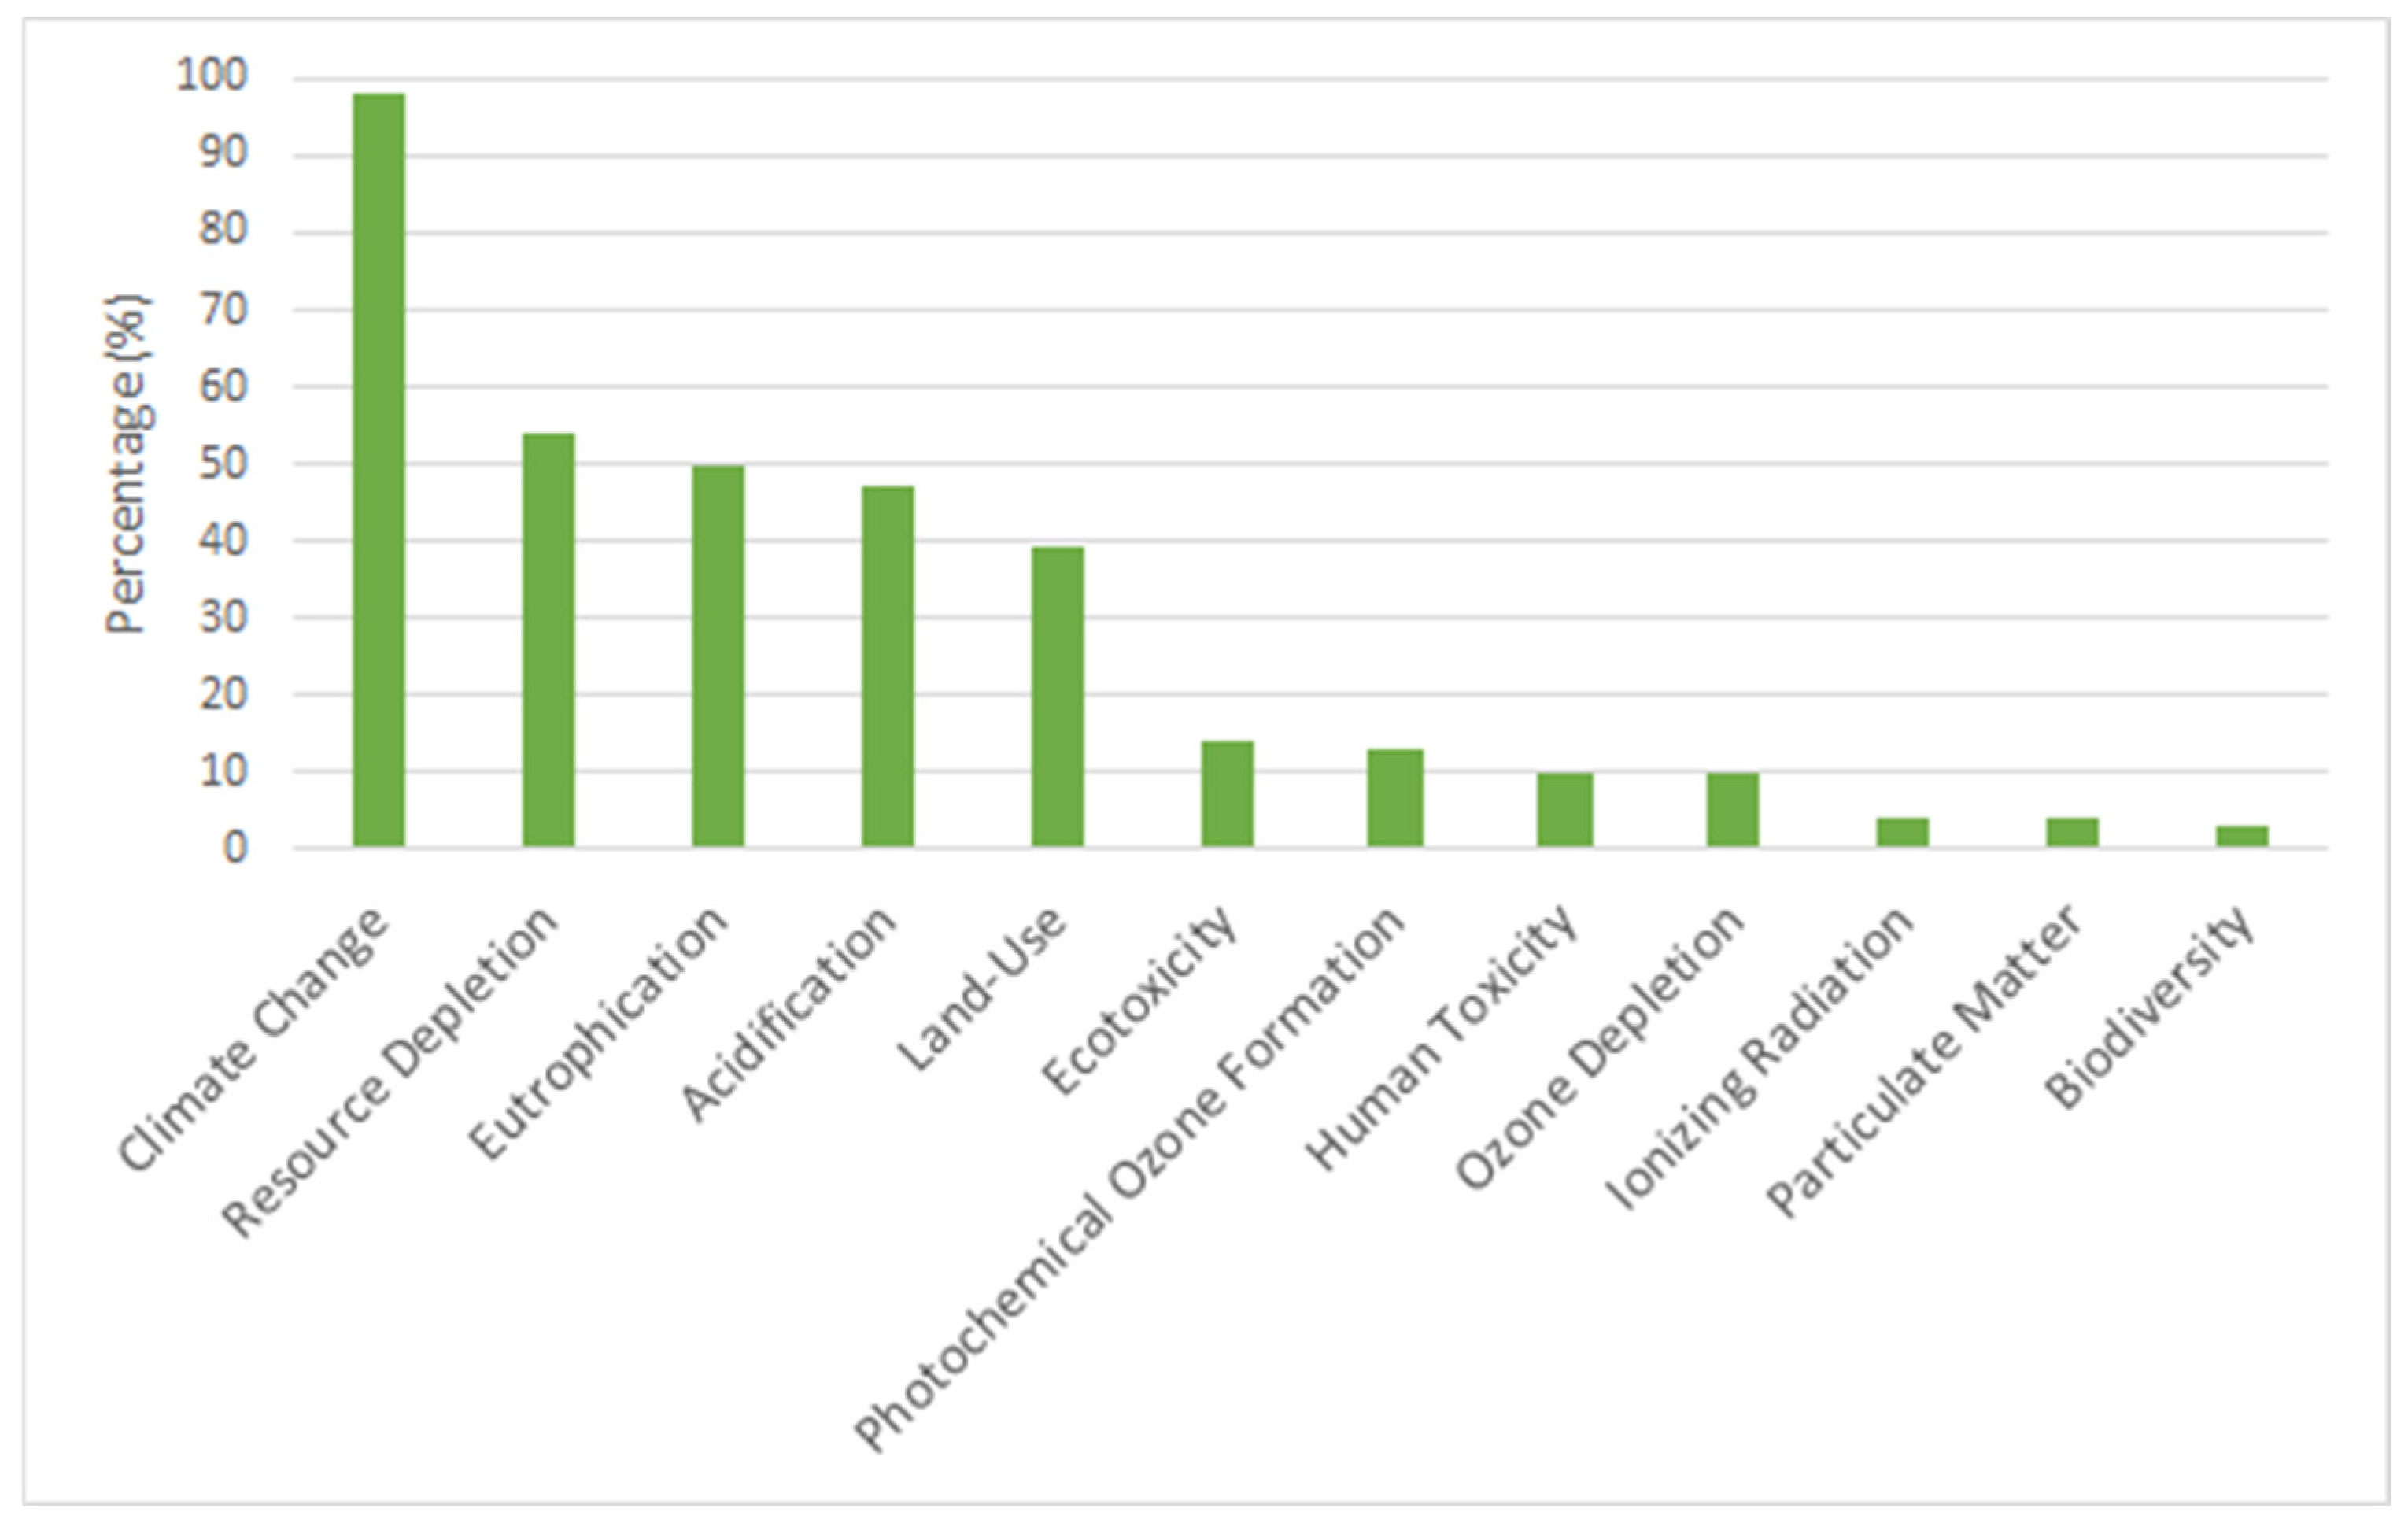
4. Life Cycle Assessment, Inherent Weaknesses, and Improving Accuracy

There are different types of modelling approaches, such as LCA and inventory-based models, empirical and statistical models, as well as process-based and mechanistic models [47]. The LCA model is a well-accepted approach used to analyse the environmental impact of a product [12,48,49] from the emissions produced, to the resources needed for manufacturing and waste created. Alternatives to the LCA include an environmental impact analysis (EIA), which assesses the environmental costs and benefits of a project, to limit the impact. However, this method is more useful after conducting an LCA, where a mitigation strategy has been developed and can be fully investigated before implementation. It is intended for new projects, as an environmental risk assessment, rather than a project to improve sustainability of an existing entity [50].
An LCA is a popular tool for calculating the CF of livestock [3,51,52], being deemed one of the leading approaches for reliably evaluating the environmental footprint of the dairy production system [4,5]. For instance, organisations such as the Food and Agriculture Organisation of the United Nations (FAO), use a Global Livestock Environmental Assessment Model (GLEAM), based on a LCA approach, which has been used locally and globally, focussing on the emissions produced from livestock; mainly manure and feed [53]. The benefits of an LCA are that they can apply different scenarios to a model, to calculate the impact of the changes on the environment [48,54]. LCAs consider the complete life cycle of the item by examining the direct and indirect emissions emitted from the process, creating a holistic overview [55]. It is an important tool for deliberating new policies [48,53,54,55] by providing evidence to determine the best strategies for future legislation and goals within the sector [56].
The LCA approach is highly regarded, following the official International Organisation for Standardisation methodology, as highlighted in Figure 1 below [2]. The official methodology follows four phases: 1. Goal and scope design. 2. Inventory analysis. 3. Impact analysis. 4. Interpretation of results. The implementation of an LCA can be limited by the scope of its application designed in stage 1. For example, an LCA can be overgeneralised, due to a limited scope of application, being determined by the investigator [51]. Project investigators might choose to assess a certain aspect of a product, such as CF, which lacks evaluation of the whole significant impact of that product, such as biodiversity, the water footprint and/or the N footprint. A review investigated this by analysing 173 peer-reviewed studies on the impact of products on GHGe and global warming [51]. They found climate change was the most popular impact category, evaluated in 96% of the papers assessed. Other environmental issues were neglected, such as biodiversity, which was one of the least examined impact categories, with only 3% of the studies including the topic. Figure 2 shows a selection of impact categories and the percentage of articles in the meta-analysis that considered them in their study [51].
The length of LCAs can vary [51] starting at “cradle” and often ending at “grave” [53]. But in the agricultural industry, LCAs are also assessed on-farm, from cradle to the farm-gate, evaluating the emissions of inputs and those generated on-farm. However, emissions not formed on-farm are sometimes discounted using this method, such as imported feed, as the emissions are formed off-farm [57]. Studies can fail to consider the cultivation of feed within their scope, even though whether feed is imported or grown on-farm significantly impacts the CF of feed [58], as does cultivation through fertiliser and pesticide use [27]. For instance, a previous LCA of feed production did not consider whether the feed was imported, where it was imported from and therefore the emissions associated with the transportation of the feed or impact on the area’s environment and land use [59]. A huge proportion of animal feed is also imported from abroad; for instance, in 2019, the UK imported more than two million tonnes of SBM for livestock feed such as swine, poultry, and cattle [60]. However, the LCA method does allow for import emissions to show an accurate overview of emissions [61]. The issue resides with the scope design, rather than the LCA methodology, as poor planning can lead to the neglect of another area or impact [51]. The scope needs to be developed appropriately to gain a holistic view of a product and to avoid a narrow scope that would negatively impact another area of the environment. Nevertheless, a benefit of an LCA can be to focus on a particular area, provided further research on the potential impacts is acknowledged prior to implementation.
There are also multiple sources of imported feed from across the globe, and data on the difference in the GHGe between supplying countries are limited, which effects the accuracy of GHGe results [51,56]. The lack of data led to one study using an average to represent all import emissions, irrelevant of the transport distance, which was not accounted for [56]. Another consequence of insufficient data can lead to the tweaking of boundaries for defining terminology [51]. For instance, McClelland et al. [51] aimed to assess the impact of imported feed against feed grown on-farm but found that a very restricted number of farms studied were self-sufficient; this would create the baseline for the data. To overcome this issue, it was decided that studies using less than 10% of imported feed would be categorised as “self-contained” to form the baseline. However, this instability in boundaries could lead to errors in the results and cause difficulty between comparisons.
There are various forms of functional units for how GHGe are reported, such as per hectare of land, per animal, per unit of energy or output produced, such as milk or protein. It is vital that the functional units used in an LCA are declared and standardised, as they are not accurately comparable, suggesting different systems or feeds as more environmentally friendly [45]. For instance, when two forages were compared, corn-silage appeared to result in higher emissions than lucerne, when measured per kg of CO2 per hectare, but less per kg of protein. The same can occur in production systems, as they have different aims and measurement units, with housed systems aiming for high efficiency, favouring large milk yield (MY) per cow and per area. The large production often leads to a tendency for housed systems to use GHGe per unit of milk produced, as a more optimal unit for representing the systems GHGe as low. By contrast, pasture-based systems often have a preference for smaller cattle, leading to lower MY and efficiency [11]. Thus, pasture-based tend to favour high MY per hectare of land, presenting GHGe per hectare of land, as the area tends to be larger to stretch the GHGe to appear lower [37]. The unit GHGe per hectare of land also lacks consideration for the milk output of cattle. It is beneficial to base functional units on production, to improve efficiency and measure GHGe based on the output of the farm.
Farming is a career and source of income for those in the industry, making the costs and profit of different systems and mitigation strategies a key factor in decision-making [13,62]. Strategies that have not been thoroughly evaluated to show a profitability return after investment are unlikely to be implemented on-farm [62]. Nevertheless, there are a limited number of LCA studies evaluating the economic factors of dairy production systems [12,37,63]. Not only are the economics important, but it is critical to include economic, environmental, and social aspects to holistically assess the sustainability of a product [12]. Yet, LCAs generally lack inclusion and analysis of the social or economic properties of a product [2] and very few LCAs have assessed both emissions of the dairy system, milk production, and profits [64]
Significant trade-offs have also been identified, when both the environmental and economic implications of systems have been assessed. For example, grass-based systems in Pennsylvania showed larger profits, but higher emissions per milk produced than housed systems [37]. Researchers have highlighted the need for LCA studies to incorporate the economic costs of different production systems, as well as emissions, to aid policy [65]. The vital research can inform the government of the required subsidies to make changes in practices and limit emissions. Without this research, policymakers would not have the knowledge to financially assist the industry reach the required emission targets, creating a huge barrier between decision makers and farmers.
Models allow the input of data to fit individual farms and assess mitigation strategies, which are more accurate than using a universal mitigation approach, which would not represent all farms given the large variety in production systems [66]. Tailored strategies are more valuable than universal mitigation strategies, that are implemented nationally [1]. Models offer a cost-effective process for evaluating emissions, rather than directly measuring GHGe. Therefore, predicting emissions is the preferred method, but must be accurate to be beneficial, as simulation models are used both in government, to deliberate new approaches to reduce emissions, and on-farm [6]. Models are also a useful tool to show farmers how the mitigation schemes work, as they are straightforward for farmers to understand, being used at a familiar agricultural level. They can therefore be used to convince farmers to apply the suggested strategies on-farm [41,42].
LCAs, and inventory-based models tend to be based on emission factors, standard values, or empirical models to calculate emissions from each component, which are useful for building national inventories and large models [47]. Conversely, empirical, and statistical models are apt for experiments assessing mitigation measures, determining the deviation in emissions and for emission calculators at the farm level that need little input measures. Models that are based on a whole farm level, can evaluate several mitigation strategies at one time and the longitudinal effect of climate change. Ouatahar et al. [47] created a decision tree based on set objectives to aid the decision-making process of choosing a modelling approach, which showed whole farm models (WFMs) to be the desired approach for evaluating different mitigation strategies at the farm scale.

5. Existing Whole Farm Simulation Models

Yet, the majority of current whole farm simulation models (WFMs) used to predict GHGe from dairy and other livestock across the world are based on generalised emission factors, as seen in Table 1 below, from cradle to farm-gate [40]. Current WFMs lack consideration for the level of uncertainty associated with the emission factors used [41]. The IPCC Guidelines are the most representable containing steady values for creating a nation-wide GHG record and comparing emissions internationally [40]. There are multiple tiers in the IPCC guidelines for calculating the GHGe of the agricultural industry, to allow the option of including more detail if available [40], from Tier 1 to Tier 3, with Tier 2 being the most used strategy [67]. The Tier 1 methodology is the simplest form, to allow estimation of emissions with little needed inputs, to allow ease of use. The calculation of emissions can be conducted with a minimum input of the number of livestock on-farm. Tier 2 is an enhanced version of Tier 1, where additional inputs are required, such as type of livestock, manure management, diet and production system used. However, the methodology has been criticised as it lacks consideration for variations in farms, such as the type of location and management system [40]. But, if sufficient detail is available, IPCC also offers a Tier 3 approach, which is the most advanced of the methodologies, requiring the manure and enteric CH4 calculation methodologies, dietary information and the calculations used for energy requirements [67]. The methodology incorporates country-specific data to accurately predict emissions for the region, but data are needed for this function.
The IPCC methodology is very popular in existing models, such as Holos [19], HolosNor [78], FarmSIM [41], OVERSEER [85], GLEAM [88], REPRO [89], Cool Farm Tool [90], Arla Global Climate Check Carbon tool [3,92], Farmscoper [94] and Agrecalc [95]. The IPCC methodology is also programmed into models as an optional methodology for either predicting manure, enteric emissions or both, similar to the GHG model [21], DairyWise [41], DairyGEM [72], SIMSDAIRY [71], Integrated Farm System Model [101], Valio Carbo® Farm calculator [90], GAS-EM [3], the INRA method [102], FarmGHG [69,70], Dairy Tier 3 [68,74] and BEEFGEM [82].
Nevertheless, the IPCC methodology is flawed, as the approach is deficient in information to compare emissions between management systems and farms across the tiers [40,47]. The methodology was built for use as a national inventory and not to be used as a tool to predict an individual farm’s emissions and evaluate mitigation strategies [47]. The approach also does not differentiate between imported and locally sourced feed, presuming a mixture of the two, which might not accurately reflect or compare farm emissions [40]. WFMs are used to overcome these issues, as inputs and emissions can be adjusted as needed to accurately reflect the individual farm and their emissions. A method that incorporates the complete system is needed to precisely evaluate the GHGe of the agricultural system [47].
Yet, existing models mostly neglect to examine the economics of different mitigation strategies, due to limited data on costs and investments [102]. From the worldwide models highlighted in Table 1, economic inclusion was 32% of the models and the CS component was 29%. Production costs significantly influence decision-making; therefore, if profitable, economic inclusion could encourage low emission strategies and their uptake [101]. Existing simulation models also do not tend to include a CS component. Out of 31 WFMs found in the literature, only eight included CS, namely: Farm Sim [41], Hoofprint [84], The GHG Model [21], Holos [12], AgreCalc [95], Farmscoper [94], the Valio Carbo® Farm calculator [91], and FarmAC [87]. Teagasc have developed a Sustainability Digital Platform AgNav [96]. Agnav has been developed in collaboration with Teagasc, the Irish Cattle Breeding Federation (ICBF) and Bord Bia. Agnav has been piloted on farmers, which began in March 2023, and is limited to farmers taking part in the Signpost advisory programme [103]. Teagasc aim to incorporate CS and biodiversity into the tool in the future [96,104].

6. Conclusions and Future Directions

Farm simulation models are vital for evaluating mitigation strategies to reduce the environmental footprints of farms. Their application presents a cost-effective and time-saving measure to assess environmental impacts, whilst minimising negative trade-offs. Embedding LCA frameworks are well applied and integral to evaluating the variety of impacts from ‘cradle’ to ‘farm gate’ [54,57]. Thus, LCA framework-based farm simulation models are currently the best approach for evaluating mitigation solutions to dairy farms. Our review has examined findings from existing studies on life cycle assessment to provide an up-to-date assessment of how such reporting and evaluative measures are applied in the dairy system, as shown in Table 2. Though many of the LCAs and their application have been implemented in Global North contexts, i.e., in the UK, North America, and Europe; these findings also have implications for countries in the Global South that may explore applying similar frameworks to their dairy systems.
The functional unit chosen for presenting the GHGe of the farm, also need to consider the milk output of cattle. By basing the unit on production values, such as milk output, the farmer is encouraged to improve production efficiency to meet required milk demands with a growing population, demand, and nutrients. The output is also more favourable to the farmer, as higher production encourages larger profits [62], a key variable in decision-making [13,62]. The GHGe are then based on the efficiency, such as the production per the number of cattle and GHGe, rather than the amount of land the farmer has and allows the farmer to estimate GHGe per herd, rather than at an individual level, which can be more time consuming and complex. Research into selecting a universal unit will improve comparability between farms and studies. The LCA length also needs to cover all essential contributors and avoid underestimating emissions, such as those from imported feed. Funding and timescales can be an issue to facilitate this; however, a full scope should be devised which shows the full breadth of the topic and can be built upon with future research to ensure that the limitations of a partial LCA are fully recognised in the work to readers and for the application of the outputs.
LCAs are implemented to investigate the overall sustainability of a process or product, including environmental, economic, and social impacts. However, environmental sustainability often dominates LCAs meaning economic and social impacts, including cultural and ethical considerations are missed or simplified. It is important that these variables are incorporated to limit trade-offs between them, as an environmentally friendly strategy may be too expensive to feasibly implement. A holistic scope that includes these factors would limit possible trade-offs. There is a lack of data to conduct thorough LCAs of dairy farms, which leads to simplistic LCAs and the exclusion of multiple variables, such as variations in farms, type of location and management system [40]. In previous LCA analysing the environmental impact of dairy farms, this has led to the tweaking of definitions, such as what constitutes as “self-sufficient” [51]. The relaxation of boundaries and lack of tailored data to individual farms can significantly impact the GHGe reported, leading to misleading and inaccurate results.
To overcome this issue, there needs to be changes in policy to incentivise measuring the environmental footprints on-farm, in addition to biodiversity management plans to increase the data available. DEFRA could then collate the anonymised data and collaborate with researchers to provide country-specific data to tailor results to individual farms. The increase in data availability would allow for researchers to create country-specific and management style averages to show whether farms are performing below or above average for their location and type. Collaboration with key parties is crucial to facilitate knowledge exchange of multiple aspects and develop a holistic scope, void of negative trade-offs. Collaborators include farmers, to gain practical knowledge, such as feasibility, ecologists to provide biodiversity and conservation knowledge, an economist to assist with the economics and environmentalists to provide information on GHGe. Researchers using these mitigation strategies to guide their goal and scope design will then allow policymakers to confidently use their research outputs when implementing strategies and incentives to improve the sustainability of dairy farms.

Author Contributions

Conceptualization, F.T.B.; methodology, F.T.B.; formal analysis, F.T.B. and S.A.; investigation, F.T.B., witing—original draft preparation, F.T.B. and S.A., writing—review and editing, F.T.B. and S.A., project administration, F.T.B. and S.A., and funding acquisition, F.T.B. All authors have read and agreed to the published version of the manuscript.

Funding

This research was funded by the Agricultural and Horticulture Development Board (AHDB) and partly by the Dartington Cattle Breeding Trust, Perry Foundation, Seal-Hayne Educational Trust and West Country Dairy Awards, as part of the Agri-Food Charities Partnership (AFCP), project code [41140078/41240004].

Conflicts of Interest

The authors declare no conflicts of interest.

References

  1. Rotz, C.A.; Stout, R.C.; Holly, M.A.; Kleinman, P.J.A. Regional environmental assessment of dairy farms. J. Dairy Sci. 2020, 103, 3275–3288. [Google Scholar] [CrossRef] [PubMed]
  2. ISO 14040:2006(en); Environmental Management—Life Cycle Assessment—Principles and Framework. International Organization for Standardization: Geneva, Switzerland, 2006. Available online: https://www.iso.org/obp/ui/#iso:std:iso:14040:ed-2:v1:en (accessed on 13 October 2020).
  3. Vibart, R.; de Klein, C.; Jonker, A.; van der Weerden, T.; Bannink, A.; Bayat, A.R.; Crompton, L.; Durand, A.; Eugène, M.; Klumpp, K.; et al. Challenges and opportunities to capture dietary effects in on-farm greenhouse gas emissions models of ruminant systems. Sci. Total Environ. 2021, 769, 144989. [Google Scholar] [CrossRef] [PubMed]
  4. Tarighaleslami, A.H.; Ghannadzadeh, A.; Atkins, M.J.; Walmsley, M.R.W. Environmental life cycle assessment for a cheese production plant towards sustainable energy transition: Natural gas to biomass vs. natural gas to geothermal. J. Clean. Prod. 2020, 275, 122999. [Google Scholar] [CrossRef]
  5. Wang, L.; Setoguchi, A.; Oishi, K.; Sonoda, Y.; Kumagai, H.; Irbis, C.; Inamura, T.; Hirooka, H. Life cycle assessment of 36 dairy farms with by-product feeding in Southwestern China. Sci. Total Environ. 2019, 696, 133985. [Google Scholar] [CrossRef]
  6. Ibidhi, R.; Calsamiglia, S. Carbon footprint assessment of spanish dairy cattle farms: Effectiveness of dietary and farm management practices as a mitigation strategy. Animals 2020, 10, 2083. [Google Scholar] [CrossRef]
  7. Byrne, J. Improving the peer review of narrative literature reviews. Res. Integr. Peer Rev. 2016, 1, 12. [Google Scholar] [CrossRef]
  8. Wakefield, A.; Axon, S. Scaling the food mountain: Implications for addressing the determinants of consumer food waste practices. Sustainability 2024, 16, 9409. [Google Scholar] [CrossRef]
  9. Snyder, H. Literature review as a research methodology: An overview and guidelines. J. Bus. Res. 2019, 104, 333–339. [Google Scholar] [CrossRef]
  10. Evans, D.; Kowanko, I. Literature reviews: Evolution of a research methodology. Aust. J. Adv. Nurs. 2000, 18, 33–38. [Google Scholar]
  11. Lorenz, H.; Reinsch, T.; Hess, S.; Taube, F. Is low-input dairy farming more climate friendly? A meta-analysis of the carbon footprints of different production systems. J. Clean. Prod. 2019, 211, 161–170. [Google Scholar] [CrossRef]
  12. Segerkvist, K.A.; Hansson, H.; Sonesson, U.; Gunnarsson, S. Research on Environmental, Economic, and Social Sustainability in Dairy Farming: A Systematic Mapping of Current Literature. Sustainability 2020, 12, 5502. [Google Scholar] [CrossRef]
  13. Caffrey, K.R.; Veal, M.W. Conducting an agricultural life cycle assessment: Challenges and perspectives. Sci. World J. 2013, 2013, 472431. [Google Scholar] [CrossRef] [PubMed]
  14. Lovendahl, P.; Difford, G.F.; Li, B.; Chagunda, M.G.G.; Huhtanen, P.; Lidauer, M.H.; Lassen, J.; Lund, P. Review: Selecting for improved feed efficiency and reduced methane emissions in dairy cattle. Animal 2018, 12, s336–s349. [Google Scholar] [CrossRef] [PubMed]
  15. Drews, J.; Czycholl, I.; Krieter, J. A life cycle assessment study of dairy farms in northern Germany: The influence of performance parameters on environmental efficiency. J. Environ. Manag. 2020, 273, 111127. [Google Scholar] [CrossRef]
  16. Mostert, P.F.; van Middelaar, C.E.; Bokkers, E.A.M.; de Boer, I.J.M. The impact of subclinical ketosis in dairy cows on greenhouse gas emissions of milk production. J. Clean. Prod. 2018, 171, 773–782. [Google Scholar] [CrossRef]
  17. Mostert, P.F.; Bokkers, E.A.M.; de Boer, I.J.M.; van Middelaar, C.E. Estimating the impact of clinical mastitis in dairy cows on greenhouse gas emissions using a dynamic stochastic simulation model: A case study. Animal 2019, 13, 2913–2921. [Google Scholar] [CrossRef]
  18. Roque, B.M.; Salwen, J.K.; Kinley, R.; Kebreab, E. Inclusion of Asparagopsis armata in lactating dairy cows’ diet reduces enteric methane emission by over 50 percent. J. Clean. Prod. 2019, 234, 132–138. [Google Scholar] [CrossRef]
  19. Mc Geough, E.J.; Little, S.M.; Janzen, H.H.; McAllister, T.A.; McGinn, S.M.; Beauchemin, K.A. Life-cycle assessment of greenhouse gas emissions from dairy production in Eastern Canada: A case study. J. Dairy Sci. 2012, 95, 5164–5175. [Google Scholar] [CrossRef]
  20. van Middelaar, C.E.; Berentsen, P.B.M.; Dijkstra, J.; van Arendonk, J.A.M.; de Boer, I.J.M. Effect of feed-related farm characteristics on relative values of genetic traits in dairy cows to reduce greenhouse gas emissions along the chain. J. Dairy Sci. 2015, 98, 4889–4903. [Google Scholar] [CrossRef]
  21. O’Brien, D.; Geoghegan, A.; McNamara, K.; Shalloo, L. How can grass-based dairy farmers reduce the carbon footprint of milk? Anim. Prod. Sci. 2016, 56, 495–500. [Google Scholar] [CrossRef]
  22. Sorley, M.; Casey, I.; Styles, D.; Merino, P.; Trindade, H.; Mulholland, M.; Resch Zafra, C.; Keatinge, R.; le Gall, A.; O’Brien, D.; et al. Factors influencing the carbon footprint of milk production on dairy farms with different feeding strategies in western Europe. J. Clean. Prod. 2024, 435, 140104. [Google Scholar] [CrossRef]
  23. Soteriades, A.D.; Gonzalez-Mejia, A.M.; Styles, D.; Foskolos, A.; Moorby, J.M.; Gibbons, J.M. Effects of high-sugar grasses and improved manure management on the environmental footprint of milk production at the farm level. J. Clean. Prod. 2018, 202, 1241–1252. [Google Scholar] [CrossRef]
  24. IPCC. CH4 and N2O Emissions from Livestock Manure. 2019. Available online: https://www.ipcc-nggip.iges.or.jp/public/gp/bgp/4_2_CH4_and_N2O_Livestock_Manure.pdf (accessed on 14 February 2022).
  25. Owen, J.J.; Silver, W.L. Greenhouse gas emissions from dairy manure management: A review of field-based studies. Glob. Change Biol. 2015, 21, 550–565. [Google Scholar] [CrossRef] [PubMed]
  26. Aguirre-Villegas, H.A.; Larson, R.A. Evaluating greenhouse gas emissions from dairy manure management practices using survey data and lifecycle tools. J. Clean. Prod. 2017, 143, 169–179. [Google Scholar] [CrossRef]
  27. FAO. Global Livestock Environmental Assessment Model (GLEAM). 2020. Available online: https://www.fao.org/gleam/results (accessed on 20 December 2020).
  28. Liu, L.; Zheng, X.; Wei, X.; Kai, Z.; Xu, Y. Excessive application of chemical fertilizer and organophosphorus pesticides induced total phosphorus loss from planting causing surface water eutrophication. Sci. Rep. 2021, 11, 1–8. [Google Scholar] [CrossRef]
  29. Evans, L.; VanderZaag, A.C.; Sokolov, V.; Baldé, H.; MacDonald, D.; Wagner-Riddle, C.; Gordon, R. Ammonia emissions from the field application of liquid dairy manure after anaerobic digestion or mechanical separation in Ontario, Canada. Agric. For. Meteorol. 2018, 258, 89–95. [Google Scholar] [CrossRef]
  30. DEFRA. Environmental Improvement Plan 2023; Defra—Department for Environment Food and Rural Affairs: London, UK, 2023. [Google Scholar]
  31. DEFRA. Greenhouse Gas Mitigation Practices-Farm Practices Survey England 2021; Defra—Department for Environment Food and Rural Affairs: London, UK, 2021. Available online: https://www.gov.uk/government/statistics/farm-practices-survey-february-2021-greenhouse-gas-mitigation-practices (accessed on 14 February 2022).
  32. Vetter, S.H.; Malin, D.; Smith, P.; Hillier, J. The potential to reduce GHG emissions in egg production using a GHG calculator—A Cool Farm Tool case study. J. Clean. Prod. 2018, 202, 1068–1076. [Google Scholar] [CrossRef]
  33. Food Standards Agency. Pesticides in Food. 2021. Available online: https://www.food.gov.uk/business-guidance/pesticides-in-food (accessed on 3 March 2023).
  34. Hansen, T.L.; Li, M.; Li, J.; Vankerhove, C.J.; Sotirova, M.A.; Tricarico, J.M.; Cabrera, V.E.; Kebreab, E.; Reed, K.F. The ruminant farm systems animal module: A biophysical description of animal management. Animals 2021, 11, 1373. [Google Scholar] [CrossRef]
  35. Jia, Z.Q.; Zhang, Y.C.; Huang, Q.T.; Jones, A.K.; Han, Z.J.; Zhao, C.Q. Acute toxicity, bioconcentration, elimination, action mode and detoxification metabolism of broflanilide in zebrafish, Danio rerio. J. Hazard. Mater. 2020, 394, 122521. [Google Scholar] [CrossRef]
  36. Straw, E.A.; Brown, M.J.F. Co-formulant in a commercial fungicide product causes lethal and sub-lethal effects in bumble bees. Sci. Rep. 2021, 11, 21653. [Google Scholar] [CrossRef]
  37. Rotz, C.A.; Holly, M.; de Long, A.; Egan, F.; Kleinman, P.J.A. An environmental assessment of grass-based dairy production in the northeastern United States. Agric. Syst. 2020, 184, 102887. [Google Scholar] [CrossRef]
  38. Üçtuğ, F.G. The Environmental Life Cycle Assessment of Dairy Products. Food Eng. Rev. 2019, 11, 104–121. [Google Scholar] [CrossRef]
  39. DEFRA. Agri-Climate Report 2021—GOV.UK. 2021. Available online: https://www.gov.uk/government/statistics/agri-climate-report-2021/agri-climate-report-2021 (accessed on 14 February 2022).
  40. Crosson, P.; Shalloo, L.; O’Brien, D.; Lanigan, G.J.; Foley, P.A.; Boland, T.M.; Kenny, D.A. A review of whole farm systems models of greenhouse gas emissions from beef and dairy cattle production systems. Anim. Feed. Sci. Technol. 2011, 166–167, 29–45. [Google Scholar] [CrossRef]
  41. Schils, R.L.M.; Olesen, J.E.; del Prado, A.; Soussana, J.F. A review of farm level modelling approaches for mitigating greenhouse gas emissions from ruminant livestock systems. Livest. Sci. 2007, 112, 240–251. [Google Scholar] [CrossRef]
  42. Schils, R.L.M.; De Haan, M.H.A.; Hemmer, J.G.A.; Van den Pol-van Dasselaar, A.; De Boer, J.A.; Evers, A.G.; Holshof, G.; Van Middelkoop, J.C.; Zom, R.L.G. DairyWise, a Whole-Farm Dairy Model. J. Dairy Sci. 2007, 90, 5334–5346. [Google Scholar] [CrossRef]
  43. Kiefer, L.; Menzel, F.; Bahrs, E. The effect of feed demand on greenhouse gas emissions and farm profitability for organic and conventional dairy farms. J. Dairy Sci. 2014, 97, 7564–7574. [Google Scholar] [CrossRef]
  44. O’Brien, D.; Shalloo, L.; Grainger, C.; Buckley, F.; Horan, B.; Wallace, M. The influence of strain of Holstein-Friesian cow and feeding system on greenhouse gas emissions from pastoral dairy farms. J. Dairy Sci. 2010, 93, 3390–3402. [Google Scholar] [CrossRef]
  45. Little, S.M.; Benchaar, C.; Janzen, H.H.; Kröbel, R.; McGeough, E.J.; Beauchemin, K.A. Demonstrating the Effect of Forage Source on the Carbon Footprint of a Canadian Dairy Farm Using Whole-Systems Analysis and the Holos Model: Alfalfa Silage vs. Corn Silage. Climate 2017, 5, 87. [Google Scholar] [CrossRef]
  46. Patra, A.; Park, T.; Kim, M.; Yu, Z. Rumen methanogens and mitigation of methane emission by anti-methanogenic compounds and substances. J. Anim. Sci. Biotechnol. 2017, 8, 13. [Google Scholar] [CrossRef]
  47. Ouatahar, L.; Bannink, A.; Lanigan, G.; Amon, B. Modelling the effect of feeding management on greenhouse gas and nitrogen emissions in cattle farming systems. Sci. Total Environ. 2021, 776, 145932. [Google Scholar] [CrossRef]
  48. Caro, D. Carbon Footprint. Encycl. Ecol. 2019, 4, 252–257. [Google Scholar] [CrossRef]
  49. Gilardino, A.; Quispe, I.; Pacheco, M.; Bartl, K. Comparison of different methods for consideration of multifunctionality of Peruvian dairy cattle in Life Cycle Assessment. Livest. Sci. 2020, 240, 104151. [Google Scholar] [CrossRef]
  50. Komínková, D. Environmental Impact Assessment and Application—Part 1. In Reference Module in Earth Systems and Environmental Sciences; Elsevier: Amsterdam, The Netherlands, 2016. [Google Scholar] [CrossRef]
  51. McClelland, S.C.; Arndt, C.; Gordon, D.R.; Thoma, G. Type and number of environmental impact categories used in livestock life cycle assessment: A systematic review. Livest. Sci. 2018, 209, 39–45. [Google Scholar] [CrossRef]
  52. Paramesh, V.; Parajuli, R.; Chakurkar, E.B.; Sreekanth, G.B.; Kumar, H.B.C.; Gokuldas, P.P.; Mahajan, G.R.; Manohara, K.K.; Viswanatha, R.K.; Ravisankar, N. Sustainability, energy budgeting, and life cycle assessment of crop-dairy-fish-poultry mixed farming system for coastal lowlands under humid tropic condition of India. Energy 2019, 188, 116101. [Google Scholar] [CrossRef]
  53. FAO. GLEAM, a Comprehensive Life Cycle Assessment of Livestock Sector’s Environmental Impacts. 2015. Available online: http://www.fao.org/ag/againfo/home/en/news_archive/2015_GLEAM_environmental_impacts.html (accessed on 20 December 2020).
  54. Curran, M.A. Life-cycle assessment. In Encyclopedia of Ecology; Elsevier: Amsterdam, The Netherlands, 2016; pp. 359–366. [Google Scholar] [CrossRef]
  55. Leip, A.; Uwizeye, A. Nitrogen Footprints. In Encyclopedia of Ecology; Elsevier: Amsterdam, The Netherlands, 2019; pp. 370–382. [Google Scholar] [CrossRef]
  56. Weiss, F.; Leip, A. Greenhouse gas emissions from the EU livestock sector: A life cycle assessment carried out with the CAPRI model. Agric. Ecosyst. Environ. 2012, 149, 124–134. [Google Scholar] [CrossRef]
  57. Beukes, P.C.; Gregorini, P.; Romera, A.J.; Levy, G.; Waghorn, G.C. Improving production efficiency as a strategy to mitigate greenhouse gas emissions on pastoral dairy farms in New Zealand. Agric. Ecosyst. Environ. 2010, 136, 358–365. [Google Scholar] [CrossRef]
  58. Mogensen, L.; Kristensen, T.; Nguyen, T.L.T.; Knudsen, M.T.; Hermansen, J.E. Method for calculating carbon footprint of cattle feeds—Including contribution from soil carbon changes and use of cattle manure. J. Clean. Prod. 2014, 73, 40–51. [Google Scholar] [CrossRef]
  59. Park, Y.S.; Lee, K.M.; Yang, S.H. Life Cycle Assessment of the Domestic Dairy Cow System. J. Korean Soc. Environ. Eng. 2015, 37, 52–59. [Google Scholar] [CrossRef]
  60. 60. Experts in Sustainable Forest & Agricultural Advice (EFECA). Prepared for the UK Roundtable on Sustainable Soya. 2019. Available online: https://www.efeca.com/wp-content/uploads/2019/12/UK-RT-on-Sustainable-Soya-APR-2019-final.pdf (accessed on 16 May 2024).
  61. Bertrand, S.; Barnett, J. Standard method for determining the carbon footprint of dairy products reduces confusion. Anim. Front. 2011, 1, 14–18. [Google Scholar] [CrossRef]
  62. Hristov, A.N.; Oh, J.; Firkins, J.L.; Dijkstra, J.; Kebreab, E.; Waghorn, G.; Makkar, H.P.S.; Adesogan, A.T.; Yang, W.; Lee, C.; et al. Special topics—Mitigation of methane and nitrous oxide emissions from animal operations: I. A review of enteric methane mitigation options. J. Anim. Sci. 2013, 91, 5045–5069. [Google Scholar] [CrossRef]
  63. Ruviaro, C.F.; de Leis, C.M.; Florindo, T.J.; de Medeiros Florindo, G.I.B.; da Costa, J.S.; Tang, W.Z.; Pinto, A.T.; Soares, S.R. Life cycle cost analysis of dairy production systems in Southern Brazil. Sci. Total Environ. 2020, 741, 140273. [Google Scholar] [CrossRef] [PubMed]
  64. Jayasundara, S.; Worden, D.; Weersink, A.; Wright, T.; VanderZaag, A.; Gordon, R.; Wagner-Riddle, C. Improving farm profitability also reduces the carbon footprint of milk production in intensive dairy production systems. J. Clean. Prod. 2019, 229, 1018–1028. [Google Scholar] [CrossRef]
  65. Parajuli, R.; Dalgaard, T.; Birkved, M. Can farmers mitigate environmental impacts through combined production of food, fuel and feed? A consequential life cycle assessment of integrated mixed crop-livestock system with a green biorefinery. Sci. Total Environ. 2018, 619–620, 127–143. [Google Scholar] [CrossRef] [PubMed]
  66. Jose, V.S.; Sejian, V.; Bagath, M.; Ratnakaran, A.P.; Lees, A.M.; Al-Hosni, Y.A.S.; Sullivan, M.; Bhatta, R.; Gaughan, J.B. Modeling of Greenhouse Gas Emission from Livestock. Front. Environ. Sci. 2016, 4, 191545. [Google Scholar] [CrossRef]
  67. IPCC. Chapter 10 Emissions from Livestock and Manure Management. 2006. Available online: https://www.ipcc-nggip.iges.or.jp/public/2006gl/ (accessed on 14 February 2022).
  68. Bannink, A.; Zom, R.L.G.; Groenestein, K.C.; Dijkstra, J.; Sebek, L.B.J. Applying a mechanistic fermentation and digestion model for dairy cows with emission and nutrient cycling inventory and accounting methodology. Animal 2020, 14, s406–s416. [Google Scholar] [CrossRef]
  69. Olesen, J.E.; Schelde, K.; Ministry of Food, Agriculture and Fisheries Internal Report. FarmGHG A Model for Estimating Greenhouse Gas Emissions from Livestock. 2004. Available online: https://pure.au.dk/portal/da/publications/farmghg-users-manual-a-model-for-estimating-greenhouse-gas-emissi (accessed on 21 March 2021).
  70. Olesen, J.E.; Schelde, K.; Weiske, A.; Weisberg, M.R.; Asman, W.A.H.; Djurhuus, J. Modelling greenhouse gas emissions from European conventional and organic dairy farms. Agric. Ecosyst. Environ. 2006, 112, 207–220. [Google Scholar] [CrossRef]
  71. del Prado, A.; Misselbrook, T.; Chadwick, D.; Hopkins, A.; Dewhurst, R.J.; Davison, P.; Butler, A.; Schröder, J.; Scholefield, D. SIMSDAIRY: A modelling framework to identify sustainable dairy farms in the UK. Framework description and test for organic systems and N fertiliser optimisation. Sci. Total Environ. 2011, 409, 3993–4009. [Google Scholar] [CrossRef]
  72. Rotz, A.C.; Chianwaw, D.S.; Montes, F.; Hafner, S.; Bonifacio, H.F. Dairy Gas Emissions Model (DairyGEM), Reference Manual. 2015. Available online: https://www.agmrv.org/knowledge-portal/resources/the-dairy-gas-emissions-model-dairygem/ (accessed on 5 May 2021).
  73. Beukes, P.C.; Gregorini, P.; Romera, A.J. Estimating greenhouse gas emissions from New Zealand dairy systems using a mechanistic whole farm model and inventory methodology. Anim. Feed. Sci. Technol. 2011, 166–167, 708–720. [Google Scholar] [CrossRef]
  74. Dijkstra, J.; Bannink, A.; Bosma, P.M.; Lantinga, E.A.; Reijs, J.W. Modeling the Effect of Nutritional Strategies for Dairy Cows on the Composition of Excreta Nitrogen. Front. Sustain. Food Syst. 2018, 2, 63. [Google Scholar] [CrossRef]
  75. Nielsen, N.I.; Volden, H.; Åkerlind, M.; Brask, M.; Hellwing, A.L.F.; Storlien, T.; Bertilsson, J. A prediction equation for enteric methane emission from dairy cows for use in NorFor. Acta Agric. Scand. A Anim. Sci. 2013, 63, 126–130. [Google Scholar] [CrossRef]
  76. The Primary Industries Climate Challenges Centre (PICCC). Tools Greenhouse Accounting Frameworks (GAF) for Australian Primary Industries. 2023. Available online: https://www.piccc.org.au/resources/Tools (accessed on 8 February 2023).
  77. Dairy Australia. Australian Dairy Carbon Calculator—DGAS. 2023. Available online: https://www.dairyaustralia.com.au/en/climate-and-environment/greenhouse-gas-emissions/australian-dairy-carbon-calculator (accessed on 8 February 2023).
  78. Bonesmo, H.; Beauchemin, K.A.; Harstad, O.M.; Skjelvåg, A.O. Greenhouse gas emission intensities of grass silage based dairy and beef production: A systems analysis of Norwegian farms. Livest. Sci. 2013, 152, 239–252. [Google Scholar] [CrossRef]
  79. Rotz, C.A.; Montes, F.; Hafner, S.D.; Heber, A.J.; Grant, R.H. Ammonia emission model for whole farm evaluation of dairy production systems. J. Environ. Qual. 2014, 43, 1143–1158. [Google Scholar] [CrossRef] [PubMed]
  80. Rotz, C.A.; Corson, M.S.; Chianese, D.S.; Coiner, C.U. The Integrated Farm System Model Reference Manual Version 4.7. 2022. Available online: https://www.researchgate.net/publication/242713478_THE_INTEGRATED_FARM_SYSTEM_MODEL (accessed on 6 April 2021).
  81. Ashfield, A.; Crosson, P.; Wallace, M. Simulation modelling of temperate grassland based dairy calf to beef production systems. Agric. Syst. 2013, 115, 41–50. [Google Scholar] [CrossRef]
  82. Foley, P.A.; Crosson, P.; Lovett, D.K.; Boland, T.M.; O’Mara, F.P.; Kenny, D.A. Whole-farm systems modelling of greenhouse gas emissions from pastoral suckler beef cow production systems. Agric. Ecosyst. Environ. 2011, 142, 222–230. [Google Scholar] [CrossRef]
  83. Danfær, A.; Huhtanen, P.; Udén, P.; Sveinbjornsson, J. The nordic dairy cow model, karoline—Description. In Nutrient Digestion and Utilization in Farm Animals: Modelling Approaches; CABI Publishing: Wallingford, UK, 2006; pp. 383–406. [Google Scholar] [CrossRef]
  84. Sise, J.A.; Kerslake, J.I.; Oliver, M.J.; Glennie, S.; Butler, D.; Behrent, M.; Fennessy, P.F.; Campbell, A.W. Development of a software model to estimate daily greenhouse gas emissions of pasture-fed ruminant farming systems. Anim. Prod. Sci. 2010, 51, 60–70. [Google Scholar] [CrossRef]
  85. Wheeler, D.M.; Ledgard, S.F.; DeKlein, C.A.M. Using the OVERSEER nutrient budget model to estimate on-farm greenhouse gas emissions. Aust. J. Exp. Agric. 2008, 48, 99–103. [Google Scholar] [CrossRef]
  86. Kesting, M.; Witzke, P. Methodology Underlying the CAPRI Model. 2021. Available online: https://climate.ec.europa.eu/system/files/2021-10/policy_strategies_analysis_models_capri_model_methodology_en.pdf (accessed on 21 March 2021).
  87. FarmAC. The FarmAC Model. 2023. Available online: https://www.farmac.dk/ (accessed on 27 January 2023).
  88. Gerber, P.J.; Steinfeld, H.; Henderson, B.; Mottet, A.; Opio, C.; Dijkman, J.; Falcucci, A.; Tempio, G. Tackling climate change through livestock: A global assessment of emissions and mitigation opportunities. In Tackling Climate Change Through Livestock: A Global Assessment of Emissions and Mitigation Opportunities; CABI Publishing: Wallingford, UK, 2013; Available online: https://www.fao.org/4/i3437e/i3437e.pdf (accessed on 28 February 2021).
  89. Küstermann, B.; Kainz, M.; Hülsbergen, K.J. Modeling carbon cycles and estimation of greenhouse gas emissions from organic and conventional farming systems. Renew. Agric. Food Syst. 2008, 23, 38–52. [Google Scholar] [CrossRef]
  90. Hillier, J.; Walter, C.; Malin, D.; Garcia-Suarez, T.; Mila-i-Canals, L.; Smith, P. A farm-focused calculator for emissions from crop and livestock production. Environ. Model. Softw. 2011, 26, 1070–1078. [Google Scholar] [CrossRef]
  91. Valio. Valio Introduces Valio Carbo® Farm Calculator—To Help Lower its Farmers’ CO2e Emissions by an Estimated 30% Within 5 Years. 2020. Available online: https://www.valio.com/news/valio-introduces-valio-carbo-farm-calculator---to-help-lower-its-farmers-co2e-emissions-by-an-estimated-30-within-5-years/ (accessed on 2 February 2023).
  92. Arla. How We Measure Dairy Farming’s Carbon Footprint. 2023. Available online: https://www.arla.com/sustainability/sustainable-dairy-farming/how-we-measure-dairy-farmings-carbon-footprint/#how-do-we-know-that-arla-farmers-are-among-the-most-climate-efficient-in-the-world (accessed on 8 February 2023).
  93. Eugène, M.; Sauvant, D.; Nozière, P.; Viallard, D.; Oueslati, K.; Lherm, M.; Mathias, E.; Doreau, M. A new Tier 3 method to calculate methane emission inventory for ruminants. J. Environ. Manag. 2019, 231, 982–988. [Google Scholar] [CrossRef]
  94. Gooday, R.D.; Anthony, S.G.; Durrant, C.; Harris, D.; Lee, D.; Metcalfe, P.; Newell-Proce, P.; Turner, A. Farmscoper Extension: Defra Project SCF0104. 2015. Available online: https://adas.co.uk/services/farmscoper/ (accessed on 2 March 2021).
  95. Agrecalc. How We Calculate Your Carbon Footprint: Our Modelling Methodology. 2025. Available online: https://www.agrecalc.com/home/about/information-on-ipcc-methodologies/ (accessed on 10 October 2020).
  96. Teagasc. Teagasc Climate Action Strategy—Sustainability Digital Platform. 2022. Available online: https://www.teagasc.ie/news--events/daily/environment/teagasc-climate-action-strategy---sustainability-digital-platform.php (accessed on 7 February 2023).
  97. Niu, M.; Kebreab, E.; Hristov, A.N.; Oh, J.; Arndt, C.; Bannink, A.; Bayat, A.R.; Brito, A.F.; Boland, T.; Casper, D.; et al. Prediction of enteric methane production, yield, and intensity in dairy cattle using an intercontinental database. Glob. Change Biol. 2018, 24, 3368–3389. [Google Scholar] [CrossRef]
  98. Hassaan, M.A.; El Nemr, A. Pesticides pollution: Classifications, human health impact, extraction and treatment techniques. Egypt. J. Aquat. Res. 2020, 46, 207–220. [Google Scholar] [CrossRef]
  99. Johnson, I.R.; Chapman, D.; Parsons, A.J.; Eckard, R. DairyMod: A Biophysical Simulation Model of the Australian Dairy System. 2003. Available online: https://www.researchgate.net/publication/259892592_DairyMod_a_biophysical_simulation_model_of_the_Australian_dairy_system (accessed on 30 June 2023).
  100. Cabrera, V.E.; Breuer, N.E.; Hildebrand, P.E.; Letson, D. The dynamic North Florida dairy farm model: A user-friendly computerized tool for increasing profits while minimizing N leaching under varying climatic conditions. Comput. Electron. Agric. 2005, 49, 286–308. [Google Scholar] [CrossRef]
  101. Finnegan, W.; Yan, M.; Holden, N.M.; Goggins, J. A review of environmental life cycle assessment studies examining cheese production. Int. J. Life Cycle Assess. 2018, 23, 1773–1787. [Google Scholar] [CrossRef]
  102. Lie, H.; Rich, K.M.; van der Hoek, R.; Dizyee, K. An empirical evaluation of policy options for inclusive dairy value chain development in Nicaragua: A system dynamics approach. Agric. Syst. 2018, 164, 193–222. [Google Scholar] [CrossRef]
  103. Teagasc. AgNav—A Sustainable Digital Platform to Support Farmers. 2023. Available online: https://www.teagasc.ie/news--events/news/2023/agnav--a-sustainable-dig.php (accessed on 9 September 2024).
  104. Today’s Farm. AgNav: A New Way to Measure. 2023. Available online: https://www.teagasc.ie/media/website/publications/2023/AgNav---A-new-way-to-measure-and-enhance-sustainability.pdf (accessed on 18 November 2024).
Figure 1. The stages of a life cycle assessment methodology, derived from the official International Organisation for Standardisation methodology [2].
Land 14 01207 g001
Figure 2. The percentage of articles in the meta-analysis by McClelland et al. [51] that reviewed LCA applications and their focal impact categories.
Land 14 01207 g002
Table 1. List of worldwide simulation models used to examine the environmental impact of livestock and the areas they cover, adapted from Schils, Olesen et al. (2007) [41]. CH4 = methane, CO2 = carbon dioxide, N2O = nitrous oxide, CS = carbon sequestration, AW = animal welfare, EME = enteric methane emissions, H2 = hydrogen, VFA = volatile fatty acids, OMD = organic matter digestibility, N = nitrogen, DM/DMI = dry matter/intake, CP = crude protein, vs. = volatile solids.
Model NameAnimalCH4CO2N2OCSNH3 and NO3EconomicsAWBiodiversityEME MeasurementManure MeasurementCountryReference
DairyWiseDairy CH4 EF × DMI (Schils et al., 2006) and updated [68]Emission factorNetherlandsSchils, De Haan et al. [42]; Bannink et al. [68]
FarmGHGDairy Kirchgessner et al. (1995) cited in [69,70]IPCC Tier 2EuropeOlesen et al. [69,70]
SIMS DairyDairy Giger-Reverdin et al. (2003) cited in [71]IPCC and Chadwick and Pain (1997) and Yamulki et al. (1999) cited in [71]UKDel Prado et al. [71]
DairyGEMDairy Mills (2003) cited in [72]IPCC (2006) Tier 2 and Sommer (2004) cited in [72]USARotz et al. [72]
HolosDairy IPCCIPCCCanadaMc Geough et al. [19]
WFMDairy H2 balance and VFA profileEstimates OMD and N excretion, not N2O or CH4 from manureNew ZealandBeukes et al. [57]; Beukes, Gregorini and Romera [73]
The GHG modelDairy (Mills et al., 2003; IPCC, 2006) cited in [21]Emission factorsIrelandO’Brien et al. [21]
Dairy Tier 3Dairy Rumen H2 based on VFA stoichiometryIPCC Tier 2NetherlandsBannink, van Schijndel and Dijkstra [68]; Dijkstra et al. [74]
NorForDairy Nielsen et al. [75] Sweden/DenmarkNielsen et al. [75]
D-GAFDairy Livestock numbers, DMI, DM digestibility, milk metabolic rate increase, liveweight, liveweight gain and milk productionVS, DM digestibility, emission potential (0.24), ash content, methane conversion factorAustraliaThe Primary Industries Climate Challenges Centre (PICCC) [76]
D-GASDairy Based on DM, DM Digestibility and CPEmissions factorAustraliaDairy Australia [77]
HolosNorDairy and Beef IPCC (2006) Tier 2 and digestibility of the diet [67]IPCC (2006) [67]NorwayBonesmo et al. [78]
Integrated Farm System Model (IFSM)Dairy and Beef Mills 2003 cited in [79,80]IPCC 2006 Tier 2 [67] and Sommer (2004) cited in [79,80]USARotz et al. [79,80]
FarmSimCattle IPCC Tier 1 and 2IPCC Tier 2FranceSchils, Olesen et al. [41]
Grange Dairy Beef Systems ModelCattle Based on real measurements Ashfield, Crosson and Wallace [81]
BEEFGEMBeef IPCC (2006) [67]Husted (1994), Chadwick (2000) and Oenema (1997) cited in [82]IrelandFoley et al. [82]
KarolineBeef Rumen H2, VFA stoichiometry, CH4 formation in hind gutmanure N and P outputDenmark/Sweden, and FinlandDanfær et al. [83]
HoofprintSheep and beef Energy intake × number of animalsEnergy intake × number of animalsNew ZealandSise et al. [84]
OVERSEERRuminants NO3 EF (21.6 g CH4 kg−1 DMI) × animal intake (IPCC, 2006) [67]NZ inventory EF and IPCC Tier 2 [67]New ZealandWheeler et al. [85]
CAPRIRuminants and non-ruminants Data Coefficients EUKesting and Witzke [86]
FarmACRuminants and non-ruminants Not specifiedNot specifiedDenmarkFarmAC [87]
GLEAMRuminants and non-ruminants IPCC Tier 2 [67]IPCC Tier 2 [67]-Gerber et al. [88]
REPRORuminants and non-ruminants Aim for future moduleIPCC—conversion factors [67]IPCC [67]GermanyK✓stermann, Kainz and H✓lsbergen [89]
Cool Farm ToolVarious livestock IPCC and FCRIPCC Tier 2-Hillier et al. [90]
Valio Carbo® Farm calculatorVarious livestock (Ramin and Huhtanen, 2013) cited in [91]Sommer et al. (2004), (Elsgaad (2016), Petersen (2016), IPCC (2006) [67] and (Gronroos et al. 2017) cited in [91]FinlandValio [91]
INRA methodVarious livestock Sauvant and Nozière (2016) cited in [92]IPCC Tier 2 [67] and Eugene 2019 [93]FranceEugène et al. [93]
GAS-EMVarious livestock Kirchgessner et al. (1994) cited in [3]IPCC Tier 2 [67]GermanyVibart et al. [3]
Arla Global Climate Check Carbon toolVarious livestock IPCC 2006 [67]IPCC 2006 [67]Sweden/Denmark/Germany/UKVibart et al. [3]; Arla [92]
FarmscoperVarious livestock IPCC 1996 cited in [94]IPCC Tier 2 (1996) cited in [94]UKGooday et al. [94]
AgrecalcVarious livestock IPCC 2006 Tier 2 [67]IPCC Tier 2 [67]UKAgrecalc [95]
Sustainability Digital Platform—in developmentVarious livestock NUE ---Teagasc [96]
The Ruminant Farm Systems Model (RuFaS)Dairy Choice of three:
(1) Niu et al. [97]
(2) Mills et al., Mitsherlich Model 3 cited in [98], or (3) the IPCC Tier 2 model [67]
Based on animal and dietary characteristics and IPCC Tier 2 [67]USAHansen et al. [98]
DairyModDairy AustraliaJohnson et al. [99]
DyNoFloDairy Estimates manure N excretion using milk production from milking cows and book values for dry cows, heifers, and steers.USA—FloridaCabrera et al. [100]
Table 2. Mitigation measures to offset LCA application limitations.
LimitationIssueMitigation MeasureOutcomes
Investigator guidance during scope designUnholistic scope designCan lead to trade-offs and negative impactsCollaborating with key parties, e.g., ecologists, and the local community and engaging in knowledge exchangeAllows knowledge exchange between various parties to consider multiple aspects and limit possible trade-offs.
Lacking comparabilityMultiple units and insufficient information to compare management systemsInvestigate the functional units to ensure the choice does not bias the result towards one system. Basing the unit on production efficiency.A universal functional unit, to allow easy comparison between farms and outputs. Based on production efficiency to encourage high efficiency and large profits and a manageable level to calculate.
LCA lengthlacks inclusion of all inputs, e.g., Imported feedLength needs to ensure all emissions are included and total is not skewed or underestimating emissions.If time-scale is an issue then a larger study should be planned with the aim of completion in the future to show a more holistic view. With the limitations of the current study clearly highlighted.
Bias towards environmental sustainabilityLCAs of dairy farms often lack consideration for social and economic impacts, when economics can have a large influence on decision-making.Consider sustainability holistically, by including social and economic impacts when possible to be more inclusive.A holistically approach to ensure there are no-trade offs between environmental, economic and social sustainability, that would impact feasibility in real life.
Policy guidanceLack of dataCan lead to the tweaking of boundaries, e.g., self-sufficiency and more generalised data.DEFRA to provide anonymised country-specific data for researchers and to collaborate. Policymakers and Government to incentivise farmers to measure their environmental impact via farm calculator tools, implement a biodiversity management plan and encourage surveying the biodiversity of the farm.A higher volume of farms measuring their emissions and biodiversity on-farm to collate large datasets for country-specific data. Baseline data for countries, farm types and sizes to have tailored data for specific farms. Overcoming the issues of the limitations of IPCC tier 1.
Disclaimer/Publisher’s Note: The statements, opinions and data contained in all publications are solely those of the individual author(s) and contributor(s) and not of MDPI and/or the editor(s). MDPI and/or the editor(s) disclaim responsibility for any injury to people or property resulting from any ideas, methods, instructions or products referred to in the content.

