Article

Risk Identification and Spatiotemporal Evolution in Rural Land Trusteeship

Research Center of Digital Rural Service, School of Public Management, China University of Mining and Technology, Xuzhou 221116, China
*
Author to whom correspondence should be addressed.
Land 2025, 14(6), 1132; https://doi.org/10.3390/land14061132
Submission received: 6 April 2025 / Revised: 7 May 2025 / Accepted: 20 May 2025 / Published: 22 May 2025
(This article belongs to the Section Land Systems and Global Change)

Abstract

:
Rural land trusteeship, as an innovative agricultural business model, has played an important role in enhancing agricultural production efficiency and optimizing land resource allocation. However, the model has also revealed many risks in the process of its implementation, posing challenges to its sustainable development. Based on the cases of land trusteeship risk disputes made public by the China Judges and Records Network from 2013 to 2023, this paper uses Nvivo 12 Plus qualitative analysis software to identify and characterize the risks and utilizes the spatial analysis method to explore the spatial and temporal evolution of the risks. The study found the following: (1) Risks of rural land trusteeship can be categorized as market, operational, financial, natural, and contractual risks, with financial and contractual risks being more prominent. (2) The number of land trusteeship disputes gradually increased from 2013 to 2020, reaching a peak in 2020. Subsequently, the number has shown a decreasing trend, which reflects the positive effect of policy. (3) In terms of spatial pattern, land trusteeship risks have a significant northeast–southwest clustering trend, North China and Northeast China being high-risk clustering areas, while South China and Southwest China have relatively low risks. (4) There are significant differences in the spatial distributions of different types of risks, with market and operational risks being highly concentrated in economically active areas, while natural risks are more influenced by the geographic environment.

1. Introduction

The ongoing wave of structural transformation is profoundly reshaping the global agricultural landscape: rural population aging, large-scale labor migration toward non-agricultural sectors, and the challenges faced by smallholders in achieving economies of scale and adopting new technologies have all posed critical threats to food security, agricultural sustainability, and rural development worldwide [1,2]. Across the world—from the reform of the Common Agricultural Policy in Europe [3] to agricultural development programs in Asia [4] and Latin America [5,6]—countries are actively exploring effective responses to these challenges. Against this backdrop, innovative models of agricultural production and support systems have continued to emerge, aiming to improve agricultural efficiency and strengthen the resilience of smallholders. Models such as contract farming [7], agricultural service platforms [8], and custom hiring services [9] have become vital bridges connecting smallholders with markets, technology, and capital.
Amid this global transformation, China faces a particularly pressing challenge: Who will farm the land? On the one hand, urbanization continues to drain labor from rural areas [10,11]; on the other hand, fragmented smallholders are unable to benefit from the productivity gains brought by scale and specialization. In response, China has in recent years vigorously promoted the rural land trusteeship model [12]. This model typically refers to a practice in which farmers who are unwilling or unable to cultivate their land purchase agricultural production services, entrusting their farmland to cooperatives or other service organizations for cultivation and management, without transferring land ownership [13]. To clarify the scope of this study, rural land trusteeship is defined as a production arrangement in which farmers, while retaining their contracted land-use rights, delegate one or more stages of crop production to professional service providers—such as farmers’ cooperatives or agricultural service companies—through service payments or profit-sharing agreements. This model preserves land rights for farmers while introducing scale and specialization through service outsourcing. Its institutional design and operational logic reflect both the global trend of service-oriented agriculture and the distinct characteristics shaped by China’s unique land tenure system.
Since the central government first introduced the concept of “trusteeship-based” agricultural services in the 2014 No. 1 Central Document, supportive policies have been continuously reinforced. Key policy initiatives such as the 2017 Guiding Opinions on Vigorously Promoting Agricultural Production Trusteeship [14,15], the 2021 Guiding Opinions on Accelerating the Development of Agricultural Socialized Services [16,17], and the 14th Five-Year Plan have all identified rural land trusteeship as a strategic priority for government support [18]. By the end of 2024, the number of agricultural socialized service organizations nationwide exceeded one million, with trusteeship services covering over 2.14 billion mu-times, reaching more than 94 million smallholder households [19]. Strong policy backing and robust grassroots demand have fueled the rapid expansion of trusteeship services, providing crucial support for improving the efficiency of modern agricultural production and integrating smallholders into agri-food value chains [20].
However, as with many contractual arrangements and outsourcing mechanisms in agriculture globally [21,22], China’s rural land trusteeship model has begun to exhibit multidimensional risks amid its rapid development. Challenges such as contract enforcement, service quality, and benefit distribution have emerged, raising new concerns regarding the model’s long-term stability and sustainability [23]. The inherent complexity of trusteeship operations—given the involvement of multiple stakeholders, including farmers [24], service providers [25], government authorities [26], and village collectives [27]—has led to diverse and layered risk exposures. Effectively identifying and managing these risks is essential to safeguarding stakeholder interests and ensuring the healthy development of the model. Yet recent research on rural land trusteeship in China has primarily focused on its economic outcomes [28,29], institutional designs [30,31], and policy assessments [32,33], with relatively limited attention being paid to the systematic identification of diverse risks and their spatiotemporal dynamics. Against this backdrop, this study poses three core research questions: (1) What types of risks are involved in rural land trusteeship? (2) How have these risks evolved over time? (3) What are the spatial characteristics of trusteeship-related risks? To address these questions, the remainder of this paper is structured as follows: Section 2 reviews the relevant literature; Section 3 outlines the data sources and research methods; Section 4 conducts a grounded theory analysis of primary court case data to identify five major risk types, followed by an in-depth analysis of their spatiotemporal evolution; Section 5 discusses the findings; and Section 6 summarizes the conclusions and offers policy recommendations and directions for future research. By systematically analyzing the temporal and spatial evolution of rural land trusteeship risks in China, this study seeks to provide solid empirical evidence for the model’s sustainable development and contribute valuable insights to the global governance of risks in modern agricultural service systems.

2. Literature Review

Rural land trusteeship is often examined within the broader framework of agricultural services, which are regarded as a production model that promotes agricultural sustainability. The theoretical origins of agricultural services can be traced back to early 20th-century studies on industrial structure and the tertiary sector. As early as the early 1900s, Fisher, Clark, and Kuznets conceptualized services as the “tertiary industry” within national economies and emphasized their role as a key driver of economic recovery. Their theories on the tertiary sector and service economy laid the intellectual groundwork for incorporating agricultural services into the field of economics [34]. With the advancement of agricultural mechanization and the rise of commercial agriculture, developed countries such as the United States proposed the concept of the “agriculture–business complex”, encouraging industrial and commercial sectors to provide customized services to agriculture and thus promote a shift from subsistence to market-oriented production. From the mid-20th century to the early 21st century, countries across the globe began to systematically develop agricultural service systems, with research expanding to cover service actors and roles [35,36], types of services [37,38], service quality [39,40], policy and financing frameworks [41], and key influencing factors [42]. Transaction and managerial costs have also been identified as major constraints on the promotion of agricultural services [43], forming a theoretical basis for subsequent cost–benefit analyses of various service models.
Within this mature and multifaceted theoretical framework, rural land trusteeship has emerged as an innovative form of agricultural socialized service. It inherits the core principle of agricultural services—improving productivity through third-party specialization—while addressing real-world challenges such as fragmented smallholder operations and rural labor shortages. Through contractual arrangements, farmers outsource tasks such as plowing, fertilizing, and harvesting to cooperatives or service firms, achieving scale and specialization without relinquishing their land-use rights [10].
Academic interest in rural land trusteeship in China has grown gradually. Around the year 2000, scholars began to examine how trusteeship could address problems such as land abandonment caused by rural labor migration and the financial burden of agricultural taxation. Following the abolition of the agricultural tax in 2006, the enactment of the Law on Farmers’ Specialized Cooperatives, and the promotion of national agricultural modernization strategies, land trusteeship entered a phase of rapid development. During this period, research increasingly focused on case studies of emerging operational entities—such as cooperatives, trusteeship firms, and large-scale household farms [29]. In-depth analyses of representative models in Shaanxi (Changfeng) and Shandong (Supply and Marketing Cooperatives) had a notable academic and policy impact, contributing to the central government’s formal endorsement of “trusteeship-based services” in a 2014 policy document [44]. In recent years, as China advances its rural revitalization strategy and explores new forms of agricultural modernization, scholarly attention to land trusteeship has deepened. Researchers have begun to explore its broader roles, such as facilitating the integration of smallholders into modern agriculture and innovating rural land operation systems. The scope of study has also expanded to include the conceptual definition of land trusteeship in the new era [45], innovation in service delivery models [46], organizational mechanism design [47], assessments of implementation outcomes [46], and analysis of practical challenges and coping strategies. As attention to the functions and limitations of trusteeship models has grown, the inherent risks associated with them have also become a research focal point. Chinese scholars have begun to apply both qualitative and quantitative methods—including case studies [48], questionnaire surveys [49], factor and analytic hierarchy models [50], and fuzzy evaluation methods [33]—to identify risks throughout the trusteeship process. From the perspectives of various stakeholders, including farmers [31], trusteeship organizations [51], government authorities [52], and village collectives [53], they have proposed targeted risk prevention strategies. However, current studies show clear limitations in exploring the spatiotemporal dynamics of land trusteeship risks, and no systematic research has yet addressed this issue directly.
In summary, although progress has been made in identifying and categorizing land trusteeship risks and in proposing mitigation strategies, existing studies remain limited in scope. Most are confined to static analyses of specific regions or theoretical discussions. There remains a lack of comprehensive, nationwide studies that systematically examine the spatiotemporal evolution of trusteeship risks. Methodologically, the application of spatial analysis tools such as geographic information systems (GISs) remains scarce, making it difficult to conduct multidimensional dynamic risk assessments. Therefore, a deeper investigation into the composition, spatiotemporal patterns, and underlying mechanisms of land trusteeship risks—particularly under China’s unique institutional context—has become an urgent and underdeveloped research frontier. Addressing this gap is a core objective of the present study.

3. Materials and Methods

This study was conducted based on an analysis of 558 judicial documents concerning land trusteeship disputes, which were retrieved from the China Judgments Online database (https://wenshu.court.gov.cn/) using the keyword “land trusteeship”. The platform, established and operated by the Supreme People’s Court of China, is the largest and most authoritative open-access repository of judicial verdicts in the country. The search was limited to cases published between 1 January 2013 and 31 December 2023. In the first stage, Nvivo 12 Plus was employed to perform qualitative coding and analysis. Using the principles of grounded theory, the study systematically extracted thematic categories to identify and classify various types of land trusteeship risks. In the second stage, the spatiotemporal distribution of identified risks was examined through multi-angle spatial analysis conducted using ArcGIS 10.2 software. This included the mapping of disputes and analysis of their geographic and temporal characteristics. Through systematic retrieval, filtering, and organization of the judicial texts, a structured dataset comprising 1215 valid entries was constructed. Each record included essential fields such as dispute occurrence time, geographic location, and risk type. It is important to note that, given that China Judgments Online primarily archives judicial rulings from mainland China, this study excluded cases from the Hong Kong Special Administrative Region, the Macao Special Administrative Region, and Taiwan, as these regions operate under independent legal systems and separate jurisdictions. The spatial data used in the analysis were obtained from multiple authoritative sources, including the National Platform for Common Geospatial Information Services (Tianditu), the Ministry of Natural Resources, and the National Bureau of Statistics of China.

3.1. Qualitative Analysis

Qualitative analysis is primarily used to explore and understand subjective phenomena such as human behaviors, attitudes, beliefs, and various social–cultural contexts. This approach emphasizes the description, interpretation, and understanding of data. In this study, Nvivo 12 Plus was employed as a tool for qualitative analysis to examine land trusteeship dispute cases. Through the use of open coding, axial coding, and selective coding, the study systematically processed the data to identify and categorize different types of land trusteeship risks.

3.2. Spatial Analysis Methods

3.2.1. Ordinary Kriging

Ordinary kriging is a geostatistical method used to make unbiased estimates of unknown values by minimizing the variance of prediction errors. This method takes into account the spatial correlation between sample points and quantifies this correlation using a semivariogram function. By leveraging these spatial relationships, the method optimizes the predictions for unknown locations. In this study, land trusteeship dispute data were used as sample points, with the number of disputes serving as the variable for spatial interpolation. ArcGIS was used to perform the interpolation of point data on the number of land trusteeship disputes from 2013 to 2023 in order to characterize the overall land trusteeship risk profile.

3.2.2. Standard Deviation Ellipse

The standard deviation ellipse is an effective tool for capturing the directional distribution of spatial elements and revealing their overall development trends within a given region [54]. It accurately identifies the central tendency, orientation, and directional bias of geographic features in spatial distribution analyses [55]. In this study, the standard deviation ellipse was used to analyze the distribution of various types of land trusteeship risks across China from 2013 to 2023, highlighting the trends and directionalities of land trusteeship risks.

3.2.3. Spatial Autocorrelation Analysis

Spatial autocorrelation analysis includes both global spatial autocorrelation and local spatial autocorrelation models [56]. In this study, the Global Moran’s I index was used to evaluate the overall spatial clustering or dispersion of land trusteeship risks, as well as their specific risk types, across China. A positive Moran’s I value indicates spatial clustering, whereas a negative value implies spatial dispersion. A value of zero suggests a random distribution with no spatial correlation. However, Global Moran’s I only captures the overall spatial distribution characteristics and fails to detect local clusters or spatial heterogeneity. To address this limitation, the study also applies the Local Moran’s I index to identify the spatial locations and clustering patterns of land trusteeship risks and their various types. The calculation formula for Local Moran’s I is as follows [57,58]:
I global = i = 1 n j = 1 n W i j ( x i x ¯ ) ( x j x ¯ ) i = 1 n ( x i x ¯ ) 2
I local = ( x i x ¯ ) j = 1 n W i j ( x j x ¯ ) 1 n × i = 1 n ( x i x ¯ ) 2
where x i and x j represent the number of land trusteeship disputes in city i and city j, respectively; x i is the mean number of disputes across all cities; n denotes the total number of cities included in the analysis; and W i j is the spatial weight matrix, where W i j = 0 if cities i and j are not adjacent. A positive Local Moran’s I value indicates that a given city exhibits spatial clustering of land trusteeship risks with its neighboring areas, and the larger the value, the stronger the clustering effect. In contrast, a negative Local Moran’s I value suggests spatial dispersion, meaning that the city’s risk level significantly differs from those of surrounding areas, with lower values indicating a stronger radiating (outlier) effect. When the Local Moran’s I value is approximately zero, it reflects a random spatial distribution, implying no significant spatial autocorrelation.

4. Results

4.1. Identification of Land Trusteeship Risks in Rural China

After developing a thorough understanding of the collected data, a qualitative analysis approach was adopted to organize and categorize the research texts. First, open coding was conducted on the raw textual data to extract initial concepts, which were then grouped into preliminary categories. Second, axial coding was employed to further explore the underlying meanings of the initial concepts and categories, allowing for the development and refinement of these elements into more coherent core categories. Finally, selective coding was used to integrate and converge the main categories into a central theme. The detailed process and results of the three-level coding are presented as follows.

4.1.1. Open Coding

The purpose of open coding is to deconstruct the original structure of textual data and redefine their intrinsic concepts in order to reconfigure meaning from a new analytical perspective. Given that the source material for this study consisted of actual land trusteeship dispute cases, the word cloud function of NVivo 12 Plus was used to count high-frequency words with a view to providing a reference for subsequent conceptual categorization. Among the frequently occurring words, ‘contract’ showed the highest frequency (3524 occurrences). Other prominent terms included ‘trusteeship’ (1835 occurrences), ‘land’ (1326 occurrences), and ‘cooperative’ (1258 occurrences). These high-frequency words reveal the core elements of land trusteeship dispute cases, encompassing the main actors, objects, and operational channels. In addition, the words “farmer”, “enterprise”, “agreement”, and “payment” all had more than 350 occurrences, and a large number of marginal words with small font sizes in the word cloud also showed a fairly high frequency of occurrences—mostly around 125—suggesting a rich lexical representation of the dimensions related to the dispute.
Based on the results of open coding and the word cloud analysis, this study identified 20 categories from the open coding of 558 land trusteeship dispute cases, encompassing a total of 410 reference points. Table 1 presents selected examples.

4.1.2. Axial Coding

Axial coding is the process of further exploring and integrating concepts on the basis of open coding. By logically reorganizing free nodes at the same hierarchical level, diverse conceptual categories are synthesized into classified attributes. Based on the 20 initial categories, this study identified 13 core categories through semantic judgment of the textual data, as detailed in Table 2.

4.1.3. Selective Coding

Selective coding is the process of consolidating and refining categories by identifying the “core category” among the previously discovered conceptual themes and constructing a conceptual framework [59]. Building upon open and axial coding, this phase involves deeper conceptual integration and logical analysis, whereby loosely developed categories are expanded and conceptually connected to form a complete theoretical structure, as shown in Table 2.
Based on the selective coding of grounded theory analysis, this study ultimately identified five core categories of risk associated with the practice of rural land trusteeship in China: market risk, operational risk, financial risk, natural hazard risk, and contractual risk. (1) Market risk refers to potential losses arising from uncertainty in agricultural input supply, pricing of production services, and agricultural product sales, primarily due to fluctuations in market prices and shifts in supply and demand. (2) Operational risk denotes the possibility of underperformance or losses incurred during service delivery by trusteeship providers, caused by limitations in management capacity, technical proficiency, resource allocation, or external working conditions. (3) Financial risk captures risks related to capital shortages, cash flow difficulties, payment disputes, and financing obstacles that may arise during trusteeship operations. (4) Natural hazard risk encompasses threats posed by force majeure events, such as extreme weather conditions (e.g., droughts, floods, and hailstorms), geological disasters, and severe pest and disease outbreaks, that result in reduced or total crop failure on entrusted farmland. (5) Contractual risk refers to disputes and losses stemming from issues in the signing or execution of trusteeship contracts, including ambiguous clauses, breach of contract, information asymmetry, opportunistic behavior, and invalidation or unilateral modification of contractual terms.

4.2. Spatiotemporal Evolution of Land Trusteeship Risks in Rural China

4.2.1. Temporal Characteristics of Land Trusteeship Risk Evolution

Based on the previously constructed national database of rural land trusteeship dispute cases (a total of 558 cases), this section adopts a yearly time scale and divides the study period (2013–2023) into 11 consecutive annual intervals. As illustrated in Figure 1, the number of rural land trusteeship disputes in China exhibits a clear pattern of phased variation over the study period. In the early stage, from 2013 to 2016, the number of cases fluctuated. There were nine cases recorded in 2013, followed by a decline to the lowest point of two cases in 2014. The number then surged to 38 in 2015, before slightly decreasing to 32 in 2016. From 2017 to 2020, the number of disputes experienced continuous and accelerated growth: 54 cases were recorded in 2017, rising to 69 in 2018, then sharply increasing to 115 in 2019, and peaking at 179 cases in 2020—the highest figure in the entire study period. Following the peak, a downward trend emerged between 2021 and 2023. The number of disputes dropped to 124 in 2021, decreased further to 110 in 2022, and declined to 51 cases by 2023. Overall, during the 11-year period from 2013 to 2023, the number of rural land trusteeship disputes in China followed a clear “rise-and-fall” trajectory. The years 2017 to 2020 constituted a rapid growth phase, with 2020 marking a critical turning point, after which the number of cases entered a declining phase. It is also worth noting that the ascending phase featured certain year-to-year fluctuations, such as noticeable troughs in 2014 and 2016.

4.2.2. Temporal Evolution Characteristics of Different Types of Land Trusteeship Risks

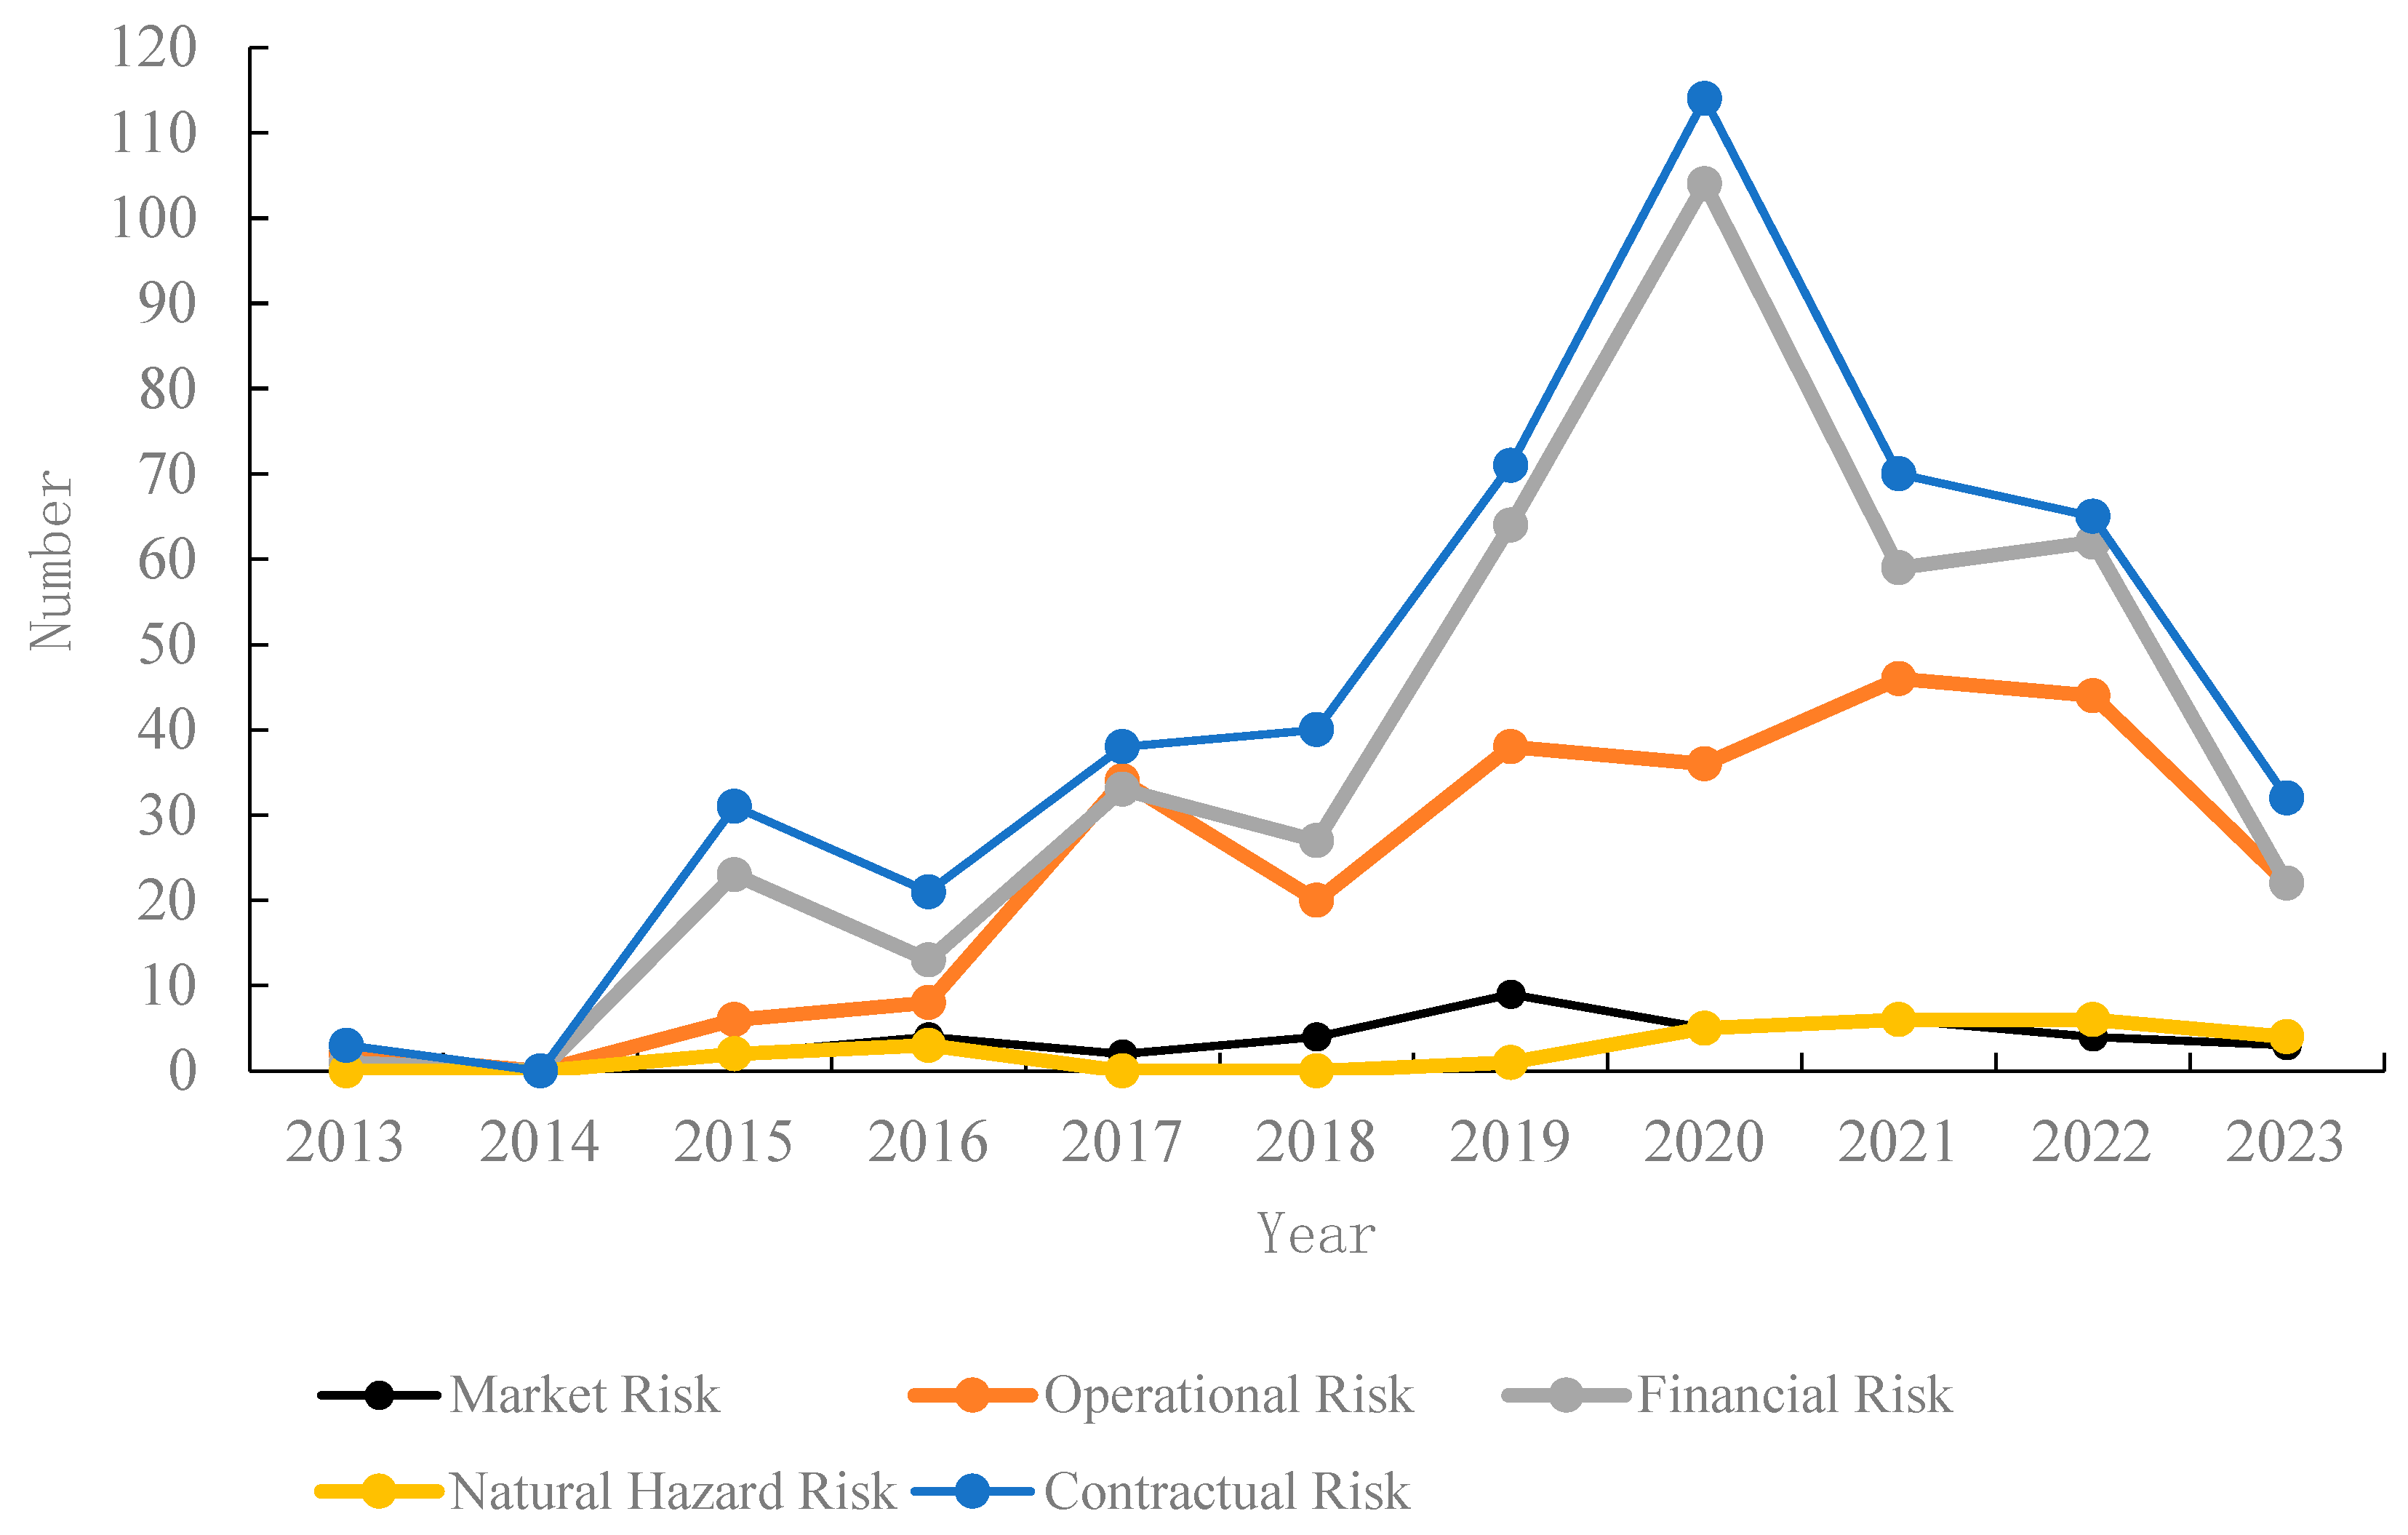
As illustrated in Figure 2,From 2013 to 2014, the number of risk incidents across all categories remained low, with market risk and natural hazard risk scarcely present, and operational, financial, and contractual risks occurring at relatively low levels. Beginning in 2015, rural land trusteeship disputes started to emerge more prominently, particularly with rapid increases in financial and contractual risks. Specifically, financial risk cases rose from 23 in 2015 to 33 in 2017, while contractual risk cases increased from 31 to 38 over the same period. Operational risk also expanded significantly, growing from 6 cases in 2015 to 34 in 2017. The years 2019 to 2020 marked a period of concentrated escalation in trusteeship-related risks, with all categories peaking during this time. Notably, financial risk and contractual risk reached their highest levels in 2020, with 104 and 114 cases, respectively, and operational risk also climbed to 38 cases in 2019. Market risk showed an upward trend during this phase, and although natural hazard risk remained relatively infrequent, it experienced a noticeable increase in 2020. Since 2021, the overall number of risks has shown a declining trend but remains at a relatively high level. Operational risk has persisted at over 40 cases annually, while financial and contractual risks, though lower than their peak levels, have remained substantial—reaching 59 and 70 cases, respectively, in 2021, and 62 and 65 cases in 2022. These patterns suggest that although enhanced legal and managerial interventions have helped mitigate certain risks, they have not been fully eradicated. During this stage, market risk exhibited a slight decline, and natural hazard risk remained at a low level. By 2023, all categories of risk further subsided; however, operational, financial, and contractual risks continued to constitute the dominant types of risk in rural land trusteeship.

4.2.3. Spatial Evolution Characteristics of Land Trusteeship Risks in Rural China

(1) Overall Spatial Pattern of Land Trusteeship Risks
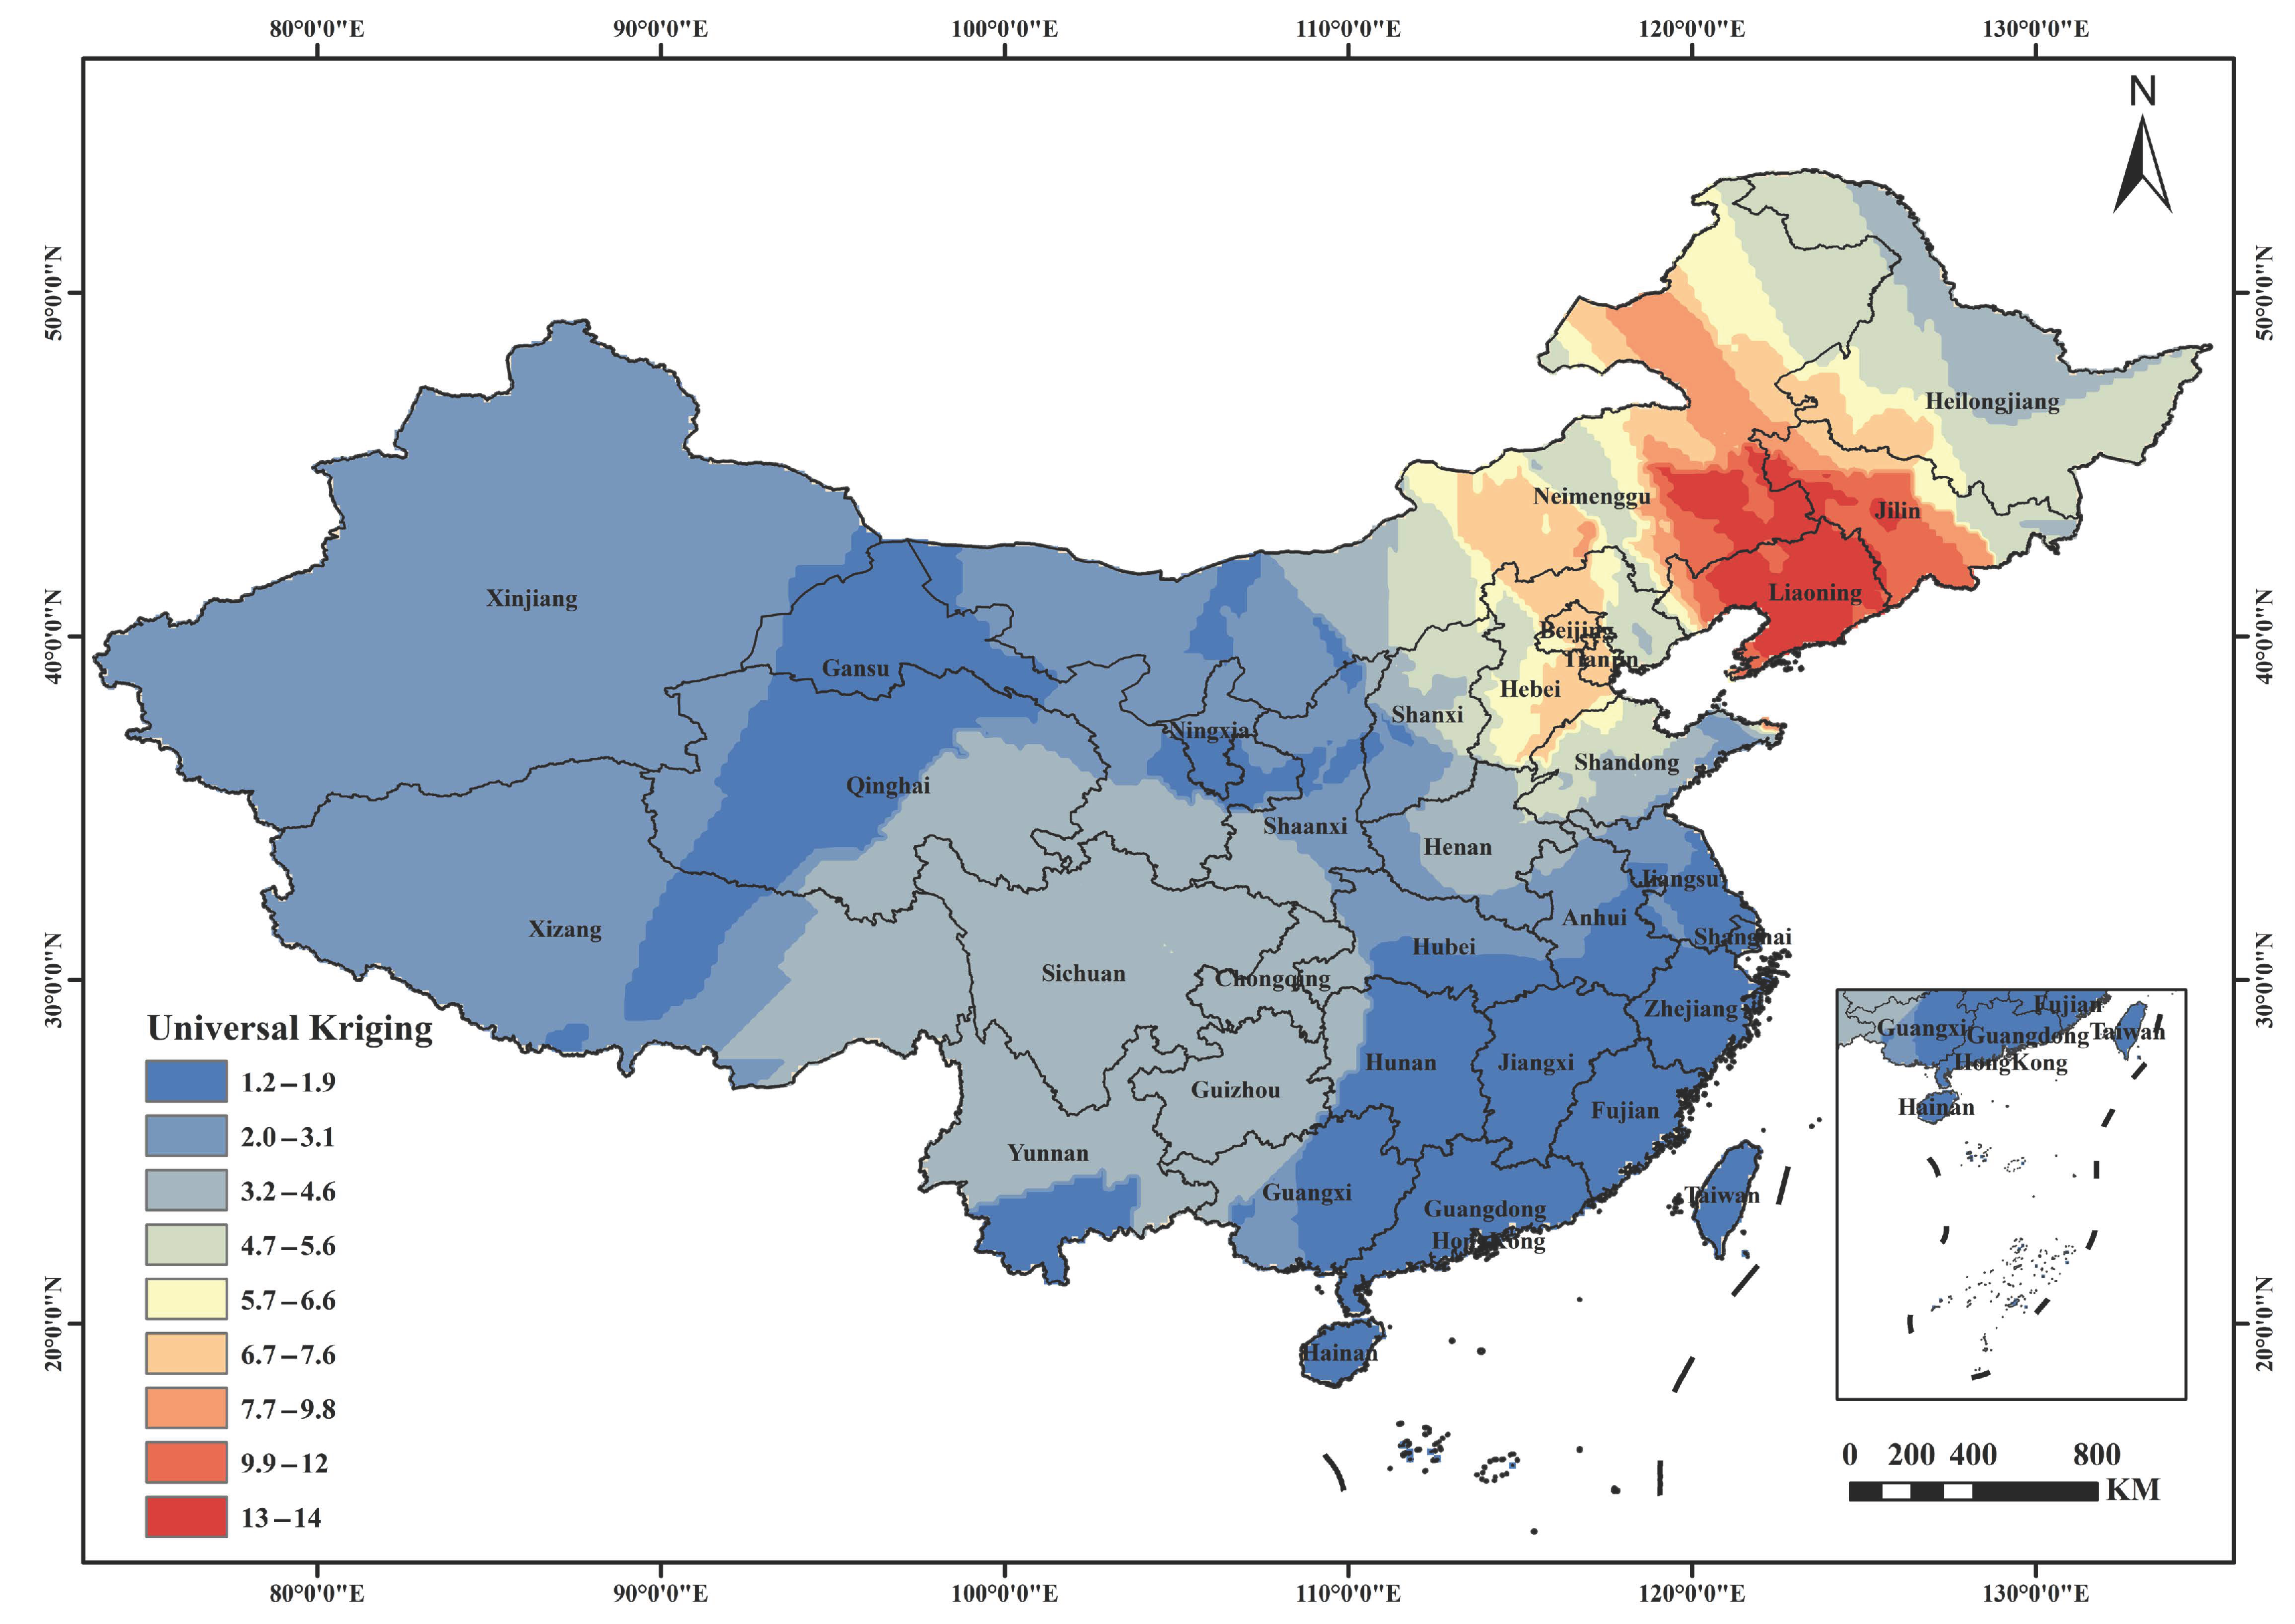
As shown in Figure 3, the spatial interpolation analysis visually illustrates the spatial heterogeneity of rural land trusteeship risk intensity across China during the period from 2013 to 2023. The figure reveals a marked spatial imbalance in risk distribution. High-risk areas (represented in red and orange, corresponding to risk values between 7.7 and 14) are heavily concentrated in northeastern China (Heilongjiang, Jilin, and Liaoning) and parts of northern China (including eastern Inner Mongolia, Hebei, Shandong, and the Beijing–Tianjin region), forming a contiguous high-risk core zone. The tri-province border region of Heilongjiang, Jilin, and Liaoning, along with adjacent areas, exhibits the highest levels of risk intensity. Medium-risk areas (represented in yellow and green, with values ranging from 4.7 to 7.6) are primarily distributed around the periphery of the high-risk core zone, serving as transitional belts between high- and low-risk regions. These include parts of northern, central, and northwestern China, such as Henan, Shanxi, sections of Shaanxi, and parts of Xinjiang. Low-risk areas (depicted in shades of blue, indicating values below 4.6) are widely distributed across western China (including most of Xinjiang, Tibet, Qinghai, and western Gansu), southern provinces (such as Guangdong, Guangxi, Fujian, and Hainan), and southwestern regions (including Yunnan, Guizhou, southern Sichuan, southern Hunan, and southern Jiangxi). Within these low-risk areas, the zones with the lowest intensity (dark blue, below 1.9) also occupy a substantial proportion of the territory. Overall, the national spatial pattern of rural land trusteeship risk reveals a pronounced tendency toward higher risk intensity in the northeast and northern regions, while risk levels remain generally low in the western, southern, and southwestern parts of the country. The overall gradient of risk intensity declines from northeast to southwest, demonstrating strong spatial clustering and significant regional differentiation.
(2) Spatial Trend of Land Trusteeship Risk Distribution
As shown in Table 3, the long axis of the standard deviation ellipse represents the directional trend of the data distribution, while the short axis reflects the spread or dispersion. The greater the difference between the lengths of the two axes (i.e., the larger the eccentricity) and the smaller the ratio of the short axis to the long axis, the stronger the directional tendency of the data. An analysis of the parameters associated with the standard deviation ellipses for the national distribution of land trusteeship risks from 2021 to 2023 reveals that the central longitude and latitude of the ellipses have remained relatively stable over the past three years. The azimuth angle increased from 62.54° in 2021 to 67.60° in 2023. In terms of the short-to-long axis ratio, the value declined from 1.95 in 2021 to 1.88 in 2023, indicating that the directional concentration of land trusteeship risks has been continuously strengthening. The ellipses consistently exhibit a northeast–southwest orientation, and the increase in directional tendency suggests an intensifying pattern of spatial clustering.
(3) Evolution of the Spatial Association Pattern of Land Trusteeship Risks
In this study, ArcGIS 10.2 software was used to conduct a global spatial autocorrelation analysis. The observational units were defined based on the number of land trusteeship risk cases nationwide from 2013 to 2023, totaling 558 cases. This approach was applied to evaluate the spatial characteristics of land trusteeship risks within the study area. As shown in Table 4, the Global Moran’s I index for the total number of disputes was 0.3, with a p-value < 0.001, indicating a statistically significant positive value. The result also passed the Z-statistic significance test of the p-value, confirming the existence of a spatial relationship in the distribution of land trusteeship risk cases across China. Specifically, the results reveal a significant positive global spatial autocorrelation, suggesting that the number of land trusteeship risk cases in neighboring provinces is geographically correlated. In other words, the number of risk cases in a given province is likely influenced by, and also influences, the number of cases in adjacent provinces. Regions with a relatively high (or low) number of cases tend to be surrounded by other regions with similarly high (or low) case numbers, forming clusters of similar spatial intensity in land trusteeship risk.
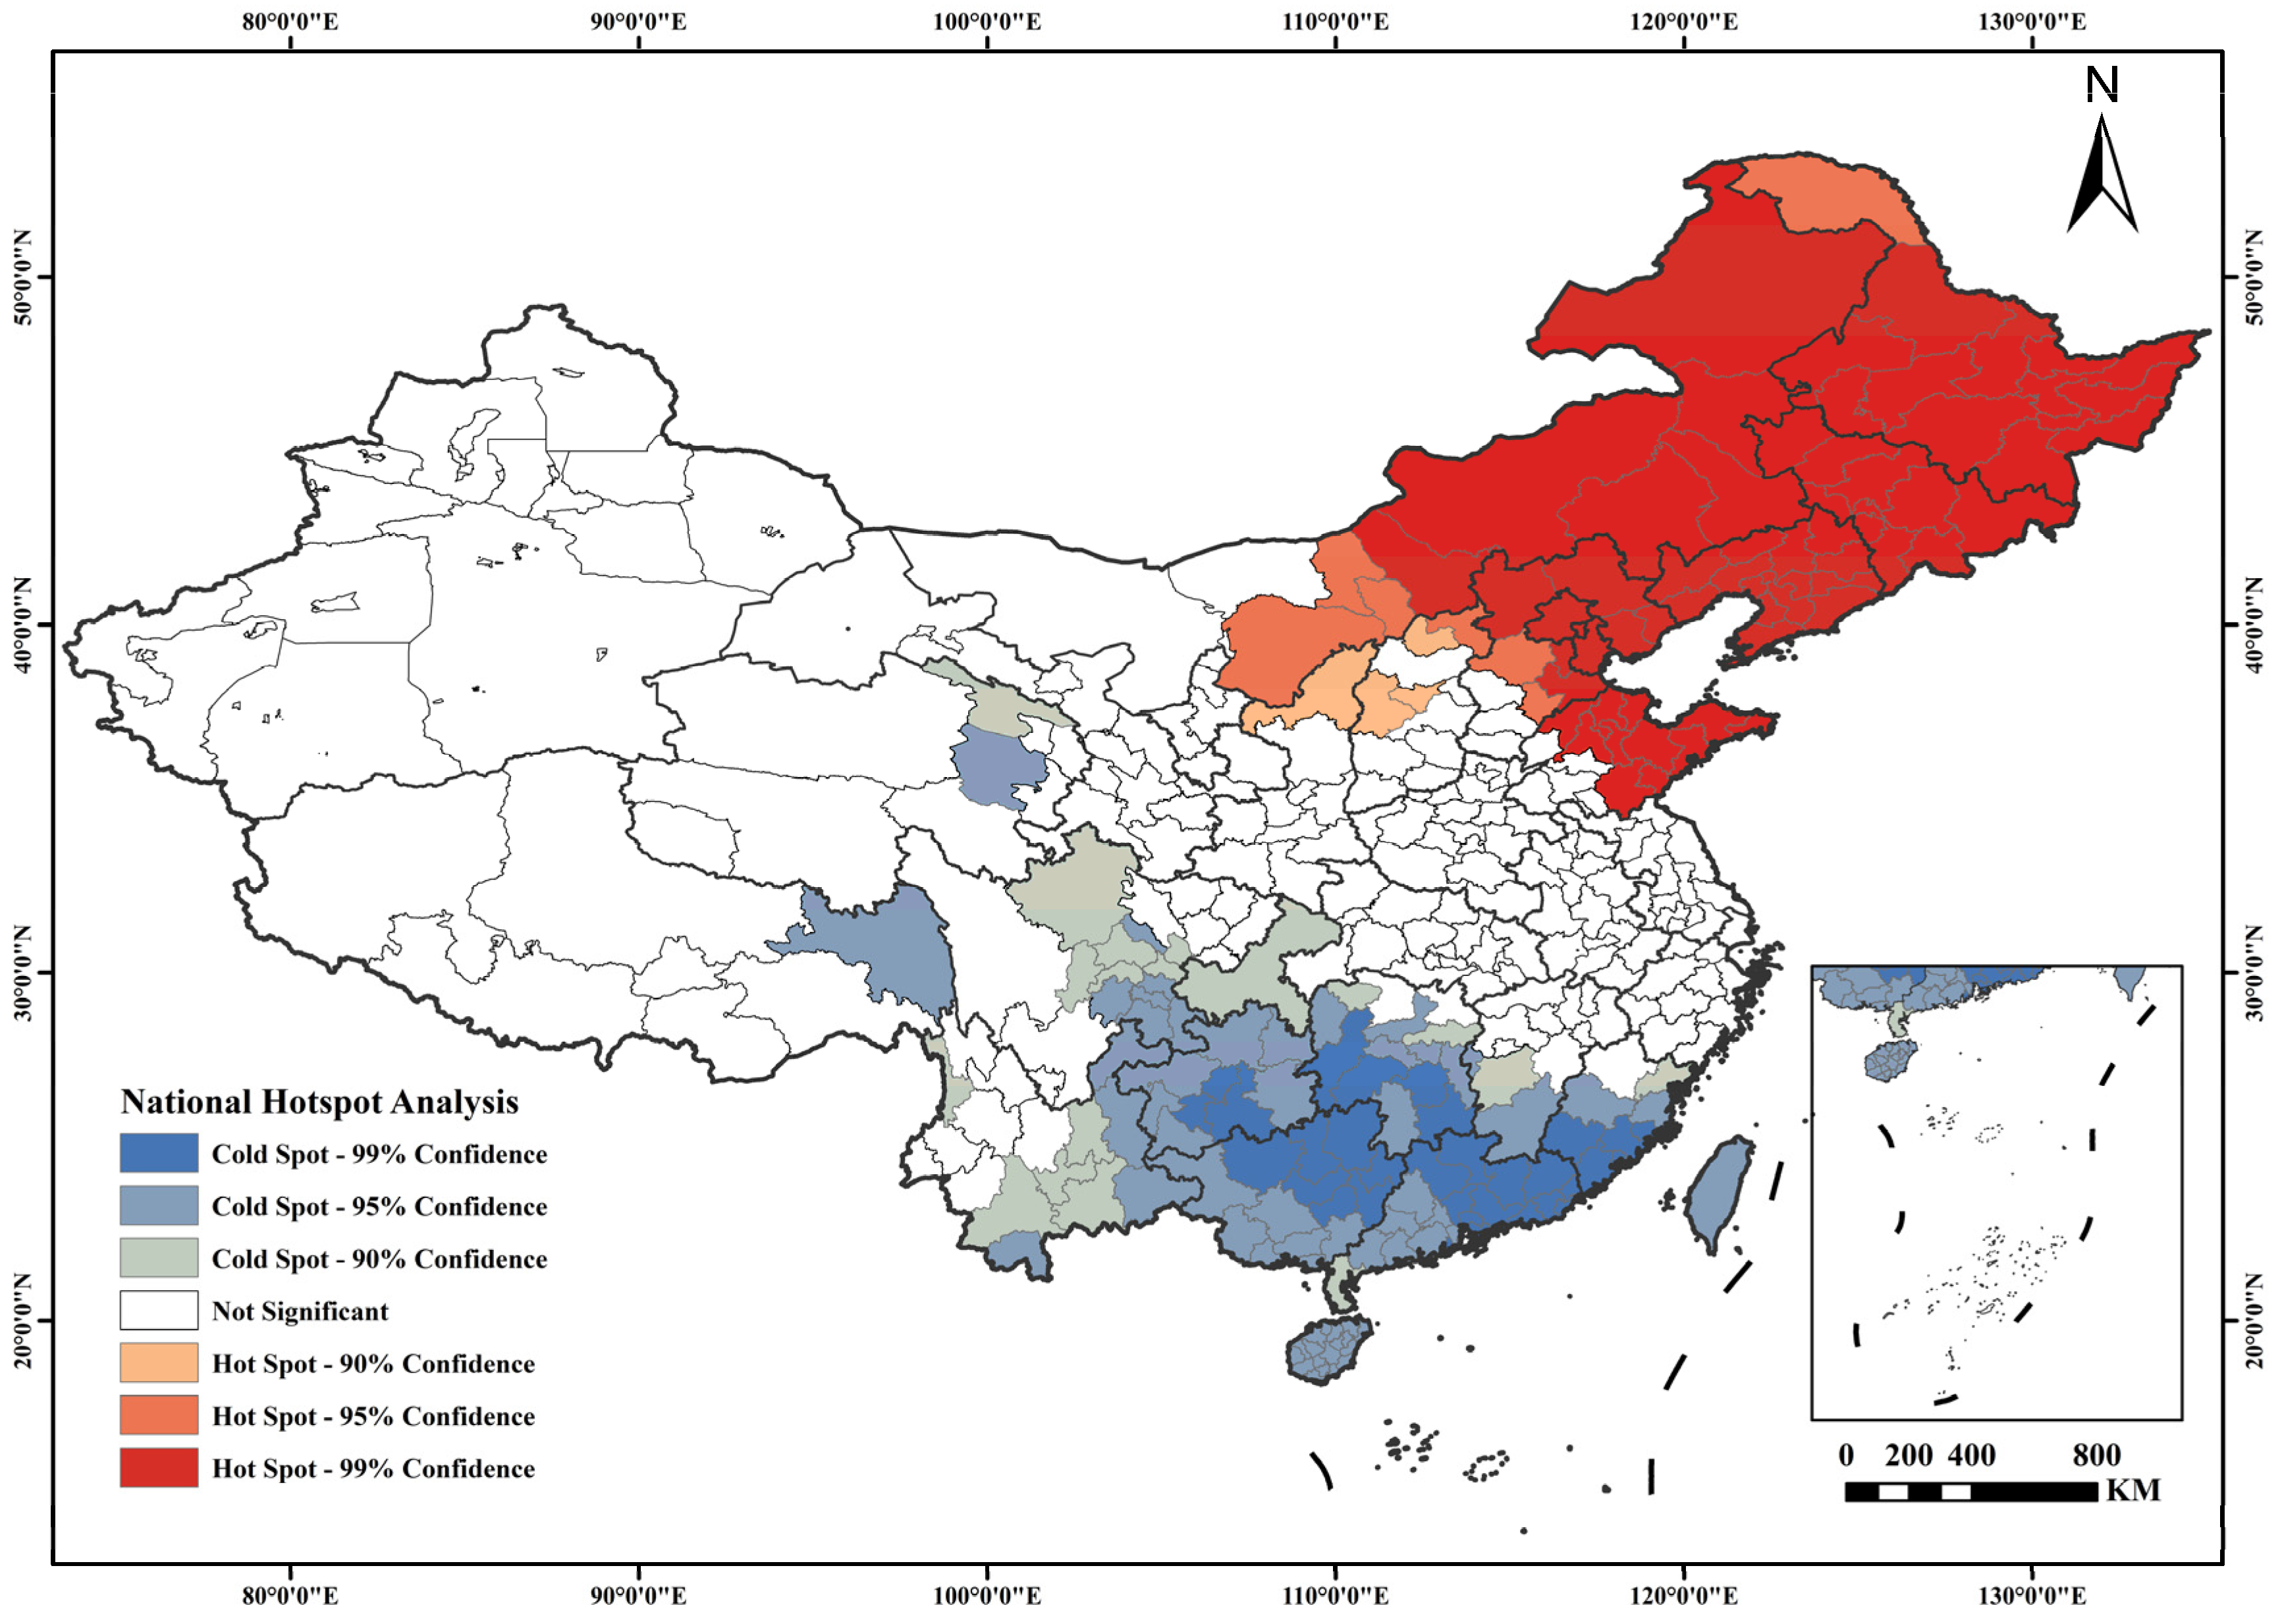
Due to the inherent heterogeneity of spatial phenomena, some areas may exhibit local positive spatial autocorrelation while others may display spatial dispersion. Therefore, it is necessary to conduct a local spatial autocorrelation analysis. Based on the number of land trusteeship dispute cases nationwide, this study applied the Hot Spot Analysis tool in ArcGIS 10.2 to calculate the local Getis–Ord Gi* statistic for land trusteeship risks from 2013 to 2023. The results were then classified—according to the Gi* values, from high to low—into four categories: hot spots, sub-hot spots, sub-cold spots, and cold spots, thereby analyzing the spatial distribution patterns of land trusteeship risks across China and identifying areas with concentrated increases or decreases in risk levels.
As illustrated in Figure 4, the spatial distribution of cold- and hot-spot regions for land trusteeship risks nationwide from 2013 to 2023 exhibits a clear pattern of spatial clustering. The analysis reveals the formation of core hot-spot clusters and core cold-spot clusters in geographical space. The core hot-spot areas are primarily concentrated in Heilongjiang, Jilin, Liaoning, Inner Mongolia, Beijing, Tianjin, Hebei, and Shandong Provinces, along with their surrounding regions, forming contiguous zones of elevated risk. In contrast, the core cold-spot areas are mainly distributed across Hunan, Guangdong, Hainan, Guangxi Zhuang Autonomous Region, and Chongqing, as well as adjacent provinces, also forming relatively contiguous zones with lower risk levels.

4.2.4. Spatial Evolution Characteristics of Different Types of Land Trusteeship Risks

(1) General Spatial Characteristics of Each Risk Type
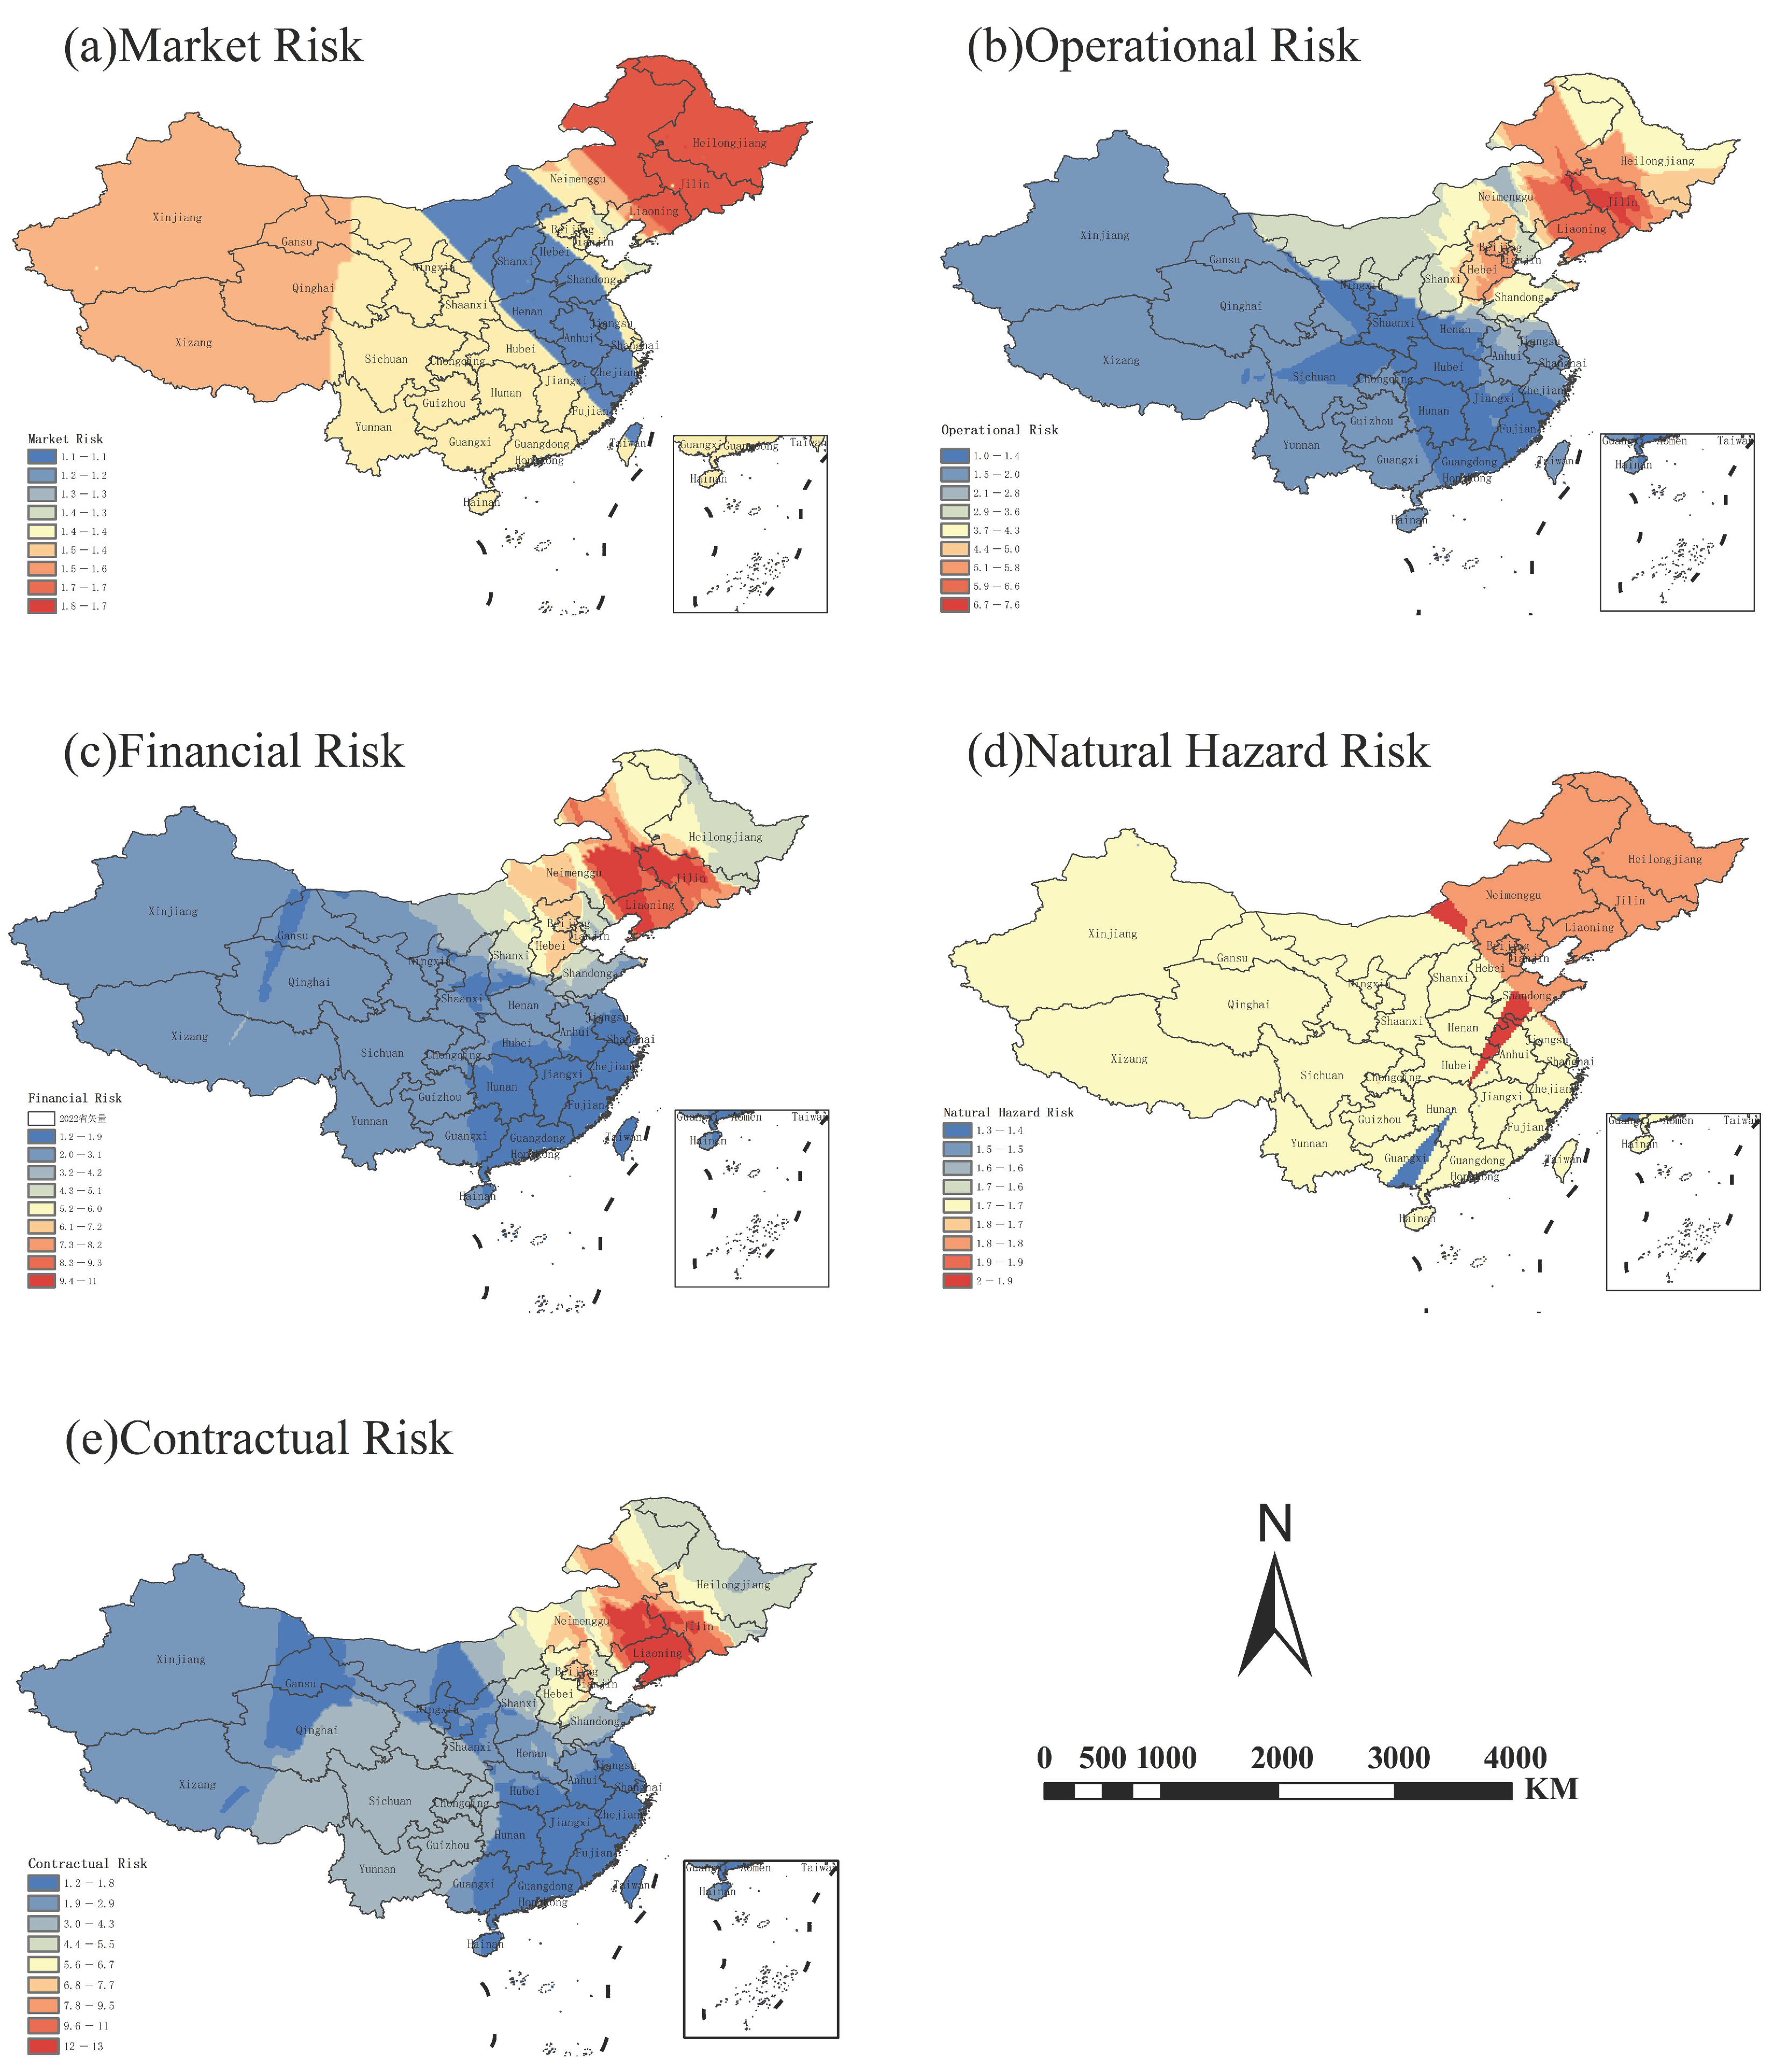
Based on national land dispute data from 2013 to 2023, the spatial distribution patterns of market risk, operational risk, financial risk, natural hazard risk, and contractual risk were analyzed using the ordinary kriging interpolation technique. As shown in Figure 5, the spatial distribution of each risk type exhibits significant regional characteristics and can be categorized into low-risk, moderately low-risk, moderately high-risk, and high-risk zones. Market risks are primarily concentrated in economically active regions, with high-risk areas including parts of Heilongjiang, Liaoning, and Xinjiang, where the number of cases reaches four to five. Most cities exhibit relatively low market risk, with an average of only 1.56, and over 75% of cities reporting 1–2 cases, indicating regional clustering overall. Operational risks have a broader spatial coverage, with higher risk levels observed in eastern coastal and northeastern cities. Certain areas of Heilongjiang reached the highest national level (12), while Shandong and Henan were at moderate risk levels, and western regions such as Xinjiang and Guizhou remained low. Financial risks show strong regional clustering, with the highest levels recorded in northeastern areas such as Anda, Heilongjiang (13 cases). Some cities in Shandong reported seven to nine cases, whereas western regions and smaller cities generally exhibited lower, more dispersed risk levels. Natural hazard risks were mainly distributed across northern China, the northeast, and parts of the west. Northeastern cities such as Hunchun and Hulunbuir had the highest levels (three to four), while western and central–southern regions, such as Altay in Xinjiang and Ezhou in Hubei, recorded lower and more sporadic occurrences. Contractual risks were widespread across the country. The highest risk was found in Anda, Heilongjiang (13 cases), while eastern and northern provinces such as Shandong and Hebei recorded moderately high levels (6–9). Central provinces like Henan and Guizhou had moderate levels (three to five), and northwestern regions reported relatively low levels (one to two). Overall, the spatial distribution of each risk type reveals significant regional differences. High-risk areas are mainly concentrated in northeastern and northern China, as well as in some economically developed regions, while lower-risk areas are generally found in parts of the western and central cities.
(2) Spatial Variation Trends of Different Types of Land Trusteeship Risks
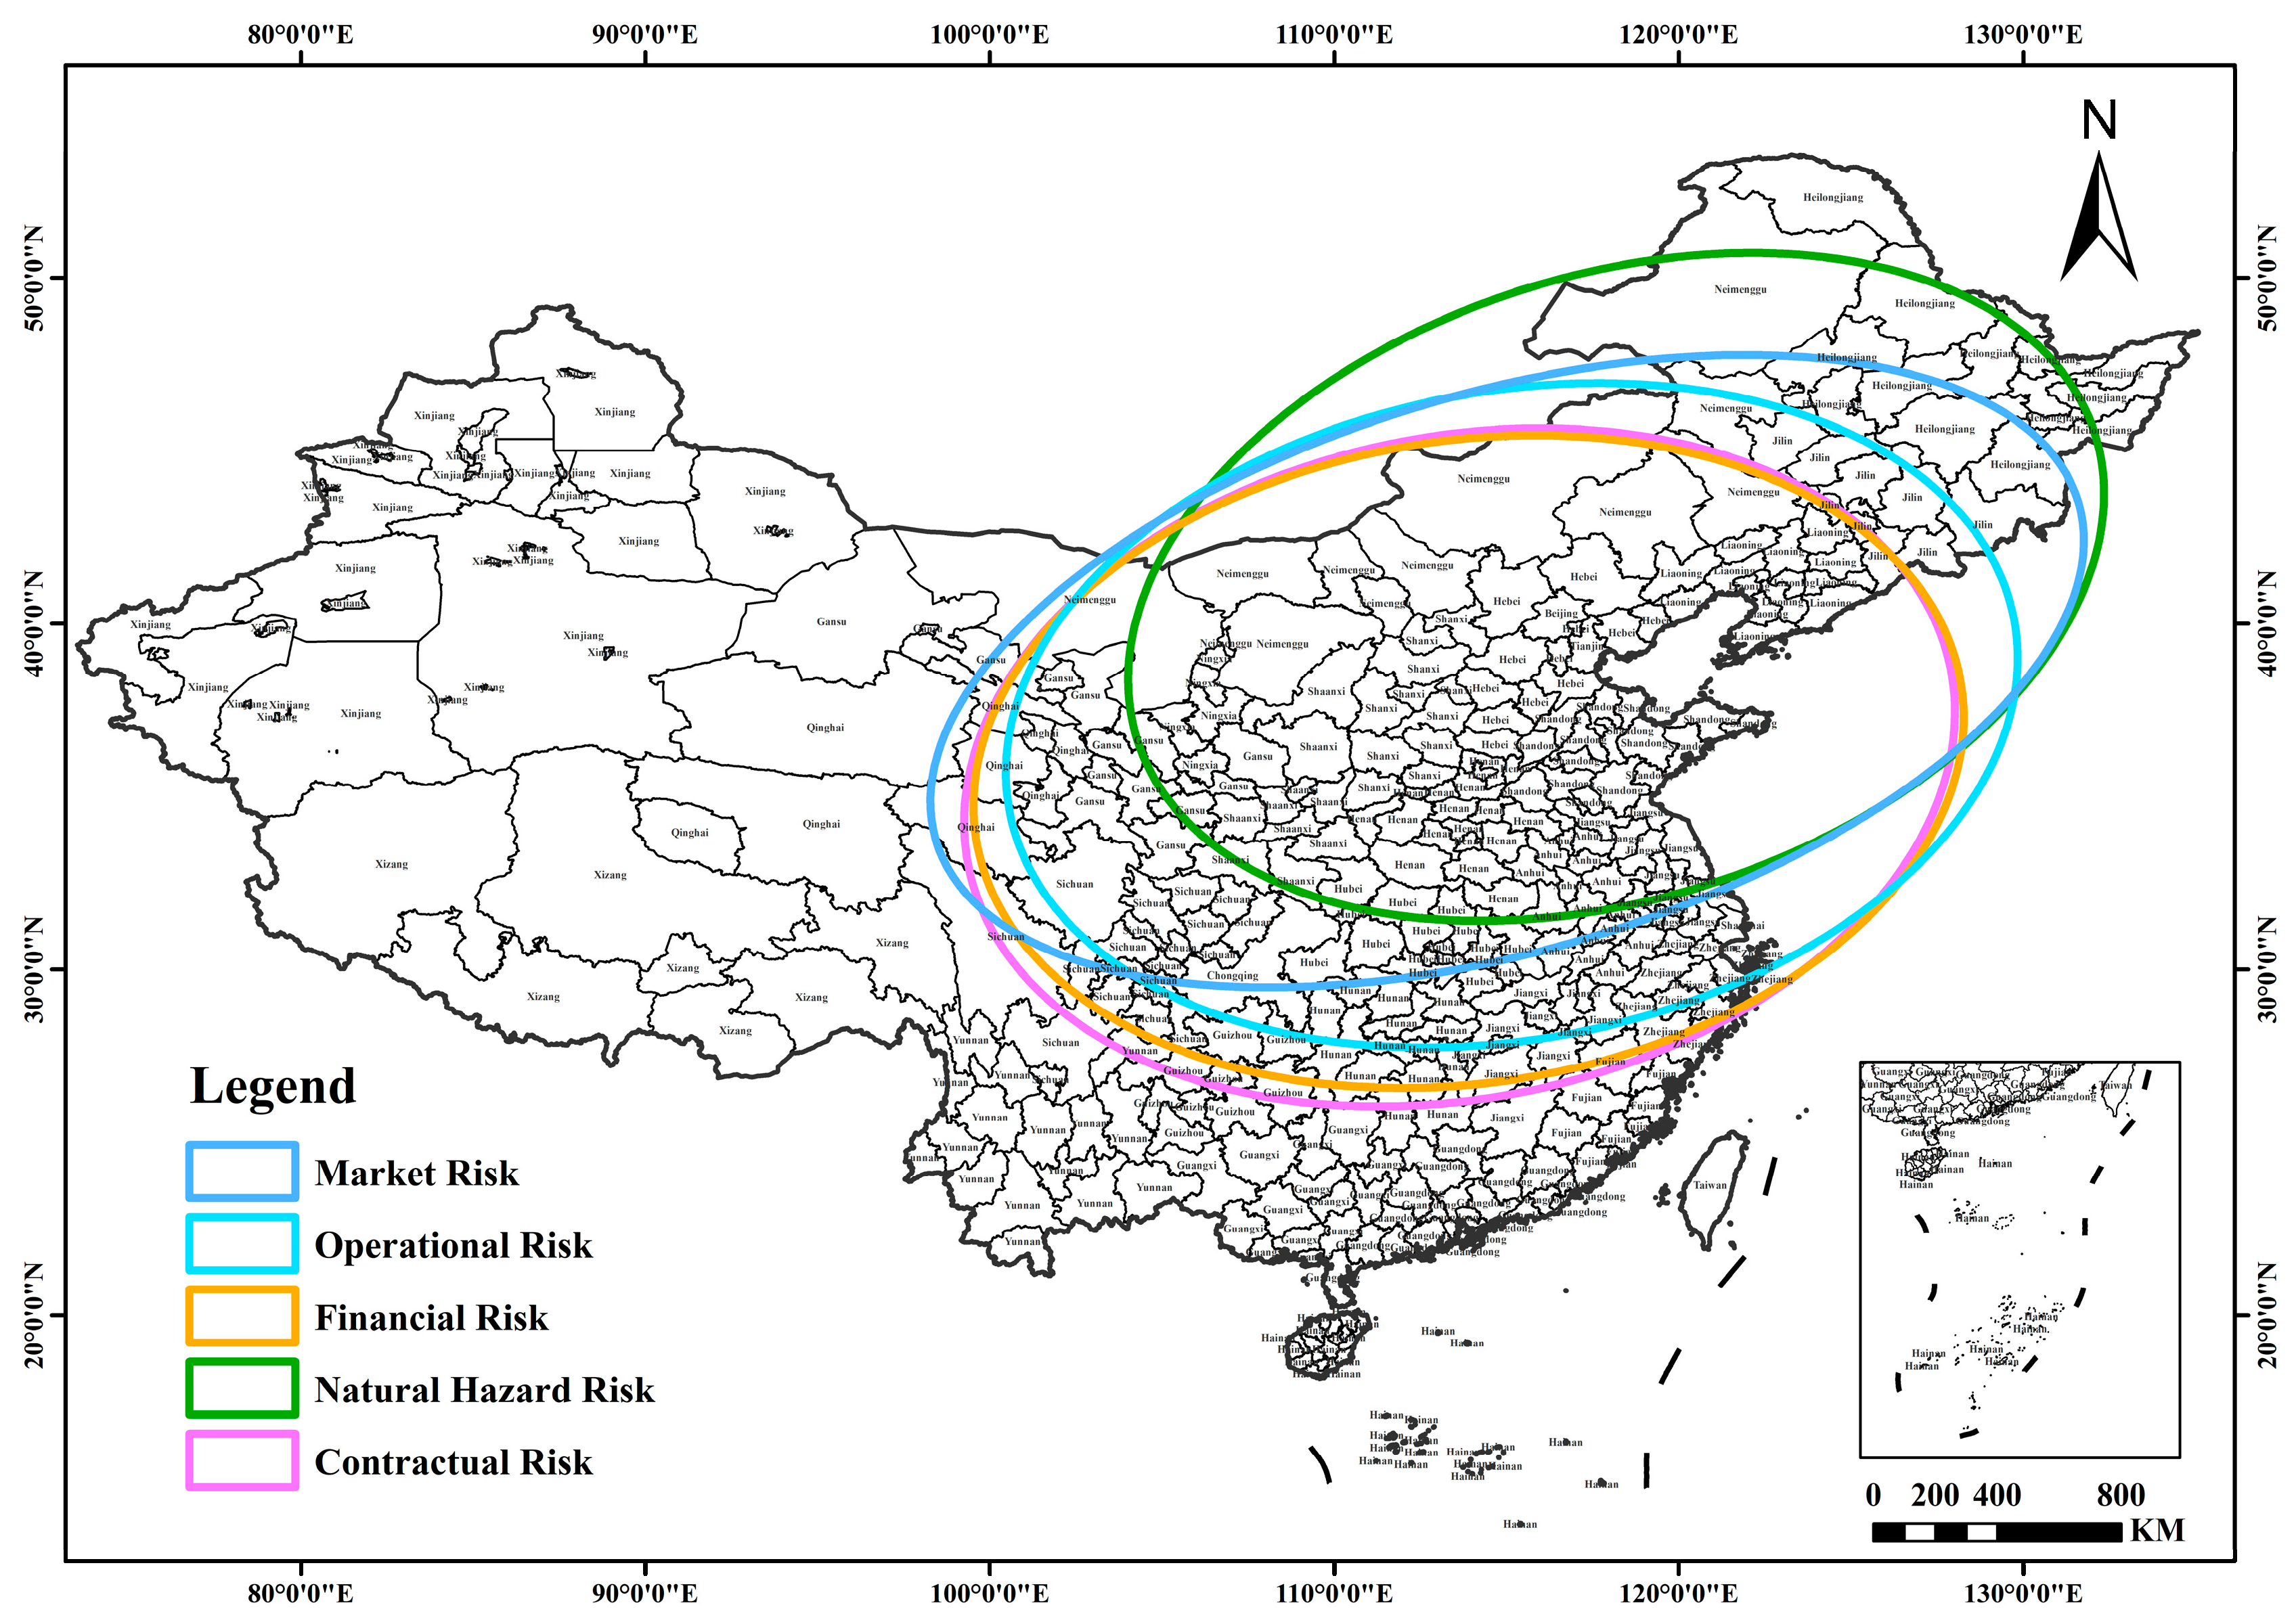
According to the parameters of the standard deviation ellipses for the five types of land trusteeship risks, the central coordinates are generally located in North China, although different risk types exhibit varying spatial shapes and directional tendencies(see Table 5). In terms of central location, the centers of market, operational, and financial risks are closely aligned (approximately 115° E, 37.5° N), indicating a high concentration of these risks in agriculturally and economically active regions such as Hebei, Henan, and Shandong. The center of natural hazard risk is situated further to the northeast (118.17° E, 41.06° N), covering parts of Liaoning, northeastern Hebei, and eastern Inner Mongolia, suggesting a more prominent impact of natural factors on land trusteeship in this area. In contrast, the center of contractual risk is located further south (113.63° E, 35.84° N), reflecting a higher frequency of contract enforcement disputes in regions like Henan and Shanxi. In terms of directionality, the spatial distribution of all risk types exhibits a clear northeast–southwest orientation, though with varying degrees of linearity. Market risk has the lowest short-to-long axis ratio (0.466), indicating a highly linear spatial expansion pattern, likely spreading along key economic corridors. Operational and financial risks share an identical ratio (0.631), implying similar spatial expansion characteristics and strong directional tendencies. Natural hazard risk exhibits a comparable ratio (0.618), suggesting a similarly concentrated distribution. Contractual risk, with the highest ratio (0.658), shows a more even spatial distribution and weaker directionality, which may be attributed to the widespread nature of contract-related issues across the country. In terms of azimuth angles, all risk types fall within a narrow range between 72° and 79°, consistent with the dominant national agricultural–economic axes and land transfer patterns. Market risk (73.63°) and natural hazard risk (72.35°) have slightly smaller azimuth angles, indicating a marginally more northerly orientation. In contrast, operational (79.28°), financial (79.28°), and contractual risks (78.72°) exhibit larger azimuth angles, suggesting that their spatial expansion trends are more closely aligned with the northeast–southwest axis.
As shown in Figure 6, the spatial distribution of all five risk types exhibits a pronounced northeast–southwest expansion pattern, accompanied by a high degree of spatial clustering. Among them, market, operational, and financial risks share similar spatial distribution patterns, being primarily concentrated in North China and extending along major economic corridors. Natural hazard risks are more centered in the northeastern regions, with their distribution strongly influenced by geographical and environmental factors. Contractual risks, while more evenly distributed, still exhibit a certain degree of directional tendency. These patterns suggest that the spatial evolution of land trusteeship risks is shaped by the combined effects of economic development models, geographic conditions, and land-use practices.
(3) Evolution of the Spatial Association Patterns of Different Types of Land Trusteeship Risks
This study employed ArcGIS 10.2 to conduct a global spatial autocorrelation analysis, using 488 land trusteeship risk cases from 2013 to 2023 as observational units. These cases were categorized into five types: market risk, operational risk, financial risk, natural hazard risk, and contractual risk. Table 6 presents the Global Moran’s I index results for each risk type. The Moran’s I value for market risk is 0.025 (p < 0.001), indicating a certain degree of positive spatial autocorrelation, though the value is close to zero and thus reflects a weak correlation. Operational risk has a Moran’s I of 0.086 (p < 0.001), showing a slightly stronger spatial correlation than market risk, but still one that is relatively weak. Financial risk displays the highest spatial correlation with a Moran’s I of 0.124 (p < 0.001), and the result is statistically significant. Natural hazard risk has a Moran’s I of 0.031 (p < 0.001), suggesting a low level of spatial correlation, which is consistent with its more scattered distribution. Contractual risk shows a Moran’s I of 0.056 (p < 0.001), indicating weak but statistically significant spatial autocorrelation.
These results demonstrate that among the five risk types, financial risk exhibits the strongest spatial correlation (Moran’s I = 0.124), while market risk, operational risk, natural hazard risk, and contractual risk show relatively lower spatial correlations (Moran’s I = 0.025, 0.086, 0.031, and 0.056, respectively). However, the significance level (p < 0.01) across all risk types indicates that none of them follow a purely random spatial distribution, and all exhibit some degree of spatial clustering.
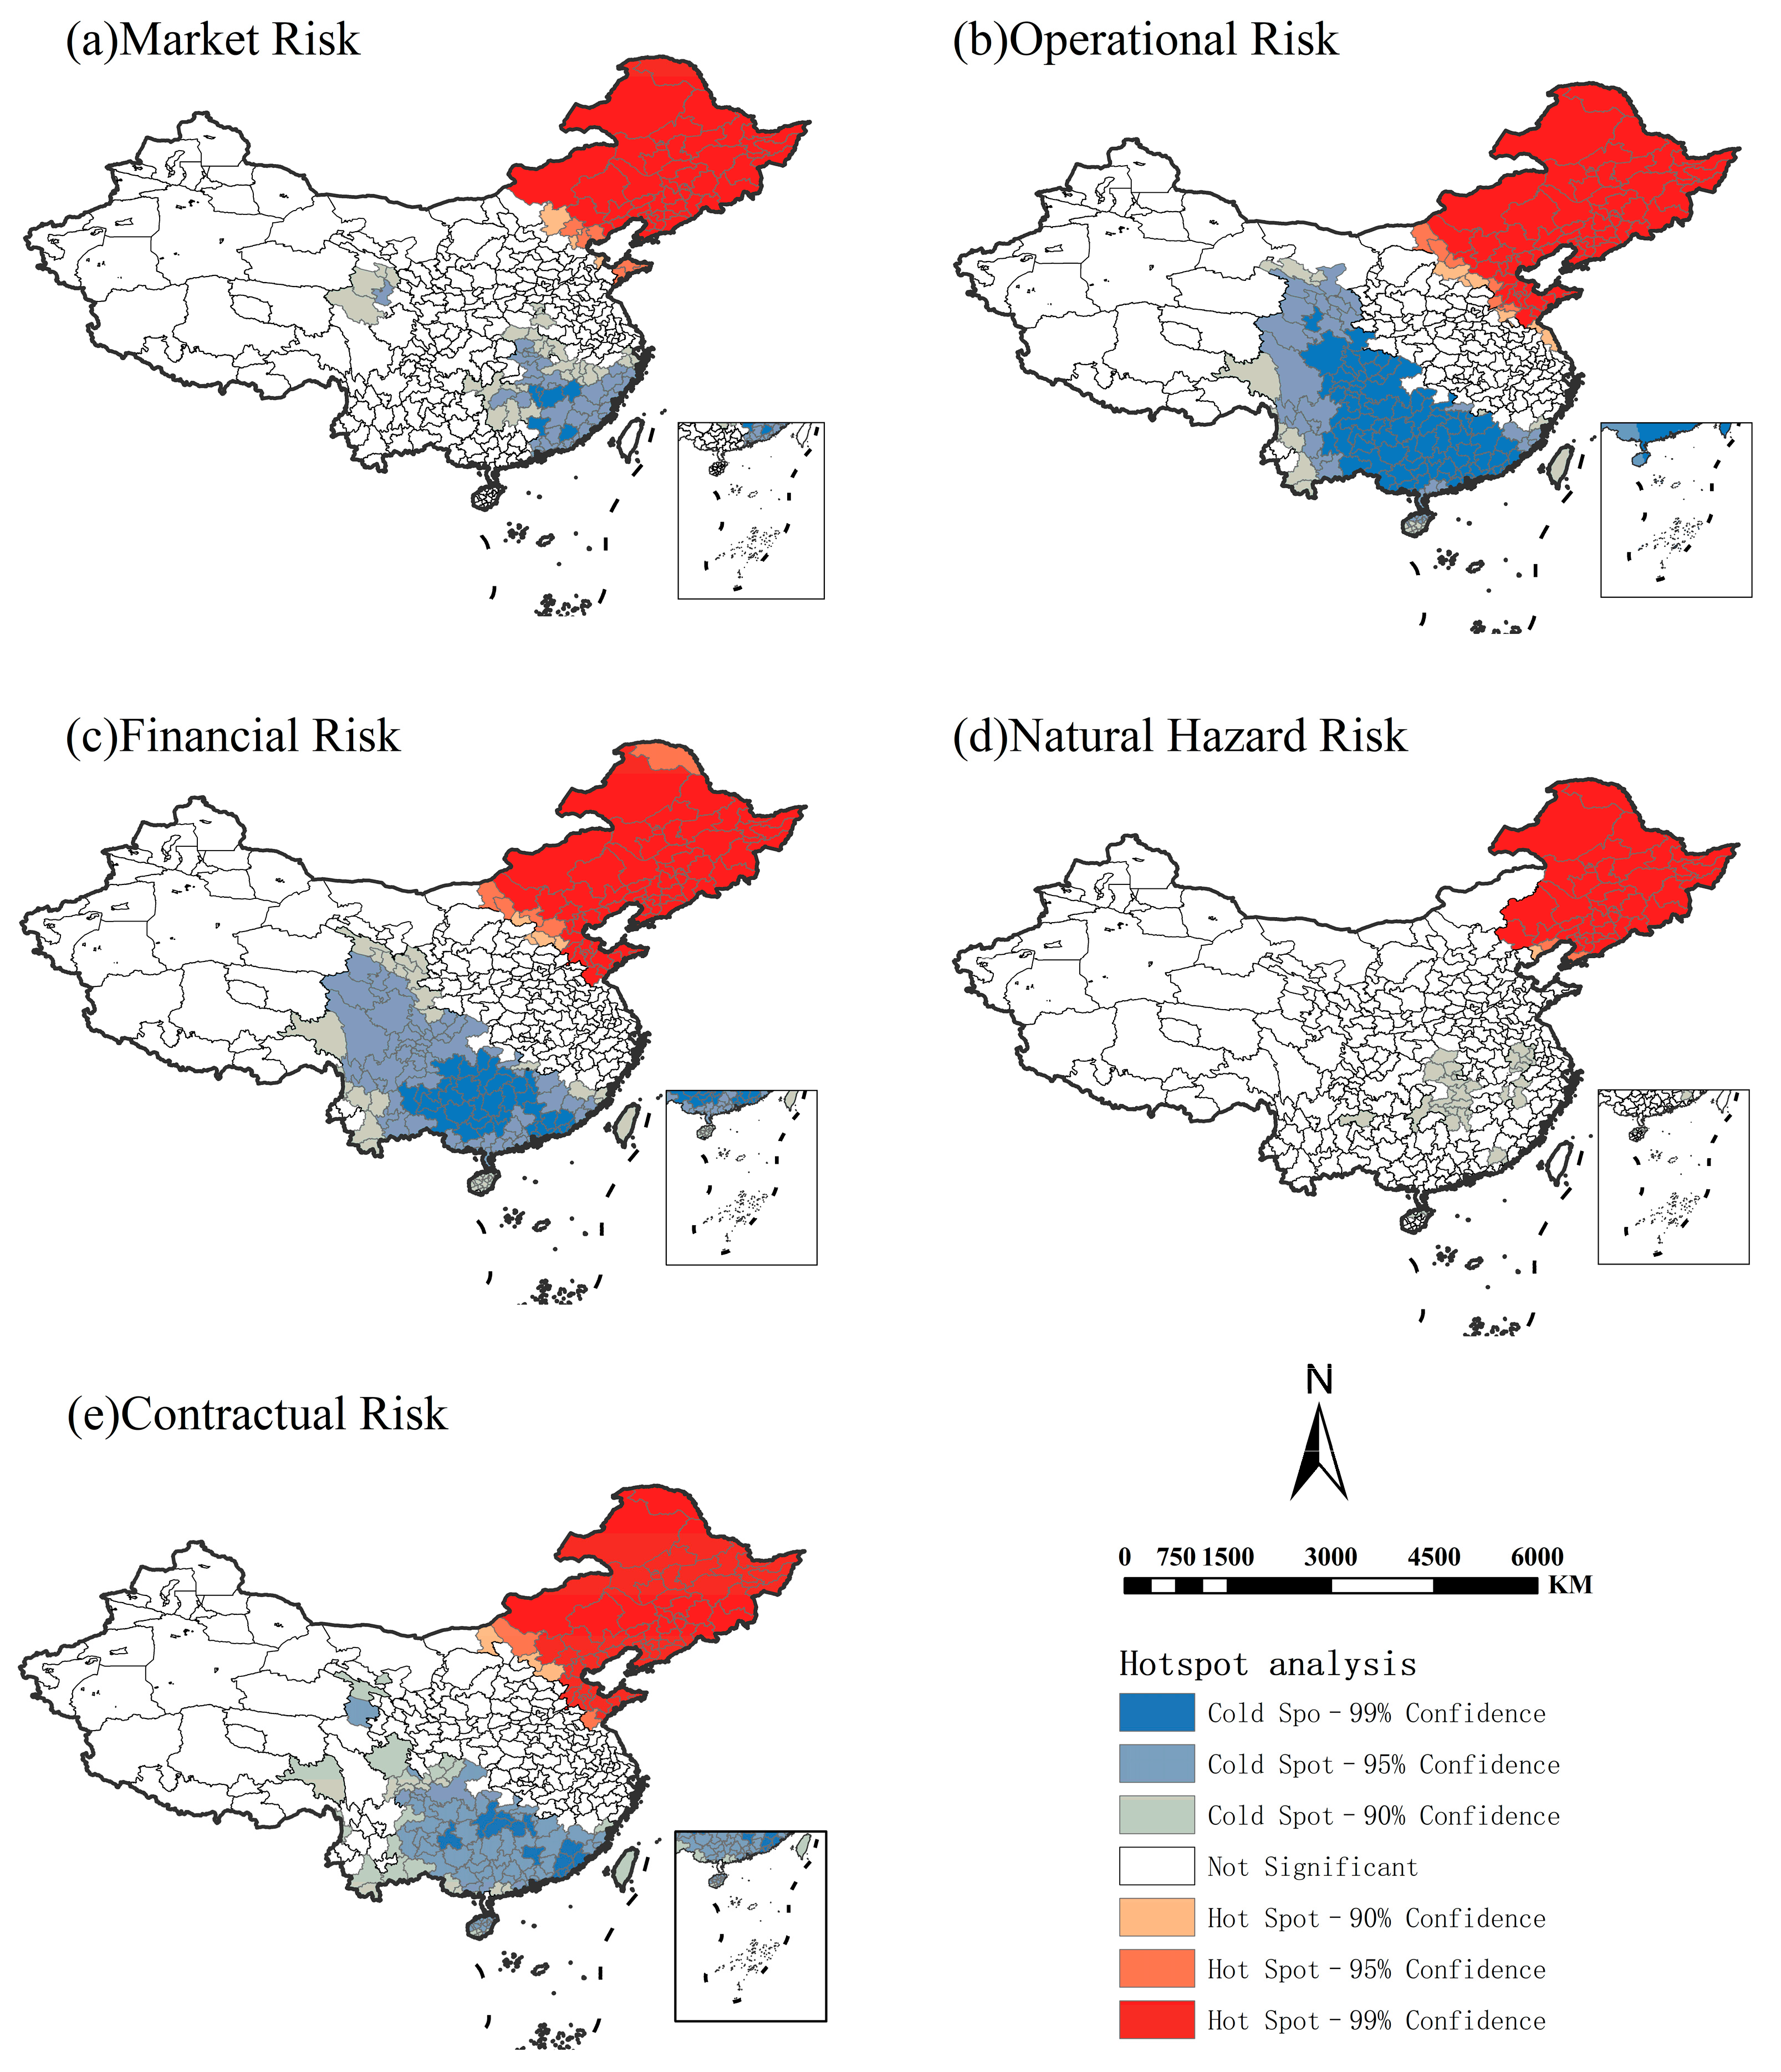
Based on the number of dispute cases associated with each type of land trusteeship risk nationwide, the Hot Spot Analysis tool was further applied to calculate the local Getis–Ord Gi* statistic for each risk type from 2013 to 2023. The results were classified into four categories—hot spots, sub-hot spots, sub-cold spots, and cold spots—based on descending Gi* values. This classification was used to analyze the spatial distribution patterns of land trusteeship risks across China and to identify areas where risk levels have significantly increased or decreased (see Figure 7).
Analyzing the five risk types—market risk, operational risk, financial risk, natural hazard risk, and contractual risk—reveals a relatively consistent spatial pattern across the country. First, hot-spot regions are primarily concentrated in Northeast China (Heilongjiang, Jilin, and Liaoning) and North China (Hebei and Shandong), where risk levels are significantly higher than the national average at the 99% confidence level. In the northeast, factors such as a narrowly structured economy, high concentration of land trusteeship activities, and harsh natural conditions contribute to elevated risk levels across all categories. In North China, high risk levels are largely driven by the complexity of agricultural operations, deficiencies in contract management, and greater exposure to market fluctuations. Second, cold-spot regions are mainly located in South China (Guangdong and Fujian), central–southern China, and the southwest (Hubei, Hunan, Guizhou, and Yunnan), where the five types of risks are all significantly lower than the national average at the 99% confidence level. This may be closely related to factors such as a diversified economic structure, market stability, standardized contract management practices, and relatively infrequent natural disasters. Lastly, the risk distribution in central and western regions, as well as parts of Central China (such as Xinjiang, Gansu, and Inner Mongolia), is more scattered and does not exhibit clear spatial clustering or dispersion characteristics. This is likely due to the uneven distribution of economic activities and significant differences in land-use patterns across these regions, resulting in marked spatial heterogeneity in risk expression. Overall, while different types of land trusteeship risks show common spatial characteristics, they also demonstrate regional variation. These spatial clustering patterns offer valuable insights for formulating targeted regional risk prevention and control. strategies.

5. Discussion

5.1. Analysis of Rural Land Trusteeship Risk Types

Through grounded theory analysis of a large number of judicial cases, this study identifies five core categories of risk in rural land trusteeship: market risk, operational risk, financial risk, natural hazard risk, and contractual risk. Compared with the existing literature, the risk identification in this study is more systematic. Chen et al. (2022), using an AHP–Fuzzy method, evaluated natural and operational risks in Manas County, Xinjiang, but did not address other risk dimensions [33]; Yu et al. (2022) examined the failure of village collectives to suppress trusteeship risk from the perspective of principal–agent theory, focusing primarily on contractual risk while lacking a systematic analysis of other types [27]. This study fills these gaps and provides a new perspective and empirical supplement for comprehensive risk assessment in rural land trusteeship. Although market risk accounts for a relatively small portion of the total cases, its impact is broad—particularly during periods of sharp fluctuations in agricultural input prices or prolonged downturns in agricultural product markets, often resulting in disputes over service fees or profit-sharing. This aligns with the inherent sensitivity of agricultural production to market cycles [41]. Operational risk reflects the core competence of trusteeship service providers. Case analysis reveals repeated issues such as production losses, crop failures, and even environmental damage caused by poor management, lack of technical expertise, or diseconomies of scale, mirroring concerns found in international discussions on outsourced agricultural services [60]. The prominence of financial risk is a key finding of this study. Many disputes arise from delayed service payments and broken financial chains among trusteeship organizations, rendering them unable to pay compensation or dividends. This reflects widespread issues among cooperatives and small-to-medium-sized service companies, including weak capital reserves, heavy reliance on external financing or subsidies, and poor internal financial management [25]. These findings partly validate the adverse selection problem under principal–agent theory—farmers may struggle to identify financially sound service providers [27]—and also relate to the institutional economic perspective, in which underdeveloped rural financial markets and difficulties in policy implementation exacerbate structural vulnerabilities. Natural hazard risk is an inherent feature of agriculture, primarily manifesting in disputes over liability for losses caused by extreme weather events or pest and disease outbreaks. Although relatively few in number, such cases often trigger other risks and have serious consequences. The lack of effective risk-sharing mechanisms in many cases is a key factor driving such disputes into legal proceedings [48]. Contractual risk, alongside financial risk, emerges as one of the most prevalent types, aligning closely with core tenets of transaction cost economics [60]. Cases frequently involve vague contract terms, ambiguous definitions of rights and obligations, and unclear provisions on breach of contract, creating room for opportunistic behavior. The complexity of agricultural production and high levels of information asymmetry make supervision costly and complete contracts difficult to achieve. Informal agreements or overly simple contracts further aggravate this risk. These patterns indicate that, amid the rapid expansion of rural land trusteeship in China, standardized contractual arrangements and enforceable mechanisms remain weak points [53]. Furthermore, these five categories of risk are not mutually exclusive but often interlinked. For example, natural disasters (natural hazard risk) may cause operational disruptions (operational risk), leading to financial strain (financial risk) and ultimately resulting in contractual non-compliance (contractual risk). Understanding the systemic and interconnected nature of these risks is critical for designing integrated risk management strategies.

5.2. Discussion on the Temporal Evolution of Rural Land Trusteeship Risks

This study finds that rural land trusteeship disputes exhibit a distinct “rise-then-decline” temporal pattern, with the number of cases peaking in 2020, and different types of risks showing differentiated trajectories over time. This overall trend reflects the general pattern observed during the growth of emerging agricultural models under policy-driven expansion. Specifically, the ascending phase of disputes (2013–2020) coincides closely with the period in which rural land trusteeship expanded from local pilot programs to national-scale implementation, accompanied by a rapid increase in practice volume [16]. During this phase, various trusteeship organizations and service models emerged rapidly, while corresponding market regulations, service standards, and oversight mechanisms lagged behind, making it more likely for latent contradictions and risks to surface. This phenomenon—where the early expansion stage is accompanied by an increase in risk—has also been observed in the initial development phases of socialized agricultural services and contract farming in other countries [61]. The decline in disputes since 2021 aligns with China’s broader policy shift toward high-quality development and improved regulatory guidance. In recent years, the Chinese government has issued several policy directives and guidelines aimed at enhancing the standardized management of agricultural socialized service providers and improving risk-sharing mechanisms [17]. These efforts have strengthened guidance, support, and oversight of service entities, thereby helping to promote greater market order and contractual stability.
A comparative analysis of the temporal evolution of different risk types reveals further distinctions. Financial risk and contractual risk not only dominate in volume but also exhibit the most pronounced temporal fluctuations, both peaking in 2020. This clearly illustrates that during the early, rapidly expanding phase of trusteeship—when oversight was still underdeveloped—vulnerabilities in financial sustainability and uncertainties in contract execution were the focal points of risk. These patterns are closely associated with the weak financial foundations of some trusteeship entities, their heavy dependence on government subsidies, and widespread issues of information asymmetry and opportunistic behavior within contractual relationships [27]. Although operational risk also experienced fluctuations, it remained at relatively high levels in later years, indicating that enhancing service professionalism, managerial precision, and technical adaptability among trusteeship organizations is a long-term endeavor that cannot be resolved solely through short-term policy interventions or market expansion [51]. In contrast, natural hazard risk, while relatively limited in case volume, exhibited a marked spike in 2020, suggesting that large-scale natural disasters in specific years can sharply expose the vulnerability of agricultural production to extreme weather events and may also trigger or amplify other risk types. Disputes related to market risk remained relatively stable over time; this study speculates that disagreements stemming from short-term fluctuations in agricultural product or input prices may not always escalate to the judicial level, but this does not negate the potential impact of market volatility on the stability of rural land trusteeship practices [60].

5.3. Discussion on the Spatial Evolution of Rural Land Trusteeship Risks

This study reveals significant spatial heterogeneity and clustering in rural land trusteeship risks, along with distinct spatial differentiation across different risk types—patterns that closely align with the uneven regional development and geographic characteristics of agricultural production in China.
Spatial patterns and drivers of clustering: Overall, the risk distribution exhibits a northeast–southwest directional pattern, with high-risk hot-spots concentrated in northeastern and northern China. This spatial configuration aligns closely with the layout of China’s major grain-producing regions [62] and the early focus areas of rural land trusteeship policy implementation [63]. These regions tend to have higher levels of land consolidation, greater demand for trusteeship services, and earlier large-scale practice, which have together contributed to a higher accumulation of dispute cases. This finding is comparable to those of previous studies by Zhang (2024) [64] and Wang (2020) [65], which showed that land-related disputes and conflicts vary spatially across regions, influenced by economic development models, institutional practices, and local governance capacity. The significant spatial autocorrelation identified in this study (Global Moran’s I = 0.300, p < 0.001) suggests the presence of spatial spillover effects, wherein institutional environments, market conditions, or policy implementation in neighboring areas may interact. This provides empirical support for the rationale behind regionally coordinated risk governance.
Spatial differentiation of risk types and underlying drivers: The spatial patterns of different risk types reveal the complexity of the driving mechanisms. Market and operational risks are primarily concentrated in economically dynamic and agriculturally intensive areas, such as parts of northern and northeastern China and some eastern coastal regions. Prior research has shown that in areas with higher degrees of marketization, more complex value chains, and more prevalent large-scale service models, transaction complexity and management challenges are more likely to arise [43]. Natural hazard risk is more directly shaped by geographic and climatic factors, with its spatial center skewed toward the northeast. This is consistent with the findings of Liu et al. (2021), who highlighted the heightened vulnerability of northeastern China to climatic extremes such as low temperatures, droughts, and floods, as well as the ad-ditional pressure from black soil conservation, all of which contribute to a higher nat-ural risk profile [66]. Financial and contractual risks display spatial patterns that largely overlap with the overall risk hot spots in the northeast and north, with financial risk exhibiting the strongest spatial autocorrelation. This indicates that in regions where trusteeship practices have scaled and marketized rapidly, issues related to capital chains and contract enforcement are the most concentrated and prevalent.
The spatiotemporal evolution of rural land trusteeship risks is the result of multiple interacting factors. At the macro level, policy orientation, economic development, and legal–institutional conditions play a decisive role. At the meso level, regional agricultural characteristics, the structure of the service market, and climatic–geographic factors are key influences. At the micro level, the capabilities of service organizations, farmers’ risk perception and behavior, and the structure of local social capital and trust all contribute to shaping risk patterns. This study, through judicial case analysis, offers indirect empirical support for the influence of these factors. However, to precisely quantify their respective contributions, richer datasets and more sophisticated econometric models are needed—an important direction for future research.

6. Conclusions

This study conducted an in-depth analysis of 558 judicial dispute cases related to rural land trusteeship, publicly available on China Judgments Online and published between 2013 and 2023. It systematically identified five major types of risk associated with rural land trusteeship practices in China: market risk, operational risk, financial risk, natural hazard risk, and contractual risk, with financial and contractual risks being particularly prominent. This case-based typology offers a foundational framework for understanding and managing risks inherent in this agricultural service model.
From a temporal perspective, the number of dispute cases followed a pronounced “rise-then-decline” trajectory, gradually increasing from 2013 to 2020, peaking in 2020, and then decreasing in subsequent years. This dynamic reflects the transition of rural land trusteeship from a phase of rapid expansion and concentrated risk exposure to one of regulatory standardization, rationalization of market actors, and partial risk mitigation. However, further analysis of individual risk trajectories reveals more nuanced patterns: financial and contractual risks not only dominated in volume but also exhibited the most intense temporal volatility, with a sharp surge culminating in 2020. These trends are closely related to weak financial management, financing constraints, and contract enforcement disputes during the rapid expansion phase of trusteeship practices. Operational risk, though fluctuating, remained persistently high in later years, indicating that enhancing the professionalism, managerial sophistication, and technical capabilities of service providers is a long-term challenge. Natural hazard risk, while lower in absolute volume, experienced a sharp rise in specific years (notably 2020), underscoring the latent impact of major external shocks—such as widespread natural disasters or public health crises—on trusteeship stability. Disputes related to market risk remained relatively stable over time, which may reflect the fact that issues arising from short-term price volatility in agricultural products or inputs are less likely to escalate into litigation. The combined temporal trend and inter-type variation highlight the complex dynamics of trusteeship risks shaped by policy cycles, market development phases, actor interactions, and external environmental shocks.
From a spatial perspective, the study reveals significant heterogeneity and clustering in the distribution of trusteeship-related risks. First, the overall spatial pattern follows a clear northeast–southwest axis. Spatial autocorrelation analysis confirms the presence of statistically significant positive global spatial autocorrelation (Global Moran’s I = 0.300, p < 0.001), suggesting that the risks are not randomly distributed across space but instead exhibit clustered patterns. Second, hot-spot analysis identifies the key high-risk clusters, concentrated in northeastern provinces (Heilongjiang, Jilin, and Liaoning) and parts of northern China (Inner Mongolia, Hebei, Shandong, and Beijing–Tianjin), forming a contiguous high-risk belt. In contrast, cold-spot regions with low risk are primarily located in southern China (Guangdong, Guangxi, and Hainan) and parts of the southwest (e.g., Hunan and Chongqing). Third, the spatial configurations of different risk types show marked variation: market and operational risks are more concentrated in economically active regions where agricultural socialized services are more prevalent; natural hazard risk is more strongly shaped by environmental and climatic conditions, with its center of intensity skewed toward northeastern China; and both financial and contractual risks, while widespread, display particularly strong clustering in northeastern and northern regions.
These findings not only enrich the theoretical understanding of rural land trusteeship risk but also provide critical empirical evidence for informed policy formulation and practical management. Identifying high-risk regions and dominant risk types allows governments, trusteeship organizations, and smallholders to adopt context-specific and targeted risk mitigation strategies. By integrating qualitative textual analysis with geographic spatial analysis, this study establishes an effective analytical framework for examining institutional risk in agricultural governance.
Despite the detailed analysis based on a large volume of judicial documents, the study has certain limitations. First, the data source is singular, relying exclusively on publicly disclosed court judgments, which may introduce representativeness bias by omitting risk events that did not enter the legal system. Second, the study focuses on descriptive and spatial characterization of risk phenomena, without conducting deeper quantitative tests on the underlying drivers or causal mechanisms. Future research could incorporate field surveys and structured interviews to obtain richer first-hand data that complement judicial sources. Extending the temporal scope of analysis and applying more advanced dynamic or causal inference models would also enable deeper insights into the mechanisms driving risk evolution. These efforts are essential for supporting the sustainable development of agricultural socialized service systems not only in China but also in other developing countries undergoing similar rural transformations.

Author Contributions

Writing—original draft, X.F.; Writing—review & editing, J.X. All authors have read and agreed to the published version of the manuscript.

Funding

This research was funded by the National Social Science Foundation of China, grant no. 20BJY119, and the Fundamental Research Funds of the Central Universities, grant no. 2024JCXKSK05.

Data Availability Statement

The raw data supporting the conclusions of this article will be made available by the authors on request.

Acknowledgments

Thanks to the anonymous reviewers for their pertinent suggestions.

Conflicts of Interest

The authors declare no conflict of interest.

References

  1. Bureau, J.-C.; Crombez, C.; Knops, L.; Matthews, A.; Swinnen, J.; Tangermann, S.; Viaggi, D. The Common Agricultural Policy after 2013. Intereconomics 2012, 47, 316–342. [Google Scholar] [CrossRef]
  2. FAO. The Future of Food and Agriculture: Trends and Challenges; Food and Agriculture Organization of the United Nations: Rome, Italy, 2017; ISBN 978-92-5-109551-5. [Google Scholar]
  3. Matthews, A. The EU’s Farm to Fork Strategy: A Reform of the CAP or an Agroecological Illusion? Bio-Based Appl. Econ. 2021, 10, 133–148. [Google Scholar]
  4. Pingali, P.L. Green Revolution: Impacts, Limits, and the Path Ahead. Proc. Natl. Acad. Sci. USA 2012, 109, 12302–12308. [Google Scholar] [CrossRef] [PubMed]
  5. Kay, C. The Agrarian Question and the Neoliberal Rural Transformation in Latin America. Eur. Rev. Lat. Am. Caribb. Stud. 2015, 100, 73–83. [Google Scholar] [CrossRef]
  6. Berdegué, J.A.; Fuentealba, R. Latin America: The state of smallholders in agriculture. In IFAD Conference on New Directions for Smallholder Agriculture; IFAD: Rome, Italy, 2011; pp. 24–25. [Google Scholar]
  7. Tuan, N.P. Contract Farming and Its Impact on Income and Livelihoods for Small-Scale Farmers: Case Study in Vietnam. J. Agribus. Rural. Dev. 2012, 26, 147–166. [Google Scholar]
  8. Gröbli, M.; del Pilar, M. Digital Farming, Invisible Farmers: Global Mergers and Smallholders in Latin America. Alternautas 2022, 9, 222–244. [Google Scholar] [CrossRef]
  9. Sims, B.G.; Kienzle, J. Sustainable agricultural mechanization for smallholders: What is it and how can we implement it? Agriculture 2017, 7, 50. [Google Scholar] [CrossRef]
  10. Seto, K.C.; Reenberg, A. Rethinking Global Land Use in an Urban Era; The MIT Press: London, UK, 2014; p. 83. [Google Scholar]
  11. Long, H. Land Use Transitions and Rural Restructuring in China; Springer: Cham, Switzerland, 2020. [Google Scholar]
  12. Cheng, L.; Shen, L.; Hu, Z. Spatiotemporal Evolution of the Coupling Coordination Between Agricultural Production Efficiency and Green Technology Innovation in China. China Agric. Resour. Reg. Plan. 2024, 1–13. Available online: http://kns.cnki.net/kcms/detail/11.3513.S.20241128.1048.008.html (accessed on 2 May 2025).
  13. Su, Y.; Huang, Q.; Meng, Q.; Zang, L.; Xiao, H. Socialized Farmland Operation—An Institutional Interpretation of Farmland Scale Management. Sustainability 2023, 15, 3818. [Google Scholar] [CrossRef]
  14. State Council. Guiding Opinions on Promoting Rural Industrial Revitalization. Agrotech. Serv. 2019, 36, 1–4. [Google Scholar]
  15. Li, G. Key Issues in Promoting Rural Industrial Revitalization: Interpretation of the Guiding Opinions. China Rural. Sci. Technol. 2019, 08, 8–11. [Google Scholar]
  16. Liu, B.; Tang, C.; Zhou, G.; Yi, C. Evolution Characteristics of Rural Innovation Policies and Implications for Rural Development. Econ. Geogr. 2024, 44, 147–159. [Google Scholar]
  17. Li, X.; Chen, H. Grassroots Party Building Leading Rural Governance: Logic, Evolution, Characteristics and Development Path. Guangxi Agric. J. 2024, 39, 41–53. [Google Scholar]
  18. State Council. The 14th Five-Year Plan for Promoting Agricultural and Rural Modernization. China Agric. Account. 2022, 04, 98. [Google Scholar]
  19. Wang, A. Press Conference on China’s Economic High-Quality Development: Situation of Consolidating Agriculture and Promoting Rural Revitalization. Available online: https://www.gov.cn/lianbo/fabu/202501/content_7000255.htm (accessed on 2 May 2025).
  20. Chen, X.; Liu, X. Research Status and Prospect of Rural Land Trusteeship in China. Hubei Agric. Sci. 2021, 60, 19–23. [Google Scholar]
  21. Daum, T.; Birner, R. Agricultural Mechanization in Africa: Myths, Realities and an Emerging Research Agenda. Glob. Food Secur. 2020, 26, 100393. [Google Scholar] [CrossRef]
  22. Ragasa, C.; Lambrecht, I.; Kufoalor, D.S. Limitations of Contract Farming as a Pro-Poor Strategy: The Case of Maize Outgrower Schemes in Upper West Ghana. World Dev. 2018, 102, 30–56. [Google Scholar] [CrossRef]
  23. Zhang, Y.; Zhang, B.; Yi, F. Rural Digital Governance and Collective Action. China Rural. Rev. 2024, 06, 98–121. [Google Scholar]
  24. Chen, Y.; Huang, S. Impact of Risk Perception on Farmers’ Land Trusteeship Decisions. China Land Sci. 2022, 36, 21–30. [Google Scholar]
  25. Deng, J.; Dong, K. Organizational Models and Innovation in China’s Grain Production. Agric. Econ. 2023, 01, 3–7. [Google Scholar]
  26. Xiao, T.; Lu, J. Reconstructing the Conceptual Framework of ‘Government Trust’. J. Xiamen Univ. (Philos. Soc. Sci. Ed.) 2024, 74, 135–148. [Google Scholar]
  27. Yu, L.; Gao, Q.; Zheng, S. Why Does Village Collective Coordination Fail in Reducing Land Trusteeship Risk? China Land Sci. 2022, 36, 68–77. [Google Scholar]
  28. Chen, C.; Yu, L.; Chen, J. Impact of Land Trusteeship on Asset Income Poverty Alleviation. Econ. Geogr. 2019, 39, 198–206. [Google Scholar]
  29. Sun, X.; Su, X. Land Trusteeship, Total Income, and Grain Planting Willingness. Issues Agric. Econ. 2012, 33, 102–108+112. [Google Scholar]
  30. Hu, L.; Zhou, Y.; Wu, S. Land Trusteeship Model and Vertical Integration. China Rural. Rev. 2019, 02, 49–60. [Google Scholar]
  31. Du, H.; Chen, J.; Gong, J.; Liu, B. Agricultural Production Trusteeship: Models, Effects and Risk-Sharing Mechanisms. Price Theory Pract. 2020, 12, 10–13+74. [Google Scholar]
  32. Tian, Y.; Xia, R. High-Quality Development of Agricultural Socialized Services. Agric. Econ. Manag. 2024, 6, 1–11. [Google Scholar]
  33. Chen, X.; Lin, T.; Liu, X.; Wang, X. Risk Assessment of Rural Contracted Land Trusteeship. J. China Agric. Mech. 2022, 43, 178–184+212. [Google Scholar]
  34. Rust, I.W. Review of a Concept of Agribusiness. J. Farm Econ. 1957, 39, 1042–1045. [Google Scholar] [CrossRef]
  35. Besley, T.; Ghatak, M. Incentives, Choice, and Accountability in the Provision of Public Services. Oxf. Rev. Econ. Policy 2003, 19, 235–249. [Google Scholar] [CrossRef]
  36. Farrington, J.; Christoplos, I.; Kidd, A.; Beckman, M. Creating a Policy Environment for Pro-Poor Agricultural Extension: The Who? What? And How? Nat. Resour. Perspect. 2002, 80, 1356–9228. [Google Scholar]
  37. Lee, H.-L. Information Spaces and Collections: Implications for Organization. Libr. Inf. Sci. Res. 2003, 25, 419–436. [Google Scholar] [CrossRef]
  38. Cabrini, S.M.; Irwin, S.H.; Good, D.L. Style and Performance of Agricultural Market Advisory Services. Am. J. Agric. Econ. 2007, 89, 607–623. [Google Scholar] [CrossRef]
  39. Karami, E.; Rezaei-Moghaddam, K. Determinants of Agricultural Cooperatives’ Performance in Iran. Agric. Econ. 2005, 33, 305–314. [Google Scholar] [CrossRef]
  40. Vogelsang, I. Incentive Regulation and Competition in Public Utility Markets. J. Regul. Econ. 2002, 22, 5–27. [Google Scholar] [CrossRef]
  41. Cabrini, S.M.; Stark, B.G.; Önal, H.; Irwin, S.H.; Good, D.L.; Martines-Filho, J. Efficiency Analysis of Agricultural Market Advisory Services. MSOM 2004, 6, 237–252. [Google Scholar] [CrossRef]
  42. Hibbard, J.D.; Kumar, N.; Stern, L.W. Destructive Acts in Marketing Channel Relationships. J. Mark. Res. 2001, 38, 45–61. [Google Scholar] [CrossRef]
  43. Coase, R.H. The Nature of the Firm. Economica 1937, 4, 386–405. [Google Scholar] [CrossRef]
  44. Wang, W.; Xu, Q.; Zhou, X. Land Trusteeship and Agricultural Service Scale Operation. J. Shandong Univ. Financ. Econ. 2017, 29, 87–95, 105. [Google Scholar]
  45. Hu, L.; Wu, S. The Connotation and Realization of Land Trusteeship. Economist 2019, 12, 68–77. [Google Scholar]
  46. Kong, X.; He, X. Reform of Supply and Marketing Cooperatives. J. Xinjiang Norm. Univ. 2023, 44, 77–88. [Google Scholar]
  47. Du, H.; Chen, J.; Li, Y. Agricultural Production Trusteeship and Interest Linkage. Rural. Econ. 2021, 1, 31–38. [Google Scholar]
  48. Mu, N.; Kong, X.; An, X. Risk-Sharing Mechanism of Land Trusteeship. Price China 2018, 03, 66–69. [Google Scholar]
  49. Chen, Y. Risk Perception and Land Trusteeship Decision-Making. Master’s Thesis, Northeast Agricultural University, Harbin, China, 2024. [Google Scholar]
  50. Wang, Y.; Xiao, J.; Huo, Y. Risk Identification Index System of Rural Land Trusteeship. Anhui Agric. Sci. 2023, 51, 218–223. [Google Scholar]
  51. Jiang, C. Four Relationships in Agricultural Production Trusteeship Services. Issues Agric. Econ. 2020, 09, 55–63. [Google Scholar]
  52. Wang, Q. Deepening Rural Property Rights Reform. Agric. Econ. 2024, 10, 107–109. [Google Scholar]
  53. Yu, H.; Zhang, Z. Mechanism, Conditions and Risk Avoidance of Land Trusteeship. Reform 2018, 04, 110–119. [Google Scholar]
  54. Guo, L.; Zhao, D.; Chen, G.; Yan, L.; Feng, P.; Wang, Y. Spatiotemporal Characteristics of Land Use in Zhengzhou (2000–2020). Reg. Res. Dev. 2023, 42, 149–154. [Google Scholar]
  55. Rehemanrukiya; Kasmu, A.; Duolat, X.; Wei, B.; Zhang, X.; Liang, H. Carbon Storage in Northern Tianshan Urban Agglomeration. China Environ. Sci. 2022, 42, 5905–5917. [Google Scholar]
  56. Xiaowei, Y.; Jie, Z.; Wangjun, L. Urbanization and Land Ecosystem Service Value in Wuhan. DBKXXB 2015, 31, 249–256. [Google Scholar]
  57. Feng, Y.; Ke, M.; Zhou, T. Non-Grain Production of Cultivated Land in China. Sustainability 2022, 14, 14286. [Google Scholar] [CrossRef]
  58. Anselin, L.; Bera, A.K.; Florax, R.; Yoon, M.J. Spatial Dependence Tests. Reg. Sci. Urban Econ. 1996, 26, 77–104. [Google Scholar] [CrossRef]
  59. Wen, Y.; Zhang, Z. Social Risks of Farmers’ Centralized Residence. China Land Sci. 2018, 32, 21–27. [Google Scholar]
  60. Qiu, Y.; Zhou, J.; Tang, L. Risk Forecast and Safety Management in Agricultural Outsourcing. Mob. Inf. Syst. 2022, 2022, 5489118. [Google Scholar]
  61. Anderson, E.; Monjardino, M. Contract Design in Agricultural Supply Chains. Eur. J. Oper. Res. 2019, 277, 1072–1082. [Google Scholar] [CrossRef]
  62. Liu, Y.; Lu, S.; Chen, Y. Urban–Rural Equalized Development Patterns in China. J. Rural Stud. 2013, 32, 320–330. [Google Scholar] [CrossRef]
  63. Yang, L.; Bingpu, C.; Lanlan, H. Agricultural Socialized Service in China. J. Chin. Agric. Mech. 2022, 43, 229. [Google Scholar] [CrossRef]
  64. Zhang, M.; Tan, S.; Chen, E.; Li, J. Land Disputes in China: Spatio-Temporal Characteristics and Influencing Factors. Ecol. Indic. 2024, 160, 111938. [Google Scholar] [CrossRef]
  65. Wang, Y. Impact of Land Transfer Direction on Land Disputes. Ind. Innov. Res. 2020, 16, 9–13. [Google Scholar]
  66. Liu, F.; Li, Y.; Liu, X.; Yu, S. Spatial–temporal changes in meteorological and agricultural droughts in Northeast China: Change patterns, response relationships and causes. Nat. Hazards. 2021, 109, 2191–2212. [Google Scholar]
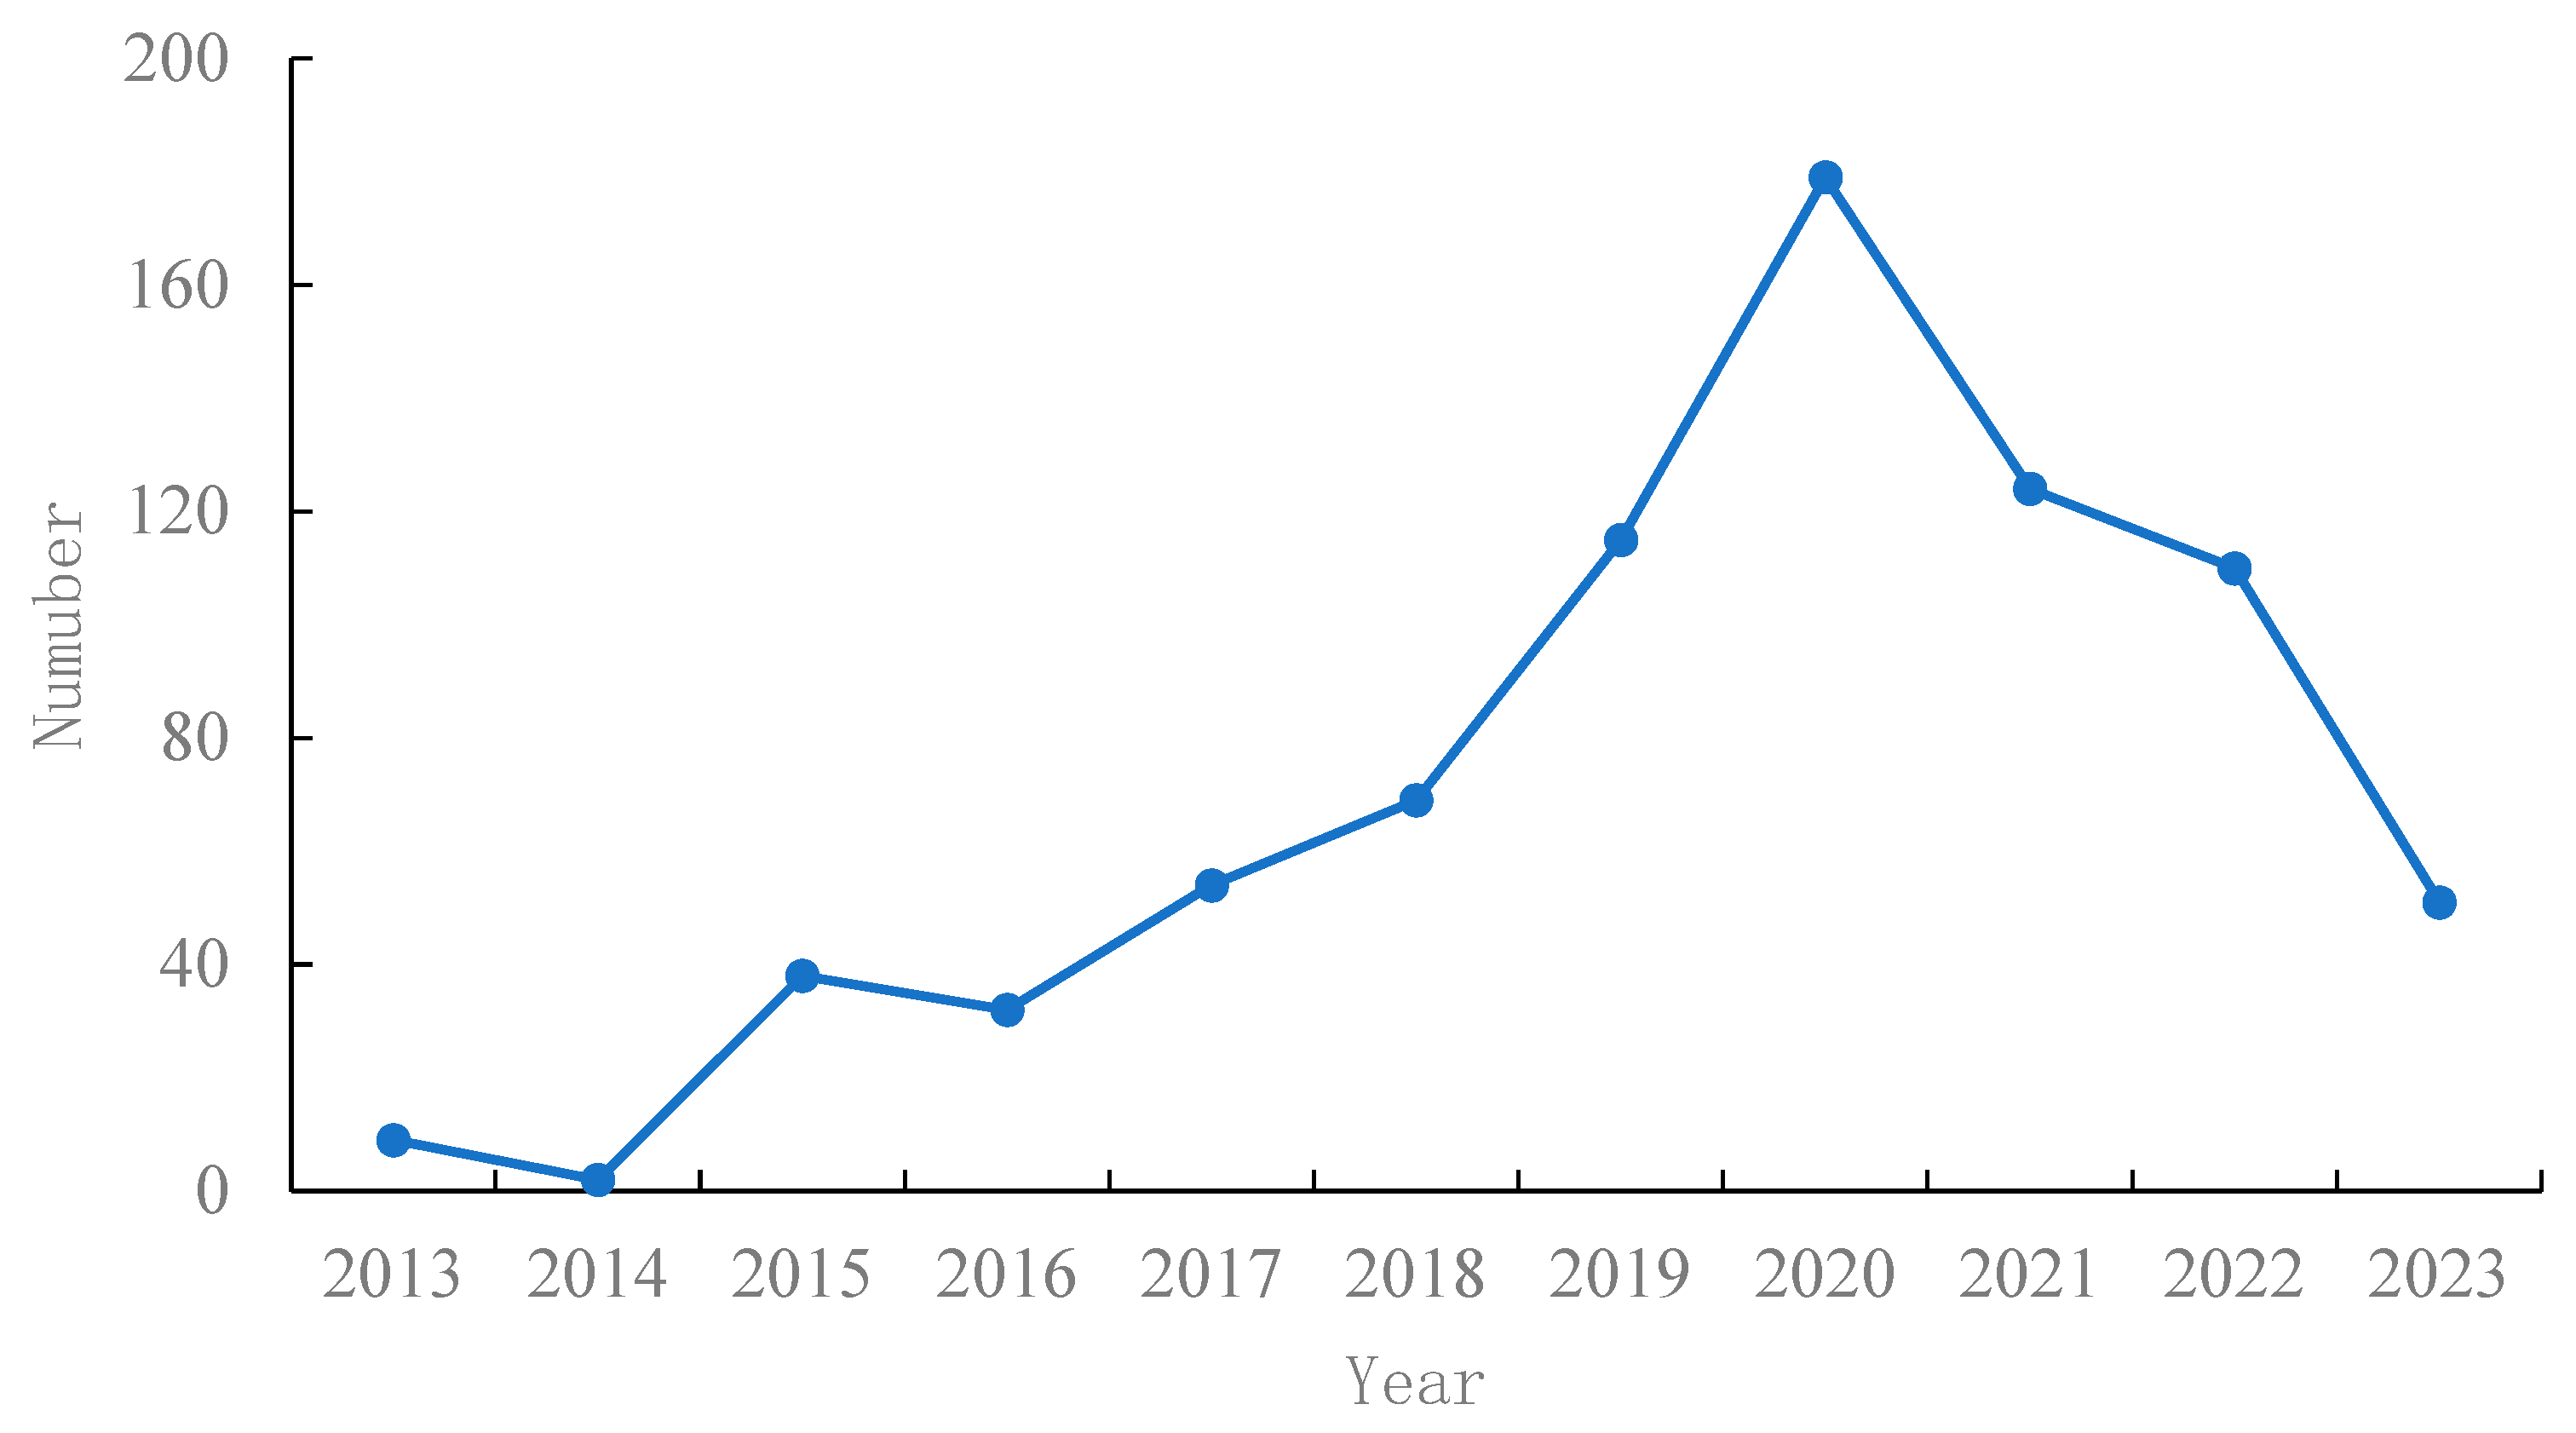
Figure 1. Temporal trend of land trusteeship risks nationwide.
Land 14 01132 g001
Figure 2. Annual trends of different types of land trusteeship risks.
Land 14 01132 g002
Figure 3. Overall spatial characteristics of land trusteeship risks nationwide.
Land 14 01132 g003
Figure 4. Distribution of hot and cold spots of land trusteeship risks.
Land 14 01132 g004
Figure 5. Overall spatial characteristics of different types of land trusteeship risks.
Land 14 01132 g005
Figure 6. Standard deviation ellipses of different risk types.
Land 14 01132 g006
Figure 7. Hot-spot analysis of risk.
Land 14 01132 g007
Table 1. Concept extraction process.
Serial NumberOriginal TextInitial Concept
1In the first-instance judgment, the appellant was found to owe the appellee RMB 7102 in trusteeship service fees. The appellant argued that the court’s finding was inconsistent with the actual amount, asserting that the correct payable amount should be RMB 1803.50.Disputes between trusteeship parties over the final trusteeship service price
2The defendant Sun Fengxian contended that due to the poor quality of seeds provided by the plaintiff, her land experienced a reduced yield, producing only around 1200 jin per mu. The plaintiff also failed to inspect the field in person, ultimately resulting in lower revenue from the sale of her agricultural products.Reduced agricultural yield caused by low-quality seeds, leading to decreased income from agricultural product sales
3The plaintiff entrusted 15 mu of contracted farmland to a cooperative for trusteeship services. The seed and fertilizer fee was RMB 180 per mu for a three-year term, from 1 April 2019, to 31 March 2022. All inputs were centrally procured by the Jinhui Feng Cooperative. Later, due to rising input costs, the cooperative unilaterally decided to adjust the trusteeship price, but the parties failed to reach a new agreement.Disputes over trusteeship pricing adjustments triggered by rising agricultural input costs and unilateral cost-cutting measures by cooperatives
4In autumn, the plaintiff dispatched personnel to inspect the field and claimed that the land could yield 1700 jin per mu. However, due to the poor quality of the seeds provided by the plaintiff, actual yield was only about 1200 jin per mu.Low-quality seed supply from the trusteeship provider resulted in yield reduction
5Hua’ao Cooperative failed to fulfill its responsibilities throughout the entire farming period, including under-application of fertilizers and improper seed selection. Pesticide spraying was delayed by half a month compared to adjacent plots, and only occurred after repeated requests from the defendant. As a result, the autumn harvest was extremely poor due to inadequate field management.Poor management by the trusteeship provider, including failure to implement large-scale operations, which led to crop losses and even total yield failure
6The plaintiff’s claims regarding the contract and provision of seeds and fertilizer are factual. However, due to the poor quality of the seeds, our land yielded only around 1300 jin per mu instead of the normal 1600 jin. After on-site inspection, the plaintiff failed to take any remedial measures. Therefore, I only agree to pay RMB 900 for the seeds and fertilizer.The farmer failed to fulfill the contractual obligation to pay for seeds and fertilizers
7We did not pay the trusteeship fee of RMB 3600 on the grounds that the crop yield was too low. The corn yield was only 500 jin per mu, whereas the plaintiff had promised an expected yield of 2000 jin per mu. We believe we owe nothing to the plaintiff and instead, the plaintiff should compensate us for economic losses.The farmer refused to pay the trusteeship fee on the grounds that the land management was substandard
8Although the defendant, Dongnong Ecological Family Farm of Fuxin Mongol Autonomous County, agreed and expressed appreciation for the arrangement, it has yet to make payment. Except for RMB 10,000 in interest paid by Liaoning Gerui Agricultural Technology Service Co., Ltd. on its behalf, the principal and remaining interest are still outstanding.The trusteeship provider defaulted on the payment of agreed compensation for losses
9After negotiating with the two defendants, they initially agreed to compensate for the yield losses. However, after the plaintiff harvested the corn and brought it home, the Jinnongfeng Cooperative refused to compensate, and defendant Zhang Qishun also denied his prior commitment. Thus, the plaintiff initiated civil litigation.The trusteeship provider breached its promise and refused to compensate for yield losses
10The defendant fully and properly performed its contractual obligations within the contract period. However, due to the exceptionally high rainfall in June, July, and August 2022—reportedly the most in nearly 30 years in both Liaoning Province and Xinmin City—the reduced corn yield in low-lying areas with poor drainage was fundamentally caused by force majeure.Reduced crop yield due to meteorological disasters
11We orally agreed that the plaintiff would ensure a yield of 1500 jin per mu. However, due to pest infestation, actual yield dropped significantly to around 1200 jin per mu. The plaintiff did not send anyone for on-site inspection or to address the issue.Reduced crop yield caused by pest and disease outbreaks
12During contract performance, the appellee, Jinhui Feng Cooperative, provided the appellant with agricultural inputs such as fertilizer and seeds, but failed to fulfill other obligations including sowing and autumn harvest.The trusteeship provider fulfilled only part of the agreed trusteeship obligations
13On 10 April 2013, the plaintiff and defendant signed a rural land transfer (equity-based trusteeship) contract. The defendant undertook agricultural production via equity-based land trusteeship. The 2013 profit-sharing payment was made in full. However, the 2014 payment of RMB 5679, due on 1 December 2014, has remained unpaid.Discrepancies between the two parties regarding the classification of the trusteeship contract
14The appellee, Jinhui Feng Cooperative, claimed to have renegotiated the contract into a partial trusteeship agreement with the appellant Qin Fengmin, but Qin denied this. Furthermore, the appellee failed to provide sufficient evidence to support its claim. Therefore, the appellee should be deemed in breach of contract and bear corresponding liability.The trusteeship provider subcontracted land use without the consent of the other party
15In 2020 and again on 25 February 2021, the defendant, without approval from the village committee and the sixth group of villagers, unilaterally subleased 405.63 mu and 240 mu of contracted farmland to unrelated third parties, Li Jianwei and Li Dongbao, for corn cultivation.The plaintiff initiated litigation due to the defendant’s failure to pay rent on time as stipulated in the contract
16The plaintiff Zhang signed a land lease agreement with the defendant to lease 2.19 mu of contracted farmland. The 2013 rent was paid, but the 2014 lease payment of RMB 1971, due on 1 December 2014, remains unpaid despite multiple requests by the plaintiff and various excuses by the defendant.The trusteeship provider failed to perform contractual obligations and unilaterally abandoned land management
17In the contract dispute between plaintiff Jia Jinbao and defendant Liaoning Sanrui Agricultural Science and Technology Development Co., Ltd., the plaintiff provided 120 mu of land and a trusteeship fee of RMB 33,120 according to the agreement, but the defendant essentially abandoned management of the field.The defendant failed to pay for agricultural products at the contractually agreed sale price, breaching the contract
18During the autumn harvest, the plaintiff only received 16,800 jin of produce, and the defendant failed to pay at the agreed protective price of RMB 4.5 per jin.The contract was deemed invalid due to the presence of a party lacking civil capacity in the trusteeship agreement
19The defendant’s breach of contract caused the plaintiff significant financial losses. The plaintiff claimed a sunflower payment of RMB 75,600, compensation for losses totaling RMB 91,320, and other damages amounting to RMB 8475, for a total claim of RMB 175,395.Reduced crop yield due to meteorological disasters
20The plaintiff requested the court to order the defendant Deng Qingyi to pay RMB 6000 in trusteeship service fees, along with interest and liquidated damages as specified in the contract. However, Deng Qingyi is both deaf and mute, and unable to communicate normally. According to the law, he should be considered lacking civil capacity. Therefore, the three contracts signed by Deng Qingyi should be deemed invalid.Reduced crop yield caused by pest and disease outbreaks
21
Table 2. Scope development and qualitative coding processes.
Conceptualization
(Open Coding)
Categorization
(Open Coding)
Axial CodingSelective Coding
Disputes between trusteeship parties over service pricing; yield reduction leading to fluctuations in agricultural product revenues; trusteeship pricing disputes triggered by fluctuations in input costs1 Disputes over trusteeship service pricing
2 Fluctuations in agricultural product sales prices due to quality or yield issues
3 Variations in agricultural input prices affecting trusteeship fees
1 Fluctuations in agricultural input prices
2 Trusteeship service pricing
3 Market demand volume
4 Fluctuations in agricultural product prices
Market Risk
Poor seed quality supplied by the trusteeship provider caused yield reduction; mismanagement by the trusteeship provider due to technical limitations or lack of large-scale operations, resulting in reduced or failed crop yields4 Yield reduction or crop failure caused by inadequate capacity or poor management by the trusteeship provider
5 Economic losses to farmers due to lack of technical expertise and operational experience of the trusteeship provider
6 High costs and low returns caused by inappropriate scale of trusteeship operations
5 Insufficient operational qualifications and capabilities
6 Underdeveloped agricultural infrastructure
7 Lack of professional technical personnel
8 Scale of land trusteeship
Operational Risk
Farmer failed to fulfill contractual payment obligations for seeds and fertilizers; trusteeship provider breached commitment and refused to compensate for yield losses; farmer refused to pay the trusteeship fee, citing substandard land management; trusteeship provider defaulted on agreed compensation payments7 Disputes arising from farmers failing to pay trusteeship fees on time
8 Farmers’ refusal to pay land rent
9 Partial or complete refusal to pay trusteeship fees due to dissatisfaction with service outcomes
10 Trusteeship provider’s unwillingness to compensate for economic losses
11 Trusteeship provider’s prolonged failure to settle outstanding payments
9 Poor cash flow
10 Payment of trusteeship fees
11 Difficulty in loan financing
Financial Risk
Extreme rainfall or pest and disease outbreaks resulted in agricultural yields or profits falling short of contractual expectations12 Yield reduction caused by meteorological disasters
13 Yield reduction caused by geological disasters
14 Yield reduction caused by pest or disease outbreaks
12 Impact of natural disastersNatural Hazard Risk
Partial fulfillment of trusteeship obligations; trusteeship provider defaulted on dividend payments for land equity participation; inconsistencies between parties in defining the type of trusteeship contract; trusteeship provider unilaterally subcontracted land use without consent; the existence of a party lacking civil capacity rendered the signed contract invalid15 Trusteeship provider cut corners and failed to deliver services in accordance with contractual terms
16 Trusteeship provider failed to pay profit returns as stipulated in the contract
17 Breach of contract due to unilateral changes in the type of trusteeship by the provider
18 Trusteeship provider violated the contract by subleasing the land to third parties without consent
19 The contract was rendered invalid due to the presence of a party lacking civil capacity
13 Insufficient contract performance capacity of the trusteeship provider
14 Lack of civil capacity on the part of the trusteeship provider
Contractual Risk
Table 3. Parameters of the standard deviation ellipse.
YearCentral LongitudeCentral LatitudeShort Axis/Long AxisAzimuth Angle (°)
2021115.6537.471.9562.54
2022118.9840.942.3764.96
2023115.7037.951.8867.60
Table 4. Global spatial autocorrelation analysis.
CategoryMoran’s IZ-Valuep-ValueSpatial Autocorrelation
Total Number of Disputes0.3004.410.000Significantly Positive Correlation
Table 5. Parameters of the standard deviation ellipses.
Risk TypeCentral LongitudeCentral LatitudeShort Axis/Long AxisAzimuth Angle (°)
Market Risk115.0138.620.4773.64
Operational Risk115.1437.350.6379.28
Financial Risk115.1437.350.6379.28
Natural Hazard Risk118.1741.060.6272.35
Contractual Risk113.6335.840.6678.72
Table 6. Global Moran’s I indices for different types of land trusteeship risks.
CategoryMoran’s IZ-Valuep-ValueSpatial Autocorrelation
Market Risk0.0254.2590.000Significantly Positive Correlation
Operational Risk0.08613.2330.000Significantly Positive Correlation
Financial Risk0.1244.6700.000Significantly Positive Correlation
Natural Hazard Risk0.0315.5240.000Significantly Positive Correlation
Contractual Risk0.0569.0730.000Significantly Positive Correlation
Disclaimer/Publisher’s Note: The statements, opinions and data contained in all publications are solely those of the individual author(s) and contributor(s) and not of MDPI and/or the editor(s). MDPI and/or the editor(s) disclaim responsibility for any injury to people or property resulting from any ideas, methods, instructions or products referred to in the content.