Article

Mongolian Freshwater Ecosystems Under Climate Change and Anthropogenic Pressure: A Case Study of Ugii Lake

by
Itgelt Navaandorj
1,2,
Erdenetsetseg Tsogtbayar
1,
Solongo Tsogtbaatar
1,
Gerelt-Od Dashdondog
1,
Mandakh Nyamtseren
1,2 and
Kikuko Shoyama
3,*
1
Institute of Geography-Geoecology, Mongolian Academy of Sciences, Ulaanbaatar 13330, Mongolia
2
Eco-Innovation and Development Center, Ulaanbaatar 15171, Mongolia
3
College of Agriculture, Ibaraki University, Ami 300-0393, Japan
*
Author to whom correspondence should be addressed.
Land 2025, 14(5), 998; https://doi.org/10.3390/land14050998
Submission received: 5 March 2025 / Revised: 22 April 2025 / Accepted: 24 April 2025 / Published: 5 May 2025

Abstract

:
This study investigates the hydrological, ecological, and socio-economic responses of Ugii Lake—a freshwater body in semi-arid Central Mongolia—to climate variability and anthropogenic pressures. Seasonal field surveys conducted during the spring, summer, and fall of 2023–2024 revealed notable spatial and temporal variation in water quality, with pH ranging from 7.54 to 8.87, EC from 316 to 645 µS/cm, and turbidity between 0.36 and 5.76 NTU. Total dissolved solids (TDS) values and ionic compositions indicated increased salinization in some zones, particularly those exposed to high evaporation and shoreline disturbance. Heavy metal analysis identified elevated levels of aluminum, manganese, and zinc at several sampling points; however, concentrations generally remained within national environmental standards. Vegetation surveys showed that disturbed areas—especially those affected by grazing and tourism—exhibited reduced native plant diversity and dominance of invasive species. Socio-economic interviews with local herders and stakeholders indicated that 67.3% of households experienced declining livestock productivity, and 37.1% reported increased allergies or respiratory symptoms linked to deteriorating environmental conditions. Despite some ongoing conservation efforts, respondents expressed dissatisfaction with enforcement and impact. These findings highlight the need for community-driven, integrated lake management strategies that address environmental degradation, climate adaptation, and rural livelihood security.

1. Introduction

Climate change significantly impacts freshwater ecosystems globally, affecting stability, biodiversity, and livelihoods. Located in Mongolia’s semi-arid steppe, Ugii Lake exemplifies the vulnerability of small-to-medium-sized lakes to climate variability, making it a key indicator of regional environmental change. In recent decades, Ugii Lake has experienced pronounced hydrological and thermal changes that have affected its water levels, aquatic ecosystem, and the socio-economic well-being of communities that rely on it. Understanding the effects of climate change on lakes like Ugii is essential for developing adaptive strategies to preserve ecological balance and sustain local livelihoods [1,2]. A significant consequence of climate change affecting Ugii Lake is the reduction of its water surface area, a phenomenon commonly observed across semi-arid and arid regions, where declining precipitation and heightened evaporation intensify water loss [3]. Between 1986 and 2018, Ugii Lake’s surface area decreased by approximately 13.5%, corresponding to a significant decline in annual precipitation and a reduction in river inflow, two primary contributors to lake volume [1]. This reduction in surface area reflects a broader pattern observed in other semi-arid and arid regions—such as Central Asia, Sub-Saharan Africa, and Western North America—where altered precipitation patterns and intensified evaporation have led to significant declines in lake levels [4,5].
Annual precipitation in Central Mongolia has shown variability, but a general decreasing trend in precipitation has created an imbalance in the lake’s natural hydrological cycle. Reduced river inflows further exacerbate the situation. For Ugii Lake, inflow from surrounding rivers and streams has been vital in maintaining water levels, especially during dry seasons. Climate models suggest that Central Asia, including Mongolia, may experience prolonged droughts interspersed with intense rainfall events, further straining lake systems in arid environments [4]. These changes could impair the lake’s ability to recover to previous levels after seasonal drawdowns, leading to a persistent decrease in water surface area and a decline in the quality of aquatic habitats. In Mongolia, the national average air temperature has increased by approximately 2.24 °C between 1940 and 2023, with central regions, including Arkhangai Province, experiencing similar warming trends [4]. This substantial rise in temperature has contributed to elevated evaporation rates across lake and steppe ecosystems. Studies estimate that annual evaporation in Central Mongolia ranges from 800 to 1100 mm, often surpassing annual precipitation, which averages around 250–350 mm in the Ugii Lake basin [1,2]. This imbalance accelerates lake water loss, exacerbating salinization and degrading aquatic habitats. Increased evaporation not only diminishes lake volume but also concentrates salts and other dissolved minerals, potentially impacting water quality [1]. This trend aligns with findings from global studies on evaporation’s role in lake systems, where climate-induced warming amplifies evaporation, contributing to water scarcity and altering the physical and chemical characteristics of lake ecosystems [6]. As evaporation rates rise, Ugii Lake faces risks of salinization, which could further disrupt the ecosystem and reduce its suitability for both aquatic organisms and human use.
Alongside hydrological changes, rising temperatures have introduced thermal shifts that alter the structure and function of lake ecosystems. Ugii Lake has experienced increased water temperatures in recent years, likely driven by the broader trend of climate warming observed across Central Asia. Higher air temperatures have direct consequences for lake thermal dynamics, affecting the depth and duration of thermal stratification, as observed in various lake systems globally [5,7]. Stratification, or the layering of water by temperature, can impact the distribution of dissolved oxygen and nutrients, essential for sustaining aquatic organisms [8]. Rising water temperatures have the potential to disrupt the lake’s thermal regime, shortening the mixing periods that are critical for oxygenating deep lake layers. This can lead to hypoxic (low oxygen) conditions, especially in deeper areas, creating a stressful environment for aquatic life [9]. Research has shown that temperature shifts can influence the metabolic rates of organisms, leading to faster growth and reproduction rates for some species, while others may struggle to survive [10]. For example, increased temperatures may favor the proliferation of algal species, potentially causing algal blooms that further deplete oxygen levels and disrupt the lake’s ecological balance.
Furthermore, altered thermal dynamics may influence species composition within Ugii Lake. Certain fish and invertebrate species, particularly those adapted to cooler waters, may decline as water temperatures exceed their physiological tolerances. In contrast, warmer temperatures may create favorable conditions for invasive species that outcompete native species, thereby reducing biodiversity and altering the lake’s ecosystem structure [11,12]. This shift in species composition could have far-reaching implications, as changes in the abundance and diversity of primary producers and consumers disrupt food webs and nutrient cycles within the lake. The hydrological and thermal changes affecting Ugii Lake pose significant risks to biodiversity and ecosystem stability. Reduced water levels and increased temperatures contribute to lower oxygen solubility, a critical factor for sustaining aquatic life [8]. This reduction in oxygen availability, particularly in the lake’s hypolimnion (deep water layers), limits the survival of oxygen-dependent species, such as fish, and affects other aquatic organisms that contribute to the lake’s biodiversity. As a result, changes in oxygen dynamics could reduce the lake’s carrying capacity for diverse species, ultimately affecting the broader ecological community.
Moreover, Ugii Lake’s declining water levels and temperature changes directly impact the livelihoods of communities that rely on its resources. Many local residents depend on the lake for fishing, livestock watering, and irrigation. Climate-driven water loss and reduced water quality challenge these traditional practices, posing risks to food security and economic stability [10]. Additionally, changes in fish populations due to altered habitat conditions and temperature stressors could affect local fisheries, reducing a critical source of protein and income for surrounding communities. Local economies also rely on Ugii Lake for eco-tourism, particularly for bird watching and nature tourism. However, decreased water levels and compromised water quality could deter visitors, threatening this revenue source and prompting communities to adapt to these new conditions. Climate change introduces challenges for water management and ecological conservation, necessitating integrated approaches that account for ecological, economic, and social needs [13] and the development of local adaptation strategies [14].
While climate change poses significant threats, it may also provide favorable conditions for some invasive species that are more resilient to fluctuating water levels and temperatures. These species can disrupt native ecosystems by outcompeting local flora and fauna, further destabilizing the lake’s ecological balance. Invasive species introductions often lead to a decline in native biodiversity and can permanently alter the lake’s habitat structure. This shift underscores the importance of monitoring and managing non-native species in climate-vulnerable ecosystems like Ugii Lake [11]. Given the complex and interconnected impacts of climate change on Ugii Lake, this study aims to assess the lake’s hydrological and ecological responses to these changes. Specifically, we investigate seasonal variations in water quality, analyze vegetation dynamics, and examine socio-economic factors that influence local perceptions and uses of the lake’s resources. By focusing on these elements, our research seeks to highlight critical vulnerabilities in Ugii Lake’s ecosystem and provide insights for sustainable management practices that can support both environmental and socio-economic resilience.
The need for this research is underscored by the global trend of diminishing freshwater resources, especially in arid and semi-arid regions, where climate change intensifies water scarcity [15]. By documenting Ugii Lake’s responses to hydrological and thermal changes, this study contributes to a growing body of literature on lake ecosystems’ sensitivity to climate change, offering a case study that may inform conservation strategies for similar freshwater systems in Mongolia and beyond. This knowledge can guide policy development and community engagement efforts that prioritize adaptive management, ensuring the long-term sustainability of Ugii Lake and its ecosystem services.

2. Materials and Methods

2.1. Study Area

Ugii Lake, located in Central Mongolia, was selected as the study site due to its ecological and socio-economic importance. Positioned within a semi-arid climate zone, the lake is characterized by highly seasonal weather patterns, with cold, dry winters and warm, moderately wet summers. The lake is surrounded by steppe vegetation, including species adapted to arid and semi-arid conditions, as well as marshland vegetation near water sources. Ugii Lake plays a critical role in providing resources for local communities, supporting biodiversity, and hosting eco-tourism activities. The lake’s ecosystem is highly susceptible to hydrological changes, making it an ideal subject for studying the effects of climate change on lake dynamics.
Ugii Lake has a surface area of approximately 25 km2 and a maximum depth of around 15 m during high water seasons. It is primarily fed by the Khushuu and Orkhon Rivers, with minor seasonal streams contributing additional inflows. The lake plays a vital role in the local economy, supporting fisheries; livestock watering; and eco-tourism activities such as birdwatching, cultural tours, and lakeside recreation. It is recognized as an important natural resource for Arkhangai Province and is visited annually by both domestic and international tourists. Additionally, the lake’s surrounding wetlands provide critical habitat for migratory bird species, enhancing its ecological and conservation significance.
The geographic location of Ugii Lake was mapped using GPS coordinates, with sampling points distributed across various sections of the lake to ensure a representative collection of data on water quality, vegetation, and socio-economic impacts. The selection of sampling points considered the diversity of lake habitats, including areas with varying levels of human disturbance, from more remote shores to heavily visited recreational sites (Figure 1).

2.2. Sampling Design and Data Collection

This study employed a mixed-methods approach, encompassing quantitative and qualitative data collection. Water quality, vegetation, and socio-economic data were collected during two field campaigns conducted in July–October 2023 and July 2024 to capture seasonal variation.

2.2.1. Water Quality Assessment

The physicochemical parameters were measured in situ, such as electrical conductivity (EC), total dissolved solids (TDS), temperature (T°C), and pH, using a HI98195 multi-parameter. Turbidity was measured using HANNA (HI93703) turbidity meter. Total alkalinity was determined by the hydrochloric acid titrimetric method (methyl orange), total chloride was determined by the silver nitrate titrimetric method (potassium chromate), and total hardness was measured using EDTA titration. Nitrate (NO3), nitrite (NO2), ammonium (NH4+), and sulphate (SO42−) were determined by HI 83399 photometer and UV spectrophotometrer (Hanna Instruments, Leigthon Buzzard, UK).
General chemical analyses and pollution parameters were determined by the following methods and analyzed in the water analysis laboratory of the Institute of Geography and Geoecology (Table 1).

2.2.2. Vegetation Survey

A comprehensive vegetation survey was conducted around Ugii Lake to assess plant biodiversity, species distribution patterns, and the impacts of anthropogenic activities on plant communities. The study focused on three primary habitat types: dry steppe, marshlands, and areas subject to human disturbance. Sampling sites were selected according to habitat classification, proximity to the lakeshore, and the level of human impact. Standardized 1 m × 1 m quadrats were established in each habitat to ensure consistent data collection. Within each quadrat, plant species were identified to the lowest feasible taxonomic level, supported by field guide references and expert validation. Species cover percentages were visually estimated to quantify species abundance. For dominant species, average height and density were recorded to evaluate structural variations between disturbed and undisturbed sites. The surveys were conducted from July to August 2023 and 2024, the peak growing seasons, to capture optimal species diversity and abundance. Annual repetitions of the surveys enabled the documentation of temporal changes throughout the study period.

2.2.3. Socio-Economic Surveys and Interviews

Socio-economic data were collected through structured surveys and semi-structured interviews to examine local perceptions of environmental changes and the extent of community reliance on Ugii Lake’s resources. The structured questionnaire was designed to collect quantitative data on residents’ use of lake resources, perceived environmental changes, and socio-economic dependence on the lake. Topics covered included resource use frequency (e.g., water for irrigation or livestock), perceived changes in water levels and water quality, health impacts linked to environmental changes (e.g., allergies and waterborne diseases), and community attitudes toward conservation and preferred management approaches. A total of 100 respondents were selected through purposive sampling to ensure representation across a range of demographics and occupations, thereby capturing diverse community perspectives. Semi-structured interviews were conducted to facilitate in-depth exploration of topics raised in the survey. These interviews were conducted in person, lasted approximately 20 to 30 min, and were audio-recorded with participants’ consent. Open-ended questions were used to elicit qualitative insights into environmental perceptions and socio-economic challenges faced by the community. Survey responses were manually recorded and subsequently digitized for analysis. Interview transcripts were translated from Mongolian to English and coded for thematic analysis, enabling the identification of recurring themes and community sentiments related to environmental change.

2.3. Data Analysis

Data analysis was conducted using a combination of statistical and qualitative methods, depending on the data type and research objectives.

2.3.1. Water Quality Analysis

Descriptive statistics, including mean, median, and range, were calculated for each water quality parameter to characterize seasonal and spatial variations. Temporal trends in water temperature, pH, turbidity, and electrical conductivity (EC) were analyzed using repeated measures analysis of variance (ANOVA) to detect statistically significant seasonal differences. Correlations between water quality parameters (e.g., temperature and turbidity) were also calculated to identify potential relationships indicative of underlying environmental processes, such as the influence of temperature on sediment suspension and nutrient concentrations.

2.3.2. Vegetation Data Analysis

Species richness (defined as the total number of species) and diversity indices (e.g., Shannon–Wiener index) were calculated for each habitat type. These indices provided quantitative measures of biodiversity, facilitating comparisons between disturbed and undisturbed areas. Differences in species abundance, cover, and height between disturbed and undisturbed sites were analyzed using t-tests and analysis of variance (ANOVA) to evaluate the impacts of human activities on vegetation structure.

2.3.3. Socio-Economic Data Analysis

Survey data were analyzed using descriptive statistics, such as frequency distributions and percentages, to summarize community perceptions of environmental changes, patterns of resource use, and associated health impacts. Qualitative data from interviews underwent thematic coding, which identified key themes, including perceived environmental degradation, economic dependence on lake resources, and community attitudes toward conservation. The coding process was conducted using qualitative analysis software to ensure the systematic identification of recurring themes. Socio-economic findings were subsequently cross-referenced with water quality and vegetation data to investigate potential relationships between community perceptions and observed ecological changes. This integrated analysis offered insights into the bidirectional influence between socio-economic factors and environmental conditions in the Ugii Lake area.

3. Results

3.1. Water Quality

The pH values across different sites generally fall within a slightly alkaline range (above 7.0). As shown in Figure 2, some sites show wider variability, indicating seasonal or environmental influences. Sites S-1, S-2, and S-3 have slightly higher pH levels (~8.85–8.87), indicating more alkaline conditions. S-10 has the lowest pH (~7.54), meaning it is closer to neutral compared to other sites. S-11 falls in between, with moderate pH variations. Outliers (if present) suggest potential localized factors affecting acidity/alkalinity, such as inflow from different sources or biological activity.
EC measures the water’s ability to conduct electricity, which correlates with dissolved ions. Different sites have varying EC levels, likely due to differences in mineral content and salinity. Site S-1 has the highest EC (645 µS/cm) and TDS (377 ppm), indicating higher dissolved ion content. S-10 has the lowest EC (316 µS/cm) and TDS (190 ppm), suggesting lower mineralization. S-2 and S-3 are similar in conductivity (~615–625 µS/cm) and TDS (~360 ppm), implying comparable water chemistry (Figure 3). Sites with higher median EC could be influenced by higher ion concentrations, possibly from groundwater seepage or evaporation effects.
TDS is highly correlated with EC and follows a similar pattern. Sites with higher TDS levels indicate more dissolved materials, which could be due to increased evaporation, higher inflow of mineralized water, or anthropogenic impacts. As presented in Figure 4, the spread of values across sites suggests that some locations may be more prone to seasonal changes in water chemistry.
Water temperature varies significantly across different sites, likely reflecting seasonal fluctuations. Some sites may exhibit wider temperature variation, possibly due to differences in depth, shading, or inflow from tributaries. As shown in Figure 5, S-2 shows the highest temperature (16.94 °C avg), possibly due to exposure or shallow depth. Site S-11 recorded the lowest average temperature (~7.23 °C), which may be attributed to its location in a shaded, deeper zone with limited solar exposure and possible groundwater influence. These micro-environmental conditions can suppress surface warming compared to shallow or exposed sites like S-2. S-1 and S-3, which have moderate temperatures (~15 °C). The temperature of a site can influence biological activity, pH levels, and chemical reactions.
Turbidity measures water clarity and is influenced by suspended particles. Some sites show higher median turbidity, indicating more sediment, algal blooms, or organic matter. Sites with lower turbidity suggest clearer water, possibly due to fewer disturbances or filtration through sediment. Figure 6 indicates that S-2 has the highest turbidity (~5.76 NTU), meaning it has the most suspended particles or sediment. S-10 and S-11 have the clearest water (~0.36 NTU), indicating low sediment content. S-3 also has moderate turbidity (~2.66 NTU), suggesting periodic disturbances. Outliers in turbidity may indicate episodic events such as storms, runoff, or increased biological activity.
Different sites exhibit distinct water chemistry profiles, influenced by factors like geology, hydrology, land use, and climate. High variability in some parameters (e.g., turbidity and EC) suggests the need for continuous monitoring to identify long-term trends. The presence of outliers might indicate specific events or pollution sources requiring further investigation.
Water-type classification helps us understand the hydrochemical composition of different sites and their geochemical influences. The dominant ions in water determine the chemical signature and potential sources of mineralization. Based on the major cations (Na⁺, K⁺, Ca2⁺, and Mg2⁺) and anions (Cl, SO42−, HCO3), water types can be classified into different categories.
Most sites, including S-1, S-2, S-3, and S-11, are of the sodium–chloride type, which is characterized by high concentrations of sodium (Na⁺) and chloride (Cl), typically found in saline environments, groundwater seepage zones, or evaporative lakes. This type indicates mineralization due to geological processes (e.g., salt deposits or underground water flow) and an increased concentration of Na⁺ and Cl in water due to high evaporation rates.
High calcium (Ca2⁺) and bicarbonate (HCO3) content was observed in site S-10. This type of water is typically associated with freshwater sources and carbonate rock formations, and it is often found in streams, rivers, or recharge areas with significant groundwater input. The influence of limestone or carbonate rocks is present where water interacts with CaCO3 minerals (Figure 7).
Sulfate (SO42−) is the dominant anion in site S-1. This type of water is typically found in areas influenced by volcanic activity, mining, or industrial pollution. It can be linked to geothermal waters or sulfate-rich sedimentary deposits.
Sodium–chloride dominance suggests that salinity management may be important, particularly for water use in agriculture or drinking supply. Calcium–bicarbonate areas (S-10) may be more suitable for freshwater sources but need protection from contamination. Tracking seasonal changes in water type can help identify hydrological trends and external influences (e.g., climate change and land-use changes) (Figure 8).
Figure 9 shows how the number of sites classified under each water type (sodium–chloride, calcium–bicarbonate, and sulfate) varies over time. The sodium–chloride type (Na-Cl) remains dominant across different months, suggesting consistent mineralized water conditions. The prevalence of sodium–chloride water types also indicates rising salinity, which may limit the lake’s suitability for freshwater species and human use. The calcium–bicarbonate type (Ca-HCO3) appears only during specific periods, indicating possible seasonal groundwater recharge or dilution. The sulfate type (SO4) shows minimal presence, meaning that volcanic or sulfate contamination is either sporadic or absent.
Potential explanations for seasonal changes are related to increased evaporation concentrates’ dissolved ions, leading to a higher presence of the Na-Cl type. Higher precipitation or snowmelt may dilute salts, increasing the proportion of Ca-HCO3-type water. Seasonal runoff from surrounding land could alter water chemistry, shifting between different types.
The sodium-chloride (Na-Cl) type remains the most dominant in all seasons. The calcium–bicarbonate (Ca-HCO3) type is more prominent in some seasons, likely due to groundwater recharge. The presence of the sulfate (SO4) type is minimal across all seasons (Figure 10).

3.2. Vegetation Analysis

Vegetation patterns varied across different habitat types, reflecting environmental conditions and levels of disturbance. In steppe habitats, drought-tolerant grasses such as Stipa krylovii, Leymus chinensis, and Achnatherum splendens dominated, maintaining moderate-to-high vegetation cover (30–70%) under semi-arid conditions. Marshland habitats were characterized by water-retentive species, including Carex duriuscula and Potentilla bifurca, which formed dense plant cover (50–62%). These areas were particularly sensitive to hydrological changes. In shrubland habitats, Caragana micropylla and Artemisia adamsii were the dominant species, contributing to soil stabilization in degraded areas. Shrubland vegetation maintained moderate cover (45–55%) but was vulnerable to grazing and soil erosion (Figure 11).
The analysis of the plant-height changes based on the level of human disturbance (e.g., grazing, tourism, and road construction) is shown in Figure 12 and indicates that the low-disturbance areas have the tallest vegetation (around 25–30 cm on average). This suggests that less human impact allows plants to grow taller. Moderate-disturbance areas have shorter plants (around 10–20 cm on average), showing that some grazing or trampling is affecting plant growth. High-disturbance areas have the shortest vegetation, meaning that constant human pressure (like overgrazing) keeps plants from growing properly. Some outliers (dots outside the boxes) show exceptionally tall or short plants, but they are rare.
The analysis revealed a clear positive relationship between vegetation cover and plant height, with low-disturbance sites averaged 27 cm in height and 65% cover, compared to 12 cm and 45% cover in high-disturbance areas (Figure 13). Moderate-disturbance sites occupied an intermediate position, with variable plant heights and cover. Steppe grasslands were characterized by low-growing vegetation (7–12 cm), except in protected areas, where species such as Achnatherum splendens reached 25–35 cm. Shrubland habitats, dominated by species such as Caragana micropylla, exhibited greater plant heights (20–30 cm), though grazing pressure reduced shrub density. In marshlands, species such as Carex spp. and Blysmus rufus formed relatively short vegetation (10–22 cm), influenced by soil moisture limitations. Overall, the findings highlight that steppe and shrubland ecosystems demonstrate greater resistance to disturbance compared to marshlands, though overgrazing reduces both species diversity and plant height across all habitats. Marshlands are particularly vulnerable to hydrological changes, emphasizing the importance of targeted wetland conservation. Human disturbance significantly alters vegetation composition, promoting opportunistic and invasive species in degraded areas, while low-disturbance sites consistently maintain the highest plant cover and species diversity, underscoring the ecological value of protected areas.

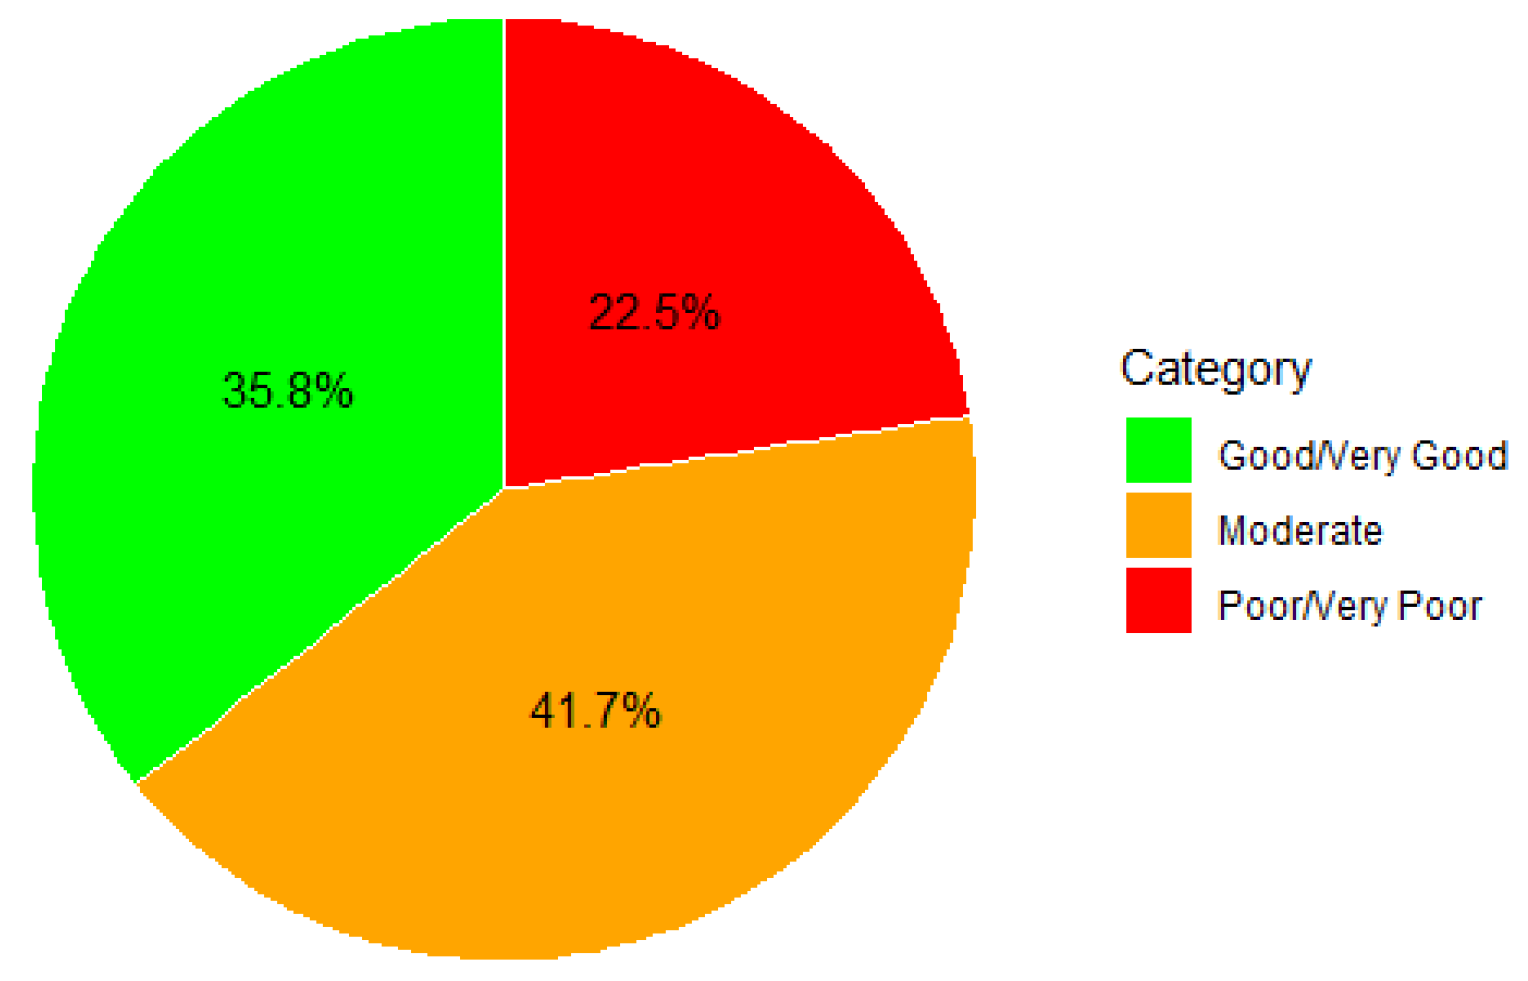
3.3. Socio-Economic Perspectives

A comprehensive understanding of the socio-economic dynamics surrounding Ugii Lake is essential for policymakers, local authorities, and conservation organizations. This study provides empirical evidence on livelihoods, tourism, and environmental perceptions to inform sustainable land-use strategies, while also analyzing the economic resilience demonstrated by herders and businesses in response to climate variability and resource limitations. Strategic recommendations are offered for integrated conservation efforts aimed at ensuring the long-term sustainability of both the lake’s ecosystem and the local economy. To support this analysis, surveys were conducted with 46 herder households, 15 tourists, and 5 businesses. Figure 14 shows that 54.5% of herder households rely entirely on livestock grazing for their livelihoods, while 34.1% engage in both livestock management and eco-tourism activities, such as operating yurts or tourist camps. None of the surveyed households reported engagement in agricultural activities. By integrating these socio-economic insights with environmental data, the study enhances evidence-based decision-making and promotes a sustainable balance between economic development and environmental stewardship at Ugii Lake.
Regarding livestock ownership, 36% of herders have herds of up to 300 animals, while 16.7% manage herds exceeding 1000. Over the past five years, 23.1% of respondents reported an increase in herd size, another 23.1% noted a decrease, and 53.8% experienced no significant changes. Over the last decade, 61.5% of herders maintained stable herd sizes, whereas 30.8% reported a decline in their livestock numbers.
The study evaluated perceptions of environmental conditions over the past ten years. While the water level of Ugii Lake has risen, the quality of pastures has declined. There has been a significant increase in rodent populations, especially voles, which has exacerbated the degradation of pasture areas. Furthermore, a decrease in biodiversity has been noted, particularly with a reduction in the variety of fish species.
According to respondents’ recollections, environmental conditions a decade ago were significantly better, with 36.4% recalling that conditions were “good” or “very good” at that time. In contrast, only 21.2% now rate the current conditions as such, indicating a perceived decline over time. These retrospective assessments, gathered through surveys conducted in 2023, reflect local perceptions of environmental degradation over the past 10 years (Figure 15). Currently, 22.5% of individuals describe the conditions as “very poor”, and 41.7% consider them to be “moderate”.
The rise in road traffic (31.7%) has led to the creation of unregulated trails that harm vegetation. The expansion of tourism (30.9%) has resulted in increased waste pollution. Climate change (17.1%) has contributed to drought conditions and altered the state of the lake. Additionally, overgrazing (11.4%) has further stressed pasturelands.
Soil erosion has increased (41.4%), along with the prevalence of invasive weeds. Observations have indicated a decline in water quality (17.1%) and a loss of fish species (12.2%). Moreover, air quality has worsened due to drier conditions, with 12.2% of respondents acknowledging this concern (Figure 16).
A significant 67.3% of herders indicated a deterioration in livestock quality, characterized by diminished meat yield and reduced body weight. Additionally, 25.5% reported a decrease in household income attributed to lower livestock productivity. Businesses reliant on tourism experienced a downturn in visitor numbers, leading to a decline in revenue. Changes in household migration patterns were also evident, with 22.9% of households modifying their migration frequency and distance, while 25.7% faced issues related to water scarcity.
A comprehensive assessment of public perceptions and environmental conditions at Ugii Lake reveals significant environmental, socio-economic, and health-related challenges driven by expanding tourism, overgrazing, and climate fluctuations. Although a portion of respondents (11.4%) reported respiratory illnesses, and 37.1% cited allergies potentially linked to environmental change, no formal air quality monitoring (e.g., NOx, SO2, and PM10/2.5) was conducted as part of this study. Moreover, the Ugii Lake region lacks significant industrial activity. Therefore, these health symptoms may be more closely associated with dust from road traffic, dry climate conditions, or increased biomass burning, rather than direct industrial air pollution. These findings highlight the need for future studies that integrate environmental health assessments, including atmospheric monitoring, to better understand exposure pathways. In terms of conservation efforts, respondents identified existing programs such as waste management, the construction of fencing to limit vehicle access around the lake, and initiatives by tourism operators to promote waste segregation and tree planting; however, these efforts were widely regarded as insufficient or poorly enforced. Among businesses, 40% considered local conservation initiatives ineffective, while 60% felt that existing programs have failed to adequately address key environmental issues. Environmental deterioration was particularly evident in rising water levels, declining pasture quality, soil erosion, the spread of invasive plant species, and overall biodiversity loss, compounded by increased pollution from tourism and unregulated vehicle access. These environmental pressures have also resulted in economic difficulties, with reduced livestock productivity lowering household incomes, and tourism businesses suffering financial setbacks due to environmental degradation. Health and social impacts include growing incidences of allergies and respiratory illnesses, alongside changes in household migration patterns as families respond to shrinking pasture areas. Addressing these interconnected issues requires not only strengthening conservation programs—such as improving waste management and completing protective fencing—but also enhancing enforcement, fostering greater community participation, and establishing clear policies and investments in essential infrastructure to promote sustainable development and environmental protection at Ugii Lake.

4. Discussion

4.1. Environmental Changes of Ugii Lake

The hydrology and water quality of Ugii Lake appear to be strongly influenced by climate variability, particularly reduced precipitation and increased evaporation. Previous studies estimated a 13.5% reduction in the lake’s surface area between 1986 and 2018 [1], reflecting broader trends of shrinking steppe-region lakes across Central Mongolia due to intensified evaporation linked to rising temperatures [35]. While this study did not reassess lake surface extent using remote sensing, future research should apply recent satellite imagery (e.g., Landsat-8, Sentinel-2, or PlanetScope) to reassess lake surface changes through 2024. Combining time-series satellite analyses with in situ observations would enhance our understanding of hydrological response to climate change. These findings are consistent with Schwanghart et al. (2009) [2], who demonstrated the sensitivity of Ugii Lake to shifting precipitation patterns and called for adaptive water management policies in the region.
The thermal profile of Ugii Lake indicates a trend of increasing summer water temperatures poses significant risks to aquatic ecosystems. Elevated temperatures enhance thermal stratification, limiting oxygen availability in deeper layers and disrupting nutrient cycling, a phenomenon widely observed in lakes experiencing warming trends worldwide [36]. Such disruptions, as documented by Saros et al. (2012) [37], can trigger algal blooms, further degrading water quality and threatening aquatic biodiversity. In Ugii Lake, elevated turbidity levels near frequently visited shorelines suggest that human activity, particularly tourism-related shoreline disturbances, exacerbates sediment suspension and further reduces water clarity. Increased turbidity diminishes light penetration, impairing photosynthesis in submerged aquatic vegetation, which is critical for supporting aquatic biodiversity and stabilizing sediments. These cumulative pressures increase the likelihood of ecological shifts favoring invasive species that thrive in disturbed conditions, a pattern observed in numerous wetland and lake ecosystems affected by both climate change and human activities.
Vegetation surveys conducted around Ugii Lake further revealed that plant communities, including native species adapted to steppe and marshland environments, are increasingly impacted by anthropogenic activities such as livestock grazing and tourism. In disturbed areas, native plant diversity declines, while disturbance-tolerant and invasive species become more dominant. This pattern mirrors findings from studies such as those conducted in the Deepor Beel wetland in Assam [38] and in the Abay Choman and Jimma Geneti watersheds in Ethiopia [39]. As in other semi-arid regions, the vegetation surrounding Ugii Lake plays a vital role in regulating soil erosion, enhancing water retention, and maintaining habitat quality [40]. However, ongoing vegetation degradation accelerates soil destabilization, further contributing to sediment inflow into the lake and reducing habitat quality for both plant and animal species. Schwanghart et al. (2009) [2] similarly emphasized that maintaining healthy vegetation cover in lake catchments is essential for stabilizing soils and preserving water quality. Without targeted conservation measures, such as rotational grazing and controlled tourist access in ecologically sensitive areas, vegetation loss will continue to undermine the lake’s ecological resilience [41]. The changes in fish populations due to altered habitat conditions and temperature stressors could affect local fisheries, as seen in Lake Tanganyika, where climate warming has reduced fish production [42]. Long-term aquatic research is essential to understand and mitigate the impacts of climate change on lake ecosystems [43].

4.2. Impact of Climate Change on Ugii Lake

In parallel with climate pressures, human activities have significantly intensified stress on Ugii Lake’s ecosystem. The socio-economic assessment highlights that local communities perceive significant environmental changes at Ugii Lake, with direct impacts on their livelihoods, health, and economic opportunities. In particular, 37.1% of respondents reported increased allergies linked to environmental changes, and 11.4% noted a rise in respiratory illnesses, while skin conditions associated with lake-water use were also frequently mentioned.
These health issues underscore the direct connections between environmental degradation and public health, especially in climate-sensitive regions [14]. The importance of robust water quality monitoring and community education programs is further reinforced by these findings. Additionally, local perceptions of conservation initiatives reveal a clear gap between existing programs and community expectations. Although some waste management programs, fencing projects to restrict vehicle access, and eco-tourism initiatives such as waste segregation and tree planting have been introduced, these efforts are widely viewed as inadequate or poorly enforced.
Notably, 40% of surveyed businesses rated local conservation initiatives as ineffective, while 60% indicated that current programs fail to address the most pressing environmental issues. These findings align with global best practices, which emphasize that successful wetland and lake conservation efforts require active community involvement, clear regulatory frameworks, and adequate investment in infrastructure. Recommendations from local residents—including improved waste management, better regulation of recreational areas, and construction of proper sanitation facilities—demonstrate that community-driven conservation strategies can enhance both ecological protection and economic sustainability. This integrative approach, combining local knowledge with evidence-based management, represents a critical pathway toward ensuring the long-term health and resilience of Ugii Lake’s ecosystem.
The findings from Ugii Lake reflect the complex interplay between climate change, water quality, vegetation dynamics, and socio-economic factors, highlighting the lake’s vulnerability to both climatic variability and human activities. These results align with global research on semi-arid lake systems [15], emphasizing the need for integrated management strategies that address ecological and socio-economic challenges simultaneously.

5. Conclusions

Our study of Ugii Lake demonstrates that climate change and anthropogenic pressures are fundamentally transforming the lake’s hydrology, thermal dynamics, vegetation, and socio-economic context. The observed declines in water level, increased turbidity, and shifts in thermal regimes are indicative of broader climate-induced stressors affecting both biodiversity and water quality. Key conclusions from this research include the following:
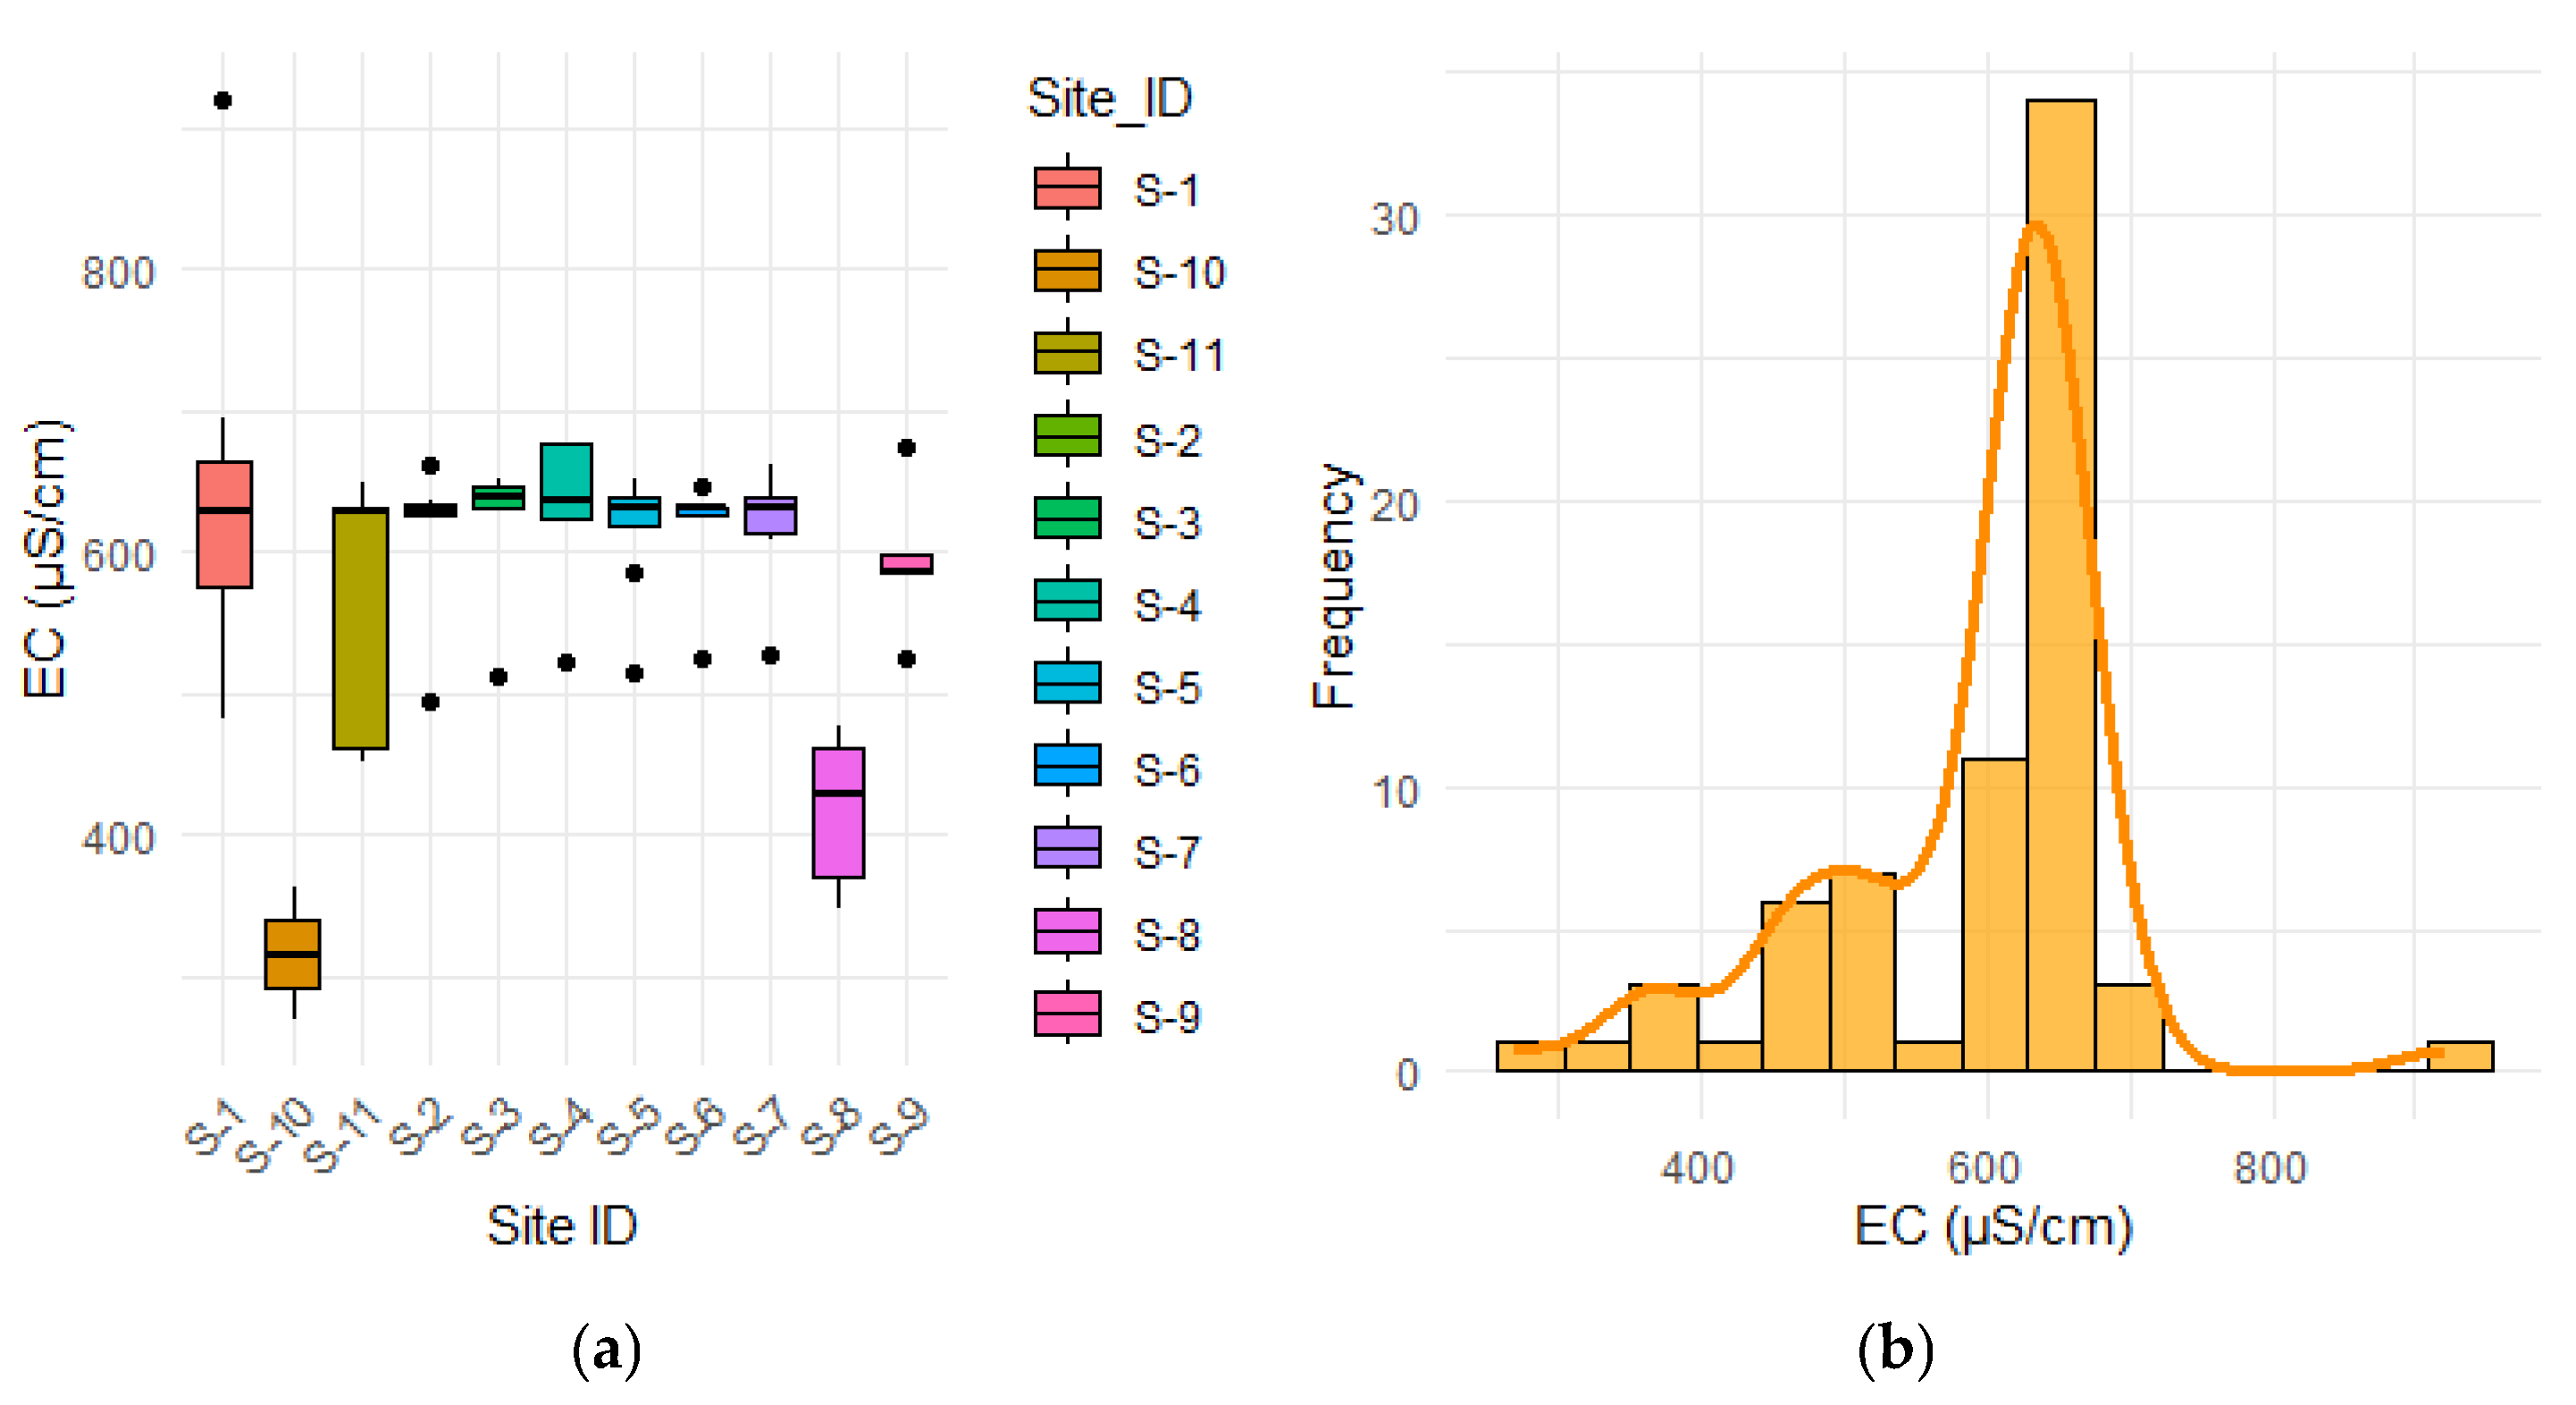
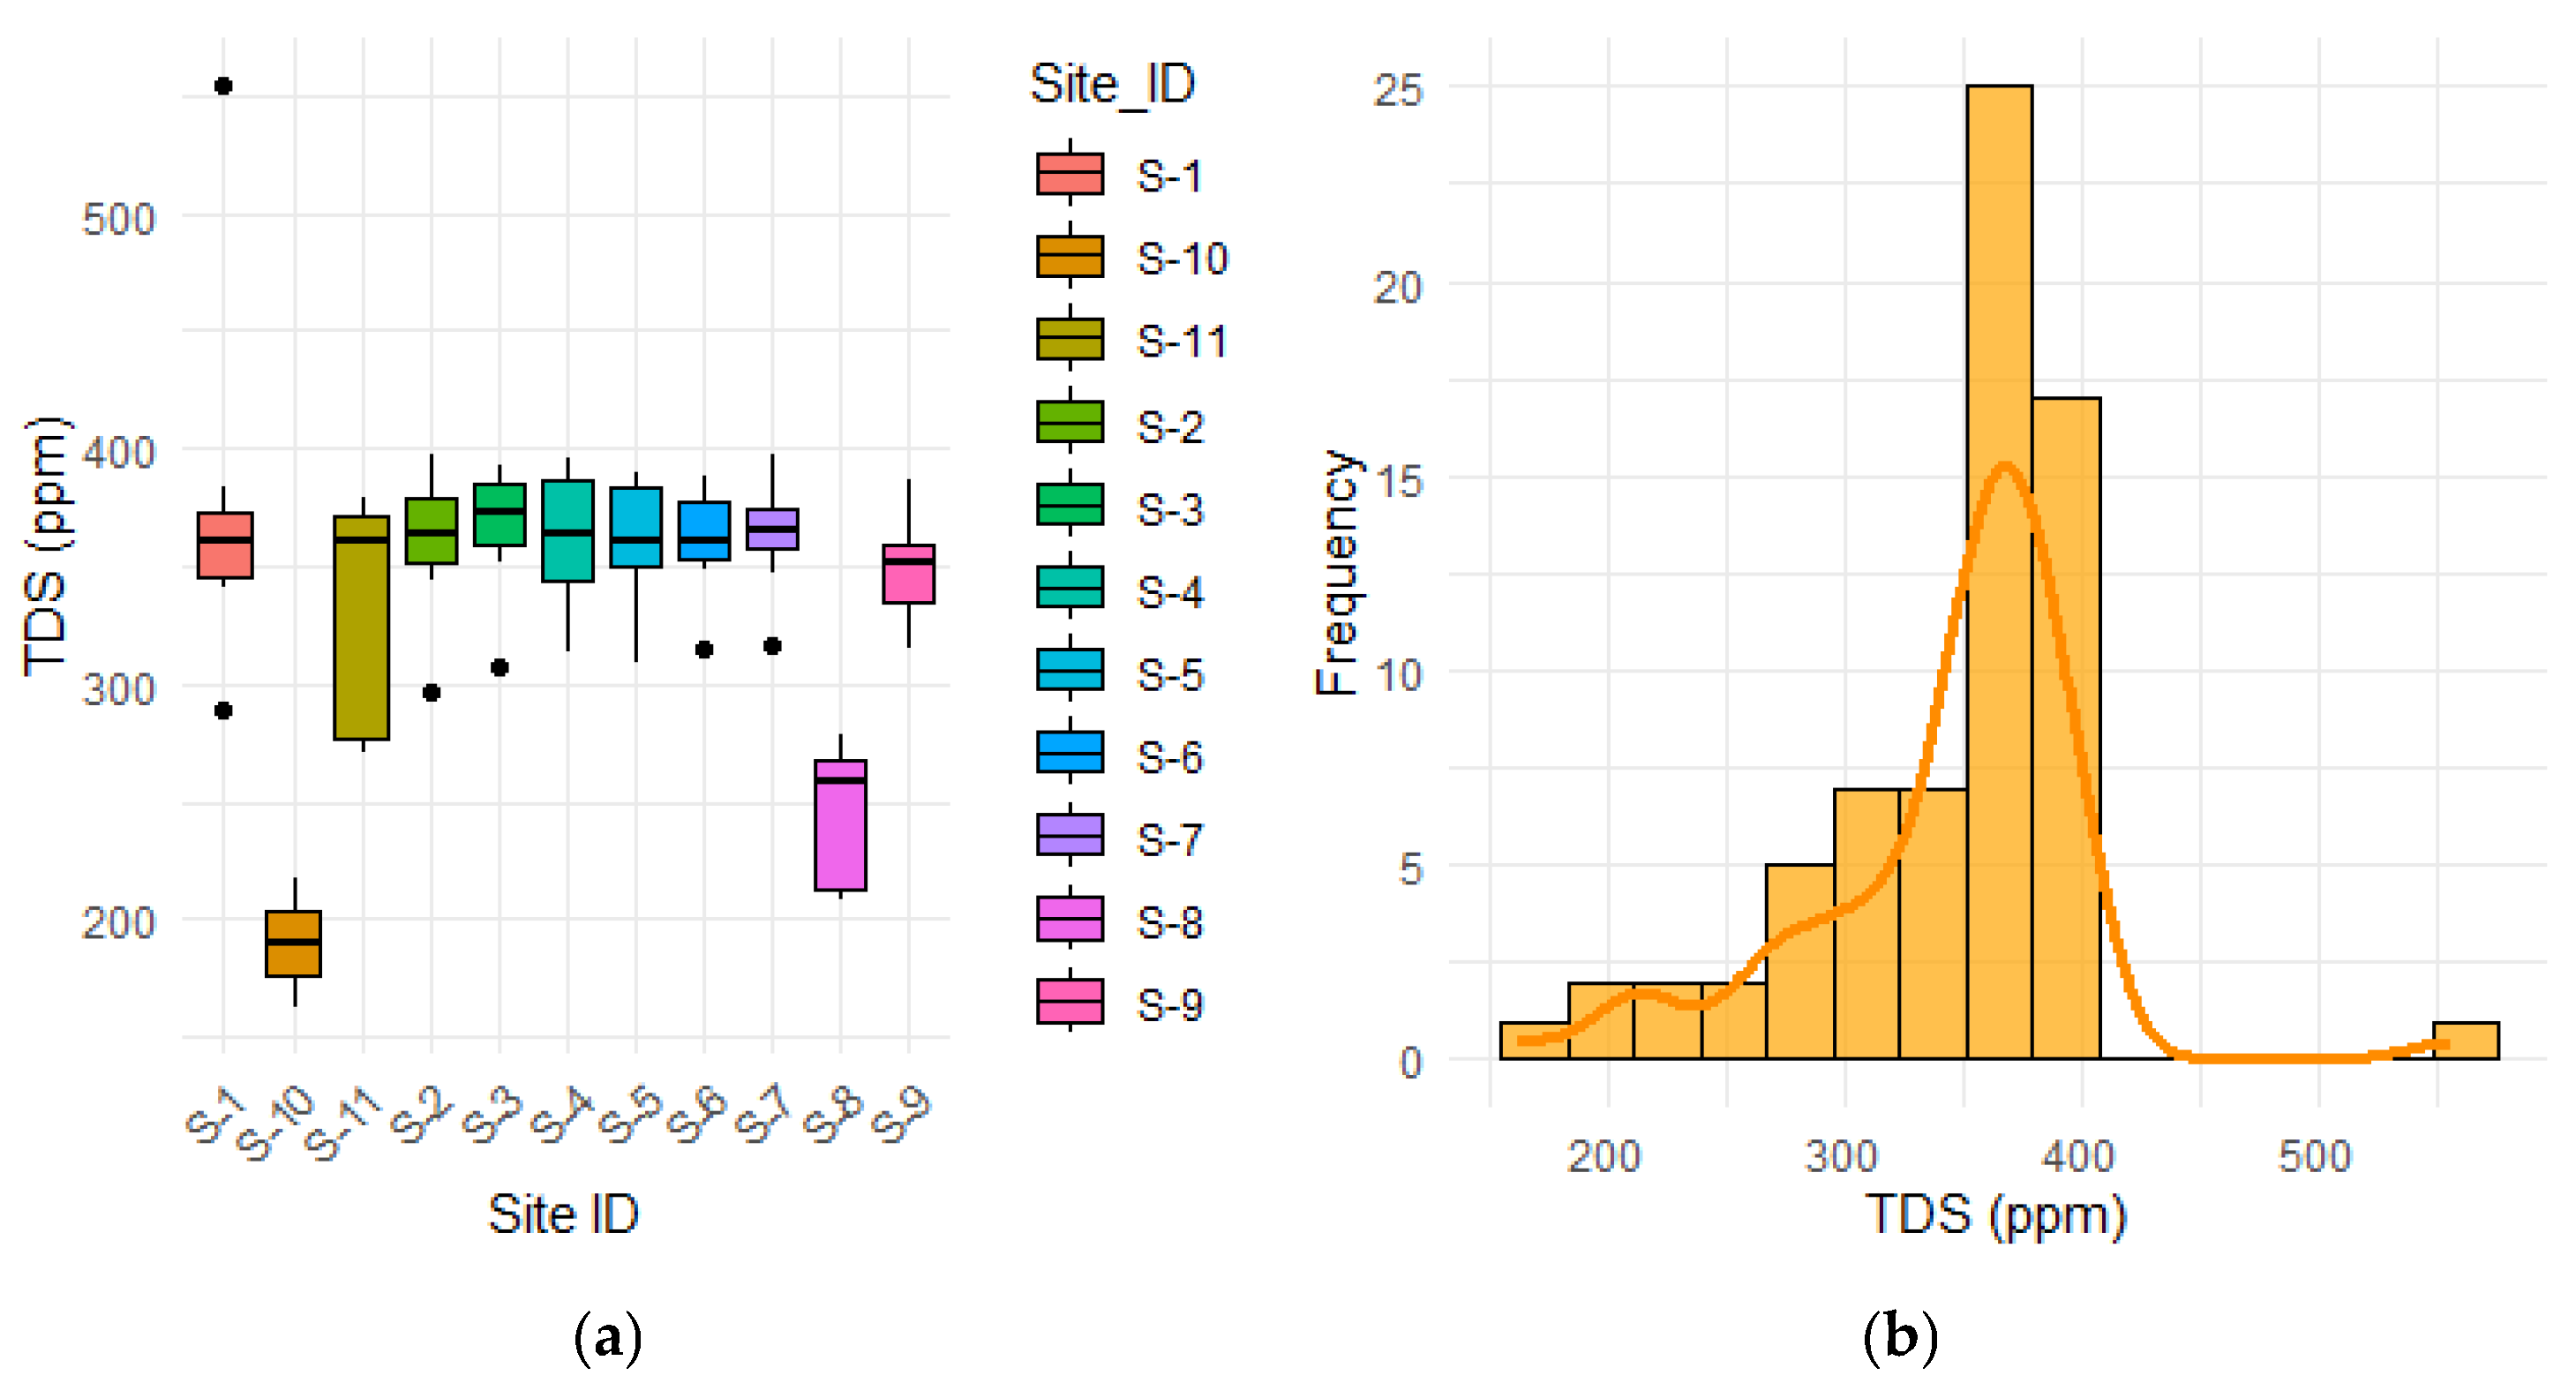
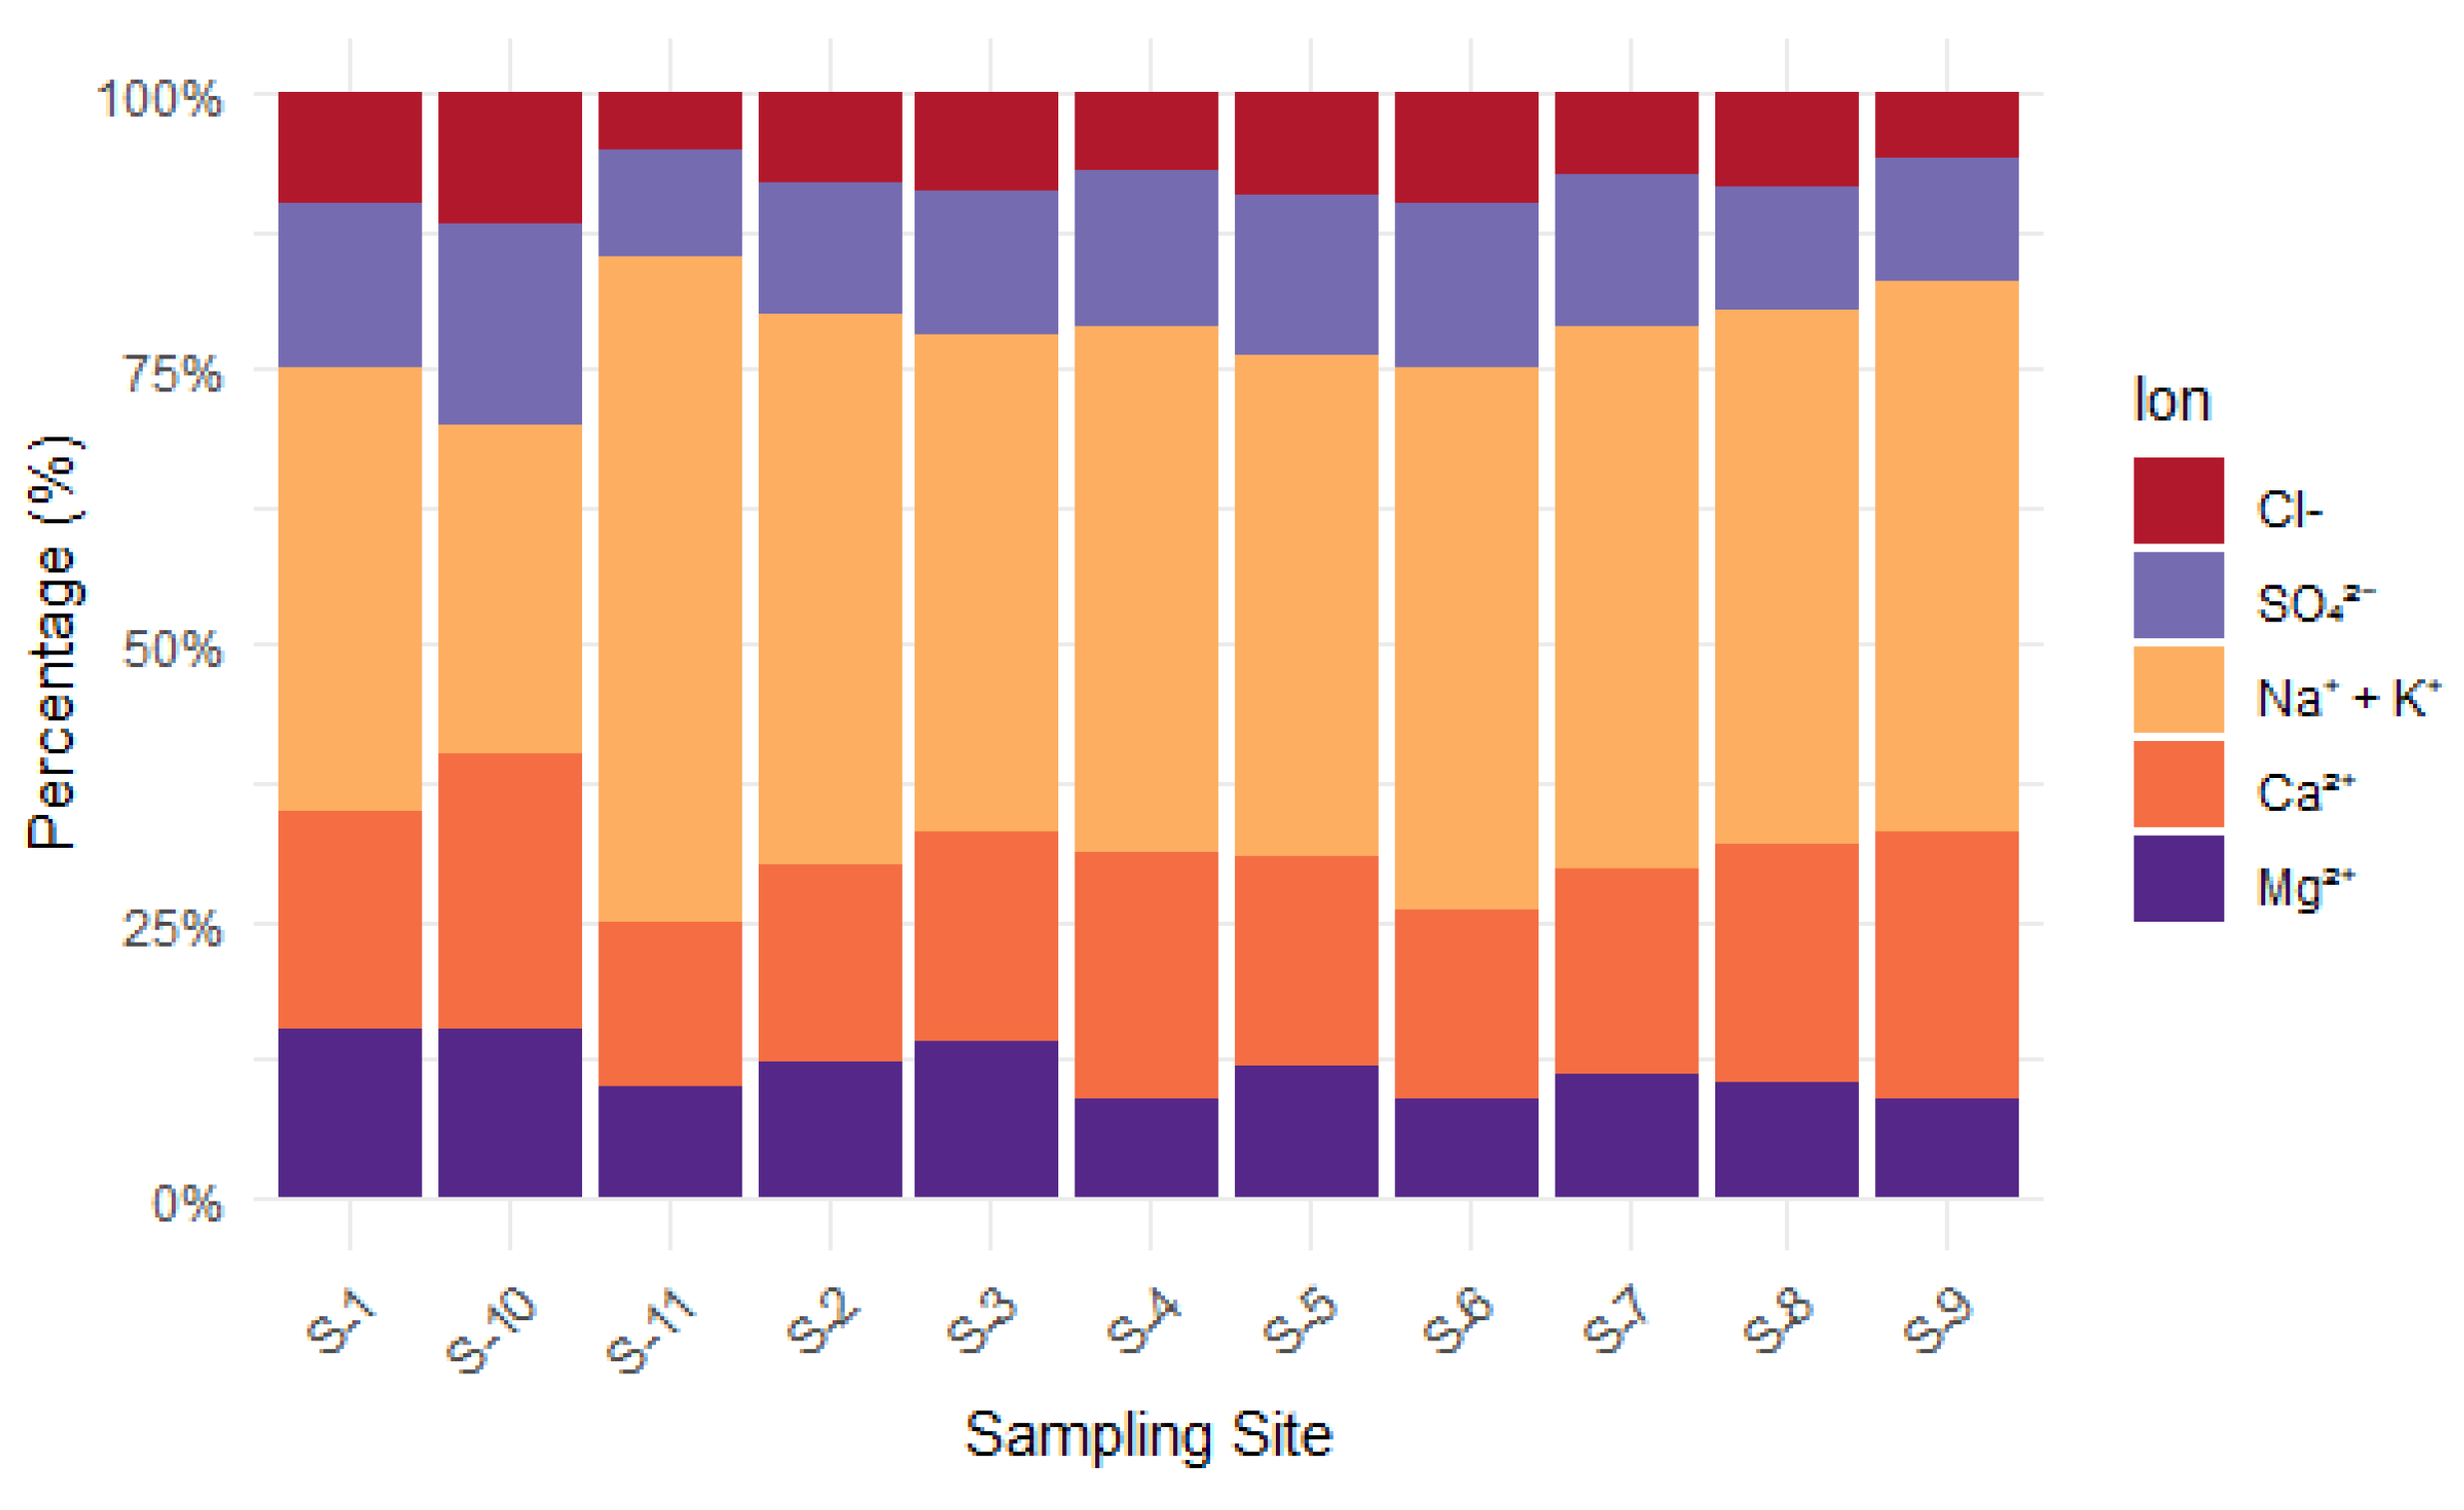
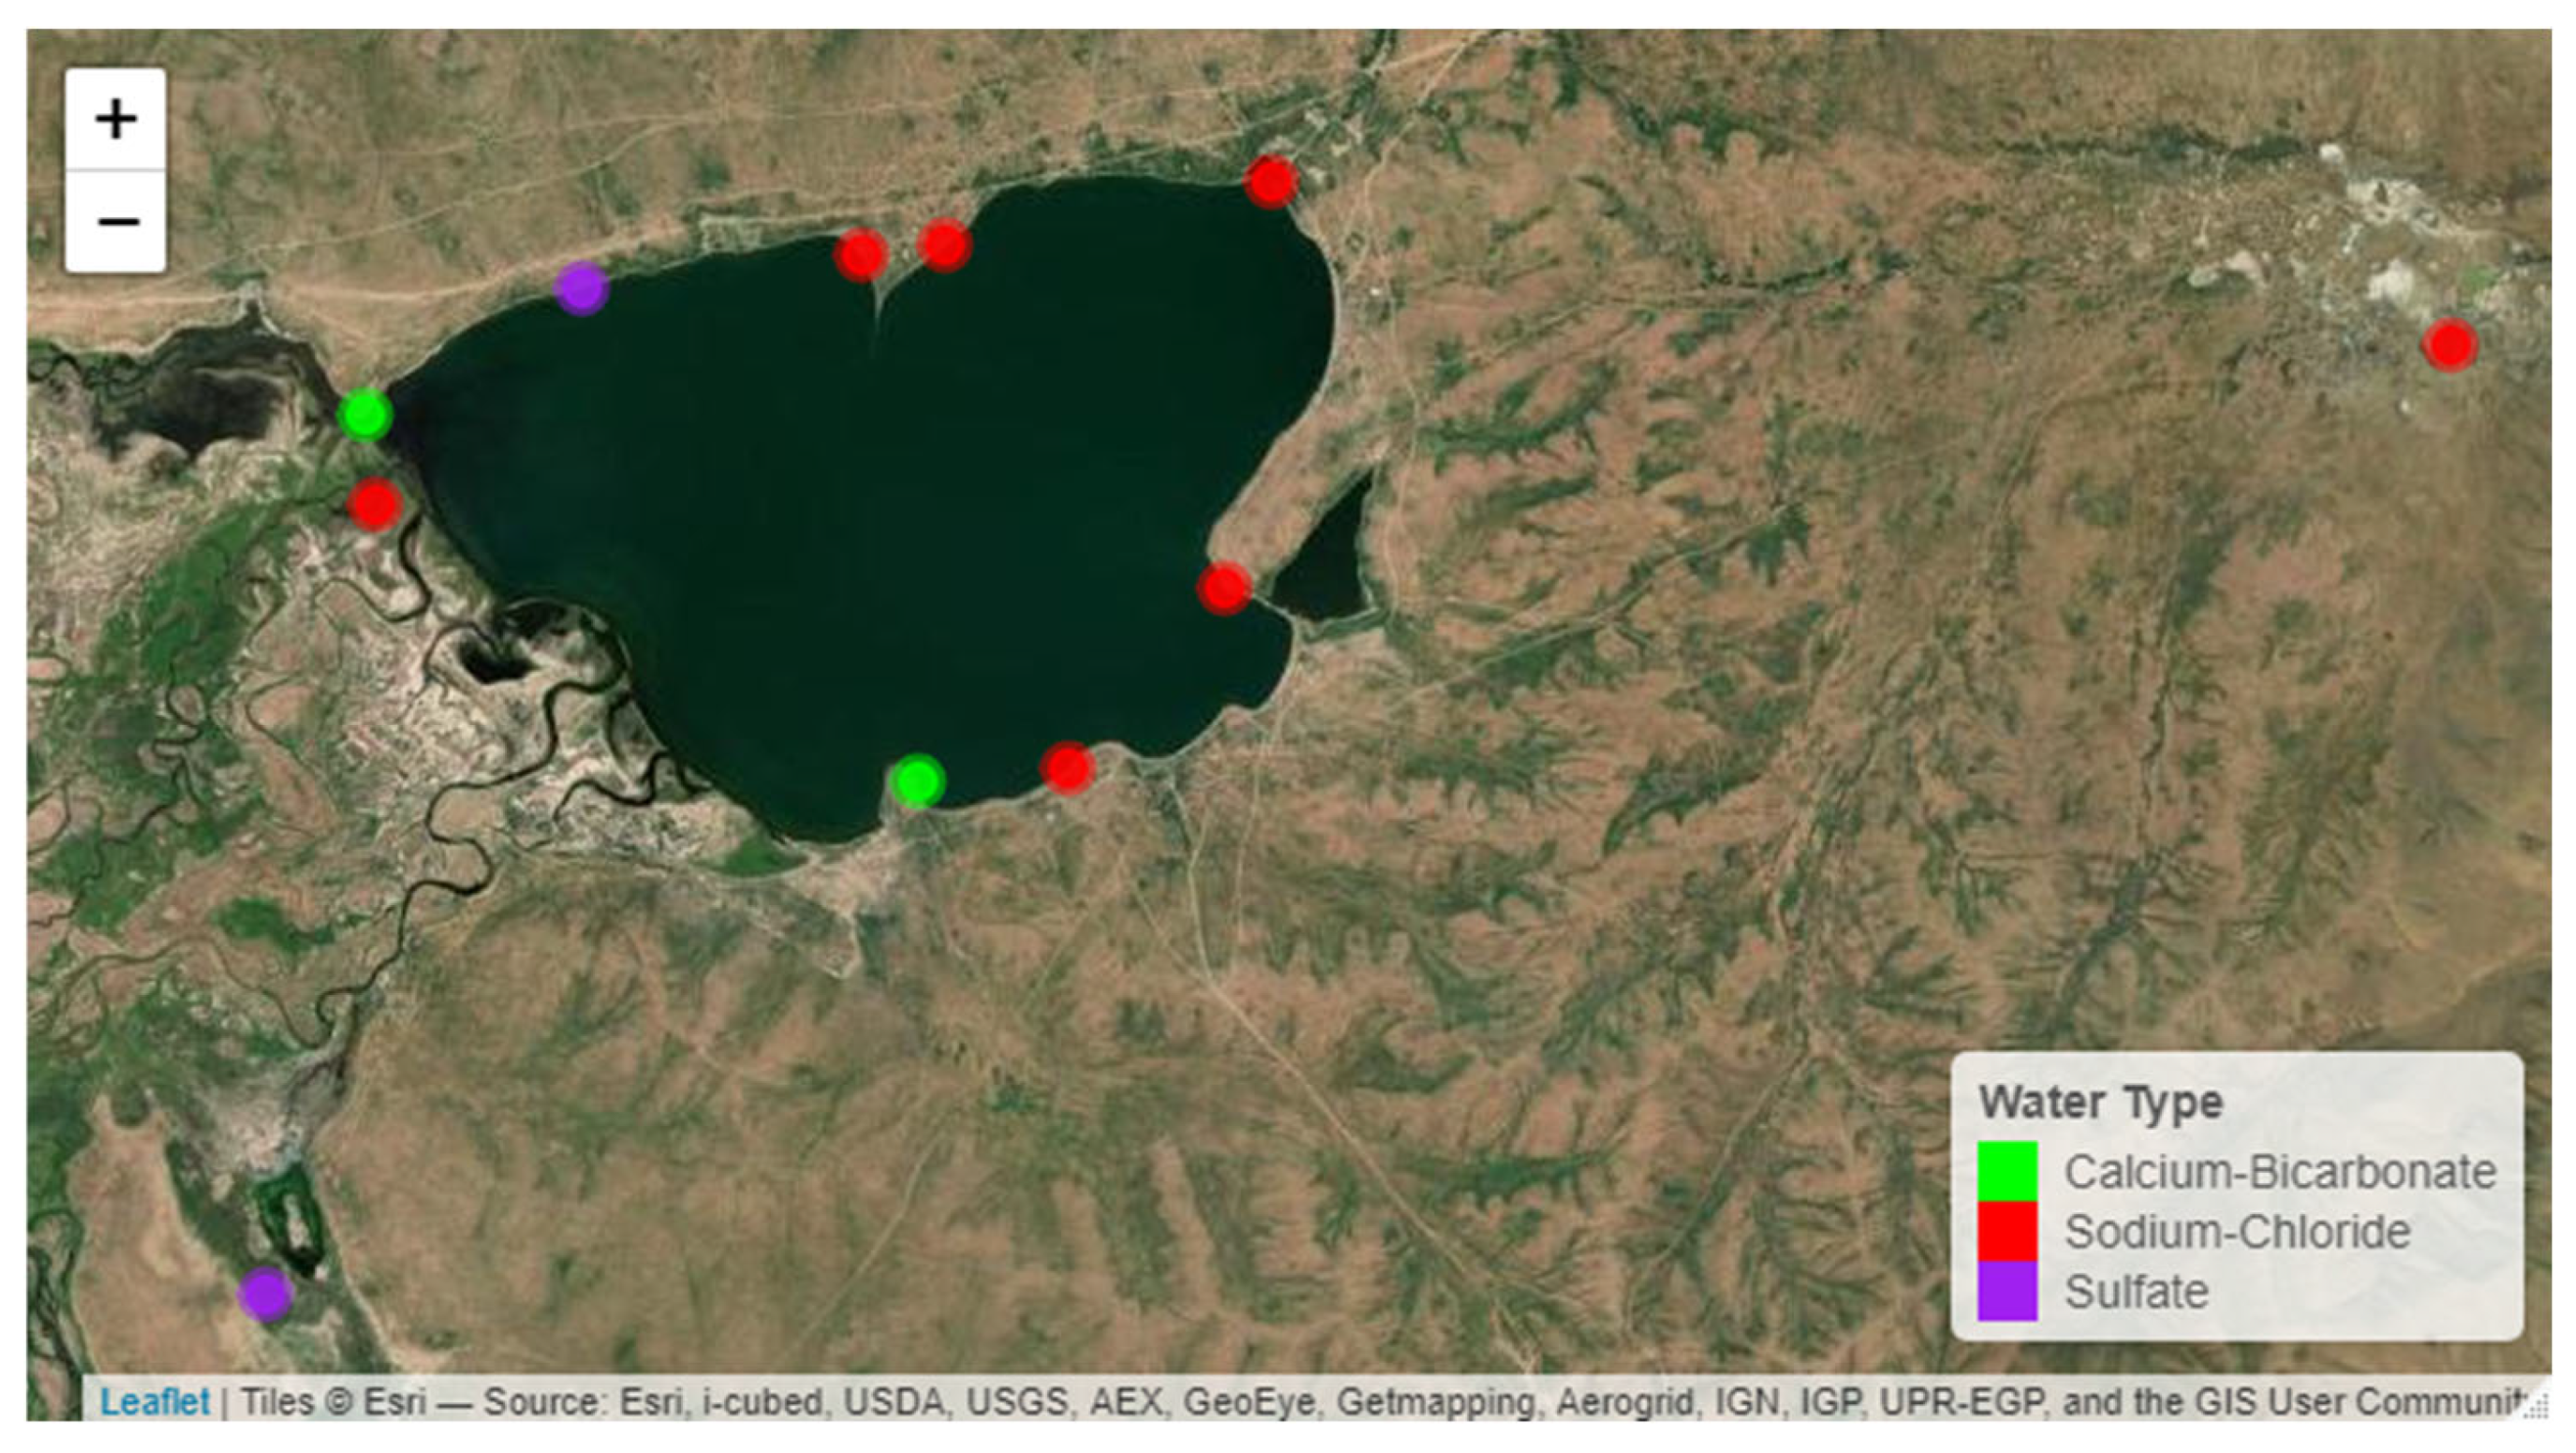
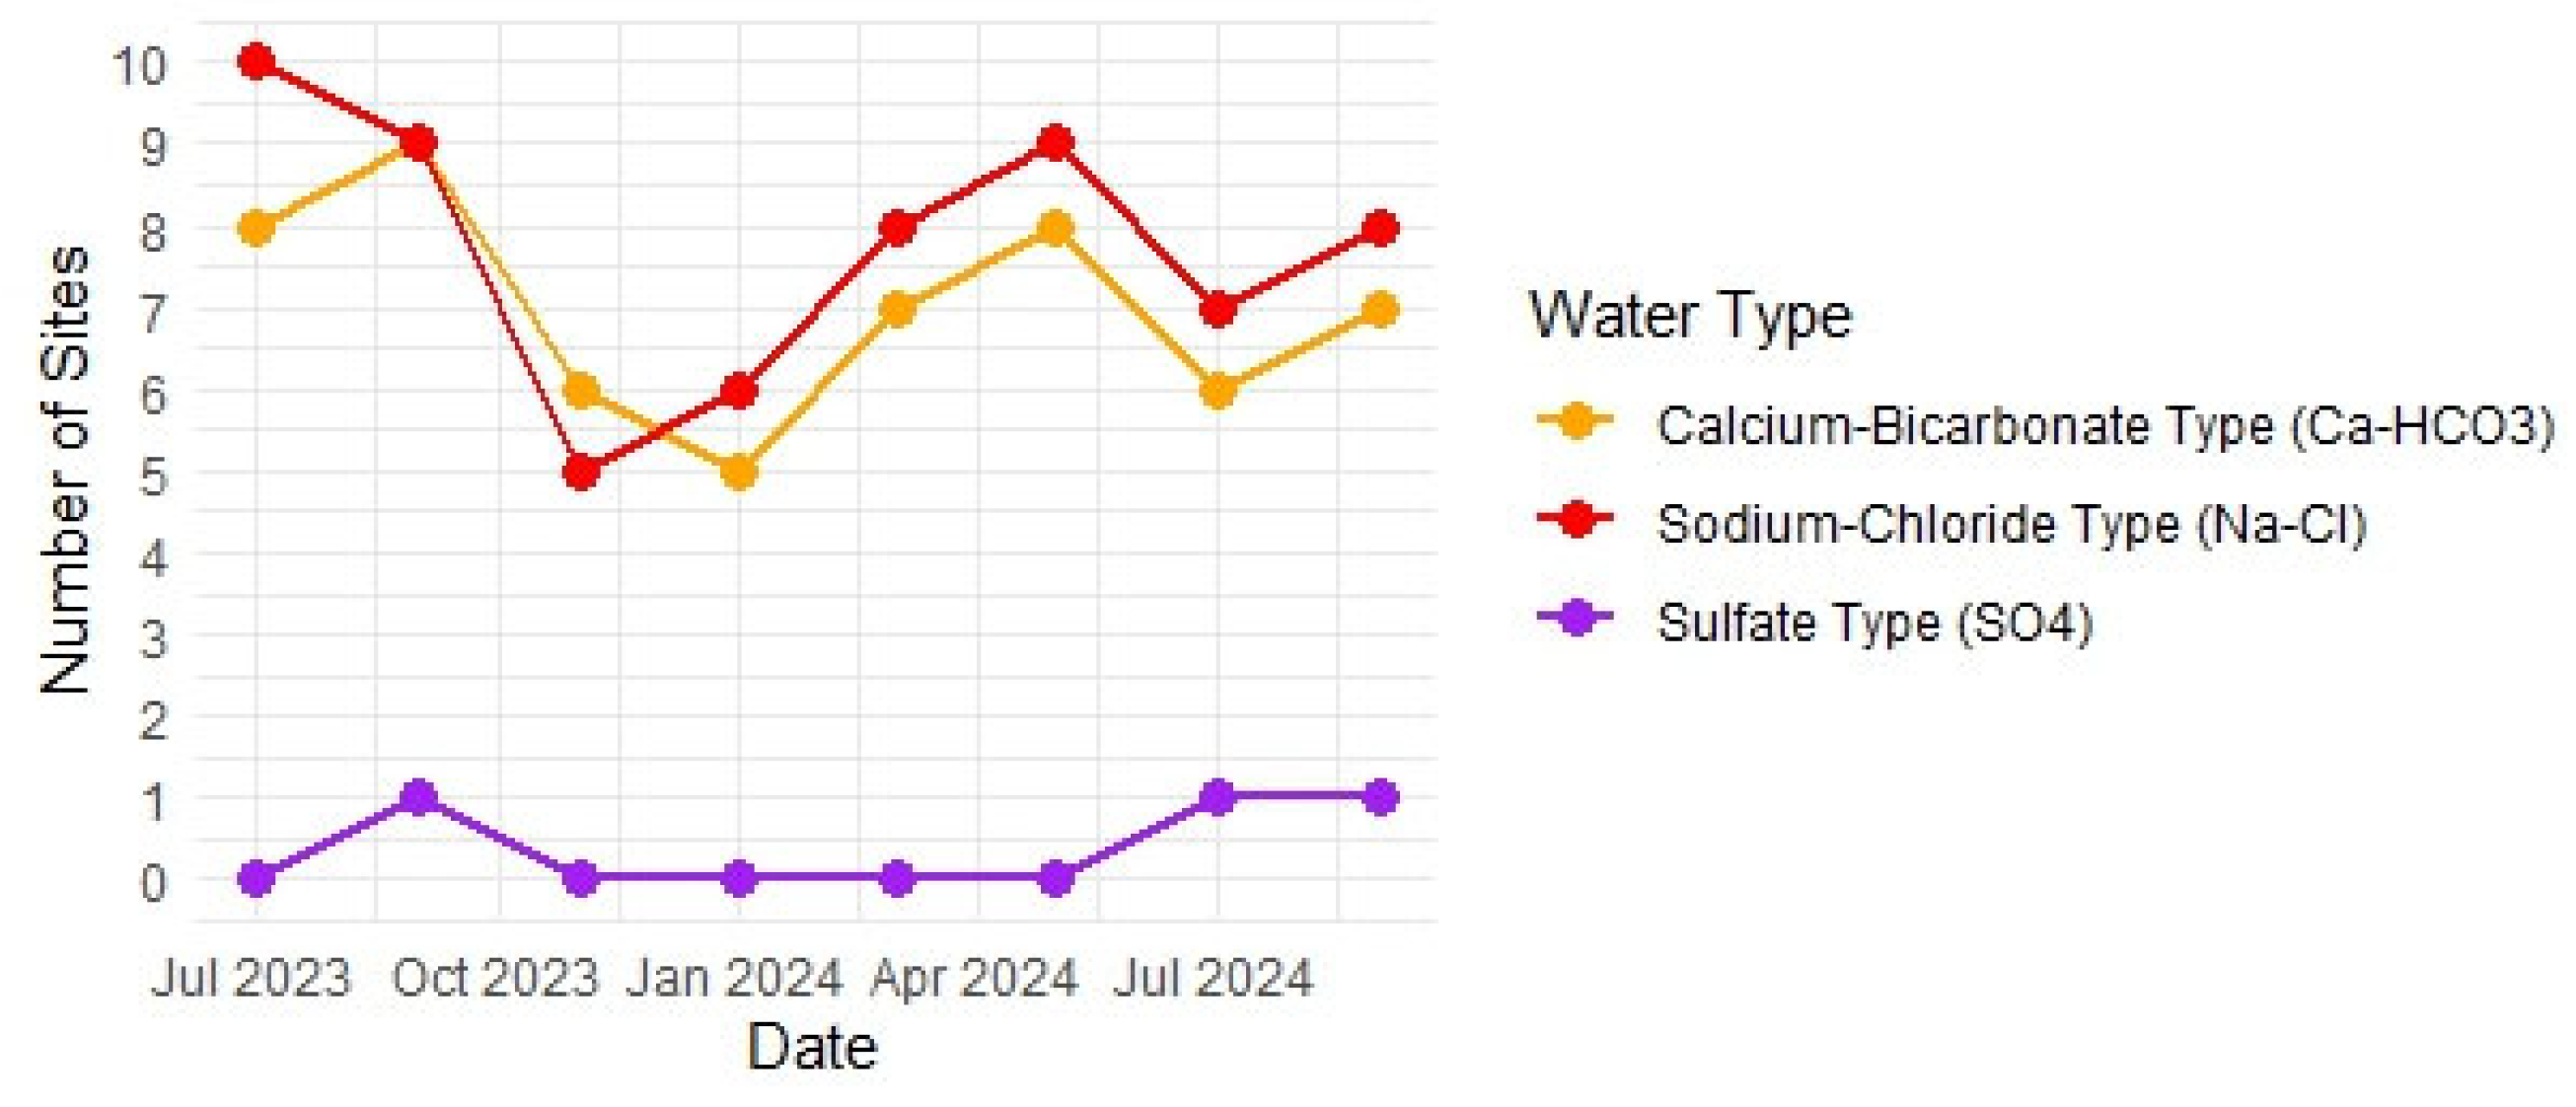
  • Water quality challenges: Distinct seasonal variations in water quality were observed across the Ugii Lake watershed. In July and October, the lake displayed relatively fresh, bicarbonate-dominated water types with moderate total dissolved solids (TDS) and stable pH, suggesting limited mineralization influenced by precipitation and minimal evaporation. In contrast, August showed elevated TDS and pH values, particularly in Ugii Lake, likely due to intense evaporation and increased biological activity during warmer periods. Springs exhibited stable ionic composition, TDS, and pH, serving as a reliable indicator of groundwater quality and showing minimal seasonal variation. This contrast highlights the differing hydrological processes between surface and groundwater systems.
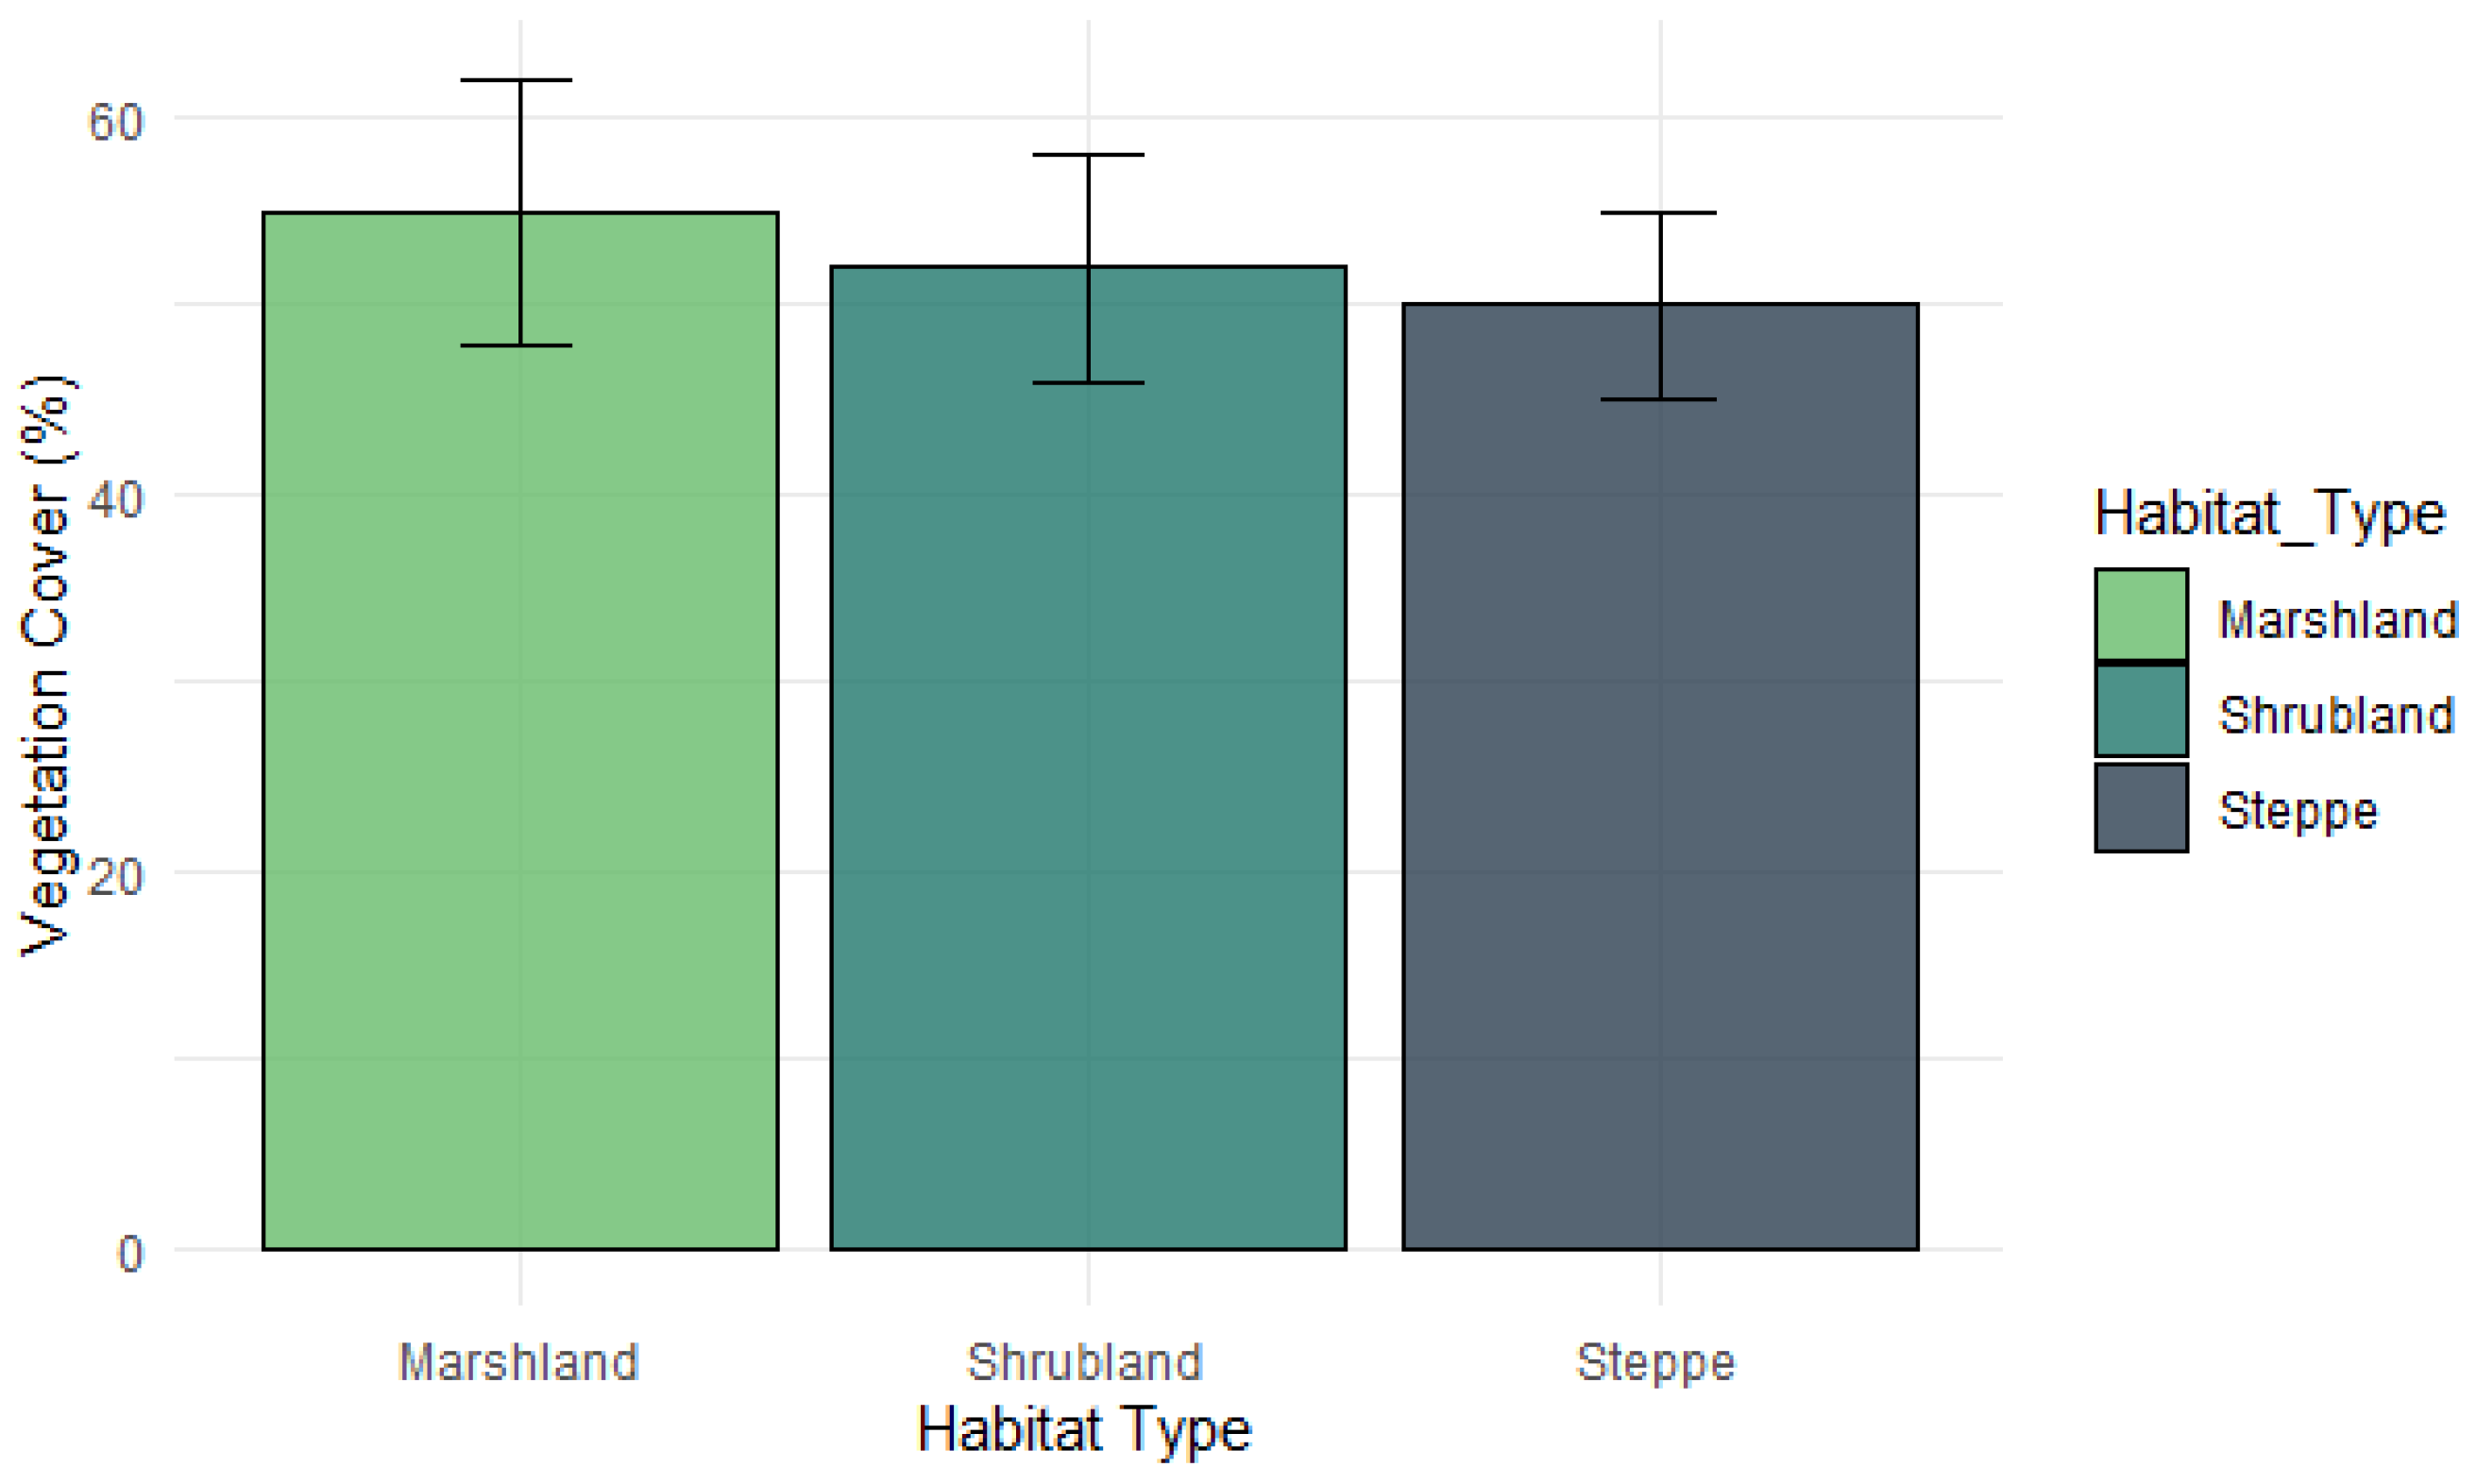
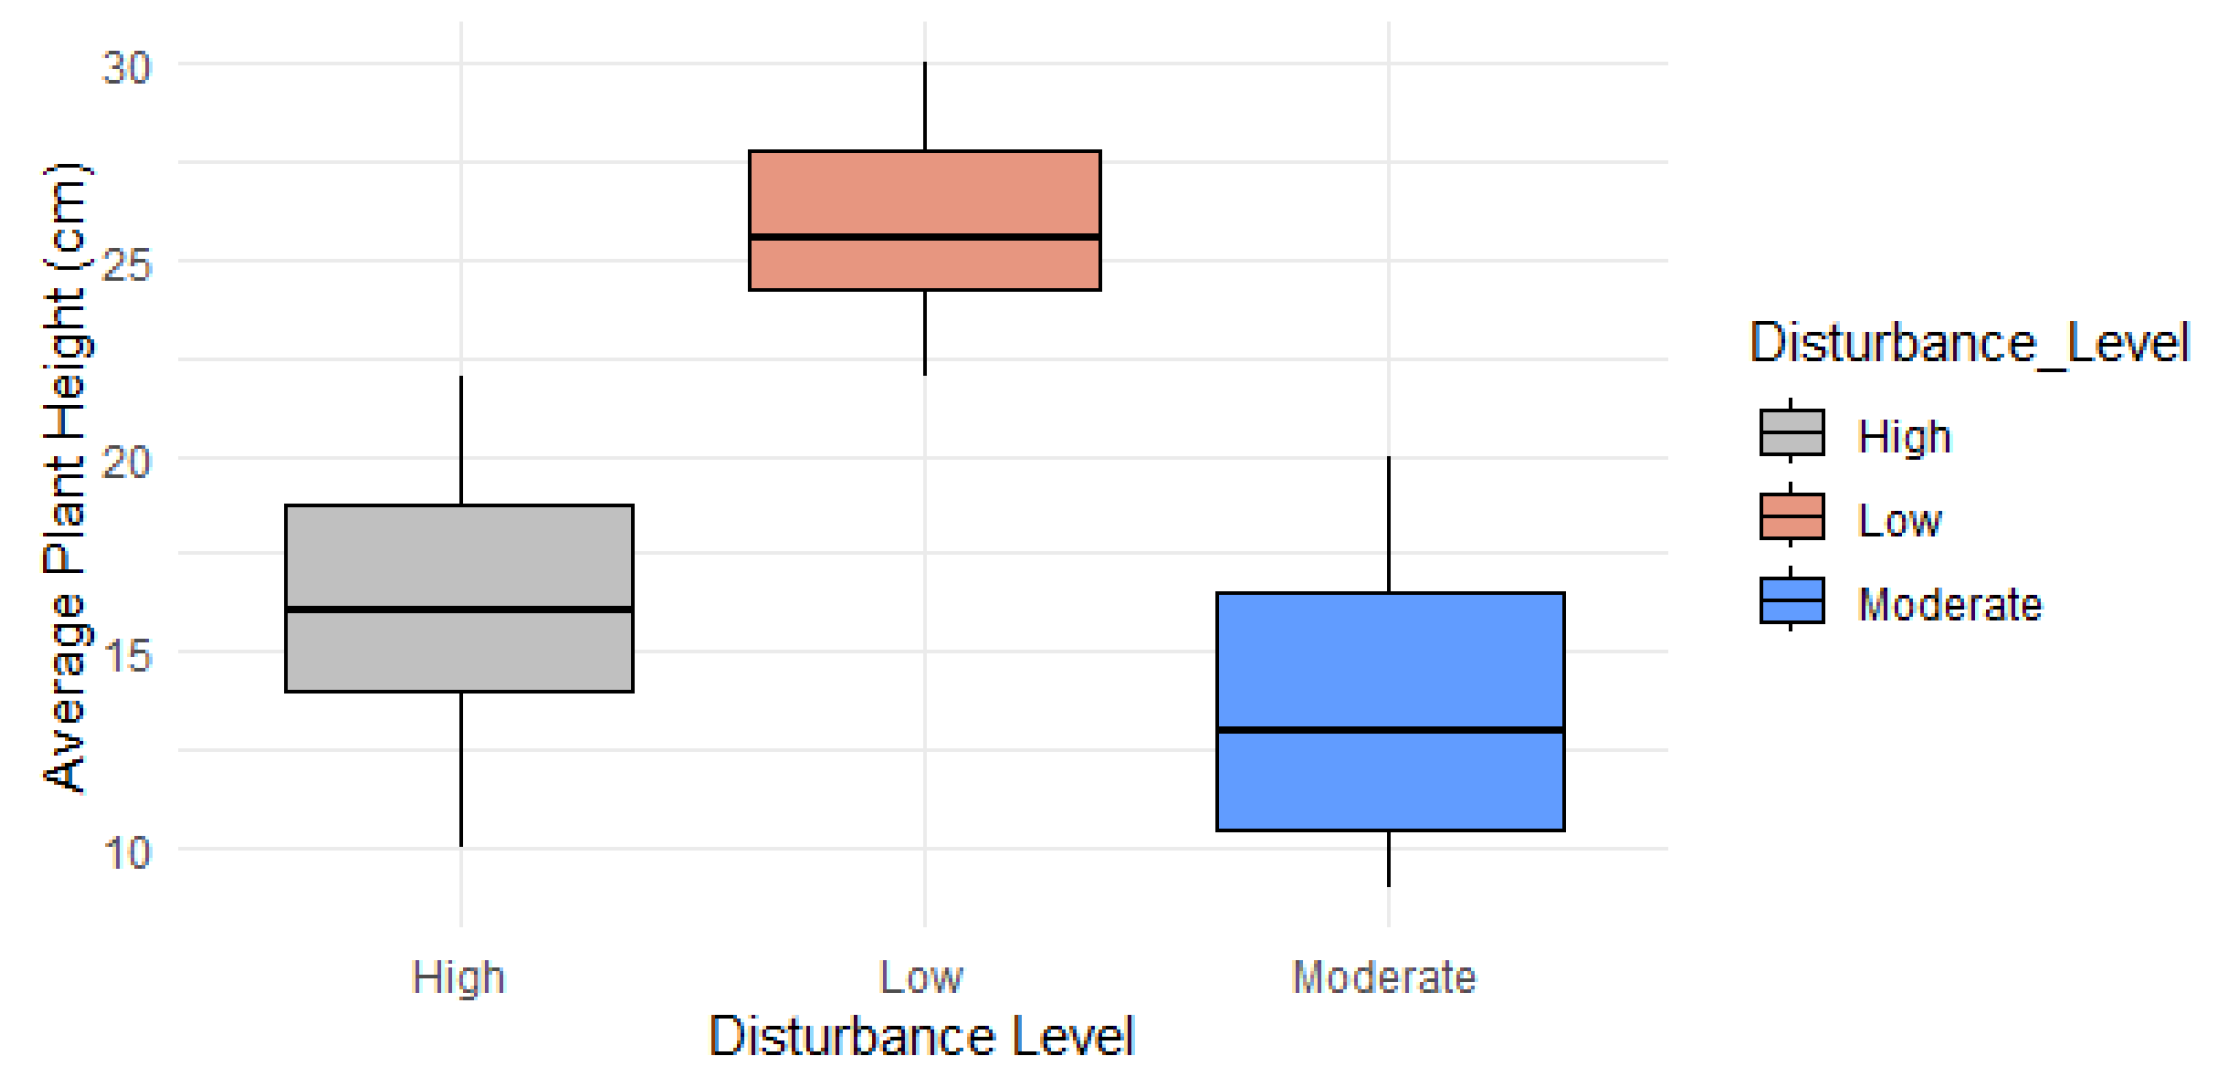
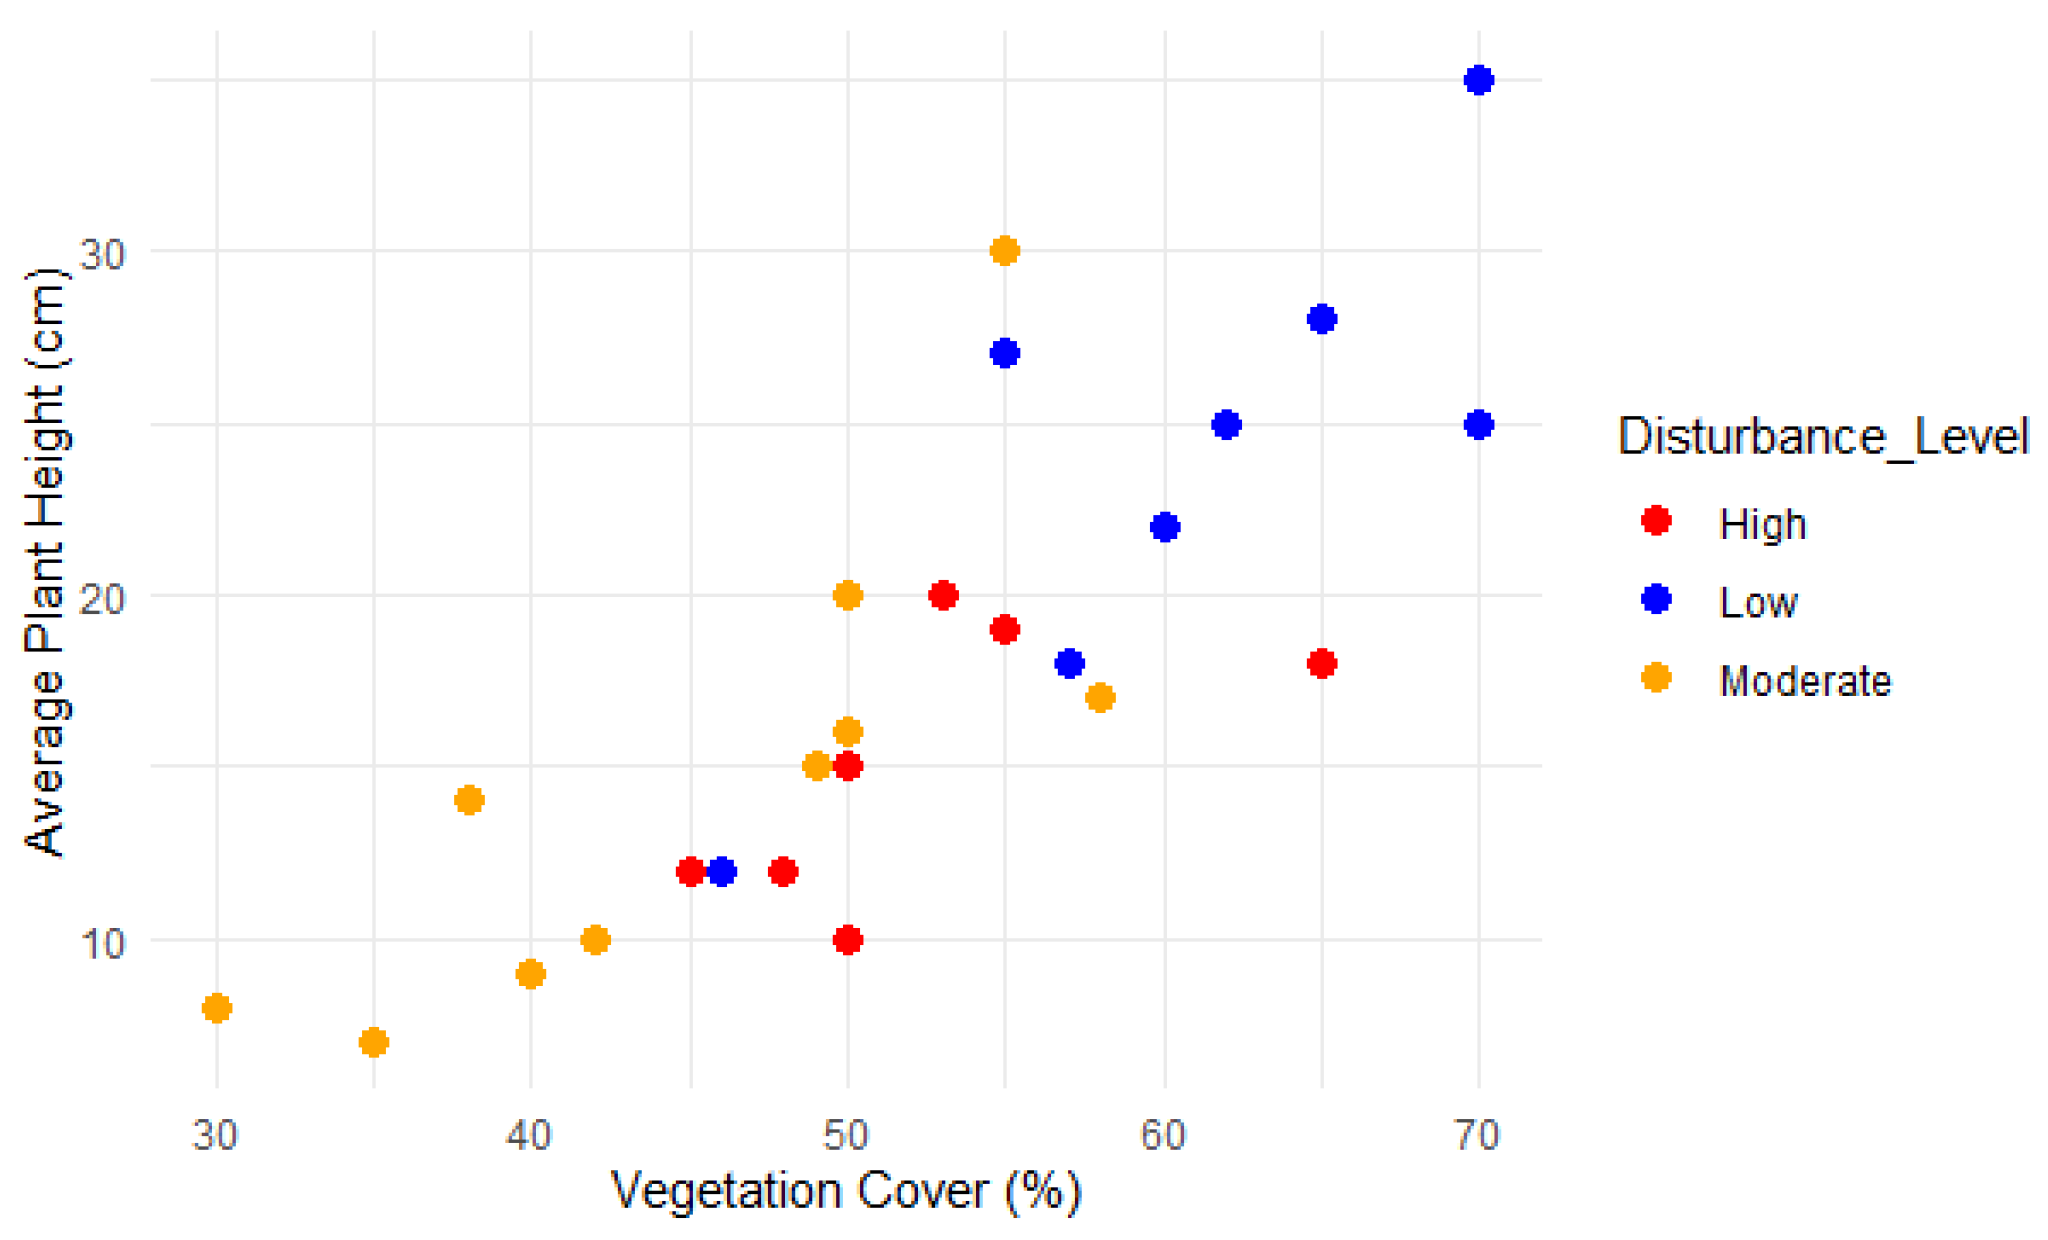
  • Vegetation decline and habitat degradation: Native vegetation is declining due to human activities such as grazing and tourism, leading to increased erosion and reduced water retention in the lake’s catchment. Restoration measures, including rotational grazing and restricted access, are vital for protecting vegetation and preventing further ecological degradation.
  • Socio-economic and health implications: The local community’s dependence on Ugii Lake for water, fishing, and tourism underlines the socio-economic importance of maintaining the lake’s ecological health. Reported health concerns linked to water quality issues emphasize the need for routine monitoring and the development of more robust waste management systems.
  • Community-based conservation: Community support for initiatives such as waste management and restricted recreational zones indicates strong potential for local, participatory conservation. Engaging residents in planning and implementing conservation strategies is critical to achieving long-term ecological and economic sustainability for the lake.
The decrease in lake surface area due to reduced precipitation and increased evaporation is a challenge shared by many steppe lakes worldwide. Previous studies have shown that the hydrology of Lake Ugii is particularly sensitive to climate variability, underscoring the importance of prioritizing water conservation in future climate adaptation strategies.

Author Contributions

Conceptualization, M.N. and I.N.; methodology, I.N., S.T., and G.-O.D.; software, M.N. and E.T.; validation, I.N., S.T., G.-O.D., and E.T.; formal analysis, M.N.; investigation, M.N., I.N., S.T., G.-O.D., and E.T.; resources, M.N. and K.S.; data curation, M.N.; writing—original draft preparation, M.N. and I.N.; writing—review and editing, K.S.; visualization, M.N.; supervision, K.S. and M.N.; project administration, K.S.; funding acquisition, K.S. All authors have read and agreed to the published version of the manuscript.

Funding

This research was funded by the Asia-Pacific Network for Global Change Research APN, grant number CRRP2022-02MY-Shoyama.

Data Availability Statement

The original contributions presented in this study are included in the article. Further inquiries can be directed toward the corresponding author. This study was conducted in accordance with the ethical guidelines of Ibaraki University.

Acknowledgments

The authors would like to thank the Institute of Geography–Geo-Ecology, Mongolian Academy of Sciences, for assistance during the field surveys in 2023 and 2024. The authors would like to thank local authorities for their generous assistance during the fieldwork and technical data process.

Conflicts of Interest

The authors declare no conflicts of interest.

References

  1. Sumiya, E.; Dorjsuren, B.; Yan, D.; Dorligjav, S.; Wang, H.; Enkhbold, A.; Weng, B.; Qin, T.; Wang, K.; Gerelmaa, T.; et al. Changes in Water Surface Area of the Lake in the Steppe Region of Mongolia: A Case Study of Ugii Nuur Lake, Central Mongolia. Water 2020, 12, 1470. [Google Scholar] [CrossRef]
  2. Schwanghart, W.; Frechen, M.; Kuhn, N.J.; Schütt, B. Holocene environmental changes in the Ugii Nuur basin, Mongolia. Palaeogeogr. Palaeoclimatol. Palaeoecol. 2009, 279, 160–171. [Google Scholar] [CrossRef]
  3. Lehner, B.; Döll, P. Development and validation of a global database of lakes, reservoirs, and wetlands. J. Hydrol. 2004, 296, 1–22. [Google Scholar] [CrossRef]
  4. Huang, J.; Yu, H.; Guan, X.; Wang, G.; Guo, R. Dryland climate change: Recent progress and challenges. Rev. Geophys. 2017, 55, 719–778. [Google Scholar] [CrossRef]
  5. Adrian, R.; O’Reilly, C.M.; Zagarese, H.; Baines, S.B.; Hessen, D.O.; Keller, W.; Livingstone, D.M.; Sommaruga, R.; Straile, D.; Van Donk, E.; et al. Lakes as sentinels of climate change. Limnol. Oceanogr. 2009, 54, 2283–2297. [Google Scholar] [CrossRef]
  6. Hostetler, S.W. Hydrological and Thermal Response of Lakes to Climate: Description and Modeling. In Physics and Chemistry of Lakes; Lerman, A., Imboden, D.M., Gat, J.R., Eds.; Springer: Berlin/Heidelberg, Germany, 1995; pp. 63–82. [Google Scholar] [CrossRef]
  7. Labaj, A.L.; Michelutti, N.; Smol, J.P. Annual stratification patterns in tropical mountain lakes reflect altered thermal regimes in response to climate change. Fundam. Appl. Limnol. 2018, 191, 267–275. [Google Scholar] [CrossRef]
  8. Vincent, W.F. Effects of Climate Change on Lakes. In Encyclopedia of Inland Waters; Likens, G.E., Ed.; Elsevier: Amsterdam, The Netherlands, 2009; pp. 55–60. [Google Scholar] [CrossRef]
  9. Michelutti, N.; Wolfe, A.P.; Cooke, C.A.; Hobbs, W.O.; Vuille, M.; Smol, J.P. Climate change forces new ecological states in tropical Andean lakes. PLoS ONE 2015, 10, e0115338. [Google Scholar] [CrossRef]
  10. Rahel, F.J.; Olden, J.D. Assessing the effects of climate change on aquatic invasive species. Conserv. Biol. 2008, 22, 521–533. [Google Scholar] [CrossRef]
  11. Gleick, P.H. Basic water requirements for human activities: Meeting basic needs. Water Int. 1996, 21, 83–92. [Google Scholar] [CrossRef]
  12. Birk, S.; Chapman, D.; Carvalho, L.; Spears, B.M.; Andersen, H.E.; Argillier, C.; Auer, S.; Baattrup-Pedersen, A.; Banin, L.; Beklioğlu, M.; et al. Impacts of multiple stressors on freshwater biota across spatial scales and ecosystems. Nat. Ecol. Evol. 2020, 4, 1060–1068. [Google Scholar] [CrossRef]
  13. Schneider, P.; Hook, S.J. Space observations of inland water bodies show rapid surface warming since 1985. Geophys. Res. Lett. 2010, 37, L22405. [Google Scholar] [CrossRef]
  14. Houghton, A.; English, P. An approach to developing local climate change environmental public health indicators, vulnerability assessments, and projections of future impacts. J. Environ. Public Health 2014, 2014, 132057. [Google Scholar] [CrossRef] [PubMed]
  15. Woolway, R.I.; Sharma, S.; Smol, J.P. Lakes in Hot Water: The Impacts of a Changing Climate on Aquatic Ecosystems. Bioscience 2022, 72, 1050–1061. [Google Scholar] [CrossRef]
  16. MNS ISO 10523:2001; Water Quality—Determination of pH. Mongolian Agency for Standardization and Metrology: Ulaanbaatar, Mongolia, 2001.
  17. MNS ISO 5667-6:2001; Water Quality—Sampling—Part 6: Guidance on Sampling of Rivers and Streams. Mongolian Agency for Standardization and Metrology: Ulaanbaatar, Mongolia, 2001.
  18. MNS ISO 7888:1999; Water Quality—Determination of Electrical Conductivity. Mongolian Agency for Standardization and Metrology: Ulaanbaatar, Mongolia, 1999.
  19. MNS 4423:1997; Drinking Water—Method of Measuring Dry Residue. Mongolian Agency for Standardization and Metrology: Ulaanbaatar, Mongolia, 1997.
  20. MNS ISO 7027:1999; Water Quality—Determination of Turbidity. Mongolian Agency for Standardization and Metrology: Ulaanbaatar, Mongolia, 1999.
  21. MNS ISO 11923:2001; Water Quality—Determination of Suspended Solids by Filtration Through Glass-Fibre Filters. Mongolian Agency for Standardization and Metrology: Ulaanbaatar, Mongolia, 2001.
  22. MNS ISO 6059:2005; Water Quality—Determination of the Sum of Calcium and Magnesium—EDTA Titrimetric Method. Mongolian Agency for Standardization and Metrology: Ulaanbaatar, Mongolia, 2000.
  23. MNS ISO 9297:2001; Water Quality—Determination of Chloride—Silver Nitrate Titration with Chromate Indicator (Mohr’s Method). Mongolian Agency for Standardization and Metrology: Ulaanbaatar, Mongolia, 2001.
  24. MNS ISO 9280:2001; Water Quality—Determination of Sulfate—Gravimetric Method by Precipitation with Barium Sulfate. Mongolian Agency for Standardization and Metrology: Ulaanbaatar, Mongolia, 2001.
  25. MNS ISO 9963-1:2001; Water Quality—Determination of Alkalinity—Part 1: Determination of Total and Composite Alkalinity. Mongolian Agency for Standardization and Metrology: Ulaanbaatar, Mongolia, 2001.
  26. MNS ISO 8467:2001; Water Quality—Determination of Permanganate Index. Mongolian Agency for Standardization and Metrology: Ulaanbaatar, Mongolia, 2001.
  27. MNS ISO 11732:2005; Water Quality—Determination of Ammonium Nitrogen—Method by Flow Analysis (CFA and FIA) and Spectrometric Detection. Mongolian Agency for Standardization and Metrology: Ulaanbaatar, Mongolia, 2005.
  28. MNS ISO 6777:2001; Water Quality—Determination of Nitrite—Molecular Absorption Spectrometric Method. Mongolian Agency for Standardization and Metrology: Ulaanbaatar, Mongolia, 2001.
  29. MNS ISO 7890-3:2001; Water Quality—Determination of Nitrate—Part 3: Spectrometric Method Using Sulfosalicylic Acid. Mongolian Agency for Standardization and Metrology: Ulaanbaatar, Mongolia, 2001.
  30. MNS ISO 11905-1:2001; Water Quality—Determination of Nitrogen—Part 1: Method Using Oxidative Digestion with Peroxodisulfate. Mongolian Agency for Standardization and Metrology: Ulaanbaatar, Mongolia, 2001.
  31. MNS ISO 6878:2001; Water Quality—Determination of Phosphorus—Ammonium Molybdate Spectrometric Method. Mongolian Agency for Standardization and Metrology: Ulaanbaatar, Mongolia, 2001.
  32. MNS ISO 5814:2005; Water Quality—Determination of Dissolved Oxygen—Electrochemical Probe Method. Mongolian Agency for Standardization and Metrology: Ulaanbaatar, Mongolia, 2001.
  33. MNS ISO 6060:2001; Water Quality—Determination of the Chemical Oxygen Demand. Mongolian Agency for Standardization and Metrology: Ulaanbaatar, Mongolia, 2001.
  34. MNS ISO 5815-1:2008; Water Quality—Determination of Biochemical Oxygen Demand After N Days (BODₙ)—Part 1: Dilution and Seeding Method with Allylthiourea Addition. Mongolian Agency for Standardization and Metrology: Ulaanbaatar, Mongolia, 2008.
  35. Struck, J.; Bliedtner, M.; Strobel, P.; Schumacher, S.; Bazarradnaa, E.; Zech, R.; Zech, W. Central Mongolian lake sediments reveal new insights on climate change and equestrian empires in the eastern steppes. Sci. Rep. 2022, 12, 2829. [Google Scholar] [CrossRef]
  36. Austin, J.A.; Colman, S.M. Lake Superior summer water temperatures are increasing more rapidly than regional air temperatures: A positive ice-albedo feedback. Geophys. Res. Lett. 2007, 34, L06604. [Google Scholar] [CrossRef]
  37. Saros, J.E.; Stone, J.R.; Pederson, G.T.; Slemmons, K.E.; Spanbauer, T.; Schliep, A.; Cahl, D.; Engstrom, D.R. Climate-induced changes in lake ecosystem structure inferred from coupled neo- and paleoecological approaches. Ecology 2012, 93, 2155–2164. [Google Scholar] [CrossRef]
  38. Saha, T.K.; Sajjad, H.; Roshani, R. Exploring the impact of land use/land cover changes on the dynamics of Deepor wetland (a Ramsar site) in Assam, India using geospatial techniques and machine learning models. Model. Earth Syst. Environ. 2024, 10, 4043–4065. [Google Scholar] [CrossRef]
  39. Moisa, M.B.; Bulto, T.W.; Werku, B.C.; Mume, A.B.; Shibru, S. Analyzing wetland dynamics using geospatial techniques: A case of Abay Choman and Jimma Geneti watershed, Horo Guduru Wollega Zone, Western Ethiopia. Air Soil Water Res. 2023, 16, 11786221221150183. [Google Scholar] [CrossRef]
  40. Rahimi, L.; Bahram, M.; Ahmad, Y. Assessing and Modeling the Impacts of Wetland Land Cover Changes on Water Provision and Habitat Quality Ecosystem Services. Nat. Resour. Res. 2020, 29, 3701–3718. [Google Scholar] [CrossRef]
  41. Nyamtseren, M.; Pham, T.D.; Vu, T.T.P.; Navaandorj, I.; Shoyama, K. Mapping Vegetation Changes in Mongolian Grasslands (1990–2024) Using Landsat Data and Advanced Machine Learning Algorithm. Remote Sens. 2025, 17, 400. [Google Scholar] [CrossRef]
  42. Cohen, A.S.; Gergurich, E.L.; Kraemer, B.M.; McGlue, M.M.; McIntyre, P.B.; Russell, J.M.; Simmons, J.D.; Swarzenski, P.W. Climate warming reduces fish production and benthic habitat in Lake Tanganyika, one of the most biodiverse freshwater ecosystems. Proc. Natl. Acad. Sci. USA 2016, 113, 9563–9568. [Google Scholar] [CrossRef]
  43. Hampton, S.E.; Scheuerell, M.D.; Church, M.J.; Melack, J.M. Long-term perspectives in aquatic research. Limnol Ocean. 2019, 64, S2–S10. [Google Scholar] [CrossRef]
Figure 1. Location of sampling sites.
Land 14 00998 g001
Figure 2. pH levels for each site (a) and distribution (b). The box in a boxplot represents the interquartile range, the central line indicates the median, and the dots represent outliers.
Land 14 00998 g002
Figure 3. EC for each site (a) and distribution (b). The box in a boxplot represents the interquartile range, the central line indicates the median, and the dots represent outliers.
Land 14 00998 g003
Figure 4. TDS for each site (a) and distribution (b). The box in a boxplot represents the interquartile range, the central line indicates the median, and the dots represent outliers.
Land 14 00998 g004
Figure 5. Temperature for each site (a) and distribution (b). The box in a boxplot represents the interquartile range, the central line indicates the median, and the dots represent outliers.
Land 14 00998 g005
Figure 6. Turbidity for each site (a) and distribution (b). The box in a boxplot represents the interquartile range, the central line indicates the median, and the dots represent outliers.
Land 14 00998 g006
Figure 7. Ionic composition for each site.
Land 14 00998 g007
Figure 8. Water-type distribution for each site.
Land 14 00998 g008
Figure 9. Water-type changes over seasons.
Land 14 00998 g009
Figure 10. Seasonal trends in water-type distribution.
Land 14 00998 g010
Figure 11. Mean vegetation cover (%) across different habitat types (marshland, shrubland, and steppe) around Ugii Lake. Bars represent the average vegetation cover for each habitat type, while the error bars indicate the standard deviation of vegetation cover values within each habitat type, reflecting variability across sampling plots.
Land 14 00998 g011
Figure 12. Distribution of average plant height (cm) across different disturbance levels (high, moderate, and low) in habitats around Ugii Lake. The boxplots show the median (horizontal line), interquartile range (IQR) (box), and minimum and maximum values within 1.5 × IQR (whiskers).
Land 14 00998 g012
Figure 13. Relationship between vegetation cover and plant height. The scatter plot explores how plant height and vegetation cover are related, with different colors representing disturbance levels: red (moderate disturbance), blue (high disturbance), and green (low disturbance).
Land 14 00998 g013
Figure 14. Primary livelihood sources of household at Ugii lake.
Land 14 00998 g014
Figure 15. Perceived environmental changes over the last 10 years.
Land 14 00998 g015
Figure 16. Environmental concerns in Ugii lake.
Land 14 00998 g016
Table 1. The methods for determining water quality parameters.
ParametersUnitsStandard of DeterminationMethod
TemperatureT°CMNS ISO 10523:2001 [16]Measurement with HI98195 multiparameter probe
pHpH MNS ISO 5667-6:2001 [17]
ECECµS/cmMNS ISO 7888:1999 [18]
Total dissolved solidsTDSPpmMNS 4423:1997 [19]
Turbidity NTUMNS ISO 7027:1999 [20]Measurement with HI93703 turbidity meter
Suspended matter TSS MNS ISO 11923:2001 [21]Gravimetric method (filtration through glass-fiber filters and weighing)
CalciumCa2+mg/LMNS ISO 6059:2005 [22]Trilonometric titration (EDTA method)
MagnesiumMg2+mg/LTrilonometric titration (EDTA method)
ChlorideClmg/LMNS ISO 9297:2001 [23]Mohr’s titration method (silver nitrate with chromate indicator)
SulfateSO42−mg/LMNS ISO 9280:2001 [24]Gravimetric method (precipitation as barium sulfate)
Carbonate, hydrocarbonateCO32−, HCO3mg/LMNS ISO 9963-1:2001 [25]Acidimetry (titration with standard acid, methyl orange indicator)
Oxidation of permanganate CODmg/LMNS ISO 8467:2001 [26]Permanganate oxidation titration method
AmmoniaNH4+mg/LMNS ISO 11732:2005 [27]Flow injection analysis (FIA) with indophenol blue reaction, HI83399 photometer
NitriteNO2mg/LMNS ISO 6777:2001 [28]Diazotization-spectrophotometric method, Palintest 7100 photometer
NitrateNO3mg/LMNS ISO 7890-3:2001 [29]Spectrophotometric method with sulfosalicylic acid, HI83399 photometer
Total nitrogenTNmg/LMNS ISO 11905-1:2001 [30]Oxidative digestion with potassium peroxodisulfate and spectrophotometric detection
Total phosphorusTPmg/LMNS ISO 6878:2001 [31]Digestion and ammonium molybdate colorimetric method
Dissolved oxygenDOmg/LMNS ISO 5814:2005 [32]Electrochemical probe method (DO meter HI98198) or Winkler titration
Chemical oxygen demandCODmg/LMNS ISO 6060:2001 [33]Dichromate oxidation method; detection by HI83399 photometer or titration
Biological oxygen demandBODmg/LMNS ISO 5815-1:2008 [34]5-day incubation method with DO measurement (HI83399 photometer)
Disclaimer/Publisher’s Note: The statements, opinions and data contained in all publications are solely those of the individual author(s) and contributor(s) and not of MDPI and/or the editor(s). MDPI and/or the editor(s) disclaim responsibility for any injury to people or property resulting from any ideas, methods, instructions or products referred to in the content.

