Abstract
The accurate extraction of mountainous cropland from remote sensing images remains challenging due to its fragmented plots, irregular shapes, and the terrain-induced shadows. To address this, we propose a deep learning framework, SE-ResUNet, that integrates Squeeze-and-Excitation (SE) modules into ResUNet to enhance feature representation. Leveraging Sentinel-1/2 imagery and DEM data, we fuse vegetation indices (NDVI/EVI), terrain features (Slope/TRI), and SAR polarization characteristics into 3-channel inputs, optimizing the network’s discriminative capacity. Comparative experiments on network architectures, feature combinations, and terrain conditions demonstrated the superiority of our approach. The results showed the following: (1) feature fusion (NDVI + TerrainIndex + SAR) had the best performance (OA: 97.11%; F1-score: 96.41%; IoU: 93.06%), significantly reducing shadow/cloud interference. (2) SE-ResUNet outperformed ResUNet by 3.53% for OA and 8.09% for IoU, emphasizing its ability to recalibrate channel-wise features and refine edge details. (3) The model exhibited robustness across diverse slopes/aspects (OA > 93.5%), mitigating terrain-induced misclassifications. This study provides a scalable solution for mountainous cropland mapping, supporting precision agriculture and sustainable land management.
1. Introduction
Cropland is the fundamental resource and agricultural foundation upon which human society depends [1]. Since the Industrial Revolution, excessive exploitation of natural resources has led to increasing degradation of global cropland and significant changes in its area, thereby posing great challenges to food security. Understanding the distribution of cropland is crucial for evaluating cropland quality, ensuring food security, and formulating effective cropland protection policies [2]. Remote sensing images have become a primary data source for obtaining information on cropland distribution and its changes owing to their broad coverage, timeliness, rich information content, and ease of acquisition. In mountainous areas, the quality of cropland, cultivation conditions, and other factors constrain its distribution, making spatial changes more pronounced. Therefore, accurately extracting the spatial distribution of cropland in these regions is therefore of utmost importance.
Complex terrain and frequent cloudiness in mountainous areas pose significant challenges to the remote sensing-based monitoring of cropland [3]. Firstly, the complex mountainous terrain is characterized by fragmented cropland parcels with varying shapes and sizes, as well as pronounced mountain shadows [4,5]. Secondly, sloped cropland is common in mountainous regions, and the field boundaries often blend together with vegetation, causing feature blurring and increasing extraction difficulty. Thirdly, the undulating terrain and frequent cloudy and foggy days in mountainous areas result in a lower number of available optical remote sensing images each year.
Machine learning algorithms are common methods used to extract cropland data from remote sensing images. Examples include decision trees [6], support vector machines [7], and artificial neural networks [8]. However, these algorithms typically focus on the spectral information contained within image pixels, neglecting the utilization of spatial contextual information and the exploration of high-level semantic features. This makes them challenging to apply to the extraction of cropland information in complex regions [9].
In recent years, there has been notable advancement in the field of image segmentation, particularly with the rapid development of deep learning models represented by convolutional neural networks (CNNs). CNNs are capable of automatically extracting the primary features and performing automatic information extraction by learning the intrinsic patterns and representation levels of the sample data, thus exhibiting more robustness to complex and variable situations [10]. Numerous scholars have utilized deep learning networks, such as UNet [11] and Deeplab v3+ [12], to extract cropland based on high-resolution remote sensing data. Their results have demonstrated that deep learning methods can achieve higher accuracy in cropland extraction compared to traditional machine learning algorithms.
Most research on deep learning for cropland extraction is based on semantic segmentation using medium- and high-resolution satellite imagery [13]. However, the shapes of cropland in mountainous areas vary significantly, and the boundaries with forests or grasslands are blurred and exhibit different spatial scales, which leads to relatively low accuracy in cropland extraction from remote sensing data in mountainous areas.
Increasing the number of features is a common method for improving the accuracy of remote sensing classification in complex terrains [14,15]. For example, adding topographic features helps mitigate terrain effects [16]; incorporating synthetic aperture radar (SAR) band features mitigates the impact of clouds, fog, and shadows [17]; and including phenological features aids in distinguishing land cover types with marked seasonal variations [18,19]. However, a larger number of feature channels can increase the computational load on deep learning networks, so the number of input features should not be too high. Through a combination of multiple feature types, it is possible to fully leverage the information from various features, meeting the input feature demands of deep learning networks.
The extraction of multi-scale spatial features by deep learning networks is primarily determined by the network’s architecture. For example, HRNet [20] and SegNet [21] networks are often used for extracting cropland. HRNet preserves high-resolution information, thereby enhancing the accuracy and detail richness of cropland extraction. In contrast, SegNet restores the boundaries and detailed information of cropland in a pixel-by-pixel classification process. The architectures of these networks offer substantial advantages for precise extraction of cropland. To improve the accuracy of cropland extraction, some scholars have modified the network structures. This includes incorporating attention mechanism modules [22], optimizing network structures [23], and employing transfer learning [24]. The Squeeze and Excitation (SE) module is a channel attention mechanism that reweights the feature maps of the convolutional network through ‘Squeeze’ and ‘Excitation’ steps. It adaptively recalibrates channel weights to enhance useful features and suppress less relevant ones [25] to extract key information. ResUNet is a deep learning model that combines residual links with the U-Net architecture, capturing complex features by deepening the network layers while retaining low-level feature information, thus preventing gradient vanishing and information loss [26]. Integrating the SE module with ResUNet may enhance the accuracy of remote sensing-based cropland extraction in mountainous areas.
To this end, this study utilized Sentinel 1/2 remote sensing images and DEM data as experimental data, and selected a typical mountainous area in southwest China as the study area. It aimed to improve the accuracy of mountainous cropland extraction by using a combination of multiple features and refining deep learning network structures. On one hand, a feature set is constructed using topographic, vegetation index, and SAR polarization features, and a three-channel image is generated through feature fusion to create a sample set. On the other hand, the ResUNet network, enhanced with the SE module, is trained to evaluate the performance of the improved network architecture in extracting mountainous cropland under different remote sensing feature combinations.
In summary, this study aimed to address the following two questions: (1) Can using a combination of features improve the performance of deep learning networks in extracting mountainous cropland? (2) Can the integration of the SE module with ResUNet improve the accuracy of mountainous cropland extraction?
By addressing these questions, this study contributes to the scientific knowledge by proposing an innovative approach that integrates multiple features and optimizes deep learning network structures for accurate cropland extraction in complex mountainous regions. This method effectively overcomes the challenges posed by complex terrain and frequent cloudiness, significantly enhancing extraction accuracy. The findings not only provide new technical insights for cropland extraction in difficult environments but also offer valuable references for high-precision land cover classification using deep learning. Ultimately, this work supports better land management practices and sustainable agricultural development, contributing to global food security efforts.
2. Materials and Methods
2.1. Study Area
The study area is located in Qujing City, Yunnan Province, China, spanning 103°57′ E to 104°11′ E longitude and 25°44′ N to 25°06′ N latitude (Figure 1). The average elevation is 2003 m, with a total area of approximately 2314 km2. The region has a subtropical monsoon climate, with an average annual temperature of 14.5 °C and an average annual rainfall of 1008 mm. The topography of the study area is characterized by interlocking mountains, hills, and basins, along with complex terrain and fragmented land parcels, making it representative of a typical mountainous area. The land cover types in the region are diverse, including cropland, forest, grassland, shrubland, built-up land, water bodies, etc.
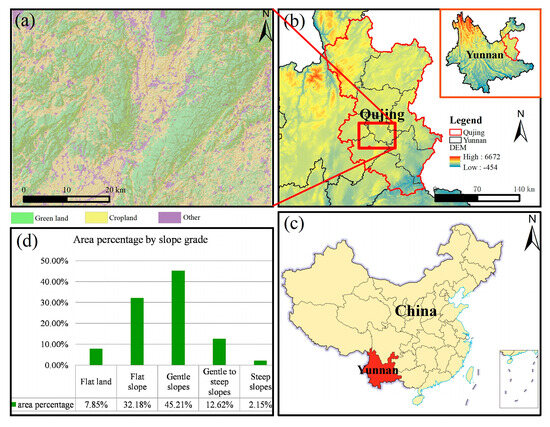
Figure 1.
Geographic location of the study area. (a) Topography and land use types in the study area. (b) Location of the study area in Qujing City, Yunnan Province. (c) Location of Yunnan Province in China. (d) Slope grading statistics of the study area.
2.2. Data Source and Pre-Processing
2.2.1. Sentinel-1/2 Remote Sensing Images
This study collected Sentinel-1/2 remote sensing images of the study area from September to November 2022, with a spatial resolution of 10 m, to extract vegetation features for training. The Sentinel-1/2 remote sensing images were obtained from Google Earth Engine (GEE) [27].
Sentinel-1 consists of two polar-orbiting Synthetic Aperture Radar (SAR) satellites, which are active microwave remote sensing satellites It can provide continuous imagery day and night, ensuring timeliness and reliability. The study utilized Sentinel-1 SAR GRD’s dual-polarization mode, specifically the VV + VH polarization combination, known for its high penetration capability for land observation.
The high-resolution optical satellite of Sentinel-2 is equipped with a multispectral imager at an altitude of 786 km, featuring 13 spectral bands [28]. The primary product used is the Sentinel-2 Level 2A (L2A) data product, which has undergone pre-processing including radiometric calibration and atmospheric correction, reflecting surface reflectance information. This study primarily utilized bands B2 (blue), B3 (green), B4 (red), and B8 (near-infrared).
The Sentinel-1 and Sentinel-2 images were separately acquired on the GEE platform for preprocessing. The main steps included image cropping, cloud removal, void filling, resampling, and median synthesis processing. First, the Sentinel-1/2 image data were collected according to the study area boundaries and cropped accordingly. The QA60 band provided with the Sentinel-2 images was used for cloud removal, with cloud coverage filtered to be below 20% to ensure image quality. After cloud removal, gaps in the imagery were filled using bilinear interpolation from an adjacent month’s imagery to ensure data integrity. Subsequently, a median composite of the image sets from September to November was generated, reducing the impact of noise. A total of 21 Sentinel-1 images and 25 Sentinel-2 images were used.
2.2.2. Topographic Data
The collected topographic data are ASTER GDEM elevation data products with a spatial resolution of 30 m. ASTER GDEM is derived from detailed observations by Terra, which is part of NASA’s next-generation Earth observation satellites. These data were used to calculate topographic features and for topographic classification. The data were obtained from the Geospatial Data Cloud Platform of the Computer Network Information Center, Chinese Academy of Sciences (http://www.gscloud.cn, accessed on 6 March 2024).
2.2.3. Ground Truth Data
Ground truth data were primarily obtained by manually vectorizing the entire study area based on high-resolution imagery from Google Earth (https://earth.google.com/web/, accessed on 6 March 2024). Since the focus of this study was on cropland, the land cover types were categorized into cropland, green land (forests, grasslands, and shrublands), and other (urban land, water bodies, bare land, etc.) for simplicity. The ground truth data collection method is as follows: first, high-resolution remote sensing images from Google Earth in 2022 were selected and cropped to match the study area. The land cover types within the study area were visually interpreted and vectorized into three categories. To ensure the accuracy and reliability of the annotations, the labeling process involved multiple annotators who independently labeled the same areas, and their results were cross-validated to resolve any inconsistencies. Next, the vectorized results were converted into raster data with a resolution of 10 m and saved as TIF files to obtain the ground truth data. Finally, the ground truth data were cropped into 256 × 256-pixel tiles with a 128-pixel stride, generating the labeled image set required for the deep learning network, totaling 5376 images. Figure 2 shows an example of the data.
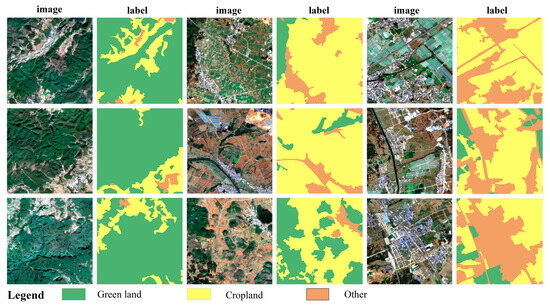
Figure 2.
Example of image labeling.
2.3. Research Methods
The research methodology primarily consists of the following components: data preparation, feature extraction, network construction, and experimental design. Initially, the data preparation phase involved collecting high-resolution remote sensing images and preparing labeled data through visual interpretation. Next is the feature extraction phase, where suitable remote sensing features were selected based on the characteristics of mountainous cropland and prior research for combination analysis. A Jeffries–Matusita (JM) distance analysis was conducted to determine the separability between classes under each feature combination. In the network construction phase, the Squeeze-and-Excitation (SE) attention mechanism was integrated into the ResUNet network to form the SE-ResUNet network. Finally, experiments were conducted to compare feature combinations, network structures, and the impact of terrain conditions (Figure 3).
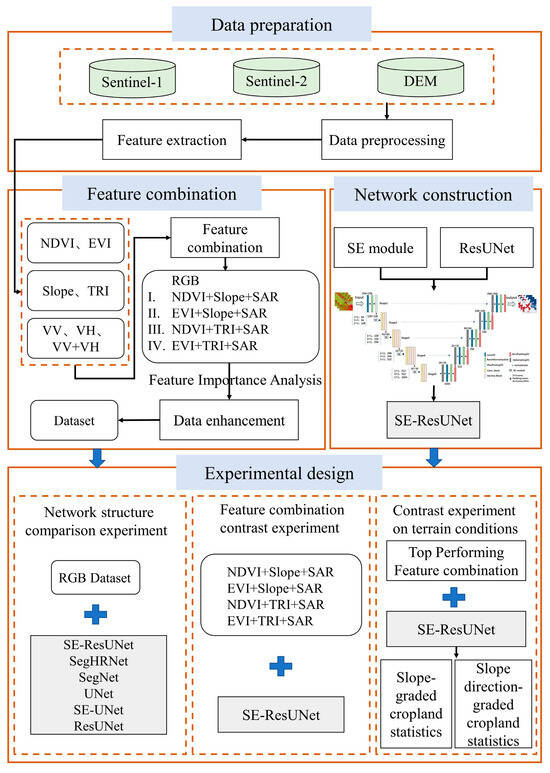
Figure 3.
Study roadmap.
2.4. Cropland Feature Extraction and Feature Combination
2.4.1. Cropland Feature Extraction
Considering the requirements for cropland extraction and the characteristics of mountainous areas, this study extracted candidate features based on three aspects: vegetation indices, topography, and Synthetic Aperture Radar (SAR) data.
Vegetation index features: Two of the most widely used vegetation indices, the Normalized Difference Vegetation Index (NDVI) and the Enhanced Vegetation Index (EVI) were selected as candidate features. The NDVI can be calculated from the reflectance of the near-infrared (NIR), red (R), green (G), and blue (B) bands of Sentinel-2 imagery. The calculation methods are shown in Equations (1) and (2). The NDVI can detect vegetation cover and mitigate some effects of radiation changes related to the sun’s elevation angle, the satellite’s observation angle, topography, clouds, shadows, and atmospheric conditions. It is highly effective in distinguishing green land from other land use types. However, it is less effective in distinguishing cropland from green land, particularly in areas with sparse vegetation cover. The EVI, on the other hand, can enhance the discrimination between cropland and forest [29].
In the equation, NIR refers to the near-infrared band of Sentinel-2 imagery and R denotes the red band.
In this equation, B refers to the blue band.
Topographic features: Topographic features were used to reflect the topographic differences in mountainous areas. Slope and terrain relief (TRI) were selected as candidate topographic features. These two features were calculated using QGIS software (https://www.qgis.org/, QGIS 3.22, accessed on 1 March 2024) based on the DEM data.
SAR features: Optical imagery in mountainous areas is often hindered by interference from clouds, shadows, and aerosols. SAR is a high-resolution imaging radar capable of acquiring high-resolution radar imagery similar to optical photography, even under conditions of extremely low visibility. A key advantage of SAR is its all-weather operability, which is unaffected by weather or shadows. Sentinel-1 remote sensing imagery represents a current standard in SAR imagery. It includes VV and VH polarization bands, which are complementary due to their different directional polarizations. By averaging the VV and VH bands, a SAR polarization feature is created and was considered as a candidate feature for inclusion.
2.4.2. Feature Combination
The study selected NDVI, EVI, slope, TRI, and SAR features. According to the existing research, these features can enrich the information content of images and make a significant contribution to the extraction of cropland in hilly and mountainous areas [30,31,32,33]. Different features can capture different characteristics of land objects. SAR features help to mitigate the effects of shadows and clouds in mountainous areas, topographic features can assist in distinguishing between the topographic differences of different land objects, and vegetation indices can effectively differentiate between green vegetation and cropland, minimizing confusion. Random Forest was used to evaluate the importance of features and determine the best combination of features; the calculation formula as follows:
In the formula, I(T) is the set of all internal nodes in tree T, v(t) is the feature used to split node t, N(t) is the number of samples in node t, n is the total number of samples, and ΔI(t) is the decrease in impurity before and after the split of node t.
To evaluate the separability of different land cover types using various feature combinations, we employed the Jeffreys–Matusita (JM) distance. For the calculation of the JM distance, we selected a specific region within the study area and used different feature combination images. For each land cover type, we randomly selected 300 points to ensure the representativeness and reliability of each land cover type. The JM distance formula is as follows:
In this equation, mi and mj represent the 3D mean vectors of the three bands for the two types of features selected in the image, i and j are the covariance matrices of the two types of features, and T denotes the transposition operation. The JM distances were used to assess the effectiveness of different feature combinations in distinguishing between cropland and other land types.
2.4.3. Construction of Sample Sets with Different Combinations
According to the combination schemes, the corresponding features were fused into three-channel images and saved in TIFF format. The fused images were then cropped according to the label cropping scheme to obtain 5376 small images, which corresponded to the label set, forming the sample set. The number of pixels marked in the labels was counted, with green vegetation accounting for 39.98%, cropland accounting for 46.8%, and other land types accounting for 13.22%. The sample set, including the fused image set and the label set, was divided into training, validation, and testing sets in a ratio of 8:1:1. To balance the number of different land objects and enhance the generalization ability of the network, data augmentation was applied to the training set of the land types with fewer samples. The data augmentation methods included rotation, symmetry transformations, and gamma transformations. Each resulting training sample set consisted of 4841 remote sensing images with a size of 256 × 256 and their corresponding labels.
2.5. Cropland Extraction Network Construction
Considering the irregular shape of cropland in mountainous areas, this study introduced the Squeeze-and-Excitation (SE) module into the ResUNet network architecture to construct a deep learning network for the remote sensing extraction of mountainous cropland—namely, SE-ResUNet.
2.5.1. ResUNet
ResUNet is a convolutional neural network that integrates the architectures of ResNet and UNet. It effectively addresses the issues of gradient vanishing and loss of semantic information, achieving favorable training outcomes even with small datasets.
ResUNet utilizes a fusion of the ResNet50 architecture and the UNet framework. The UNet framework comprises convolutional layers, max pooling layers, ReLU activation functions, skip connections, and upsampling layers, often referred to as an encoder–decoder structure. In ResUNet, the encoder section is enhanced by the feature extraction capabilities of ResNet50, which deepens the network with multiple convolutional and normalization layers. The decoder portion remains consistent, restoring the dimensions of the original features through upsampling while maintaining skip connections between high-level and shallow semantic features, thereby enabling the network to incorporate more image information.
The fundamental modules of ResNet50 consist of two parts: the conv_block and the identity_block. The conv_block contains a convolutional block that utilizes a stride to reduce the dimensions of the feature map. Following this, the convolved features are aggregated with the residual connections and subjected to a ReLU activation, primarily used to adjust the size of channels and feature maps. The identity_block is designed to deepen the network and includes three convolutional layers with kernel sizes of 1 × 1, 3 × 3, and 1 × 1. After each convolutional layer, batch normalization and ReLU activation are sequentially applied. In the final convolutional layer, the input features are added to the convolved features before ReLU activation is performed. Based on these two modules and depending on the input parameters, convolutional layers and residual blocks of varying depths are stacked to produce feature maps of different scales. The overall architecture of ResNet50 is depicted in Figure 4.
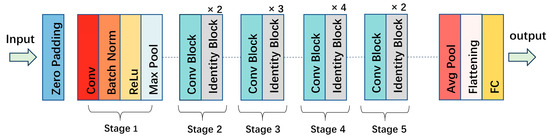
Figure 4.
ResNet50 structure.
2.5.2. SE Module
The SE attention mechanism module explicitly models the interdependencies between convolutional feature channels, thereby enabling the learning of attention weights for the input features. Furthermore, these learned weights are applied to the input features, enhancing their representational capacity and improving the network’s performance. The integration of the SE module serves to augment the network’s capacity for feature representation by introducing a channel attention mechanism. The module is primarily composed of two distinct sections, as shown in Figure 5.
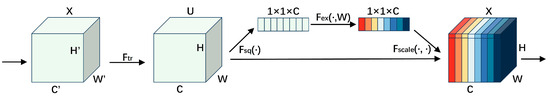
Figure 5.
SE attention mechanism module. Each color corresponds to different weight values in the 1 × 1 × C weight matrix.
- (1)
- Incorporation of Global Information: A global average pooling operation is performed using the build and call methods, which directly compresses the W × H × C feature map containing global information into a 1 × 1 × C feature vector Z. This compression process reduces the channel dimension from C to a single value, thereby mitigating the channel dependency problem. The input feature map is denoted by u, and (H, W, C) represents the width, height, and number of channels of the image, respectively. The compression operation is denoted by the symbol (Fsq), and the resulting output is designated as Z. The underlying computational formula is as follows:
In this equation, the coordinates i and j denote the spatial dimensions of the feature map.
- (2)
- Adaptive Correction: A nonlinear transformation is applied to the result after compression, which is achieved through global pooling, followed by two fully connected layers with a sigmoid activation function. The outcome serves as the weight for each channel. To enable nonlinear interactions between channels and perform feature recalibration, it is essential to learn how to leverage global information to selectively emphasize informative features and suppress less relevant ones. Let us denote the excitation operation as Fex and set the result as S to compute the following equation:
In this equation, the weights w, w1, and w2 refer to the values used in the fully connected layer. The terms σ and δ represent the sigmoid and ReLU activation functions, respectively.
- (3)
- Weighting Operation: The attention weights obtained in the previous step are multiplied by the corresponding channel feature weights to enhance the network’s capability for feature extraction. The weight multiplication operation is denoted by the symbol Fscale, where the weighted attention is the result S of the preceding step. The output X is then calculated using the following formula:
In this equation, Fscale (Uc, Sc) represents the corresponding channel product between the scalar Sc and the feature Uc, respectively.
2.5.3. SE-ResUNet Network
The SE-ResUNet network is a convolutional neural network based on the ResUNet network with the addition of the SE (Squeeze-and-Excitation) attention mechanism. The improved network structure is shown Figure 6. The network includes convolutional layers, normalization layers, pooling layers, residual connections, and skip connections. It features an encoder–decoder architecture, with SE modules added after each convolutional layer in the encoder. These SE modules perform global average pooling on each channel and dynamically adjust the weights of each channel through fully connected layers, compensating for feature information lost during the convolution process. Specifically, the SE module first performs global average pooling on each channel’s feature map, which can be seen as a “compression” of the feature map to extract the average feature information of each channel, thereby reflecting the overall characteristics of the channel. Next, these average values are passed through two fully connected layers, which serve to reduce the dimensionality of the feature information and restore the number of channels. Moreover, a weight value is assigned to each channel to dynamically adjust its importance, enhancing useful features while suppressing less important ones. Through this adaptive adjustment, the SE module enables the model to focus more on important features and ignore less relevant information. In this way, the model can better understand the details of the image and improve its accuracy in recognizing complex scenes such as cropland. Residual connections are also employed to facilitate gradient flow of extracted features, aiding in faster network convergence. These connections preserve part of the original input information, preventing the loss of important features during data transmission. The decoder retains the original UNet network structure, connecting with the feature extraction part through skip connections. It fuses high-resolution features from the encoder with subsequent low-resolution features, restoring image details. Compared to the original ResUNet network, the improved network extracts image features through the encoder and adjusts channel weights via the SE modules. During feature transmission, residual connections pass information to the next layer, preventing information loss. The decoder fuses encoder features with the upsampling process through skip connections, preventing network degradation and reducing the number of network parameters, ultimately yielding classification results. The SE modules enhance feature representation, allowing the network to focus on important features and suppress noise, while residual connections ensure robust feature transmission [34]. These characteristics make it effective in capturing the fragmented and irregular shapes of cropland in complex terrains [35].
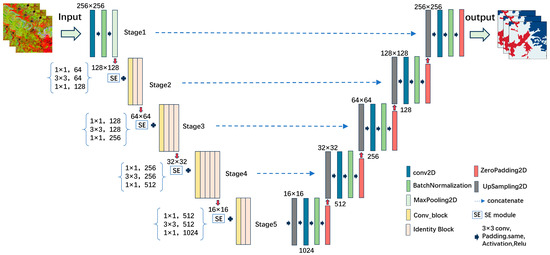
Figure 6.
SE-ResUNet network structure.
2.6. Classification of Topographic Indicators and Data Set Distribution
To verify the performance of the SE-ResUNet network under different topographic indices, the aspect and slope were calculated as two topographic factors based on the DEM (Digital Elevation Model) data. Since the resolution of the DEM data is 30 m, the calculated data need to be resampled to a 10 m resolution for the statistical analysis.
Based on the calculation results, the slope and aspect were categorized into five different levels to analyze the network’s performance in extracting cropland across different topographic levels. The slope classification followed common grading methods and were divided as follows: flat land (≤2°), gently sloping land (2~6°), moderately sloping land (6~15°), steeply sloping land (15~25°), and very steep land (≥25°). The aspect of slope was categorized to consider the impact of shading on cropland extraction, and was divided into the following five categories: flat slopes (−1), shaded slopes (0 to 45°, 315° to 360°), semi-shaded slopes (45° to 135°), sunny slopes (135° to 225°), and semi-sunny slopes (225° to 315°).
For slope, the training set and validation set exhibited distinct distributions (Figure 7). In the training set, moderately sloping land accounted for 41.93%, and gently sloping land accounted for 42.05%. Flat land made up 7.89%, steeply sloping land accounted for 5.58%, and very steep land accounted for 2.54%. In the validation set, moderately sloping land accounted for 40.88% and gently sloping land accounted for 43.25%. The remaining portions were 8.15% flat land, 5.28% steeply sloping land, and 2.44% very steep land. This distribution ensures the network’s performance evaluation across various slope conditions.
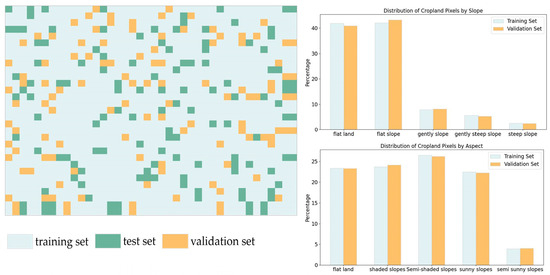
Figure 7.
The spatial distribution of the training set, validation set, and testing set in the study area.
Regarding aspect, the training and validation sets had similar distributions. In the training set, semi-shaded slopes accounted for 23.36%, sunny slopes accounted for 23.74%, and semi-sunny slopes accounted for 26.51%. Shaded slopes accounted for 22.47% and flat slopes accounted for 3.93%. In the validation set, semi-shaded slopes accounted for 23.32%, sunny slopes accounted for 24.16%, and semi-sunny slopes accounted for 26.24%. Shaded slopes accounted for 22.24% and flat slopes accounted for 4.03%. These data further validate the model’s performance under different lighting conditions.
2.7. Experimental Design and Precision Evaluation
2.7.1. Experimental Design
The experiment was conducted on a computer with the Windows 10.1 operating system. The programming environment was Python 3.8, with TensorFlow 2.7.0 used as the framework and CUDA 11.8 as the acceleration library. The computer configuration included an NVIDIA GeForce RTX 3050 graphics card and an Intel(R) Core (TM) i7-12700F 2.10GHz CPU. During training, the ReLU activation function and Adam optimizer were used, with a learning decay rate of 0.001, a batch size of 10, and 100 training epochs. An early stopping strategy was implemented to prevent overfitting, and the dice loss function was used as the loss function.
To comprehensively evaluate the proposed method’s performance in remote sensing extraction of cropland, three experiments were designed to validate the network’s performance and effectiveness. These experiments included feature fusion comparison, network structure comparison, and terrain condition comparison.
Feature fusion comparison experiment: Sample sets formed from different feature combinations were input into the SE-ResUNet network for training. The objective was to evaluate the impact of varying feature combinations on cropland extraction. Additionally, we aimed to assess the efficacy of these feature combinations for extracting cropland in mountainous regions using the SE-ResUNet network.
Network structure comparison experiment: The training of each network, using labels and original RGB images, was divided into two parts: common network comparison experiments and ablation experiments. The common network comparison experiment compared the SE-ResUNet network with Seg-HRNet [20] and SegNet [21], both of which have shown excellent performance in land classification tasks. The Seg-HRNet network, with its multiple parallel branches, fuses multi-resolution features and effectively integrates high- and low-resolution information, enhancing both network performance and the ability to capture semantic information. This also allows for more accurate preservation of the image’s spatial information, improving the accuracy of image segmentation. The SegNet network uses an encoder–decoder architecture to process image information. Its effectiveness in image segmentation tasks comes from upsampling feature maps using de-pooling in the decoder and retaining boundary feature information through skip connections.
The ablation experiments compared the UNet, SE-UNet, and ResUNet networks to verify the performance contributions of each module within the network. This was achieved by gradually removing the SE attention mechanism from SE-ResUNet and the residual modules from the original ResUNet network. The UNet network includes multiple convolutional and pooling layers that reduce the input image’s resolution and extract high-level features. Low-level and high-level features are connected to enhance network performance. The UNet structure is relatively simple, facilitating implementation and training, and it can effectively segment images of varying sizes. It exhibits a strong generalization ability, making it applicable to various types of image segmentation tasks. The SE-UNet network adds the SE attention mechanism after each convolutional block in the UNet network’s encoder and decoder, and maintains the same structure elsewhere. The ResUNet module replaces the initial encoder in the UNet network with the ResNet50 residual structure for feature extraction, while keeping the decoder unchanged to validate the role of the SE attention mechanism.
Terrain condition comparison experiment: The objective was to train various networks using the optimal feature combination sample set. Subsequently, the cropland extraction accuracy for each network at different slope grades and aspect levels was calculated. Finally, the performance of SE-ResUNet in extracting cropland in mountainous areas was compared and analyzed.
2.7.2. Precision Evaluation Method
For the cropland extraction results, the remote sensing images from the validation set were input into the trained network for prediction. The output results were then reclassified into cropland and non-cropland (green vegetation and others), with the corresponding labels undergoing the same operation. The accuracy of the cropland extraction results was assessed using overall accuracy, F1-scores, Kappa coefficients, and Intersection over Union (IoU).
- (1)
- Overall Accuracy
Overall Accuracy (OA) is the proportion of correctly predicted pixels out of the total number of pixels, which indicates the overall classification precision.
In this equation, TP represents the number of true positives, which are images correctly identified as cropland, TN represents the number of true negatives, which are images correctly identified as non-cropland, FP represents the number of false positives, which are images incorrectly classified as cropland, and FN represents the number of false negatives, which are images incorrectly classified as non-cropland.
- (2)
- F1-Score
There is generally an inverse relationship between precision and recall, and these two metrics are interdependent. The F1-score can be used to balance the relative importance of precision and recall. A higher F1-score signifies better performance.
In this equation, the precision, represented by the formula P = TP/(TP + FP), and the recall, represented by the formula R = TP/(TP + FN), are used to calculate the F1-score, which indicates the classification’s quality. A higher F1-score signifies a higher accuracy of the classification.
- (3)
- Kappa Factor
Kappa coefficients are used to assess the accuracy of classification and are a standard metric in remote sensing image classification assessments.
In this equation, Po represents the proportion of samples that were correctly predicted, which is the overall classification accuracy. Pe represents the sum of the products of the number of true samples for each category and the number of predicted samples, divided by the square of the total number of samples.
- (4)
- Intersection of Union
The Intersection of Union (IoU) is a commonly used metric for evaluating the segmentation performance of deep learning networks. It quantifies the ratio of the intersection to the union of a network’s predicted outcomes and the actual values for a given category.
3. Results
3.1. Comparison of Extraction Results of Cropland with Different Feature Combinations
To evaluate the contribution of the different features to cropland extraction, we first calculated the importance of each feature. The results of the feature importance calculation are presented in Table 1. These results helped us better understand which features play a key role in cropland extraction and provide a basis for the subsequent feature combination schemes.

Table 1.
The importance of each feature.
According to the results of the feature importance calculations, the importance of SAR features was higher than that of the VH and VV bands, and it had the highest importance among all features. Therefore, each feature combination included the SAR feature as a fixed element, with the remaining features being paired with vegetation indices and topographic features.
The JM distances calculated for the five sets of fused images are shown in Table 2. It can be seen that among the five feature combination schemes, the JM distances between cropland and green vegetation were all above 1.9, indicating excellent separability between the samples. The JM distances between cropland and other land types were between 1.4 and 1.5, which can be considered to have good separability between the samples. The five feature combinations served as a basis for comparison to assess the impact of different feature combinations.
Table 2.
JM distance for each feature combination.
Based on the feature combination schemes, cropland was extracted using the SE-ResUNet network and the results are shown in Table 3. From the results, it can be seen that the extraction of cropland after training with the five feature fusion images had high accuracy. Among the four feature combination schemes, Scheme III (NDVI + TRI + SAR) had the best classification effect, with an Overall Accuracy (OA) of 96.98%, a Kappa coefficient of 96.89%, an F1-score for cropland of 96.25%, and an Intersection over Union (IoU) of 92.78%. The RGB remote sensing images had the lowest accuracy, with an OA of 95.98%, a Kappa coefficient of 94.89%, an F1-score for cropland of 95.42%, and an IoU of 91.12%. The performance differences between Scheme I to Scheme IV were not significant, indicating that the feature fusion of topography, SAR, and vegetation indices effectively improved the accuracy of cropland extraction in mountainous areas.
Table 3.
Comparison of cropland extraction results of various feature combination schemes using SE-ResUNet network.
Figure 8 shows the classification effects on the feature combination images. Feature fusion can enhance the distinction between green vegetation, cropland, and other land types, providing richer land object information and reducing the sensitivity to lighting and weather conditions. From the cropland extraction effects using different feature fusion images, in the first group of images, for RGB, the images in (a) and (d) show instances in Area A where non-cropland was misidentified as cropland, leading to confused land object boundaries. In (a) and (d), Area B lost some detail information compared to the labels, with incomplete contours, while (b) shows better recognition effects in both Areas A and B. In the second group of images, for RGB, in (a), (b), and (d), there are instances in Areas C and D where cropland was misidentified as non-cropland, with a few debris patches appearing while the details recognized in (c) were more complete and closer to the shape of the actual land objects in the labels. In the third group of images, (b) shows better recognition effects. Overall, the land object boundaries extracted by the SE-ResUNet network were clear, with few debris patches and land object adhesions, resulting in good recognition effects. The feature combination images performed well in recognizing complex land object shapes. Compared to RGB images, the feature combination images had clearer details at the edges and fewer deformations in the extraction results.
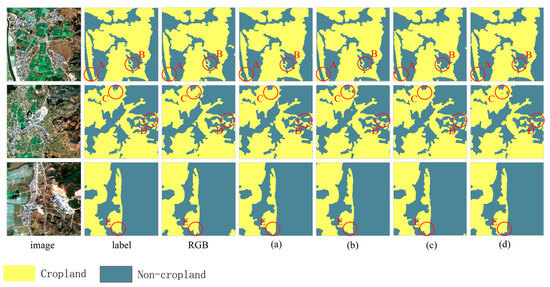
Figure 8.
Schematic of the effect of cropland extraction for each feature combination scheme: (a) NDVI + Slope + SAR; (b) EVI + Slope + SAR; (c) NDVI + TRI + SAR; (d) EVI + TRI + SAR. In these subfigures, the same letter (A, B, C, D, E) across different schemes indicates the same area of analysis.
By comprehensively evaluating the four schemes based on extraction accuracy and effects, Scheme III was found to have the highest accuracy in cropland recognition and it also showed good extraction effects. Therefore, Scheme III was selected as the training images for the topographic condition comparison experiment.
3.2. Comparison of Cropland Extraction Results from SE-ResUNet and Common Deep Learning Networks
After training the Seg-HRNet, SegNet, UNet, SE-UNet, ResUNet, and SE-ResUNet networks with processed labels and original RGB-band image data, the following six metrics were calculated: overall accuracy, Kappa coefficient, F1-score, IoU, number of parameters, and training time. The results are presented in Table 4.
Table 4.
Comparison of cropland extraction results from SE-ResUNet and other network structures.
In comparison to Seg-HRNet and SegNet, SE-ResUNet demonstrated a significant accuracy advantage, with a rate exceeding 90%. The SE-ResUNet network achieved an OA, Kappa, F1-score, and IoU of 95.98%, 94.89%, 95.42%, and 91.12%, respectively. The overall accuracy (OA) was 6.2% and 4.41% higher than that of Seg-HRNet and SegNet, respectively. The Kappa coefficient was 6.14% and 4.03% higher, and the F1-score was 8.21% and 5.96% higher, respectively. The Intersection over Union (IoU) was 13.8% and 10.19% higher than that of Seg-HRNet and SegNet, respectively.
The ablation study results showed that the SE-ResUNet structure achieved the highest accuracy. The UNet network, without the SE attention mechanism and residual module, saw a 1.58% decrease in overall accuracy, a 0.8% decrease in the Kappa coefficient, and reductions of 2.36% and 4.1% in the F1-score and IoU, respectively. The SE-UNet network lacking the ResNet50 residual structure showed a 1.25% decrease in overall accuracy, a 0.44% decrease in the Kappa coefficient, a 1.97% decrease in the F1-score, and a 3.41% decrease in IoU. The ResUNet network without the SE attention mechanism showed a 3.53% decrease in overall accuracy, a 3% decrease in the Kappa coefficient, a 3.69% decrease in the F1-score, and an 8.09% decrease in IoU. The SE-UNet network with the incorporation of the SE attention mechanism showed a notable reduction in the discrepancy between each index and the SE-ResUNet network compared to the original UNet network. In summary, the integration of the SE module and the ResUNet structure facilitates the integration of feature information across layers, enabling the learning of more complex features and enhancing the network’s accuracy and the model’s capacity for feature expression.
The SE-ResUNet network had a relatively low number of parameters but required the longest training time. However, the extended training time is justifiable given the accuracy the model can achieve.
Three images were selected for the comparative analysis to illustrate the impact of each network on cropland extraction. The results are presented in Figure 9. It is evident that all six networks demonstrated varying degrees of responsiveness to the distribution of cropland within the study area. In the first set of images, all the networks except SE-ResUNet tended to incorrectly identify non-cropland as cropland. This is evident at points A and B, which also show that the other networks had more fragmented patches and less accurate feature recognition. Notably, the Seg-HRNet network exhibited discernible jaggedness in its extracted features, accompanied by a lack of clarity in edge details. In contrast, the SE-ResUNet network demonstrated a clear and comprehensive ability to recognize both cultivated land and non-cropland, with minimal missing components, negligible disconnection, and complete segmentation at the boundary. In the second set of images, the four networks of Seg-HRNet, SegNet, UNet, and SE-UNet showed notable deficiencies in nulling at D. The ResUNet network showed enhanced clarity at D, although there was an instance of misclassifying non-cropland as cropland at C. SE-ResUNet stood out as a notable performer in discerning land classes. In the third set of images where cropland is intermingled with non-cropland and the plot shape is irregular, a comparison of images E and F reveals that the remaining five networks failed to accurately identify feature boundaries, resulting in misclassifications and omissions. In contrast, the SE-ResUNet network demonstrated a superior ability to recognize features that closely align with the shapes outlined in the labels. In conclusion, the SE-ResUNet network clearly and seamlessly recognized feature boundaries, effectively preventing the formation of fragmented patches and voids, and showed significant superiority in the extraction of cropland features.
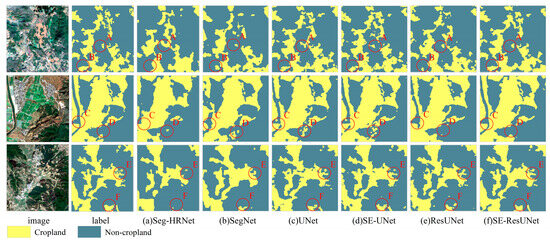
Figure 9.
Extracted cropland effect of each deep learning network: (a) Seg-HRNet; (b) SegNet; (c) UNet; (d) SE-UNet; (e) ResUNet; (f) SE-ResUNet. In these subfigures, the same letters (A, B, C, D, E, F) across different networks indicate the same area of analysis.
3.3. Performance Analysis of SE-ResUNet on Mountainous Cropland Extraction
Before conducting the model performance analysis, it was necessary to have a basic understanding of the terrain and cropland distribution in the study area. According to our analysis, in 2022, cropland accounted for 38.54% of the total area in the study region. Areas with slopes between 6° and 15° make up 46.34% of the study area, while regions with slopes of 15° or more account for 15.74%. These data provide important background information for the subsequent model performance analysis.
Based on the feature fusion images of Scheme III, the cropland with the same range as the label was predicted for the fall of 2022, and the overall accuracy of SE-ResUNet and the other networks was calculated under different terrain classifications.
The results of the slope aspect classification are shown in Table 5. It can be seen that the identification accuracy for sunny slopes and semi-sunny slopes was relatively high, indicating that the lighting conditions in these two areas are good and the image quality is high, making them easier to identify. The identification accuracy for flat slopes was relatively low, possibly because there are fewer and more scattered flat slopes in the study area, and their proportion among all slope aspects is relatively low, resulting in less stable extracted features and a lower identification accuracy compared with the other slope aspects. The identification accuracy for shaded slopes was lower than that of semi-shaded slopes, indicating that shadows and lighting conditions had a significant impact on the classification of complex terrain areas. The SE-ResUNet network had a higher identification accuracy, with a more balanced accuracy across the different slope aspects. Except for flat slopes, the identification accuracy reached over 91%, indicating that it can better utilize the information from feature fusion images.
Table 5.
Comparison of cropland extraction accuracy of each deep learning network under different slope aspects.
The comparison of cropland extraction accuracy for the different networks across different slope types is shown in Table 6. It can be seen that among the five slope types, the identification accuracy for flat land and flat sloped land was the highest, with flat sloped land producing a higher accuracy than flat land. As the slope gradient increased, the accuracy of cropland identification by all the networks decreased. In steep-slope land, only the SE-ResUNet network achieved an accuracy of over 80% in cropland identification. This may be because in areas with steep slopes, the edges of land features overlap, affecting the accuracy and completeness of feature information extraction and leading to information loss. However, the results still showed that the SE-ResUNet network had was significantly better at identifying cropland in areas with steep slopes compared to the other networks, indicating that it has good performance in cropland extraction in mountainous regions.
Table 6.
Cropland extraction results for each deep learning network with different slopes.
To provide a more intuitive representation of these results, we included a map in Figure 10 showing the distribution of cropland extracted by the SE-ResUNet network across the different slopes and aspects. This map clearly illustrates the overall distribution of cropland in the study area in 2022, as well as the distribution characteristics of cropland across the different slopes and aspects.
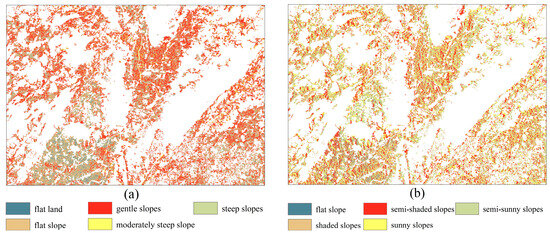
Figure 10.
Cropland distribution extracted by SE-ResUNet: (a) slope-based distribution; (b) aspect-based distribution.
4. Discussion
The feature combination comparison experiment (Table 3) shows that integrating vegetation index, terrain features, and SAR features significantly improves the precision of remote sensing for cropland extraction in mountainous areas. Among the tested combinations, the integration of the NDVI, terrain index, and SAR polarization features provided the highest accuracy. This outcome as attributed to the unique properties of each feature. The vegetation index indicates the vegetation growth status and coverage extent, partially mitigating the effects of shadows, topography, and atmosphere. Topographic features reflect terrain variations by highlighting differences in elevation and slope. SAR features, unaffected by light and weather, can effectively mitigate the effects of shadows and clouds. This study confirmed that, while deep learning networks can discern multi-scale spatial features, the input images from diverse feature combinations significantly influence their extraction performance.
In terms of network structure, the SE-ResUNet network, which integrates the SE module into the ResUNet framework, was shown to improve the precision of mountainous cropland delineation. The SE module dynamically adjusts channel weights, and ResUNet connects shallow and deep features, enhancing the network’s feature utilization efficiency. The comparative experiments showed that the SE-ResUNet network produces stable and excellent results using RGB images and across six feature groups. The results from Table 4, Table 5 and Table 6indicate that the SE-ResUNet network effectively extracts cropland across all feature combinations, with superior overall and terrain classification performance. This suggests that the network is suitable for land use classification in complex terrains and for image segmentation tasks involving complex textures and diverse elements. However, further experimental validation is needed.
The research by Jianping Pan et al. demonstrated that the combination of SAR and optical imagery in deep learning can achieve better results in cloudy and rainy mountainous areas [36], which is consistent with the conclusions of this study. This consistency can be attributed to the fact that SAR imagery is unaffected by light and weather conditions, effectively reducing the interference of shadows and clouds. Similarly, the SE-ResUNet network, which is more commonly used for segmentation tasks in medical imaging, has shown promise in land cover classification tasks. For instance, studies have shown that the SE-ResUNet network introduces a channel attention mechanism with residual structure during downsampling and learns the skip connections of UNet for multi-scale feature extraction and supplementation. These characteristics enhance the network’s ability to extract the features of small-volume, fragmented objects, which is crucial for identifying small cropland plots in complex terrains [34]. Additionally, by bilinearly interpolating the SE-ResUNet module into the downsampling and upsampling processes of the UNet model, this method can reduce the impact of unavoidable factors such as noise, thereby improving segmentation accuracy and clarity [35]. This further confirms that the SE-ResUNet network can effectively identify fragmented plots in complex terrain areas. In this study’s complex terrain area, cropland plots are often small and fragmented, and the characteristics of the SE-ResUNet network enable it to more effectively identify these plots.
Although the proposed method shows satisfactory precision in identifying mountainous cropland, the study has limitations requiring further research. The study’s limitations include the following: firstly, the remote sensing features considered were limited to three categories—vegetation index, topography, and SAR, with each category only including some features and omitting others like texture and phenology. Future research could examine the performance of SE-ResUNet in more detail when applied to a wider range of feature combinations. Secondly, to ensure the area’s continuity and terrain diversity, the samples were concentrated in a rectangular area, which may introduce some bias in accuracy when applied elsewhere. But, since all terrain types are represented in the study area, any deviations are likely to be minimal. Future evaluations can assess the method’s efficacy across a broad area using the established cropland extraction methodology. Compared to other networks, the SE-ResUNet network in this study had fewer parameters but the longest training time. Thus, further optimization of the training method is needed to improve the network performance.
5. Conclusions
This study aimed to address the low precision in remote sensing extraction of mountainous cropland due to factors such as terrain, geomorphology, mountain shadows, and clouds. To address this, we proposed a deep learning-based remote sensing extraction method for mountainous cropland. The method uses feature combinations to enhance the discriminative capacity of mountainous cropland, integrating these features into a three-channel image for input into the deep learning network. Additionally, we developed the SE-ResUNet network by integrating the SE module into the ResUNet network, enhancing its ability to extract multi-scale spatial features. From the analysis and discussion of the results from the feature combination comparison experiments, network structure comparison experiments, and terrain grading comparison experiments, the following conclusions were drawn:
- (1)
- Feature combination significantly influences the results of deep learning-based remote sensing extraction of mountainous cropland. Integrating vegetation indices, terrain features, and SAR features effectively enhances the precision of remote sensing extraction of mountainous cropland. The NDVI, TRI, and SAR polarization combination achieved the highest accuracy, with an OA of 96.98%, an F1-score of 96.25%, and an IoU of 92.78%.
- (2)
- The SE-ResUNet network effectively extracted cropland from remote sensing feature fusion images, outperforming other networks. The ablation experiments showed notable improvements, with the OA, Kappa, F1-score, and IoU values increasing by 3.53%, 3.00%, 3.69%, and 8.09%, respectively, compared to ResUNet.
- (3)
- The SE-ResUNet network using the optimal feature combination fusion images had high identification accuracy across different slopes and aspects. In shaded areas such as shaded slopes and semi-shaded slopes, the accuracy of cropland extraction was comparable to that of other aspects. Moreover, it demonstrated excellent performance in areas with steep slopes, indicating that the model is well-suited for land classification in mountainous regions.
In conclusion, the proposed method mitigates the impact of mountain shadows, topography, and clouds on the extraction of cropland in mountainous regions, enhancing the efficacy of remote sensing-based extraction of cropland in such areas. The methodology presented in this paper can be extended to other studies of land cover classification, including the extraction of cropland. Future research could explore a greater number of feature combinations, larger study areas, and more effective network training methods to enhance the applicability and performance of the method proposed in this paper.
Author Contributions
Conceptualization, J.W.; methodology, L.X.; software, S.S.; validation, H.Z.; formal analysis, Q.M.; investigation, Y.H.; resources, L.X.; data curation, L.X.; writing—original draft preparation, L.X.; writing—review and editing, J.W.; visualization, L.X.; supervision, K.Y.; project administration, K.Y.; funding acquisition, J.W. All authors have read and agreed to the published version of the manuscript.
Funding
This work was supported by the National Natural Science Foundation of China (grant No. 41961056) and the Yunnan Province high-level Talent Training Support Program (grant No. YNWR-QNBJ-2020-053).
Data Availability Statement
The data generated and analyzed during this study are currently not publicly available as they are being used to support ongoing and future research projects. However, the data may be made available upon reasonable request to the corresponding author, subject to appropriate data use agreements and ethical considerations. (Name of code: Remote Sensing Image Extraction of Cropland. Developer: Ling Xiao. Contact details: School of Faculty of Geography, Yunnan Normal University, Kunming, Yunnan Province, 650500, P. R. China. Email: 18468134138@163.com. Year first available: 2024. Hardware required: Computer with an NVIDIA GeForce RTX 3050 graphics card and an Intel(R) Core(TM) i7-12700F 2.10GHz CPU. Required software: PyCharm Community Edition and the tensorflow 2.7.0, opencv 4.6.0, and numpy 1.23.4 packages. Programming language: Python 3.8. How to access the source code: the source files for the Remote Sensing Image Extraction of Cropland can be downloaded from github: https://github.com/lingxiao2333/Remote-Sensing-Image-Extraction-of-Cropland, accessed on 6 September 2024).
Conflicts of Interest
The authors declare no conflicts of interest.
References
- Sui, H.; Wang, J.; Hua, L.; Duan, Z.Q.; Xu, G. Review on the Status and Methods of Remote Sensing Farmland Monitoring. Guangxi Sci. 2022, 29, 1–12. [Google Scholar]
- Zhao, Z.; Wang, J.; Wang, L.; Rao, X.; Ran, W.; Xu, C. Monitoring and analysis of abandoned cropland in the Karst Plateau of eastern Yunnan, China based on Landsat time series images. Ecol. Indic. 2022, 146, 109828. [Google Scholar] [CrossRef]
- Liu, Z.; Guo, J.; Li, C.; Wang, L.; Gao, D.; Bai, Y.; Qin, F. Effective Cultivated Land Extraction in Complex Terrain Using High-Resolution Imagery and Deep Learning Method. Remote Sens. 2025, 17, 931. [Google Scholar] [CrossRef]
- Ma, Y.; Wang, J.; Xiong, J.; Sun, M.; Wang, J. Risk assessment for cropland abandonment in mountainous area based on AHP and PCA—Take Yunnan Province in China as an example. Ecol. Indic. 2023, 158, 111287. [Google Scholar] [CrossRef]
- Xu, C.; Wang, J. Extraction of abandoned land in Zhaotong City based on Landsat8 remote sensing image. In Proceedings of the International Conference on Geographic Information and Remote Sensing Technology (GIRST 2022), Kunming, China, 16–18 September 2022; pp. 676–683. [Google Scholar]
- Xiong, J.; Thenkabail, P.S.; Gumma, M.K.; Teluguntla, P.; Poehnelt, J.; Congalton, R.G.; Yadav, K.; Thau, D. Automated cropland mapping of continental Africa using Google Earth Engine cloud computing. ISPRS J. Photogramm. Remote Sens. 2017, 126, 225–244. [Google Scholar] [CrossRef]
- Li, X.; Jiang, Q. Extraction of farmland classification based on multi-temporal remote sensing data. Trans. Chin. Soc. Agric. Eng. 2015, 31, 145–150. [Google Scholar]
- Tseng, M.-H.; Chen, S.-J.; Hwang, G.-H.; Shen, M.-Y. A genetic algorithm rule-based approach for land-cover clas-sification. ISPRS J. Photogramm. Remote Sens. 2008, 63, 202–212. [Google Scholar] [CrossRef]
- Wang, D.; Cao, W.; Zhang, F.; Li, Z.; Xu, S.; Wu, X. A Review of Deep Learning in Multiscale Agricultural Sensing. Remote Sens. 2022, 14, 559. [Google Scholar] [CrossRef]
- Dou, P.; Shen, H.; Huang, C.; Li, Z.; Mao, Y.; Li, X. Large-scale land use/land cover extraction from Landsat imagery using feature relationships matrix based deep-shallow learning. Int. J. Appl. Earth Obs. Geoinf. 2024, 129, 103866. [Google Scholar] [CrossRef]
- Xu, W.; Deng, X.; Guo, S.; Chen, J.; Sun, L.; Zheng, X.; Xiong, Y.; Shen, Y.; Wang, X. High-Resolution U-Net: Preserving Image Details for Cultivated Land Extraction. Sensors 2020, 20, 4064. [Google Scholar] [CrossRef]
- Wang, Z.; Wang, J.; Yang, K.; Wang, L.; Su, F.; Chen, X. Semantic segmentation of high-resolution remote sensing images based on a class feature attention mechanism fused with Deeplabv3+. Comput. Geosci. 2022, 158, 104969. [Google Scholar] [CrossRef]
- Lu, H.; Fu, X.; Liu, C.; Li, L.-G.; He, Y.-X.; Li, N.-W. Cultivated land information extraction in UAV imagery based on deep convolutional neural network and transfer learning. J. Mt. Sci. 2017, 14, 731–741. [Google Scholar] [CrossRef]
- Chen, G.; Sui, X.; Kamruzzaman, M. Agricultural remote sensing image cultivated land extraction technology based on deep learning. Rev. Técnica La Fac. Ing. Univ. Zulia 2019, 9, 2199–2209. [Google Scholar]
- Yang, J.; Xu, J.; Lv, Y.; Zhou, C.; Zhu, Y.; Cheng, W. Deep learning-based automated terrain classification using high-resolution DEM data. Int. J. Appl. Earth Obs. Geoinf. 2023, 118, 103249. [Google Scholar] [CrossRef]
- Li, H.; Xie, Y.; Yu, L.; Wang, L. A Study on the Land Cover Classification of Arid Region Based on Multi-temporal TM Images. Procedia Environ. Sci. 2011, 10, 2406–2412. [Google Scholar] [CrossRef][Green Version]
- Zhou, T.; Pan, J.; Han, T.; Wei, S. Planting area extraction of winter wheat based on multi-temporal SAR data and optical imagery. Trans. Chin. Soc. Agric. Eng. 2017, 33, 215–221. [Google Scholar]
- Liu, W.; Wang, J.; Luo, J.; Wu, Z.; Chen, J.; Zhou, Y.; Sun, Y.; Shen, Z.; Xu, N.; Yang, Y. Farmland Parcel Mapping in Mountain Areas Using Time-Series SAR Data and VHR Optical Images. Remote Sens. 2020, 12, 3733. [Google Scholar] [CrossRef]
- Zhong, L.; Hu, L.; Zhou, H. Deep learning based multi-temporal crop classification. Remote Sens. Environ. 2019, 221, 430–443. [Google Scholar] [CrossRef]
- Li, Z.; Chen, S.; Meng, X.; Zhu, R.; Lu, J.; Cao, L.; Lu, P. Full Convolution Neural Network Combined with Contextual Feature Representation for Cropland Extraction from High-Resolution Remote Sensing Images. Remote Sens. 2022, 14, 2157. [Google Scholar] [CrossRef]
- Persello, C.; Tolpekin, V.; Bergado, J.; de By, R. Delineation of agricultural fields in smallholder farms from satellite images using fully convolutional networks and combinatorial grouping. Remote Sens. Environ. 2019, 231, 111253. [Google Scholar] [CrossRef]
- Chen, J.; Wang, C.; Ma, Z.; Chen, J.; He, D.; Ackland, S. Remote Sensing Scene Classification Based on Convolutional Neural Networks Pre-Trained Using Attention-Guided Sparse Filters. Remote Sens. 2018, 10, 290. [Google Scholar] [CrossRef]
- Liu, S.; Liu, L.; Xu, F.; Chen, J.; Yuan, Y.; Chen, X. A deep learning method for individual arable field (IAF) extraction with cross-domain adversarial capability. Comput. Electron. Agric. 2022, 203, 113694–113704. [Google Scholar] [CrossRef]
- Li, L.; Chen, Z.; Ma, Y.; Liu, L. A Lightweight High-Resolution Remote Sensing Image Cultivated Land Extraction Method Integrating Transfer Learning and SENet. IEEE Access 2024, 12, 113694–113704. [Google Scholar] [CrossRef]
- Zhang, X.; Cheng, B.; Chen, J.; Liang, C. High-Resolution Boundary Refined Convolutional Neural Network for Automatic Agricultural Greenhouses Extraction from GaoFen-2 Satellite Imageries. Remote Sens. 2021, 13, 4237. [Google Scholar] [CrossRef]
- Diakogiannis, F.I.; Waldner, F.; Caccetta, P.; Wu, C. ResUNet-a: A deep learning framework for semantic segmen-tation of remotely sensed data. ISPRS J. Photogramm. Remote Sens. 2020, 162, 94–114. [Google Scholar] [CrossRef]
- Yang, J.; Huang, X. The 30 m annual land cover dataset and its dynamics in China from 1990 to 2019. Earth Syst. Sci. Data 2021, 13, 3907–3925. [Google Scholar] [CrossRef]
- Waldner, F.; Diakogiannis, F.I. Deep learning on edge: Extracting field boundaries from satellite images with a convolutional neural network. Remote Sens. Environ. 2020, 245, 111741. [Google Scholar] [CrossRef]
- da Silva, V.S.; Salami, G.; da Silva, M.I.O.; Silva, E.A.; Junior, J.J.M.; Alba, E. Methodological evaluation of vegetation indexes in land use and land cover (LULC) classification. Geol. Ecol. Landscapes 2019, 4, 159–169. [Google Scholar] [CrossRef]
- Liang, X.; Jin, X.; Yang, X.; Xu, W.; Lin, J.; Zhou, Y. Exploring cultivated land evolution in mountainous areas of Southwest China, an empirical study of developments since the 1980s. Land Degrad. Dev. 2020, 32, 546–558. [Google Scholar] [CrossRef]
- Meng, H.; Li, C.; Liu, Y.; Gong, Y.; He, W.; Zou, M. Corn Land Extraction Based on Integrating Optical and SAR Remote Sensing Images. Land 2023, 12, 398. [Google Scholar] [CrossRef]
- Mu, Y.; Wu, M.; Niu, Z.; Huang, W.; Yang, J. Method of remote sensing extraction of cultivated land area under complex conditions in southern region. Remote Sens. Technol. Appl. 2020, 35, 1127–1135. [Google Scholar]
- Xu, W.; Lan, Y.; Li, Y.; Luo, Y.; He, Z. Classification method of cultivated land based on UAV visible light remote sensing. Int. J. Agric. Biol. Eng. 2019, 12, 103–109. [Google Scholar] [CrossRef]
- Yang, J.; Lu, Y.; Zhang, Z.; Wei, J.; Shang, J.; Wei, C.; Tang, W.; Chen, J. A Deep Learning Method Coupling a Channel Attention Mechanism and Weighted Dice Loss Function for Water Extraction in the Yellow River Basin. Water 2025, 17, 478. [Google Scholar] [CrossRef]
- Zang, L.; Liang, W.; Ke, H.; Chen, F.; Shen, C. Research on liver cancer segmentation method based on PCNN image processing and SE-ResUnet. Sci. Rep. 2023, 13, 12779. [Google Scholar] [CrossRef]
- Pan, J.; Qi, C.; Zhang, H.; Hu, Y.; Ren, Z.; He, Z.; Wang, X.; Li, Y.; Wang, Y.; Xie, J. KDANet: A farmland extraction network using band selection and dual attention fusion—A case study of paddy fields and irrigated land in Qingtongxia, China. Geocarto Int. 2025, 40, 2465518. [Google Scholar] [CrossRef]
Disclaimer/Publisher’s Note: The statements, opinions and data contained in all publications are solely those of the individual author(s) and contributor(s) and not of MDPI and/or the editor(s). MDPI and/or the editor(s) disclaim responsibility for any injury to people or property resulting from any ideas, methods, instructions or products referred to in the content. |
© 2025 by the authors. Licensee MDPI, Basel, Switzerland. This article is an open access article distributed under the terms and conditions of the Creative Commons Attribution (CC BY) license (https://creativecommons.org/licenses/by/4.0/).