Article

How Does the Scale and Functional Diversity of the Innovation Cooperation Network Affect Local Innovation? Township-Level Evidence from Beijing

1
College of Architecture and Urban Planning, Beijing University of Technology, Beijing 100124, China
2
Beijing Tsinghua Tongheng Urban Planning and Design Institute, Holistic Research and Planning Branch of THUPDI, Beijing 100085, China
*
Author to whom correspondence should be addressed.
Land 2025, 14(5), 1115; https://doi.org/10.3390/land14051115
Submission received: 28 April 2025 / Revised: 11 May 2025 / Accepted: 14 May 2025 / Published: 20 May 2025
(This article belongs to the Section Land Socio-Economic and Political Issues)

Abstract

The innovation cooperation network (ICN) drives innovation. However, how its network diversity affects local innovation needs further exploration. This paper examines the effects of ICN’s scale and functional diversity on local innovation. Employing the township-level co-invention network in Beijing, we analyze the evolution of the scale and functional diversity from 2010 to 2020, and explore their impacts, as well as the effects of their interaction, on local innovation. Moreover, the relationship between network and Jacobs’ diversity is further discussed. The results show that the township-level scale and functional diversity of the ICN in Beijing have increased by over 40%, accompanied by a transformation in the core–periphery distribution pattern. Both scale and functional diversity significantly contribute to local innovation, but manifest as inverted-U relationships, and they substitute for each other in promoting innovation. Furthermore, a substitution effect also exists between network and Jacobs’ diversity, though not robustly. Research highlights the role of scale and functional diversity in the ICN. It emphasizes that local governments need to conduct more precise management and adjustments in light of the heterogeneity of network connections in different scales and sectors within the ICN, in order to boost local innovation and foster regional development.

1. Introduction

Factors fostering innovation constitute an interdisciplinary research agenda wherein diversity is a prominent theme [1]. Recent studies have highlighted the role of diversity in promoting innovation. Fundamental to the ability of diversity to foster innovation is the ability to provide access to knowledge, resources, and technology, hence creating knowledge externalities [2]. The knowledge base view (KBV) proposes the importance of knowledge for innovation participants. However, diversity challenges knowledge absorption and network management capabilities. Transaction cost theory, for example, states that innovators tend to favor lower costs. The study of knowledge diversity externalities originates mostly from research on Jacobs’ externalities. Jacobs posited that the most important source of knowledge spillovers comes from outside the industry in which the firm operates [3]. Jacobs’ externalities refers to urbanization economies as one type of agglomeration economy [4]. Her theory emphasizes that industry diversity within a geographic region promotes knowledge externalities and fosters innovative activity and economic growth [5]. Beaudry and Schiffauerova summarize various types of Jacobs’ externalities measures [6]: the Hirschman–Helfendahl Index (HHI), employment in other industries, the Gini coefficient, the total regional population, total regional employment, etc. The HHI is the most commonly used [7]. Empirical evidence for Jacobs’ diversity remains an interesting topic.
Another category of the literature is network externalities [8,9,10]. The rise of networks can be traced back to Castells’ proposal of ‘space of flows’ [11]. He pointed out that the space of flows is the spatial logic of globalization, in which power and functioning derive from networked exchanges (capital, data, technology), rather than from fixed territories. In this context, access to networks becomes more important than the locational attributes of a particular place [
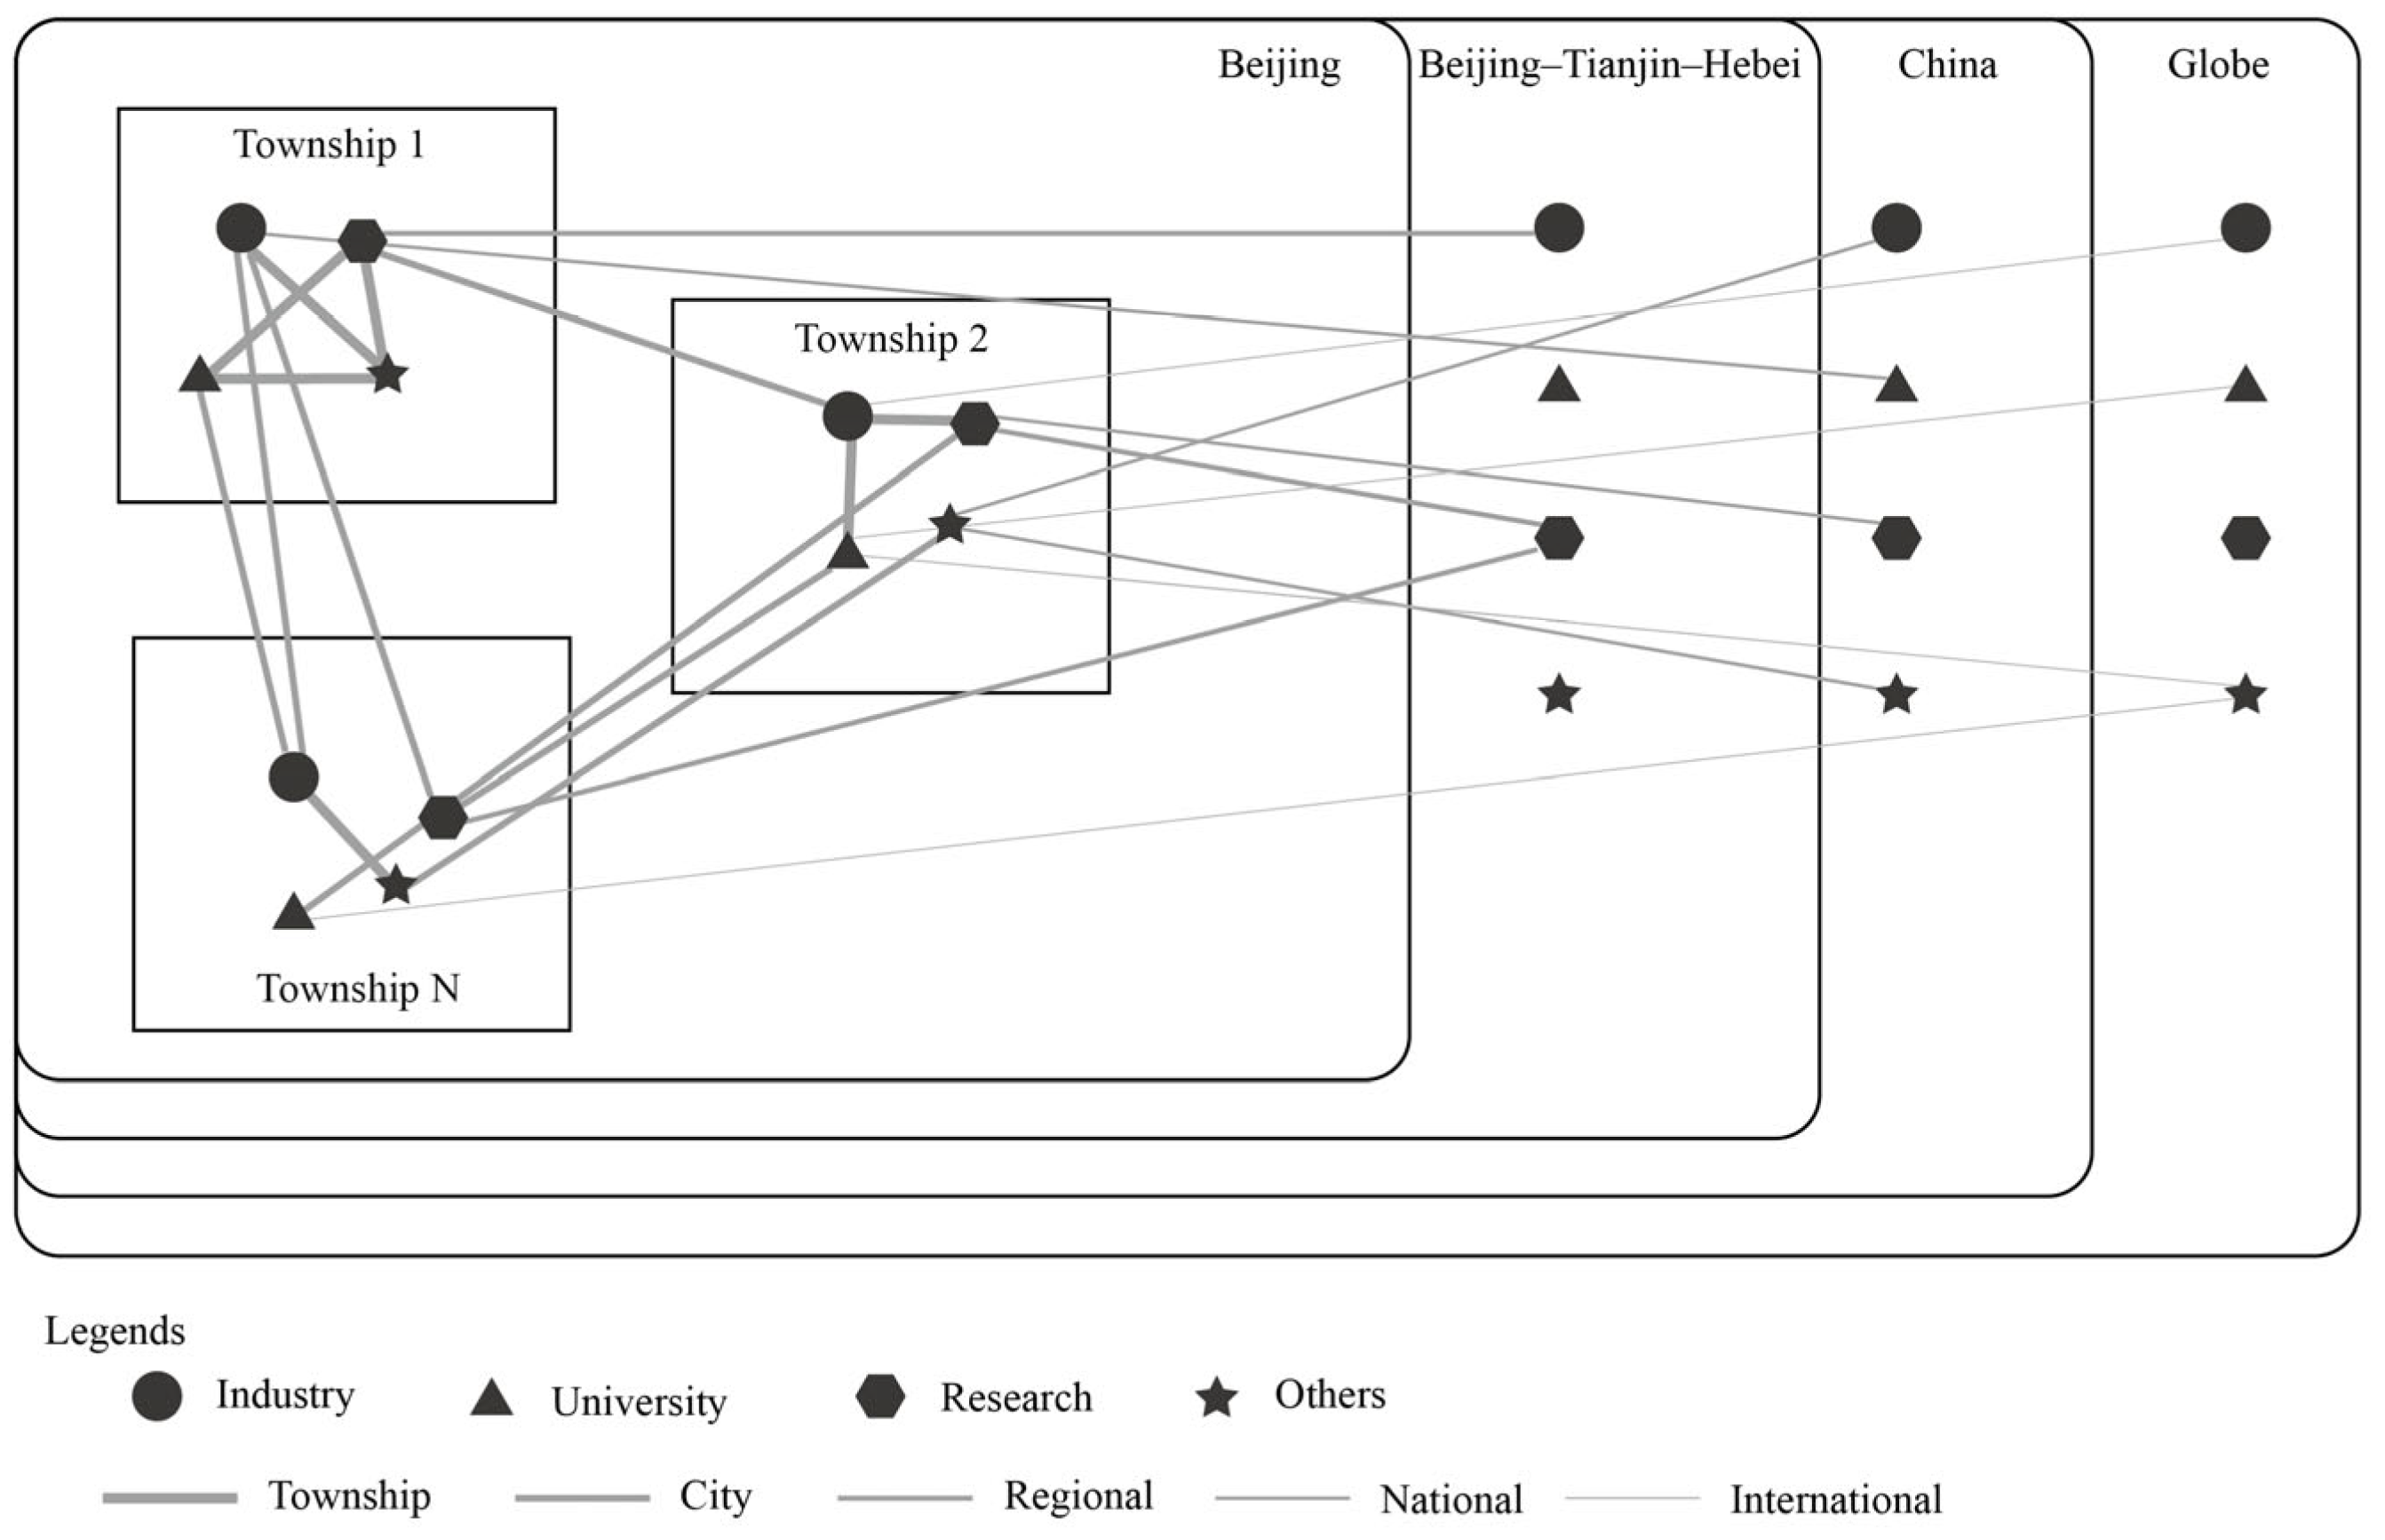
12]. Knowledge is a crucial component in the flow of innovation. Participants in innovation connect to suitable partners in order to access external knowledge. All participants and their inter-connections form a network. An innovation cooperation network (ICN) consists of network nodes, such as individuals, organizations, cities, regions, and countries, and network connections, such as co-invention relationships, joint R&D projects, or intellectual property transfer [13]. Most previous studies have used different types of network nodes to confirm the close association between network structure and innovation performance [14]. ICNs act as a crucial channel for acquiring varied knowledge externalities. The network’s facilitating role is regarded as network externalities [10]. Scholars typically analyze the externalities of network structure with regard to regional innovation from the perspectives of network size, network heterogeneity, network centrality, and network bonding strength [15,16]. Limited research examines this topic through the lens of network heterogeneity, particularly relational heterogeneity [15].
There exists a discourse concerning the association between agglomeration and network externalities, positing either no relationship [15,17], a complementary relationship [18,19], or a substitutive relationship [20,21]. Notwithstanding multiple pertinent studies, a consensus continues to be unattainable. In conclusion, the relationship between network and agglomeration externalities is still ambiguous, particularly at the intra-township level [22]. Current research offers a solid foundation for examining the correlation between network diversity externalities, Jacobs’ externalities, and regional innovation. Nevertheless, the majority of studies concerning the externalities of ICNs predominantly emphasize network centrality and neglect network connection diversity. What is the impact of network diversity on local innovation capacity within a city, and how does functional diversity interact with scale diversity? The relationship between network and agglomeration externalities from a diversity standpoint requires elucidation.
It is essential to examine the structure of ICNs that influence local innovation. Empirical studies facilitate the advancement of local innovation in urban areas. Co-invention data are often chosen to depict ICN, due to the ease of access and well-organized characteristics of patent data [23]. Collaborations among inventors form differentiated transfer functions in knowledge exchange [24]. Under the trend of global innovation, patent cooperation is often cross-scale [25] and cross-sector [26], characterized by high diversity and heterogeneity. As a high-density international metropolis and a pivotal node in the global innovation network, Beijing has experienced rapid growth in co-invention relationships [
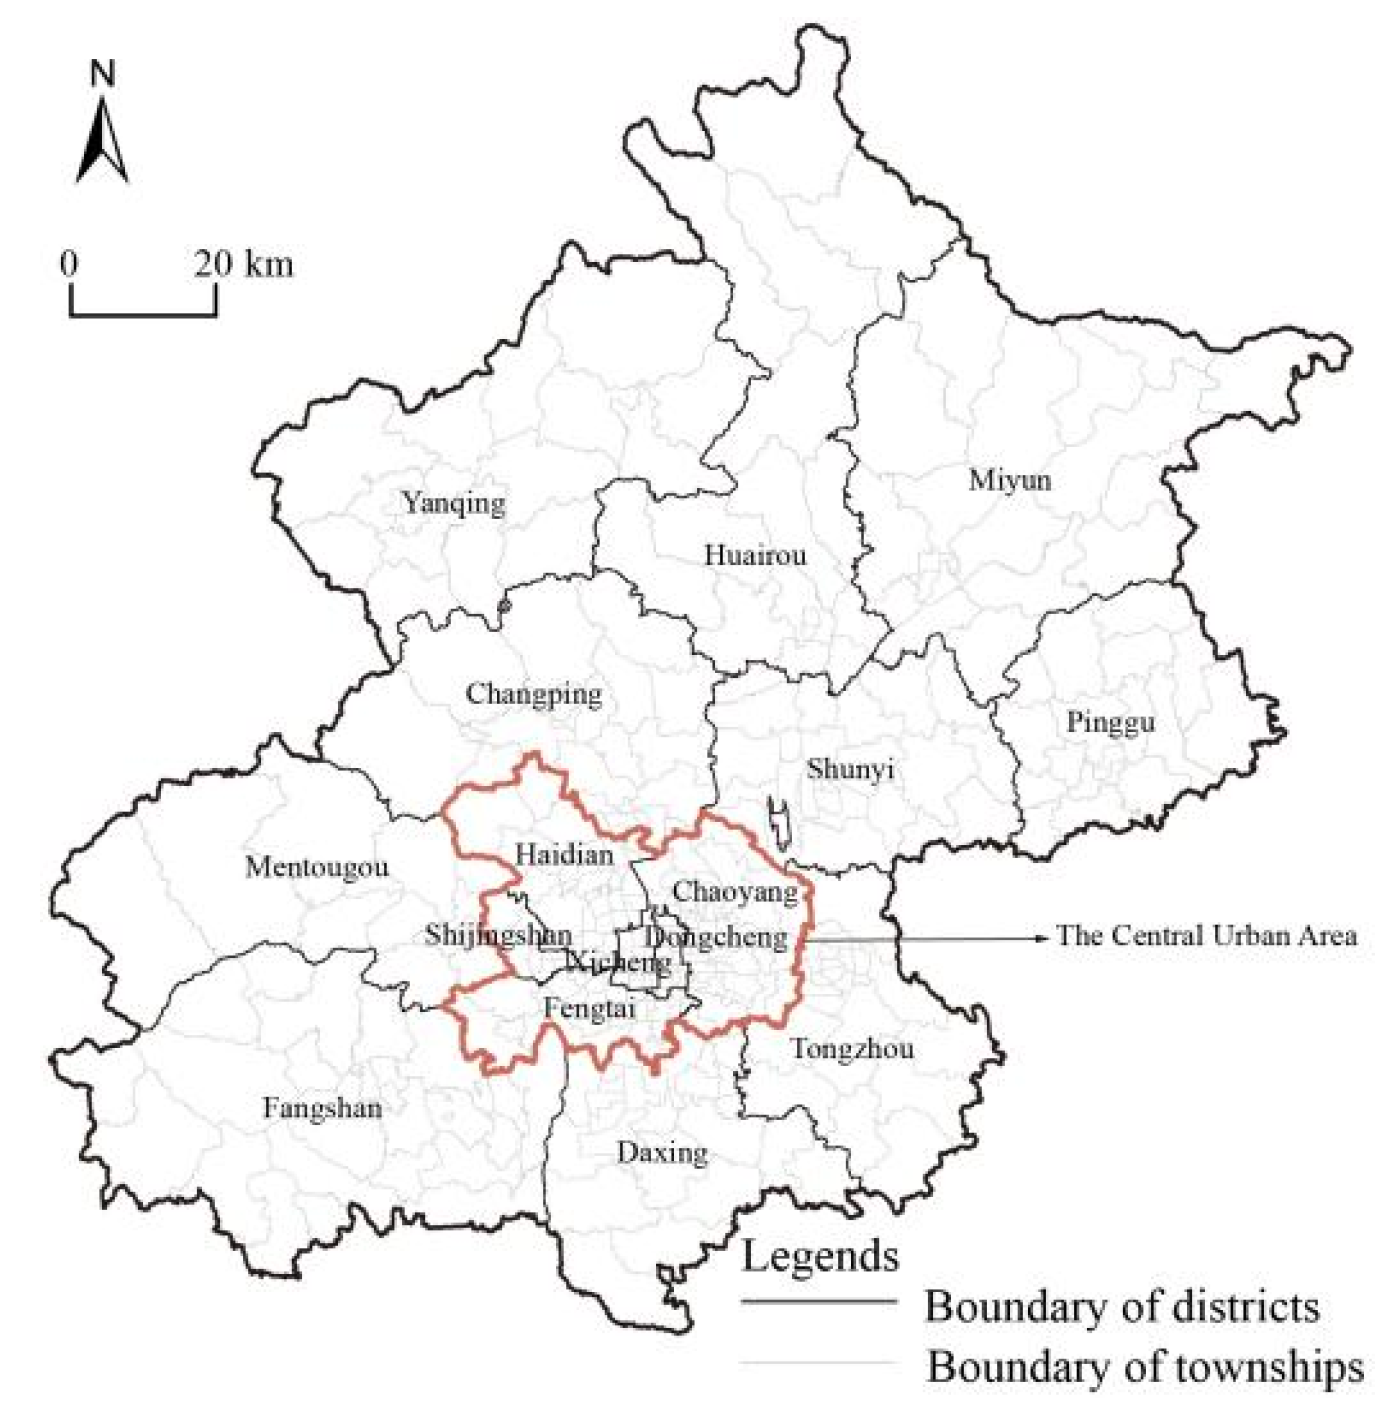
27], making it an ideal case for study. In the specific context of China, administrative boundaries often restrict the allocation and flow of innovative elements. Therefore, township-level administrative regions are better spatial divisions for studying uneven innovation within cities. This study utilizes 343 townships in Beijing from 2006 to 2020 as the research units. Utilizing multi-source data, spatial analysis, and a panel regression model, this study examines and elucidates the relationship between network diversity, network externalities, and local innovation to enhance the theoretical comprehension of network externalities.
The research objectives of this paper are as follows: (1) to identify the spatial distribution features of network diversity from scale and functional perspectives; (2) to use a panel negative binomial regression model to clarify the influence of scale and functional diversity, as well as their interaction, on local innovation capacity; and (3) to reveal the impact relationship between network diversity and Jacobs’ diversity on local innovation capacity.
The contributions of this paper mainly involve the following aspects: (1) The network diversity of the ICN is measured in both the scale and functional dimensions at the township level, which helps to understand the characteristics of network heterogeneity within cities and broadens the perception of network properties; (2) The nonlinear impact of ICN’s network diversity on local innovation is clarified, and the interaction effects between scale and function diversity are examined. These findings enrich the scholarship on network externalities; (3) The relationship between network externalities and Jacobs’ externalities, based on the diversity perspective, is further discussed. This result provides empirical evidence for the relevant academic debate.
The remainder of this paper is structured as follows: Section 2 conducts theoretical analysis and proposes some hypotheses. Section 3 describes this paper’s data, methods, and variables. Section 4 describes the spatio-temporal evolution of network diversity. Section 5 tests the proposed hypotheses using econometric methods. Finally, there is a conclusion and discussion.

2. Theoretical Analysis and Research Hypothesis

2.1. Innovation Cooperation Network

Under the trend of open innovation, the advantages of collaborative innovation have led to the gradual clustering of various types of innovation participants to form high-density cooperation networks. We summarize the definitions of ICNs in existing studies. Table 1 shows that ICNs have two important components: nodes and connections. The basic network node is various R&D entities, usually including universities, enterprises, and research institutions. Depending on the location of those entities, nodes can be further aggregated to form different levels of administrative units [28], such as districts/counties and cities. The flow of knowledge and technology between different nodes forms the network connections. Forms of network cooperation include joint patents, co-authored publications, shared R&D projects, or technology licensing agreements. Measuring innovation cooperation is the focus of existing research. Patent data constitute the most direct, valid, and easy-to-measure indicator, although they are imperfect [29]. A joint patent is one of the criteria for measuring innovation in technological collaboration. The common methods used to analyze network structure are social network analysis and complex network analysis.

2.2. Jacobs’ Diversity and Network Diversity

Diversity is one of the key factors in cultivating innovation. Jane Jacobs points out that diversity is the nature of cities [3]. She argues that the diversity of industries facilitates firms’ innovative activities. The exchange and collision of knowledge among different industries results in externalities that ultimately promote innovative activities and economic growth. In the literature, these are referred to as Jacobs’ externalities [32,33]. Glazer et al. found evidence in favor of inter-industry spillovers in 170 U.S. cities by measuring Jacobs’ diversity through the proportion of industrial employment [34]. The empirical results of Feldman and Audretsch are also consistent with the existence of Jacobs’ externalities [35]. The HHI is considered the dominant measure of Jacobs’ diversity. For example, using the inverse HHI, Huang et al. formalize that Jacobs’ externalities work mainly within cities [16]. Jacobs’ externalities are just one of several sources of externalities; others are Marshallian and Porter’s externalities. Marshallian externalities emphasize the role of industrial specialization [36], while Porter gives more prominence to the role of competition [37]. Scholars tend to agree that both Jacobs’ and Marshallian externalities exist, but differ in the scales and conditions in which they operate [6,36,38]. Jacobs’ externality is rooted in a diversified local production structure, which generates urbanization economies that benefit innovation [16].
In the space of flows introduced by Castells [11], there exists a variety of externalities similar to that of space of place, which is referred to as network diversity in the existing literature [39]. Network diversity typically describes the heterogeneity of nodes and connections in flow space, encompassing factors such as race and social status in social networks [40], information sources and connection strength in physical networks [41], member attributes and functional collaboration in cooperative networks [39,42], and species in ecological networks [43]. Established studies have focused on two forms of network heterogeneity. One form is functional heterogeneity. Industry–academia–research studies have focused on the functional differences in the cooperation between multiple actors [44,45]. Some studies divide actors according to customers, suppliers, competitors, research organizations, and universities [21,46]. Another form is scale heterogeneity. The distinction between local and non-local network connections, which he called the ‘buzz-pipeline’ model, was proposed earlier. Network connections are multiscale (typically local/regional/national/global) [47,48,49]. Compared to the binary ‘buzz-pipeline’ concept, network diversity can finely distinguish the differences in the roles of external connections. For example, Wang et al. found that transnational pipelines and domestic pipelines have different impacts on local innovation capabilities [50]. The diversified network connections facilitate the formation of heterogeneous knowledge combinations. However, more studies show that diversity has a mixed effect (inverted U-shaped relationship) on innovation [51].

2.3. Network/Jacobs’ Diversity and Local Innovation Capacity

2.3.1. The Impact of Multi-Dimensional Network Diversity on Local Innovation

The advantage of network diversity lies in enabling cross-regional and cross-sector knowledge exchange, offering multiple pathways for knowledge spillovers, and promoting the transformation of abundant knowledge resources into innovative outputs. From a scale perspective, network connections at different scales bring heterogeneous knowledge. Local connections facilitate the spillover of tacit knowledge, promote the absorption and application of knowledge, and establish trust mechanisms to reduce transaction costs [48,52]. Non-local connections enhance the completeness and comprehensiveness of urban knowledge stock and support the transformation of knowledge resources into outcomes [49]. From a functional perspective, intra-sector connections often enhance homogeneous knowledge, whereas heterogeneous knowledge from other sectors may generate unexpected innovation [53]. However, excessive network diversity brings adverse effects. On the one hand, excessive network diversity amplifies knowledge noise, increasing the difficulty of knowledge integration, thereby limiting further innovation. Redundant knowledge may obscure high-value scarce knowledge, thus leading to a loss of innovation opportunities [23]. On the other hand, excessively high levels of diversity can hinder knowledge dissemination [54], a phenomenon known as cognitive lock-in. This may also hinder the generation of innovative ideas [55], thereby reducing the birth rate of innovation. Therefore, the impact of scale and functional diversity on urban internal innovation capabilities follows an inverted U-shaped relationship. Therefore, this study hypothesizes the following:
H1a
The degree of functional diversity will have an inverted U-shaped relationship with local innovation capacity.
H1b
The degree of scale diversity will have an inverted U-shaped relationship with local innovation capacity.

2.3.2. The Impact of Functional Diversity and Scale Diversity on Local Innovation

The knowledge base view emphasizes the importance of the ability to integrate knowledge [56]. However, subject to transaction cost constraints, an area utilizes fewer innovation collaborations to achieve more knowledge integration. Therefore, it will selectively structure a favorable diversity network from a particular aspect (function or scale) to obtain the required diversity of knowledge. In prior analysis, it was concluded that excessive functional diversity often means a lack of clear leadership in ICN, potentially resulting in a fragmented knowledge base [57] and reducing regional innovation efficiency. In addition, an overabundance of scale diversity may incur substantial maintenance costs, complicating the absorption and integration of knowledge sources, hence undermining innovation outcomes [58].
The intersection of the two types of network diversity will increase network connection heterogeneity and significantly increase the cost of network management [5]. In terms of externalities, the marginal effect of knowledge diversity externalities in the region will be reduced. Consequently, for this paper’s purposes, the influence of functional diversity on local innovation capacity will weaken as scale diversity increases, and vice versa [59]. The benefit of functional diversity lies in its capacity to provide cross-sectoral knowledge and information [26,49]. However, a notable disadvantage is that different sectors within the same region may possess homogeneous knowledge and information, resulting in redundant interactions regarding knowledge transfer [60]. Scale diversity may magnify this. Due to multiple proximities, knowledge introduced via non-local connections may also become homogeneous, accelerating the tendency of local academic–industry–research collaborations to fall into cognitive dependency [53]. Similarly, specific external knowledge can potentially be replaced through cross-sectoral cooperation, rendering non-local connections less essential. Excessively intricate knowledge networks provide a more complex network structure, ultimately imposing management burdens and hindering innovation performance [61]. Therefore, substitution effects exist between functional diversity and scale diversity concerning local innovation capability. Therefore, this study hypothesizes the following:
H2
The interaction between functional diversity and scale diversity will negatively impact local innovation.

2.3.3. The Impact of the Combination of Network Diversity and Jacobs’ Diversity on Local Innovation

The discussion of the relationship between network and agglomeration externalities is diverse [10,62,63]. Some studies suggest that there is no relationship between them [15] or that they are complementary [18]. A recent study by Turkina et al. suggests an alternative relationship between collaborative networks and spatial proximity for the R&D services sector [21]. Knowledge diversity determines the range of knowledge components available for reorganization [64] and shapes innovation outcomes by creating the possibility of cross-fertilization [65]. From a diversity perspective, there is some substitution between network and Jacobs’ externalities. Network diversity and Jacobs’ diversity are optional options for acquiring knowledge diversity goals. Specific regions make trade-offs between the two [59]. This process suggests a negative moderating effect between network diversity and Jacobs’ diversity. Meijers et al. contend that, in contrast to isolated firms, decentralized firms in urban networks build cross-spatial links through cooperation and transactions [8], with lower transaction costs and expanded knowledge spillovers. Therefore, network externalities can somewhat replace Jacobs’ externalities in terms of knowledge spillovers. Based on the above arguments, this study assumes the following:
H3a
The interaction between functional and Jacobs’ diversity will negatively impact local innovation.
H3b
The interaction between scale diversity and Jacobs’ diversity will negatively impact local innovation.

3. Materials and Methods

3.1. Study Area

As a crucial innovation hub globally, Beijing profoundly influences China’s innovation landscape [66]. WIPO’s Global Innovation Index 2023 ranks Beijing fourth among the world’s top 100 S&T innovation clusters [67]. The distribution of these high-density local innovation activities is primarily concentrated in Beijing’s Central Area [27], yet it remains unbalanced. Thus, the township-level administrative divisions are considered the specific spatial units. Beijing’s Central Urban Area comprises 343 township units, as illustrated in Figure 1.

3.2. Construction of Co-Invention Network

Patent-based partnerships are an effective way to quantify ICNs [29]. The co-invention network can be constructed by taking inventors in Beijing and their partners as the nodes and the cooperative relationship among them as the connections. Inventors come from various sectors: universities, enterprises, research institutions, and others [28]. The co-invention network in Beijing is a multiscale network composed of multiple nodes (Figure 2). Network connections are knowledge-heterogeneous depending on the sector and scale. According to the participants’ sector, network connections are categorized into eight functions: industry–university, industry–research, research–university, industry/university/research–other, industry–industry, university–university, research–research, and other–other.
In addition, network connections are categorized into different scales according to the location of the partners: township, city, regional, national, and international [68]. For example, the connection between two inventors located in the same town belongs to the township scale. If one of the inventors is located outside of China, their connection belongs to the international level.

3.3. Variables

3.3.1. Dependent Variables

The townships’ innovation capabilities were used as the dependent variables. Patent outcomes are typically used as proxy indicators to measure local innovation capabilities (Table 2). However, this approach may lead to endogeneity issues when independent variables are derived from invention patent data. A comprehensive patent indicator was created by referring to related studies [69], encompassing invention patents, utility models, and industrial designs.

3.3.2. Core Variables

Continuous and efficient innovation output requires the guidance of network diversity as the driving force. Therefore, two core explanatory variables are established: scale and functional diversity. In the network, the measurement process for scale and functional diversity is as follows: Firstly, network connections are identified into five scales. Scale diversity (SD) is defined as the presence of connections of one township across different scales. The larger its value, the greater the scale heterogeneity of the network and the greater the access to knowledge from different geographical areas. It is calculated using the Shannon–Wiener index [70], as follows:
S D = i n p i ln p i ln ( n ) ,
where pi is the connection proportion of a specific scale, and n is the kind of connection scale, with a value of 5.
Secondly, network connections across different sectors are categorized into eight types. Functional diversity (FD) is defined as the presence of connections of one township between different sectors. The larger its value, the greater the functional heterogeneity of the network and the greater the access to knowledge from different sectors. The calculation is also performed using the Shannon–Wiener index, as follows:
F D = j m q j ln q j ln ( m ) ,
where qj represents the proportion of connections with one type of function, and m denotes the kind of connection function, with a value of 8.

3.3.3. Moderating Variable

A moderating variable was established to identify the interaction between network and Jacobs’ diversity: industry diversification. The HHI is a common measure of industry concentration, which refers to the sum of the squares of the percentage of total industry revenue or total assets held by each market competitor. Following the approach of Huang et al. [16], HHI’s reciprocal is used to estimate industry diversification. The larger the index, the higher the degree of diversification. The formula is as follows:
I D = 1 j ( E i , j / E i ) 2 ,
where Ei,j represents the number of employees in the j-th industry of the i-th township, and Ei represents the total number of employees in the i-th town.

3.3.4. Control Variables

The chosen scope of the township-level index is limited by data sources. Control variables were set based on relevant studies [49,50,58,71] (Table 1).
Economic development (PGDP): The level of economic development generally determines the level of capital investment and accumulation for technological innovation within cities. This provides a financial guarantee for technological innovation, and thereby benefits local innovation capacities. Generally speaking, the higher the level of economic development, the more favorable it is for local innovation capacities.
Population (Pop): Innovation is generated from the interactions among people, especially people with particular skills that are necessary to produce new ideas and impact the capability to absorb external knowledge [72]. Therefore, a township’s innovation level is highly related to its population amount [73].
Built environment quality (BEQ): Townships with different levels of physical capital are likely to have different performance, as physical capital is a key input factor in the local innovation process [71]. Accessibility to the metro station in townships is used as a proxy for physical capital.

3.3.5. Dummy Variable

A university usually acts as an anchor institution for local innovation [74]. In this study, the absence of a university is treated as a dummy variable.

3.4. Model Design

This paper estimates the innovation performance model to examine the contribution of scale and functional diversity to promoting local innovation performance. Typically, the regional innovation performance model employs the standard knowledge production function, with the dependent variable being the total innovation output, such as the total number of patents. In this study, the knowledge production function was modified to explore the differential effect of network diversity on innovation capacity. Some variables were transformed into logarithms to prevent heteroskedasticity from causing ‘pseudo-regression’. The variance inflation factor (VIF) test results indicate that all VIFs were less than 2, suggesting that the model has low collinearity. Furthermore, the fixed-effects (FE) model was used to control for unobserved heterogeneity. Township-fixed effects were introduced to account for unobserved heterogeneity among different towns. However, time-fixed effects were not included in the baseline regressions, as they may absorb part of the individual effect [75]. The regression results may be biased because the dependent variables are count variables, and there is ‘overdispersion’ (the variance significantly exceeds the mean). Consequently, a panel negative binomial regression model was chosen, as follows:
I n n o _ c a p a c i t y i t = α + β 1 S D + β 2 S D 2 + β 3 F D + β 4 F D 2 + β 5 S D F D + β 6 I D + β 7 S D I D + β 8 F D I D + β 9 c t r l + ε i
where Inno_capacityit indicates the level of local innovation, and ctrl denotes all control variables; α denotes the constant term, and εi is the random error term; β1, β2, …, β9 are some coefficients to be estimated; i represents the town; and t denotes the time.

3.5. Data

Patents, the primary carriers of intellectual property for technological innovation, contain rich co-invention relationships and are widely used data in knowledge and innovation research. The originality of invention patents is the highest, and the number of invention patents is considered a standard indicator of local innovation capability [50]. In this study, we screened the data of invention patents involving innovation entities in Beijing. The data processing steps were as follows: (1) Patent data were obtained from the global patent database IncoPat (https://www.incopat.com/ (accessed on 31 March 2023)), filtered by the keyword ‘Beijing’ in the applicant’s address. Considering the delay in patent issuance, 1,666,923 authorized patents were obtained from 2006 to 2022 to determine the townships’ innovation capabilities. (2) Co-invention data were filtered out from the authorized invention patents. After data cleaning, the dates and applicants were split into multiple data entries for multi-party cooperative patents. Type tags were used to label their functional types (university/industry/research/others). (3) The applicants were matched with their addresses. Applicants within Beijing were assigned to corresponding township units based on their address. Similarly, external collaborators were classified into regions (Beijing–Tianjin–Hebei urban agglomeration), countries, and the globe. In total, 431,779 co-invention data were obtained. A 5-year time window was used to calculate core variables, accounting for the uncertainty in patent approval [76,77].
Other data mainly came from public access. Among them, the employment data in the manufacturing industry came from the China National Enterprise Credit Information Publicity System. Manufacturing industries were divided into 31 categories according to 2-digit codes. The POI data used to measure Jacobs’ diversity came from Gaode Maps (https://www.amap.com/ (accessed on 24 June 2024)). The kilometer grid dataset of China’s historical GDP spatial distribution used to measure economic development was sourced from the Resource and Environment Science Data Registration and Publishing System [78]. The population data used to measure population size came from the WorldPop dataset (https://hub.worldpop.org/project/categories?id=3 (accessed on 13 January 2025)). The subway station data were vectorized from the subway operation map released by the Beijing Subway Operation Company (https://map.bjsubway.com/ (accessed on 15 January 2025)). The distribution data of universities came from the AOI data of Baidu Maps (https://map.baidu.com/ (accessed on 8 March 2024)).
This paper selected the study period from 2010 to 2020 for two reasons. First, following the proposal of the Beijing Zhongguancun National Autonomous Demonstration Zone in 2009, the analysis commenced in 2010 to ensure a sufficiently large sample size to test the hypothesis regarding local innovation capability. Second, the study ended in 2020 because COVID-19 emerged in China in 2019, resulting in social lockdowns that hindered patent cooperation. To align with the years of micro-data for control variables, such as the GDP grid dataset, the study focused on three years: 2010, 2015, and 2020. As collaboration cannot lead to immediate innovation outcomes, the dependent variables lagged by two years, as per the early literature [63].

4. Results

4.1. The Diversity Evolution of the ICN in Beijing

The Comprehensive Network Structure

Figure 3 illustrates the evolution of the ICN in Beijing. The network has undergone substantial growth, with the total connections increasing nearly sevenfold. From a functional structural perspective, intra-sector connections have demonstrated a significantly higher growth rate than inter-sector ones, resulting in an impressive current proportion of 80%, as depicted in Figure 3b,d. This expansion can primarily be attributed to the rising number of industry–industry connections, which have increased by 21%. This trend indicates that collaborative innovation in the industrial sector is becoming increasingly prevalent in Beijing.
Figure 3c,e evidence the scale structure of ICN connections, which remains stable. Local connections maintain a proportion of approximately 60%. The proportion of city-level connections fluctuates between 51% and 59%, whereas national connections range from 28% to 37%, underscoring their significance.

4.2. The Spatio-Temporal Changes in the Network Diversity of the ICN in Beijing

4.2.1. The Network Diversity Changes of the ICN in Beijing

There is a continuous increase in multi-dimensional diversity within the ICN in Beijing (Figure 4). The distribution of SD exhibits a dumbbell shape, with a modest average increase from 0.186 to 0.344. Similarly, the FD distribution also displays a dumbbell shape, but is more dispersed. Its mean value rises from 0.190 to 0.271. The kernel density curves for all indices indicate that most townships lack network diversity, which may be due to the fact that an incubation period is necessary for enhancing network diversity.

4.2.2. The Spatial Changes of Network Diversity of the ICN in Beijing

The distribution of the two diversity indices reveals a similar core–periphery pattern, as depicted in Figure 5. For scale diversity, the figure shows that the one-tier township has expanded from the Central Urban Area towards the edge districts. In 2010, townships with high scale diversity were predominantly centered in the Central Urban Area. By 2015, there was a notable increase in high-value townships beyond the Central Urban Area. Finally, in 2020, the number of high-value townships in the edge districts, including Huairou, Tongzhou, and Changping, continued to rise. This pattern suggests that an increasing part of Beijing is becoming more deeply integrated into the multi-level innovation network.
A similar spatial evolution pattern can be observed for functional diversity. The difference is that high-level townships have not spread widely to the outlying areas, but have always been concentrated in the Central Urban Area. Although the outlying areas have begun to show higher scale diversity, they do not show higher functional diversity, indicating that these areas still lack cross-sector collaborative innovation.

4.3. The Dynamic Mechanism of Network Diversity Underlying Local Innovation

Regression Results

Due to data availability limitations, data from 343 townships in Beijing in 2010, 2015, and 2020 were selected for regression analysis. The dependent variables were compared with seven models—M1, M2, M3, M4, M5, M6, and M7—based on the level of local innovation (Table 3). The coefficients of the variables are generally stable across different models, indicating the robustness of the results.
With regard to SD, models M1 and M2 in Table 3 indicate that SD has a significant positive impact on the innovation capability of towns, while the squared term of SD has a significant negative impact. The effect of SD shows an inverted U-shaped relationship, which supports hypothesis H1a. This result is consistent with De Noni et al. [79]. Through an analysis of 269 European regions, they concluded that a balanced degree of inter- and intra-connections is more conducive to regional innovation productivity. It also aligns with Meijers et al., who emphasized connection scales’ heterogeneity [8]. Figure 6 shows a decline in the average marginal effects. The turning point is 0.840, which falls within the range of SD values. As long as it is below the turning point, the higher the level of scale diversity, the greater the impact on innovation capacity, and vice versa. These findings suggest that SD has a threshold effect on innovation. Excessive SD will have lower marginal returns. This is mainly due to the substantial cost of maintaining high SD levels, which reduces firms’ willingness to cooperate. At the same time, balanced cross-scale connections may lead to much-duplicated knowledge, resulting in knowledge overload, reducing the efficiency of knowledge combinations, and thus failing to capture potential knowledge externalities.
With regard to FD, models M3 and M4 in Table 3 indicate that FD has a significant positive impact on the innovation capability of towns, while the square term of FD has a significant negative impact. The effect of FD also shows an inverted U-shaped relationship, which is consistent with hypothesis H1b of the theoretical analysis. This result aligns with the findings of Nieto and Santamaría’s study [80], which indicated that cooperation between heterogeneous sectors enhances innovation novelty, implying that diverse functional connections negatively affect innovation, due to the inclusion of homogeneous cooperation. The research conducted by Azeem et al. [42] and Xiao et al. [81] also support this conclusion. Figure 6 shows that average marginal effects decline. The turning point is 0.521, which falls within the range of FD values. As long as it is below the threshold, the higher the level of function diversity, the greater the impact on innovation capacity, and vice versa. The results indicate that varied cross-sector cooperation usually means a too-dispersed knowledge system, making it difficult to concentrate and integrate [82], decreasing the marginal output of innovation [80].
From the interaction between SD and FD, model M5 in Table 3 demonstrates an insignificantly negative impact on local innovation, hence confirming hypothesis H2. This suggests that SD and FD have a substitution effect, rather than a complementary effect, on township innovation. According to the knowledge base view, participants in innovation engage ICNs to acquire complementary knowledge [83]. The relevance and complementarity of knowledge play a key role, not the source of knowledge. The source of such complementary knowledge may be either cross-sectoral or cross-regional. This depends on the innovator’s situation. For example, a firm searching for critical knowledge may obtain the desired knowledge from a nearby university. If non-local corporate partners already have this knowledge, local cross-sectoral collaboration will probably not occur. Considering the knowledge absorption costs, there is a limit to the network connections that innovation participants can maintain. When the knowledge brought in by different sectors meets the demand, innovation participants will strengthen cross-sectoral cooperation and create dependencies, and thus will not pursue more cross-scale connections. The reverse is also true. Therefore, scale diversity and functional diversity are substitutes in the acquisition of knowledge externalities.
From the interactions between network diversity and Jacobs’ diversity, models M6 and M7 in Table 3 indicate that the interactions between SD and ID, as well as between FD and ID, hurt local innovation capabilities, which is consistent with the theoretical assumptions H3a and H3b. This conclusion suggests that the interaction between Jacobs’ and network externalities from a diversity perspective is not conducive to local innovation. Similarly to this conclusion, the research results of Zhou et al. indicate that the interactive effect of urban hierarchy and connection networks has a negative impact on urban economic efficiency in China’s eastern and western regions [84]. Meijers et al. also believe that urban network externalities can, to some extent, replace agglomeration economies [8]. This suggests that network diversity, whether SD or FD, plays a role of mutual substitution or weakening of ID, rather than additive complementarity to innovation at the township level. Diversity is an important source of value in terms of knowledge externalities. Innovation participants have always found it challenging to carry out developmental or exploratory innovations in isolation, and they have to engage with different partners to acquire external knowledge to keep up with competition [85]. In contrast to isolated inventors, decentralized inventors in ICNs build cross-scale connections with lower transaction costs to acquire knowledge spillovers, implying that network diversity can somewhat replace Jacobs’ diversity. The accessibility of local knowledge bases regarding diversity is greater for inventors lacking social proximity [86], although the benefit of belonging to the same technical community in ICN is greater for inventors who are not co-located.
For control variables, the built environment quality has a significant negative impact on the innovation capacity of towns, indicating that more accessible public transportation is beneficial for the mobility of innovative talents. This result is consistent with the study by Zhang et al., who found that public transportation accessibility positively impacts innovation [87]. Population size and the level of economic development have a significant positive impact on local innovation capacity, which is consistent with the conclusions of existing studies [79]. Universities also work, but the significance is weak. They mainly engage in knowledge innovation and indirectly influence technological innovation. The study on the Chinese film industry network by Wen et al. also showed that universities have a positive but insignificant impact on urban film industry innovation [71].

4.4. Case Study

We provide specific case studies to further illustrate the substitution effects between functional and scale diversity. Utilizing scale diversity to compensate for a lack of functional diversity is common in industrial park-type townships. A typical example is Shangdi Street. Located in Haidian District, Shangdi is home to China’s first information technology industrial base and agglomerates many multinational companies, such as Lenovo, Huawei, and IBM branches. Shangdi’s innovation capacity, as measured by the total patent output, is among the top five in Beijing. As an old industrial base, the area lacks universities and public research institutions, resulting in an unbalanced ICN structure. The data show that over the study period, the scale diversity increased from 0.444 to 0.773, while on the contrary, the functional diversity declined from 0.374 to 0.250. This reliance on scale diversity contributed to a more than 8-fold increase in patent output. This alternative mechanism of scale diversity is associated with multinational enterprises. These firms have better knowledge integration capabilities, acquiring complementary knowledge from affiliates and partners globally. This enables a better response to knowledge-absorption challenges. The result is a share of over 87% of industry–industry connections from 2016 to 2020, with over one-fifth including non-local connections.
The above case shows that a township can succeed when it maintains reasonable diversity in any dimension of function and scale. Similar examples include Jiuxianqiao Street in Chaoyang District and Ronghua Street in Beijing Jingkai District. As the role of scale diversity continues to increase, it decreases the town’s reliance on functional diversity. However, this substitution effect has underlying conditions, i.e., knowledge-absorptive capacity, as in the case of the rich multinational-firm clusters in Shangdi.

4.5. Robustness Tests

4.5.1. Changing the Dependent Variable

By modifying the indicator of the dependent variable [62,63], the aim was to enhance both the robustness and comprehensiveness of the findings related to local innovation. In accordance with Cui et al. [88], this paper employs the number of high-tech enterprises as a proxy indicator. High-tech enterprises contribute to regional technological advancement and offer diverse perspectives on local innovation capabilities within specific contexts. The results presented in Table 4 align with previous research outcomes, confirming these findings’ consistency.

4.5.2. Sample Reduction

Anchor institutions that concentrate a large amount of connections have a significant impact on the network diversity of the host township. This randomness may affect the accuracy of the results. A regression analysis was conducted after excluding the top 10% of townships by total ICN connections [58]. The results in Table 5 are largely consistent with those in Table 3, and support the previous conclusions.

4.5.3. Testing of Two-Way Fixed Effects

To further control for fixed-time effects, a two-way fixed effects regression was employed [76], with the results shown in Table 6. The results confirm that the regression analysis in this paper is robust. Taken together, the substitution of dependent variables, reduction in sample size, and confirmation of two-way fixed effects show that the negative binomial panel regression analysis in this paper meets its key assumptions, and that the findings are robust.

4.5.4. Changing the Measurement of Jacobs’ Externalities

To further reflect the richness of Jacobs’ externalities, land use diversity was employed as a substitute for industrial diversity in the examination. Drawing on the approach of Zhu et al. [89], land use diversity (LUD) is derived based on POI data. The regression results in Table 7 indicate that hypothesis H3 of this paper still holds.

5. Discussion

5.1. The Network Diversity Dynamic of the ICN in Beijing from 2010 to 2020

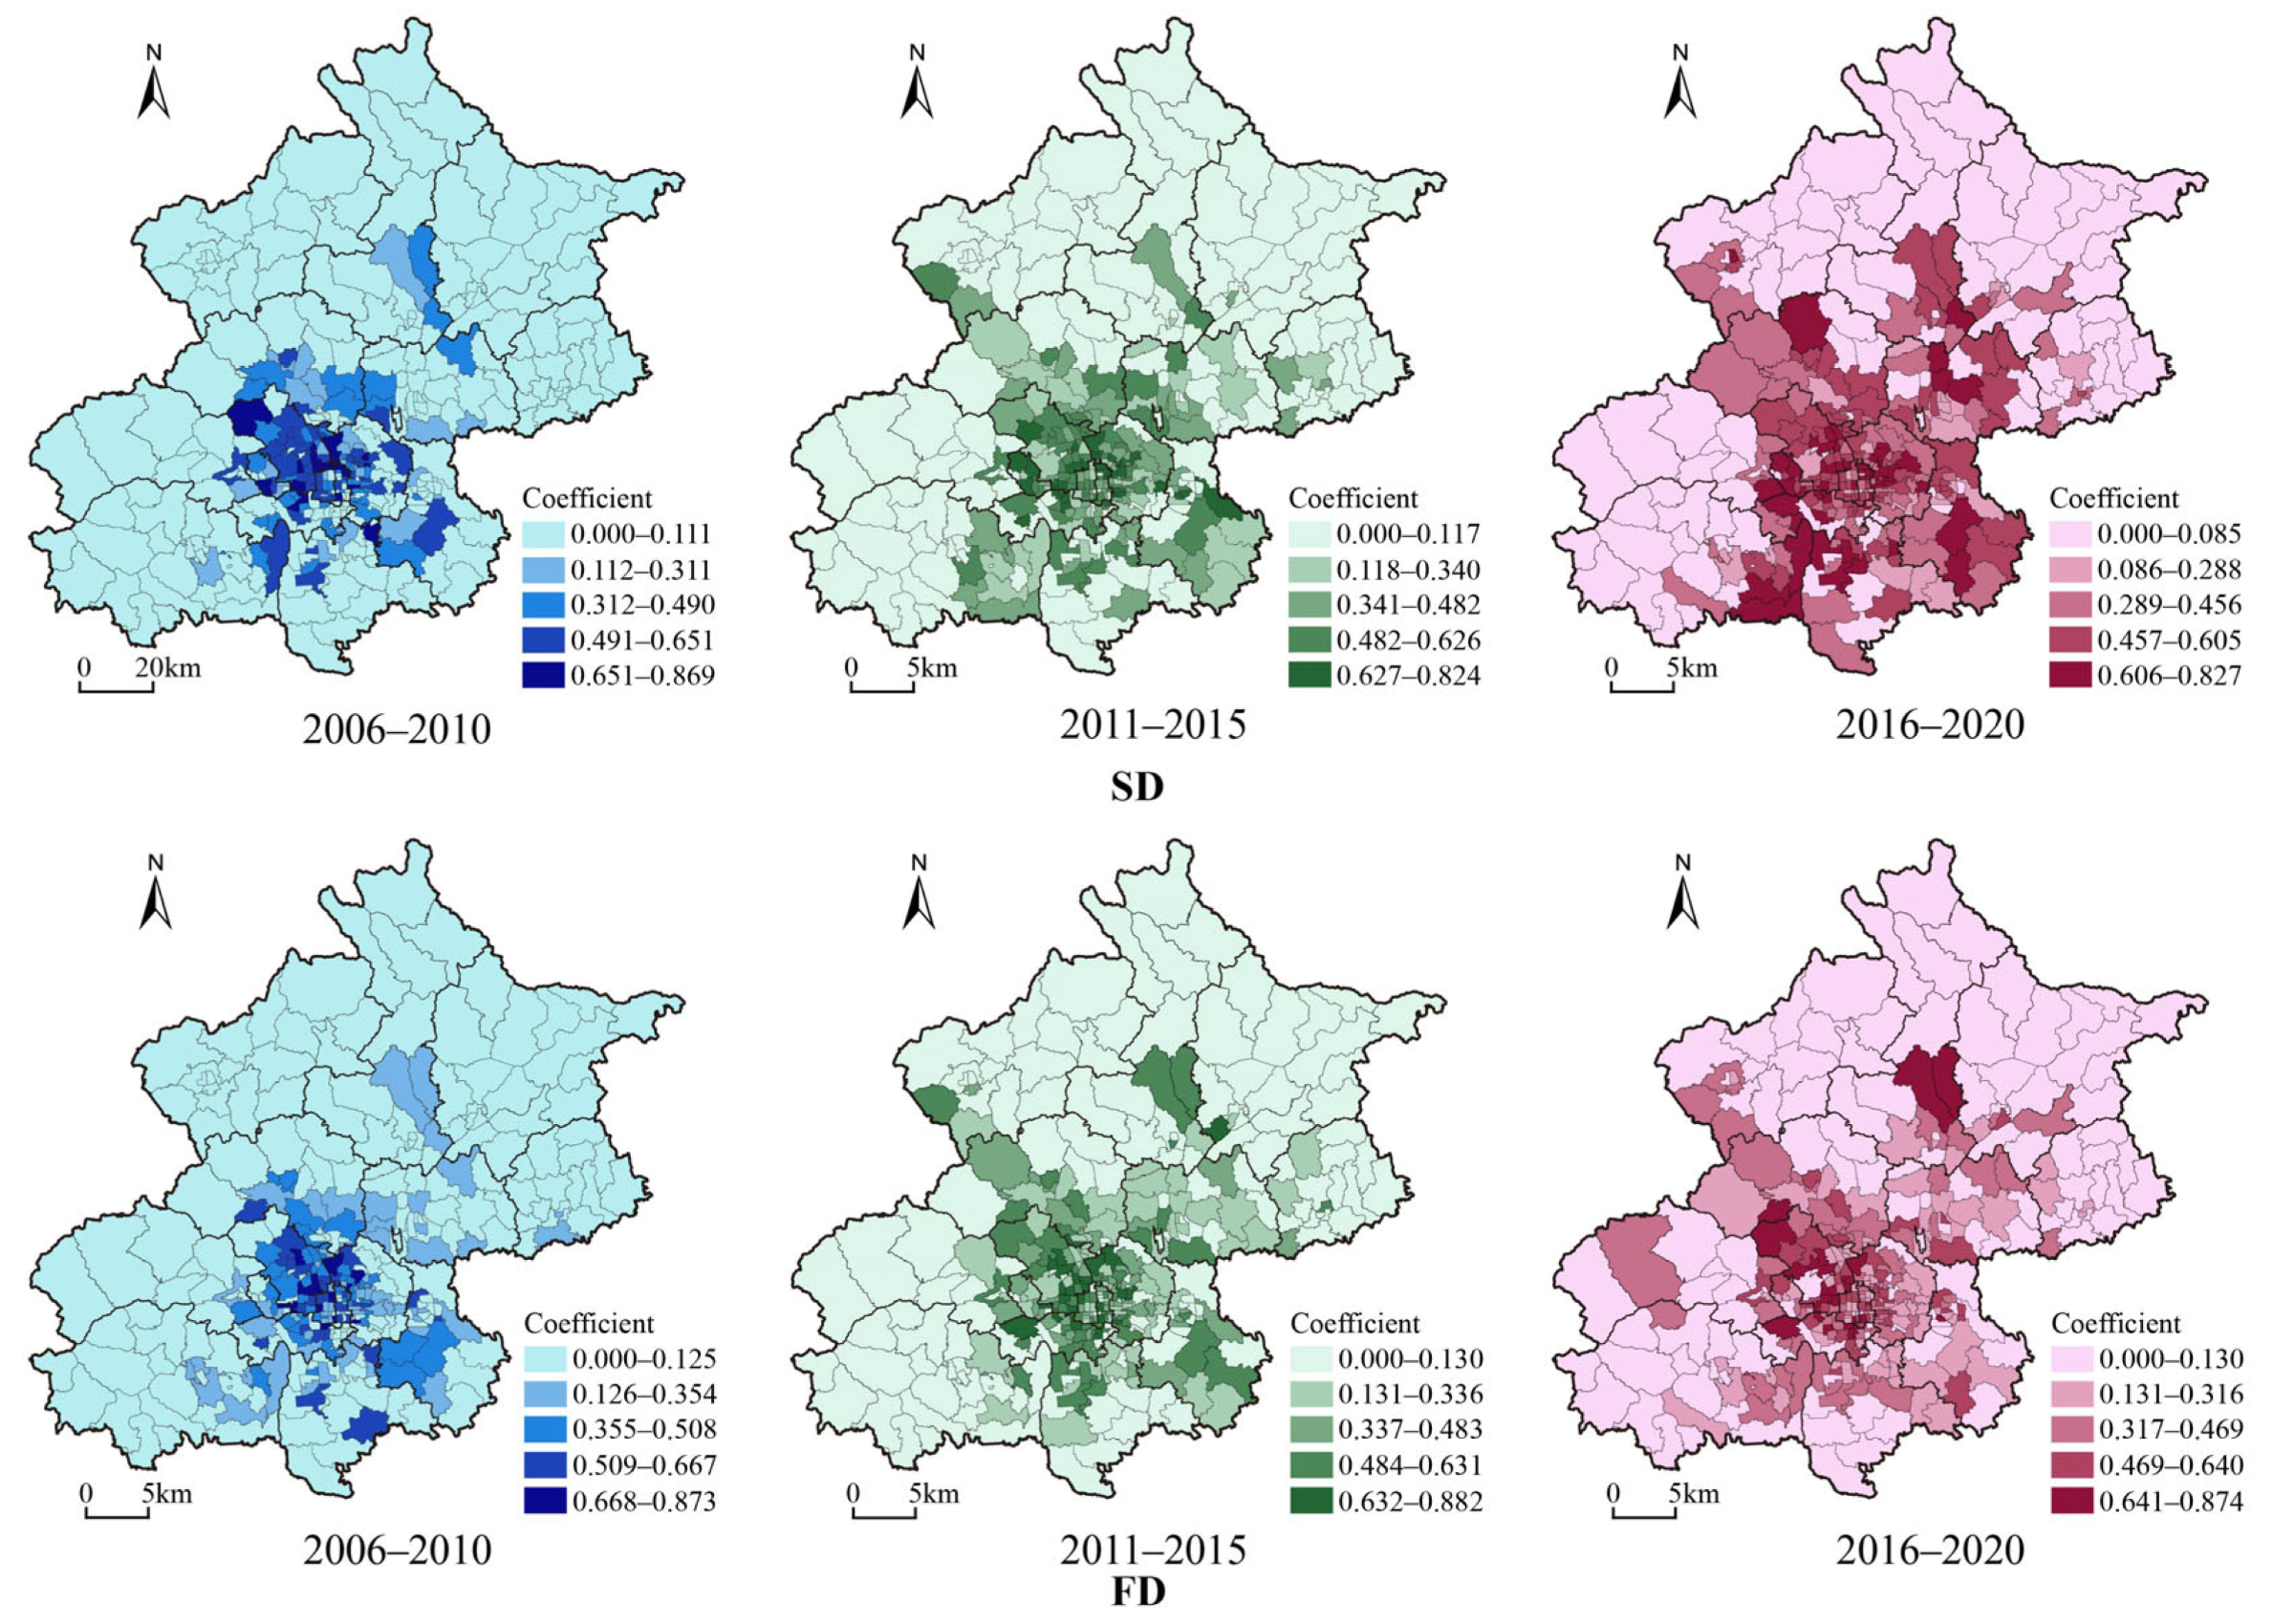
Since the 21st century, major mega-cities, including Beijing, have been deeply integrated into the global ICN. This paper reveals the spatio-temporal characteristics of network diversity at the township level in Beijing. The results show that from 2010 to 2020, the network diversity level of the ICN in various townships has increased significantly. Specifically, the average scale diversity level has risen by 84.946%, while the average functional diversity level has risen by 42.632%. The spatial distribution of both types of network diversity presents a core–periphery pattern. We measured the heterogeneity of network connections in the two dimensions, expanding our understanding of the network structure of the ICN. Our study extends and complements the ‘buzz-pipeline’ theory by showing differences in the roles of the ‘pipeline’ at different scales.

5.2. The Impact of Network Diversity on Local Innovation

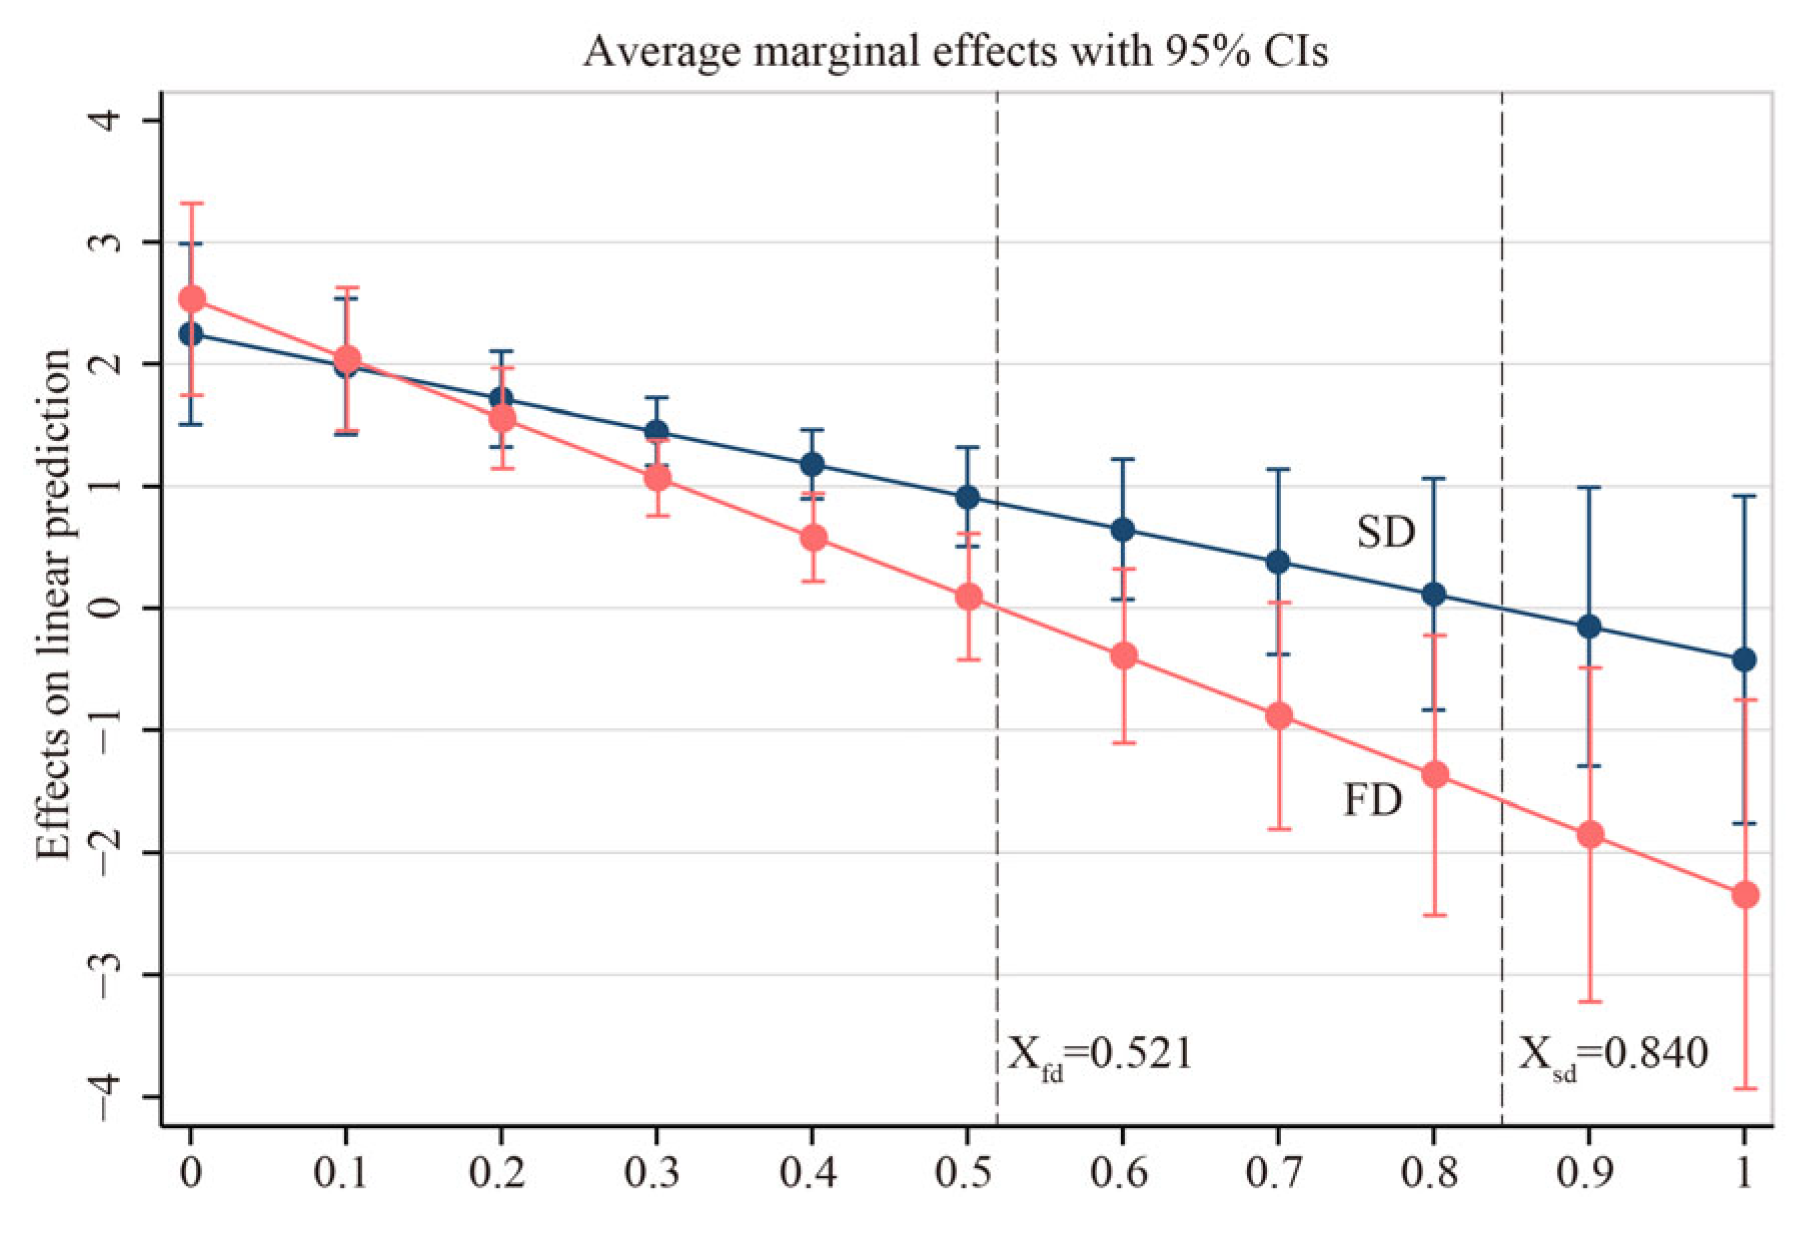
This paper reveals the nonlinear impact of scale and functional diversity within innovation cooperation networks on local innovation. The formation of innovation is built upon a moderately complex level of knowledge combinations. Excessively complex knowledge sources can lead to overload. Whether in the scale or functional dimension, an excessively high level of network diversity increases the complexity of knowledge sources, making knowledge integration, absorption, and maintenance difficult. This is highly detrimental to local innovation. The marginal effect of network diversity on the innovation capacity of towns and villages first increases and then decreases, supporting hypothesis H1a, with an inverted U-shaped impact. This result is consistent with the findings of Wang et al.’s study [90]. They explored the relationship between knowledge diversity and research performance in research collaborations, and found an inverted U-shaped pattern between interdisciplinary collaboration diversity and social impact. Some studies disagree. Wen et al. analyzed the positive effects of relevant and irrelevant network knowledge diversity on firms’ innovation outcomes [71]. While realizing that growing relevant knowledge diversity still increases firms’ absorption pressure, they did not test the potential negative effects of network diversity. Compared to previous studies, we emphasize the threshold effect of network diversity and distinguish different dimensions of network diversity.

5.3. The Impact of the Interaction Between Scale and Functional Diversity on Local Innovation

This study indicates a substitutive relationship, rather than a complementary one, between scale and functional diversity. This is primarily because knowledge from different sectors and scales tends to be similar. The long-term acquisition of homogeneous knowledge can lead to cognitive lock-in, thus undermining the vitality of innovation [60]. The case studies also show that industry-based townships often rely on scale diversity as a substitute for functional diversity, due to the relatively homogenous nature of local innovation players. High-level knowledge absorption capability integrating fragmented knowledge is a severe challenge for towns, particularly those in remote regions.

5.4. The Impact of the Interaction of Network Diversity and Jacobs’ Diversity on Local Innovation

The relationship between network externalities and agglomeration externalities is far from a consensus. We provide empirical support for the substitution relationship view. The regression results reveal the substitutive relationship between network and Jacobs’ diversity. However, stability tests indicate that this relationship is not stable. Models M6 and M7 in Table 3, Table 4 and Table 5 indicate that the impact of the interaction is no longer significant. The research by Zhou et al. supports our conclusion [84], but Capone et al. reached the opposite conclusion [91]. Other studies indicate an insignificant interaction effect between the two [63]. Existing studies have mostly measured agglomeration externalities from a specialization perspective, with less consideration given to the diversification perspective or the urbanization economy. We provide a perspective for understanding the alternative relationship between the network and Jacobs’ externalities regarding spillover effects. More empirical analysis is needed to unravel this complex relationship, considering other agglomeration mechanisms in the future.

5.5. Contributions and Limitations

This paper contributes to ICN research in three ways: (1) The analysis of network diversity enriches our understanding of the heterogeneity of network connections by considering both the scale and function of network connections. (2) The nonlinear impact of network diversity on innovation is investigated, and the threshold effect of network diversity is identified. Furthermore, the substitutive relationship between the two types of network diversity emphasizes the importance of the necessary trade-offs that townships must make when managing their networks. (3) The alternative relationship between network diversity and Jacobs’ diversity is revealed, providing valuable empirical evidence to elucidate the link between network externalities and agglomeration externalities from a knowledge spillover perspective. Additionally, this study operates at the township level, reflecting the uneven innovation dynamics within mega-cities more accurately.
However, there are some limitations to consider. First, this research does not adequately address informal networks, potentially leading to limited observation of local buzz. Nonetheless, the limited data availability challenges the incorporation of informal connections into this analysis. Second, conclusions regarding the relationship between network diversity and Jacobs’ diversity remain unstable. This is a contentious issue within the existing literature that necessitates further clarification through additional empirical evidence. Third, while our analysis reveals network diversity patterns in patent-intensive sectors (e.g., manufacturing, IT), it likely underestimates contributions from institutions in sectors where non-patent innovation dominates. For instance, in the creative industries, music and film rely on copyrights, trademarks, or informal secrecy, rather than patents. In the health sector, pharmaceutical innovation relies more on regulatory approval than on the quantity of patents. Moreover, the existence of ‘patent trolls’ makes it challenging to reflect the true quality of innovation. In the future, it is necessary to integrate copyright data, social impact indicators, and open-science indicators (such as academic citations) to establish a multi-dimensional indicator system to comprehensively measure human progress.

6. Conclusions

The ICN has emerged as a crucial factor in fostering local innovation, offering cities an alternative way to enhance innovation performance. However, numerous studies have tended to treat cities as mere nodes of regional networks, disregarding the disparities in network distribution within them. Such issues are widespread and necessitate a more granular level of analysis. In this study, the township level, being a micro-administrative unit, serves as an ideal study scale. Following a comprehensive examination of the network diversity’s evolution, this study employed a panel negative binomial regression model to investigate the influence of scale and functional diversity on township innovation. The key findings of this study are summarized as follows:
(1)
Beijing’s ICN has undergone significant growth. There has been an increase in both scale diversity and functional diversity, indicating the evolving maturity of the township-level cooperation network. The distribution of network diversity follows a similar core–periphery pattern, with high-value towns located mainly in Beijing’s Central Urban Area.
(2)
At the township level, ICN’s scale and functional diversity exhibit a significant inverted U-shaped impact on local innovation capability. This finding highlights the significance of appropriate network diversity within the ICN for promoting innovation. Furthermore, the interaction between scale and functional diversity negatively impacts local innovation. This adverse effect remained significant in robustness tests where the explanatory variables were substituted and the sample size was reduced. This suggests that scale and functional diversity have a substitutive effect in promoting local innovation capabilities.
(3)
Network diversity, including scale and functional diversity, has a certain degree of substitutive effect on promoting township-level innovation capabilities with Jacobs’ diversity. This reveals the relationship between network externalities and Jacobs’ externalities. Nevertheless, the substitution effect identified in this study lacks robustness. This indicates that the relationship between network externalities and agglomeration externalities is likely intricate, which aligns with the conflicting conclusions discovered in the extant literature. Such complexity calls for a more in-depth exploration and comprehensive analysis to fully understand the underlying mechanisms governing the interaction between these two types of externalities and their implications for regional innovation development.
Finally, this paper offers some policy implications for enhancing the diversity of township-level ICNs: (1) ICNs serve as a double-edged sword in promoting regional innovation development. Policymakers must acknowledge the threshold effect of network diversity and adopt a smarter strategy to manage the trade-off between cross-sectoral and cross-scale cooperation. (2) Network diversity provides evidence and support for breakthroughs in small peripheral towns. Utilizing cross-scale networks to bridge the gap of local cross-sectoral cooperation will be an important way to gain critical knowledge. (3) Policies should consider both the spatial synergistic location of innovative entities and the structure of cooperation networks, but should focus on capitalizing on their strengths. The findings of this paper offer valuable insights for urban planners and policymakers to promote urban innovation and sustainable development, supporting other towns or cities to pursue a better innovation network effect.

Author Contributions

Conceptualization, J.N.; methodology, J.N. and T.L.; software, T.L.; validation, T.Z.; formal analysis, J.N.; investigation, T.L.; resources, J.N.; data curation, T.L. and T.Z.; writing—original draft preparation, T.L.; writing—review and editing, J.N.; visualization, T.L.; supervision, J.N.; project administration, J.N.; funding acquisition, J.N. All authors have read and agreed to the published version of the manuscript.

Funding

This research was funded by the National Natural Science Foundation of China (52308044) and the China Postdoctoral Science Foundation (2023M730149).

Data Availability Statement

The original contributions presented in the study are included in the article; further inquiries can be directed to the corresponding author.

Conflicts of Interest

Author Tianming Zheng was employed by the company Beijing Tsinghua Tongheng Urban Planning and Design Institute, Holistic Research and Planning Branch of THUPDI. The remaining authors declare that the research was conducted in the absence of any commercial or financial relationships that could be construed as a potential conflict of interest.

References

  1. Hofstra, B.; Kulkarni, V.V.; Munoz-Najar Galvez, S.; He, B.; Jurafsky, D.; McFarland, D.A. The Diversity–Innovation Paradox in Science. Proc. Natl. Acad. Sci. USA 2020, 117, 9284–9291. [Google Scholar] [CrossRef] [PubMed]
  2. Phelps, C.C. A Longitudinal Study of the Influence of Alliance Network Structure and Composition on Firm Exploratory Innovation. Acad. Manag. J. 2010, 53, 890–913. [Google Scholar] [CrossRef]
  3. Jacobs, J. The Economy of Cities; Random House: New York, NY, USA, 1969. [Google Scholar]
  4. Parr, J.B. Agglomeration Economies: Ambiguities and Confusions. Environ. Plan A 2002, 34, 717–731. [Google Scholar] [CrossRef]
  5. Simonen, J.; Svento, R.; Juutinen, A. Specialization and Diversity as Drivers of Economic Growth: Evidence from HighTech Industries. Pap. Reg. Sci. 2015, 94, 229–248. [Google Scholar] [CrossRef]
  6. Beaudry, C.; Schiffauerova, A. Who’s Right, Marshall or Jacobs? The Localization versus Urbanization Debate. Res. Policy 2009, 38, 318–337. [Google Scholar] [CrossRef]
  7. Bucciarelli, P.; Hache, E.; Mignon, V. Evaluating Criticality of Strategic Metals: Are the Herfindahl–Hirschman Index and Usual Concentration Thresholds Still Relevant? Energy Econ. 2025, 143, 108208. [Google Scholar] [CrossRef]
  8. Meijers, E.J.; Burger, M.J.; Hoogerbrugge, M.M. Borrowing Size in Networks of Cities: City Size, Network Connectivity and Metropolitan Functions in Europe. Pap. Reg. Sci. 2016, 95, 181–199. [Google Scholar] [CrossRef]
  9. Capello, R. The City Network Paradigm: Measuring Urban Network Externalities. Urban Stud. 2000, 37, 1925–1945. [Google Scholar] [CrossRef]
  10. Dong, S.; Liu, K. Agglomeration Externalities vs. Network Externalities: Impact on Green Technology Innovation in 283 Chinese Cities. Sustainability 2024, 16, 3540. [Google Scholar] [CrossRef]
  11. Castells, M. The Rise of the Network Society; Blackwell Publishers: Oxford, UK, 1996. [Google Scholar]
  12. Briciu, V.-A.; Rezeanu, C.-I.; Briciu, A. Online Place Branding: Is Geography ‘Destiny’ in a ‘Space of Flows’ World? Sustainability 2020, 12, 4073. [Google Scholar] [CrossRef]
  13. Yang, X.; Kong, L.; Qu, S. Evolution of Technology Cooperation Networks Based on Networked Evolutionary Games Model: An Industrial Heterogeneity Perspective. Technol. Soc. 2024, 78, 102631. [Google Scholar] [CrossRef]
  14. Yao, L.; Li, J.; Li, J. Urban Innovation and Intercity Patent Collaboration: A Network Analysis of China’s National Innovation System. Technol. Forecast. Soc. Change 2020, 160, 120185. [Google Scholar] [CrossRef]
  15. Xie, X.; Fang, L.; Zeng, S. Collaborative Innovation Network and Knowledge Transfer Performance: A fsQCA Approach. J. Bus. Res. 2016, 69, 5210–5215. [Google Scholar] [CrossRef]
  16. Huang, Y.; Hong, T.; Ma, T. Urban Network Externalities, Agglomeration Economies and Urban Economic Growth. Cities 2020, 107, 102882. [Google Scholar] [CrossRef]
  17. Varga, A.; Pontikakis, D.; Chorafakis, G. Metropolitan Edison and Cosmopolitan Pasteur? Agglomeration and Interregional Research Network Effects on European R&D Productivity. J. Econ. Geogr. 2014, 14, 229–263. [Google Scholar] [CrossRef]
  18. Hazır, C.S.; LeSage, J.; Autant-Bernard, C. The Role of R&D Collaboration Networks on Regional Knowledge Creation: Evidence from Information and Communication Technologies. Pap. Reg. Sci. 2018, 97, 549–568. [Google Scholar] [CrossRef]
  19. Innocenti, N.; Capone, F.; Lazzeretti, L. Knowledge Networks and Industrial Structure for Regional Innovation: An Analysis of Patents Collaborations in Italy. Pap. Reg. Sci. 2020, 99, 55–73. [Google Scholar] [CrossRef]
  20. Van der Wouden, F.; Rigby, D.L. Co-inventor Networks and Knowledge Production in Specialized and Diversified Cities. Pap. Reg. Sci. 2019, 98, 1833–1854. [Google Scholar] [CrossRef]
  21. Turkina, E.; Frigon, A.; Doloreux, D. Network versus Spatial Proximity and Firm Innovation: The Case of the R&D Service Sector. J. Reg. Sci. 2025, 65, 135–155. [Google Scholar] [CrossRef]
  22. Jiang, J.; Xu, Z.; Lu, J.; Sun, D. Does Network Externality of Urban Agglomeration Benefit Urban Economic Growth—A Case Study of the Yangtze River Delta. Land 2022, 11, 586. [Google Scholar] [CrossRef]
  23. Breschi, S.; Lenzi, C. Co-Invention Networks and Inventive Productivity in US Cities. J. Urban Econ. 2016, 92, 66–75. [Google Scholar] [CrossRef]
  24. Hussain, O.A.; Zaidi, F.; Rozenblat, C. Analyzing Diversity, Strength and Centrality of Cities Using Networks of Multinational Firms. Netw. Spat. Econ. 2019, 19, 791–817. [Google Scholar] [CrossRef]
  25. Indraprahasta, G.S.; Derudder, B. The Geographically Variegated Connections of the Jakarta Metropolitan Area as Produced by Manufacturing Firms. Growth Change 2019, 50, 705–724. [Google Scholar] [CrossRef]
  26. Li, W.; He, C. The Role of Industry-University-Research Collaboration in Regional Technological Diversification: An Empirical Study on the Pharmaceutical Industry in China. Appl. Geogr. 2024, 171, 103393. [Google Scholar] [CrossRef]
  27. Lyu, L.; Wu, W.; Hu, H.; Huang, R. An Evolving Regional Innovation Network: Collaboration among Industry, University, and Research Institution in China’s First Technology Hub. J. Technol. Transf. 2019, 44, 659–680. [Google Scholar] [CrossRef]
  28. Ma, T.; Hong, W.; Cao, Z.; Zhang, L.; Yang, X. Connection Patterns and Resilience Simulation of Innovation Network in the Context of Technology Transfer: A Case Study of Strategic Emerging Industries in the Guangdong-Hong Kong-Macao Greater Bay Area. Sustain. Cities Soc. 2024, 106, 105396. [Google Scholar] [CrossRef]
  29. Du, Y.; Wang, M.; Yin, Y. Research on Innovation Cooperation Network of Chinese Universities Based on Patent Data. J. Eng. Technol. Manag. 2024, 71, 101784. [Google Scholar] [CrossRef]
  30. Zeng, S.X.; Xie, X.M.; Tam, C.M. Relationship between Cooperation Networks and Innovation Performance of SMEs. Technovation 2010, 30, 181–194. [Google Scholar] [CrossRef]
  31. Zhang, L.; Cao, Z.; Chen, G.; Wang, Z. A Study of China’s Inter-City Networks for Innovation Cooperation within Software and Service Firms. Eurasian Geogr. Econ. 2019, 60, 582–615. [Google Scholar] [CrossRef]
  32. Nielsen, B.B.; Asmussen, C.G.; Weatherall, C.D.; Lyngemark, D.H. Marshall vs Jacobs Agglomeration and the Micro-Location of Foreign and Domestic Firms. Cities 2021, 117, 103322. [Google Scholar] [CrossRef]
  33. Demidova, O.; Kolyagina, A.; Pastore, F. Marshallian vs Jacobs Effects: Which Is Stronger? Evidence for Russia Unemployment Dynamics. Struct. Change Econ. Dyn. 2020, 55, 244–258. [Google Scholar] [CrossRef]
  34. Glaeser, E.L.; Kallal, H.D.; Scheinkman, J.A.; Shleifer, A. Growth in Cities. J. Political Econ. 1992, 100, 1126–1152. [Google Scholar] [CrossRef]
  35. Feldman, M.P.; Audretsch, D.B. Innovation in Cities: Science-Based Diversity, Specialization and Localized Competition. Eur. Econ. Rev. 1999, 43, 409–429. [Google Scholar] [CrossRef]
  36. Caragliu, A.; de Dominicis, L.; de Groot, H.L. Both Marshall and Jacobs Were Right! Econ. Geogr. 2016, 92, 87–111. [Google Scholar] [CrossRef]
  37. Porter, M.E. Competitive Advantage, Agglomeration Economies, and Regional Policy. Int. Reg. Sci. Rev. 1996, 19, 85–90. [Google Scholar] [CrossRef]
  38. Andersson, M.; Larsson, J.P.; Wernberg, J. The Economic Microgeography of Diversity and Specialization Externalities—Firm-Level Evidence from Swedish Cities. Res. Policy 2019, 48, 1385–1398. [Google Scholar] [CrossRef]
  39. Alecu, A.I. Exploring the Role of Network Diversity and Resources in Relationship to Generalized Trust in Norway. Soc. Netw. 2021, 66, 91–99. [Google Scholar] [CrossRef]
  40. Eagle, N.; Macy, M.; Claxton, R. Network Diversity and Economic Development. Science 2010, 328, 1029–1031. [Google Scholar] [CrossRef]
  41. Carpi, L.C.; Schieber, T.A.; Pardalos, P.M.; Marfany, G.; Masoller, C.; Díaz-Guilera, A.; Ravetti, M.G. Assessing Diversity in Multiplex Networks. Sci. Rep. 2019, 9, 4511. [Google Scholar] [CrossRef]
  42. Azeem, M.M.; Fazal-e-Hasan, S.; Gutiérrez, L.; Baker, D. Does Functional Diversity in Interfirm Collaborations Lead to Innovation Diversity? Firm-Level Evidence from the Australian Food Industry. Aust. J. Agric. Resour. Econ. 2022, 66, 612–637. [Google Scholar] [CrossRef]
  43. Son, J.; Lin, N. Network Diversity, Contact Diversity, and Status Attainment. Soc. Netw. 2012, 34, 601–613. [Google Scholar] [CrossRef]
  44. Yang, G.; Cao, D.; Zhang, G. How Does Industry-University-Research Collaborative Innovation Affect Energy Intensity in China: A Novel Explanation Based on Political Turnover. Humanit. Soc. Sci. Commun. 2023, 10, 554. [Google Scholar] [CrossRef]
  45. Xu, A.; Qiu, K.; Zhu, Y. The Measurements and Decomposition of Innovation Inequality: Based on Industry-University-Research Perspective. J. Bus. Res. 2023, 157, 113556. [Google Scholar] [CrossRef]
  46. Byrne, E.; Doyle, E.; Hobbs, J. Network Diversity, Distance and Economic Impact in a Cluster: Visualising Linkages and Assessing Network Capital. Compet. Rev. 2021, 31, 863–882. [Google Scholar] [CrossRef]
  47. Zhang, J.; Sun, B.; Wang, C. Interplay between Network Position and Knowledge Production of Cities in China Based on Patent Measurement. Land 2024, 13, 1713. [Google Scholar] [CrossRef]
  48. Bathelt, H. Buzz-and-Pipeline Dynamics: Towards a Knowledge-Based Multiplier Model of Clusters. Geogr. Compass 2007, 1, 1282–1298. [Google Scholar] [CrossRef]
  49. Cao, Z.; Derudder, B.; Dai, L.; Peng, Z. ‘Buzz-and-Pipeline’ Dynamics in Chinese Science: The Impact of Interurban Collaboration Linkages on Cities’ Innovation Capacity. Reg. Stud. 2022, 56, 290–306. [Google Scholar] [CrossRef]
  50. Wang, B.; Mao, W.; Piao, J.; Liu, C. Does External Linkage Stimulate Innovation Capacity? The Analysis Based on “Dual-Pipelines” Framework. Pap. Reg. Sci. 2023, 102, 613–633. [Google Scholar] [CrossRef]
  51. Ozgen, C. The Economics of Diversity: Innovation, Productivity and the Labour Market. J. Econ. Surv. 2021, 35, 1168–1216. [Google Scholar] [CrossRef]
  52. Boschma, R. Proximity and Innovation: A Critical Assessment. Reg. Stud. 2005, 39, 61–74. [Google Scholar] [CrossRef]
  53. Andrade Rojas, M.G.; Solis, E.R.R.; Zhu, J.J. Innovation and Network Multiplexity: R&D and the Concurrent Effects of Two Collaboration Networks in an Emerging Economy. Res. Policy 2018, 47, 1111–1124. [Google Scholar] [CrossRef]
  54. Boschma, R.; Iammarino, S. Related variety, trade linkages, and regional growth in Italy. Econ. Geogr. 2009, 85, 289–311. [Google Scholar] [CrossRef]
  55. O’Leary, D.; Doran, J.; Power, B. Urbanisation, Concentration and Diversification as Determinants of Firm Births and Deaths. Reg. Stud. Reg. Sci. 2023, 10, 506–528. [Google Scholar] [CrossRef]
  56. Grant, R.M. Toward a Knowledge-based Theory of the Firm, Strat. Manag. J. 1996, 17, 109–122. [Google Scholar]
  57. Dickey, A.; Kosovac, A.; Fastenrath, S.; Acuto, M.; Gleeson, B. Fragmentation and urban knowledge: An analysis of urban knowledge exchange institutions. Cities 2022, 131, 103917. [Google Scholar] [CrossRef]
  58. Ren, C.; Wang, T.; Wang, L.; Zhang, Y. ‘Buzz-and-Pipeline’ Dynamics of Urban Dual Innovation: Evidence from China’s Biomedical Industry. Appl. Geogr. 2023, 158, 103048. [Google Scholar] [CrossRef]
  59. Lin, S.; Chen, Z.; He, Z. Intra-City Industrial Collaborative Agglomeration, Inter-City Network Connectivity and Green Technology Innovation. Sustainability 2021, 13, 8835. [Google Scholar] [CrossRef]
  60. Thrane, S.; Blaabjerg, S.; Møller, R.H. Innovative Path Dependence: Making Sense of Product and Service Innovation in Path Dependent Innovation Processes. Res. Policy 2010, 39, 932–944. [Google Scholar] [CrossRef]
  61. Muller, E.; Peres, R. The Effect of Social Networks Structure on Innovation Performance: A Review and Directions for Research. Int. J. Res. Mark. 2019, 36, 3–19. [Google Scholar] [CrossRef]
  62. Yao, L.; Li, J. Intercity Innovation Collaboration and the Role of High-Speed Rail Connections: Evidence from Chinese Co-Patent Data. Reg. Stud. 2022, 56, 1845–1857. [Google Scholar] [CrossRef]
  63. Yang, Q.; Zhu, Z.; Wang, J.; Cao, C. A Tale of Two Ties: The Impact of a Focal City’s Direct and Indirect Collaboration Networks on Regional Innovation. J. Technol. Transf. 2024, 49, 1–42. [Google Scholar] [CrossRef]
  64. Wuyts, S.; Dutta, S. Benefiting From Alliance Portfolio Diversity: The Role of Past Internal Knowledge Creation Strategy. J. Manag. 2014, 40, 1653–1674. [Google Scholar] [CrossRef]
  65. Leten, B.; Belderbos, R.; Van Looy, B. Technological Diversification, Coherence, and Performance of Firms. J. Prod. Innov. Manag. 2007, 24, 567–579. [Google Scholar] [CrossRef]
  66. Li, D.; Wei, Y.D.; Wang, T. Spatial and Temporal Evolution of Urban Innovation Network in China. Habitat Int. 2015, 49, 484–496. [Google Scholar] [CrossRef]
  67. World Intellectual Property Organization (WIPO). Global Innovation Index 2023: Innovation in the Face of Uncertainty; WIPO: Geneva, Switzerland, 2023. [Google Scholar] [CrossRef]
  68. Bunnell, T.G.; Coe, N.M. Spaces and Scales of Innovation. Prog. Hum. Geogr. 2001, 25, 569–589. [Google Scholar] [CrossRef]
  69. Wang, X.; Wang, Y. Research on the Green Innovation Promoted by Green Credit Policies. J. Manag. World 2021, 37, 173–188+11. [Google Scholar] [CrossRef]
  70. Łopucki, R.; Klich, D.; Kitowski, I.; Kiersztyn, A. Urban Size Effect on Biodiversity: The Need for a Conceptual Framework for the Implementation of Urban Policy for Small Cities. Cities 2020, 98, 102590. [Google Scholar] [CrossRef]
  71. Wen, H.; Zhang, Q.; Zhu, S.; Huang, Y. Inter- and Intra-City Networks: How Networks Are Shaping China’s Film Industry. Reg. Stud. 2021, 55, 533–545. [Google Scholar] [CrossRef]
  72. Basile, R.; Benfratello, L.; Castellani, D. Geoadditive Models for Regional Count Data: An Application to Industrial Location. Geogr. Anal. 2013, 45, 28–48. [Google Scholar] [CrossRef]
  73. Liang, X.; Hidalgo, C.A.; Balland, P.-A.; Zheng, S.; Wang, J. Intercity Connectivity and Urban Innovation. Comput. Environ. Urban Syst. 2024, 109, 102092. [Google Scholar] [CrossRef]
  74. Pancholi, S.; Yigitcanlar, T.; Guaralda, M.; Mayere, S.; Caldwell, G.A.; Medland, R. University and Innovation District Symbiosis in the Context of Placemaking: Insights from Australian Cities. Land Use Policy 2020, 99, 105109. [Google Scholar] [CrossRef]
  75. Brunnermeier, M.; Rother, S.; Schnabel, I. Asset Price Bubbles and Systemic Risk. Rev. Financ. Stud. 2020, 33, 4272–4317. [Google Scholar] [CrossRef]
  76. Yang, T.-C.; Matthews, S.A.; Park, K. Looking through a Different Lens: Examining the Inequality-Mortality Association in U.S. Counties Using Spatial Panel Models. Appl. Geogr. 2017, 86, 139–151. [Google Scholar] [CrossRef]
  77. Gao, Y.; Scherngell, T.; Neuländtner, M. Drivers for Inter-City Innovation Networks Across Chinese Cities: Modelling Physical Versus Intangible Effects. Chin. Geogr. Sci. 2024, 34, 706–721. [Google Scholar] [CrossRef]
  78. Wang, S.; Wang, J.; Wei, C.; Wang, X.; Fan, F. Collaborative Innovation Efficiency: From within Cities to between Cities—Empirical Analysis Based on Innovative Cities in China. Growth Change 2021, 52, 1330–1360. [Google Scholar] [CrossRef]
  79. De Noni, I.; Ganzaroli, A.; Orsi, L. The Impact of Intra- and Inter-Regional Knowledge Collaboration and Technological Variety on the Knowledge Productivity of European Regions. Technol. Forecast. Soc. Change 2017, 117, 108–118. [Google Scholar] [CrossRef]
  80. Nieto, M.J.; Santamaría, L. The Importance of Diverse Collaborative Networks for the Novelty of Product Innovation. Technovation 2007, 27, 367–377. [Google Scholar] [CrossRef]
  81. Xiao, H.; Cui, X.; Sarker, M.N.I.; Firdaus, R.B.R. Impact of Industry-University-Research Collaboration and Convergence on Economic Development: Evidence from Chengdu-Chongqing Economic Circle in China. Heliyon 2023, 9, e21082. [Google Scholar] [CrossRef]
  82. Flor, M.L.; Cooper, S.Y.; Oltra, M.J. External Knowledge Search, Absorptive Capacity and Radical Innovation in High-Technology Firms. Eur. Manag. J. 2018, 36, 183–194. [Google Scholar] [CrossRef]
  83. Felin, T.; Hesterly, W.S. The Knowledge-Based View, Nested Heterogeneity, and New Value Creation: Philosophical Considerations on the Locus of Knowledge. Acad. Manag. Rev. 2007, 32, 195–218. [Google Scholar] [CrossRef]
  84. Zhou, Y.; Zheng, W.; Wang, X.; Du, N. Urban Economic Efficiency under the Interactive Effect of Urban Hierarchy and Connection Networks in China. J. Geogr. Sci. 2024, 34, 2315–2332. [Google Scholar] [CrossRef]
  85. Wen, J.; Qualls, W.J.; Zeng, D. To Explore or Exploit: The Influence of Inter-Firm R&D Network Diversity and Structural Holes on Innovation Outcomes. Technovation 2021, 100, 102178. [Google Scholar] [CrossRef]
  86. Agrawal, A.; Kapur, D.; McHale, J. How Do Spatial and Social Proximity Influence Knowledge Flows? Evidence from Patent Data. J. Urban Econ. 2008, 64, 258–269. [Google Scholar] [CrossRef]
  87. Zhang, M.; Partridge, M.D.; Song, H. Amenities and the Geography of Innovation: Evidence from Chinese Cities. Ann. Reg. Sci. 2020, 65, 105–145. [Google Scholar] [CrossRef]
  88. Cui, L.; Shen, J.; Mai, Z.; Lin, C.; Wang, S. Spatial Distribution and Location Determinants of High-Tech Firms in Shenzhen, a Chinese National Innovative City. Land 2024, 13, 1355. [Google Scholar] [CrossRef]
  89. Zhu, H.; Peng, J.; Dai, Q.; Yang, H. Exploring the Long-Term Threshold Effects of Density and Diversity on Metro Ridership. Transp. Res. Part D Transp. Environ. 2024, 128, 104101. [Google Scholar] [CrossRef]
  90. Wang, G.; Gan, Y.; Yang, H. The Inverted U-Shaped Relationship between Knowledge Diversity of Researchers and Societal Impact. Sci. Rep. 2022, 12, 18585. [Google Scholar] [CrossRef]
  91. Capone, F.; Lazzeretti, L.; Innocenti, N. Innovation and Diversity: The Role of Knowledge Networks in the Inventive Capacity of Cities. Small Bus. Econ. 2021, 56, 773–788. [Google Scholar] [CrossRef]
Figure 1. Study area and division of township units.
Land 14 01115 g001
Figure 2. Structure of co-invention network in Beijing.
Land 14 01115 g002
Figure 3. Structural changes of ICN in Beijing.
Land 14 01115 g003
Figure 4. Statistics of scale and functional diversity.
Land 14 01115 g004
Figure 5. Distributional changes in scale and functional diversity.
Land 14 01115 g005
Figure 6. Marginal effects of scale and functional diversity.
Land 14 01115 g006
Table 1. Definitions of ICNs in existing studies.
DefinitionNodesConnectionsSources
A dense innovation network connecting SMEs with different firms, research institutions, suppliers, and customersSMEExtent of cooperation[30]
Complex relationships between different innovation players within the cityDistrict/county unitsPatent assignment relationship[28]
Cooperation between universities and colleges, universities and enterprises, and universities and research institutionsUniversityCo-authored patent[29]
Technical cooperation among R&D entitiesInventorsCo-authored patent[13]
Innovation network between software and service firms and other institutionsCityCo-authored patent[31]
Table 2. Index of influencing factors.
VariableIndicatorsCodeDescription
Dependent variablesInnovation capacities of townshipsInno_capacityNumber of three types of patents in townships
Core variablesLevel of scale diversity of ICNSDDiversification of cross-scale co-invention connections
Level of functional diversity of ICNFDDiversification of cross-sector co-invention connections
Moderating variableLevel of industry diversity of townshipsIDDegree of dispersion in manufacturing industry
Control variablesEconomic developmentPGDPLn GDP of townships
PopulationPopLn population of townships
Built environment qualityBEQLn Euclidean distance from townships’ centroid to nearest metro station
Dummy variableAbsence of universityUNIExisting as 1, otherwise as 0
Table 3. The regression results of the different models.
VariablesM1M2M3M4M5M6M7
SD0.353 ***0.603 *** 0.387 ***0.399 **
SD2 −0.234 **
FD 0.231 ***0.615 ***0.167 ** 0.542 ***
FD2 −0.382 ***
SD × FD −0.132
ID 0.387 ***0.517 ***
SD × ID −0.106
FD × ID −0.379 **
BEQ−0.669 ***−0.650 ***−0.729 ***−0.691 ***−0.627 ***−0.561 ***−0.569 ***
Pop0.478 ***0.472 ***0.487 ***0.508 ***0.483 ***0.532 ***0.570 ***
PGDP0.481 ***0.477 ***0.495 ***0.491 ***0.483 ***0.531 ***0.541 ***
UNI0.596 **0.518 **0.367 *0.365 *0.501 **0.467 **0.267
-cons0.0010.017−0.065−0.0450.0170.0190–0.047
Wald chi2916.720888.460826.600854.610900.840907.480840.930
Prob > chi20.0000.0000.0000.0000.0000.0000.000
Obs1029102910291029102910291029
Log likelihood−3776.982−3773.465−3808.042−3798.948−3773.363−3754.622 −3776.724
Notes: *** p < 0.01, ** p < 0.05, * p < 0.1.
Table 4. The regression results obtained through changing the local innovation capacity measure.
VariablesM1M2M3M4M5M6M7
SD0.318 ***0.633 *** 0.427 ***0.301 *
SD2 −0.271 **
FD 0.163 ***0.531 ***0.211 ** 0.554 **
FD2 −0.344 ***
SD × FD −0.233 **
ID 0.458 ***0.638 ***
SD × ID −0.019
FD × ID −0.424 *
BEQ−0.564 ***−0.517 ***−0.649 ***−0.601 ***−0.501 ***−0.471 ***−0.521 ***
Pop1.080 ***1.120 ***1.178 ***1.173 ***1.109 ***1.192 ***1.286 ***
PGDP0.431 ***0.408 ***0.419 ***0.418 ***0.416 ***0.419 ***0.405 ***
UNI0.2780.2620.1380.1190.2030.2550.035
-cons0.615 ***0.644 ***0.539 ***0.535 ***0.625 ***0.628 ***0.513 ***
Wald chi21182.1101195.350969.780989.7701207.8601386.5201190.610
Prob > chi20.0000.0000.0000.0000.0000.0000.000
Obs1029102910291029102910291029
Log likelihood−1458.437−1452.912−1486.625−1487.919−1453.165−1436.156−1485.861
Notes: *** p < 0.01, ** p < 0.05, * p < 0.1.
Table 5. The regression results obtained through reducing the sample size.
VariablesM1M2M3M4M5M6M7
SD0.403 ***0.495 *** 0.508 ***0.209
SD2 −0.088
FD 0.191 ***0.657 ***0.178 ** 0.427 **
FD2 −0.489 ***
SD × FD −0.243 **
ID 0.398 ***0.474 ***
SD × ID 0.201
FD × ID −0.251
BEQ−0.637 ***−0.630 ***−0.674 ***−0.621 ***−0.595 ***−0.521 ***−0.540 ***
Pop0.606 ***0.596 ***0.674 ***0.764 ***0.636 ***0.570 ***0.629 ***
PGDP0.466 ***0.464 ***0.479 ***0.458 ***0.464 ***0.487 ***0.507 ***
UNI0.5130.4990.1790.1870.4610.2570.012
-cons0.129 *0.130 *−0.0090.0420.145 *0.162 **−0.008
Wald chi2866.120848.100694.670784.410871.500922.370688.970
Prob > chi20.0000.0000.0000.0000.0000.0000.000
Obs926926926926926926926
Log likelihood−2929.925−2929.501−2967.688−2955.401−2925.289−2906.777−2945.229
Notes: *** p < 0.01, ** p < 0.05, * p < 0.1.
Table 6. The regression results obtained using the two-way fixed effects model.
VariablesM1M2M3M4M5M6M7
SD0.178 ***0.333 *** 0.147 **0.180
SD2 −0.142
FD 0.129 ***0.394 ***0.074 0.247 *
FD2 −0.250 **
SD × FD 0.013
ID 0.263 ***0.311 ***
SD × ID −0.009
FD × ID −0.124
BEQ−0.715 ***−0.701 ***−0.743 ***−0.711 ***−0.696 ***−0.646 ***−0.660 ***
Pop0.119 *0.114 *0.101 *0.117 *0.110 *0.128 *0.113 *
PGDP−0.048−0.044−0.041−0.042−0.039−0.013−0.007
UNI1.224 ***1.190 ***1.035 ***0.987 ***1.132 ***1.127 ***0.941 ***
-cons−0.299 ***−0.280 ***−0.325 ***−0.298 ***−0.275 ***−0.271 ***−0.302 ***
Wald chi22055.4102024.0801934.1101961.6102045.2602093.0701954.970
Prob > chi20.0000.0000.0000.0000.0000.0000.000
Obs1029102910291029102910291029
Log likelihood−3573.972−3572.206−3580.721−3574.667−3571.053−3562.842−3568.403
Notes: *** p < 0.01, ** p < 0.05, * p < 0.1.
Table 7. The regression results obtained by changing the Jacobs’ externalities measure.
VariablesM1M2
SD0.961 ***
FD 0.685 ***
SD × FD
LUD0.200 ***0.190 ***
SD × LUD−0.630 **
FD × LUD −0.477 *
BEQ−0.649 ***−0.713 ***
Pop0.442 ***0.443 ***
PGDP0.460 ***0.472 ***
UNI0.655 ***0.438 *
-cons0.013−0.057
Wald chi2944.470846.410
Prob > chi20.0000.000
Obs10291029
Log likelihood−3768.512−3800.466
Notes: *** p < 0.01, ** p < 0.05, * p < 0.1.
Disclaimer/Publisher’s Note: The statements, opinions and data contained in all publications are solely those of the individual author(s) and contributor(s) and not of MDPI and/or the editor(s). MDPI and/or the editor(s) disclaim responsibility for any injury to people or property resulting from any ideas, methods, instructions or products referred to in the content.

