1. Introduction
As urban density increases and cities expand, there is a decrease in urban livability, which is closely linked to social, economic, and environmental crises [
1]. Modern indoor lifestyles have led to a progressive disconnect between humans and nature, with consequential adverse impacts on well-being [
2], increasing the risk of diseases due to exposure to more polluted air [
3], and mental disorders [
4].
Comparative studies have highlighted that many cities worldwide have significant tree canopy deficits when tested against the 3-30-300 rule. This rule ensures nature is visible at three key distances: 3 feet (small plants), 30 feet (larger greenery), and 300 feet (larger green spaces) [
5]. This insufficient urban canopy, driven by both anthropization and climate change, exacerbates nature inequity and negatively impacts both humans and cityscapes. In response, cities often draw on natural capital to implement cost-effective interventions—such as those associated with green gentrification—thereby perpetuating an inequitable use of Earth’s resources [
6]. Alternatively, they may invest in green urbanism, which promotes a zero-emission city model focused on reducing ecological impacts, rather than prioritizing vegetation for recreation or landscape enhancement [
7]. A biophilic city model, by contrast, places nature at the core of urban planning and management [
8], recognizing the importance of experiencing biophilia—the inherent human affiliation with living beings [
9]—in everyday life. By integrating nature into the built environment through design [
10], biophilic urbanism (BU) fosters human–nature connections and their related benefits for physical health [
11], mental well-being [
12], society [
13], the environment [
14], and the economy [
15]. BU is an applied research field that stems from the integration of biophilic principles into the built environment through design and planning. While it incorporates nature-based solutions as its foundational setting, BU differs from other urban approaches—such as green, blue, or brown architecture—by prioritizing prolonged and high-quality human exposure to nature, with the aim of maximizing the resulting positive effects on citizens’ well-being. BU has recently gained traction as a response to the growing negative impacts of urbanization on livability and climate resilience [
16]. Despite scientific evidence supporting its benefits across disciplines [
16], knowledge gaps persist regarding where and how people can best access nature across urban scales.
As the extensive literature has shown, blue-green infrastructure plays a crucial role in providing ecosystem services and ensuring better living conditions for all species [
16,
17]. However, the current urban policies underestimate the functional value of natural capital, reducing it to an esthetic complement to urban landscapes. This limited perspective not only damages citizens’ quality of life but also undermines each city’s potential to develop climate resilience [
18]. Urban policies struggle due to a lack of financial resources and inefficient use of natural ones, resulting in unequal management of city areas, where overdeveloped spaces driven by green gentrification alternate with leftover spaces. These latter are informal or underutilized areas, lacking a comprehensive strategy that prioritizes their function [
19]. Although approached as fragmented green spaces, they contribute to promoting ecological connectivity, supporting wildlife, preserving biodiversity, and providing recreational opportunities for residents at both the local and metropolitan scales [
19,
20,
21]. Most current trends in landscape design and planning blend ecological perspectives with socio-cultural dimensions [
22,
23]. In efforts to build climate-adapted cities, they primarily focus on bio-regions or territorial systems [
18,
21,
22,
23], often neglecting small-scale systems with their dynamics, such as leftover spaces. Policies supporting citizen participation in the renewal of these spaces remain limited, thereby undermining their potential as human-centered environments [
24].
The esthetic marginalization of urban nature, the lack of a unifying vision of the city as a living organism, and limited community engagement in future developments represent the main gaps in the urban agenda. Within this context, BU is usually excluded or understated, despite its potential to value existing green spaces and support the creation of new ones for integrating resource-efficient and ecological cities [
18]. To bridge these gaps, we advocate for a holistic approach that uses nature as a key strategy to achieve human and environmental benefits, involving citizens in processes of urban or spatial transformation. In pursuit of a paradigm shift in urban policies and practices, we promote BU principles to make cities more equitable, sustainable, and resilient. We aim to answer the following research questions (RQs):
RQ1: How can urban nature improve livability in the built environment?
RQ2: How can BU renew urban landscapes, restoring human–nature interactions and enhancing ecosystem services?
To reply to these questions through biophilic experiences across different settings, scales, times, and modalities, the paper is organized as follows. First, we outline the materials and methods in terms of the livability criteria and design tools, following the structure of a workshop that allowed us to collect firsthand data on the positive effects of biophilia in urban contexts. Second, we examine biophilic benefits through a real-time experience in a Living Lab setting at the micro scale. Third, we recall these benefits through participants’ memories, identify them with specific nature-based settings at the macro scale, and spatially map them within the Amsterdam case study. Then, we explore biophilia through a co-design process by applying BU tools to enhance human–nature interactions and leverage ecosystem services in leftover urban spaces at the meso scale. Finally, we reflect on the outcomes of each approach to underline BU’s potential for urban planning as a response to our RQs, thus contributing to the advancement of the field by addressing existing knowledge gaps and informing future directions.
2. Materials and Methods
2.1. Study Area
The city of Amsterdam was selected for the case study. The capital of the Netherlands spans approximately 220 km
2 [
25] and has a rapidly growing population, which is expected to reach one million residents by 2030 [
26]. Although not yet included in the Biophilic Cities network [
27], Amsterdam has considerable potential to become part of it thanks to its blue-green infrastructure and urban policies. More than 61% of the public space in Amsterdam is green, with 15% of the city covered by trees and 35% by waterways. Public green spaces consist of agricultural areas (35%), natural areas (26%), neighborhood areas (23%), and recreational areas (16%) [
28]. Despite these positive figures, a recent study indicated that Amsterdam falls short of the 3-30-300 rule: around half of the buildings have a view of at least three trees, 52% are within 300 m of a park, but none meet the 30% canopy cover benchmark [
5]. However, a previous report by the European Environment Agency estimated the city’s canopy cover at up to 14% [
29]. This deficiency highlights the need for increased greening initiatives that adhere to higher quantitative and qualitative standards. In compliance with the EU Green New Deal, Amsterdam adopted a new environmental plan to become a climate-neutral city with a circular economy by 2050 [
26]. With a special emphasis on natural capital, the new “Amsterdam Green Infrastructure Vision 2050” aims to make the city more livable for people, plants, and animals [
30]. This biophilic-oriented plan recognizes the value of urban nature for individual health, social well-being, leisure, climate adaptation, and biodiversity. It established principles to ensure the adequate presence of green spaces, equitable distribution, fair access, and management and conservation through collective efforts. Moreover, it expands the existing green systems, providing a series of nature-based solutions to strengthen the social, spatial, and ecological connections [
31]. Amsterdam city has served as a test bed to explore the positive effects of biophilia experienced at the macro, meso, and micro scales.
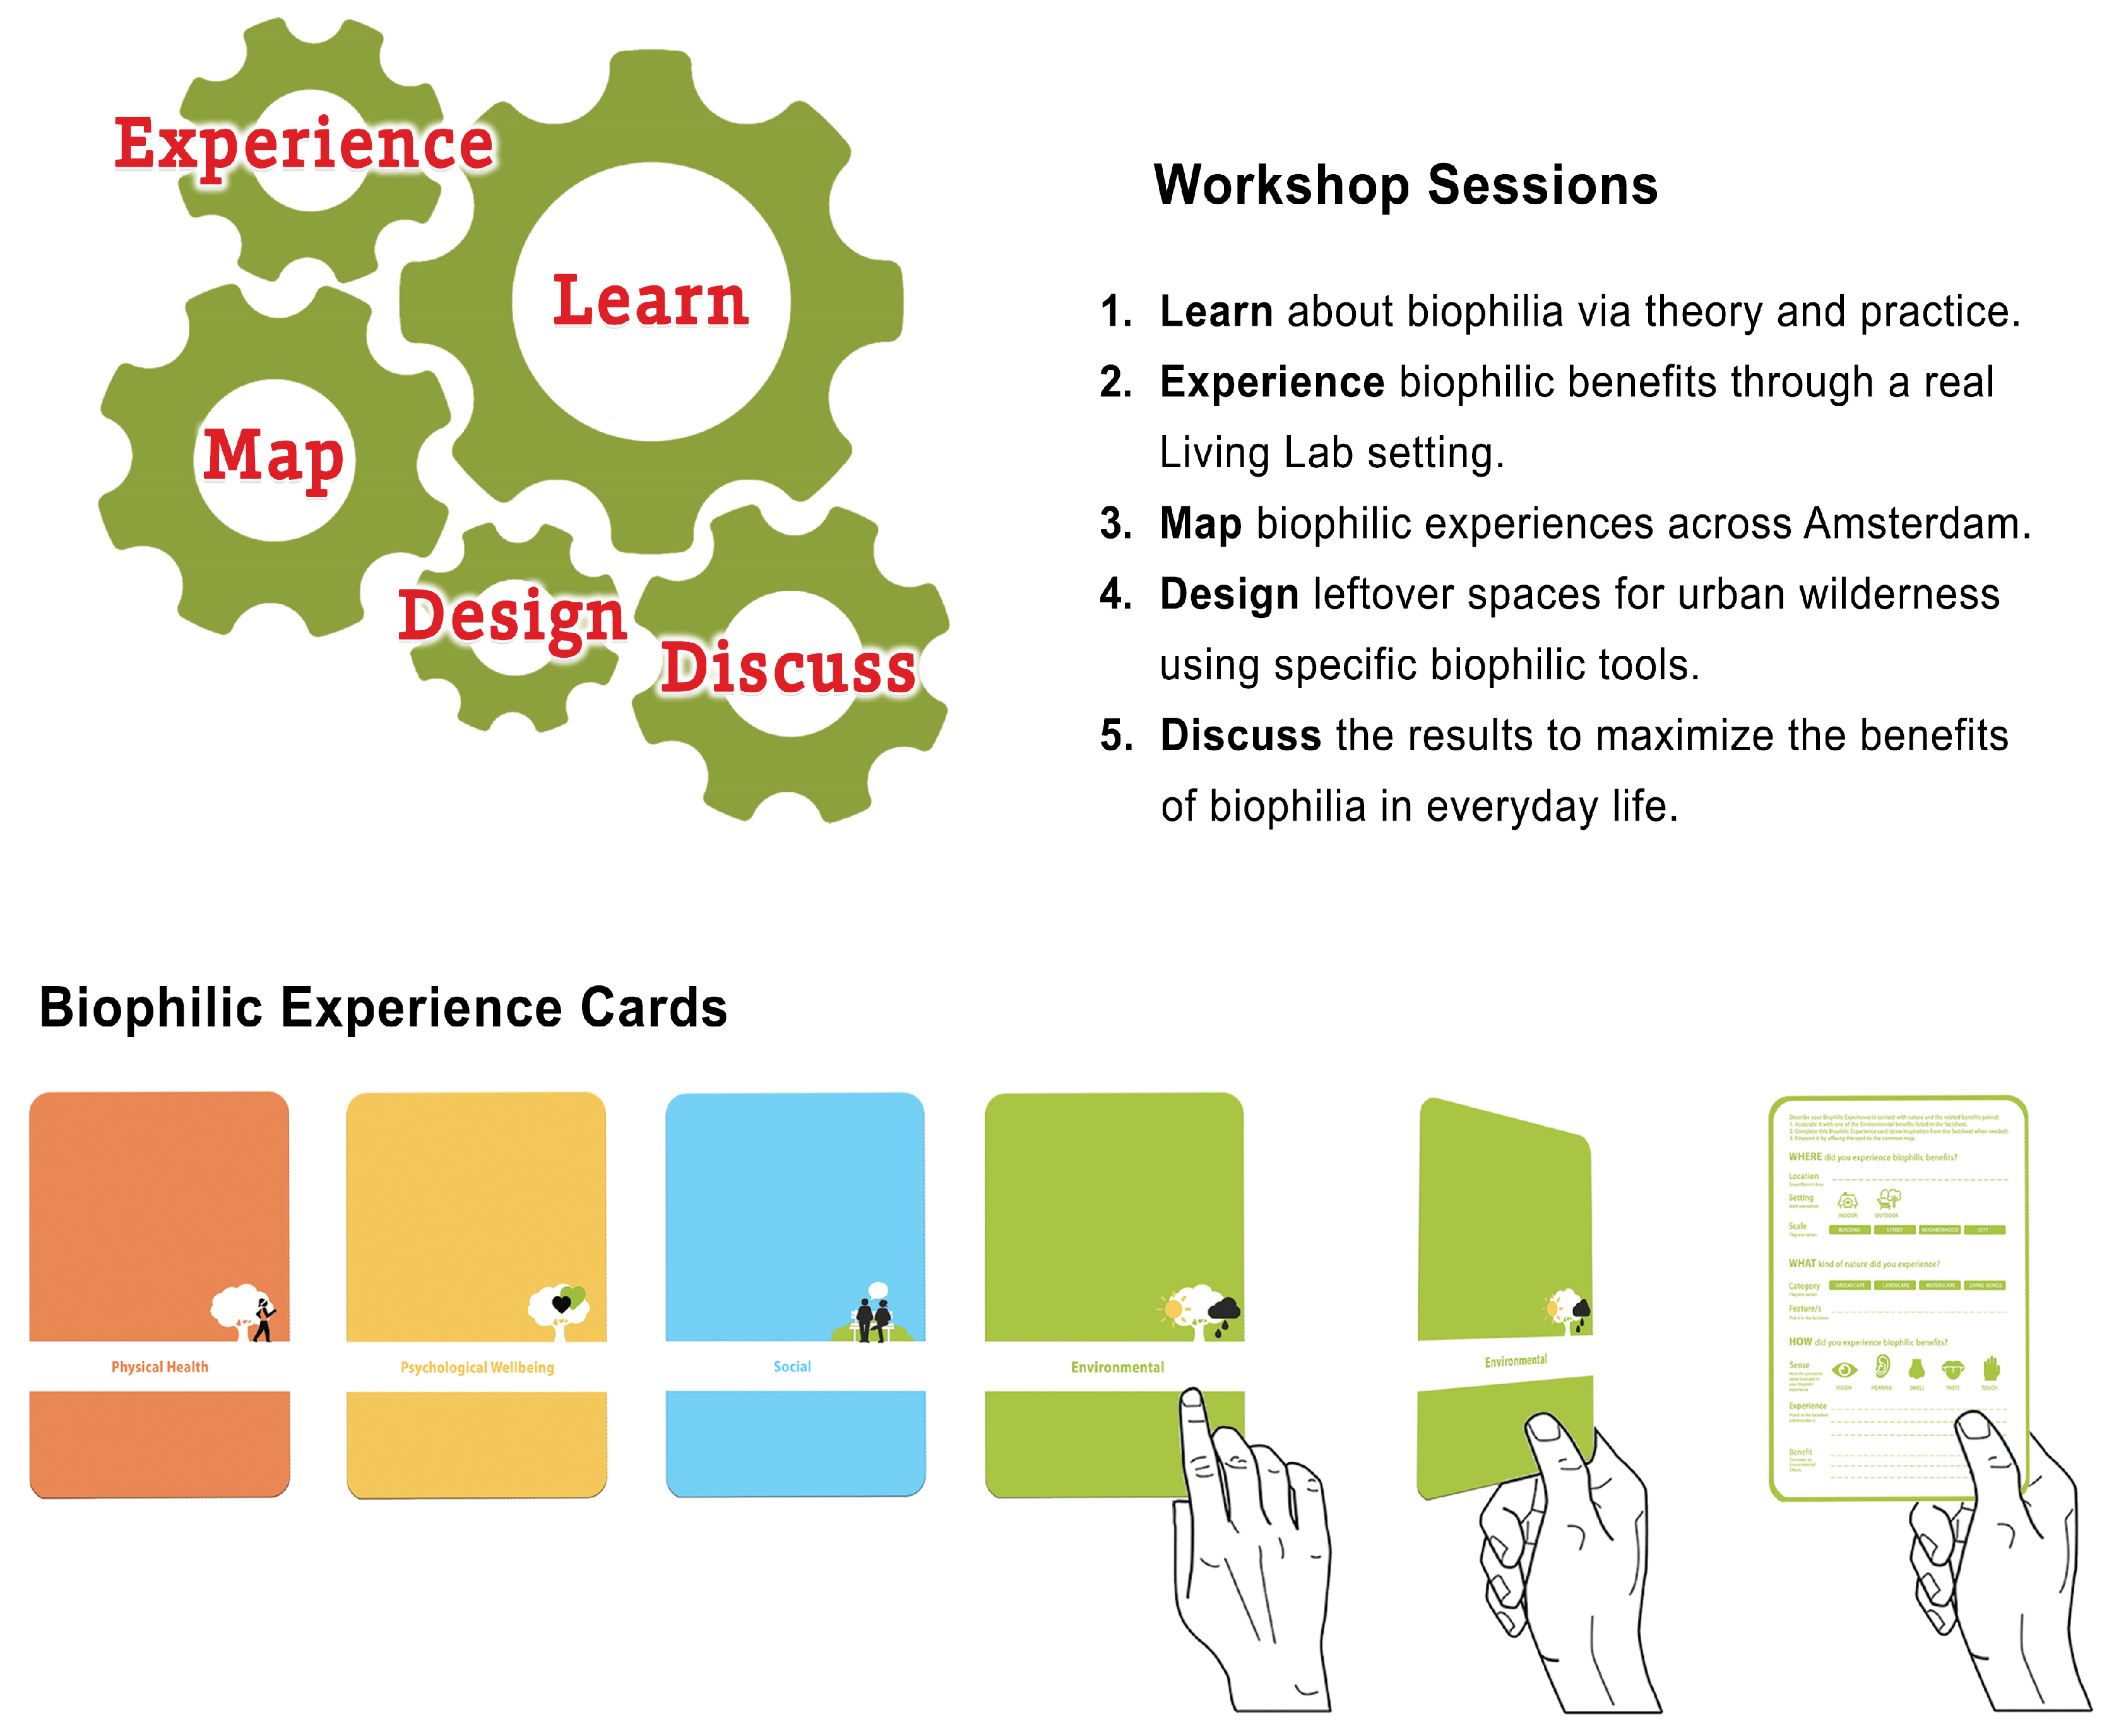
2.2. Research Design
This study combined different methods to structure a 5-session workshop aimed at raising awareness of nature’s impact on urban livability, testing our approach in real-world settings, and collecting primary data (
Figure 1). These sessions included:
(1) Learn. The workshop integrated both theoretical and practical components. Each hands-on activity was preceded by an introduction or micro-lesson that provided essential content for completing the operative tasks. This theoretical foundation contributed to a broader learning process aimed at disseminating biophilic culture. The workshop emphasized the concept of ‘biophilic experience’ as a sense-based approach to reconnect people with nature in the built environment and to harness its multiple benefits for cities and citizens. This approach was intended to inspire participants to repeat similar experiences beyond the workshop, in the urban places they most frequently visit, either alone or with friends and family.
(2) Experience. To address RQ1, we adopted an empirical approach, proposing a real-time biophilic experience within a Living Lab setting. Following a brief introduction to the concept of biophilia and its benefits, along with an overview of the site, participants engaged in an on-site immersive activity. They were asked to spend up to 20 min interacting with nature using all five senses and to reflect on the positive effects they perceived on themselves, other forms of life, or the surrounding environment. To preserve participants’ freedom of action and response, only essential instructions were provided. Nonetheless, to guide reflection, we defined four key dimensions of biophilic benefits: Physical Health, Psychological Well-being, Social, and Environmental [
16]. Depending on the type of activity, natural features, and senses involved, these benefits could be experienced individually or simultaneously within a single biophilic experience [
16]. Furthermore, the literature suggests that the positive effects of biophilia are amplified through multisensory interactions with nature and are maximized in urban landscapes with higher biodiversity or those that integrate multiple features within the same natural setting, such as blue-green infrastructure, varied plant species, and both wet and dry wilderness elements [
16,
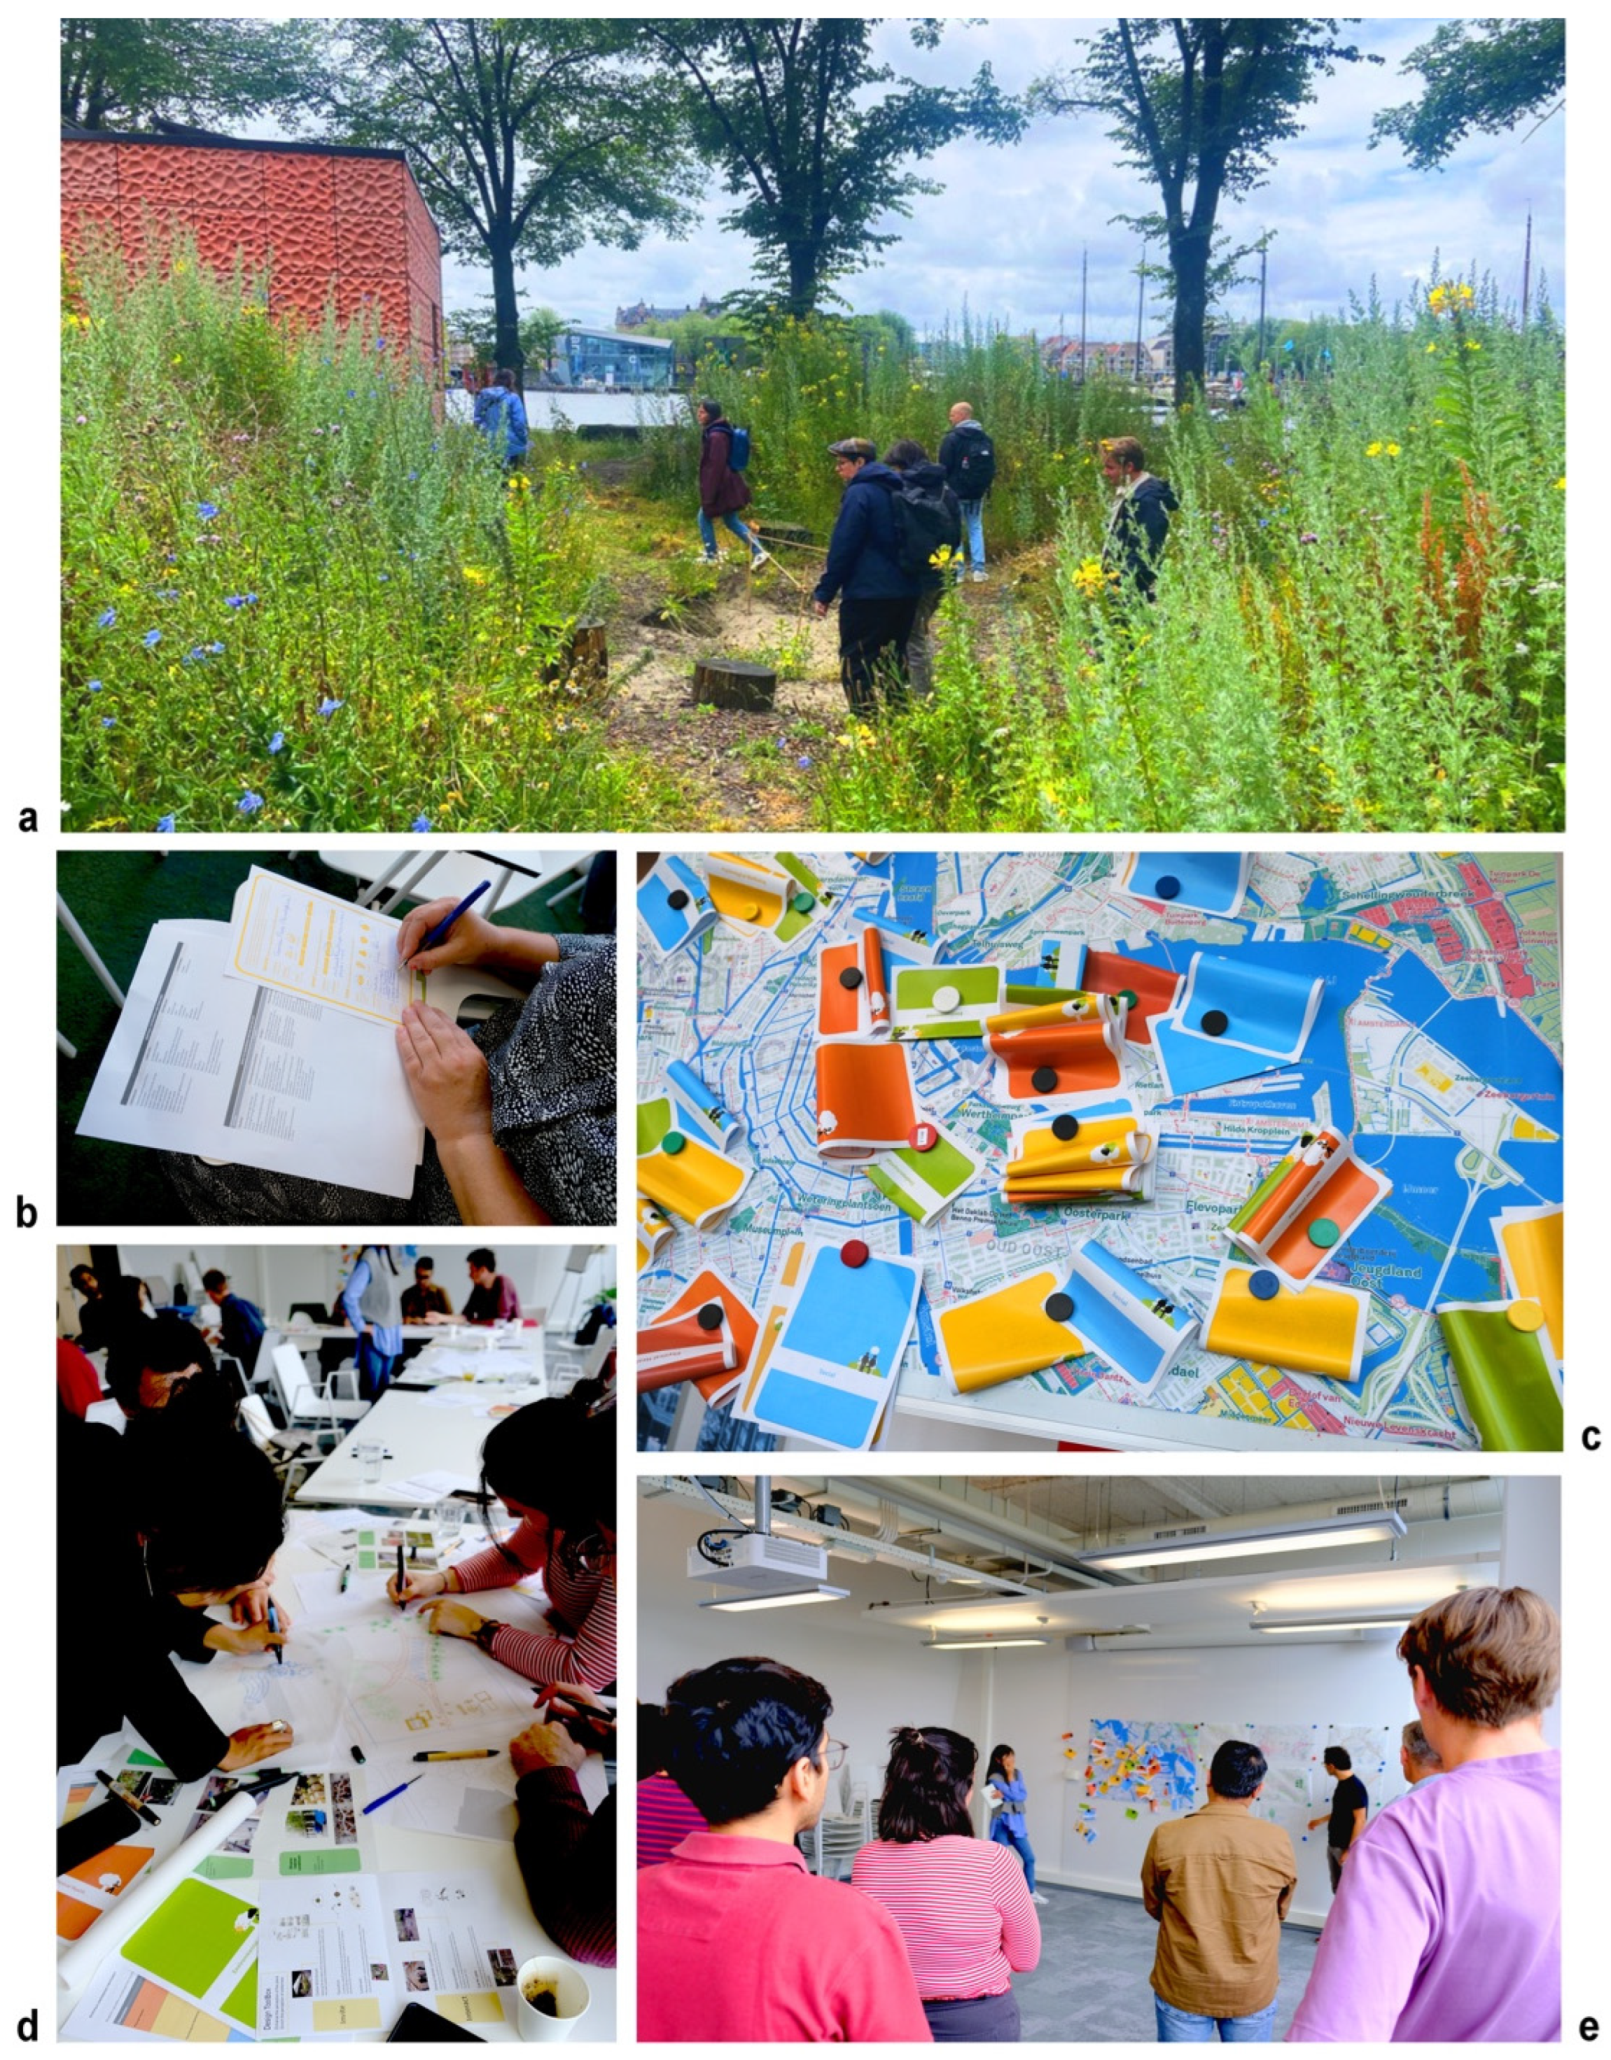
32]. The field research was conducted at the “Leftover Green Field Lab” in Marineterrein as a testing ground to investigate biophilic benefits at the micro scale. Originally initiated by Luo’s project, this space rehabilitated a leftover green area through minimal interventions by enhancing ecosystem services and fostering interspecies exchanges [
33]. Using the Living Lab methodology—which actively involves users in the design, testing, and evaluation of solutions in real-life contexts [
34]—this 250 m
2 open-air laboratory serves as a testbed for developing new ways to incorporate wilderness into the city of Amsterdam [
35]. As an outdoor biophilic setting, it stimulates engagement with blue-green infrastructure, native plants, shrubs, trees, grasses, moist soil, earthen mounds, tree trunks, sunlight, shade, and hotspots for animal restoration and feeding (
Figure 2).
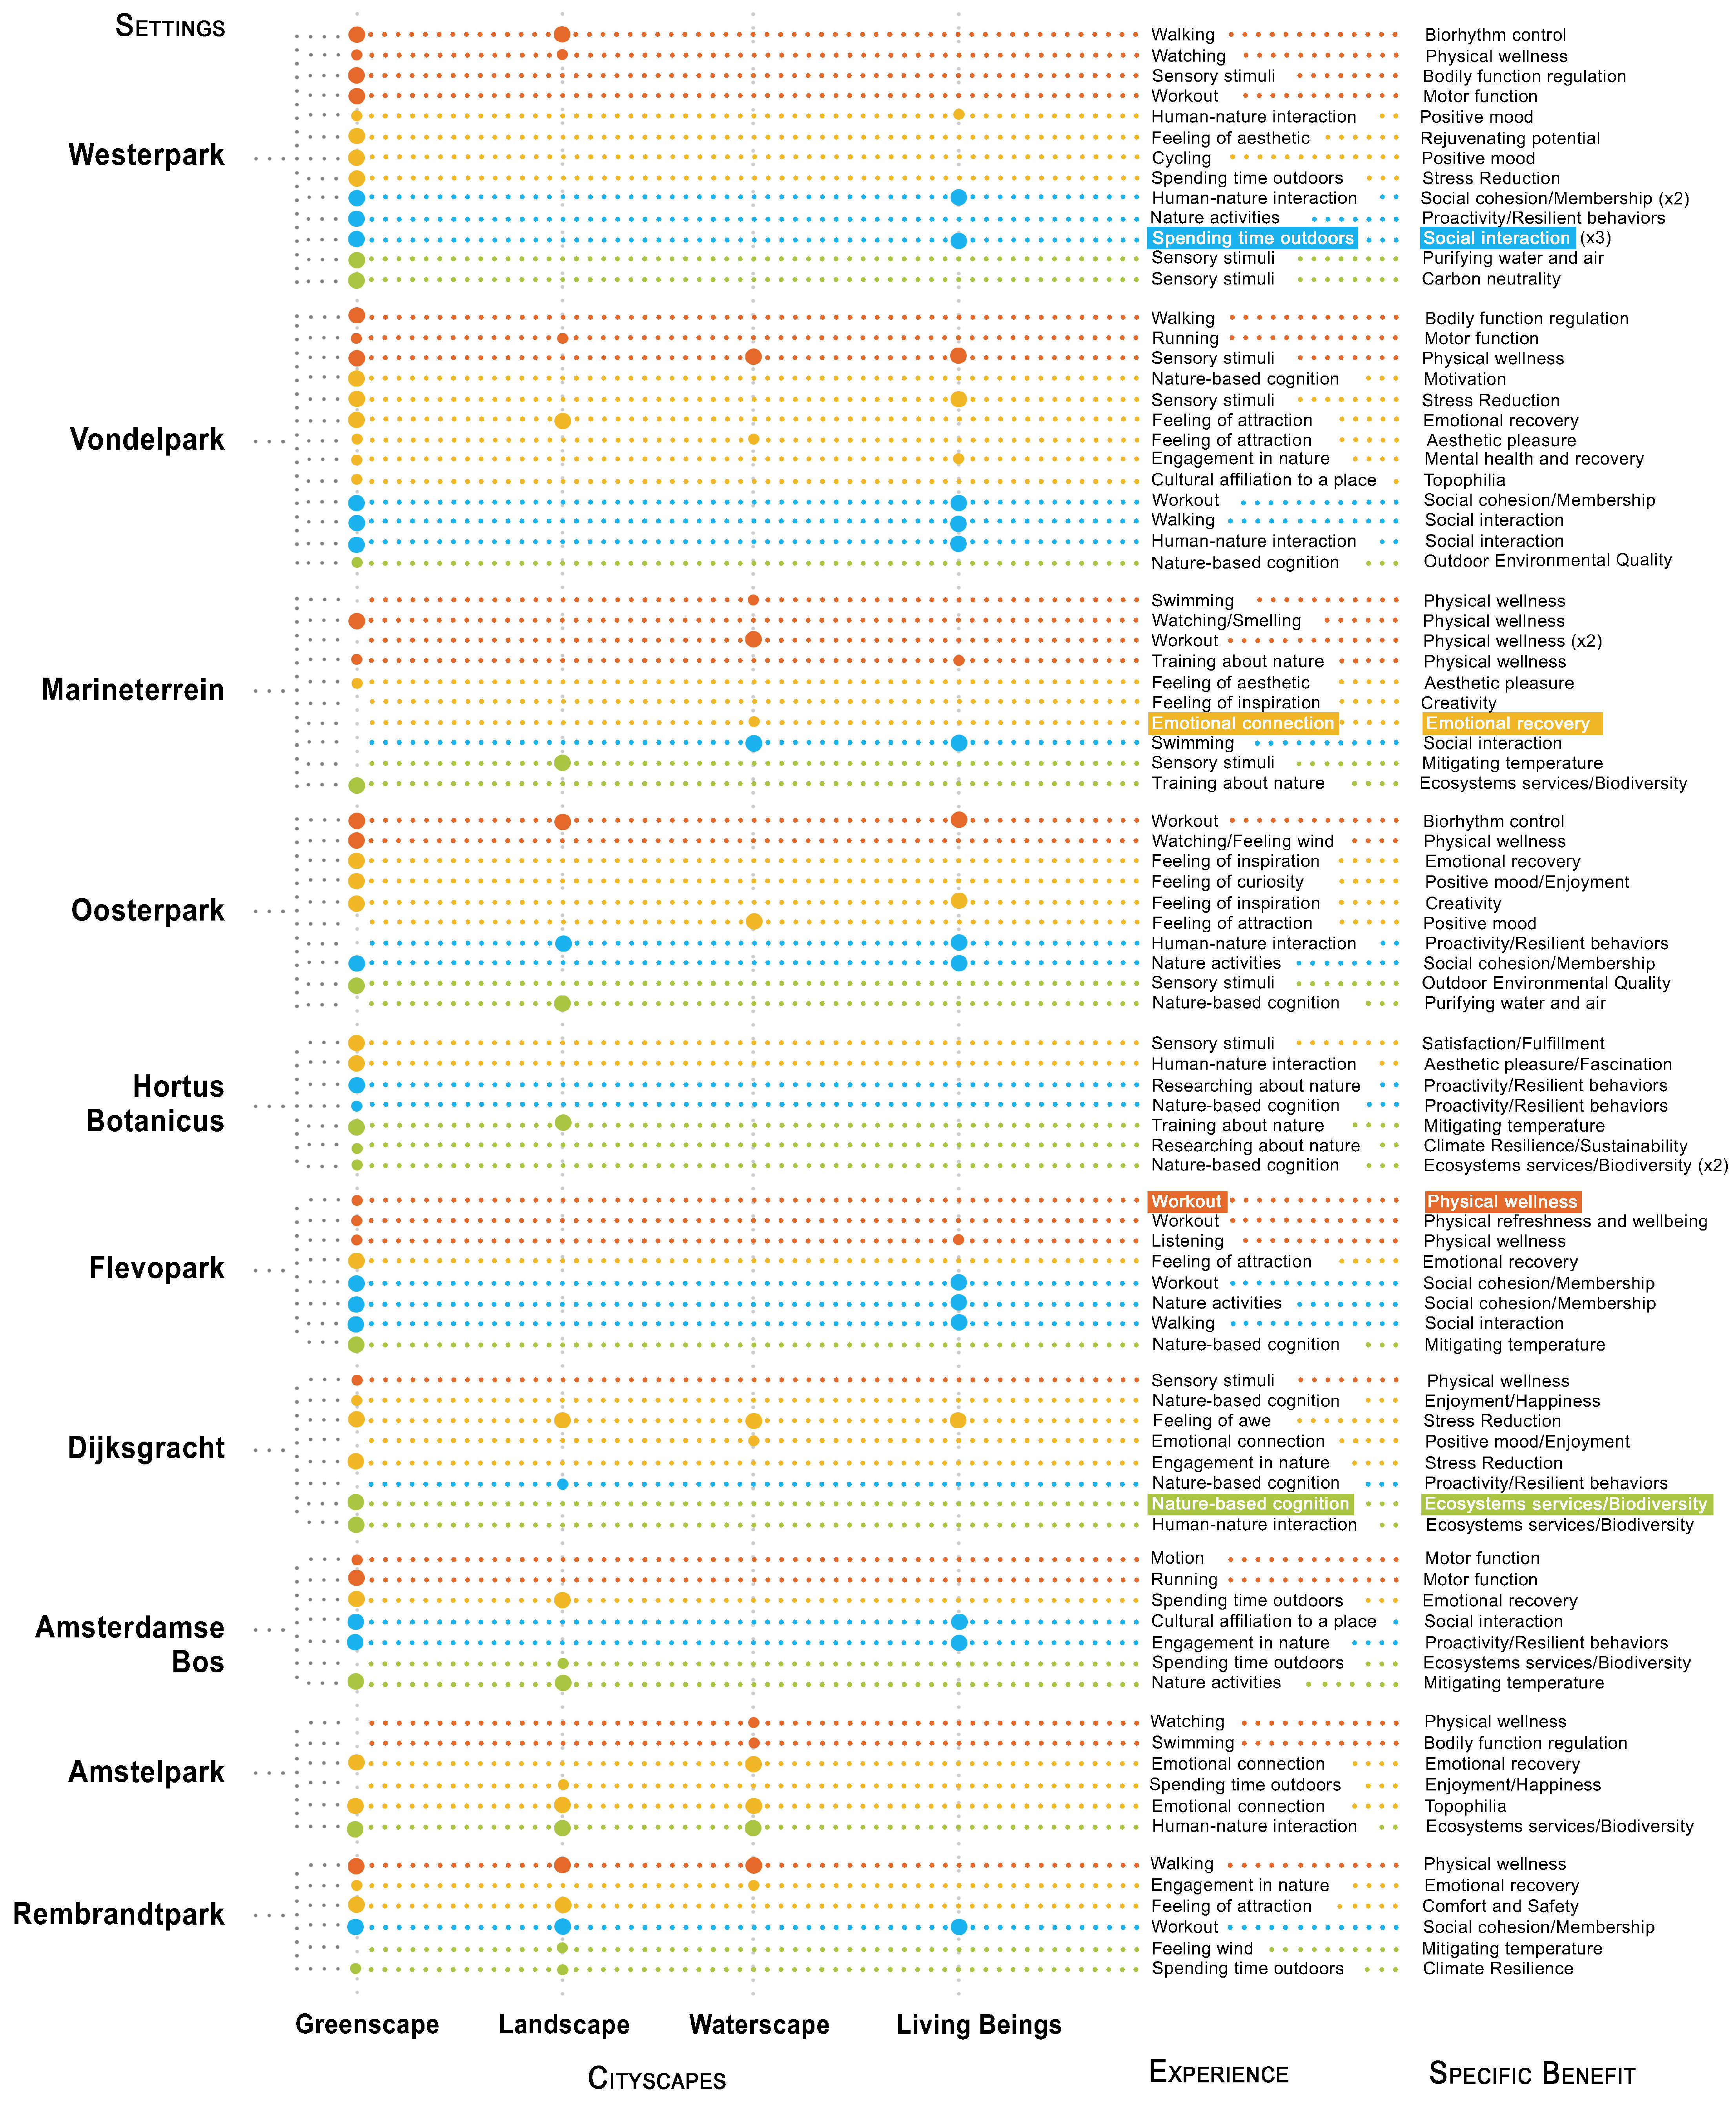
(3) Map. Spanning urban scales, we applied the same experiential approach used in the first workshop session, moving from the micro-scale Living Lab to the macro-scale city of Amsterdam. Biophilia was explored through cognitive-associative processes, as participants were invited to recall memories of similar biophilic experiences and associate each with a specific location in the city, the type of experience, the natural context in which it occurred, and the perceived positive effects. These detailed data were gathered using Biophilic Experience Cards (BEC), which visually represented the four dimensions of biophilic benefits through color coding and icons on the front and included structured sections for written input on the back (
Figure 1 and
Figure S1). Once biophilic locations were identified according to the associated benefit dimensions, they were quantified, qualified, and spatially mapped across Amsterdam.
(4) Design. In response to RQ2, we carried out another practical session grounded in research-by-design and citizen science approaches (
Figure 2). To apply BU at the meso scale, participants were introduced to the Design Toolbox, a set of guidelines used to support the cooperative Design session. The toolbox is organized into two stages (Invitation, Interaction) and encompasses six design tools (Center and Enclosure, Transition, Landmark, Diverse Habitat Conditions, Appropriation, Cue for Care). These tools were employed to revitalize leftover spaces through low-impact ecological interventions, while also strengthening human–nature interactions and boosting ecosystem services. Further details on the Design Toolbox are provided in the
Supplementary Materials (Figure S2). We adopted a co-design process to overcome the limitations of traditional user-centered approaches [
36], foster proactive community engagement [
37], and broaden stakeholder involvement [
38]. Lessons learned from the earlier theoretical and practical sessions were utilized to inform the co-design process.
(5) Discuss. The outcomes of the Design session were presented in a peer-to-peer interactive format, integrating feedback from both experts and non-experts (
Figure 2). Building on the previous sessions, participants exchanged ideas on how to maximize biophilic benefits within each design project. To support continued engagement with BU, additional training resources were provided at the end of the workshop.
2.3. Data Collection and Processing
Data for this study were gathered during three workshops held on different dates (3 July, 12 July, and 20 September 2024), hosted by the Amsterdam Institute for Advanced Metropolitan Solutions (AMS) in Marineterrein. Although the workshop structure, agenda, content, timing, and duration remained unchanged, it was scheduled in either the morning or afternoon at both the beginning and end of the same season (summer) to increase participant numbers and diversify backgrounds in terms of expertise and familiarity with the research topic.
The sampling strategy targeted a broad audience of residents or individuals living in Amsterdam, including both academic participants (students, scholars, lecturers) and non-academic groups (stakeholders, community members, citizens).
The dissemination campaign, conducted from May to September 2024, combined physical and digital platforms. The call for participation was published on the AMS website and shared via the official channels of the three institutional partners supporting the research: Amsterdam Institute for Advanced Metropolitan Solutions (AMS), Delft University of Technology (TUD), and Wageningen University & Research (WUR). The research team also leveraged personal and professional networks. Paper flyers and posters were displayed at campus facilities (AMS, TUD, WUR), and personalized email invitations were sent to urban designers, ecologists, architects, environmental scientists, and City of Amsterdam representatives (Gemeente Amsterdam). Citizens were also reached through local community platforms (e.g., Marineterrein). The call included general event details (title, dates, location, etc.), project information (structure, topic, goal, research team, participating institutions), and a QR code linking to a Google Form for online registration, which offered the option to select dates and time preferences.
The workshop was held in English. All participants were provided with a paper informed consent form, which reiterated the event information, confirmed the voluntary nature of participation, requested permission for data and image use, and described data processing, protection, and storage protocols. The form complied with official models approved by the ethical boards of TUD and WUR. The dataset was stored securely on institutional storage platforms provided by TUD.
Data collection was performed at the main workshop sessions: Experience, Map, Design, and Discuss. Feedback from the last two sessions was jointly gathered and processed as part of the same dataset.
2.3.1. Experience Dataset
Data from participants’ real-time biophilic experiences in the “Leftover Green Field Lab” were collected as individual feedback. Each participant was free to explore, interact with, and connect to the nature-based setting and its living elements, using their senses to perceive the resulting benefits within a 20 min timeframe (
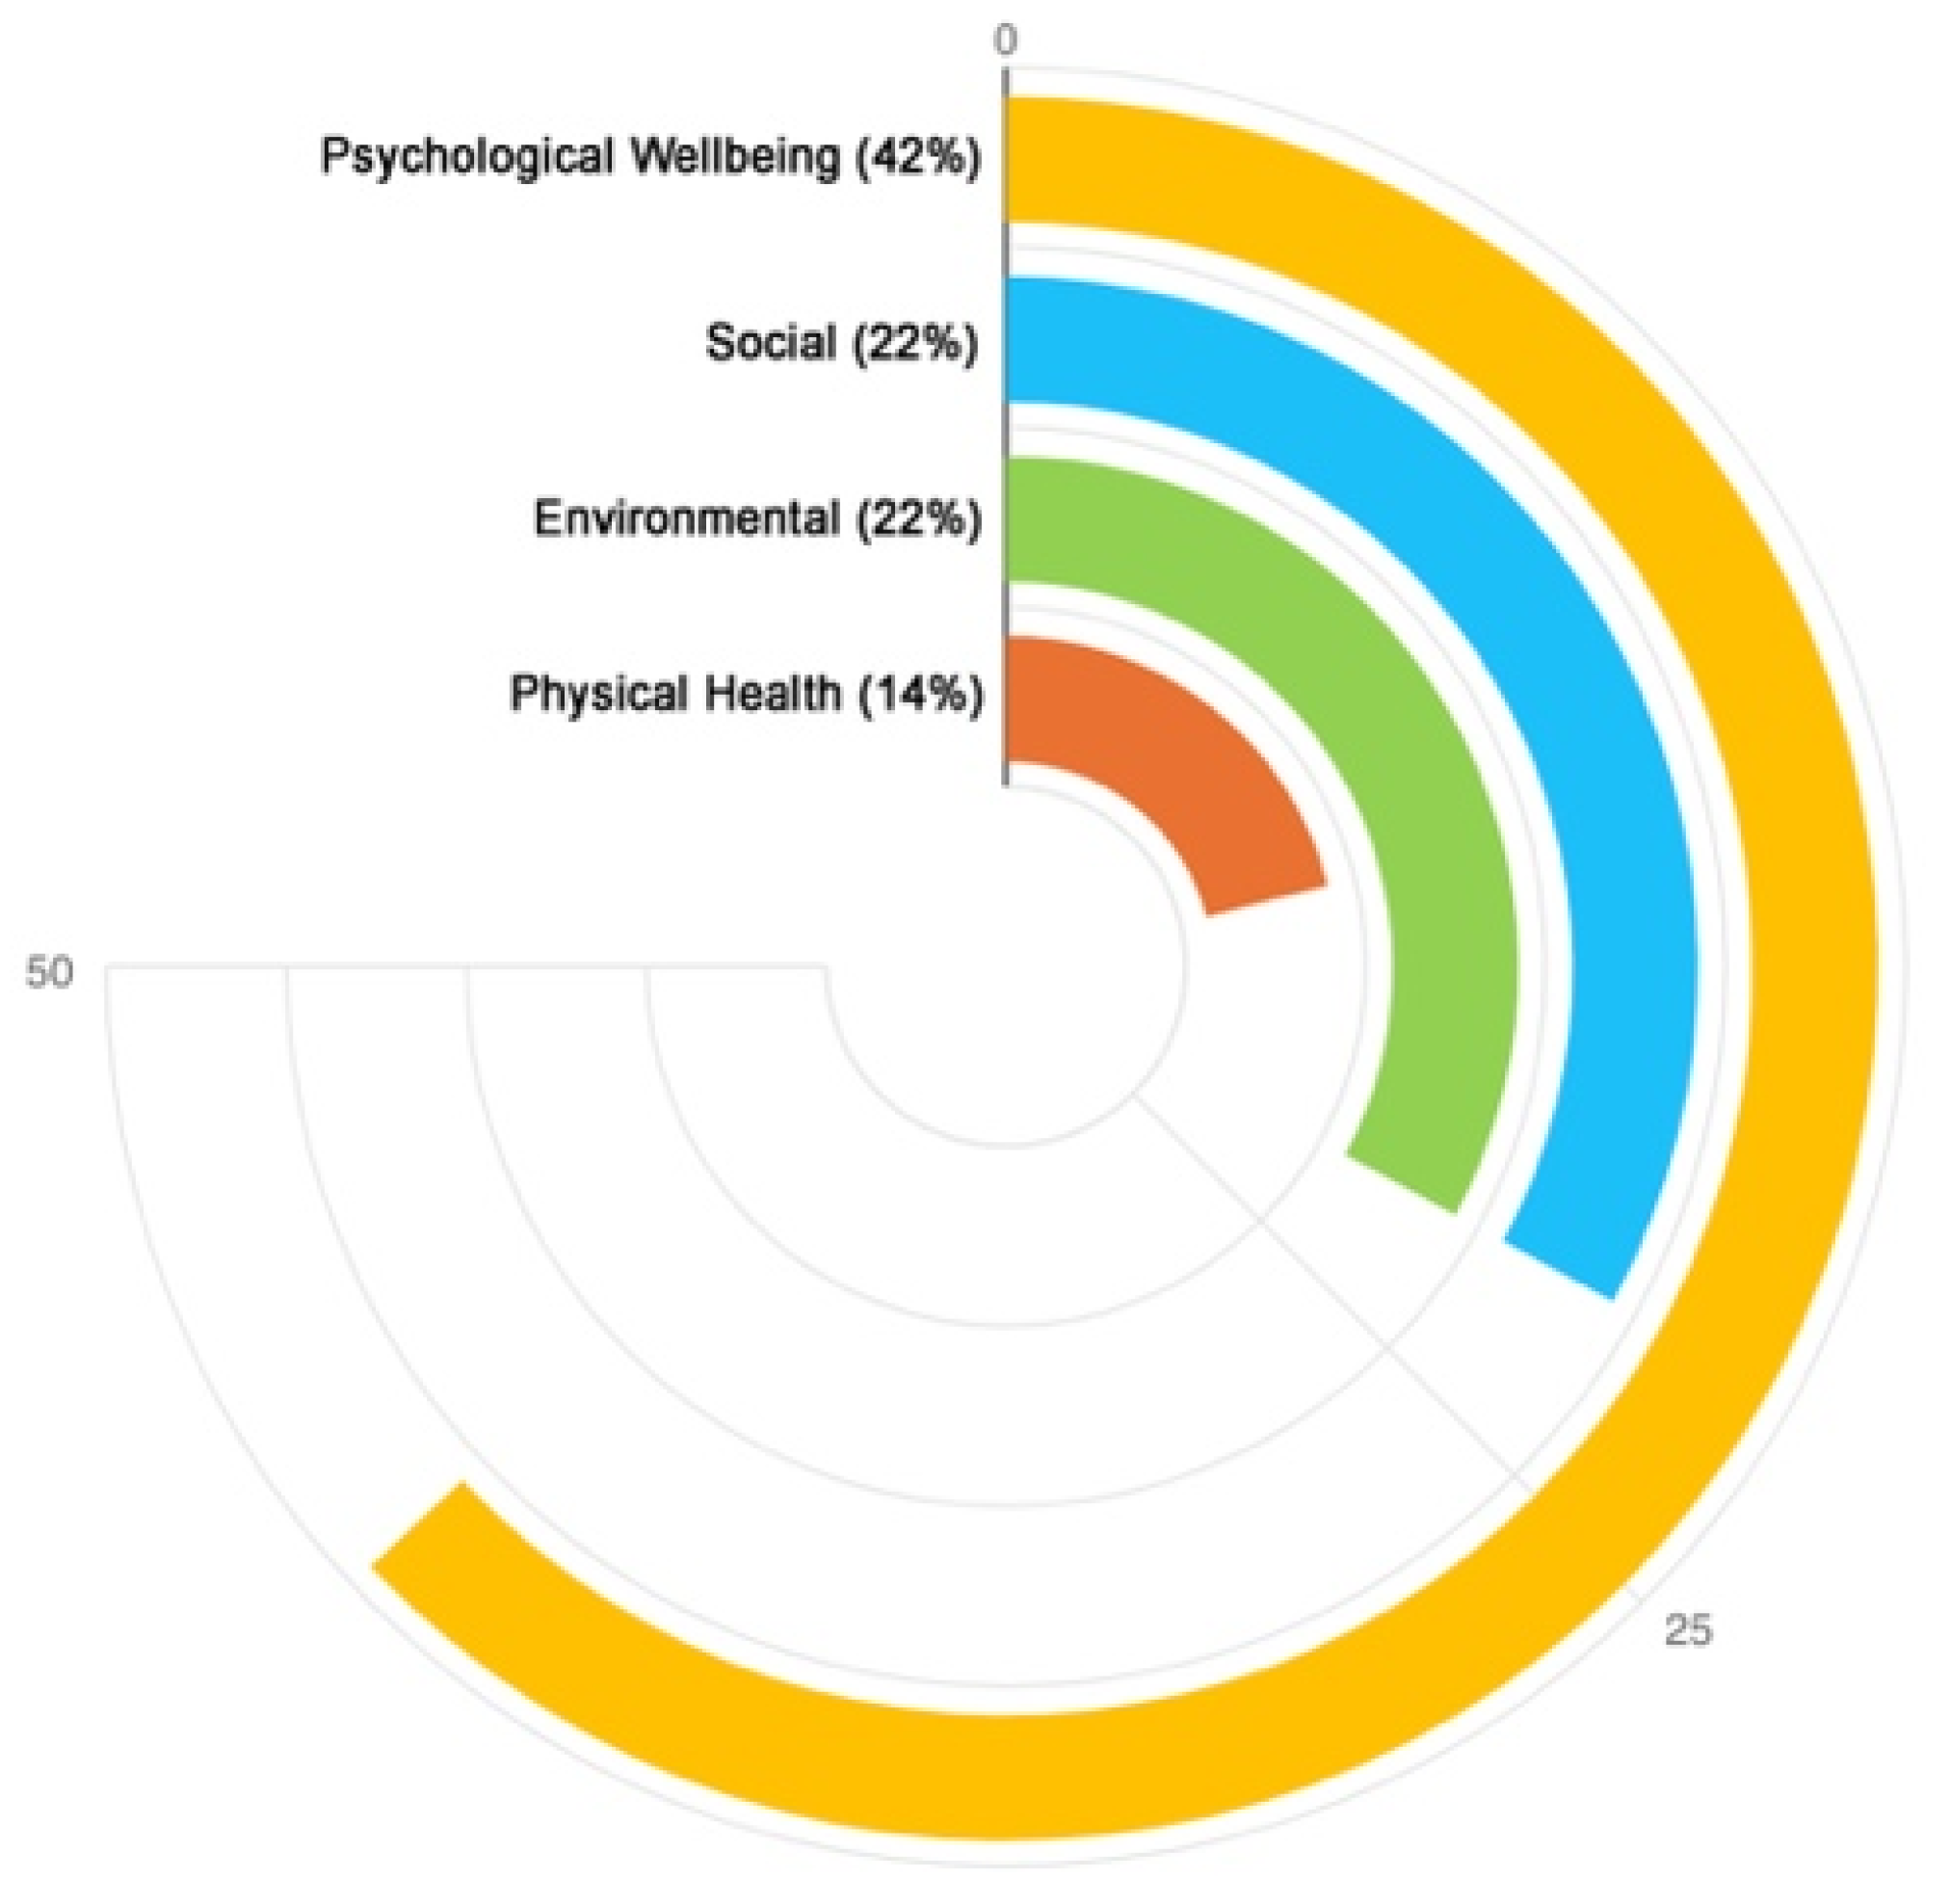
Figure 2). At the end of the session, participants were asked to summarize their on-site experience of biophilia with a single keyword reflecting the most impactful feature or effect, and to share it during a group roundtable discussion.
The resulting experience dataset was recorded during the workshop as digital notes and later processed using an integrated quantitative-qualitative approach. First, each keyword was categorized into one of the four biophilic benefit dimensions. Then, a word frequency analysis was conducted to identify the predominant benefit dimension and its relative percentage (
Table S1).
2.3.2. Biophilic Experience Cards (BEC) Dataset
To map individual biophilic experiences across Amsterdam, data were collected during a 30 min session in which participants completed Biophilic Experience Cards (BEC) (
Figure 2). These cards were part of the supporting materials provided along with a brief demo prior to the Map session (
Figure S1,
Table 1). Different BEC were distributed to participants, with each card associated with one of four biophilic benefit dimensions and identifiable by color: Physical Health (orange), Psychological Well-being (yellow), Social (blue), and Environmental (green). Before selecting a BEC to complete, participants were asked to recall a past biophilic experience anywhere in Amsterdam, focusing on the benefit gained from it (
Figure 1 and
Figure S1). Based on this self-assessment, they selected the BEC matching the benefit dimension and filled it out. To support this task, a biophilic experience framework (
Table 1), grounded on benefit-oriented literature [
16], was provided. The framework consists of three sub-tables: (a) biophilic benefits resulting from human–nature interactions, matched to benefit dimensions and corresponding colors; (b) biophilic categories and features of the urban scenario, sorted by cityscape types; and (c) ways to experience nature in the city, including examples of outdoor and indoor biophilic experiences involving both sensory and intangible interactions.
Each BEC was designed with a fixed layout with three sections (Where, What, How) to detail the individual biophilic experience (
Figure S1). Each section was headed by a question: (a) Where did you experience biophilic benefits? (b) What kind of nature did you experience? (c) How did you experience biophilic benefits? The first section (a) required participants to specify the location (e.g., street, district, or city area) within Amsterdam, the setting (outdoor or indoor), and its relevant scale (building, street, neighborhood, or city). The second section (b) referred to cityscape categories and features. Based on the predominant component, we distinguished four types of cityscape categories: Greenscape, where vegetation is predominant; Landscape, including non-green elements of the urban environment associated with the sky; Waterscape, related to blue infrastructure and water-based elements in the city; and Living Beings, encompassing people and animals. To identify the specific cityscape feature, participants could draw inspiration from
Table 1b, which lists and groups features under the four cityscape categories. This classification results from the synthesis of several biophilic literature sources [
39,
40,
41]. In section (c), participants described how the biophilic experience was implemented, whether one or more senses were involved, and the way they experienced nature in the city by selecting one option from those listed in
Table 1c. These options were grouped into physical activities and psychological/cultural/social activities, as mentioned in the relevant literature [
10,
42,
43]. A final comment was required to provide additional details on the benefits gained. Each participant was asked to complete at least three BEC, preferably selecting cards related to different benefit dimensions and associating each with a single location based on the primary benefit experienced. However, completing multiple cards within the same benefit dimension was also permitted. Similarly, participants were allowed to fill out different cards referring to the same location if it evoked distinct biophilic experiences or benefits. To make the mapping activity more interactive, participants were invited to pin each completed BEC onto a board displaying an A1 paper map of Amsterdam, offering a preliminary visual overview of the Map results by the end of the session.
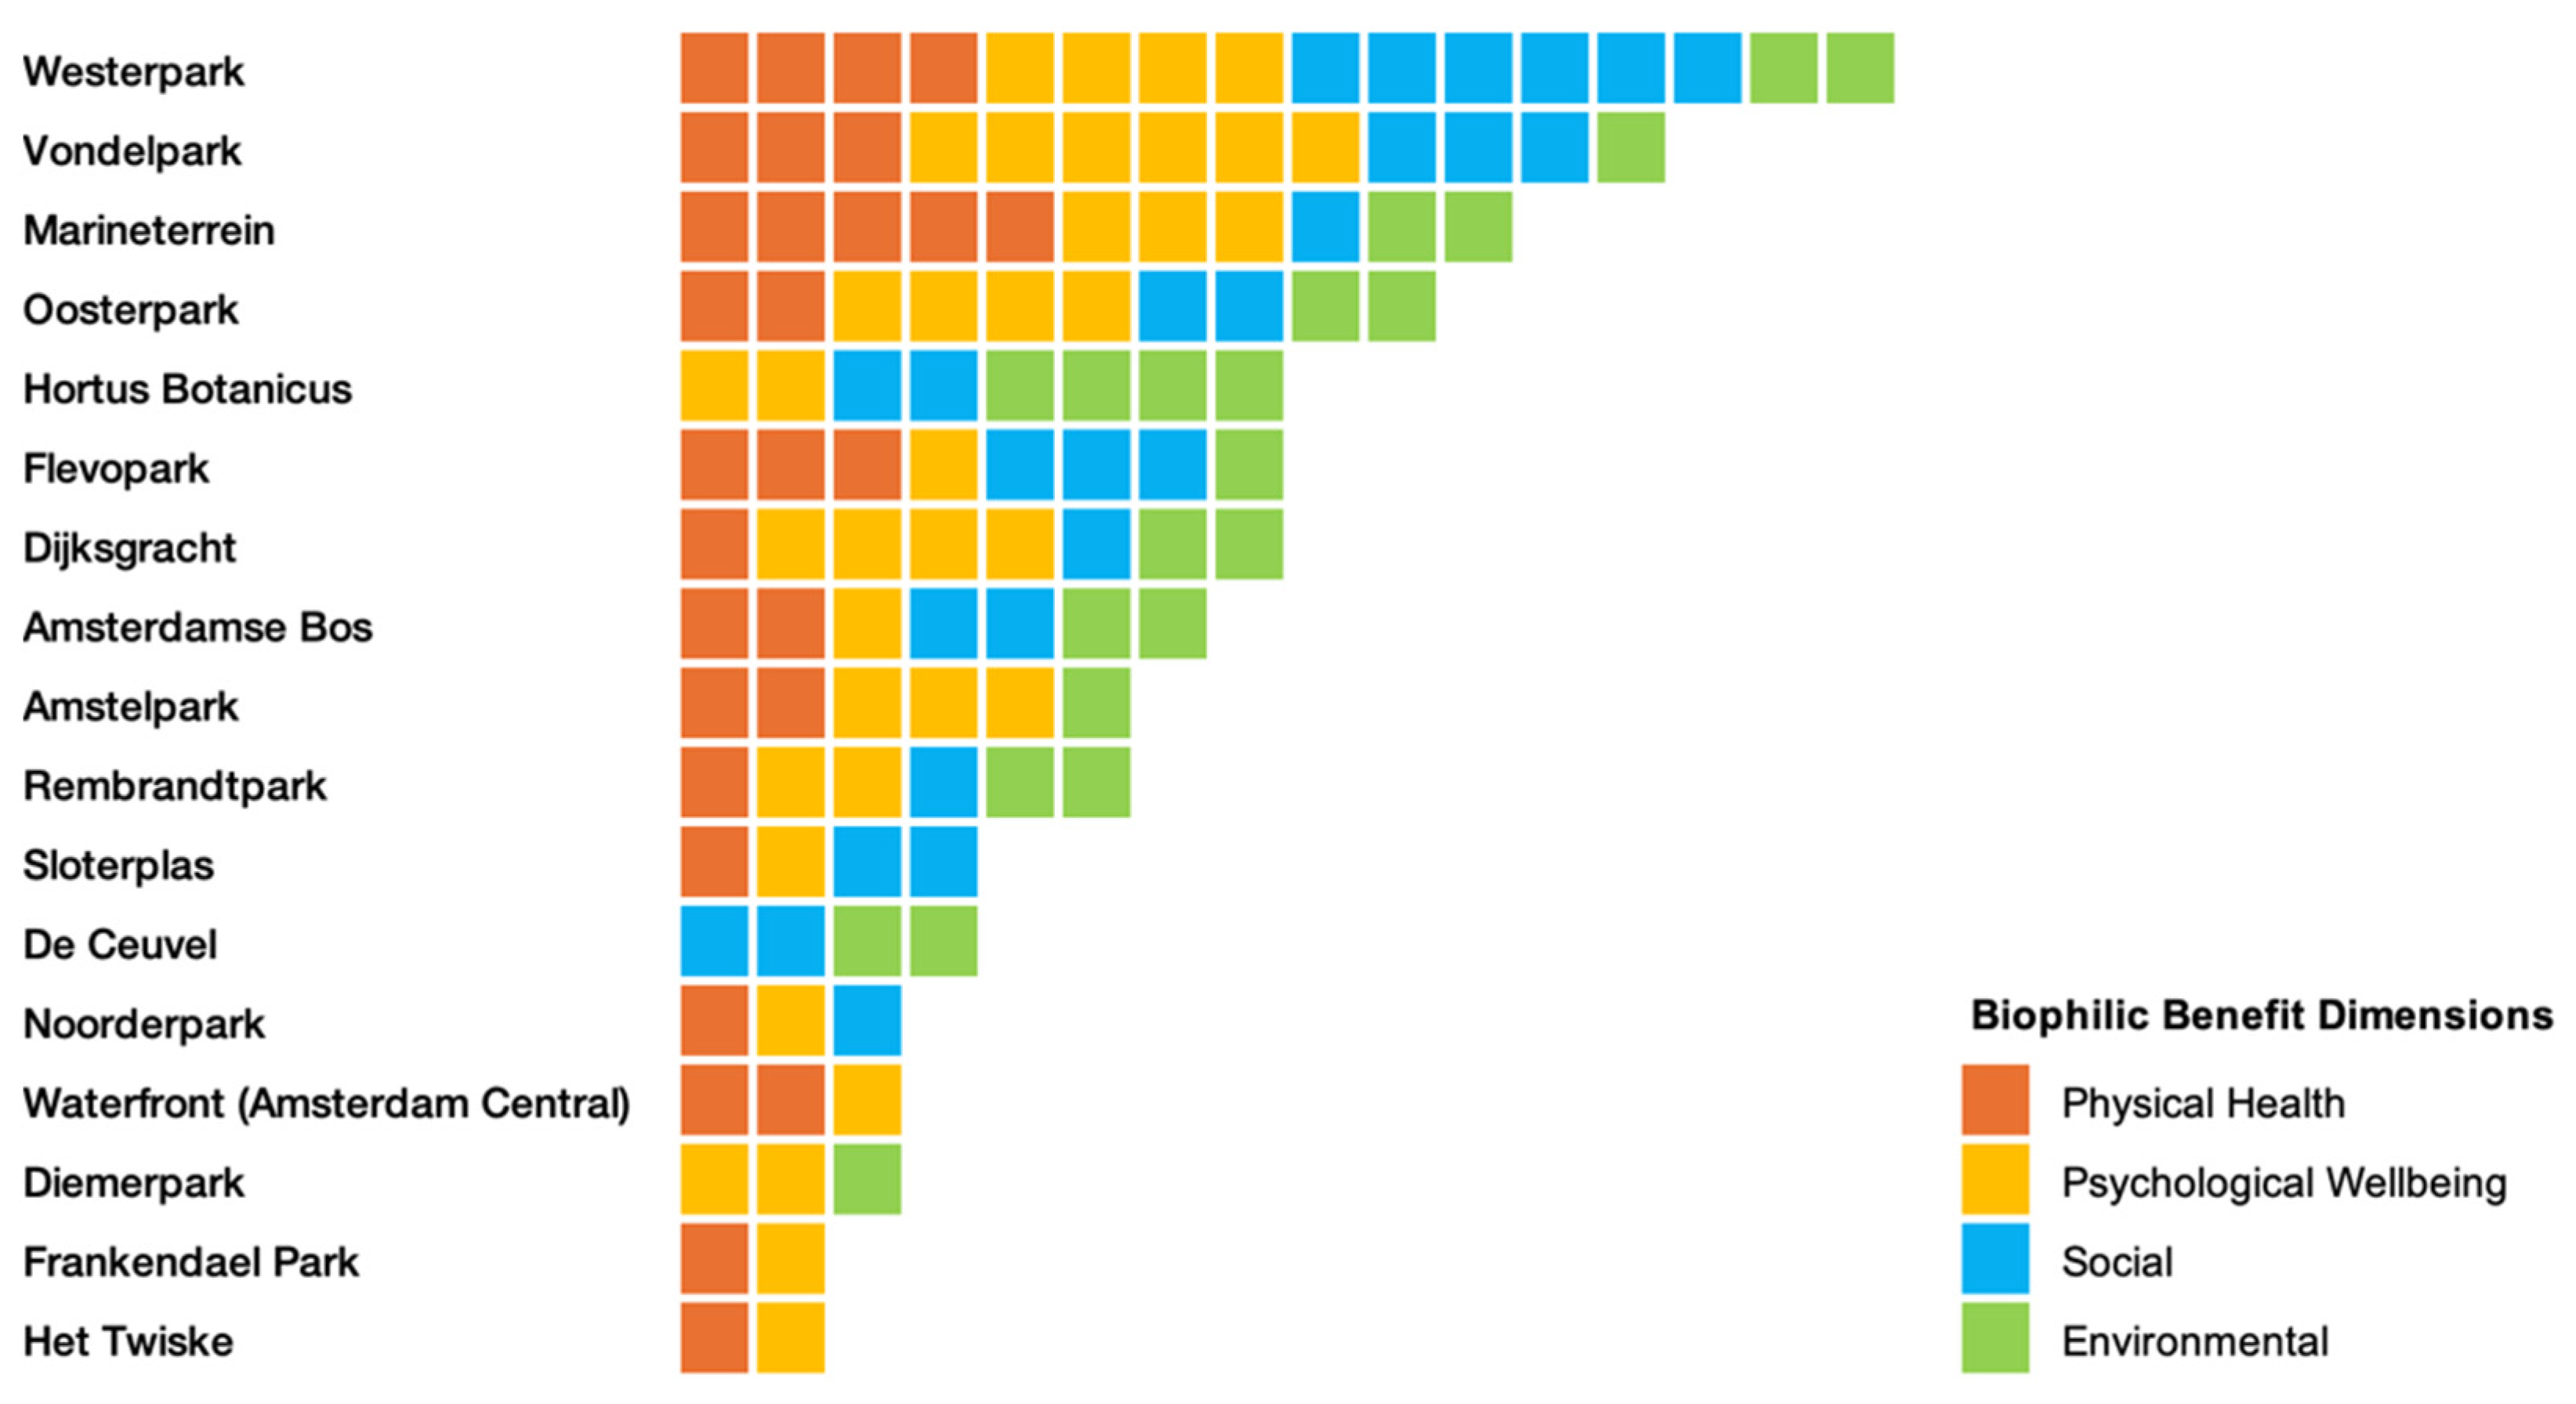
In order to process the BEC dataset, we first digitized the paper-based cards and classified them by benefit dimension. The dataset was then analyzed using a 3-metric research approach that focused on quantity, quality, and spatial distribution. Following the BEC layout, we first identified and quantified the locations. Next, we screened each data point according to the three main content areas (Where, What, How). We then qualified the data by categorizing it based on the location, setting and scale (Where); cityscape category and feature (What); and sensory mode, experience type, and benefit (How). Finally, we mapped each location to visualize its spatial distribution across the city, its potential positional relationships with other locations, and the predominant benefit dimension associated with each location. Although all data were equally explored (
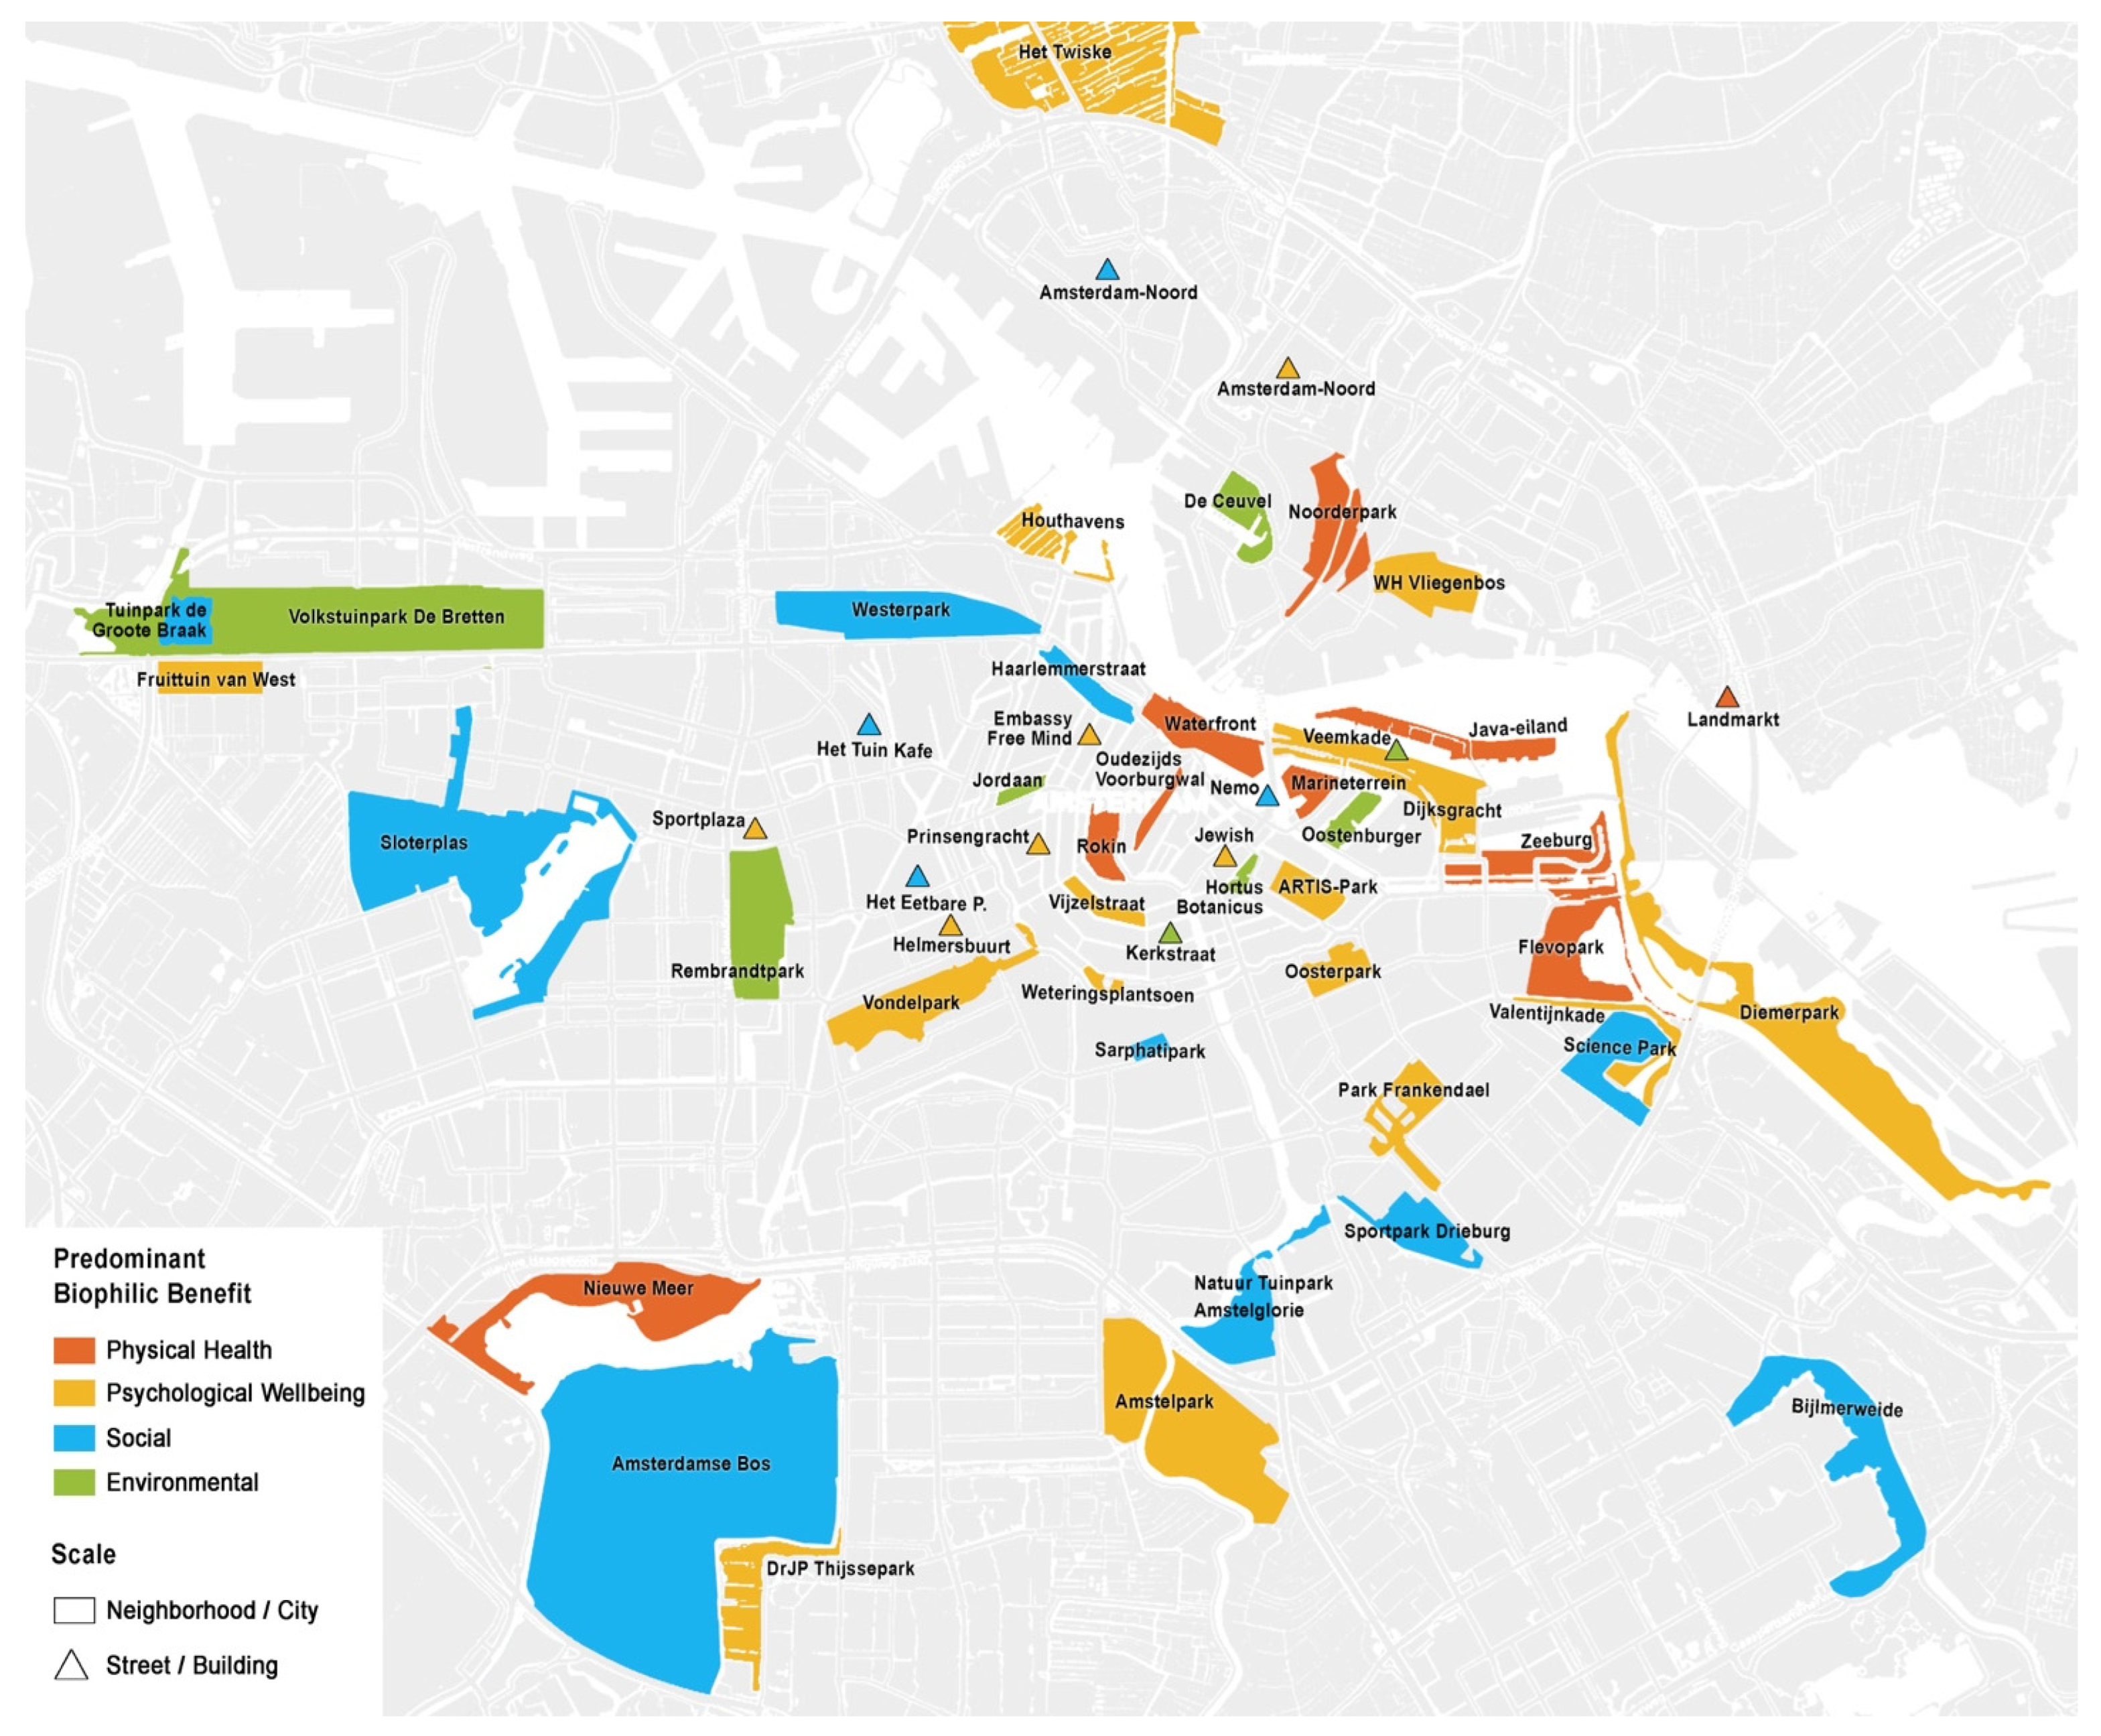
Table S2), we only considered the locations cited at least twice on BEC as the most significant results. Nevertheless, all the locations identified by participants were geolocated across Amsterdam to develop a benefit-oriented biophilic map of the city.
2.3.3. Design and Discuss Dataset
The Design session was conducted as a 45 min co-design process. To foster co-creation and community engagement, participants were divided into small work teams of approximately three people. Although group composition was spontaneous, we ensured that each group included participants with varying levels of expertise, allowing each member to meaningfully contribute to the design outcomes according to their own pace, interests, and skills (
Figure 2). During the session, we acted as advisors, providing information and practical tools to facilitate the work.
The session goal was to apply BU principals at the meso scale through a cooperative designing exercise focused on a real leftover green space. To this end, participants were asked to draw on content and insights from the previous sessions. We provided additional input, including a brief introduction to the study area, its location within the city (Bijlmermeer district, Amsterdam South), its geometric features (rectangular lot bordered by drivable roads and a bike path, covering 6400 m
2), territorial characteristics (flat terrain), strengths (grass, trees, active local community), and weaknesses (long-term vacancy since 2015, partial soil contamination due to previous use as a parking lot). This study area represents a typical leftover green space affected by urban transformation. To support the co-design activity, we introduced theoretical key concepts (e.g., leftover spaces), shared practical instructions, and distributed drawing materials (maps, tracing paper, pre-filled sheets, markers), along with an essential Design Toolbox to promote meaningful human–nature interactions in urban areas. This toolbox consisted of six design tools merging landscape architecture and BU, aiming to bridge the perceptual gap between structured spaces and leftover areas, enhance place perception, and integrate wilderness into urban environments. The design tools were organized into two stages: Invitation, designed to overcome perception biases and specifically introduce people to the urban wilderness; and Interaction, aimed at encouraging creativity and deeper engagement with the space (
Figure S2). Each stage encompassed three design tools. The Invitation stage utilized the following: (1) Center and Enclosure defines the space by contrasting a central focal point with clear boundaries [
44], helping visitors perceive the intended meaning and unique identity of the place. (2) Transition guides users through spatial sequences, marked by gates or entry points that support the shift from familiar surroundings to new and immersive interior sites [
45]. (3) Landmark identifies symbolic elements that help capture interest, stimulate curiosity, orient visitors, and connect them with the place through deeper experiences [
46]. The Interaction stage contained: (4) Built on Gilles Clément’s “Third Landscape” concept [
47], Diverse Habitat Conditions emphasizes the importance of biodiversity in sustaining flora and fauna [
48], refining spatial perceptions [
49], and fostering learning through natural ecosystem dynamics. (5) Appropriation promotes flexible-use spaces encouraging human-place interactions, site personalization, and the development of personal connections to deepen the sense of belonging [
50]. (6) Cue for Care employs visual signs to support care actions, shared stewardship, and eco-cultural values in the urban wilderness, inspiring visitors’ appreciation and respect [
51].
The resulting Design dataset was examined through a multi-step framework driven by qualitative research. The steps were as follows. (1) Digitalization and Organization: After digitalizing the design sheets (1–2 per group) corresponding to all team projects (
Table S3), we imported them into ATLAS.ti (version 24)—a qualitative data analysis software primarily used for processing written interviews or literature research [
52]. We employed ATLAS.ti to facilitate data management through coding and categorization. (2) Initial Coding: We developed a codebook based on BU principles, incorporating core aspects such as benefit dimensions, categories, features, and experiences (
Table 1), along with elements from the Design Toolbox (
Figure S2). (3) Code Refinement: We refined codes through iterative qualitative content analysis to align with participants’ ideas, experiences, design preferences, and perceptions. (4) Thematic Coding: We organized the resulting codes into three thematic classes of BU tools: ‘categories & features’ that cover biophilic cityscape categories, as shown in
Table 1b; ‘experiences & benefits’ obtained by merging
Table 1a,c; and ‘design tools’, including the Design Toolbox elements (
Figure S2). (5) Co-occurrence Analysis: This analysis identified correlations among the three BU classes, uncovering relationships between specific design interventions and their perceived benefits. It also provided insights into how participants engaged with the co-design process and translated BU principles into applied strategies. To ensure the reliability and validity of the analysis, we conducted independent coding and regular debriefing. These sessions helped address potential biases, clarify coding, and align interpretations, thus enhancing the robustness of the thematic findings (
Tables S4 and S5).
After completing qualitative coding, we quantitatively analyzed the Design dataset. First, we assessed the frequency of design tool applications across team projects (
Table 2). Next, we performed thematic coding of quotations related to the six design tools, measuring how frequently each design tool was cited in each team’s project (
Table S4). Lastly, we estimated the reciprocal correlations among the biophilic elements: ‘categories & features’, ‘experiences & benefits’, and ‘design tools’, using co-occurrence analysis (
Table 3 and
Table S5).
The Discuss session followed as a post-activity report-out, in which each work team presented its design project, while we recorded feedback in the form of additional notes. These data—including project concepts, suggestions, and reflections on nature values, ecosystem services, and BU principles—complemented the Design dataset and helped establish mutual correlations among the main operative sessions (Explore, Map, Design). The Discuss dataset was processed in three steps using qualitative and associative criteria. First, the raw notes were digitized, filtered for irrelevant content, and organized by work teams. Second, the dataset was categorized according to the literature-based framework that guided the Experience and Map sessions (
Table 1). Finally, the categorized data were integrated with the Design dataset and jointly analyzed via ATLAS.ti. Additionally, participants’ reflections captured in the Discuss session were used to identify key factors, challenges, and practical recommendations for advancing BU, which informed the final discussion section of the study.
4. Discussion
This study explores the role of BU in renewing urban planning by positioning nature as an ecological, economic, and sustainable strategy. While scientific literature offers substantial evidence of the many benefits of integrating nature into the built environment [
10,
16], we critically examine the actual potential of BU to positively impact livability across scales and its applicability in regenerating urban landscapes by ensuring both human and ecological well-being. The following discussion is structured around previous research, the knowledge gaps identified, and our research questions (RQs). Throughout the paper, we reflect on the results of biophilic experiences across time (real-time, past, and future) and space (micro, meso, and macro scales).
As prior studies have shown, experiencing nature in the city brings benefits across various domains [
16]. Through an experience-based approach, this study demonstrates that BU offers clear pathways to enhance urban livability. Specifically, the knowledge and graphic tools help identify where and how to achieve biophilic benefits in everyday life. Our spatial findings indicate that most biophilic experiences occur in large-scale outdoor settings, primarily in well-known locations such as public parks or gardens. Conversely, domestic and building-scale environments are rarely recognized as effective or accessible settings for enjoying nature, either directly or indirectly. This emphasizes the importance of public green spaces as primary locations for fostering human–nature interactions. The underrepresentation of indoor and street-scale biophilic settings further reflects limitations in public perception. Our biophilic map of Amsterdam also reveals a strong dominance of Greenscape, despite the cityscape being extensively featured by water bodies. This suggests that biophilic culture is not yet fully embedded in everyday life and points to a lack or limited presence of nature-based solutions in smaller living spaces, such as homes and streetscapes. Our benefit-driven map displays up to 53 biophilic locations across Amsterdam. This helps overcome nature inequity and its associated negative impacts by encouraging residents to explore new mobility pathways towards greater benefits, even beyond their own neighborhoods when local opportunities are lacking [
5]. Although previous studies stress insufficient urban canopy coverage in Amsterdam [
5], our biophilic map shows that parks and urban forests within the Greenscape category are perceived as the most positively impactful green features. These areas are most commonly associated with Psychological Well-being, followed by Physical and Social benefits, and less so with Environmental benefits. Our quantitative, qualitative, and spatial results demonstrate that Amsterdam is a biophilic city. This is validated by the ‘site-experience-benefit’ perspective introduced in the workshop methodology to guide participants in systematically identifying and experiencing biophilic environments. Moreover, the city’s natural assets and ongoing climate neutrality initiatives make Amsterdam a viable candidate for inclusion in the Biophilic Cities network [
27].
The biophilic experience framework proposed here provides a wide range of nature-based solutions, features, experiences, and four-dimensional benefits at different scales, all aimed at improving urban quality of life. Regarding the site-benefit pairing, our findings reveal a strong correlation between public green spaces—the highest-ranked biophilic locations—and benefits related to Psychological Well-being, Physical Health, and Social connection, as these are short-term, easily perceivable and measurable. In contrast, Environmental benefits tend to be indirect, space-related, and longer-term, requiring more time to be fully appreciated. This may limit BU’s integration into urban planning, as stakeholders often prioritize outcomes that are immediate and quantifiable [
16].
During the workshop, three cross-scale biophilic experiences were proposed, each highlighting the positive impact of BU across different locations and modes of engagement. At the micro scale, a real-time field experience in a Living Lab revealed positive effects on Psychological Well-being, reported as one-word immediate feedback. At the macro scale, the BEC results broadened the scope: ‘contemplating a memory of a previous experience with nature’ also served as a biophilic experience itself, generating specific benefits such as emotional recovery, stress reduction, or positive mood, all aligned with the Psychological Well-being dimension in the biophilic experience framework. At the meso scale, design projects reinforced this trend with participants anticipating primarily Psychological and Social benefits from applying BU tools in urban landscape renewal. Through the co-design process, participants had the opportunity to indirectly experience the positive effects of BU by assuming roles as urban planners or city-makers. This is just one of the biophilic activities outlined in our theoretical framework and integrated into various design projects, including nature-based cognition, engagement and immersion in nature, and emotional connection. Findings from each session confirm BU’s effectiveness across scales in enhancing urban livability, building a cohesive narrative that links macro-scale urban planning with meso-scale design interventions, macro-scale experiential memories with lived micro-scale experiences. This supports the integration of BU into urban planning, addressing the current mismatch between policy frameworks and biophilic principles.
While traditional approaches in urban planning reveal significant limitations in valuing nature [
7], our Design results prove that such a gap can be effectively addressed through BU. Specifically, the application of design tools demonstrates their easy implementation. Although participants initially struggled to identify Environmental benefits during the Experience and Map sessions, they actively engaged with this benefit dimension and explored ways to enhance it by integrating appropriate features into their projects. Greenscape emerges as a key element across all workshop sessions. It was the highest-ranked biophilic category in terms of locations, experiences, and benefits, and also the most frequently applied design tool, even when designing green spaces with an inherently high degree of wildness. This proves that nature, particularly vegetation and urban forests, is not antithetical to urban development but essential to it, as BU advocates.
Even though the high co-occurrence between Greenscape and design tools such as Cue for Care and Diverse Habitat Conditions was expected, the lack of a similar correlation with the Environmental benefits reveals a critical limitation. Most projects emphasized Psychological and Social benefits through restoration, community bonding, visual care, and ecological variety. Although these design interventions often integrate wild vegetation and habitat zones (Greenscape) with community-oriented features, they not explicitly address ecological processes tied to Environmental benefits. This predominance of Psychological and Social aspects may reflect their more immediate and observable implications. However, the strong co-occurrence between design tools and Psychological and Social benefits suggests that urban planning can meaningfully enhance the social and cultural facets of biophilic experiences, potentially triggering a virtuous ripple effect in how nature is valued and integrated into urban contexts.
Unlike most research focused on large-scale urban projects, this study centered on leftover spaces to highlight their multiple values, despite their limited size. This approach enabled participants to recognize the significance of natural capital in underutilized and neglected areas and to foster biophilic experiences by applying our Design Toolbox. Built on BU principles, this toolkit supports meaningful human–nature interactions, promotes community engagement, and leverages ecosystem services. Focusing on leftover spaces, we also challenged the esthetic marginalization and the partial or profit-driven exploitation of nature [
7], positioning it as a functional component in urban planning.
As a relatively recent research field, BU still presents both knowledge and application gaps [
8]. While the results of the Map session suggest that biophilic know-how requires broader dissemination, insights from the Discuss session reveal a strong interest in raising public awareness of nature and its multiple benefits for urban life. Through a combination of empirical, theoretical, and practical methods, workshop participants were able to both learn and apply biophilic principles. Moreover, the interrelation among the workshop sessions, as reflected in the Design and Discuss results, demonstrates that combining theory with hands-on activities fosters an ongoing learning process, essential for promoting biophilic culture and encouraging nature-integrated lifestyles.
Despite its contributions to advancing the research field, this study presents certain limitations. The number of workshop participants and the uneven distribution of their expertise may have influenced the results. To optimize the time and outputs during the co-design process, participants were divided into small groups. While ensuring a mix of different backgrounds in each work team, this may have further affected the outcomes. Given the empirical nature of the study, sample size played a critical role. While the total number of feedback entries was consistent, the number of unique biophilic locations identified across Amsterdam was relatively low—considering the extent of its blue-green infrastructure [
28], primarily due to data repetition and overlap. Additionally, there were very few entries related to indoor settings or to biophilic experiences at the building and street scales. External factors such as workshop timing, weather, and seasonal changes may also have affected data collection. In particular, the real-time Experience session was likely influenced by the time of day, differences in light, or the growth stages of nature across the workshop dates. Nevertheless, these dynamics are inherent to the biophilic experience, which is rooted in natural, life-like processes. As our approach focused on the positive aspects of biophilia, we did not explore the negative aspects resulting from human–nature interaction, such as biophobia. However, no negative outcomes emerged from the data processing. In the Design session, the identification of benefits from BU tools relied on subjective judgment, reflecting the author’s expertise in the field. This introduces the possibility that some benefits were misjudged or overestimated. Including a focused group discussion with participants on the perceived benefits of BU tools could have enhanced the validity of the analysis.
5. Conclusions
In an increasingly urbanized world, this study addresses the challenge of improving urban livability. We explore the potential of BU to provide physical, psychological, social, and environmental benefits across scales, using nature’s functions as an essential strategy for sustainability. Through experience and design, we demonstrate nature’s capacity to renew urban landscapes, reconnect humans with other forms of life, and leverage ecosystem services.
Beyond addressing the RQs and bridging gaps identified in prior literature, this study contributes to the fields of biophilia and its applied subject areas (biophilic design, biophilic urbanism) through both theoretical and methodological advancements. Theoretically, it explores the concepts of ‘biophilic experience’ and ‘biophilic benefit’, using quantitative, qualitative, and spatial perspectives to enhance our understanding and facilitate human–nature connections in the built environment, thereby maximizing the benefits for livability. The combined use of the biophilic experience framework, rooted in biophilia-related disciplines, and the Design Toolbox, derived from landscape design and planning, advance both fields through reciprocal interactions while setting the stage for new interchanging explorations. Methodologically, we integrate approaches that combine empirical research with research-by-design. The study is also inter-scalar, investigating different urban scales, and inter-disciplinary, merging knowledge from design, planning, psychology, and environmental science, thus crossing the traditional borders of BU as an applied science for shaping anthropic habitats. We propose targeted strategies for urban planning: a benefit-driven approach that directs policies towards enhancing individual, social, and environmental well-being, and evidence-based tools that support city-makers in implementing strategies validated by science. Lastly, we couple biophilia with citizen science to place citizens in active roles throughout the participatory process, thereby amplifying the impact of BU, as proven by our co-design findings.
As an emerging research field, BU warrants further investigation. The low proportion of biophilic experiences within the Environmental benefit dimension highlights the need for longitudinal studies to assess the short-, medium-, and long-term impacts of BU on urban natural systems. In light of the current climate crisis, this represents a pressing research priority. Positive feedback from the application of design tools confirmed that our Desing Toolbox could pave the way for integrating BU into urban planning. However, its full potential could be realized through upscaling and the development of guidelines applicable across urban scales. Additionally, the limited application of water-based solutions underscores the need for specific guidelines on incorporating blue-green infrastructure into regenerative design processes to further strengthen ecological and social value. Given the transferability and replicability of our integrated, cross-scale methods, they may be applied in other cities to validate and refine biophilic design tools, or to inspire international cooperative research.


