Article

Measurement of Building Carbon Emissions and Its Decoupling Relationship with the Construction Land Area in China from 2010 to 2020

1
School of Economics and Management, China University of Geosciences, Wuhan 430078, China
2
School of Public Administration, China University of Geosciences, Wuhan 430074, China
3
School of Geography and Tourism, Huanggang Normal University, Huanggang 438000, China
*
Author to whom correspondence should be addressed.
Land 2025, 14(5), 1106; https://doi.org/10.3390/land14051106
Submission received: 1 April 2025 / Revised: 14 May 2025 / Accepted: 16 May 2025 / Published: 19 May 2025
(This article belongs to the Section Land Innovations – Data and Machine Learning)

Abstract

:
The building sector is responsible for significant carbon emissions and energy consumption, making it a critical field for global energy-saving and emission reduction efforts to combat climate change. This study calculated the building carbon emissions (BCE) of 30 provinces in the Chinese Mainland from 2010 to 2020 using the IPCC carbon emission factor method based on the statistical data of energy consumption and building materials, and then the decoupling relationship between BCE and the construction land area (CLA) was analyzed. The results are as follows: (1) BCE exhibited an overall increase from 2010 to 2020, yet at a descending rate, with a prominent decrease in indirect BCE (IBCE); (2) BCE and direct BCE (DBCE) were higher in the north but lower in the south, while IBCE was higher along the eastern coast; (3) the provinces in North China and Northeast China possess the largest areas of construction land, but the growth of CLA was the slowest or even declined in the later stage of the study; (4) the decoupling relationship between BCE and CLA is dominated by expansive negative decoupling or strong negative decoupling. The growth of BCE is generally much faster than the expansion of construction land. The findings will have important reference for achieving energy-saving and “dual carbon” strategic development goals in China.

1. Introduction

The substantial rise in global carbon dioxide emissions, driven by the prolonged consumption of fossil fuels, has disrupted the natural equilibrium of the carbon cycle and has become the primary contributor to global warming, posing a serious threat to the sustainable development of humanity [1]. According to the assessment report from the Intergovernmental Panel on Climate Change (IPCC), the building sector is responsible for approximately 30% to 40% of global energy consumption and nearly 40% of carbon emissions [2]. Reducing BCE is considered a vital link in the long-term objective of limiting the global temperature rise to less than 2 °C [3,4]. Since 2007, China has been the largest carbon emitter, and its share of global carbon emissions continues to increase [5]. To combat climate change and reduce greenhouse gas emissions, China has initiated a “dual carbon” development strategy, which aims to reach peak carbon emissions before 2030 and achieve carbon neutrality before 2060 [6]. Newly constructed buildings account for approximately half of the world’s total, and China’s BCE exceeds 50% of total carbon emissions [7]. With the advancement of urbanization and the improvement of living standards, energy consumption and carbon emissions associated with building construction and maintenance have been steadily increasing. The building sector presents significant potential for emission reduction at relatively lower costs, making it a crucial component in China’s efforts to achieve its “dual carbon” strategic development goals [8,9]. The accounting of BCE and the exploration of influencing factors to develop targeted emission reduction measures have garnered increasing attention from government policymakers and scholars alike.
BCE is influenced by both natural and human factors [10]. Scholars have investigated the main factors influencing BCE from the perspective of human activities, including the economy [11], energy consumption [12], population dynamics [13], and industrial processes [14]. Research findings regarding the impact of the economy, population, and industry are relatively consistent. Specifically, it is widely accepted that economic growth is a key driver of increased total carbon emissions [15,16]. Additionally, the expansion of population size positively correlates with carbon emissions [17]. Currently, the impact of industrial restructuring on developing countries, such as China, remains minimal [18]. Research on energy is extensive, with differences in sample selection and varying conclusions. However, many studies suggest that adjustments in energy structure and improvements in energy efficiency exert varying degrees of inhibitory effects on BCE [19]. Previous studies have extensively examined BCE in relation to economic, energy, and population factors, instead of from the perspective of land use. Since the reform and opening up, rapid urbanization and industrialization in China have led to an increasing demand for land for infrastructure construction and urban-rural economic development [20,21]. Consequently, the total area of construction land has exhibited significant growth. Given that construction land is crucial for supporting human social and economic activities, its expansion signifies an increase in diverse production and construction activities [22,23]. Therefore, among the factors that affect BCE, changes in construction land have the most significant influence, since they interact and are interrelated with other factors such as economic development and population growth.
The conversion and management of land use in construction will directly or indirectly influence BCE. To be precise, the direct impact involves the expansion of construction land encroaching on ecological areas, thereby reducing the carbon sink capacity of natural ecosystems [24,25], while the indirect impact pertains to BCE carried by construction land from human activities, particularly emissions generated by the consumption of fossil fuels in industries, transportation, and heating [26,27]. Therefore, construction land has acted as a primary contributor to BCE, exacerbating climate change and widening the divide between humans and nature [28,29]. The heterogeneity of BCE between regions is significant, and the efficiency and management levels of construction land use vary considerably. This has complicated the interaction between changes in construction land area (CLA) and BCE and has often been overlooked in relevant research. The management of construction land serves as a crucial policy tool for regulating social and economic development [30,31], thus playing a vital role in mitigating BCE. Investigating the interactive relationship between changes in BCE and CLA needs to be further explored.
As the world’s largest carbon emitter and one of the fastest-developing countries, China faces immense pressure to conserve energy and reduce emissions. Due to the complex nature of carbon emission issues and significant regional disparities, the carbon emission challenges and appropriate response measures vary across different regions in China. This study focused on the changes in BCE and CLA in China from 2010 to 2020. The IPCC emission factor method was used to calculate the BCE of each province. The Tapio decoupling model was introduced to analyze the decoupling relationship between BCE and CLA, and to explore their evolution and distinct characteristics among regions. The research findings are anticipated to assist in assessing the low-carbon development levels of different regions in China and to offer a reference for formulating customized low-carbon development strategies.

2. Data Sources and Methods
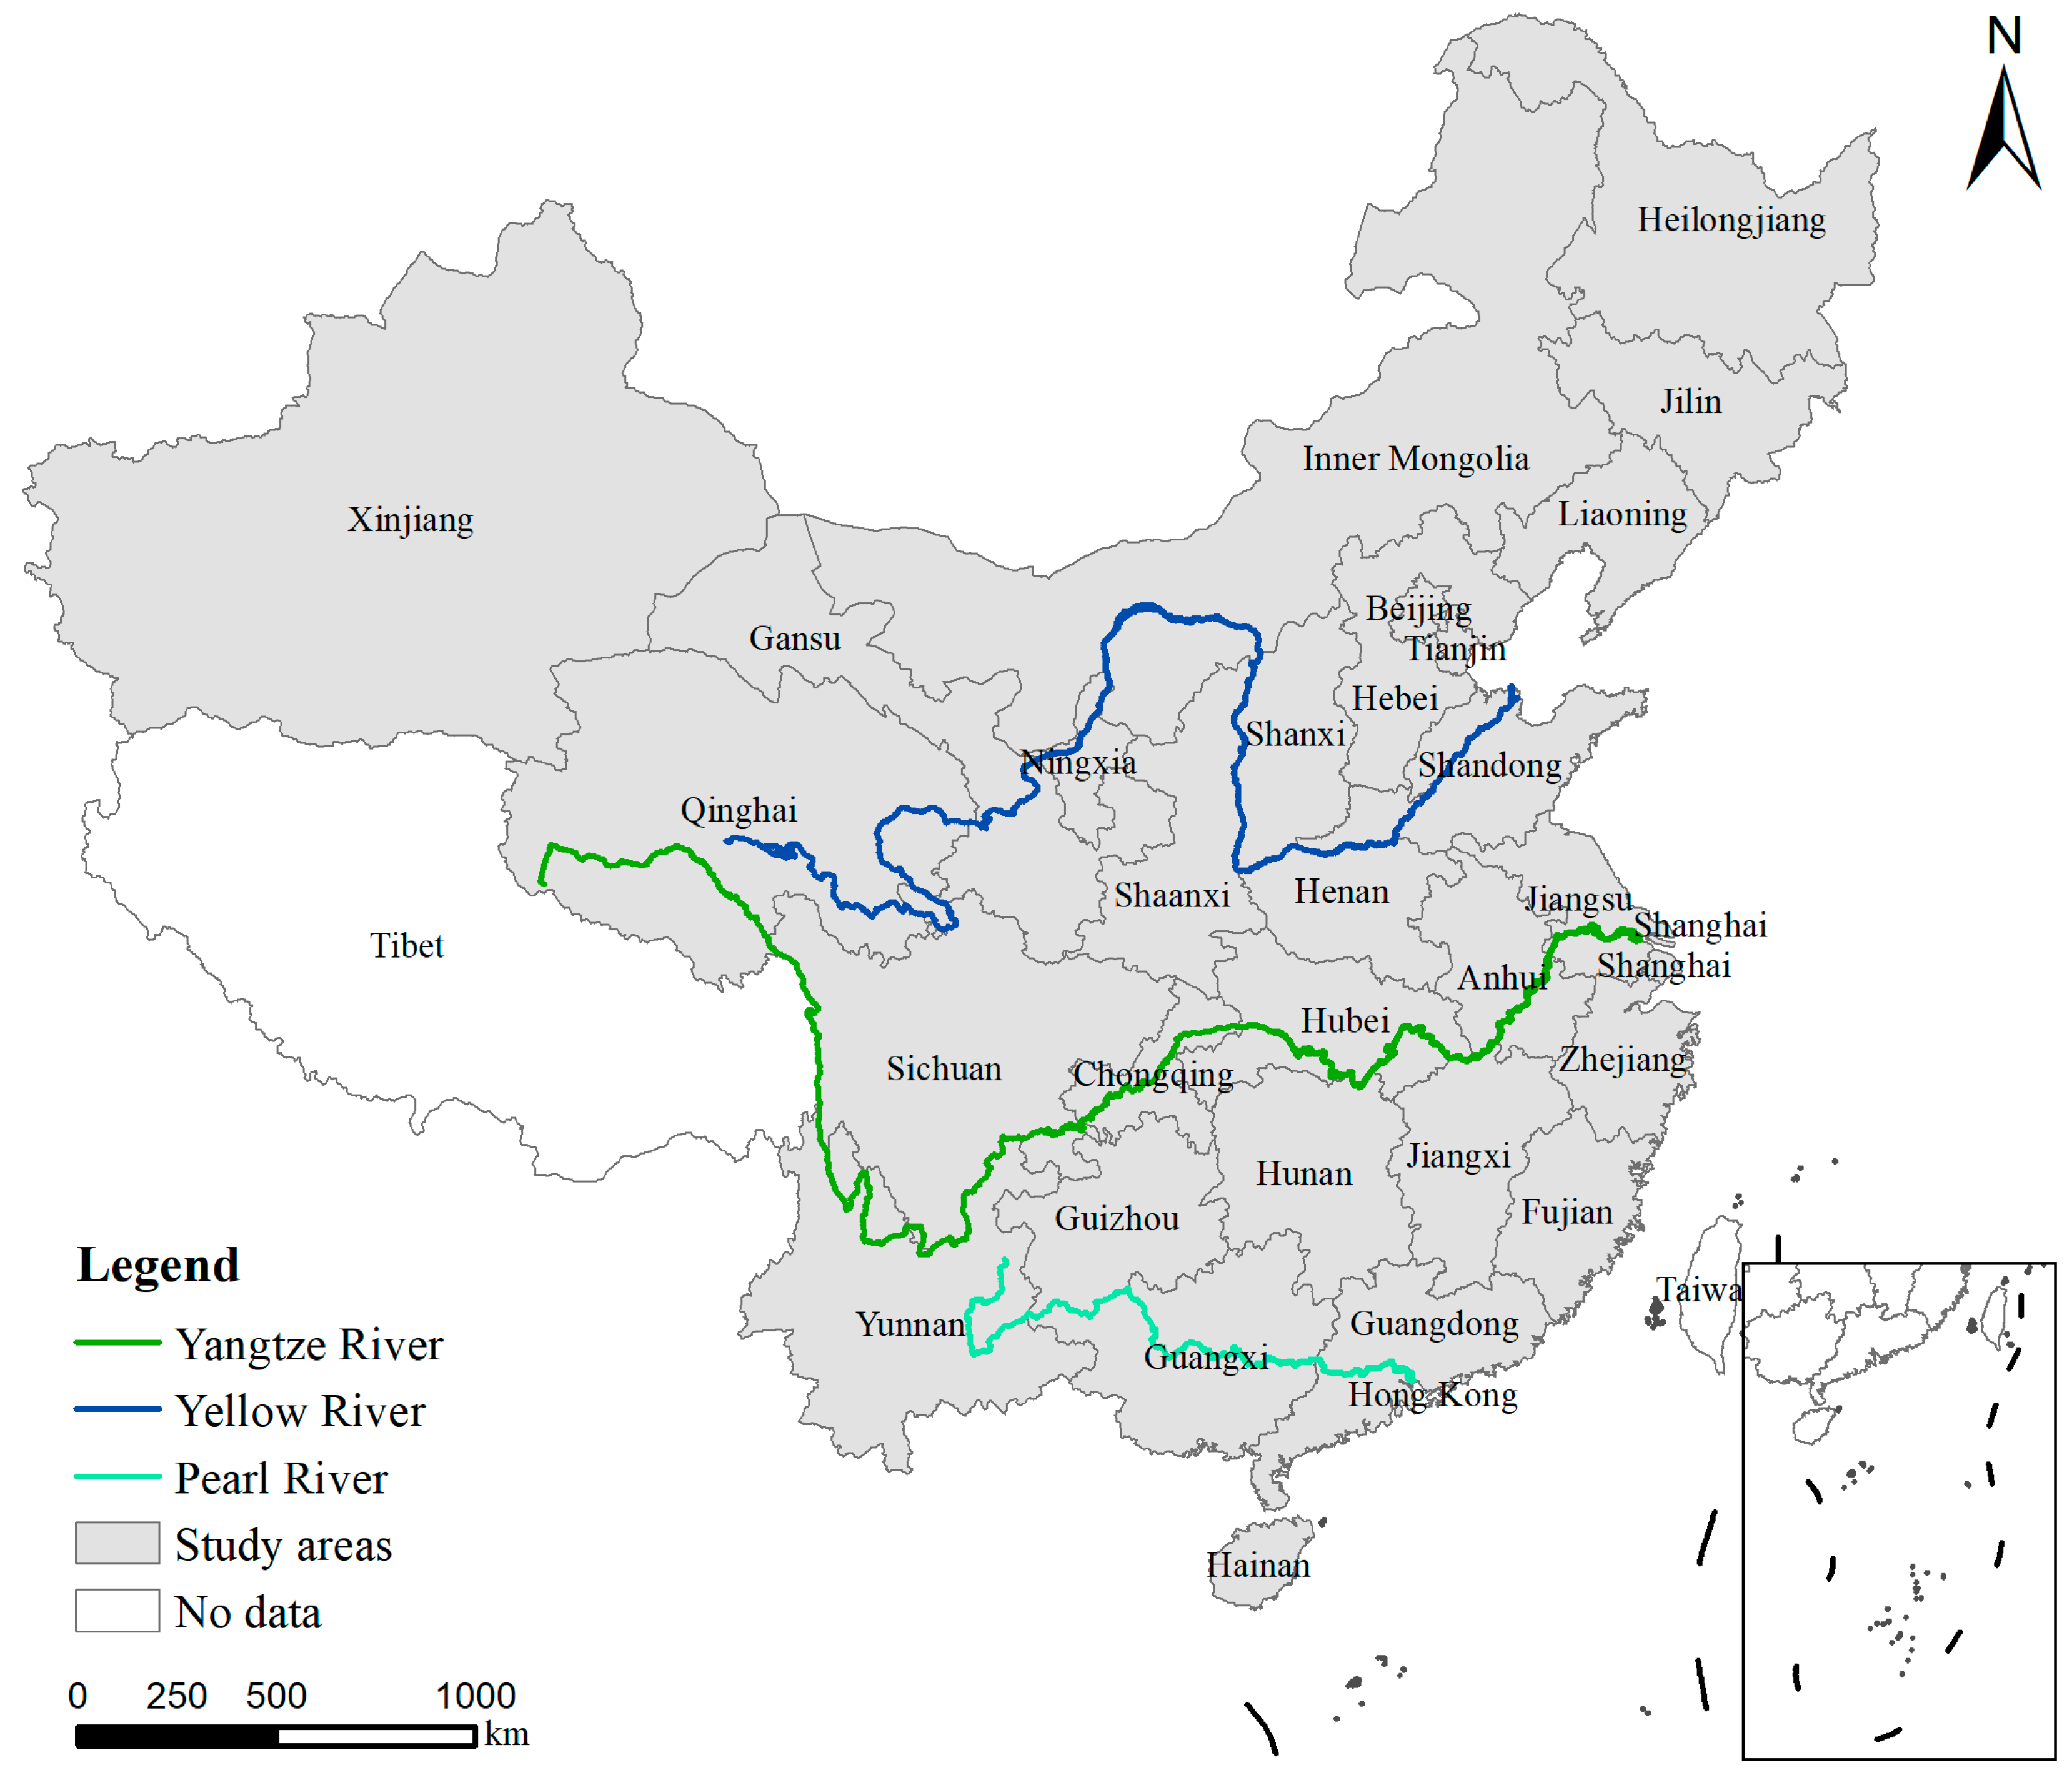
2.1. Data Sources

This study primarily used data to calculate BCE and CLA for the years 2010, 2015, and 2020. The measurement of carbon emissions is based on fossil fuels and electricity consumption data from various provinces in the Chinese Mainland, as well as data on the usage of building materials. The fossil fuels and electricity consumption data were sourced from the China Energy Statistical Yearbook for 2011, 2016, and 2021, while the building material consumption data were obtained from the China Construction Statistical Yearbook for 2011, 2016, and 2021. The data of CLA was derived from land use cover information provided by the Institute of Geographic Sciences and Natural Resources Research, CAS, in 2010, 2015, and 2020, which was acquired through manual interpretation of Landsat TM/ETM+ satellite remote sensing images with a spatial resolution of 30 m [32]. Construction land encompasses urban and rural residential areas, as well as land designated for industrial, mining, and transportation purposes. Its area was determined with the spatial statistical tool in ArcGIS 10.8 software through calculating the construction land vector. Since the up-to-date editions of the China Energy Statistical Yearbook and the China Construction Statistical Yearbook are from 2023, the data collected were for the year 2022. To highlight the significance and consistency of data changes throughout the study period, and to align with the standard five-year intervals to analyze patterns in land use change, the research period was set from 2010 to 2020. Following the update of the statistical yearbooks and the land use change data to include information for 2025, subsequent research will be conducted to reflect the changes in building carbon emissions and construction land area over the five years (2021–2025).
Accordingly, this study focused on provincial-level administrative units in China from 2010 to 2020. Due to the lack of building carbon emission measurement data from Tibet, Taiwan, Hong Kong, and Macao, they were excluded, leaving a total of 30 provincial administrative units to be studied (Figure 1).

2.2. Calculation of BCE

BCE encompasses the total carbon emissions produced by the entire building industry, such as construction, maintenance, and demolition processes of buildings, as well as related supply chains [34]. Given the significant interconnection between the building industry and other sectors, BCEs are categorized into direct building carbon emissions (DBCE) and indirect building carbon emissions (IBCE). DBCE results from the primary energy consumed directly by the building industry. Referring to the relevant literature [35,36] and thoroughly considering the potential for data acquisition, it is identified as emissions generated by energy sources, including coal, oil, natural gas, electricity, and heat. IBCE is closely linked to upstream and downstream enterprises, as indicated by the carbon dioxide released during the production and transportation of building materials. Common high-energy-consuming building materials include cement, glass, steel, aluminum, etc. They generate a large amount of carbon dioxide during production and transportation, and therefore, need to be specially considered in IBCE calculations. Although wood is a low-carbon material, it is widely used in building construction and can affect natural carbon sinks, so it also needs to be included in IBCE calculations. Based on the availability of building consumables data in the China Building Statistical Yearbook and consistency with existing research on indirect carbon emission calculation paradigms [37,38,39], IBCE is defined as the emissions produced by five building materials, namely—cement, steel, glass, wood, and aluminum—manufactured by other industries. It is calculated by multiplying the consumption of each of these building materials by their respective carbon dioxide emissions and recovery coefficients.
In order to provide a more detailed and accurate calculation of BCE, this study selected a total of 28 types of energy consumed by building industry, including raw coal, cleaned coal, other washed coal, briquettes, gangue, coke, coke oven gas, blast furnace gas, converter gas, other gas, other coking products, crude oil, gasoline, kerosene, diesel oil, fuel oil, naphtha, lubricating oil, white spirit, bitumen asphalt, petroleum coke, liquefied petroleum gas, refinery gas, other petroleum products, natural gas, liquefied natural gas, heat, and electricity. We have established a BCE calculation model in China based on the IPCC carbon emission accounting methodology [40]:
E = E d i r + E i n d = C i × α i + M j × β j × 1 ε j
where E represents the total BCE, Edir represents the direct BCE, and Eind represents the indirect BCE; Ci is the i-th energy consumption, αi is the carbon dioxide emission coefficient of i-th energy, Mj is the usage of j-th building material, βj is the carbon dioxide emission coefficient of j-th building material, and ε j is the recovery coefficient of j-th building material, where steel is 0.8 and aluminum is 0.85 [41]. Referring to the previous literature [35,36], the carbon dioxide emission coefficients of energy sources such as heat, electricity, and building materials used in this study are 0.143 kg/unit for heat, 0.995 kg/unit for electricity, 2.05t CO2/t for steel, 0.178t CO2/t for wood, 0.735 CO2/t for cement, 1.13 CO2/t for glass, and 20.3 CO2/t for aluminum, respectively. The calculation formula for the carbon dioxide emission coefficient of fossil fuels is as follows:
α i = C P I × O R I × 12 / 44 × H V i
where CPI represents the carbon content per unit calorific value of the i-th fossil energy, ORI represents the carbon oxidation rate of the i-th fossil energy, and HVi represents the low calorific value of the i-th fossil energy. The carbon dioxide emission coefficients of fossil fuels are shown in Table 1.

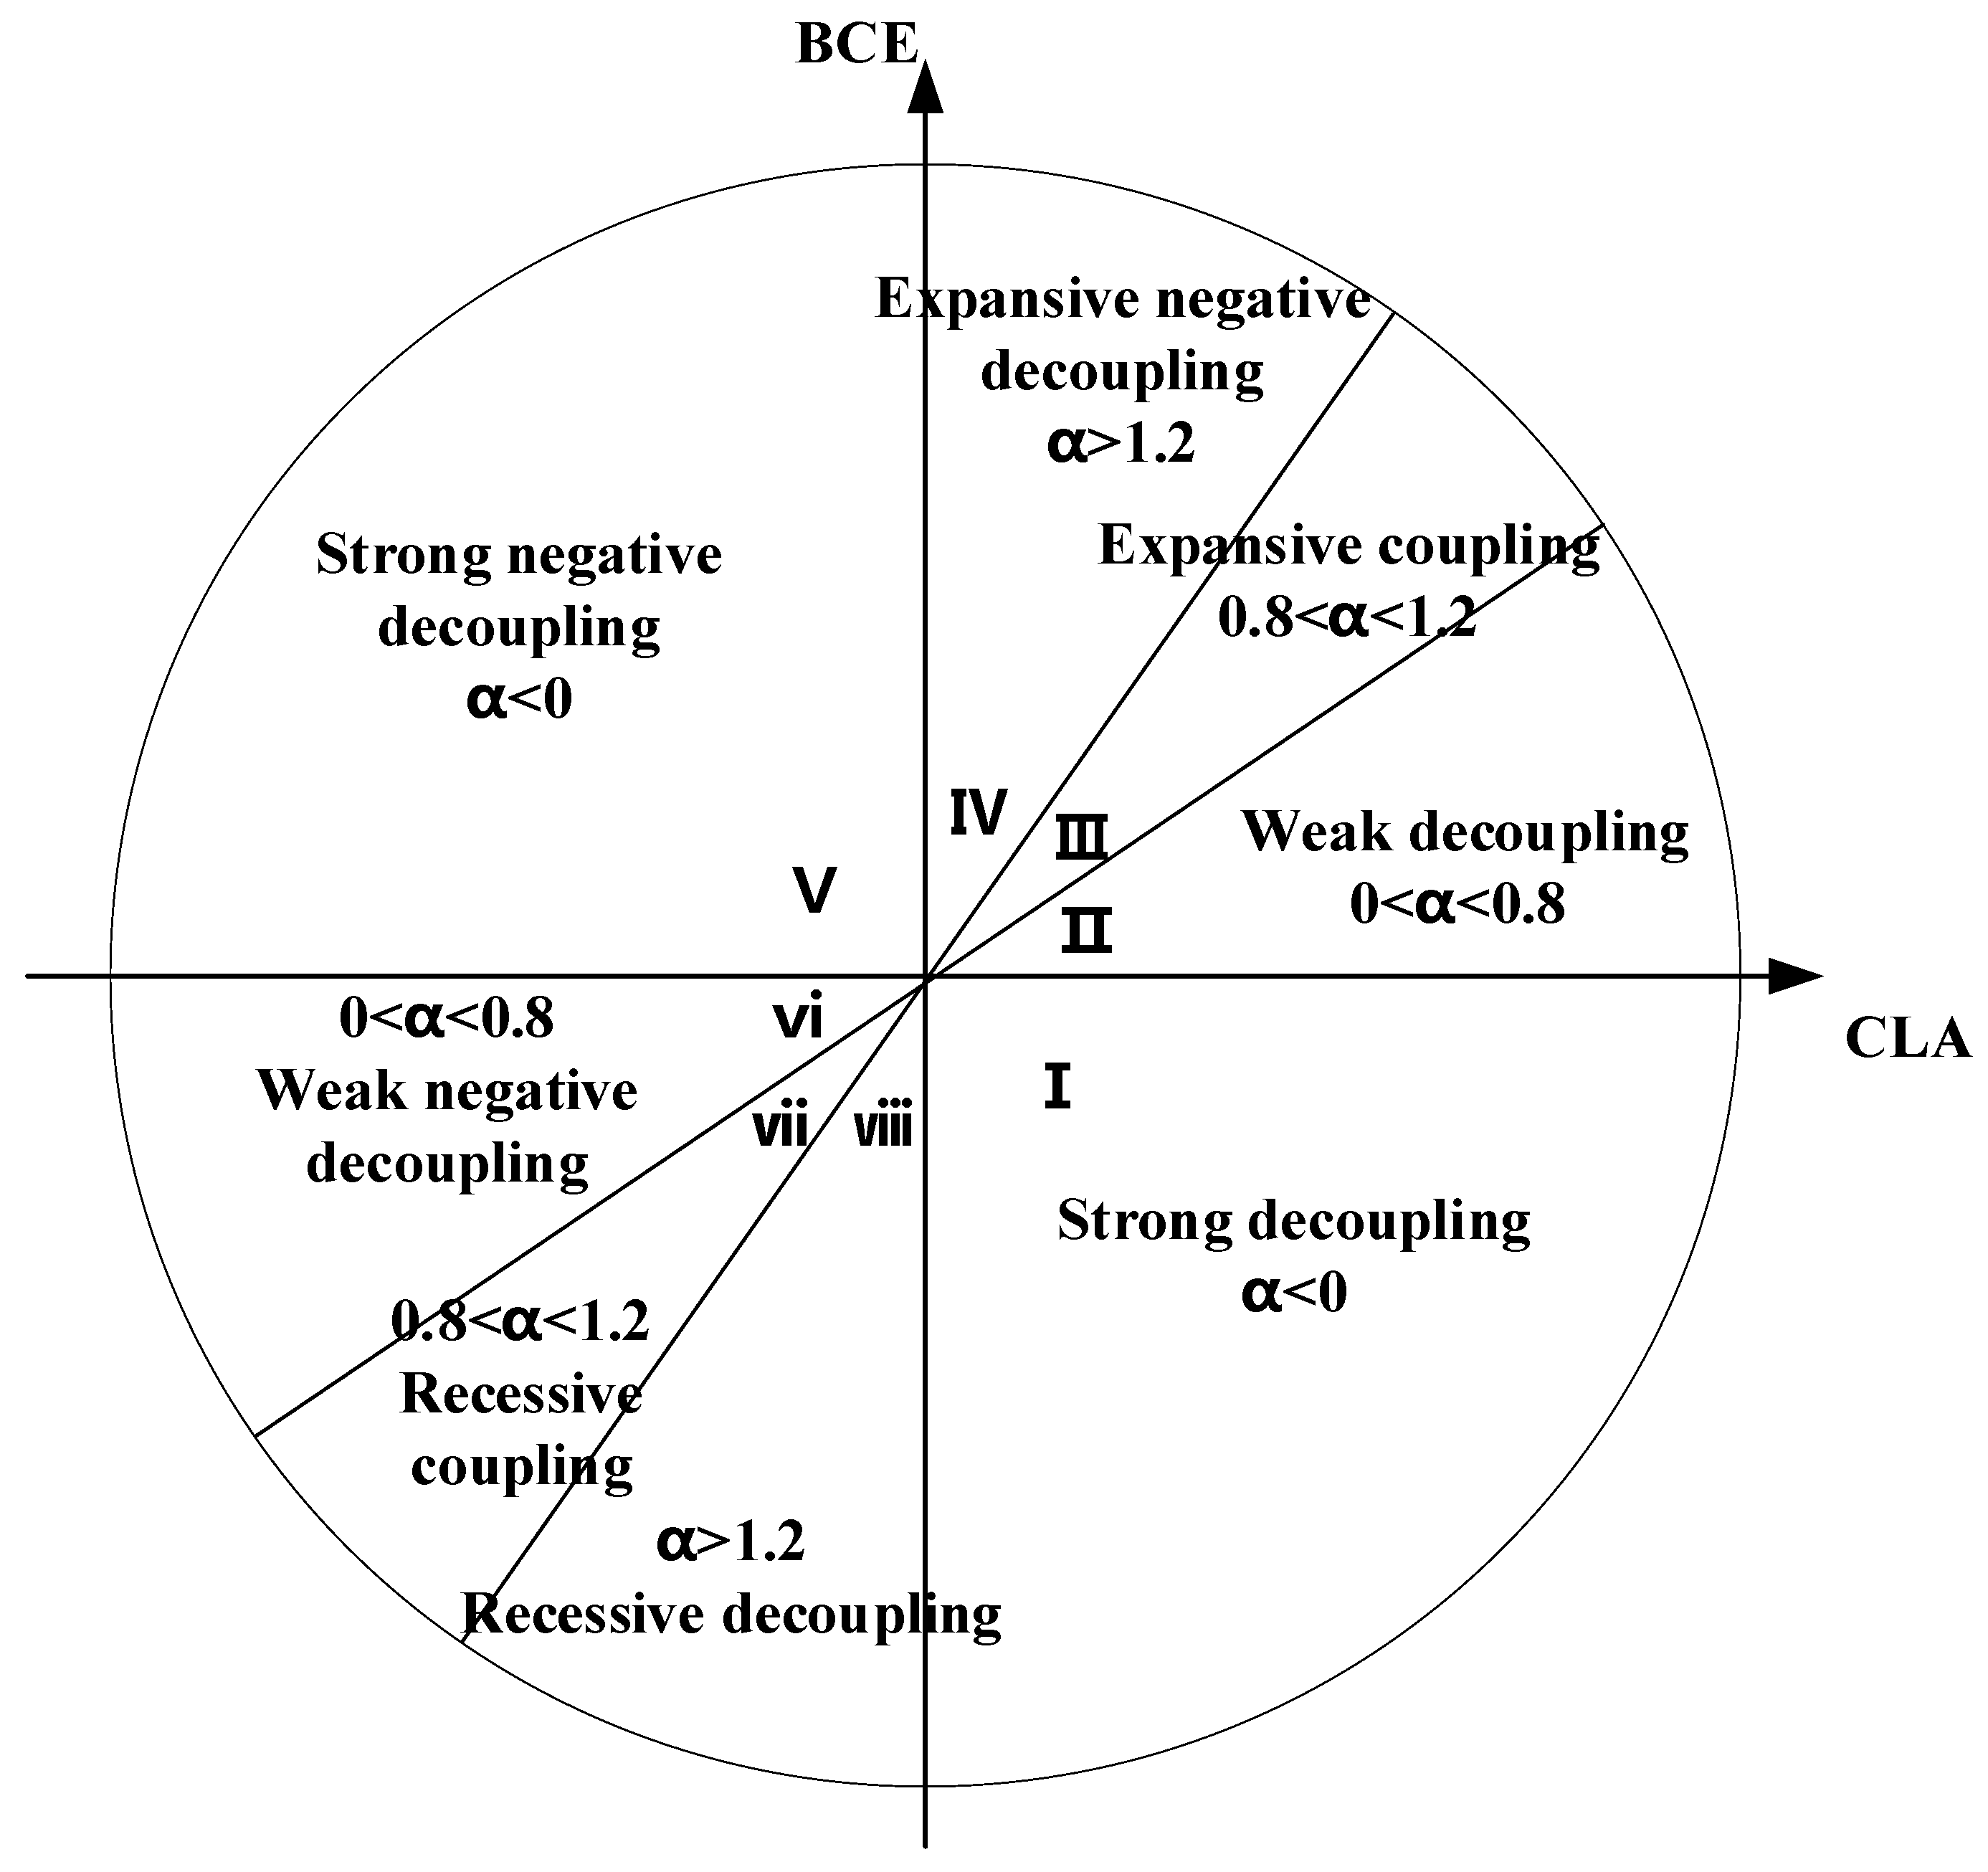
2.3. Decoupling Model

With the rapid advancement of urbanization, increasingly severe contradictions among environmental degradation, resource conservation, and socio-economic development have arisen. The issue of “decoupling” between socio-economic development and the natural environment pressures has gradually garnered attention from relevant managers and scholars. Consequently, the concept of “decoupling” has been integrated into research and management within the socio-economic domain [42,43]. Hence, the degree of decoupling has become a crucial indicator for assessing the impact of environmental pressures on regional economic growth. This study employed the Tapio decoupling model to analyze the decoupling relationship between BCE and CLA. This model was introduced by Tapio in 2005 to examine the degree of decoupling between transportation development and carbon dioxide emissions in Europe [44]. It defines decoupling elasticity and categorizes the decoupling relationship between carbon dioxide emissions and economic growth into three types: decoupling, coupling, and negative decoupling. The clear reflection of the correlation and interaction between variables, as demonstrated by the decoupling elasticity coefficient, has played a significant role in the scientific development and enhancement of the decoupling indicator system, as well as in the advancement of the decoupling theory. This model is the most widely used method in environmental economics for studying the decoupling relationship between economic development and environmental pressure. It integrates two types of indicators: total changes and relative changes. It employs time series and elasticity analysis methods to dynamically illustrate the decoupling relationship between economic indicators and environmental variables, thereby enhancing the objectivity and accuracy of measuring and analyzing such a relationship. Compared to the IPAT model, that is limited to static analysis but cannot decompose the contributions of dynamic changes, and the LMDI model, that necessitates detailed sub-item data and is sensitive to outliers while demanding high data quality, this model is superior in reflecting long-term dynamic changes with simpler data requirements and hence is more suitable for evaluating the sustainable development status of building carbon emissions.
According to the Tapio decoupling model, the decoupling coefficient represents the ratio of the magnitude of changes in CLA to changes in BCE. It is calculated according to the following formula:
δ = C t L t = C 0 + t C 0 / C 0 L 0 + t L 0 / L 0
where δ represents the decoupling elasticity coefficient between BCE and CLA during the period t; C t is the rate of change in BCE during the period t; L t is the rate of CLA change during the period t; C0 represents the base period BCE during time period t; C0+t represents the final BCE during the period t; L0 represents the CLA at the beginning of period t; and L(0+t) is the CLA at the end of the period t.
Tapio defined eight distinct types of decoupling, with decoupling coefficient values of 0, 0.8, and 1.2 serving as critical thresholds (Figure 2). In this classification, a range of elastic values within ±20% of the decoupling coefficient of 1.0 is considered coupled. Consequently, when the decoupling coefficient falls between 0.8 and 1.2, it is categorized as a coupling type. Furthermore, when the growth of the variable is either positive or negative, the coupling type is further divided into expansive coupling or recessive coupling. In Figure 2, each type of decoupling conveys a distinct meaning. For instance, expansive decoupling is characterized by a negative rate of change in CLA alongside a positive rate of change in BCE. Other types of decoupling can be elucidated similarly.

3. Results

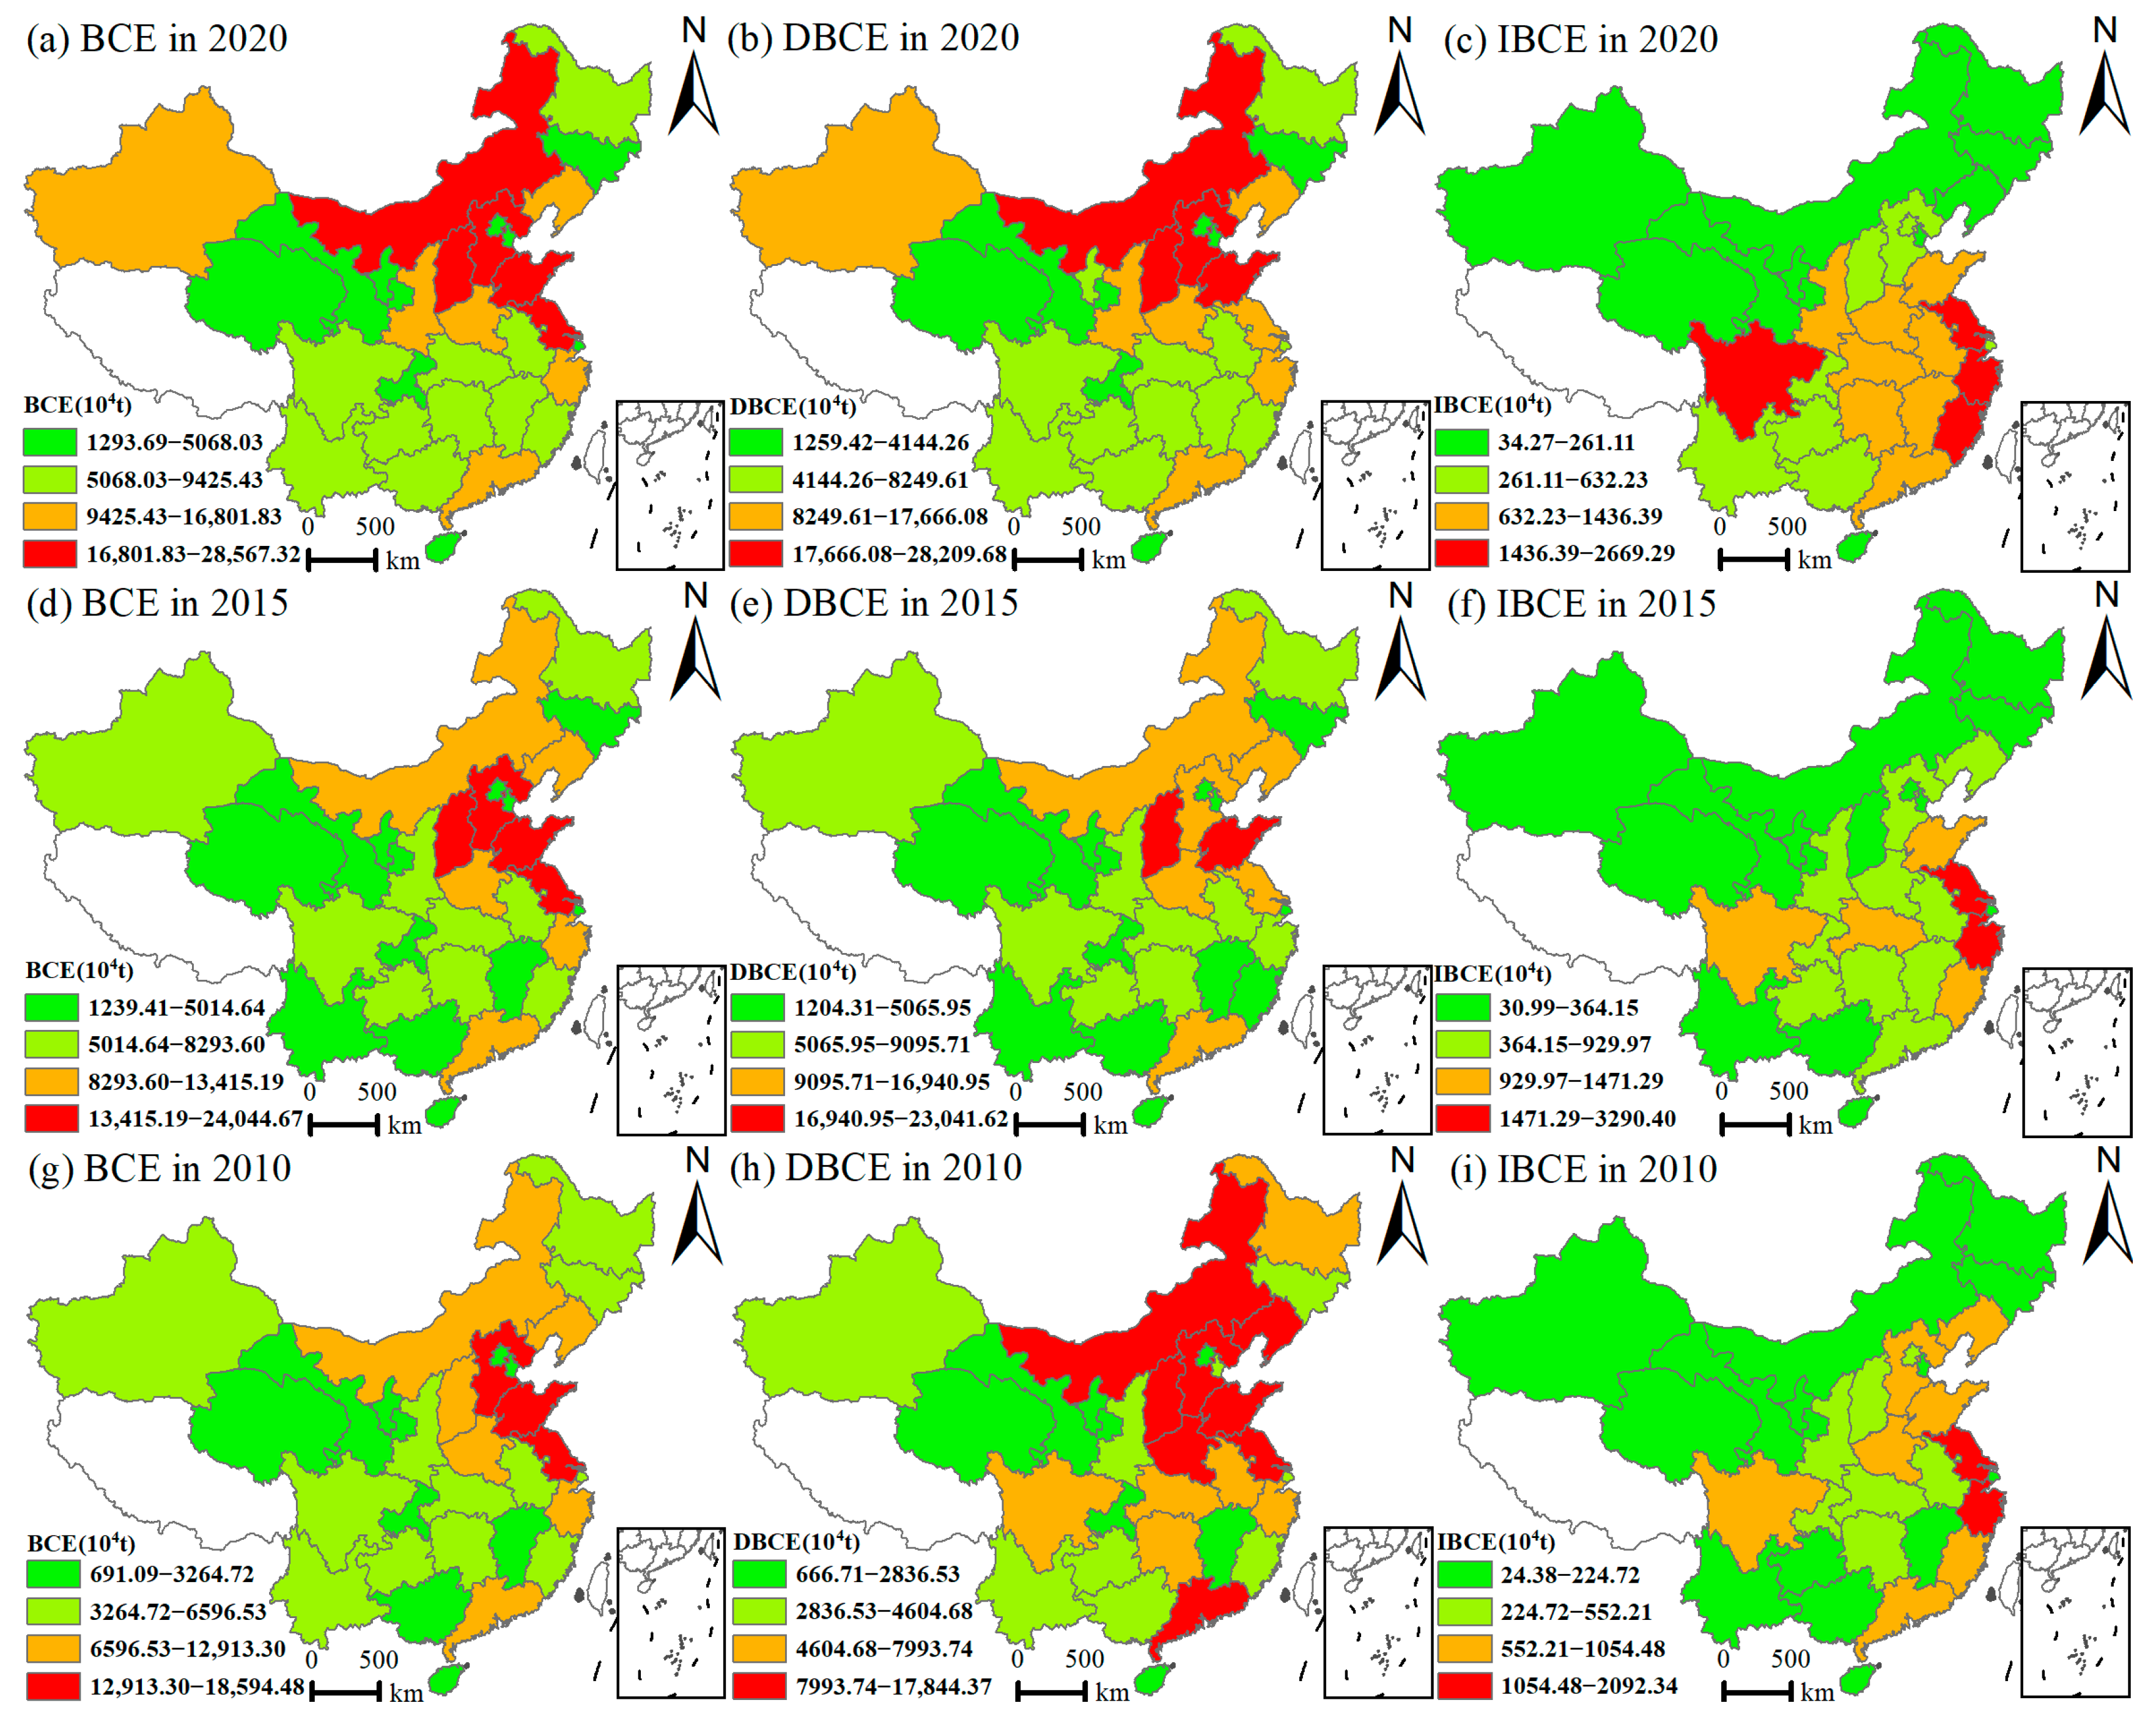
3.1. The Spatiotemporal Pattern of BCE

3.1.1. The Spatial Cluster Pattern of BCE During 2010–2020

The natural discontinuity method in the ArcGIS 10.8 software was utilized to categorize BCE of the 30 provinces, illustrating the clustering pattern across four distinct levels, ranging from high to low. This categorization was mapped to depict both the levels and the evolution patterns (see Figure 3). In 2020, the regions with the highest BCE were primarily located in Inner Mongolia, Hebei, Shanxi, Shandong, and Jiangsu in northern China, each reporting annual BCE exceeding 168.01 million tons. These areas are significant coal production bases and are also vital for heavy industries, such as steel manufacturing. In contrast, Qinghai, Gansu, and Ningxia in the northwest, along with Chongqing and Hainan in the south, exhibited the lowest levels of BCE. This disparity is largely attributed to their reliance on animal husbandry and service industries, while high-energy-consuming heavy industries constitute a relatively small portion of their economies. The pattern of DBCE in 2020 mirrored the overall pattern of BCE, primarily due to the predominance of DBCE within the total BCE. Conversely, the pattern of IBCE in 2020 displayed significant differences from both BCE and DBCE. The highest levels of IBCE were observed in Sichuan in the southwest, as well as in Jiangsu, Zhejiang, and Fujian in the east, which serve as important production bases for building materials, including wood and cement. Additionally, central and southern China exhibited relatively high levels of IBCE, while northern and northeastern China produced the lowest IBCE.
From 2010 to 2020, China’s BCE exhibited an increase in the number of high-emission provinces, accompanied by a continuous decline in the number of low-emission provinces. Specifically, in 2010, the provinces with the highest levels of BCE were limited to Hebei, Shandong, and Jiangsu along the northern coast. Over time, Shanxi and Inner Mongolia in the northern inland region joined this group. Conversely, in the early stages, southern provinces such as Guangxi, Jiangxi, and Yunnan, which initially had the lowest levels of BCE, gradually transitioned to higher levels. DBCE is characterized by fluctuations in certain regions, transitioning from high emission levels to lower levels and then back to high levels. The number of provinces with the highest DBCE decreased from eight in northern China in 2010 to only two provinces, Shanxi and Shandong, in 2015, before expanding to four provinces in northern China by 2020. Conversely, the provinces with the lowest DBCE shifted from western and southern China to northwest China. The evolution of IBEC characteristics indicates that high-emission provinces are expanding from the eastern coastal regions into the central and western provinces, while low-emission provinces are gradually contracting and clustering in northern China.

3.1.2. The Changes in BCE

In terms of changes in BCE, the overall growth of BCE, DBCE, and IBCE across the target provinces has exhibited significant variations (Figure 4). From 2010 to 2020, the BCE of most provinces increased, albeit at a declining rate. The average increment decreased from 18.76 million tons during 2010–2015 to 15.77 million tons during 2015–2020. The provinces that experienced significant growth in BCE from 2010 to 2015 were primarily located along the northern and eastern coasts of China, with Shanxi Province recording the largest increase of 86.53 million tons. The provinces that saw substantial growth in BCE between 2015 and 2020 were limited to Inner Mongolia, Shanxi, Xinjiang, Liaoning, and Shandong in northern China, as well as Guangdong Province in southern China. The largest increment during this period was recorded at 69.69 million tons in Shanxi, followed by 62.28 million tons in Inner Mongolia. From 2010 to 2020, several provinces experienced a decline in BCE, with the number of provinces reporting reductions increasing from two during 2010–2015 to five during 2015–2020. Notably, between 2010 and 2015, BCE in Beijing decreased by 2.89 million tons, while Heilongjiang experienced a reduction of 0.53 million tons. The provinces that achieved reduced carbon emissions from 2015 to 2020 expanded from northern to southern China, including Jilin, Tianjin, and Henan in the north, as well as Sichuan and Hainan in the south.
DBCE of various provinces generally increased from 2010 to 2020. From 2010 to 2015, Shanxi, located in northern China, experienced the highest increase, with an additional 87.41 million tons in DBCE. From 2015 to 2020, Shanxi, Inner Mongolia, and Shandong led in emissions growth, each contributing approximately 50 million tons. The provinces that recorded a reduction in DBCE expanded from Heilongjiang and Beijing in northern China between 2010 and 2015 to include Beijing and Henan in northern China, as well as Shanghai, Guizhou, and Hainan in southern China from 2015 to 2020. Although IBCE of various provinces generally increased from 2010 to 2020, the number of provinces experiencing a decline was significantly higher than that of provinces witnessing a decrease in BCE and DBEC. The provinces that experienced the most substantial increase in IBCE from 2010 to 2015 were Hubei, Jiangsu, Zhejiang, and Fujian, located in central and eastern China. From 2015 to 2020, the provinces with the highest growth rates were Fujian in the east and Sichuan in the west, which saw increases of 1202.73 million tons and 961.54 million tons, respectively. Meanwhile, the number of provinces with reduced IBCE rose from seven during 2010–2015 to 11 in 2015–2020, expanding from primarily northern provinces to include southern and western provinces. This trend indicates that China has made significant progress in reducing carbon emissions in the building materials production industry.

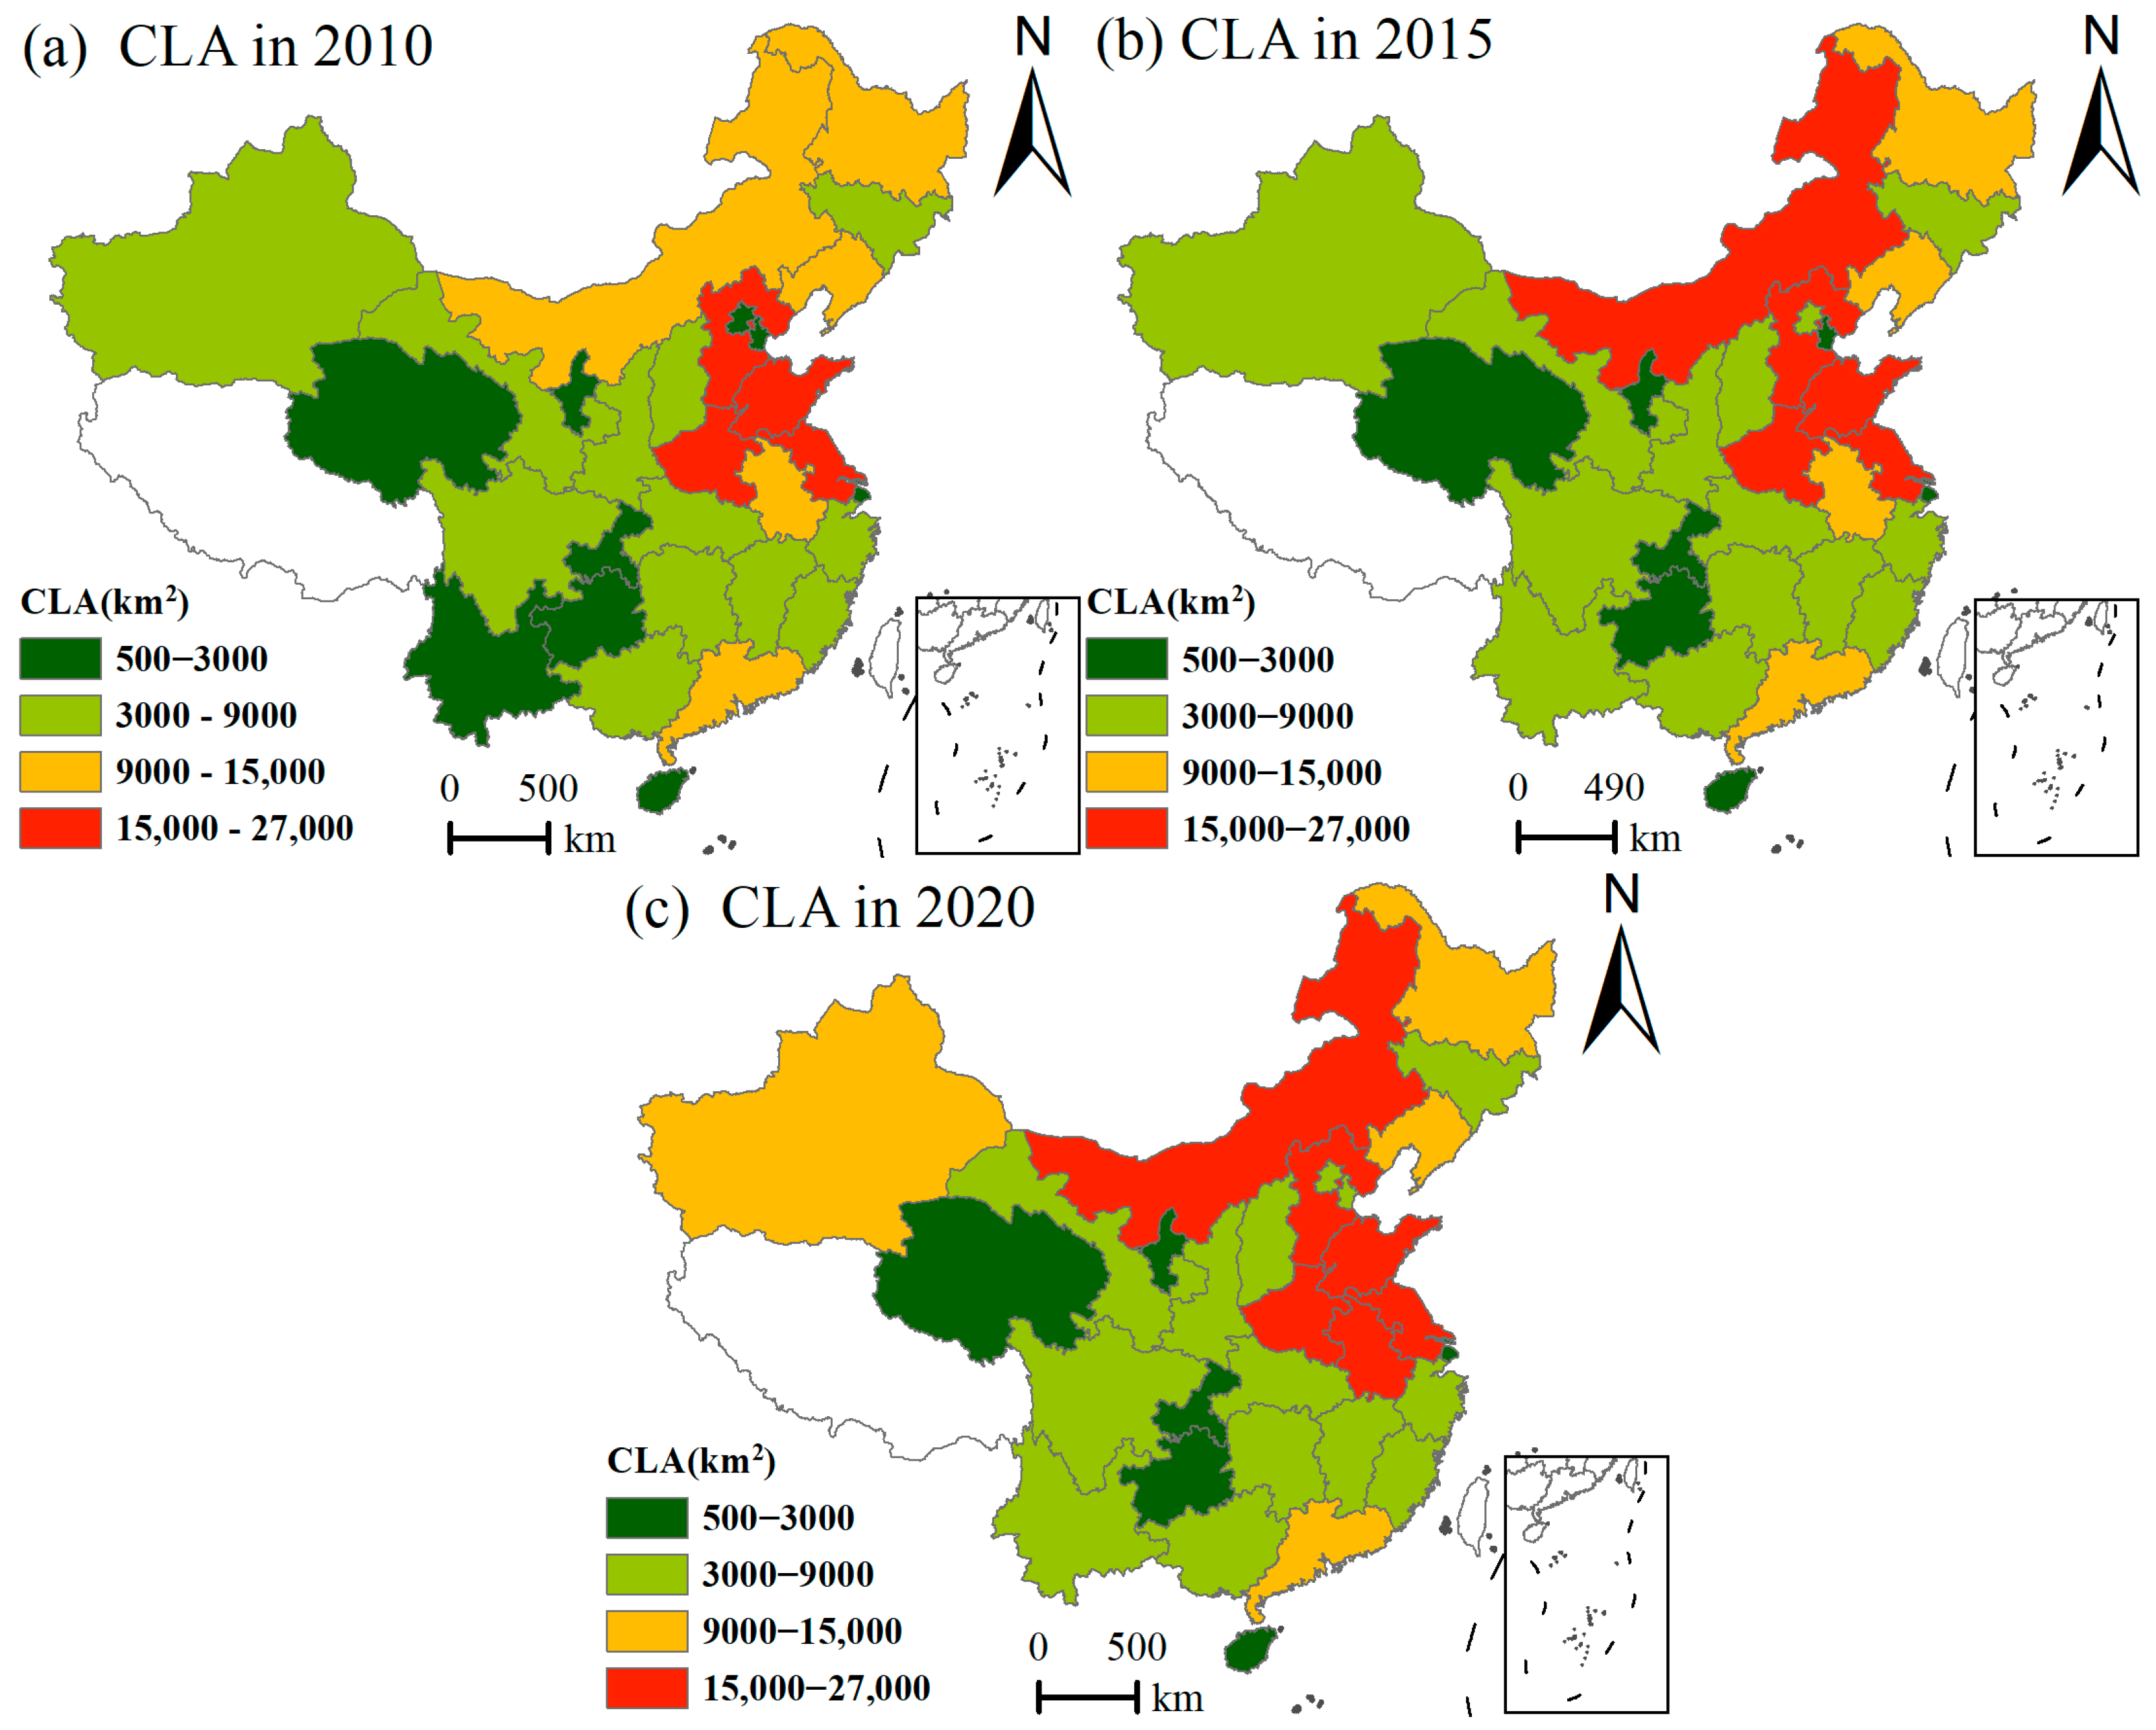
3.2. The Spatiotemporal Pattern of CLA

From 2010 to 2020, CLA in most provinces exhibited an upward trend. Its average value increased from 7378.34 km2 in 2010 to 8371.56 km2 in 2015, and further to 8662.74 km2 in 2020 (Figure 5). The provinces with the largest construction land areas, exceeding 15,000 km2 in 2010, were Hebei, Shandong, Henan, and Jiangsu in North China. After 2015, Inner Mongolia also joined this group. These provinces are characterized by their large populations, particularly a significant proportion of rural residents. The extensive area of rural construction land has contributed to the overall increase in total construction land. In contrast, the provinces with the smallest construction land areas, measuring less than 3000 km2, were primarily located in southwestern China, including Qinghai, Ningxia, Guizhou, and Chongqing. These provinces tend to have smaller populations and relatively underdeveloped economies, resulting in limited areas of construction land.
The growth rate of construction land areas in various provinces slowed from 2010 to 2020, with some provinces even experiencing a decrease between 2015 and 2020 (Figure 6). The rapid economic development and population growth from 2010 to 2015 drove the expansion of construction land across all provinces. The provinces that experienced the most significant increase in construction land, exceeding 1600 km2, were primarily located in North China, including Henan, Inner Mongolia, Xinjiang, and Hubei. Conversely, the provinces with the smallest increase, totaling less than 400 km2, included Tianjin, Ningxia, and Qinghai in North China, as well as Shanghai, Fujian, and Hainan in South China. From 2015 to 2020, the growth rate of construction land area significantly declined to less than 900 km2, with the most substantial increase occurring in Xinjiang at 803.56 km2. Additionally, the growth rate in the eastern coastal provinces was lower than that in the inland provinces. Between 2015 and 2020, a notable decrease in CLA was observed across five northern provinces: Inner Mongolia, Heilongjiang, Qinghai, Shanxi, and Hubei. This decline resulted from the Chinese government’s initiatives to transition from extensive expansion to intensive utilization of construction land. These initiatives are characterized by stringent controls on the proliferation of urban construction land and heightened efforts to address idle rural residential areas. Consequently, they have slowed the expansion of construction land and reduced its scale in provinces that have made significant efforts to consolidate rural construction land.

3.3. Decoupling Relationship Between BCE and CLA

The relationship between BCE and the CLA in most provinces was decoupled during the periods of 2010–2015 and 2015–2020, albeit with varying performance (see Figure 7). From 2010 to 2015, 17 provinces—more than half of the total—experienced significant negative decoupling, where the growth rate of BCE exceeded that of CLA. Among these, four provinces exhibited expansive coupling, indicating that the growth rates of BCE and CLA were aligned. Additionally, seven provinces demonstrated weak decoupling, while others showed strong decoupling. Weak decoupling signifies that the growth rate of BCE was slower than that of CLA, whereas strong decoupling indicates that CLA increased while BCE decreased. The relationship between BCE and CLA across all provinces from 2015 to 2020 exhibited various types of decoupling. Notably, 17 provinces had expansive negative decoupling, while five had strong negative decoupling. This indicates that BCE in these provinces was inconsistent with the slow or reduced expansion of construction land. Additionally, three provinces showed weak decoupling, and five provinces exhibited strong decoupling. Over the past few decades, the economic development of most provinces in China has relied heavily on high-energy-consuming industries, such as steel and cement. Furthermore, relaxed environmental control policies and a lack of awareness regarding BCE management have contributed to rapid economic growth, resulting in excessive BCE that outpaced the expansion of construction land.
Compared to the period from 2010 to 2015, BCE in more provinces outpaced the expansion of construction land between 2015 and 2020. However, there were fewer provinces where the growth of BCE was either aligned with or slower than the expansion of construction land. This trend may be attributed to China’s recent tightening of farmland protection policies, which has constrained the pace of construction land expansion. Furthermore, prior to 2020, there was no consensus on carbon emission control in China, and a comprehensive carbon emission control policy had yet to be established. The interplay of these factors exacerbates the non-synergistic relationship in which carbon emissions from buildings exceed the rate of construction land expansion. Consequently, additional measures must be implemented in the future to achieve emission reduction targets.
The relationship between BCE and CLA in most provinces of China from 2010 to 2015 and from 2015 to 2020 is primarily characterized by expensive negative decoupling. This means that the growth rate of BCE exceeds the expansion of construction land. This phenomenon arises from the cumulative effects of multiple factors, including economic structure, energy dependence, technological efficiency, and policy orientation. China’s energy structure is heavily reliant on fossil fuels, particularly coal. Approximately 60% of China’s energy consumption is derived from coal, which has a significantly higher carbon emission intensity compared to other energy sources. Although the rate of construction land expansion has slowed, the coal-dominated energy structure continues to drive a sustained increase in BCE. Concurrently, urbanization is fueling the demand for residential and industrial electricity. Thermal power still constitutes 71% of China’s energy mix, with the majority of new electricity demand being met by coal-fired power plants, further exacerbating BCE. China’s economic structure is characterized by a significant reliance on energy-intensive heavy industries and manufacturing. The steel, cement, and chemical sectors contribute nearly 30% of China’s carbon emissions. For instance, in 2020, China’s crude steel production accounted for 57% of the world’s total, while its cement production exceeded 50%. Although energy consumption per unit of GDP in China has been decreasing annually, the rapid expansion of the economy has resulted in a continuous increase in overall energy consumption, which has offset some of the emission reduction effects. Despite China’s efforts to promote intensive and three-dimensional development of construction land use, such as high-density urban development, both economic output and energy consumption intensity per unit of land have increased. While construction land expansion has slowed, carbon emissions per unit area have risen. The growth rate of China’s BCE, which outpaces the expansion of CLA, is fundamentally a result of the extensive economic growth model and the lagging transition to low-carbon practices. Although construction land regulation policies, such as the “1.8 billion mu arable land red line”, have curtailed unregulated construction land expansion, the transition of energy and industrial structures will require more time.
There are significant differences in the spatial patterns of the decoupling relationship between BCE and CLA that can be found when comparing the periods of 2010–2015 and 2015–2020 (Figure 8). The provinces exhibiting expansive coupling and weak decoupling types from 2010 to 2015 were primarily located in North China and Southwest China, while Heilongjiang and Jilin in Northeast China demonstrated strong decoupling and weak decoupling, respectively. This indicates that the control of BCE in these regions is effective. From 2015 to 2020, the intensity of BCE in certain provinces of Southwest and North China increased, resulting in a shift in the decoupling type towards expansive negative decoupling and strong negative decoupling. The strong decoupling and weak decoupling types, characterized by relatively low BCE, were found in only a few provinces in North and Southwest China. Northern provinces in China, including Inner Mongolia and Heilongjiang, have historically served as bases for coal energy and high-energy-consuming heavy industries, leading to significant BCE. However, due to the challenges associated with economic transformation in recent years, the demand for expanded construction land has diminished. Consequently, an increasing number of provinces are exhibiting a strong negative decoupling type, where the growth of BCE surpasses the expansion of construction land.

4. Discussion

4.1. Improvements of the Measurement of BCE

The calculation of BCE serves as the foundation for quantitatively describing trends, exploring the influencing factors, and designing effective reduction strategies [45]. The IPCC emission factor method, introduced in the 1996 IPCC Guidelines for National Greenhouse Gas Inventories, is currently the most widely utilized approach for estimating carbon emissions [40,46]. The essence of the IPCC emission factor method lies in the selection of carbon emission sources and the calculation of their respective emission coefficients [47]. Feng (2015) calculated BCE across 30 provinces in the Chinese Mainland from 2004 to 2011 using this method, where 12 fossil and electric energy sources were taken into account, and the values of carbon emission coefficient were derived from previous research in calculating DBCE. He found that China’s BCE had been increasing annually, and indirect carbon emissions accounted for approximately 90% of the total emissions [39]. Li et al. (2019) assessed BCE in Shanghai from 1999 to 2015 and examined its decoupling relationship with construction land. They utilized consumption data from the eight mostly consumed energy sources in Shanghai and adopted the carbon emission coefficients indicated in the 2016 IPCC Guidelines for National Greenhouse Gas Inventories [28].
The energy consumption of China’s building sector, particularly from fossil fuels, is highly diverse. Official statistical data document nearly thirty types of fossil fuels, and the carbon emission coefficients for each type vary based on the technology employed during different periods. Previous studies have typically focused on only a few common fossil fuels due to challenges in data acquisition and the excessive workload involved. Consequently, they have heavily relied on existing research for carbon emission coefficients, which hampers the ability to comprehensively and accurately reflect BCE. This study has collected data on 28 types of energy from 2010 to 2020 across 30 provinces. It has also calculated and updated the carbon emission coefficients for various energy types based on the latest standards, enabling a more comprehensive and consistent assessment of BCE in China. The results indicate that BCE across various provinces in China is generally increasing, which aligns with previous research findings. We have also found that DBCE accounts for over 90% of total emissions, and BCE exhibits a pattern of being higher in northern provinces compared to southern ones. Additionally, the growth rate of BCE is decelerating, particularly for IBCE, which has even declined in some provinces. These findings will provide new insights into the understanding and management of carbon emissions in China.

4.2. Region-Specific Policy Implementation

BCEs are generated by the consumption of fossil fuels in various socio-economic activities, with construction land as the carrier [48]. An increase in CLA correlates with a rise in diverse human activities, including industrial production, residential living, and transportation, which in turn leads to a rapid increase in building carbon emissions. This interaction should foster a synergistic relationship between the growth of BCE and the expansion of CLA [28,29]. However, this study has found that BCEs in the provinces studied are increasing faster than the expansion of CLA. Furthermore, the relationship between BCE and CLA exhibits expansive negative decoupling and strong negative decoupling. This indicates that the prior utilization of construction land had not significantly impacted BCE, and the efforts to promote the control and reduction of carbon emissions were unsatisfactory. Each province must implement region-specific BCE reduction policies that take into account regional resource endowments, stages of economic development, and land use characteristics.
Economically developed regions with high emissions from extensive construction land, such as Shandong, Jiangsu, and Guangdong along the eastern coast, exhibit a significant urbanization rate. The saturation of construction land in these areas has led to intensified industrial and service activities. The relationship between BCE and CLA is primarily characterized by expansive negative decoupling. To address this issue, priority should be given to updating the existing stock of construction land rather than pursuing incremental expansion. It is essential to strictly control the addition of industrial land and promote the development of low-carbon, high-end industries by relocating or phasing out energy-intensive and high-emission sectors. This approach aims to achieve industrial replacement, structural adjustment, and upgrading. Furthermore, specific indicators for low-carbon industrial land should be established, focusing on sectors such as new energy and the digital economy, while simultaneously reducing the proportion of land allocated to traditional manufacturing industries.
Regions in central China, such as Shaanxi, Hunan, and Inner Mongolia, are undergoing rapid urbanization and experiencing swift industrialization. By leveraging their abundant energy resources and large populations, these regions have become key recipients of industrial transfers from the more developed eastern areas. Over the past decade, BCE has significantly increased, outpacing the expansion of CLA. This trend highlights a strong negative decoupling relationship between BCE and CLA. The carbon emission control policies that may be adopted include: establishing carbon thresholds for future industrial projects to eliminate those with high energy consumption but low output; implementing efficient utilization of traditional coal and new energy sources while increasing the proportion of renewable energies, such as wind and solar power, in industrial consumption; and intensifying the consolidation of idle rural homesteads to convert them into ecological land, such as forests, thereby enhancing carbon sequestration efforts.
In ecologically sensitive regions of western China, such as Sichuan, Qinghai, and Xinjiang, BCE and CLA are relatively low. However, over the past decade, many areas have experienced a simultaneous increase in both BCE and CLA, with the rise in BCE outpacing the growth of CLA. This trend has resulted in a relationship characterized by expansive negative decoupling, and in some cases, strong negative decoupling. Historically, these provinces have served as important carbon sinks, making substantial contributions to the balance of carbon emissions in the country. To effectively control carbon emissions, the following measures may be implemented: prioritizing land use for renewable energy by planning wind and photovoltaic installations in desert and Gobi regions; exploring integrated land use models that combine residential, industrial, and solar power generation areas; restricting the expansion of land for high energy-consuming activities; freezing the approval of land for new coal-fired power projects; and promoting the transition of coal-fired power facilities to hydrogen energy production. Additionally, relocating residents from ecologically fragile areas and converting their original production and living land into carbon sequestration forests should be considered.

4.3. Limitations and Future Research

This study comprehensively collected consumption data for 28 types of energy across 30 provinces in the Chinese Mainland and updated their carbon emission coefficients. The IPCC emission factor method was employed to calculate BCE for each province from 2010 to 2020, and the Tapio decoupling model was utilized to analyze the relationship between BCE and CLA. This research is significant for enhancing the understanding of BCE and for formulating effective emission reduction strategies in China. However, there are still some limitations. (1) The variations in the structure and strength of construction land use will have distinct impacts on BCE, and the mechanisms underlying these relationships require further investigation; and (2) the regulation of construction land is a crucial strategy for achieving the “dual carbon” goals; however, policy formulation must align with local industrial structures and resource endowments. Future research needs to focus on developing dynamic assessment models for emission reduction to ensure long-term sustainability.

5. Conclusions

In this study, BCE is categorized into DBCE and IBCE. Utilizing consumption statistics for 28 types of energy and recalibrated carbon emission coefficients, we calculated BCE for 30 provinces in the Chinese Mainland from 2010 to 2020. Additionally, we explored the evolution of the structure and patterns of these emissions. The Tapio decoupling model was employed to analyze the relationship between BCE and CLA in each province. The results indicate that BCE varies across different provinces, revealing significant differences in the decoupling relationship with CLA. The specific conclusions are as follows:
(1)
BCE in the provinces studied exhibited an overall increase from 2010 to 2020; however, the growth rate decelerated. Specifically, the growth rate decreased from 18.76 million tons during the period of 2010–2015 to 15.77 million tons from 2015 to 2020. DBCE accounted for over 90% of total emissions, while IBCE experienced the slowest growth rate and even a decline in several provinces. The emission reduction efforts within the building materials production industry have proven effective, and minimizing the use of fossil fuels will be the most critical strategy for future emission reductions.
(2)
The evolution of BCE demonstrates spatial heterogeneity. BCE and DBCE were higher in the northern provinces but lower in the southern ones. Conversely, provinces with elevated IBCE were primarily concentrated along the eastern coast. Regions experiencing significant increases in BCE and DBCE included Inner Mongolia, Shandong, and Shanxi in northern China. In contrast, provinces in northern China exhibited either a decrease or a slower growth rate in IBCE.
(3)
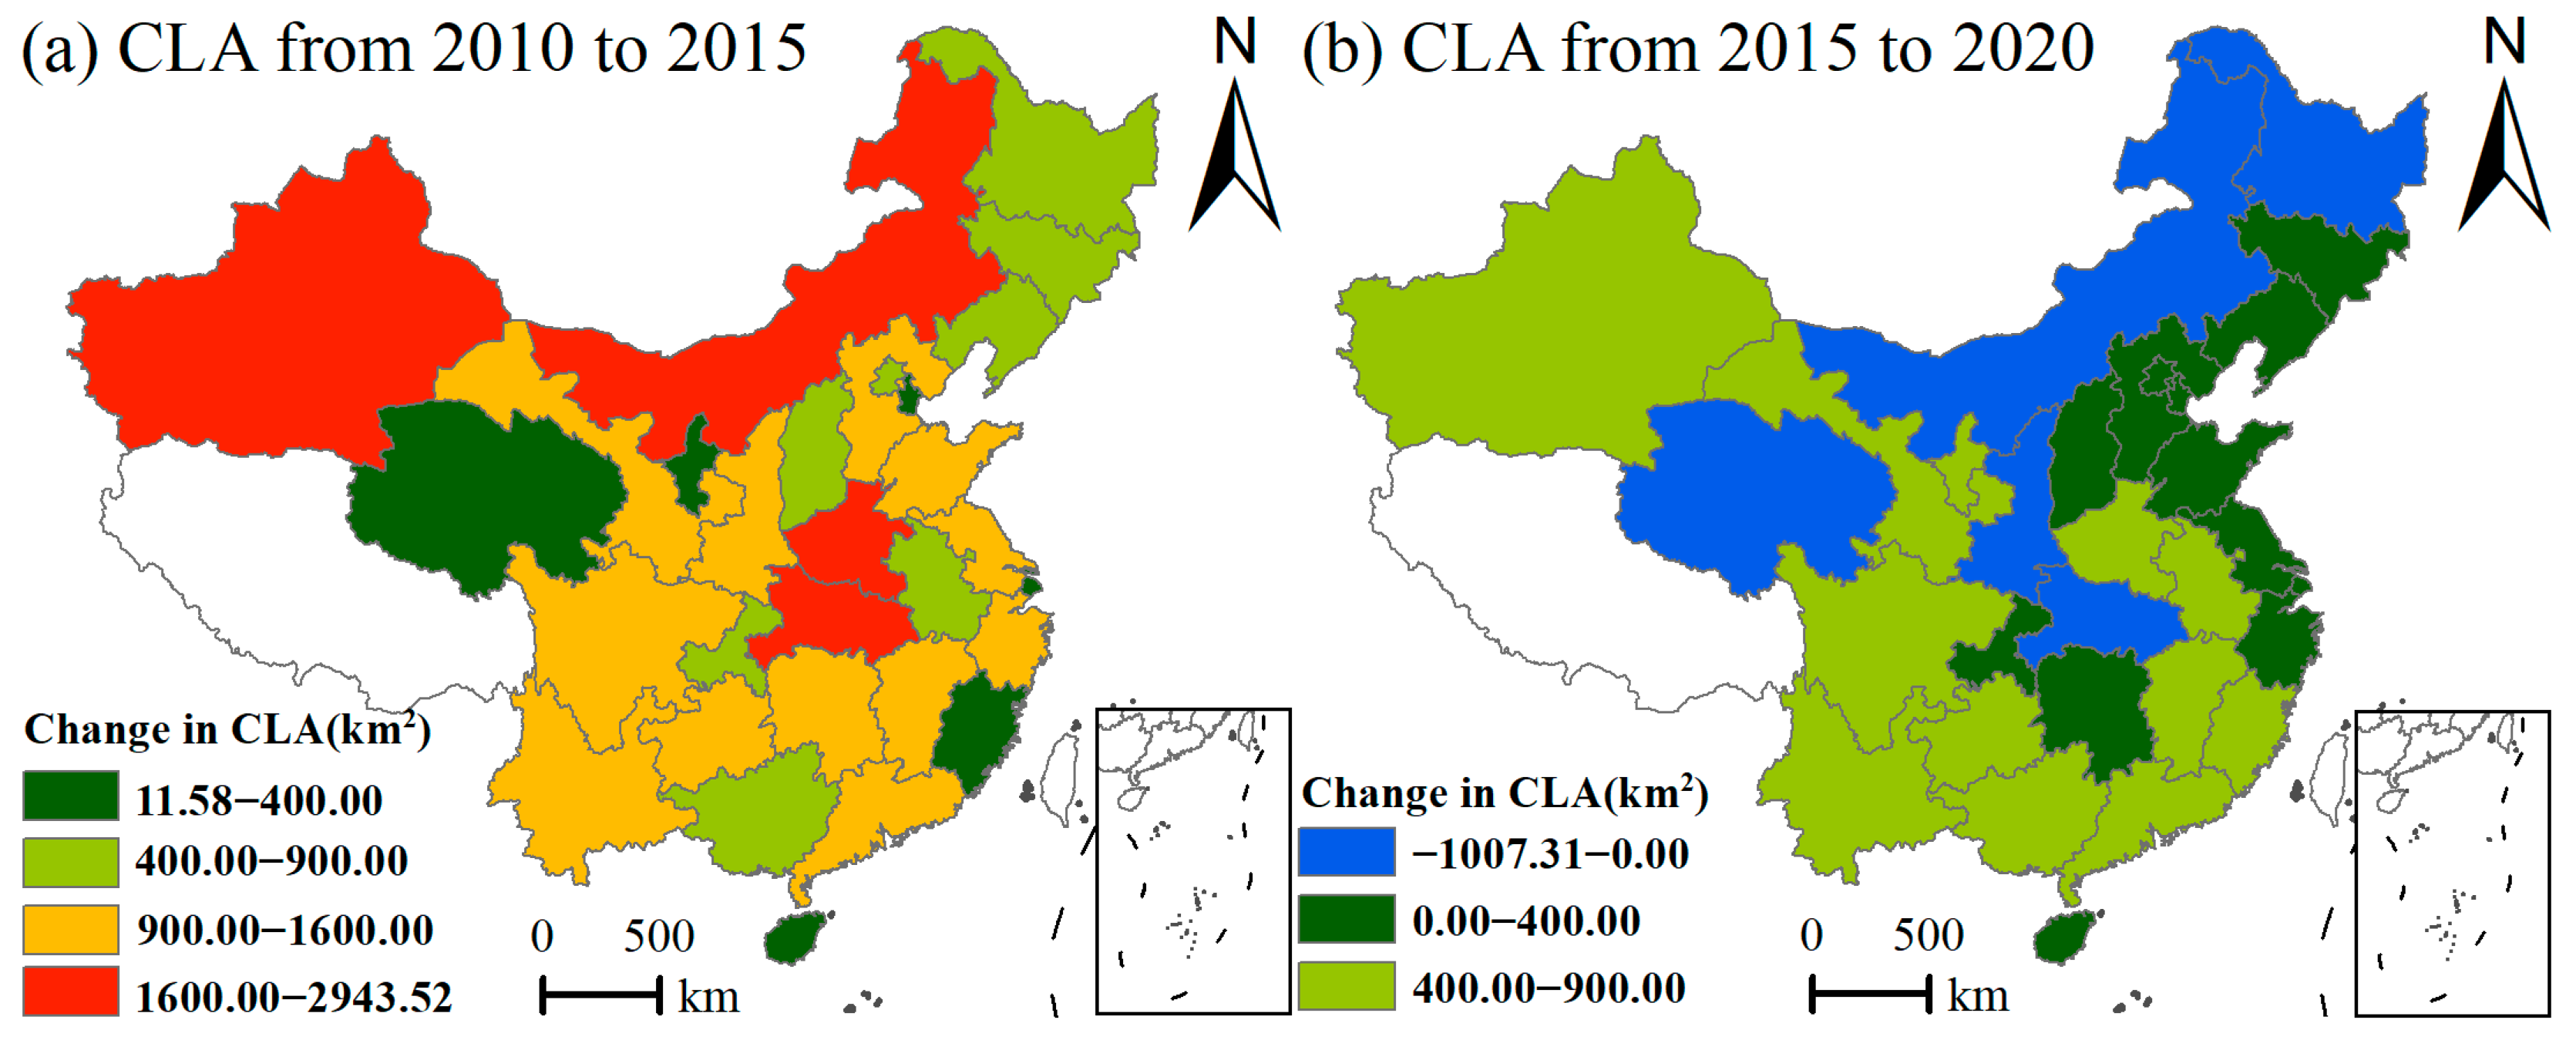
CLA was larger in the northern regions but smaller in the southern regions; however, its growth rate in the North has been lower than that in the South in recent years. The provinces with the largest CLA primarily extend from North China to Northeast China. Notably, the trend in CLA shifted from a consistent increase between 2010 and 2015 to a decline in several provinces in North China and Northeast China between 2015 and 2020.
(4)
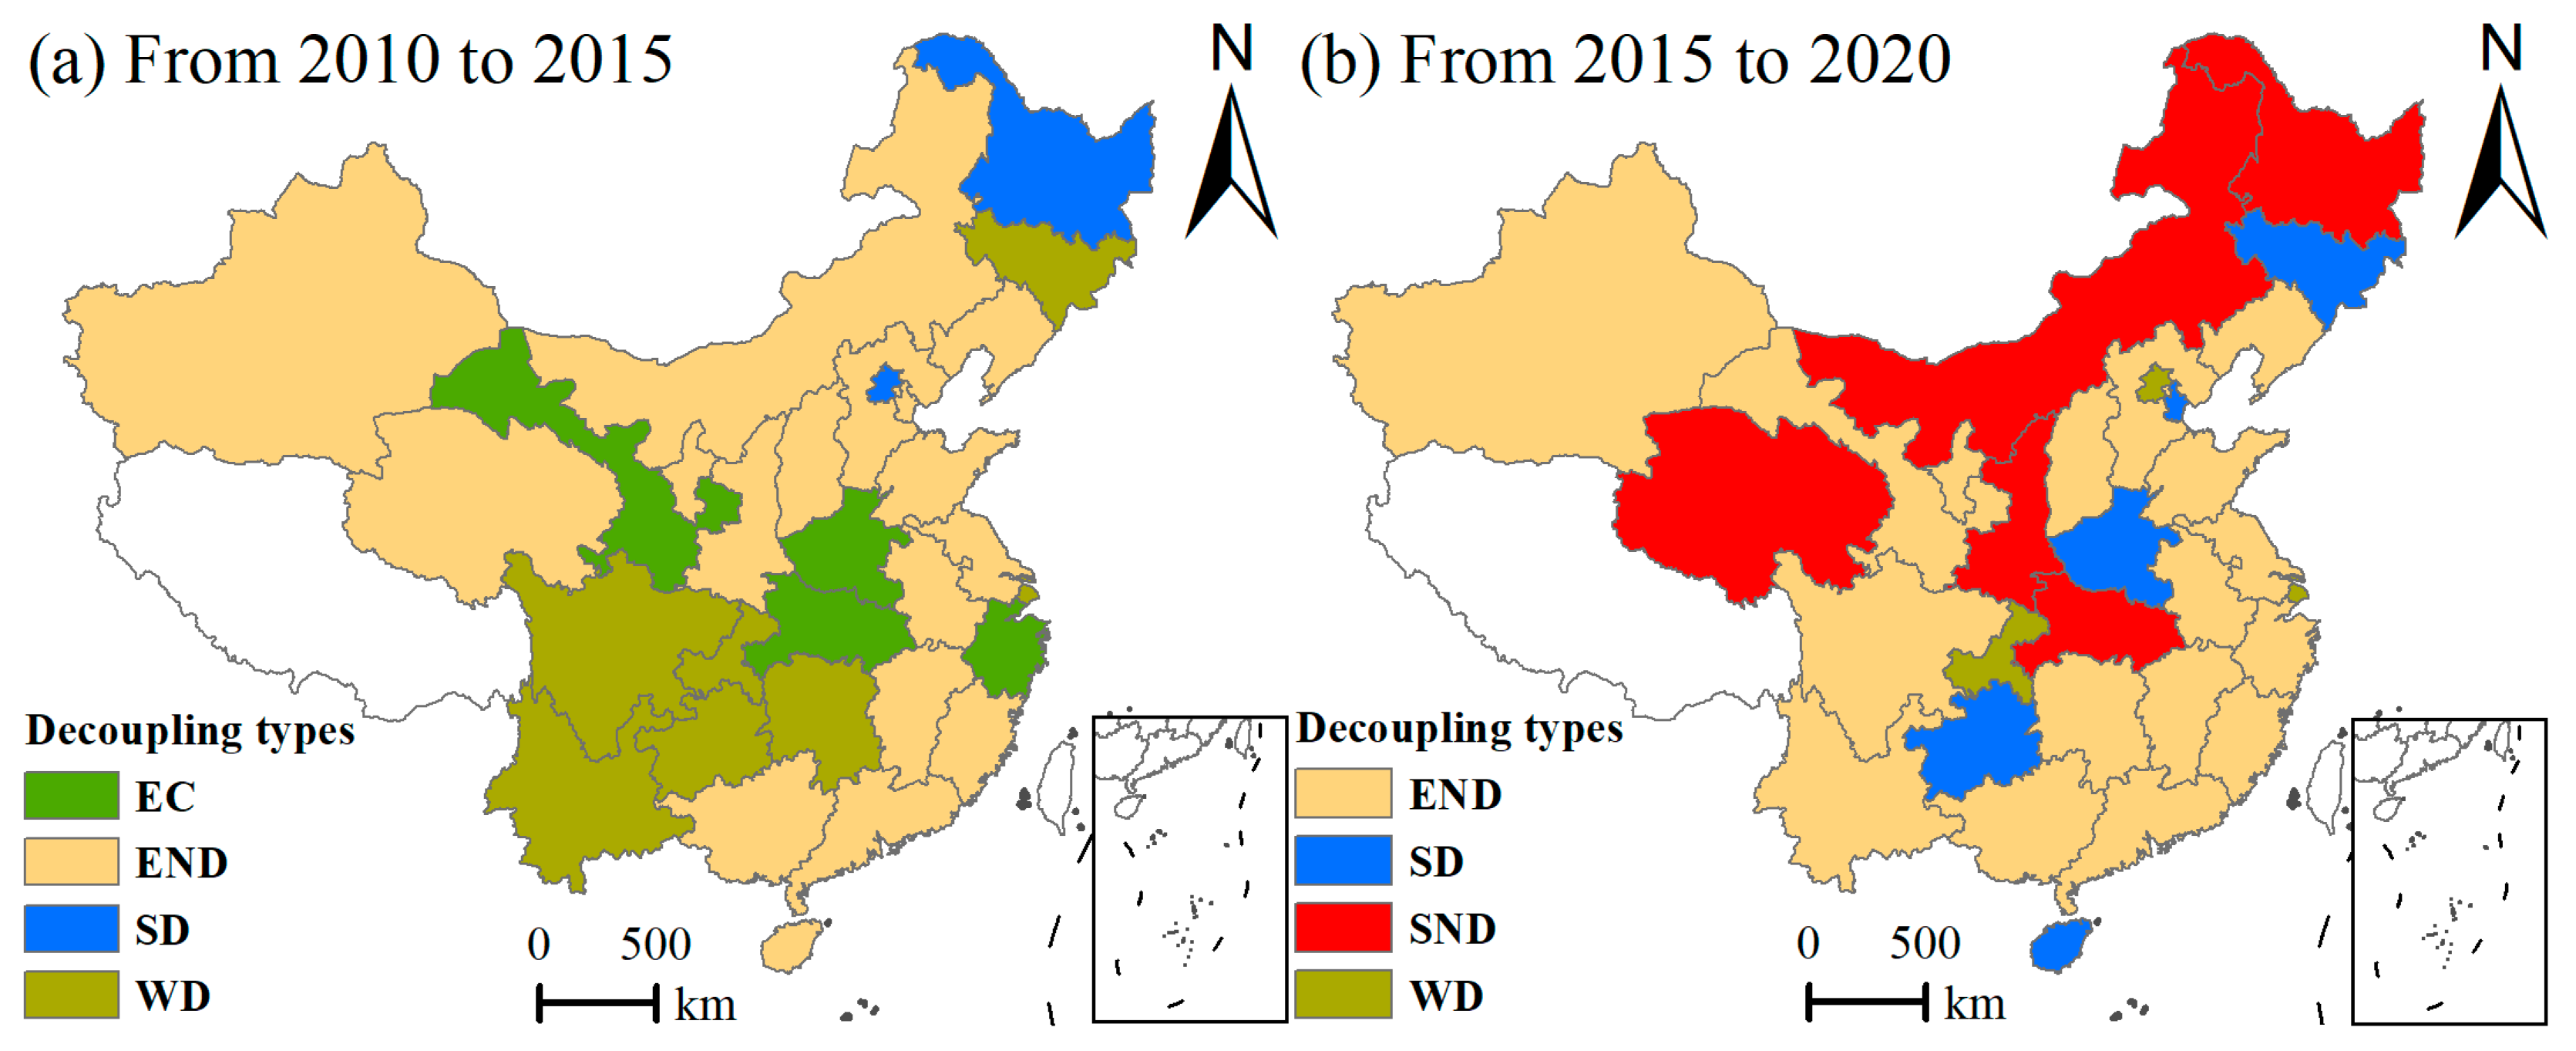
The decoupling relationship between BCE and CLA was characterized by expansive negative decoupling or strong negative decoupling, particularly evident in the later stages of the study. This indicates that BCEs were increasing at a faster rate than the expansion of CLA. Notably, provinces exhibiting strong decoupling, such as Inner Mongolia, Shanxi, and Heilongjiang in northern China, will be critical areas for future emission reduction efforts.

Author Contributions

Conceptualization, F.X. and D.X.; data curation, F.X., J.C. (Jinhua Cheng) and J.C. (Ji Chai); formal analysis, L.Y.; funding acquisition, J.Y.; methodology, J.C. (Jinhua Cheng), J.Y. and J.C. (Ji Chai); project administration, D.X.; software, J.C. (Jinhua Cheng); supervision, D.X.; validation, J.Y. and L.Y.; writing—original draft, F.X.; writing—review and editing, F.X. and D.X. All authors have read and agreed to the published version of the manuscript.

Funding

This research was funded by the National Natural Science Foundation of China (NO. 42101275); the Provincial Natural Science Foundation of Hubei, China (NO. 2023AFB651).

Data Availability Statement

The data presented in this study are available on request from the corresponding author.

Conflicts of Interest

The authors declare no conflicts of interest.

References

  1. Withey, P.; Johnston, C.; Guo, J. Quantifying the global warming potential of carbon dioxide emissions from bioenergy with carbon capture and storage. Renew. Sustain. Energy Rev. 2019, 115, 109408. [Google Scholar] [CrossRef]
  2. Ohene, E.; Chan, A.P.C.; Darko, A. Review of global research advances towards net-zero emissions buildings. Energy Build. 2022, 266, 112142. [Google Scholar] [CrossRef]
  3. Cai, W. Analyzing Impact Factors of Building Energy Consumption: Modeling and Empirical Study. Ph.D. Thesis, Chongqing University, Chongqing, China, 2011. [Google Scholar]
  4. Intergovernmental Panel on Climate Change. Climate Change 2007: Synthesis Report. Contribution of Working Groups i. II and III to the Fourth Assessment Report of the Intergovernmental Panel on Climate Change; Intergovernmental Panel on Climate Change: Geneva, Switzerland, 2007. [Google Scholar]
  5. Guan, D.; Meng, J.; Reiner, D.M.; Zhang, N.; Shan, Y.; Mi, Z.; Shao, S.; Liu, Z.; Zhang, Q.; Davis, S.J. Structural decline in China’s CO2 emissions through transitions in industry and energy systems. Nat. Geosci. 2018, 11, 551–555. [Google Scholar] [CrossRef]
  6. Chang, K.; Wang, S. Impact of dual-carbon attention competition from local government on regional carbon emissions in China. J. Environ. Manag. 2025, 374, 124064. [Google Scholar] [CrossRef] [PubMed]
  7. Xiong, X.; Li, X.; Chen, S.; Chen, D.; Lin, J. Review and prediction: Carbon emissions from the materialization of residential buildings in China. Sustain. Cities Soc. 2025, 121, 106211. [Google Scholar] [CrossRef]
  8. Zhou, N.; Khanna, N.; Feng, W.; Ke, J.; Levine, M. Scenarios of energy efficiency and CO2 emissions reduction potential in the buildings sector in China to year 2050. Nat. Energy 2018, 3, 978–984. [Google Scholar] [CrossRef]
  9. Building Energy Conservation Research Center, Tsinghua University. Annual Development Report of Building Energy Conservation in China; China Environmental Science Press: Beijing, China, 2018. [Google Scholar]
  10. Holtz-Eakin, D.; Selden, T.M. Stoking the fires? CO2 emissions and economic growth. J. Public Econ. 1995, 57, 85–101. [Google Scholar] [CrossRef]
  11. Otim, J.; Mutumba, G.S. Carbon emissions, economic governance and economic growth. Next Res. 2025, 2, 100200. [Google Scholar] [CrossRef]
  12. Amin, N.; Sharif, A.; Shabbir, M.S.; Pan, Y. Evaluating the impact of natural resource rents, r&d expenditures, green finance and energy efficiency on carbon emissions in BRICS economies: Greening the path to carbon neutrality in the post-COP 27 era. Technol. Soc. 2025, 81, 102826. [Google Scholar]
  13. Pickson, R.B.; Gui, P.; Jian, L.; Boateng, E. Do population-related factors matter for carbon emissions? Lessons from different income groups of countries. Urban Clim. 2024, 55, 101934. [Google Scholar] [CrossRef]
  14. Siegl, S.; Hagenbucher, S.; Niggli, U.; Riedel, J. Addressing dairy industry’s scope 3 greenhouse gas emissions by efficiently managing farm carbon footprints. Environ. Chall. 2023, 11, 100719. [Google Scholar] [CrossRef]
  15. Wei, Q.; Xue, L.; Zhang, H.; Chen, P.; Yang, J.; Niu, B. Spatiotemporal analysis of carbon emission efficiency across economic development stages and synergistic emission reduction in the Beijing-Tianjin-Hebei region. J. Environ. Manag. 2025, 377, 124609. [Google Scholar] [CrossRef] [PubMed]
  16. Zhu, B.; Zhang, Y.; Zhang, M.; He, K.; Wang, P. Exploring the driving forces and scenario analysis for China’s provincial peaks of CO2 emissions. J. Clean. Prod. 2022, 378, 134464. [Google Scholar] [CrossRef]
  17. Shi, K.; Liu, G.; Cui, Y.; Wu, Y. What urban spatial structure is more conducive to reducing carbon emissions? A conditional effect of population size. Appl. Geogr. 2023, 151, 102855. [Google Scholar] [CrossRef]
  18. Zhang, J.; Jiang, H.; Liu, G.; Zeng, W. A study on the contribution of industrial restructuring to reduction of carbon emissions in china during the five five-year plan periods. J. Clean. Prod. 2018, 176, 629–635. [Google Scholar] [CrossRef]
  19. Hussain, A.; Huseynova, A.; Hakimova, Y.; Nassani, A.A.; Bo, B. Energy efficiency and emission flexibility: Management and economic insights for renewable energy integration. Energy Strateg. Rev. 2025, 57, 101631. [Google Scholar] [CrossRef]
  20. Du, J.; Thill, J.; Peiser, R.B.; Feng, C. Urban land market and land-use changes in post-reform China: A case study of Beijing. Landsc. Urban Plan. 2014, 124, 118–128. [Google Scholar] [CrossRef]
  21. Liang, L.; Chen, M.; Luo, X.; Xian, Y. Changes pattern in the population and economic gravity centers since the reform and opening up in China: The widening gaps between the south and north. J. Clean. Prod. 2021, 310, 127379. [Google Scholar] [CrossRef]
  22. Rahman, M.N.; Akter, K.S.; Faridatul, M.I. Assessing the impact of urban expansion on carbon emission. Environ. Sustain. Indic. 2024, 23, 100416. [Google Scholar] [CrossRef]
  23. Yang, Y.; Yang, M.; Zhao, B.; Lu, Z.; Sun, X.; Zhang, Z. Spatially explicit carbon emissions from land use change: Dynamics and scenario simulation in the beijing-tianjin-hebei urban agglomeration. Land Use Policy 2025, 150, 107473. [Google Scholar] [CrossRef]
  24. Li, J.; Huang, X.; Kwan, M.; Yang, H.; Chuai, X. The effect of urbanization on carbon dioxide emissions efficiency in the yangtze river delta, China. J. Clean. Prod. 2018, 188, 38–48. [Google Scholar] [CrossRef] [PubMed]
  25. Cheng, Y.; Wang, Z.; Ye, X.; Wei, Y.D. Spatiotemporal dynamics of carbon intensity from energy consumption in China. J. Geogr. Sci. 2014, 24, 631–650. [Google Scholar] [CrossRef]
  26. Li, N.; Qi, L.; Jiang, S. The interactive relationship among construction land expansion, carbon emission, water resource and energy consumption in the suburb of Chongqing over the past 26 years. Desalin. Water Treat. 2018, 125, 148–155. [Google Scholar] [CrossRef]
  27. Houghton, R.A.; House, J.I.; Pongratz, J.; Van, D.W.G.R.; Defries, R.S.; Hansen, M.C.; Le Quéré, C.; Ramankutty, N. Carbon emissions from land use and land-cover change. Biogeosciences 2012, 9, 5125–5142. [Google Scholar] [CrossRef]
  28. Li, Y.; Cai, M.; Wu, K.; Wei, J. Decoupling analysis of carbon emission from construction land in shanghai. J. Clean. Prod. 2019, 210, 25–34. [Google Scholar] [CrossRef]
  29. Wang, M.; Wang, Y.; Wu, Y.; Yue, X.; Wang, M.; Hu, P. Identifying the spatial heterogeneity in the effects of the construction land scale on carbon emissions: Case study of the Yangtze river economic belt, China. Environ. Res. 2022, 212, 113397. [Google Scholar] [CrossRef]
  30. Cesar De Oliveira, S.E.M.; Visentin, J.C.; Pavani, B.F.; Branco, P.D.; de Maria, M.; Loyola, R. The european union-mercosur free trade agreement as a tool for environmentally sustainable land use governance. Environ. Sci. Policy 2024, 161, 103875. [Google Scholar] [CrossRef]
  31. Asamoah, P.S.; Takyi, S.A.; Liwur, S.B.; Amponsah, O.; Duamor, S.N. Situating the compliance with land use regulations within the context of sustainable city development: Lessons from ho municipality of Ghana. Urban Gov. 2025, 5, 79–93. [Google Scholar] [CrossRef]
  32. Liu, J.; Liu, M.; Zhuang, D.; Zhang, Z.; Deng, X. Study on spatial pattern of land-use change in China during 1995–2000. Sci. China 2003, 46, 374–384. [Google Scholar] [CrossRef]
  33. National Geomatics Center of China Standard Map Service. Available online: http://bzdt.ch.mnr.gov.cn/download.html?superclassName=%25E5%25AE%25A1%25E5%259B%25BE%25E5%258F%25B7 (accessed on 5 March 2025).
  34. Azari, R.; Abbasabadi, N. Embodied energy of buildings: A review of data, methods, challenges, and research trends. Energy Build. 2018, 168, 225–235. [Google Scholar] [CrossRef]
  35. Huo, T.; Ren, H.; Zhang, X.; Cai, W.; Feng, W.; Zhou, N.; Wang, X. China’s energy consumption in the building sector: A statistical yearbook-energy balance sheet based splitting method. J. Clean. Prod. 2018, 185, 665–679. [Google Scholar] [CrossRef]
  36. Yang, X. Research on Building Energy Conservation in China Based on Energy Consumption Data. Ph.D. Thesis, Tsinghua University, Beijing, China, 2009. [Google Scholar]
  37. Cang, Y.; Yang, L.; Luo, Z.; Zhang, N. Prediction of embodied carbon emissions from residential buildings with different structural forms. Sustain. Cities Soc. 2020, 54, 101946. [Google Scholar] [CrossRef]
  38. Pan, W.; Li, K.; Teng, Y. Rethinking system boundaries of the life cycle carbon emissions of buildings. Renew. Sustain. Enery Rev. 2018, 90, 379–390. [Google Scholar] [CrossRef]
  39. Feng, B.; Wang, X. Research on carbon decoupling effect and influence factors of provincial construction industry in China. China Popul. Resour. Environ. 2015, 25, 28–34. [Google Scholar]
  40. Intergovernmental Panel on Climate Change. Revised 1996 IPCC Guidelines for National Greenhouse Gas Inventories; Intergovernmental Panel on Climate Change: Paris, France, 1997. [Google Scholar]
  41. Li, Z. Study on the Life Cycle Consumption of Energy and Resource of Air Conditioning in Urban Residential Building in China. Ph.D. Thesis, Tsinghua University, Beijing, China, 2008. [Google Scholar]
  42. Carter, A.P. The economic of technological change. Sci. Am. 1996, 214, 25–31. [Google Scholar] [CrossRef]
  43. OECD. Decoupling: A Conceptual Overview; OECD: Paris, France, 2001. [Google Scholar]
  44. Tapio, P. Towards a theory of decoupling: Degrees of decoupling in the EU and the case of road traffic in finland between 1970 and 2001. Transp. Policy 2005, 12, 137–151. [Google Scholar] [CrossRef]
  45. Chen, C.; Zhang, L.; Zhou, C.; Luo, Y. Physics-informed explainable encoder-decoder deep learning for predictive estimation of building carbon emissions. Renew. Sustain. Energ. Rev. 2025, 213, 115478. [Google Scholar] [CrossRef]
  46. Li, X.; Zhu, C. Summary of research on account of carbon emission in building industry and analysis of its influential factors. J. Saf. Environ. 2020, 20, 317–327. [Google Scholar]
  47. Liu, M.; Meng, J.; Liu, B. Progress in the studies of carbon emission estimation. Trop. Geogr. 2014, 34, 248–258. [Google Scholar]
  48. Cai, Y.; Su, S.; Zhang, P.; Chen, M.; Wang, Y.; Xie, Y.; Tan, Q. Quantifying high-resolution carbon emissions driven by land use change in the Guangdong-Hong Kong-Macao greater bay area. Urban Clim. 2024, 55, 101943. [Google Scholar] [CrossRef]
Figure 1. Provincial and municipal administrative units in China (all administrative division maps in this study were based on the standard map review number GS (2023) 2767 [33] on the website: http://bzdt.ch.mnr.gov.cn/ (accessed on 5 March 2025) of the Ministry of Natural Resources of the People’s Republic of China).
Land 14 01106 g001
Figure 2. Decoupling types of BCE and CLA.
Land 14 01106 g002
Figure 3. Spatial cluster pattern of BCE from 2010 to 2020.
Land 14 01106 g003
Figure 4. Changes in BCE in the Chinese Mainland from 2010 to 2020.
Land 14 01106 g004
Figure 5. CLA in the Chinese Mainland from 2010 to 2020.
Land 14 01106 g005
Figure 6. Change in CLA in the Chinese Mainland from 2010 to 2020.
Land 14 01106 g006
Figure 7. Scatter plot of decoupling types between BCE and CLA.
Land 14 01106 g007
Figure 8. Spatial pattern of decoupling type between BCE and CLA.
Land 14 01106 g008
Table 1. CO2 emission coefficient of fossil fuels.
Fossil FuelsCP
(tCO2/TJ)
OR
(%)
HV
(kj/(kg or m3))
α
(kgCO2/unit)
Raw coal26.3793%20,9081.8801
Cleaned coal25.4193%26,3442.2827
Other washed coal25.8096%83630.7595
Briquettes26.6093%20,9081.8965
Gangue25.8093%83630.7358
Coke29.5093%28,4352.8604
Coke oven gas12.10100%16,7260.7421
Blast furnace gas70.80100%37630.9769
Converter gas49.60100%79451.4449
Other gas12.10100%52270.2319
Other coking products29.5093%28,4352.8604
Crude oil20.1098%41,8683.0240
Gasoline18.9098%43,0702.9251
Kerosene19.6098%43,0703.0334
Diesel oil20.2098%42,6523.0959
Fuel oil21.1098%41,8163.1705
Naphtha20.0098%43,9063.1554
Lubricating oil20.0098%40,2002.8890
White spirit20.00100%42,9453.1493
Bitumen asphalt22.0098%40,2003.1779
Petroleum coke27.5098%32,5003.2115
Liquefied petroleum gas17.2098%50,1793.1013
Refinery gas18.2098%45,9983.0082
Other petroleum products20.0098%41,8163.0052
Natural gas15.3099%35,584.51.9763
Liquefied natural gas17.2098%50,1793.1013
The data on carbon content, oxidation rate, and calorific value of fossil fuels can be obtained from reports, statistics, or standards such as the IPCC 2016 report, the Standard for Building Carbon Emission Calculation (GB/T 51366-2019), the General Rules for Calculation of the Comprehensive Energy Consumption (GB/T 2589-2020), and the “China Energy Statistical Yearbook”.
Disclaimer/Publisher’s Note: The statements, opinions and data contained in all publications are solely those of the individual author(s) and contributor(s) and not of MDPI and/or the editor(s). MDPI and/or the editor(s) disclaim responsibility for any injury to people or property resulting from any ideas, methods, instructions or products referred to in the content.

