Article

Constructing High-Quality Livable Cities: A Comprehensive Evaluation of Urban Street Livability Using an Approach Based on Human Needs Theory, Street View Images, and Deep Learning

State Key Laboratory of Subtropical Building and Urban Science, Department of Landscape of School of Architecture, South China University of Technology, 381 Wushan road, Guangzhou 510500, China
*
Author to whom correspondence should be addressed.
Land 2025, 14(5), 1095; https://doi.org/10.3390/land14051095
Submission received: 10 April 2025 / Revised: 12 May 2025 / Accepted: 16 May 2025 / Published: 18 May 2025

Abstract

Driven by the United Nations’ Sustainable Development Goal (SDG 11), the construction of high-quality livable cities has emerged as a central issue on the global agenda. However, existing research primarily focuses on optimizing physical functions, neglecting the dynamic hierarchical nature and emotional experiences of residents’ needs. This study, employing Guangzhou’s Tianhe District as an empirical case, proposes an innovative framework that integrates Maslow’s Hierarchy of Needs theory, the Method of Empathy-Based Stories (MEBS), and deep learning technology for the first time. It constructs a dynamic assessment model of “needs-streetscape elements-spatial quality”, systematically analyzing the livability characteristics and driving mechanisms of high-density urban streets. Tianhe District’s street spaces exhibit the common issue of “functional-experiential imbalance” faced by high-density cities. Furthermore, different streetscape elements in the city demonstrate significant variability in satisfying different hierarchical demand dimensions, with strong sequential relationships among these hierarchies. Adjusting and optimizing the relationships between elements can result in the creation of higher-quality street spaces that meet higher-level needs. The research findings provide differentiated renewal pathways for tropical high-density cities, offer methodological support for global urban governance under the SDG 11 objectives, and indicate directions for improving street quality in urban regeneration practices.

1. Introduction

Urban spatial quality serves as a core indicator for measuring individuals’ adaptability to the physical environment and their perception of urban development. Its essence is a comprehensive reflection of urban spatial elements on human residential livability [1,2]. In recent years, with the advancement of the United Nations’ Sustainable Development Goal (SDG 11), the construction of livable cities has become a global priority agenda [3]. However, existing research primarily focuses on optimizing physical functions, neglecting the dynamic hierarchical nature and emotional experiences of residents’ needs [4,5]. This study proposes an innovative framework that integrates Maslow’s Hierarchy of Needs theory, the Method of Empathy-Based Stories (MEBS), and deep learning technology for the first time, providing new insights into the intersection of emotional quantification and visual spatial assessments.
The term “livability” is generally understood as an indicator of residents’ satisfaction with their surrounding human and physical environments [6]. It encompasses urban environmental elements and conditions aimed at ensuring residents’ quality of life and well-being [7]. Since the 1970s, researchers from various disciplines have been committed to exploring quantitative approaches to assessing the quality of life [8]. Entering the 21st century, the concept of urban “livability” has further expanded, encompassing multidimensional considerations such as environmental Security and comfort for urban residents [9]. Spatial assessments have shifted from a single-dimensional material evaluation to a multi-dimensional demand response [
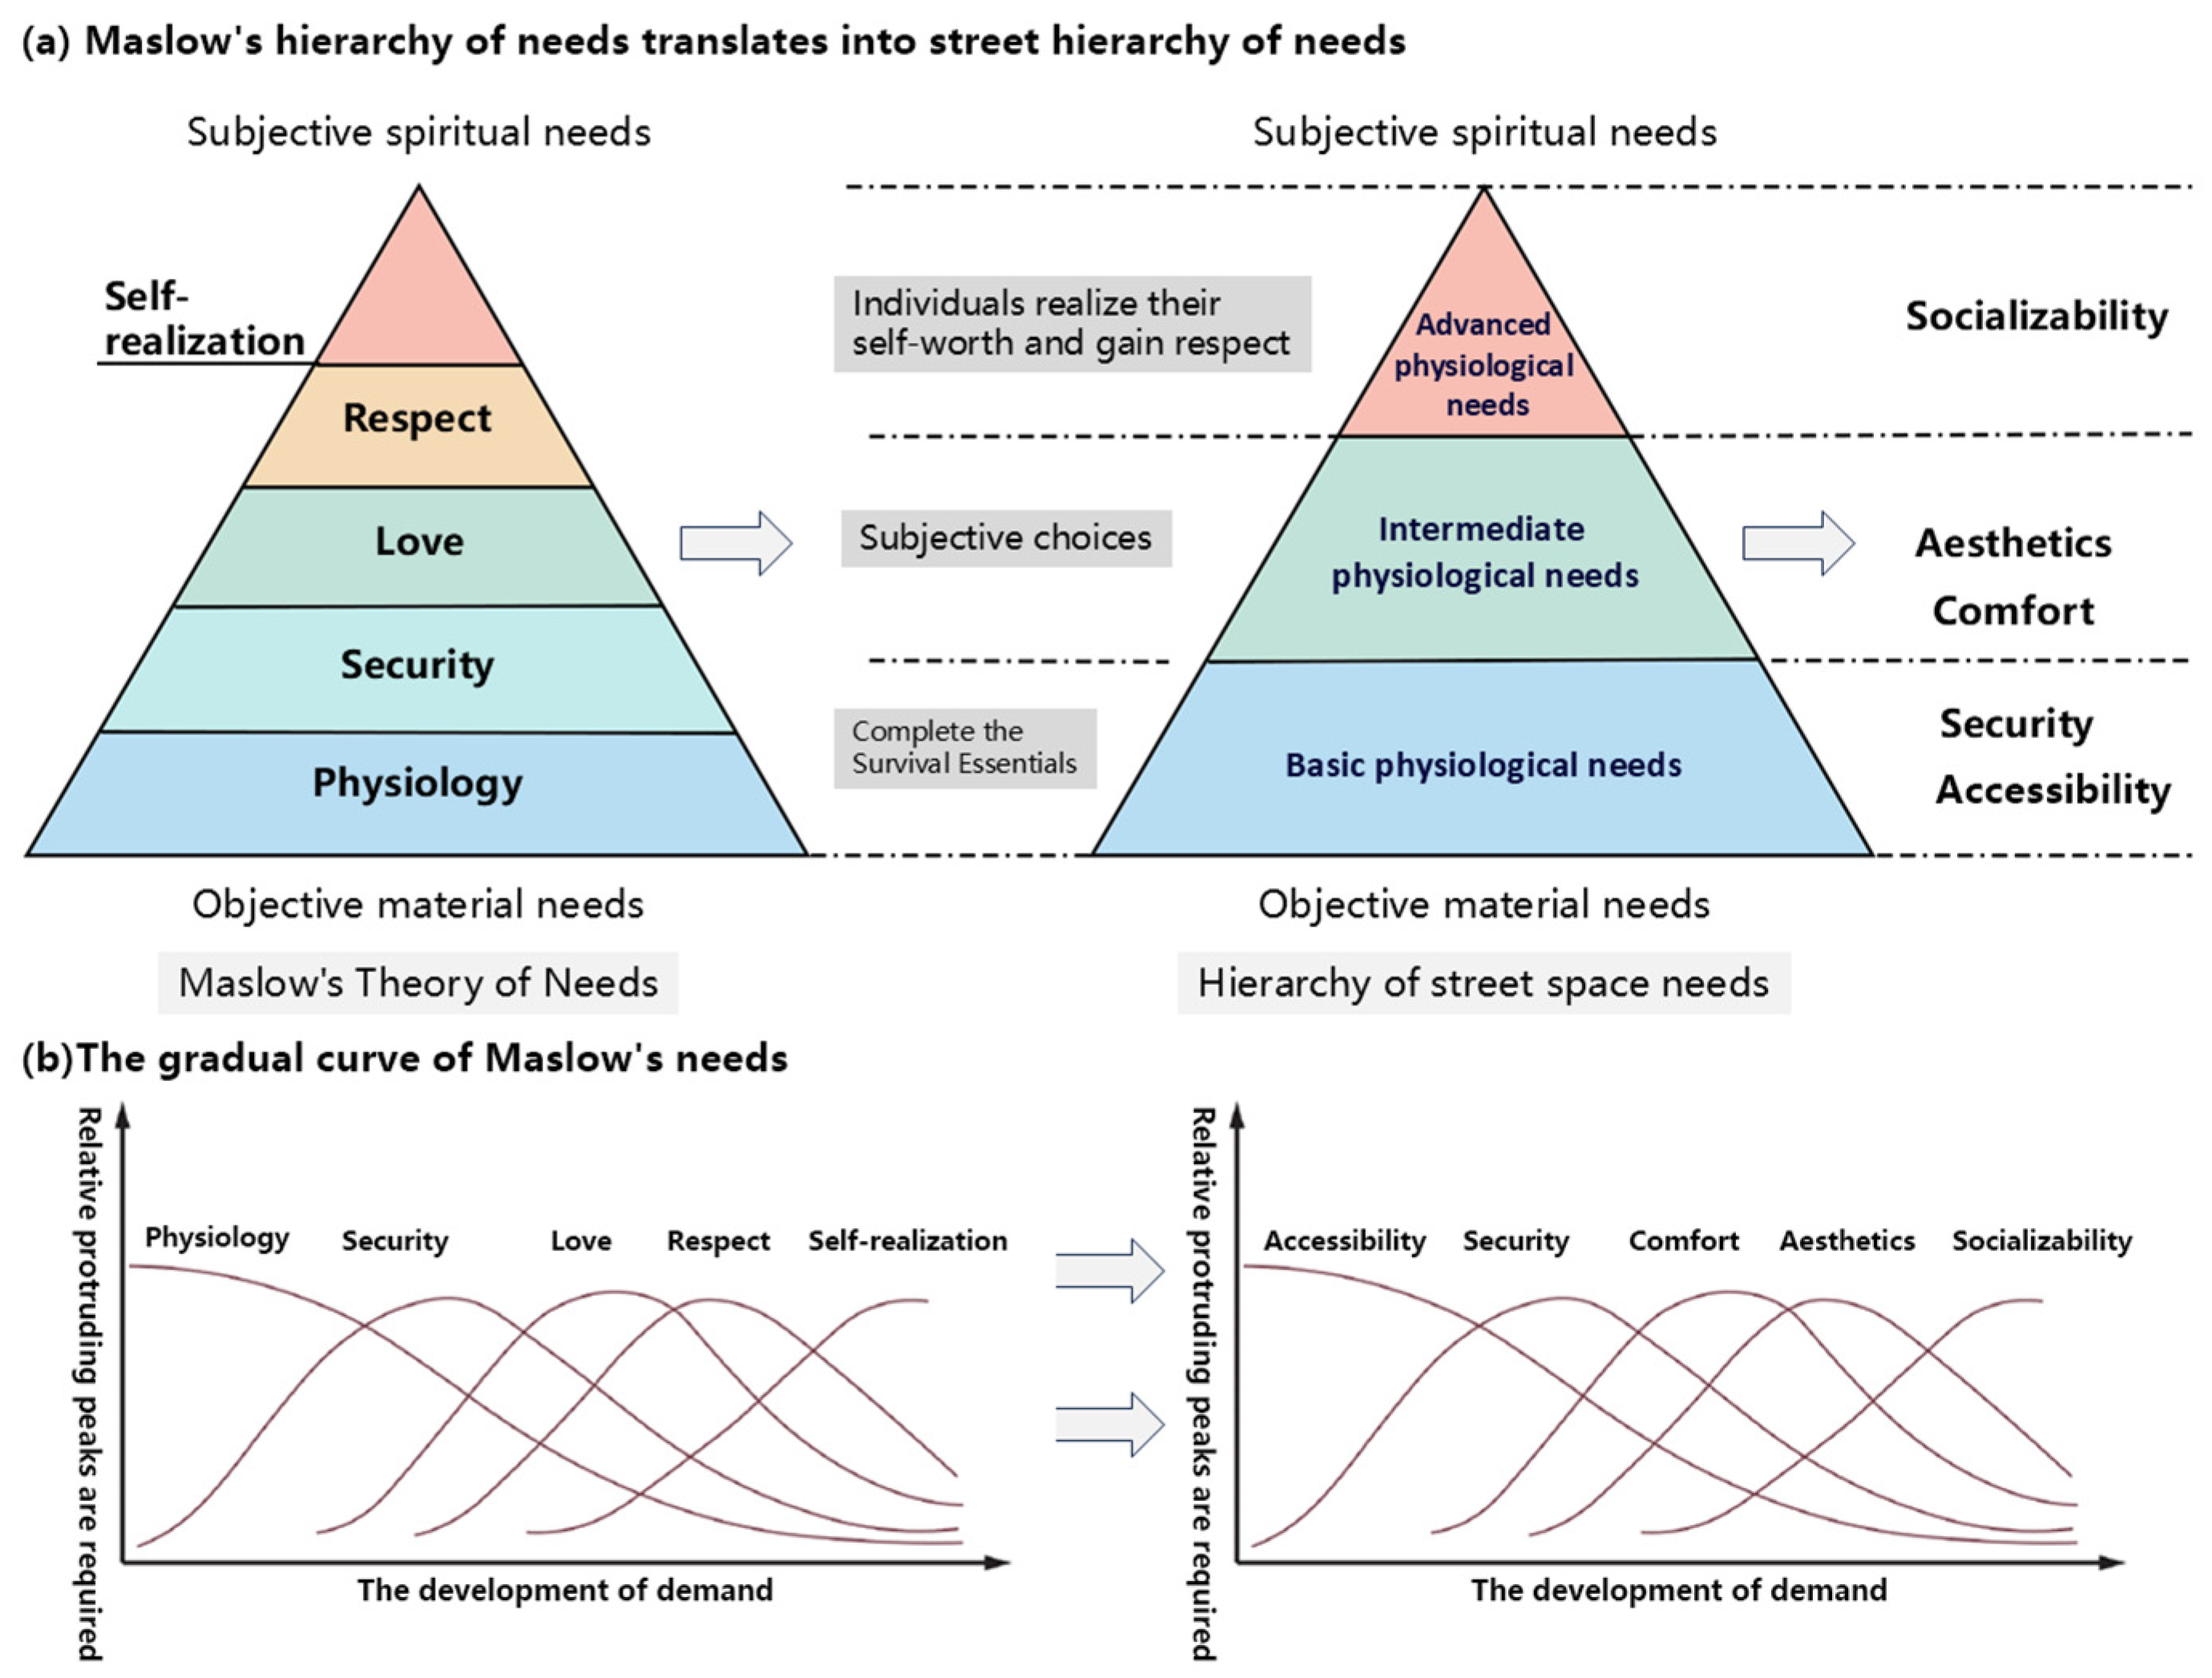
10]. The dynamic hierarchical relationship of Maslow’s theory provides a theoretical foundation for this: demand hierarchies are not strictly progressive but interact through environmental stimuli [11,12]. While this theory has been applied in smart cities [13,14], multi-functional land governance [15], and sustainable development [16], there is still a significant gap in its integration with visual spatial assessments [17]. Existing research primarily relies on traditional questionnaires, which struggle to capture authentic emotional feedback [18], while international frontier methods such as a Visual Landscape Assessment (VLA) lack demand-oriented quantitative models [19,20].
In this study, streets are selected as representatives of an urban space. As key linear elements within an urban space, the spatial quality of urban streets bridges people’s perceptions of their surroundings in both direct and indirect ways [21], reflecting the characteristics of urban spatial quality [22]. In traditional explorations of how urban streets meet residents’ needs, previous research often employed methods such as questionnaires, field surveys, and interviews to collect relevant data [23]. However, these traditional methods are susceptible to the influence of respondents’ personal experiences and subjective perceptions, potentially leading to biases in research results and affecting computer model training in deep learning, which can subsequently result in biases in large-scale predictions [18]. Notably, the Method of Empathy-Based Stories (MEBS) offers an innovative assessment approach. This method guides respondents to immerse themselves in specific scenarios, delving deeply into their moral and emotional experiences. Through storytelling, respondents can become engrossed in the scenario, revealing authentic emotional feedback and behavioral expressions, thereby assisting researchers in more effectively exploring their perspectives, expectations, thoughts, and interaction patterns regarding specific issues, ultimately achieving a comprehensive assessment of the scenario [24,25]. This approach effectively bridges the gap between authentic emotional feedback and visual landscape assessments.
Visual Landscape Assessments (VLAs) have emerged as an effective means to elucidate the relationship between individual subjective preferences and the physical elements of a scene. Based on the principle of interactions between landscapes and humans, this method evaluates the external form and functional characteristics of landscapes through the human visual system [19]. There is a direct link between the quantification of subjective perceptions and objective physical elements, which is crucial for defining and verifying the significance of visual elements in our environment [17,26,27,28,29]. Utilizing Application Programming Interface (API) technology to acquire large-scale street view data, which simulates human-perspective street images, provides an excellent approach for extensively and precisely quantifying urban street quality [30]. Deep learning techniques such as DeepLabv3+ and machine learning methods like a Random Forest (RF) enable the large-scale quantification of users’ subjective feelings and individual needs in streets. DeepLabv3+ [31], which incorporates atrous convolution and Atrous Spatial Pyramid Pooling (ASPP) [32], can identify images of varying sizes without the loss or distortion of information, enhancing the receptive field and ensuring that each convolutional output contains a broader range of information. DeepLabv3+ outperforms semantic segmentation methods such as SegNet, PSPNet, and U-Net [33], achieving an accuracy rate of approximately 90% in street view semantic segmentation by effectively identifying elements within streets [34,35,36]. The RF model can autonomously extract image features from street view elements and utilize large datasets to train the model [37]. Therefore, integrating DeepLabv3+ and RF models can predict human demand choices in streets on a large scale.
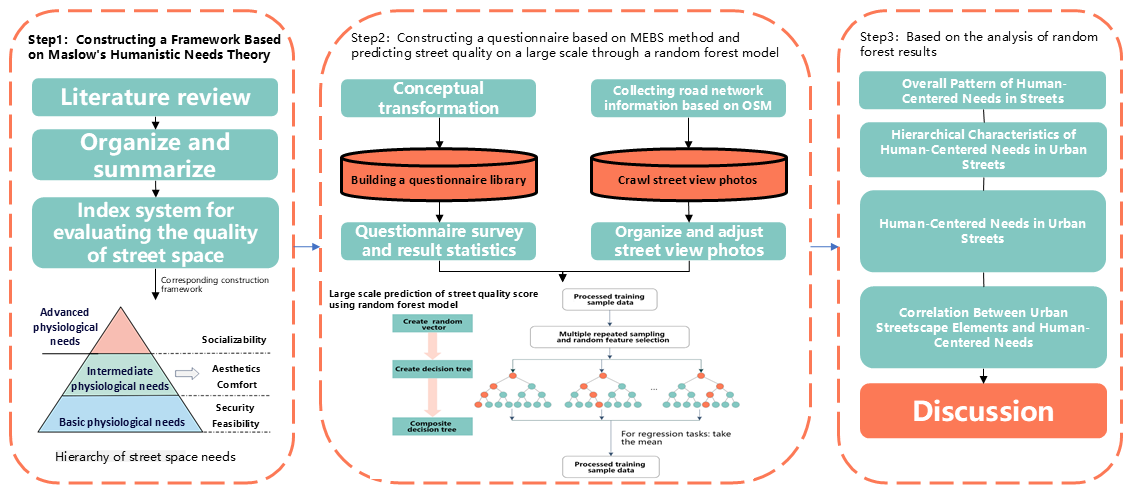
This study takes the Tianhe District of Guangzhou, a typical high-density urban area, as a case study. By employing the Method of Empathy-Based Stories (MEBS) to mitigate subjective biases and integrating DeepLabv3+ with the Random Forest model, a dynamic assessment framework of “needs-streetscape elements-spatial quality” is constructed. The research objectives encompass (1) establishing a human-centric needs theory evaluation framework coupled with street spatial quality, (2) unveiling the nonlinear transformation mechanism of demand hierarchies through streetscape elements, and (3) proposing a street design paradigm suitable for tropical high-density cities. Figure 1 illustrates the overall technical process of this study

2. Materials and Methods

2.1. Study Area

This study selects Tianhe District in Guangzhou, China, as the empirical case (Figure 2). Serving as a quintessential representative of high-density cities within tropical monsoon climates, Tianhe District encompasses an area of 136.57 square kilometers, with an annual average temperature of 22 °C and annual precipitation exceeding 1800 mm. Its climatic features exhibit a high degree of similarity to those of Southeast Asian cities, such as Bangkok (with an annual average temperature of approximately 25 °C and an annual precipitation of around 1550 mm), Taipei (with an annual average temperature of 22.4 °C and annual precipitation exceeding 2100 mm), and Singapore (26.8 °C, with an annual average precipitation of 2345 mm).
Furthermore, Tianhe District boasts a population density of 21,000 individuals per square kilometer, which is comparable to that of Tokyo’s central area (23,000 individuals per square kilometer) and Hong Kong’s Yau Tsim Mong District (19,000 individuals per square kilometer), underscoring the common challenges faced in the governance of high-density urban spaces. Topographically, the district transitions from the Huolu Mountains (with an elevation of 320 m) in the north to the alluvial plain of the Pearl River, creating a unique “mountain-plain” gradient [27]. This geomorphological feature provides a natural laboratory for investigating the differentiated impacts of terrain on street space needs.
Economically, the district is characterized by a significant divergence between the Zhujiang New Town CBD in the southwest (where the tertiary industry accounts for 92% of the economy) and the rural–urban fringe in the north (where the primary industry comprises 15% of the economy) [38]. This economic heterogeneity further enhances the case’s typicality in analyzing the correlation mechanism between “demand hierarchy” and “spatial quality”.
As a microcosm of global tropical high-density cities, the empirical findings from Tianhe District can serve as a theoretical reference for street design in regions with similar climates and population densities, such as those in Southeast Asia and South Asia.

2.2. Data Collection

2.2.1. Constructing Evaluation Indicators Based on Maslow’s Hierarchy of Needs

Maslow’s Hierarchy of Needs Theory [39] categorizes human needs into a five-tier structure ranging from material to spiritual (physiological, Security, belongingness, esteem, and self-actualization), with a certain degree of interactivity existing among these tiers [11] (Figure 3a). In the realm of urban studies, this theory has been deconstructed into a “needs-responsive spatial design” framework, emphasizing the triggering and satisfaction of psychological needs through the physical environment [4,10]. For instance, Zhao et al. (2024) [27] linked the material functions of street spaces (such as road width) with spiritual experiences (such as visual esthetics) through a five-dimensional model of “smoothness-convenience-Security-richness-comfort”. Meanwhile, Zhou et al. (2019) proposed a three-stage model of “survival-development-actualization”, focusing on the spatial transformation mechanisms of Security and belongingness [20]. However, existing research predominantly confines itself to static tier classifications, lacking exploration into the conditions for dynamic need transformation (such as environmental stimulus thresholds) [12].
In the urban spatial quality evaluation system constructed from a needs-based perspective in this study, we identified three primary tiers that correspond to the transition from objective material needs to subjective spiritual needs, in accordance with Maslow’s Hierarchy of Needs: basic physiological needs, intermediate physiological needs, and advanced physiological needs. These tiers, progressing from lower to higher levels, encompass accessibility, Security, comfort, esthetics, and Socializability. These five dimensions correspond to different aspects of residents’ needs in urban life [39].
Firstly, at the level of basic physiological needs, road accessibility primarily manifests as the acceptability and abundance of urban facilities within the physiological constraints of residents during travel. The need for Security reflects the residents’ demand as vulnerable road users for stability in the traffic environment of street spaces. At the intermediate physiological needs level, comfort mainly refers to the suitability of residents’ physical sensations and experiences in the street environment, which is of great significance for enhancing the quality of urban life. The need for esthetics is met through the esthetic design of buildings and landscapes in the urban street space environment, satisfying residents’ aspirations for a better life. At the advanced needs level, Socializability primarily pertains to residents’ needs for spiritual relaxation and emotional communication in street spaces. Pleasant scenes can facilitate social interactions and enhance residents’ willingness to engage with others.
According to Maslow’s dynamic hierarchical relationship, the transition from lower to higher tiers does not necessitate complete the satisfaction of the lower tiers. Instead, the needs of higher tiers gradually emerge as the needs of lower tiers are met. Therefore, this study selects appropriate transition thresholds to simulate the transformation and advancement between tiers.

2.2.2. Acquisition of Street View Images in Tianhe District

In this study, road network information for Tianhe District in Guangzhou was obtained from the OpenStreetMap platform (https://www.openstreetmap.org/ accessed on 10 May 2024). Based on road types, the data were cleaned and organized, with street view collection points set at intervals of 100 m along each road. A total of 4123 points were established, and 16,488 Street View Images were collected using PyCharm 2024.3.1 and the Baidu Street View API, serving as the experimental basis for this research (Figure 2d).

2.2.3. Questionnaire Survey Using the Empathy-Based Street View Story Method

The questionnaire employed the Moral Empathy-Based Storytelling (MEBS) approach. By utilizing storytelling, we immersed respondents in the scenarios, thereby encouraging them to forge an emotional connection with the sites [40] (Figure 4a). Grounded in the constructed Maslow’s Hierarchy of Needs framework, the stories were interwoven with five dimensions of street quality: accessibility, Security, comfort, esthetics, and sociability. These dimensions served as the foundation for crafting the MEBS narratives (as illustrated in Table 1). Concurrently, Yang (2024) [18] demonstrated in an experimental study that integrating the MEBS method with the Random Forest model is a feasible and valuable approach for conducting large-scale assessments of street space quality [18].
In this study, 100 non-repetitive street view photographs were randomly sampled from street images in Tianhe District to ensure coverage of diverse scene types, including commercial, residential, and transportation areas. Respondents were required to meet the following criteria: (1) having resided in Tianhe District for ≥2 years, (2) aged between 18 and 65, and (3) free from visual–cognitive impairments. Ultimately, 100 respondents were recruited (the demographic information of the respondents is presented in Table 2). The research employed a combination of online questionnaire distribution and random interviews with passersby to complete the online questionnaires. Offline experiments were conducted at subway stations such as Wushan, Tiyu Xilu, and Shipaiqiao in Guangzhou, where random interviews with passersby were carried out. Each respondent was randomly assigned to answer 25 questions, with a 5 min interval between each image to mitigate fatigue effects. Respondents rated each image based on five dimensions using a scale from 0 to 4, yielding a total of 2500 valid questionnaires, with 25 feedback responses per image. These research data are sufficient for conducting large-scale measurements and evaluations of street spaces in Tianhe District [18]. The reliability and validity analysis of the questionnaire results demonstrated good consistency (Table 3). Based on the average scores of each image across the five dimensions, streets were classified into five tiers: extremely low (0 point), low (1 point), medium (2 points), high (3 points), and extremely high (4 points).

2.3. Predicting Human Needs in Streets Through Large-Scale Deep Learning

2.3.1. Applying DeepLabv3+ for Image Segmentation

Deep learning-based image segmentation techniques offer accurate and automated analysis of various elements in Street View Images [27]. In this study, the DeepLabv3+ model was utilized for deep learning image segmentation. This model comprises two key components: atrous convolution and global average pooling (Figure 4b). The formula is presented as follows:
y i = k x i + r × k × w k
where x represents the input feature map, y is the output feature map, w denotes the convolution kernel, and r is the dilation rate. By adjusting the dilation rate r , the receptive field size of atrous convolution can be altered; i represents the position index on the output feature map, and k is the index of the kernel, representing different positions on the kernel. It is an index variable used to traverse the various elements of the kernel.
z i = 1 H × W j = 1 H k = 1 W x i j k
Additionally, x denotes the input feature map, and z represents the feature map after global average pooling. H and W are the height and width of the feature map, respectively.
The ADE_20K dataset, based on DeepLabv3+, was adopted, which encompasses 150 different types of spatial visual elements [41]. Among these, nine types of street view elements with the highest impact and proportion were selected (as shown in Table 4) [42]. The calculation formula is as follows:
P i = C i C s u m
where P i represents the proportion of a specific street element in the image, C i is the number of pixels for that element, and C s u m is the total number of pixels in the image.

2.3.2. Simulating the Level of Human Needs Satisfaction in Streets Using a Random Forest

A Random Forest (RF) is an ensemble learning method that enhances prediction accuracy and robustness by constructing multiple decision trees and aggregating their predictions [43]. To simulate the overall level of human needs satisfaction in the streets of Tianhe District on a large scale, this study employed the RF algorithm to predict the scores of human-centered demand indicators for each dimension based on the proportions of segmented street view elements.
In the quantitative research of urban planning and design, we employed the Random Forest model for data analysis, wherein the diverse elements within street view photographs were set as independent variables, and the average scores across various dimensions served as dependent variables. To identify the optimal model parameter configuration, we meticulously set and adjusted model parameters (such as the number of trees and depth) through methods like cross-validation. To balance model complexity and generalization capability while avoiding overfitting, we prudently set the number of decision trees per dimension to 150, selected 30% of the street view photographs as a control test set, utilized GridSearchCV for hyperparameter optimization, and ensured that the model accuracy remained above 0.85(The verification results are shown in Figure 5). Building on this foundation, we trained the model on the training dataset using these optimized parameters and subsequently rigorously evaluated its predictive performance on the test dataset. To quantify the deviation between predicted and actual values, we adopted the Root Mean Square Error (RMSE) as the evaluation metric, as shown below:
y ^ = 1 B b = 1 B y ^ b
where B is the number of decision trees and y ^ b is the prediction result of tree b .

2.3.3. Identifying Spatial Agglomeration Characteristics of Human-Centered Demand Indicators in Urban Streets

To investigate the spatial agglomeration characteristics of different dimensions of demand in streets, ARCMap 10.8 was employed. The formula is as follows:
L o c a l   M o r a n s   I = x i x ¯ σ 2 j = 1 , j i n [ w i j ( x j x ¯ ) ]
Here, n represents the number of samples, x i denotes the observed values, and w i j is the spatial weight between samples i and j .

2.4. Implementing Hierarchical Needs Theory at the Street Level Using Stacked Regression

Figure 3b reveals the non-strictly progressive nature of Maslow’s Hierarchy of Needs [11], indicating that the partial satisfaction of lower-level needs can trigger higher-level needs. To simulate this dynamic interaction, this study introduces Stacked Regression [44], whose core advantage lies in integrating nonlinear weights of multi-level predictors through a Meta-Model, rather than relying on a single linear assumption [45]. Specifically, an Elastic Net Meta-Model dynamically allocates weights to quantify contribution differences among levels [46]. Utilizing five-fold cross-validation, with Root Mean Square Error (RMSE) and R2 as evaluation metrics, the model achieved an R2 of 0.91 (RMSE = 0.23) on the test set, significantly outperforming the single Random Forest (R2 = 0.85) and Gradient Boosting (R2 = 0.88). Compared to Dempsey et al.’s (2012) linear hierarchical model, this method reduced errors by 32% in demand transition scenarios [47].
Based on the aforementioned scores, we consider a score of 3 (high level) as the threshold for achieving proficiency in a given dimension, thereby deeming that location suitable for advancing to higher-level needs. Using a gradient progression approach, we screen areas that meet the criteria for each level and superimpose higher-level indicators. We then identify regional distributions that satisfy different indicators and quantify the proportions at various levels.

2.5. Analyzing the Impact of Street View Elements on the Five Dimensions of Human-Centered Needs Theory

By conducting a Pearson correlation analysis between streetscape elements and the five dimensions of street demands, we systematically quantified the strength and directionality of the linear relationships between streetscape elements and various indicators of human-centered needs across different dimensions, thereby clarifying the influential role of streetscape elements in shaping key dimensions of livable cities oriented towards human-centered needs. To gain a deeper understanding of the complex mechanisms through which streetscape elements collectively impact human-centered need dimensions and to explore optimization strategies for constructing human-oriented cities, we introduced an innovative algorithm, Elastic Net Regression (ENR). Compared to other models, this algorithm demonstrates significant advantages in handling both linear and nonlinear regression problems. By integrating the technical essence of Ridge and Lasso regression, it not only enhances robustness but also effectively simplifies the model structure and improves interpretability [48]. Moreover, Elastic Net Regression demonstrates exceptional accessibility in processing and analyzing the results of street view semantic segmentation [18].
At the onset of applying the algorithm, we conducted rigorous data preprocessing, including the normalization of independent variables (streetscape elements) and dependent variables (scores for each need dimension), and employed ElasticNet CV cross-validation to scientifically select optimal Ridge and Lasso regression parameters. The Elastic Net Regression model, as a linear regression framework that combines the characteristics of Lasso (Least Absolute Shrinkage and Selection Operator) and Ridge regression, achieves effective variable selection and precise estimation of regression coefficients by optimizing a loss function that includes L1 and L2 norm penalty terms. The mathematical expression is specifically formulated as follows:
min w 1 2 n X W y 2 2 + α ρ w 1 + 1 ρ w 2 2
In this context, X represents the feature matrix, y is the target variable, w is the weight vector to be estimated, n denotes the number of samples, α is the regularization strength parameter, and ρ is the weight ratio between L1 regularization (Lasso) and L2 regularization (Ridge). When ρ = 1, Elastic Net reduces to Lasso regression; when ρ = 0, it degrades to Ridge regression.

3. Results

3.1. Human-Centered Needs in Large-Scale Urban Streets

3.1.1. Overall Pattern of Human-Centered Needs in Streets

Figure 6 displays the predicted levels of need satisfaction in streets using the Random Forest model, while Table 5 shows the proportion of different levels for each dimension. Among the five dimensions, we observe that the attainment rate for accessibility (with a score above three) is 38.21%, Security is 37.53%, comfort is 39.29%, esthetics is 28.69%, and sociability is 22.69%. Notably, esthetics has the highest proportion of streets with extremely low levels (20.76%), while accessibility has the highest proportion of streets with extremely high levels (14.99%).
In general, accessibility, Security, comfort, esthetics, and sociability are predominantly concentrated in the well-developed commercial center areas in the southern part of Tianhe District, particularly around the core aggregation zone encompassing “Guangzhou East Railway Station—Tiyuxi Road—Zhujiang New Town—Liede Business District”. Additionally, this corridor aligns with Guangzhou’s emerging economic central axis. Within this scope, roads such as Linjiang Avenue and Tianyuan Road exhibit particularly notable performance. This results in significant north–south disparities, with the less developed northern regions demonstrating inferior overall conditions. However, at the level of subjective spiritual needs, the sociability performance in the northern and southern parts of Tianhe District exhibits a high degree of similarity. Despite the southern region’s more mature development, it has not significantly spurred higher levels of social activity. The presence of highly developed and comprehensive road infrastructure and public service designs has not directly catalyzed an increase in social desire, suggesting that planners may need to examine the factors that stimulate social activities from more diversified perspectives.

3.1.2. Hierarchical Characteristics of Human-Centered Needs in Urban Streets

Table 6 presents the screening outcomes of various regions following the application of stacked regression analysis. This study strictly adheres to Maslow’s Hierarchy of Needs, progressing systematically from demand levels primarily driven by objective factors to those dominated by subjective factors. Regions that fail to meet the criteria at lower demand levels are excluded from subsequent evaluations at higher levels. The analysis indicates an elimination rate of 34.72% at the intermediate demand level and 13.88% at the advanced demand level. Specifically, the basic physiological needs level accounts for 55.14%, while the advanced physiological needs level constitutes only 6.48%.
According to the results depicted in Figure 7, specifically in Figure 7a, at the basic physiological needs level, regions meeting the criteria are predominantly concentrated in the southern part of Tianhe District, which serves as the commercial hub of both Tianhe and Guangzhou, characterized by superior road conditions. In contrast, the northern region exhibits suboptimal performance, primarily due to weaker economic benefit diffusion, resulting in relatively inadequate road infrastructure development. In Figure 7b, at the intermediate physiological needs level, compliant areas are mostly found in residential zones such as Wushan Street, indicating Tianhe District’s significant emphasis on enhancing the residential environment. Notably, in Figure 7c, the distribution of the advanced physiological needs level across Tianhe District is relatively uniform, with road satisfaction in the northern region being comparable to that in the southern region. This observation similarly highlights the potential for street development in the northern region and suggests that a favorable street experience is not solely dependent on commercial core areas, necessitating further reflection on street construction and design.

3.1.3. Human-Centered Needs in Urban Streets

We selected the economically developed southern region of Tianhe District as a representative example of high-density urban streets to conduct a spatial clustering analysis. The study’s results indicate that urban streets exhibit distinct characteristics across different demand levels (Figure 8). In our comprehensive analysis, Area A (Guangzhou East Railway Station) predominantly displays a High-High cluster at the basic demand level, which transitions to a Low-High cluster at higher demand levels. Conversely, Area B (Liede Business District), Area C (Wushan Residential Area), and Area D (Guangzhou Olympic Sports Center) all demonstrate a High-High cluster at the basic demand level but exhibit a Low-Low cluster at higher demand levels.
This conclusion further reveals that most high-density regions perform admirably in meeting the basic physiological needs of streets yet fall short in satisfying higher-level physiological demands. Notably, both Area B (Liede Business District) and Area C (Wushan Residential Area) exhibit a phenomenon where High-High clusters are surrounded by Low-High or Low-Low clusters. To delve deeper into the underlying causes of these phenomena, it is necessary to conduct field investigations of typical streets within these four areas.
The research employs a method that combines big data analysis with field investigations to achieve a more nuanced observation of street spaces. Upon investigating the current conditions of the four areas, it was observed from on-site photographs that the infrastructure in these streets is relatively well developed, with roads, trees, and other elements occupying a significant proportion of the visual landscape. However, sidewalk spaces are generally narrow. Additionally, there are fences separating pedestrian crossings from roads, and the presence of non-motor vehicle parking and other infrastructure on pedestrian crossings further encroaches upon the pedestrian space. Meanwhile, the utilization of gray spaces resulting from building setbacks in Area B (Liede Business District) and Area C (Wushan Residential Area) is inadequate, with some areas remaining idle or buildings lacking such gray spaces altogether.

3.2. Correlation Between Urban Streetscape Elements and Human-Centered Needs

The Pearson correlation analysis indicates (Figure 9) that, at the level of basic physiological needs, only the element of walls exhibits a negative correlation, while the other elements generally demonstrate positive correlations, with the exception of a negative correlation between sky and vehicles in the street Security index. At the level of intermediate physiological needs, sky, trees, grass, and sidewalks exhibit consistent performance trends. In terms of comfort, walls and sky show a negative correlation, while for esthetic indicators, walls, buildings, sky, roads, pedestrians, and vehicles exhibit negative correlations. Conversely, sidewalks, trees, and grass exhibit positive correlations, with a strong positive correlation observed between trees and grass. Regarding higher-level physiological needs, in terms of road interactivity, buildings, sky, people, and cars demonstrate positive correlations, whereas walls, trees, roads, grass, and sidewalks show negative correlations.
The Elastic Net Regression results are displayed in a rose diagram (Figure 10 and Table 7). At the basic physiological needs level, the primary positive influencing elements for accessibility are grass and roads (0.63 and 0.62, respectively), with the wall having the greatest negative impact (−0.67). For Security, the most significant positive influencing elements are grass and sidewalks (0.87 and 0.83, respectively), while the wall has the largest negative impact (−0.67). At the intermediate physiological needs level, the most crucial positive factor for comfort is grass (0.71), with the wall having the most negative impact (−0.68). For advanced physiological needs, buildings, cars, and pedestrians are the most important positive factors, ranked first, second, and third (0.48, 0.27, and 0.26, respectively).

4. Discussion

4.1. Overall Satisfaction of Human-Centered Needs in Urban Streets

This study employs Maslow’s Hierarchy of Needs to construct an indicator framework by utilizing the MEBS method to delve into users’ intrinsic experiences. Advanced deep learning techniques, such as the Random Forest model and stacked regression, are employed to accurately capture and predict the extent to which streets satisfy user needs across large areas, thereby measuring and evaluating the livability of the urban environment. The research delineates the fulfillment levels of different needs hierarchies within urban spaces, the performance disparities of various elements across dimensions, the relationships between different hierarchical levels, and the conditions for progression to higher levels. Additionally, the underlying reasons for these findings are discussed.
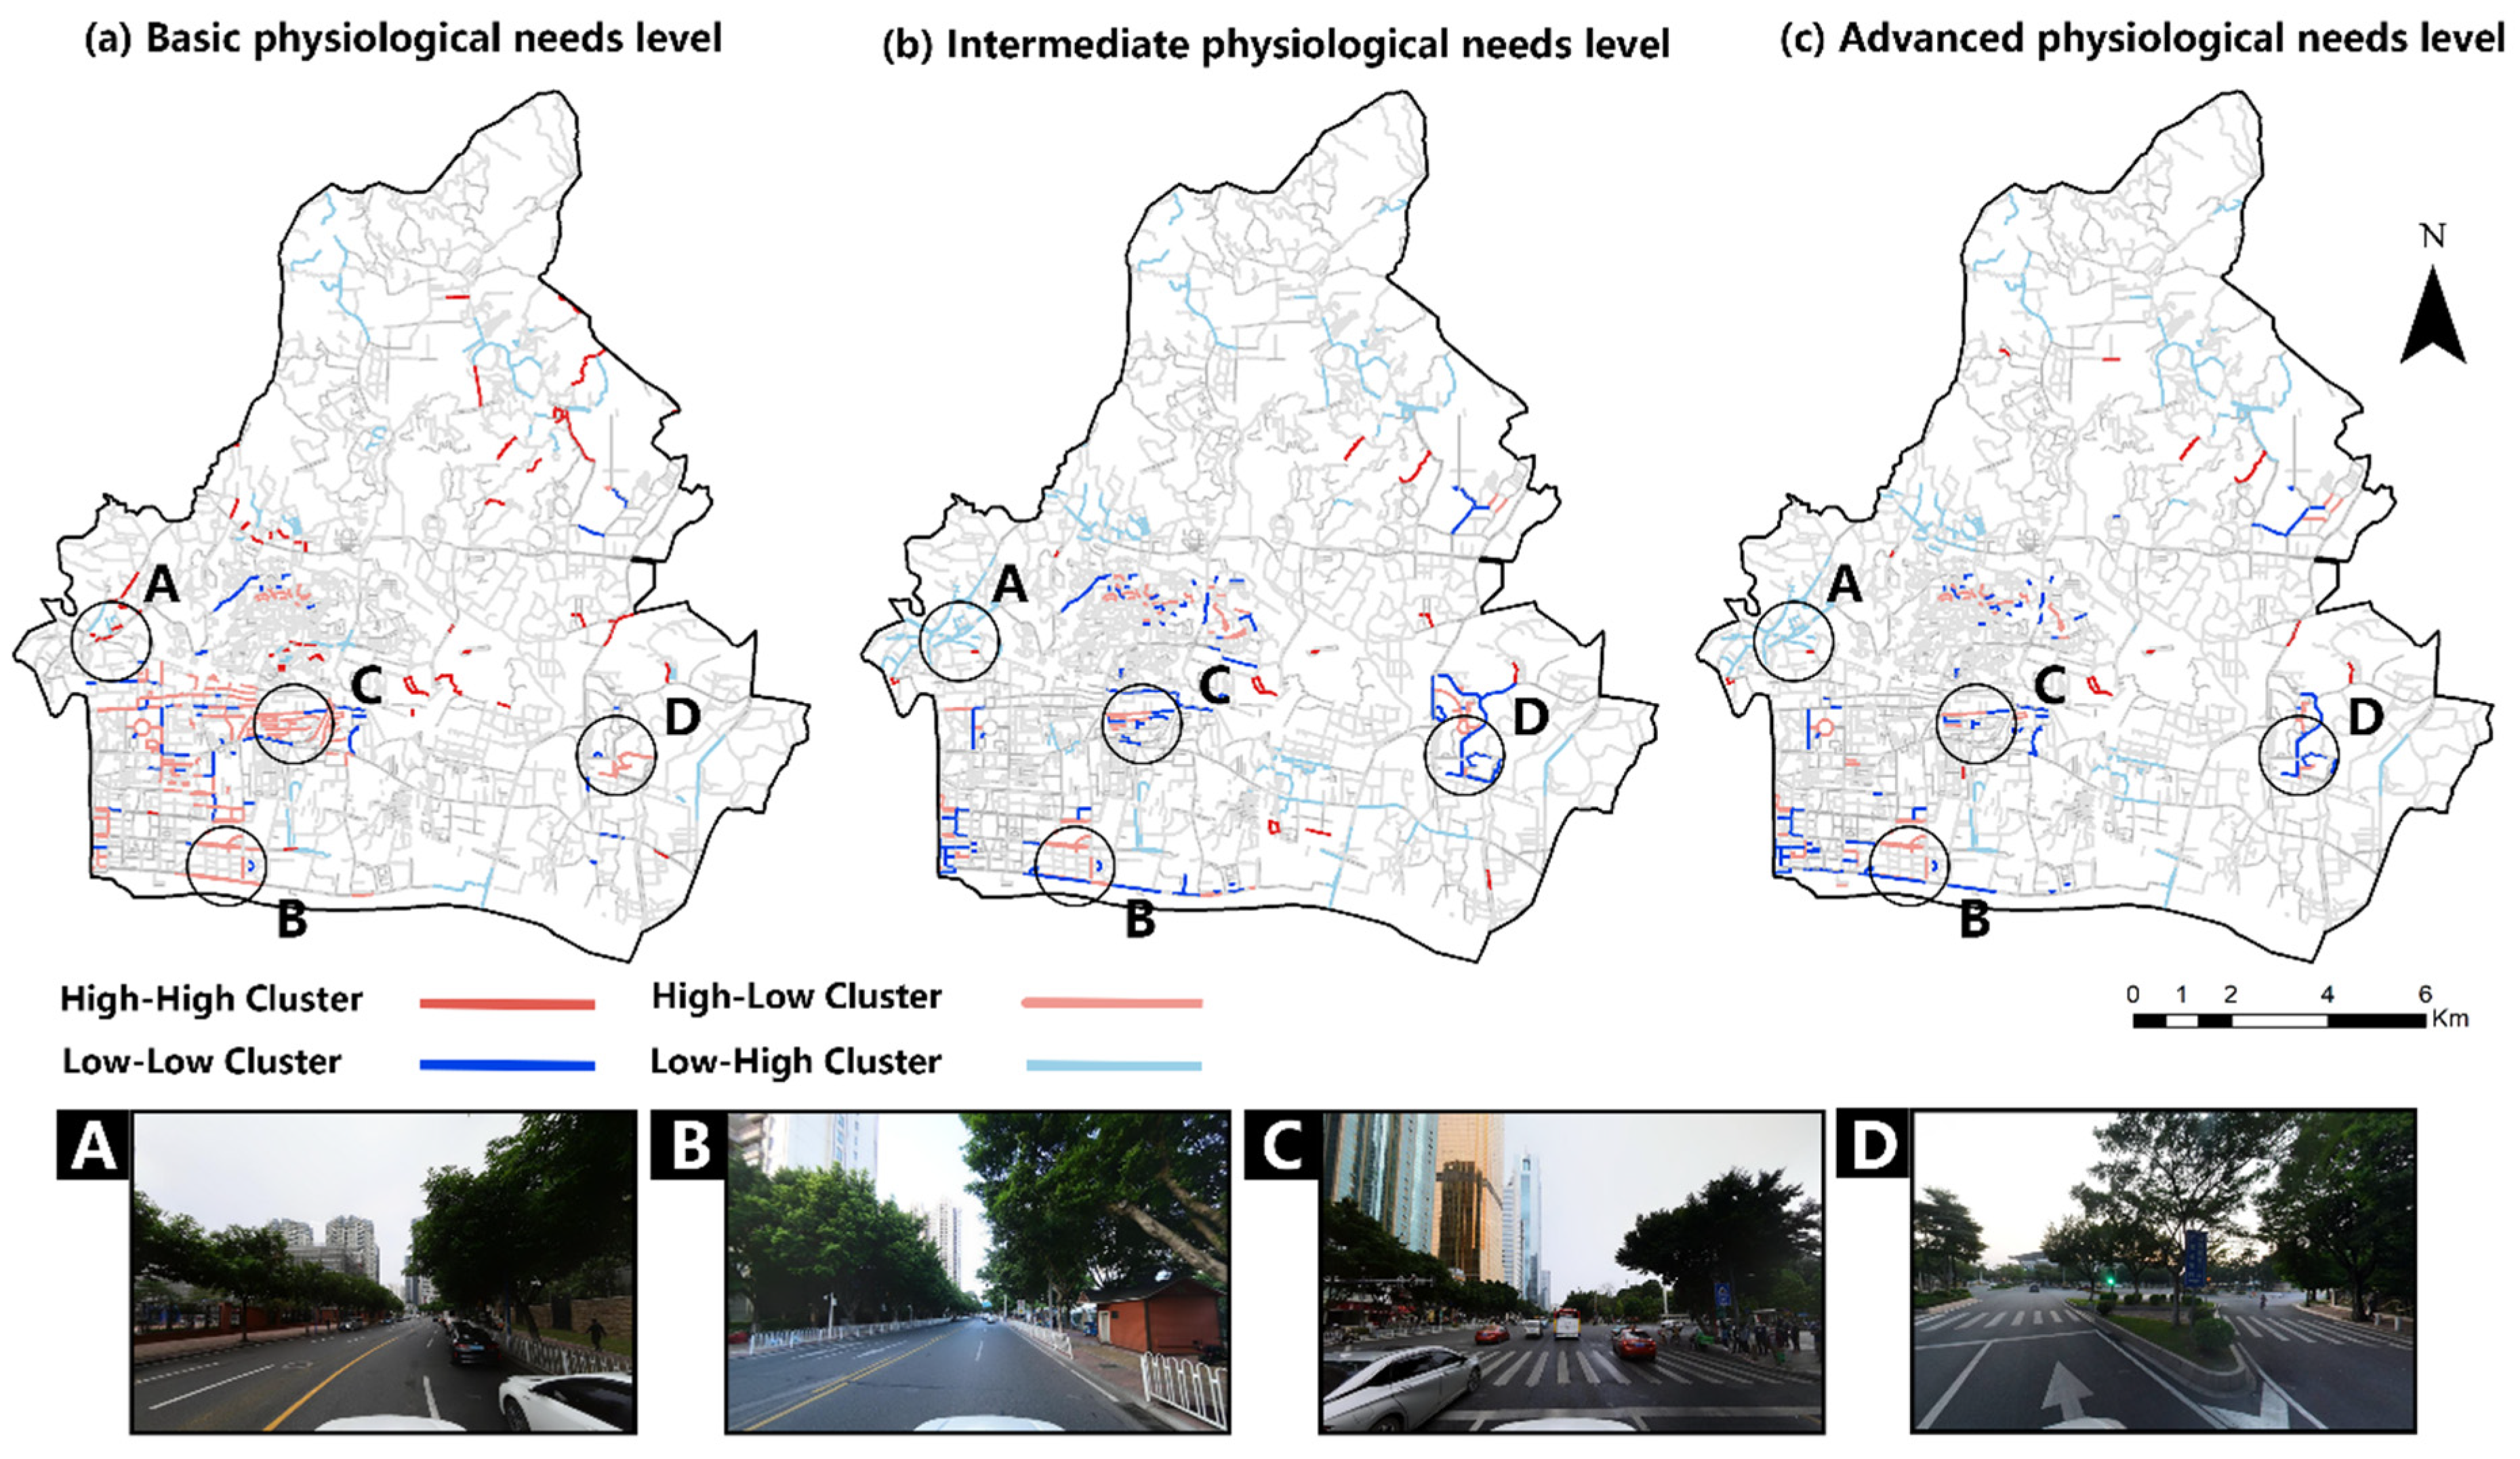
Our results indicate that the streets in Tianhe District exhibit a relatively high level of satisfaction for residents’ basic physiological needs (accessibility and Security), with a compliance rate exceeding 37%. However, there is a significant deficiency in meeting intermediate (comfort and esthetics) and advanced needs (sociability), with compliance rates below 30%. The attrition rate from basic to advanced needs (34.7%) is notably higher than that from basic to intermediate needs (13.9%) in Tianhe District. This phenomenon aligns with findings from high-density urban areas such as Shinjuku, Tokyo, and the Central Business District in Singapore, suggesting that “prioritizing functionality over experience” is a common challenge in the rapid global urbanization process [49].
From the perspective of the dynamic nature of needs hierarchies, the climatic characteristics of tropical high-density cities (e.g., high temperatures and humidity) may exacerbate this disparity, as exemplified by the urban heat island effect. Street elements such as trees, shrubs, and shaded areas significantly contribute to perceived comfort in Guangzhou’s subtropical climate, particularly within the comfort dimension. For instance, streets with shading facility coverage below 30% experience an average decline of 22% in intermediate needs compliance. This finding underscores the importance of integrating climate-adaptive design strategies into urban planning, especially in tropical and subtropical cities.
Furthermore, areas with higher levels of greening and shading in high-density urban planning tend to cluster, indicating that shading design is a pivotal intervention point for needs upgrading in tropical cities. Subtropical high-density cities should prioritize securing the transition pathway from “basic to intermediate needs” [50], enhancing comfort and esthetics through vertical greening (e.g., sky gardens in Hong Kong) and shaded corridors (e.g., Singapore’s “5-Minute Shelter Plan”). Similarly, an increase in high-quality scenes can facilitate users’ willingness to engage in social interactions, highlighting the significant role of public space quality and design in promoting social integration [4].

4.2. Impact of Different Streetscape Elements on Human-Centered Needs

Research indicates that different elements exhibit varying performances across diverse dimensions and hierarchical levels, with certain elements even demonstrating opposing relationships. For instance, in terms of accessibility, the “obstacle” elements (such as fences, buildings, and trees) across all cities are identified as negative factors. Tall walls and buildings reduce the visibility and permeability of public spaces, whereas appropriate building facades and wall heights can help mitigate this effect [47]. Conversely, in terms of sociability, fences, trees, and buildings serve as positive factors. Mehaffy (2021) points out that the esthetic quality of public spaces influences people’s health, happiness, and, consequently, their quality of life [5]. At the level of advanced physiological needs, elements like fences and buildings act as positive factors that promote user engagement and communication. This is because, in subtropical regions, buildings provide shaded spaces for interaction, while fences and buildings can stimulate the desire for communication [51]. Therefore, in architectural esthetics, decorating building facades and integrating local characteristics and culture can reduce the presence of unattractive walls that lack cultural significance, thereby enhancing street esthetics [52]. Additionally, by replacing materials, the pollution caused by building facades can be minimized [53].
In subtropical climates, construction materials should incorporate more reflective surfaces to mitigate urban heat by reflecting solar radiation rather than absorbing it. Furthermore, urban planners should prioritize the creation of a well-ventilated environment through the design of street textures. Enhancing natural ventilation by optimizing street orientation and layout can alleviate the impacts of high temperatures and humidity, fostering more appealing communication spaces for users and improving the urban environment. This also elucidates the contrasting findings between basic and advanced physiological needs, where elements such as buildings and roads emerge as primary opposing factors.
Certain dimensions, however, exhibit strong correlations. The comfort dimension at the intermediate needs level is highly correlated with Security at the basic physiological needs level. Weighted analyses also reveal a good consistency in how these two dimensions reflect elements within streets. From a hierarchical perspective, streets with higher Security levels, from an objective material standpoint (e.g., deterring criminal activities and reducing traffic accidents), influence the comfort of street spaces through alterations in material elements, such as extending the usage of spaces and pedestrian dwell times at night [54]. However, in terms of subjective element selection, natural elements hold a significant positive correlation. Humans generally prefer natural landscapes [55], and urban greening can help mitigate noise propagation [56] and air pollution [57], while also improving urban thermal comfort and microclimate regulation [58].

4.3. Impacts on the Construction of Human-Friendly Cities

Our research reveals that certain areas tend to exhibit high-high clustering characteristics at the basic physiological needs level yet transition to low-low or low-high clustering at higher levels. For instance, areas surrounding Guangzhou’s East Railway Station and Guangzhou’s Olympic Sports Center, which are major transportation hubs, exhibit significant pedestrian traffic. Consequently, planning efforts in these regions have reasonably focused on transportation infrastructure while discouraging congestion or prolonged stay. However, such patterns are less appropriate for residential, commercial, and financial districts, such as Tianhe’s Residential Area, Zhujiang’s New Town Financial District, and Tiyu Xilu’s Commercial District.
Integrating the findings from our field investigations and considering the characteristic humid and high-temperature climate of subtropical regions, we propose the following recommendations: In residential areas within subtropical zones, priority should be accorded to enhancing basic needs such as sidewalk width and shading rates. Building upon this solid foundation, efforts should be directed towards establishing activity spaces like pocket gardens while leveraging the utilization of architectural gray spaces. By providing spacious and comfortable areas for social interaction, this approach can foster greater opportunities for communal engagement, thereby augmenting the sense of safety and belonging within streets [59].
For commercial districts, ensuring adequate coverage of shading facilities is paramount. Additionally, attention should be paid to enhancing the esthetic appeal and continuity of street walls to bolster site attractiveness and vitality [60]. Incorporating local cultural elements, such as the distinctive Lingnan arcades prevalent in subtropical China, can create gray spaces through the recessed ground floors of buildings. These spaces not only offer shaded areas for respite but also synergize with commercial activities to enhance street vibrancy. Despite evolving into various forms, the fundamental functions and structural integrity of these arcades remain consistent. This initiative not only strikes a balance between modernization and regional identity but also showcases the unique streetscape of subtropical China.
Moreover, in subtropical regions, the expansive sky exposure correlates with elevated temperatures, exerting a negative impact. Drawing inspiration from practices in cities like Singapore and Bangkok, it is advisable to incorporate shading coverage and vertical greening rates into planning metrics. Currently, Guangzhou, Hong Kong, and Singapore are contemplating the integration of elevated walkway systems in their urban planning. Notable exemplary cases, such as the Pazhou urban design project in Guangzhou, illustrate how planners have coordinated with diverse enterprises to connect high-rise buildings on both sides of the street through elevated walkways. This facilitates indoor traversal, enhancing communication opportunities while saving time. Simultaneously, the addition of vertical greenery, such as green walls or planter boxes, along the exterior of these walkways provides shading to the adjacent streets and mitigates the heat island effect. These measures collectively represent successful strategies tailored for subtropical regions.
In the context of future urban regeneration efforts, understanding user needs and constructing more satisfactory urban street environments are pivotal. We propose strategies for the gradual development and enhancement of livable cities through the improvement of street environments. These strategies offer concrete action plans for urban planners and local governments. By enhancing the physical urban environment to cater to user needs, we can contribute to enhancing the well-being, vitality, and attractiveness of cities. While our study specifically focuses on Tianhe District in Guangzhou, the methodology of applying Maslow’s Hierarchy of Needs, the large-scale prediction of urban residents’ needs, and the conclusions and recommendations presented herein can effectively advance the achievement of the Sustainable Development Goals (SDGs).
Importantly, given the distinct subtropical climate of the region, integrating climate-adaptive design strategies into urban planning is crucial for ensuring long-term sustainability and resilient urban environments. The typical subtropical climate characteristics of the study area can serve as a representative of subtropical high-density cities in general, underscoring the vital importance of incorporating climate-adaptive design principles in urban planning.

4.4. Limitations and Future Research

This study focuses on visual and basic somatosensory needs, whereas Kawai et al. (2023) [61] have demonstrated that noise levels can account for up to 25% of the influence on perceived Security [60]. Consequently, future research should further integrate multi-sensory dimensions, such as auditory noise reduction design [61], olfactory comfort [62], and immersive experiences [63]. Furthermore, the empirical data, which highlight the implications of tropical monsoon climates and high-density urban forms, should be extended to rapidly urbanizing regions in South Asia and Africa to validate the global applicability and robustness of the model. Additionally, exploring the dynamic feedback mechanisms between need hierarchies and urban governance policies will provide more systematic decision-making support for sustainable urban regeneration.
Finally, the elements segmented in photographs using DeepLab V3+ only reveal the spatial proportions of each element. However, for dimensions related to esthetics or sociality, these may not be entirely influenced by spatial proportions but are rather more closely associated with design or cultural elements. For instance, architectural elements such as the proportion of facade glass, color schemes, DH (depth-to-height) ratios, or plant diversity were not accounted for in this experimental study. In future research, we will continue to refine and deepen the experimental methodologies to achieve a more comprehensive measurement of street spaces.

5. Conclusions

This study employs Tianhe District in Guangzhou as an empirical case and integrates Maslow’s Hierarchy of Needs, street view image analysis, and deep learning techniques to construct a dynamic evaluation framework of “Needs Hierarchy—Streetscape Elements—Spatial Quality”. This framework elucidates the hierarchical characteristics and driving mechanisms of street livability in high-density urban settings by proposing globally applicable design strategies. The key conclusions are as follows:
There exists a commonality in both local and global characteristics concerning the fulfillment of needs hierarchies. Streets in Tianhe District exhibit a significant emphasis on basic physiological needs over mid- to high-level needs, aligning with the “function first, experience lags” pattern inherent in the spatial governance challenges of high-density cities. Furthermore, the study reveals that the tropical climate exacerbates the deficit in mid- to high-level needs. On streets with shading coverage below 30%, the comfort compliance rate decreases by 22%. A similar trend is observed in Bangkok and Jakarta, indicating that shading design is a common intervention point for needs upgrading in tropical cities.
To address these issues, Guangzhou should prioritize the “Shaded Corridor Plan” and the “Revival of Arcade Architecture Aesthetics” to develop a urban construction approach tailored to its climatic and cultural characteristics, thereby avoiding the homogenization of urban landscapes. Simultaneously, attention should be paid to the differential performance of various elements within the “Dynamic Model of Needs Hierarchy” across different need levels by balancing and constraining these relationships to enhance urban livability.
The study proposes integrating tropical shading needs, temperate thermal comfort requirements, and cultural esthetic preferences into a unified evaluation system for urban planning in subtropical regions, thereby supporting the regionally differentiated implementation of Sustainable Development Goal 11 (SDG 11). This provides developmental objectives for the future construction of high-quality, livable cities.

Author Contributions

Conceptualization, M.L. and Z.F.; methodology, M.L. and Z.F.; software, Z.F.; validation, M.L.; investigation, Z.F.; data curation, M.L. and Z.F.; writing—original draft preparation, Z.F.; writing—review and editing, M.L.; visualization, Z.F.; supervision, M.L.; project administration, M.L.; funding acquisition, M.L. All authors have read and agreed to the published version of the manuscript.

Funding

This study is financed by The Project Supported by the National Natural Science Foundation of China No. 51978267 and State Key Laboratory of Subtropical Building and Urban Science No. 2024ZB13.

Data Availability Statement

The original contributions presented in the study are included in the article, further inquiries can be directed to the corresponding authors.

Conflicts of Interest

The authors declare that they have no known competing financial interests or personal relationships that could have appeared to influence the work reported in this paper.

References

  1. Azapagic, A.; Perdan, S. (Eds.) Sustainable Development in Practice: Case Studies for Engineers and Scientists; John Wiley & Sons: Hoboken, NJ, USA, 2011. [Google Scholar]
  2. Schell, L.M.; Denham, M. Environmental pollution in urban environments and human biology. Annu. Rev. Anthropol. 2003, 32, 111–134. [Google Scholar] [CrossRef]
  3. Kovacs-Györi, A.; Ristea, A.; Havas, C.; Mehaffy, M.; Hochmair, H.H.; Resch, B.; Juhasz, L.; Lehner, A.; Ramasubramanian, L.; Blaschke, T. Opportunities and challenges of geospatial analysis for promoting urban livability in the era of big data and machine learning. ISPRS Int. J. Geo-Inf. 2020, 9, 752. [Google Scholar] [CrossRef]
  4. Gehl, J. Cities for People; Island Press: Washington, DC, USA, 2013. [Google Scholar]
  5. Mehaffy, M.W. Health and happiness in the new urban agenda: The central role of public space. Sustainability 2021, 13, 5891. [Google Scholar] [CrossRef]
  6. Mulligan, G.; Carruthers, J.; Cahill, M. Urban quality of life and public policy: A survey. Contrib. Econ. Anal. 2004, 266, 729–802. [Google Scholar]
  7. McCrea, R.; Shyy, T.K.; Stimson, R. What is the strength of the link between objective and subjective indicators of urban quality of life? Appl. Res. Qual. Life 2006, 1, 79–96. [Google Scholar] [CrossRef]
  8. Cummins, R.A. Objective and subjective quality of life: An interactive model. Soc. Indic. Res. 2000, 52, 55–72. [Google Scholar] [CrossRef]
  9. Ahmed, N.O.; El-Halafawy, A.M.; Amin, A.M. A critical review of urban livability. Eur. J. Sustain. Dev. 2019, 8, 165. [Google Scholar] [CrossRef]
  10. Sheikh, W.T.; van Ameijde, J. Promoting livability through urban planning: A comprehensive framework based on the “theory of human needs”. Cities 2022, 131, 103972. [Google Scholar] [CrossRef]
  11. Frager, R.; Maslow, A.H. Motivation and Personality; Longman: Harlow, UK, 1987. [Google Scholar]
  12. McMillan, D.W.; Chavis, D.M. Sense of community: A definition and theory. J. Community Psychol. 1986, 14, 6–23. [Google Scholar] [CrossRef]
  13. Liu, Y.; Ji, T.; Ho, H.C.; Guo, C.; Wei, H.H. A decision-making approach for determining strategic priority of sustainable smart city services from citizens’ perspective: A case study of Hong Kong. Sustain. Cities Soc. 2024, 101, 105147. [Google Scholar] [CrossRef]
  14. Zhang, Y.; Liu, F.; Gu, Z.; Chen, Z.; Shi, Y.; Li, A. Research on smart city evaluation based on hierarchy of needs. Procedia Comput. Sci. 2019, 162, 467–474. [Google Scholar] [CrossRef]
  15. Gu, X.; Xu, D.; Xu, M.; Zhang, Z. Measuring residents’ perceptions of multifunctional land use in peri-urban areas of three Chinese megacities: Suggestions for governance from a demand perspective. Cities 2022, 126, 103703. [Google Scholar] [CrossRef]
  16. Ji, T.; Chen, J.H.; Wei, H.H.; Su, Y.C. Towards people-centric smart city development: Investigating the citizens’ preferences and perceptions about smart-city services in Taiwan. Sustain. Cities Soc. 2021, 67, 102691. [Google Scholar] [CrossRef]
  17. Dubey, A.; Naik, N.; Parikh, D.; Raskar, R.; Hidalgo, C.A. Deep Learning the City: Quantifying Urban Perception at a Global Scale. In Proceedings of the Computer Vision-ECCV 2016: 14th European Conference, Amsterdam, The Netherlands, 11–14 October 2016; Springer: Berlin/Heidelberg, Germany, 2016. [Google Scholar]
  18. Yang, Y.; Wang, Q.; Wu, D.; Hang, T.; Ding, H.; Wu, Y.; Liu, Q. Constructing child-friendly cities: Comprehensive evaluation of street-level child-friendliness using the method of empathy-based stories, street view images, and deep learning. Cities 2024, 154, 105385. [Google Scholar] [CrossRef]
  19. Daniel, T.C. Whither scenic beauty? Visual landscape quality assessment in the 21st century. Landsc. Urban Plan. 2001, 54, 267–281. [Google Scholar] [CrossRef]
  20. Zhou, S.; Chen, F.; Dai, Y. Construction of a quality spatial planning system oriented towards connotative development. City Plan. Rev. 2019, 43, 13–21. [Google Scholar]
  21. Gerike, R.; Koszowski, C.; Schröter, B.; Buehler, R.; Schepers, P.; Weber, J.; Wittwer, R.; Jones, P. Built environment determinants of pedestrian activities and their consideration in urban street design. Sustainability 2021, 13, 9362. [Google Scholar] [CrossRef]
  22. Rui, Q.; Cheng, H. Quantifying the spatial quality of urban streets with open street view images: A case study of the main urban area of Fuzhou. Ecol. Indic. 2023, 156, 111204. [Google Scholar] [CrossRef]
  23. Gunnarsson, B.; Knez, I.; Hedblom, M.; Sang, Å.O. Effects of biodiversity and environment-related attitude on perception of urban green space. Urban Ecosyst. 2017, 20, 37–49. [Google Scholar] [CrossRef]
  24. Eskola, A. Non-active role-playing: Some experiences. In Advances in Psychology; North-Holland: Amsterdam, The Netherlands, 1988; Volume 48, pp. 239–311. [Google Scholar]
  25. Wallin, A.; Koro-Ljungberg, M.; Eskola, J. The method of empathy-based stories. Int. J. Res. Method Educ. 2019, 42, 525–535. [Google Scholar] [CrossRef]
  26. Wendel, H.E.W.; Zarger, R.K.; Mihelcic, J.R. Accessibility and usability: Green space preferences, perceptions, and barriers in a rapidly urbanizing city in Latin America. Landsc. Urban Plan. 2012, 107, 272–282. [Google Scholar] [CrossRef]
  27. Zhao, X.; Lu, Y.; Lin, G. An integrated deep learning approach for assessing the visual qualities of built environments utilizing street view images. Eng. Appl. Artif. Intell. 2024, 130, 107805. [Google Scholar] [CrossRef]
  28. Dai, L.; Zheng, C.; Dong, Z.; Yao, Y.; Wang, R.; Zhang, X.; Guan, Q. Analyzing the correlation between visual space and residents’ psychology in Wuhan, China using street-view images and deep-learning technique. City Environ. Interact. 2021, 11, 100069. [Google Scholar] [CrossRef]
  29. Wei, J.; Yue, W.; Li, M.; Gao, J. Mapping human perception of urban landscape from street-view images: A deep-learning approach. Int. J. Appl. Earth Obs. Geoinf. 2022, 112, 102886. [Google Scholar] [CrossRef]
  30. Verma, D.; Jana, A.; Ramamritham, K. Predicting human perception of the urban environment in a spatiotemporal urban setting using locally acquired street view images and audio clips. Build. Environ. 2020, 186, 107340. [Google Scholar] [CrossRef]
  31. Chen, L.; Papandreou, G.; Schroff, F.; Adam, H. Rethinking Atrous Convolution for SemanticImage Segmentation. arXiv 2017, arXiv:1706.05587. [Google Scholar]
  32. He, K.; Zhang, X.; Ren, S.; Sun, J. Spatial pyramid pooling in deep convolutional networks for visual recognition. IEEE Trans. Pattern Anal. Mach. Intell. 2015, 37, 1904–1916. [Google Scholar] [CrossRef]
  33. Li, Y.; Yabuki, N.; Fukuda, T. Integrating GIS, deep learning, and environmental sensors for multicriteria evaluation of urban street walkability. Landsc. Urban Plan. 2023, 230, 104603. [Google Scholar] [CrossRef]
  34. Li, Y.; Yabuki, N.; Fukuda, T. Measuring visual walkability perception using panoramic street view images, virtual reality, and deep learning. Sustain. Cities Soc. 2022, 86, 104140. [Google Scholar] [CrossRef]
  35. Li, M.; Huai, L. Evaluation of Urban Public Green Space Services from the Perspective of the 15-Minute Life Circle. South. Archit. 2023, 6, 32–41. [Google Scholar]
  36. Nagata, S.; Nakaya, T.; Hanibuchi, T.; Amagasa, S.; Kikuchi, H.; Inoue, S. Objective scoring of streetscape walkability related to leisure walking: Statistical modeling approach with semantic segmentation of Google Street View images. Health Place 2020, 66, 102428. [Google Scholar] [CrossRef] [PubMed]
  37. Zhu, D.; Song, D.; Zhu, B.; Zhao, J.; Li, Y.; Zhang, C.; Zhu, D.; Yu, C.; Han, T. Understanding complex interactions between neighborhood environment and personal perception in affecting walking behavior of older adults: A random forest approach combined with human-machine adversarial framework. Cities 2024, 146, 104737. [Google Scholar] [CrossRef]
  38. Li, M.; Fan, Z. A Study on the Coupling Relationship between Street Space Quality and Vitality Based on Multi-source Data Methods: A Case Study of Tianhe District, Guangzhou. Contemp. Archit. 2024, 11, 98–104. [Google Scholar]
  39. Maslow, A.H. Motivation and Personality; Harper and Row: New York, NY, USA, 1954. [Google Scholar]
  40. Särkelä, E.; Suoranta, J. The method of empathy-based stories as a tool for research and teaching. Qual. Rep. 2020, 25, 399–415. [Google Scholar] [CrossRef]
  41. Cordts, M.; Omran, M.; Ramos, S.; Rehfeld, T.; Enzweiler, M.; Benenson, R.; Franke, U.; Roth, S.; Schiele, B. The cityscapes dataset for semantic urban scene understanding. In Proceedings of the IEEE Conference on Computer Vision and Pattern Recognition, Las Vegas, NV, USA, 27–30 June 2016; pp. 3213–3223. [Google Scholar]
  42. Wu, T.; Lin, D.; Chen, Y.; Wu, J. Integrating Street View Images, Deep Learning, and sDNA for Evaluating University Campus Outdoor Public Spaces: A Focus on Restorative Benefits and Accessibility. Land 2025, 14, 610. [Google Scholar] [CrossRef]
  43. Brokamp, C.; Jandarov, R.; Rao, M.B.; LeMasters, G.; Ryan, P. Exposure assessment models for elemental components of particulate matter in an urban environment: A comparison of regression and random forest approaches. Atmos. Environ. 2017, 151, 1–11. [Google Scholar] [CrossRef]
  44. Breiman, L. Stacked regressions. Mach. Learn. 1996, 24, 49–64. [Google Scholar] [CrossRef]
  45. Pavlyshenko, B. Using stacking approaches for machine learning models. In Proceedings of the 2018 IEEE Second International Conference on Data Stream Mining & Processing (DSMP), Lviv, Ukraine, 21–25 August 2018; IEEE: New York, NY, USA, 2018; pp. 255–258. [Google Scholar]
  46. Zhu, J.; Qiu, L.; Su, Y.; Guo, Q.; Hu, T.; Bao, H.; Luo, J.; Wu, S.; Xu, Q.; Wang, Z.; et al. Disentangling the effects of the surrounding environment on street-side greenery: Evidence from Hangzhou. Ecol. Indic. 2022, 143, 109153. [Google Scholar] [CrossRef]
  47. Dempsey, N.; Brown, C.; Bramley, G. The key to sustainable urban development in UK cities? The influence of density on social sustainability. Prog. Plan. 2012, 77, 89–141. [Google Scholar] [CrossRef]
  48. Meng, K.; Gai, Y.; Wang, X.; Yao, M.; Sun, X. Transfer learning for high-dimensional linear regression via the elastic net. Knowl.-Based Syst. 2024, 304, 112525. [Google Scholar] [CrossRef]
  49. Lang, W.; Chen, T.; Chan, E.H.; Yung, E.H.; Lee, T.C. Understanding livable dense urban form for shaping the landscape of community facilities in Hong Kong using fine-scale measurements. Cities 2019, 84, 34–45. [Google Scholar] [CrossRef]
  50. Oppio, A.; Bottero, M.; Arcidiacono, A. Assessing Urban Quality: A Proposal for a MCDA Evaluation Framework; Springer: Berlin/Heidelberg, Germany, 2018. [Google Scholar]
  51. Bittencourt, M.C.; do Valle Pereira, V.L.D.; Júnior, W.P. The usability of architectural spaces: Objective and subjective qualities of built environment as multidisciplinary construction. Procedia Manuf. 2015, 3, 6429–6436. [Google Scholar] [CrossRef]
  52. Liu, L.; Silva, E.A.; Wu, C.; Wang, H. A machine learning-based method for the large-scale evaluation of the qualities of the urban environment. Comput. Environ. Urban Syst. 2017, 65, 113–125. [Google Scholar] [CrossRef]
  53. Zhao, H.; Liu, C.; Yang, R.J.; Sun, C. Large-scale prediction of solar irradiation, shading impacts, and energy generation on building Façade through urban morphological indicators: A machine learning approach. Energy Build. 2024, 323, 114797. [Google Scholar] [CrossRef]
  54. Sepe, M. Liveable and healthy city design. WIT Trans. Ecol. Env. 2018, 217, 177–189. [Google Scholar]
  55. Sahraoui, Y.; Clauzel, C.; Foltête, J.C. A metrics-based approach for modeling covariation of visual and ecological landscape qualities. Ecol. Indic. 2021, 123, 107331. [Google Scholar] [CrossRef]
  56. Zhu, M.H.; Li, Q.; Yuan, J.L.; Cubino, J.P.; Johnson, J.B.; Cui, J.P.; Nizamani, M.M.; Zhu, Z.-X.; Wang, H.F. The Influence of Greening Management and Landscape Patterns on Plant Diversity in Urban Green Spaces in Danzhou, China; Urban Forestry & Urban Greening: Munich, Germany, 2024; p. 128651. [Google Scholar]
  57. Abdel-Moneim, N.M.; Khalil, H.A.E.; Kamel, R.R. Developing QOL index for resettlement projects of unsafe areas in Egypt. In Urban Forum; Springer: Dordrecht, The Netherlands, 2021; Volume 32, pp. 349–371. [Google Scholar]
  58. Eusuf, M.A.; Mohit, M.A.; Eusuf, M.S.; Ibrahim, M. Impact of outdoor environment to the quality of life. Procedia-Soc. Behav. Sci. 2014, 153, 639–654. [Google Scholar] [CrossRef]
  59. Istrate, A.L.; Chen, F.; Kadetz, P.; Chang, Y.; Williams, A.R. Developing an analytical framework for liveable streets in Shanghai. Urban Des. Int. 2021, 26, 3–20. [Google Scholar] [CrossRef]
  60. Harvey, C. Measuring Streetscape Design for Livability Using Spatial Data and Methods; The University of Vermont and State Agricultural College: Burlington, VT, USA, 2014.
  61. Kawai, C.; Georgiou, F.; Pieren, R.; Tobias, S.; Mavros, P.; Schäffer, B. Investigating effect chains from cognitive and noise-induced short-term stress build-up to restoration in an urban or nature setting using 360° VR. J. Environ. Psychol. 2024, 100, 102466. [Google Scholar] [CrossRef]
  62. Yin, Z.; Liu, Z.; Liu, X.; Zheng, W.; Yin, L. Urban heat islands and their effects on thermal comfort in the US: New York and New Jersey. Ecol. Indic. 2023, 154, 110765. [Google Scholar] [CrossRef]
  63. Dane, G.; Evers, S.; van den Berg, P.; Klippel, A.; Verduijn, T.; Wallgrün, J.O.; Arentze, T. Experiencing the future: Evaluating a new framework for the participatory co-design of healthy public spaces using immersive virtual reality. Comput. Environ. Urban Syst. 2024, 114, 102194. [Google Scholar] [CrossRef]
Figure 1. The analytical framework of the study.
Land 14 01095 g001
Figure 2. Location of the study area: (a) China; (b) Guangdong Province; (c) Guangzhou City; (d) Tianhe District.
Land 14 01095 g002
Figure 3. Schematic diagram of Maslow’s Hierarchy of Needs transformation. (a) Hierarchy of street space needs based on Maslow’s theory; (b) transformation of Maslow’s Hierarchy of Needs.
Land 14 01095 g003
Figure 4. Presentation of a questionnaire based on the empathy-driven approach and principles of DeepLabv3+. (a) Simulation of questionnaire scenarios based on the Empathy-Based Story Method; (b) quantification of street view elements using the DeepLabv3+ image segmentation model.
Land 14 01095 g004
Figure 5. Model training result chart, accessibility, Security, comfort, esthetics, and Socializability.
Land 14 01095 g005
Figure 6. Degree of livability of different streets. (a) Accessibility; (b) Security; (c) comfort; (d) esthetics; (e) sociability.
Land 14 01095 g006
Figure 7. Hierarchical characteristics of street demand satisfaction. (a) Basic physiological needs level; (b) intermediate physiological needs level; (c) advanced physiological needs level.
Land 14 01095 g007
Figure 8. Local spatial autocorrelation. (a) Basic physiological needs level; (b) intermediate physiological needs level; (c) advanced physiological needs level. Area A: Guangzhou East Railway Station; Area B: Liede Business District; Area C: Wushan Residential Area; Area D: Guangzhou Olympic Sports Center.
Land 14 01095 g008
Figure 9. Correlation heatmap of streetscape elements and dimensions in livable cities. Orange represents a positive correlation, while blue represents a negative correlation.
Land 14 01095 g009
Figure 10. Rose diagram of Elastic Net Regression for livability and street elements. (a) Accessibility; (b) Security; (c) comfort; (d) esthetics; (e) sociability.
Land 14 01095 g010
Table 1. Questionnaire based on the Empathy-Based Story Method for assessing livable cities.
DimensionStatement
QuestionAnswer 1Answer 2Answer 3Answer 4Answer 5
AccessibilityImagine you are in the scene depicted in this photo, do you think the road ahead can lead to many places?I don’t think I can go anywhere.I think I can’t go to some places.I think I can go to some places.I think I can go to quite a few places.I think I can go to many places.
SecurityImagine you have been in this scene for some time, do you feel safe?I want to leave.I feel a bit unsafe.It’s not badI feel relatively safe.I am very willing to stay in this scene.
ComfortIn the scene depicted in this photo, do you feel comfortable and relaxed? Would you be willing to stay in this place for a while?I want to leave.I feel uncomfortable.I feel it’s okay.I feel it’s nice here.It’s very pleasant here.
EstheticsImagine you are in this scene, would you be willing to take photos of the scenery here?Where is the beauty? I don’t like it here.I don’t like it here.I can accept it here.I don’t think I can go anywhereI would like to take some good photos here.
SocializabilityIf you were to stay in this scene, would you be willing to converse, rest, or play with friends or strangers?I want to leave.I don’t want to talk to anyone.If I need to talk, I accept it.It’s quite suitable for chatting here.This is a great place for a date!
Table 2. Age, gender, and occupational distribution of respondents.
VariableClassificationProportion of Classification
Age14–30 years old47%
31–5033%
over 50 years old20%
Gendermale58%
female42%
Professionoffice workers56%
students29%
other15%
Table 3. Reliability and validity testing.
DimensionAccessibilitySecurityComfortEstheticsSocializability
Cronbach’s Alphas0.7670.7810.7430.7020.689
KMO0.686
Bartlett’s sphere11,684.081
Df10
p value0.000
Table 4. The nine elements with the highest proportion of street scenes.
DimensionAverage Value(%)Maximum (%)Minimum (%)Standard Deviation (%)
Road25.0862.020.008.41
Tree18.4263.500.0011.32
Building17.3279.690.0013.23
Sky15.9449.960.0010.17
Car5.1430.200.003.85
Wall4.1970.910.007.77
Sidewalk3.1628.660.003.30
Person3.0146.810.005.21
Grass1.2019.650.002.31
Table 5. Different dimensions of livability in the streets of Tianhe District.
DimensionExtremely Low-LevelLow-LevelModerate-LevelHigh-LevelExtremely High-Level
Accessibility6.72%24.43%30.64%23.22%14.99%
Security12.3%20.18%27.29%24.26%13.27%
Comfort9.73%23.44%27.51%33.2%6.09%
Esthetics20.76%24.4626.06%20.42%8.27%
Socializability10.67%31.22%35.47%19.1%3.59%
Table 6. Degree of demand satisfaction at different levels.
DimensionBasic Physiological NeedsIntermediate Physiological NeedsAdvanced Physiological Needs
Attainment rate55.14%20.41%6.48%
Non-compliance rate44.86%79.59%93.52%
Tier elimination ratio0%34.72%13.88%
Table 7. Elastic Net Regression results for streetscape elements with livability dimensions.
Street View ElementsAccessibilitySecurityComfortEstheticsSocializability
Wall−0.671−0.668−0.683−0.6380.128
building−0.19200.056−0.420.479
Sky−0.188−0.543−0.258−0.5220.23
Tree−0.3050.1720.10.291−0.221
Road0.620.30.427−0.309−0.001
Grass0.6310.8660.7110.973−0.035
Sidewalk0.2280.8280.4950.0250.098
Person0.1100−0.2880.256
Car0.0700.0425−0.4710.267
Disclaimer/Publisher’s Note: The statements, opinions and data contained in all publications are solely those of the individual author(s) and contributor(s) and not of MDPI and/or the editor(s). MDPI and/or the editor(s) disclaim responsibility for any injury to people or property resulting from any ideas, methods, instructions or products referred to in the content.

