Article

Effects of Biochar on Soil Organic Carbon Stability in Degraded Alpine Grasslands—A Study on Arid Regions in Central Asia

1
College of Resources and Environment, Xinjiang Agricultural University, Urumqi 830052, China
2
College of Grassland Science, Xinjiang Agricultural University, Urumqi 830052, China
3
College of Natural Resources and Environment, Northwest A & F University, Yangling 712100, China
4
Xinjiang Key Laboratory of Soil and Plant Ecological Processes, Urumqi 830052, China
5
College of Life Sciences, Xinjiang Agricultural University, Urumqi 830052, China
*
Authors to whom correspondence should be addressed.
These authors contributed equally to this work.
Land 2025, 14(5), 1018; https://doi.org/10.3390/land14051018
Submission received: 19 March 2025 / Revised: 23 April 2025 / Accepted: 1 May 2025 / Published: 7 May 2025

Abstract

:
Numerous studies have reported the importance of soil organic carbon (SOC) in grassland ecosystems and its response to soil degradation, but the effect of biochar application on SOC pools in degraded alpine grasslands remains unclear. Here, we set up nine biochar addition treatments with a combination of three different biochar particle sizes (0~0.25 mm, 0.25~1 mm, and 1~2 mm) and three different biochar additions (1%, 2%, and 4%), and conducted a short-term observational experiment over a 7-month period in the non-degraded (ND), lightly degraded (LD), and severely degraded (SD) zones of alpine grassland. The results showed that the addition of 0.25~1 mm/2% and 1~2 mm/4% biochar increased the SOC storage in LD and SD by 2.03 kg m−2 and 1.19 kg m−2, respectively. The addition of biochar decreased the stability of the soil carbon pools, but the stability of the soil carbon pools increased with time. The results of structural equation modeling (SEM) indicated that changes in biochar application and particle size would indirectly affect the stability of soil carbon pools by influencing soil and plant indicators, while changes in electrical conductivity (EC) were the key factors influencing the changes of soil carbon pools in degraded LD and SD grasslands. These results can provide technical support and theoretical basis for realizing the benign development of degraded alpine grassland ecosystems and the “carbon neutral” strategy in arid areas.

1. Introduction

Grassland ecosystems are the largest terrestrial ecosystems in terms of area, and play a fundamental and strategic role in contributing to the achievement of “carbon neutrality”. Grasslands have important ecosystem services such as retaining soil moisture and nutrients, preventing winds and fixing sands, and improving microclimate [1,2,3]. The carbon pool of grassland ecosystems in the dry zone of Central Asia is about 29.1 Pg C, accounting for 9.4% of the total global carbon stock in grasslands [4]. As a result of overgrazing and climate change, more than 80 per cent of the grasslands in Xinjiang are now degraded to varying degrees, which has led to a serious loss of soil organic carbon, a decline in soil fertility, restricted plant growth and a decline in ecosystem functions [5]. Therefore, it is urgent to explore the changes in soil organic carbon components and stability of degraded grasslands and the corresponding restoration measures, which are of great significance to the study of carbon sinks in grassland ecosystems.
Many studies have shown that the addition of biochar to degraded soils has a significant positive effect on the rehabilitation of degraded agricultural soils, including increasing the accumulation and availability of organic carbon in agricultural soils [6,7], adjustment of soil pH [8], improvement of soil water conductivity, water retention capacity and increased soil porosity [9], increasing the effectiveness of soil nutrients [10], enhancement of soil microbial activity, promotion of microbial growth and reduction in soil organic matter mineralization rate [11]. The utilization of biochar in grassland systems has increased over the past few years, and several studies have found that biochar additions have positive effects on grasslands, such as enhancing the water retention capacity of grassland soils [12], improvement of soil fertility and grass productivity [13,14]. However, most grassland-related biochar research has focused on semi-arid temperate grasslands and seeded pastures [15]. However, alpine grasslands, characterized by extreme climatic conditions (e.g., low temperatures, intense UV radiation) and unique soil dynamics (e.g., frequent freeze–thaw cycles, low microbial activity), remain understudied in the context of biochar application. These environmental factors may significantly alter biochar’s interactions with soil organic carbon, potentially leading to divergent outcomes compared to temperate grasslands. For instance, low temperatures could delay biochar decomposition, prolonging its carbon sequestration effect, while freeze–thaw cycles might physically disrupt biochar–soil aggregates, accelerating carbon loss. Such knowledge gaps highlight the urgency of targeted research in alpine systems.
Bayinbuluk alpine grassland is located in the arid area of Central Asia, which plays an important role in maintaining the ecological environment safety of the basin in northwest China and increasing the income of herders. Its ecosystem stability is more fragile and sensitive to degradation because of the alpine environment. Therefore, we put forward the following scientific assumptions. (1) Physical morphological parameters of biochar: The gradient combinations of different particle sizes and application rates will change the form of soil carbon components, thus differently regulating the stability of soil organic carbon pool in alpine degraded grassland. (2) In the alpine ecosystem with frequent freeze–thaw cycles, there exists a threshold effect between the carbon fixation efficiency of biochar and the improvement effect of its input on degraded soil. Based on this, the changes of soil organic carbon components were measured regularly to evaluate the influence of biochar on the stability of soil organic carbon pool. This exploration can not only fill the theoretical gap of biochar remediation in alpine ecosystems, but also provide a quantifiable data reference for formulating a regional carbon-neutral path.

2. Materials and Methods

2.1. Study Site

The field in situ test site Bayinbuluk alpine grassland (82°27′~86°17′ E, 42°18′~43°34′ N) is located in Hejing County, Bayin’guoleng Mongol Autonomous Prefecture, Xinjiang, China. With an altitude of 2300~3042 m, it covers 770 km2, with an average annual precipitation of 273 mm, an average annual temperature of −4.8 °C, and an annual number of snow days of 150~180 d. It has a typical alpine climate [16,17]. The study area was selected around Swan Lake within the alpine grassland because it is more affected by anthropogenic interference and is a typical area for studying alpine degraded grassland. The main species in the study area were Carex liparocarpos, Festuca L., Leymus secalinus. According to the WRB (World Reference Base for Soil Resources) classification, there are Gleysol and Arenosol.

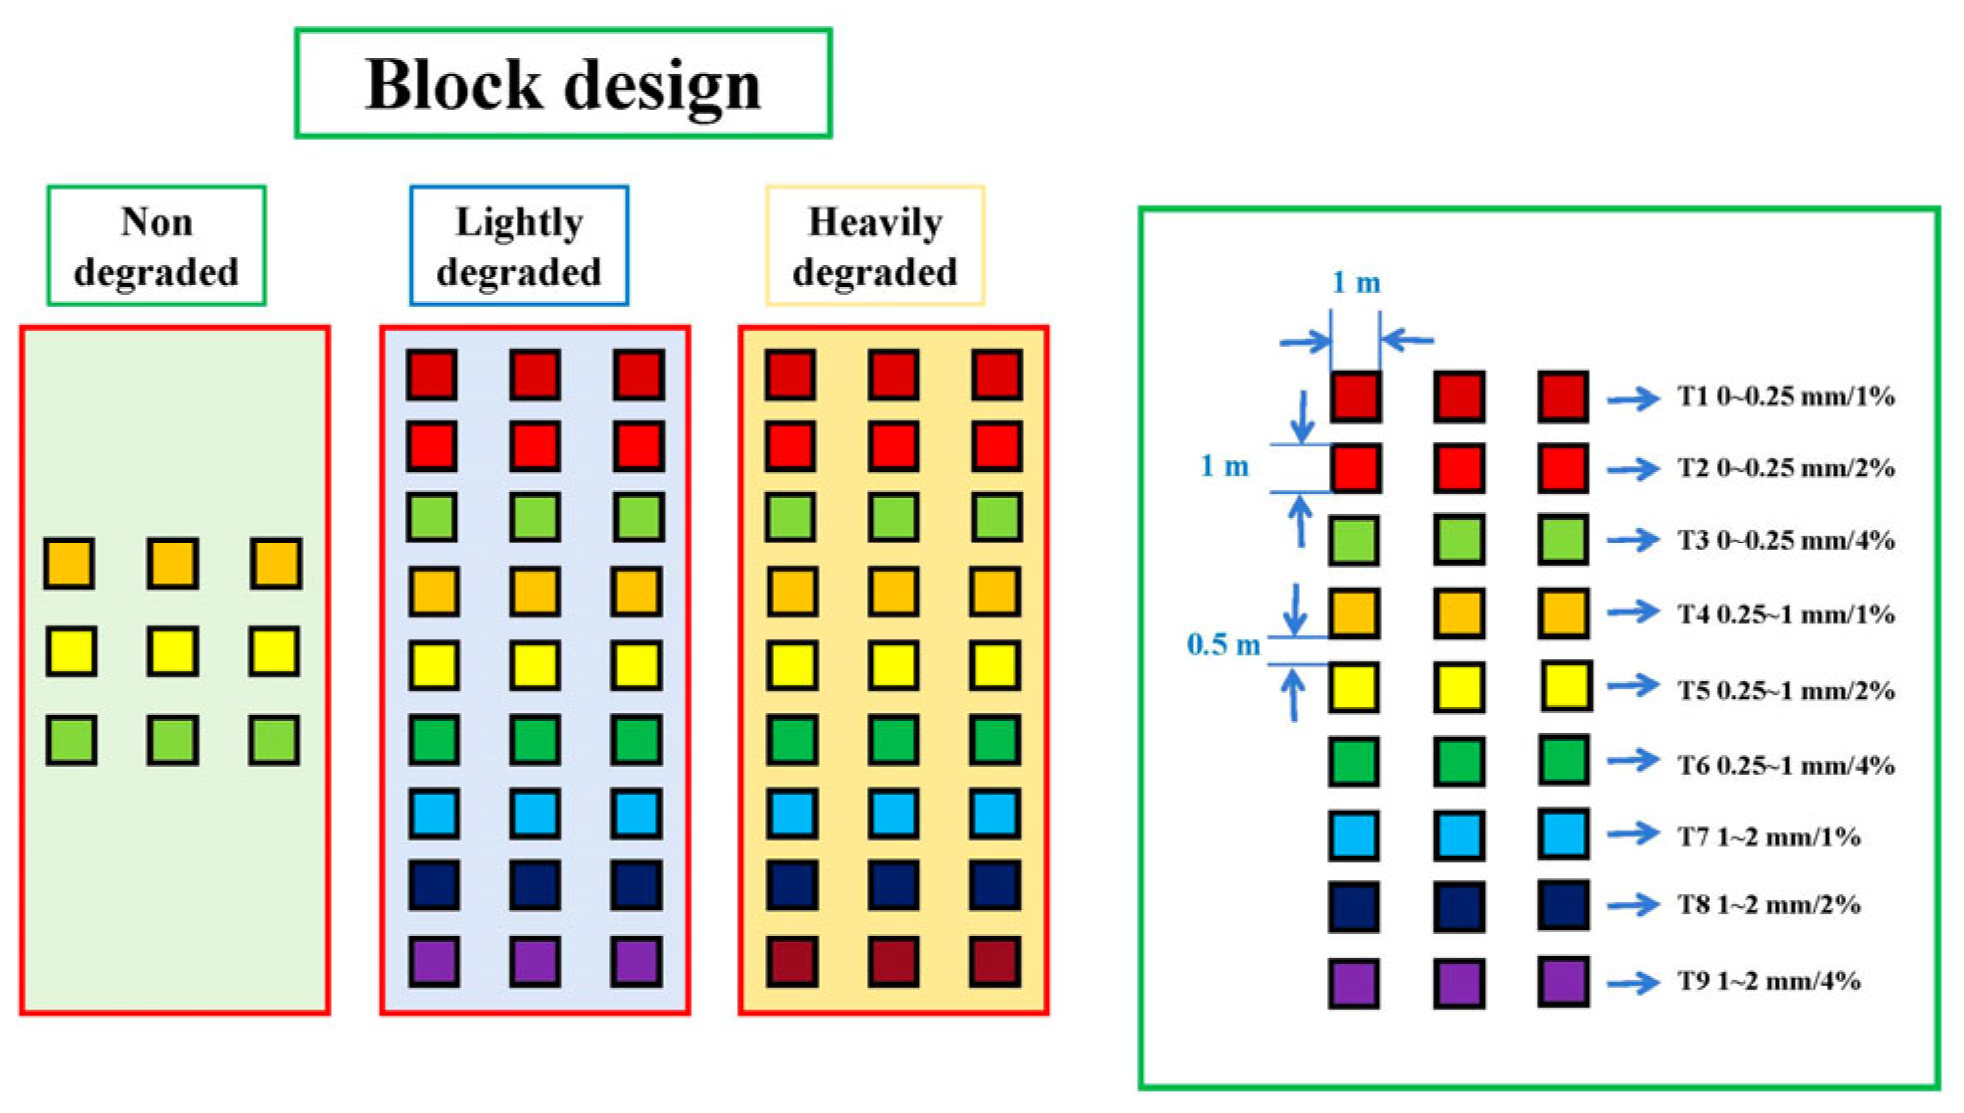
2.2. Classification of Grassland Degradation Degree

In the study area, grasslands with relatively consistent natural conditions such as slope direction and elevation were selected around the Bayinbuluk Swan Lake, and the degradation gradient observation sample zone was selected in the Camel’s Neck area through field investigation and verification. Since grassland degradation changes plant community composition, reduces soil fertility, and affects soil texture, the degradation status of grassland was assessed through a combination of plant and soil variables. Briefly, plant variables included the relative cover of three categories of plants: degradation indicator species, annual pioneer species, and dominant species, and soil variables included total carbon, total nitrogen content, and sand content. We used the grassland degradation index (GDI) to quantify the degree of degradation [18]:
Through field investigation and verification around Swan Lake, a grassland degradation observation area with relatively consistent natural conditions, such as slope direction and altitude, was selected. Because grassland degradation altered plant community composition, reduced soil fertility, and affected soil texture, grassland degradation was assessed by combining plant and soil variables. In short, plant variables included the relative coverage of three types of plants: degradation indicator species, annual pioneer species, and dominant species, and soil variables included total carbon, total nitrogen content, and sand content. We used the Grassland Degradation Index (GDI) to quantify the degree of degradation [18]:
GDI   = M 1 +   M 2 × 1 3 +   M 3 × 2 3 × 1 3 + STC   × 1 2 +   STN   × 1 2 × 1 3 + 1 Sand × 1 3
where M1, M2 and M3 represent the relative cover of dominant species (Carex liparocarpos), annual pioneer species (Festuca L.) and degradation indicator species (Leymus secalinus), respectively, STC and STN represent the total carbon and total nitrogen content of the soil, respectively, and Sand denotes the sand content of the soil. The GDI values were used to classify the grassland into three degradation classes: ND (0.96), LD (0.68), and SD (0.25) (Table 1).

2.3. Basic Physicochemical Properties of Cotton Straw Biochar and Degraded Soil

The test cotton straw biochar was obtained from Xinjiang Academy of Agricultural Sciences, with a carbonization time of 24 h and a carbonization temperature of 360 °C. The pH value of the cotton straw biochar was 10.06 ± 0.36, the average pore size was 7.43 ± 0.91 nm, the EC was 1770 ± 85.44 µS·cm−1, the organic carbon content was 479.06 ± 23.58 g·kg−1, the specific surface area was 4.68 ± 0.24 m2·g−1, and the pore volume was 0.0009 ± 0.0001 cm3·g−1. The physicochemical properties of grassland soils with different degradation levels in the experimental area are shown in Table 2 [19].

2.4. Experimental Design

The experimental design was as shown in Table 3, with biochar addition to the LD and SD areas (3 replications), and the control (CK) was no biochar application to the degraded areas (3 replications), with a total of 63 experimental plots, each of which had an area of 1 m × 1 m, with adjacent plots spaced at an interval of 0.5 m, and they were arranged in randomized groups (Figure 1). Considering the root distribution of grassland herbaceous plants, the biochar was added by spreading, and the amount of biochar added to each plot was calculated according to the soil capacity and area.

2.5. Sampling Methods and Measurement Indicators

Soil samples were collected from grasslands with different degradation degrees in April, July, September and November 2023 during one plant reproductive period, and in different degraded areas within the zone groups with the sampling method. We surveyed and recorded the dry mass weight of above-ground biomass of the plants, and at the end of the survey, the above-ground vegetation was removed, and the soil sample collection work was carried out. Soil samples (0–20 cm) were collected by the five-point method within the sample plots using a soil drill (d = 7 cm), and we immediately put the soil samples into the vehicle refrigerator and sealed them to bring them back to the laboratory.
The organic carbon content of the soil and plants was determined using the external heating method with potassium dichromate and concentrated sulfuric acid [20] and the soil samples were adsorbed using rubber rods to remove incompletely decomposed biochar and plant residues prior to the determination; soil organic carbon fractions were determined using the sulfuric acid oxidation method [20], which consists of mixing 10 mL of 1 N potassium dichromate with 2.5, 5, and 10 mL of 36 N sulfuric acid, yielding three mixtures in the ratios of 0.25:1, 0.5:1, and 1:1 (corresponding to 6.0 N, 12.0 N and 18.0 N sulfuric acid). As more organic carbon can be oxidized at higher temperatures, the SOC is divided into four different fractions in decreasing order of oxidizability, i.e., F1 (very labile organic carbon fraction), F2 (labile organic carbon fraction), F3 (less labile organic carbon fraction), and F4 (recalcitrant organic carbon fraction), and soil microbial biomass carbon (MBC) was determined using the chloroform fumigation method [21].
Soil   Microbial   Carbon = C Fumigated   Soil C Unfumigated   Soil KEc
KEc: Conversion factor, set to 0.45.
Soil pH and EC were determined using a pH meter (water–soil ratio 5:1; FE28-Standard, Switzerland) and a conductivity meter (water–soil ratio 5:1; DDSJ-308F, Shanghai); AN was determined by the alkaline hydrolysis diffusion method; AP was determined by NaHCO3 Extraction-Mo-Sb colorimetry; AK was extracted by the NaOH melting method–flame photometer method; water content (WC) was determined by the gravimetric method [22].
Biochar sequestration: estimation of biochar sequestration by subtracting the organic carbon content of the control area by the difference method [23].
Surface   soil   organic   carbon   content   =   soil   capacity   ×   soil   depth   ×   organic   carbon   content
Carbon   pool   activity   =   sample   active   organic   carbon   content / sample   inactive   organic   carbon   content

2.6. Data Analysis

We used Origin 2018, SPSS 27.0, and Amos for statistical analysis and plotting. At the 95% significance level, the LSD test was used to compare the average values of different treatments and soil physiochemical properties, and to test the normality and uniformity of variance. The relationships between organic carbon and its fractions were determined through linear regression analysis.

3. Results

3.1. Effects of Biochar Addition on Soil and Plant Organic Carbon in Degraded Grassland

There was no difference in SOC content among treatments before biochar addition (p > 0.05), and the SOC content of all treatments after biochar addition was significantly increased (p < 0.05) compared with CK, respectively (Figure 2). In the LD area, the T3 (0~0.25 mm/4%) treatment was the highest after 3 months of biochar application, increasing by 129.49% compared with CK, and the T5 (0.25~1 mm/2%) treatment was the lowest, increasing by 63.7% compared with CK; the T2 (0~0.25 mm/2%) treatment was the highest after 5 months of biochar application, increasing by 143.5% compared with CK, and the T1 (0~0.25 mm/1%) treatment was the lowest, at 70.6% higher than that of CK. There was no significant difference between the biochar application treatments after 7 months of biochar application, but it was significantly higher than that of CK treatment, and the SOC among treatments was the highest in T5, which was 124.4% higher than that of CK, and the lowest in T9 (1~2 mm/4%), which was 91.3% higher than that of CK. There were some differences in SOC among treatments of soil background value before biochar application in the SD area, with T6 (0.25~1 mm/4%) being the highest after 3 months of biochar application, increasing by 300.6% compared to CK, and T9 being the lowest, increasing by 45.2% compared to CK; after 5 months of biochar application, T3 was the highest, increasing by 316.2% compared to CK, and T9 was the lowest, increasing by 62.7%. After 7 months of biochar application, the organic carbon content among treatments was highest in T6, which was 241.9% higher than CK, and lowest in T7 (1~2 mm/1%), which was 28.4% higher than CK.
The organic carbon stock of grassland ecosystems was expressed as the sum of the increase in soil organic carbon and the organic carbon content of plants in the 0–20 cm soil layer. Table 4 shows that the organic carbon stock in the ND area was higher than that of the ck treatment in the LD and SD areas. Carbon stock in the grassland in each degraded area after biochar addition increased to a certain extent compared with that in the CK. Seven months after biochar addition, the highest increase in carbon stock was found in T5 (0.25~1 mm/2%), followed by T2 (0~0.25 mm/2%), and the lowest was found in T9 (1~2 mm/4%) in the LD area of the in situ field experiment. Enhancement was the highest, reaching 1.19 kg/m2, and T3 (0~0.25 mm/4%) was the next highest, while T7 (1~2 mm/1%) was the lowest.

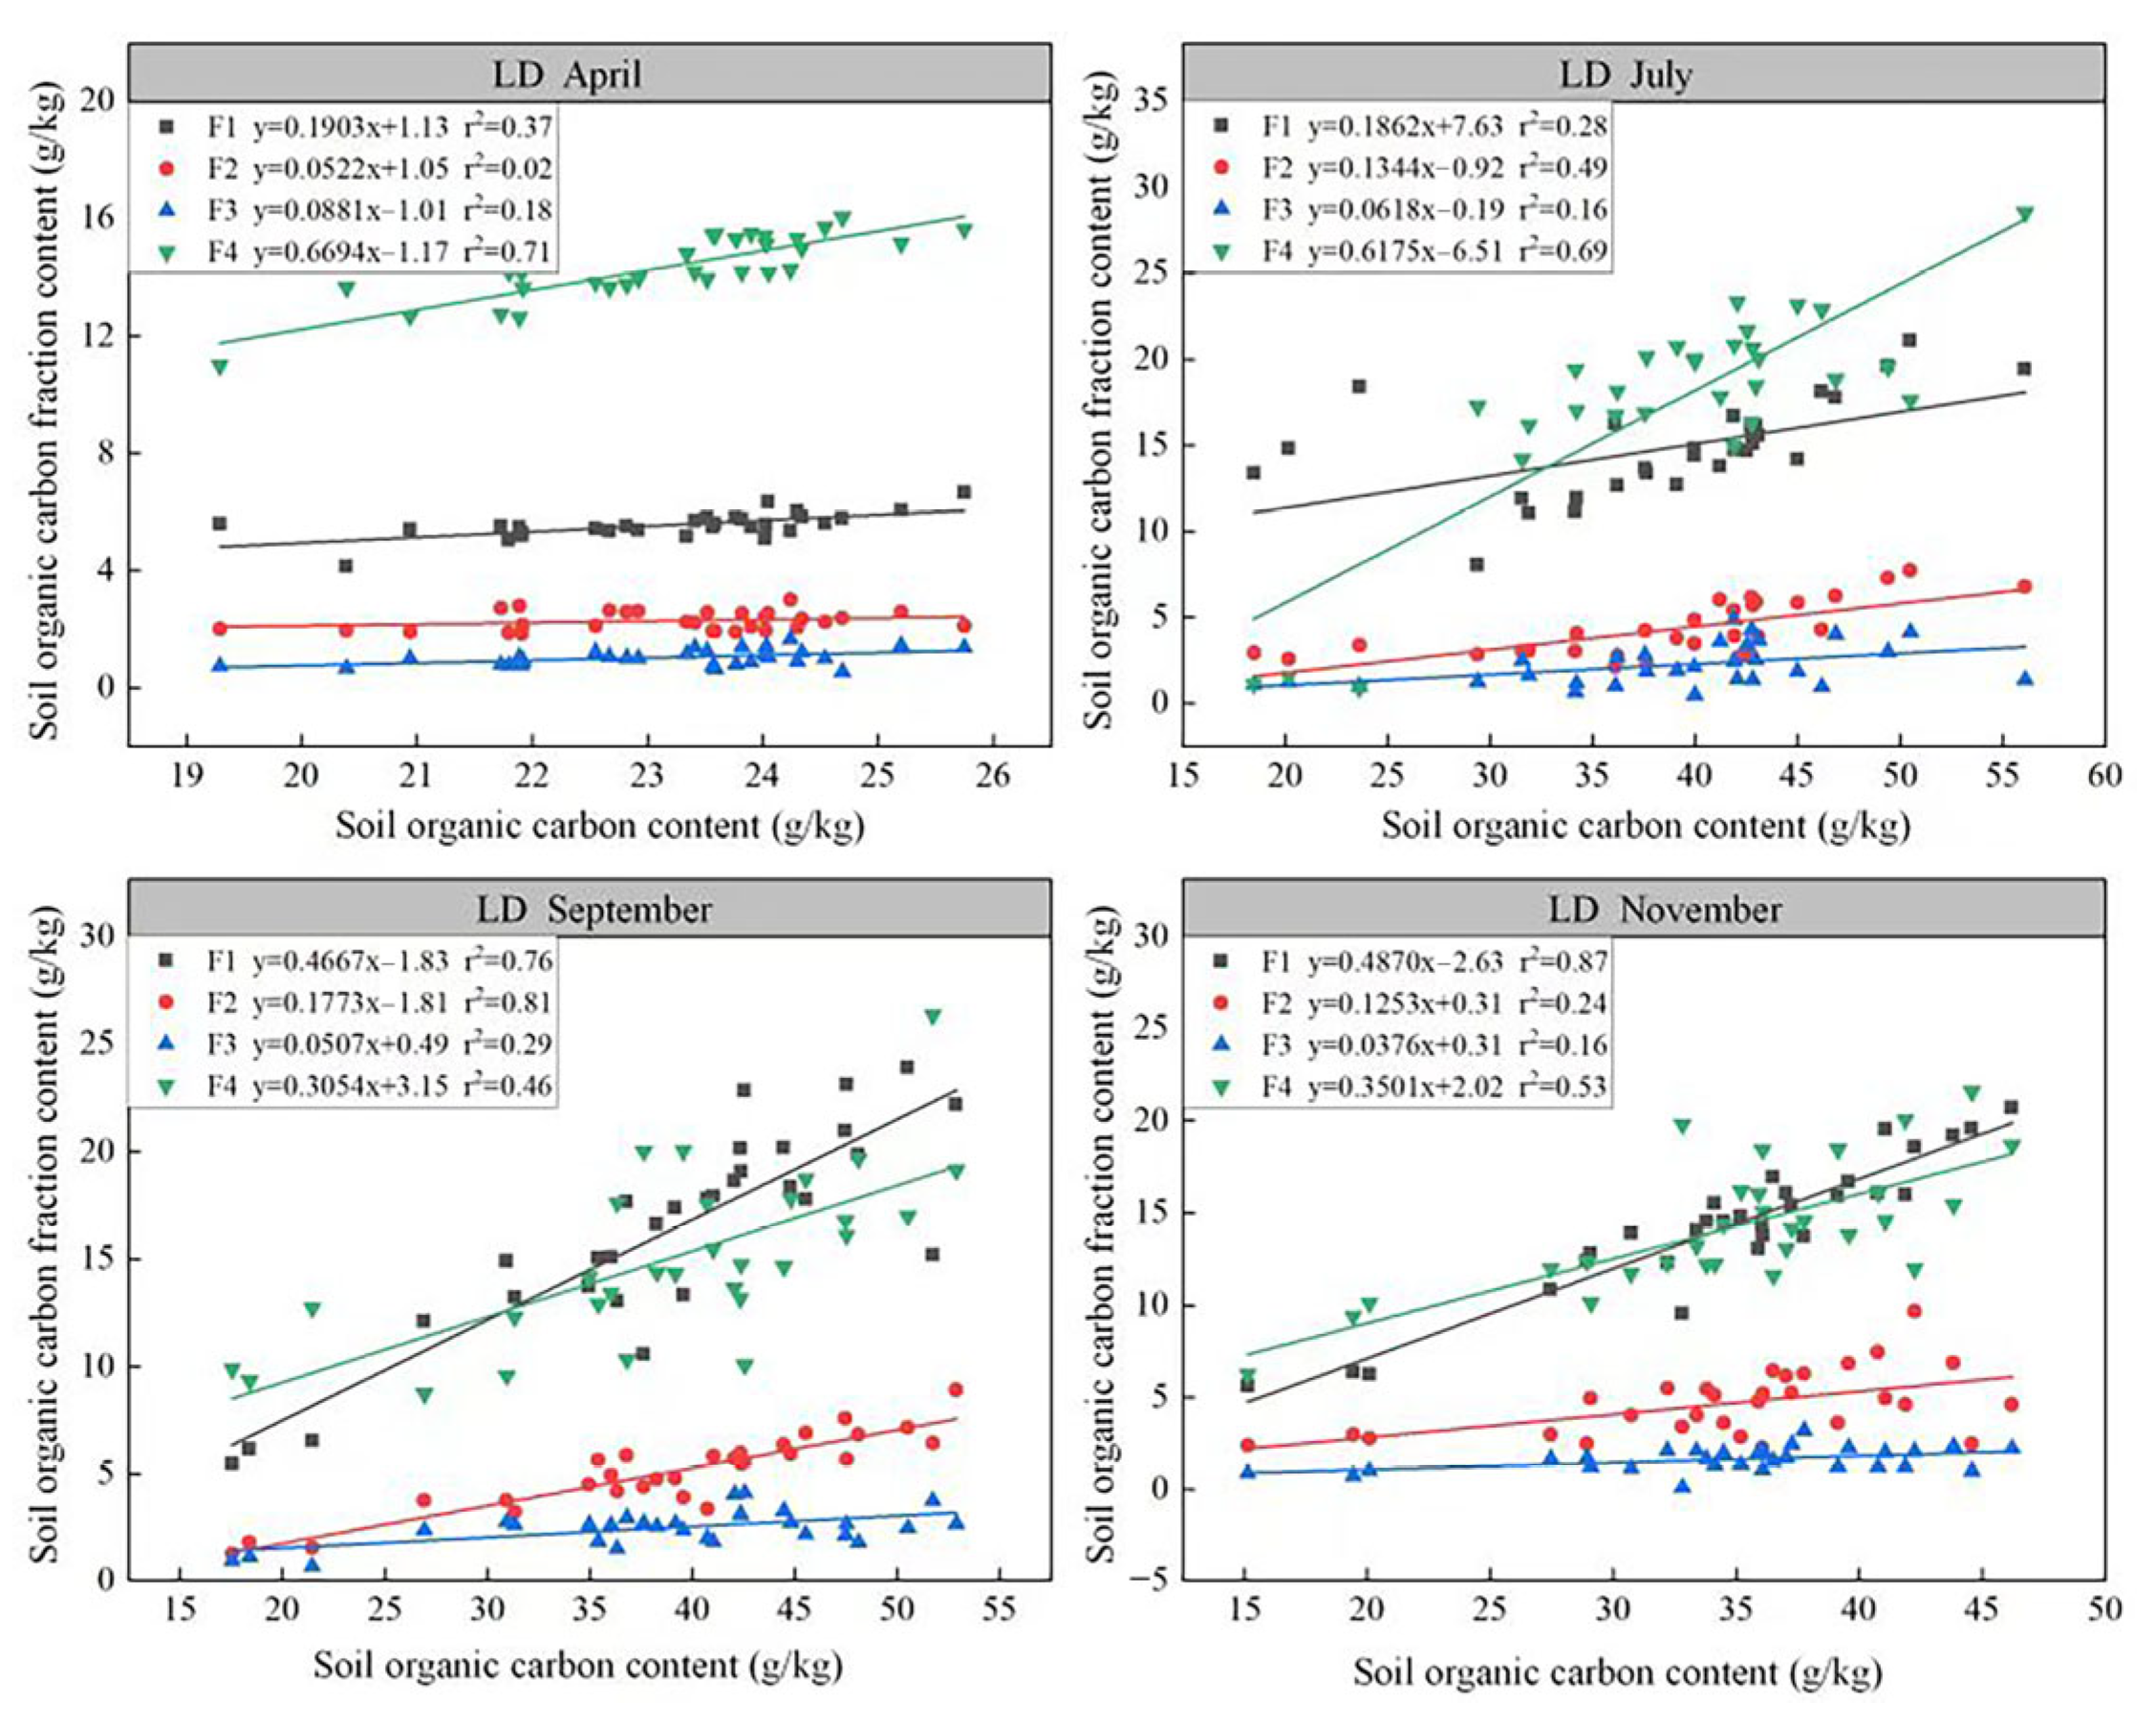
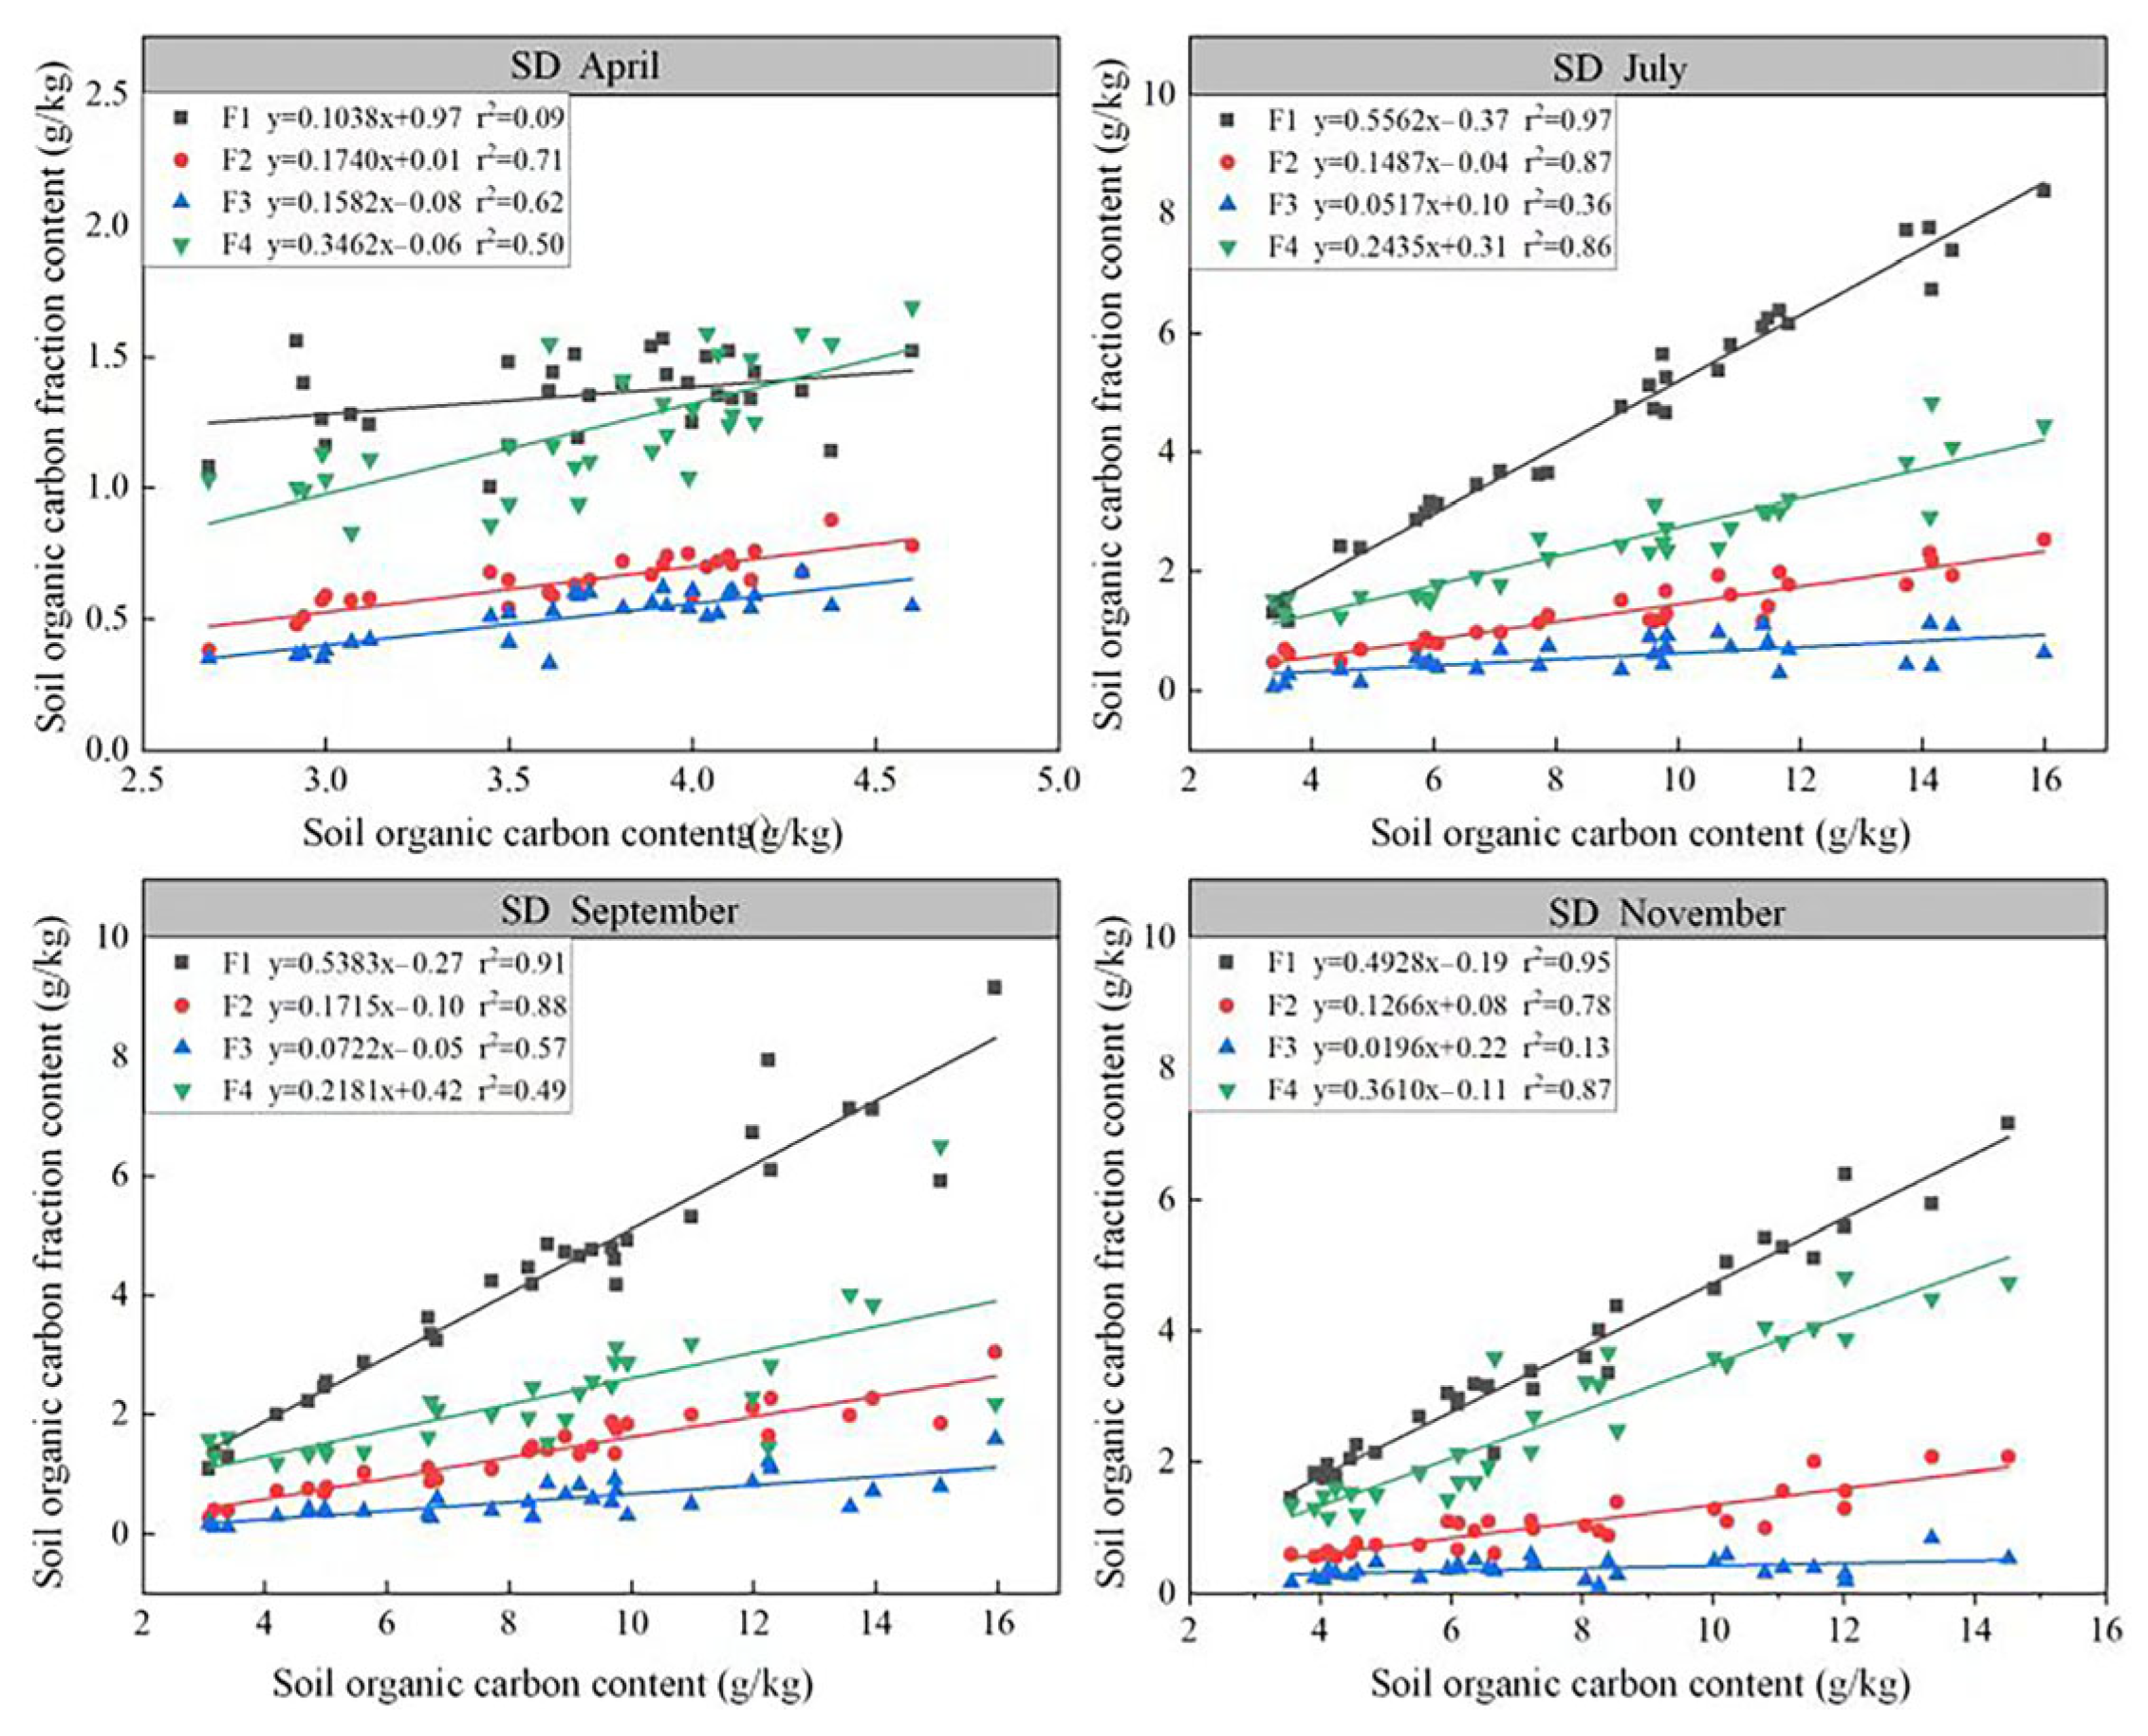
3.2. Effect of Biochar Addition on Soil Organic Carbon Fractions in Degraded Grasslands

As can be seen from Table 5 and Table 6, there was no significant difference in the organic carbon fractions of the soil treatments before the addition of biochar, and there was a significant effect on the soil fractions after the biochar was applied to the soil, with the increase in the F1 and F2 fraction content being higher than that of the F3 and F4 fractions. The content of the SOC component in each carbon application treatment was significantly higher than that in CK, and the content of carbon component in the F1 component in each carbon application treatment was significantly higher than that in other treatments.

3.3. Effects of Biochar Addition on the Stability of Soil Organic Carbon Pools in Degraded Grasslands

Regression analysis of the field in situ test in the LD area shows that there is a certain linear relationship between all organic carbon components and total organic carbon, and the relationship between soil carbon components changes after adding biochar (Figure 3). Compared with no carbon application, the correlation between SOC and F1, F2 and F3 increased after carbon application, and the slope of F4 component in April was 0.67, which was an important factor to maintain the stability of the carbon pool. After adding biochar for 3 months, the component slope of F4 decreased to 0.62; however, the slope of F4 decreased to 0.31 and that of F1 increased to 0.47 after 5 months of bio char addition. Seven months after biochar was added, the slope of the F4 component was 0.35, and the slope of the F1 component increased to 0.49, indicating that the correlation between activated carbon component and total organic carbon gradually increased after biochar was added, which became the main factor leading to the stability change of soil carbon pool.
The regression analysis of severely degraded areas in the in situ test (Figure 4) showed that all organic carbon components and the total amount of organic carbon were linear, and the relationship between soil carbon components changed after biochar addition. Similar to the trend in LD area, the correlation of F1, F2 and F3 components with SOC showed an increase after biochar application. The slope of the F1 component increased more significantly, with changes over time increasing from 0.10 to 0.56, 0.54, and 0.49 after 3, 5, and 7 months of biochar addition. The slope of the F4 component over time changed from 0.35 to 0.24, 0.22, and 0.36 after 3, 5, and 7 months of biochar addition. The results showed that the F1 component gradually rose after biochar addition and became the factor leading the stability of the soil carbon bank, but the slope of the F1 component tended to decrease with time, while the slope of the F4 component decreased after biochar addition, but gradually increased with time.

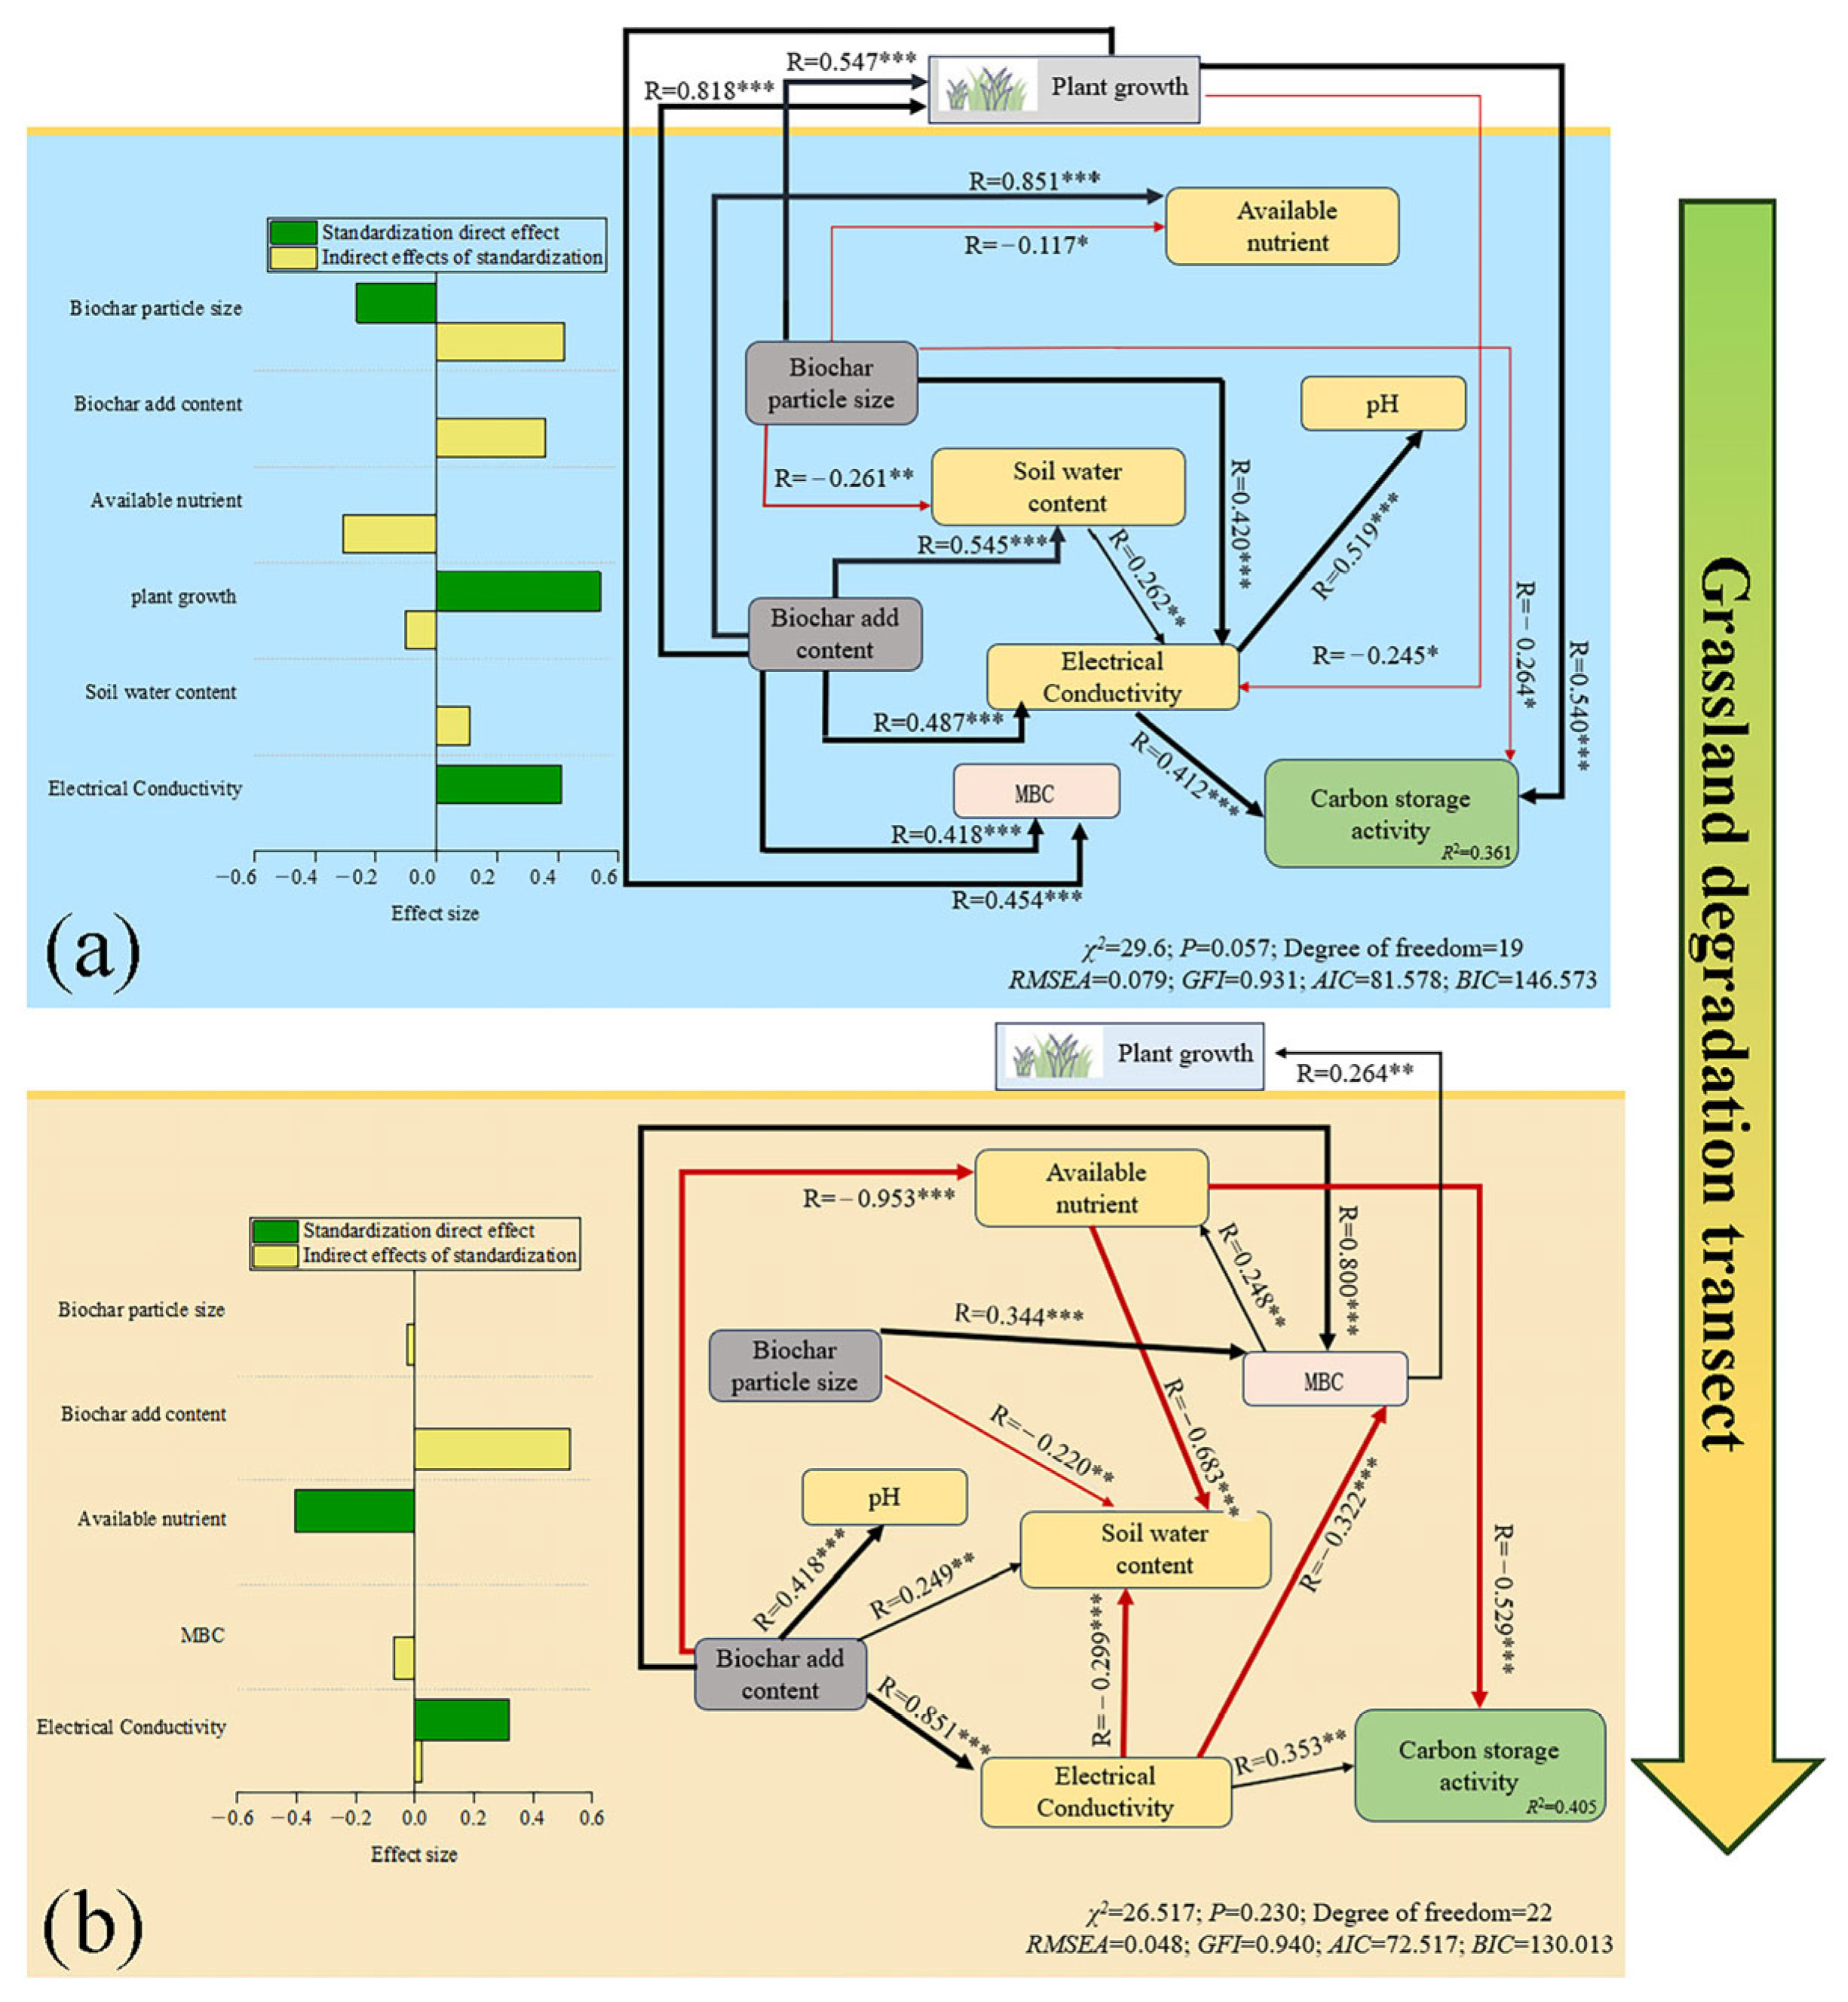
3.4. Relationship of Indicators to Changes in Carbon Pool Stability

Plant growth traits were represented by aboveground biomass dry weight, and the decrease in carbon pool stability was characterized by the increase in carbon pool activity. Meanwhile, principal component analysis was used to participate in the construction of the structural equation model, and available nutrients were represented by available nitrogen, available phosphorus, and available potassium, with PC1 explaining 79.9% of the variance in lightly degraded grassland and 77.6% of the variance in SD areas. Structural equation modeling showed that changes in biochar particle size, plant growth, and soil conductivity had a direct effect on soil carbon pool activity in the LD grassland (Figure 5a), with plant growth and increased conductivity directly decreasing the carbon pool stability of the soil, whereas an increase in the biochar particle size directly increased the soil carbon pool stability. The increase in biochar particle size, the increase in application amount and the increase in soil water content indirectly decreased the soil carbon pool stability, while the elevation of available nutrients and plant growth indirectly increased the soil carbon pool stability.
In the SD grassland (Figure 5b), the changes of available nutrients and soil conductivity had a direct effect on the activity of carbon pools, and the increase in soil conductivity led to the decrease in soil carbon pool stability in both direct and indirect aspects, while the increase in available nutrients directly increased the stability of soil carbon pools, and the increase in the application amount of biochar indirectly led to the decrease in the stability of soil carbon pools, and the increase in the particle size of biochar and the microbial amount of organic carbon indirectly increased the stability of soil carbon pools. The increase in biochar particle size and microbial organic carbon indirectly increased the stability of soil carbon pool.
Soil conductivity is the most influential factor on soil carbon pool stability in both LD grassland and SD grassland, and biochar application amount, particle size, water content and other indexes indirectly affect the stability of soil carbon pool through affecting the soil conductivity, and the influence of biochar addition on the indexes in the LD area is larger than that in the SD area, so it can be seen that the influence of biochar on lightly degraded grassland is larger than that in the SD area.

4. Discussion

4.1. Direct Impact of Biochar on Soil Carbon Pools

The addition of biochar can significantly increase the carbon storage of degraded grasslands, as the addition of biochar inputs a large amount of active organic carbon into the soil, promoting microbial decomposition and nutrient release [6]. The application of biochar to soil can also reduce the bulk density of the soil, improve soil porosity, and increase the soil’s ability to retain water and fertilizers [7], creating a more suitable living environment for plants and soil animals [24]. Our study showed that the addition of biochar had a significant effect on soil quality improvement and plant growth. Biochar promoted the growth of aboveground herbaceous plants, and the increase in plant biomass directly increased the organic carbon storage in the plant carbon pool, and the addition of biochar promoted the growth of plant roots, and the increase in root secretion stimulated the turnover of the soil carbon pool. At the same time, the addition of biochar can promote the growth of plant roots, the increase in root secretion can stimulate the turnover of soil carbon pool, and the root secretion itself has a certain sequestration effect on soil organic carbon [25], and a good root–soil environment can promote the growth activities of soil animals [26], which also indirectly promotes the process of carbon decomposition in the soil [27]; therefore, the addition of biochar has a significant influence on the soil carbon pool.
The easily oxidized organic carbon in the soil carbon pool is the most decomposable organic carbon component. It can directly participate in the process of soil biochemical transformation because it is easily oxidized and easily decomposed by microorganisms, and thus can reflect the changes in soil quality [28]. In this experiment, we found that the F1 component gradually increased with the increase in biochar application, which is because biochar itself contains organic carbon components that are easy to oxidize and decompose. Zhao et al. [29] found that biochar addition can significantly enhance the content of easily oxidized organic carbon in soil, and the increase is proportional to the addition ratio, but with the passage of time due to the gradual decomposition of easily oxidized carbon in soil-by-soil microorganisms, the content of easily oxidized carbon in soil was significantly reduced. The content of easily oxidizable carbon was significantly reduced, and this finding was similar to the present study. Jin et al. [30] concluded that the addition of biochar would increase the active organic carbon content in the soil, which was beneficial to the improvement of soil quality and soil fertility, and the decrease in easy carbon oxides at the later stage indicated that the addition of biochar would be more beneficial to promote the enhancement of the stability of soil organic matter at the later stage of the experiment, which was similar to the findings of this study. The addition of biochar significantly increased soil organic carbon content, but a large number of active organic carbon fractions in the soil will increase the proportion of soil active carbon fractions, which will make the soil activity rise and the stability of the soil carbon pool decline [31], but with the passage of time, and with changes in plant fertility and microbial decomposition, the soil’s very labile organic carbon fractions gradually reduced, and the stability of the soil carbon pool gradually increased again. Microbial biomass carbon is an important indicator for evaluating soil microbiomass activity [32], and in this study, biochar addition significantly increased soil microbial biomass carbon, which indicates that biochar addition can significantly increase soil microbial activity, which may be attributed to the fact that the addition of biochar provides microorganisms with an environment suitable for their survival and provides nutrients for their growth [33], and therefore increases the microbial mass of the soil. Therefore, it can be seen that biochar input can improve the quality of soil in lightly degraded and SD grassland, although biochar addition further increased the pH and EC of degraded grassland, but overall, it showed a positive effect on degraded grassland.
Biochar increased the soil organic carbon content at the same time, but also increased the active carbon pool components in the soil, thus enhancing the soil carbon pool activity [34] and reducing the soil carbon pool stability. As shown by the regression analysis, the addition of biochar led to the replacement of F4 components by F1 components to become the dominant indicator of the change in the stability of the carbon pool. However, with the passage of time, the correlation between the F4 component and organic carbon gradually increased, and the F1 component gradually decreased, which indicated that with the growth of plants, the turnover of carbon pool components and the decomposition of microorganisms, the stability of the soil carbon pool rebounded. The carbon pool stability of grassland soils in the SD area was more affected by the addition of biochar than that in the LD area, probably because the originally good carbon pool stabilization mechanism in the LD area had a certain buffering effect on the increase in active carbon components, which made the carbon pool stability of the LD area higher than that of the SD area in the whole period.

4.2. The Indirect Effects of Biochar and Soil Environmental Feedback

Our results showed that all the biochar addition treatments could provide effective carbon that could be utilized and absorbed by the soil, and promote the virtuous cycle of grassland ecosystems [35]. And from the structural equation modeling, the direct and indirect effects of biochar addition on plants and soil were more significant in the LD area, and the biochar addition had less effect on plants in the SD area, and biochar application was less effective in the SD area, and in the lightly and SD grassland, all the indexes showed the phenomenon of indirectly affecting the activity of carbon pools by affecting the EC, and the previous study showed that there was a complex relationship between the EC of the soil and the stability of carbon pools [35]. Stability has a complex relationship [36]. EC creates a high salinity environment in the soil, which may affect the soil microbial community, soil structure and the morphology of carbon compounds as well as the availability of soil nutrients, thus affecting the stability of the carbon pools [37]. In this study, there was a significant positive correlation between the elevated soil EC and the elevated activity of the soil carbon pools, which indicated that the elevated soil EC decreased the soil carbon pool stability. High EC usually indicates that the soil is more enriched in salts, and a high-salt environment will inhibit the activity of soil microorganisms and plant growth [38], and at the same time, a high-salinity environment may lead to the deterioration of the soil structure [39], which makes the organic carbon more easily exposed to microbial decomposition and physical loss, and thus affects the accumulation and stabilization of soil carbon pools. A soil environment deteriorated by a high-salinity environment will affect the aeration and permeability of the soil [40], thus affecting the fixation and decomposition process of organic carbon, as well as its mobility and solubility [41], altering the chemical structure of the stable organic carbon components, resulting in the transformation of the more stable organic carbon components to components that are easily decomposed, which in turn affects the stability of the organic carbon pool. Therefore, in the process of biochar restoration of degraded grassland, the change of soil EC may be an indicator that needs to be paid attention to, and in the restoration of degraded grassland, monitoring and regulating the change of soil EC has a crucial role in maintaining the stability of soil carbon pool.

5. Conclusions

In the short term, biochar addition significantly increased carbon stocks in grassland ecosystems, but led to an increase in the content of active carbon fractions, which reduced soil carbon pool stability. As plant fertility progressed, soil carbon pool stability rebounded, and among the biochar addition treatments, the T5 (0.25~1 mm/2%) and T9 (1~2 mm/4%) treatments were the optimal solutions for increasing carbon stock in the lightly degraded and heavily degraded areas, respectively. Changes in biochar application and particle size would indirectly affect the activity of soil carbon pools by influencing the changes in soil and plants, and among the factors, soil conductivity was the most critical factor affecting the stability of organic carbon pools in grasslands.

Author Contributions

Data curation, T.K.; Funding acquisition, J.Z. and H.J.; Investigation, M.C., K.L., Y.J. and T.K.; Project administration, J.Z. and H.J.; Software, M.A. and Y.H. (Yang Hu); Supervision, J.Z. and H.J.; Validation, Y.J.; Writing—original draft, Y.H. (Yunpeng Hu); Writing—review and editing, M.A. and Y.T. All authors have read and agreed to the published version of the manuscript.

Funding

This research was funded by Xinjiang Uygur Autonomous Region “Three Rural” Backbone Training Project (2023SNGGGCC002); Xinjiang Uygur Autonomous Region Graduate Innovation Project (XJ2023G150); and National Natural Science Foundation of China (No. 31560171).

Data Availability Statement

The original contributions presented in this study are included in the article; further inquiries can be directed to the corresponding authors.

Conflicts of Interest

The authors declare no conflicts of interest.

References

  1. Kang, L.H.X.; Zhang, Z.; Osbert, J. Grassland ecosystems in China: Review of current knowledge and research advancement. Phil. Trans. R. Soc. B 2007, 362, 997–1008. [Google Scholar] [CrossRef] [PubMed]
  2. Scurlock, J.; Hall, D. The global carbon sink: A grassland perspective. Global Change Biol. 1998, 4, 229–233. [Google Scholar] [CrossRef]
  3. Fang, J.; Geng, X.; Zhang, X.; Shen, H.; Hu, H. How many areas of grasslands are there in China. Chin. Sci. Bull. 2018, 63, 1731–1739. [Google Scholar] [CrossRef]
  4. Shen, H.; Zhu, Y.; Zhao, X.; Di, X.; Gao, S.; Fang, J. Analysis of current grassland resources in China. Chin. Sci. Bull. 2016, 61, 139–154. [Google Scholar]
  5. Bardgett, R.; Bullock, J.; Lavorel, S.; Manning, P.; Schaffner, U.; Ostle, N.; Chomel, M.; Durigan, G.; Fry, E.; Johnson, D.; et al. Combatting global grassland degradation. Nat. Rev. Earth Env. 2021, 2, 720–735. [Google Scholar] [CrossRef]
  6. Ding, X.; Li, G.; Zhang, X.; Li, L.; Wang, X. Biochar application significantly increases soil organic carbon under conservation tillage: An 11-year field experiment. Biochar 2023, 5, 28. [Google Scholar] [CrossRef]
  7. Hu, W.; Zhang, Y.; Rong, X.; Zhou, X.; Fei, J.; Peng, J.; Luo, J. Biochar and organic fertilizer applications enhance soil functional microbial abundance and agroecosystem multifunctionality. Biochar 2024, 6, 3. [Google Scholar] [CrossRef]
  8. Qambrani, N.; Rahman, M.; Won, S.; Shim, A.; Ra, C. Biochar properties and eco-friendly applications for climate change mitigation, waste management, and wastewater treatment: A review. Renew Sustain. Energy Rev. 2017, 79, 255–273. [Google Scholar] [CrossRef]
  9. Kuzyakov, Y.; Subbotina, I.; Chen, H.; Bogomolova, I.; Xu, X. Black carbon decomposition and incorporation into soil microbial biomass estimated by 14C labeling. Soil Biol. Biochem. 2008, 41, 210–219. [Google Scholar] [CrossRef]
  10. Nguyen, T.; Xu, C.; Tahmasbian, I.; Che, R.; Xu, Z.; Zhou, X.; Wallace, H.; Bai, S. Effects of biochar on soil available inorganic nitrogen: A review and meta-analysis. Geoderma 2017, 288, 79–96. [Google Scholar] [CrossRef]
  11. Luo, Y.; Durenkamp, M.; Nobili, M.; Lin, Q.; Devonshire, B.; Brookes, P. Microbial biomass growth, following incorporation of biochars produced at 350 °C or 700 °C, in a silty-clay loam soil of high and low pH. Soil Biol. Biochem. 2013, 57, 513–523. [Google Scholar] [CrossRef]
  12. Reed, E.; Chadwick, D.; Hill, P.; Jones, D. Critical comparison of the impact of biochar and wood ash on soil organic matter cycling and grassland productivity. Soil Biol. Biochem. 2017, 110, 134–142. [Google Scholar] [CrossRef]
  13. Han, F.; Ren, L.; Zhang, X. Effect of biochar on the soil nutrients about different grasslands in the Loess Plateau. Catena 2016, 137, 554–562. [Google Scholar] [CrossRef]
  14. Biederman, L.; Phelps, J.; Ross, B.; Polzin, M.; Harpole, W. Biochar and manure alter few aspects of prairie development: A field test. Agric. Ecosyst. Environ. 2017, 236, 78–87. [Google Scholar] [CrossRef]
  15. Gebhardt, M.; Fehmi, J.; Rasmussen, C.; Gallery, R. Soil amendments alter plant biomass and soil microbial activity in a semidesert grassland. Plant Soil 2017, 419, 53–70. [Google Scholar] [CrossRef]
  16. Wei, Y.; Hu, Y.; Liu, Y.; Gong, Y.; Zhang, W.; Liu, W.; Ailiewutalipu, A. A study on soil biological properties of artificial grassland over different cultivation times in Bayanbulak. Acta Pratacult. Sin. 2010, 19, 218–226. [Google Scholar]
  17. Lu, J.; Hu, Y.; Yue, P.; Li, K. Assessment on the health of alpine steppe in Bayinbuluk based on CVOR index. Arid. Zone Res. 2017, 34, 862–869. [Google Scholar] [CrossRef]
  18. Dong, C.; Wang, W.; Liu, H.; Xu, X.; Zeng, H. Temperate grassland shifted from nitrogen to phosphorus limitation induced by degradation and nitrogen deposition: Evidence from soil extracellular enzyme stoichiometry. Ecol Indic. 2019, 101, 453–464. [Google Scholar] [CrossRef]
  19. Hu, Y.; Abulaizi, M.; Tian, Y.; Chen, M.; Jia, H.; Zhou, J.; Kou, T.; Jia, Y. Effects of Short-term Biochar Addition of Cotton Straw on the Growth of Carex liparocarpos and Festuca arundinacea Schreb in Alpine Meadow. J. Agro Environ. Sci. 2024, 43, 1–12. Available online: http://kns.cnki.net/kcms/detail/12.1347.S.20240528.1251.002.html (accessed on 29 May 2024).
  20. Yu, P.; Li, Y.; Liu, S.; Ding, Z.; Zhang, A.; Tang, X. The quantity and stability of soil organic carbon following vegetation degradation in a salt-affected region of Northeastern China. Catena 2022, 211, 105984. [Google Scholar] [CrossRef]
  21. Lin, Q. Evaluation of the Methods for Measuring Soil Microbial Biomass. J. China Agric. Univ. 1997, (Suppl. S2), 1–11. Available online: https://kns.cnki.net/kcms2/article/abstract?v=Bo5Zm1RyAikijGtrdCuSY0-erNfikOitCsKG_pmTPd_idgnSCy3PCwKrvuIrfFRlRGTp46E7E1GUct4QBnpSwUohTQ0nn-sav73c4eygy4bVs1YN56WC6i2qQkRnWrMEGbFQE-pYob9C1I_dEF43N0E1D3VzvuL0Kw4oC7hMfH_Z-MXDbYTubDlaadOZlFa3&uniplatform=NZKPT&language=CHS (accessed on 30 April 2025).
  22. Hu, Y.; Yu, G.; Zhou, J.; Li, K.; Chen, M.; Abulaizi, M.; Cong, M.; Yang, Z.; Zhu, X.; Jia, H. Grazing and reclamation-induced microbiome alter ations drive organic carb on stability with in soil aggregates in alpine steppes. Catena 2023, 231, 107306. [Google Scholar] [CrossRef]
  23. Li, B.; Guo, Y.; Liang, F.; Liu, W.; Wang, Y.; Cao, W.; Song, H.; Chen, J.; Guo, J. Global integrative meta-analysis of the responses in soil organic carbon stock to biochar amendment. J. Environ. Manag. 2024, 351, 119745. [Google Scholar] [CrossRef] [PubMed]
  24. Hossain, Z.; Bahar, M.; Sarkar, B.; Donne, S.; Ok, Y.; Palansooriya, K.; Kirikham, M.; Chowdhury, S.; Bolan, N. Biochar and its importance on nutrient dynamics in soil and plant. Biochar 2020, 2, 379–420. [Google Scholar] [CrossRef]
  25. Panchal, P.; Preece, C.; Peñuelas, J.; Giri, J. Soil carbon sequestration by root exudates. Trends Plant Sci. 2022, 27, 749–757. [Google Scholar] [CrossRef]
  26. Zhou, Z.; Lu, J.; Preiser, J.; Widyastuti, R.; Scheu, S.; Potapov, A. Plant roots fuel tropical soil animal communities. Ecol. Lett. 2023, 26, 742–753. [Google Scholar] [CrossRef]
  27. Kumar, S.; Nakajima, T.; Mbonimpa, E.; Gautam, S.; Somireddy, U.; Kadono, A.; Rafique, R.; Fausey, N. Long-term tillage and drainage influences on soil organic carbon dynamics, aggregate stability and corn yield. Soil Sci. Plant Nutr. 2014, 60, 108–118. [Google Scholar] [CrossRef]
  28. Meng, Y. Effects of Biochar on Soil Organic Carbon Pools in Phaeozem. Northeast. Agric. Univ. 2018, 40, 1340–1347. [Google Scholar]
  29. Zhao, S.; Yu, X.; Li, Z.; Yan, Y.; Zhang, X.; Wang, X.; Zhang, A. Effects of Biochar Pyrolyzed at Varying Temperatures on Soil Organic Carbon and Its Components: Influence on the Soil Active Organic Carbon. Environ. Sci. 2017, 38, 333–342. [Google Scholar] [CrossRef]
  30. Hua, L.; Jin, S.; Tang, Z. Effect of Bio-charcoal on Release of Carbon Dioxide in Soil. J. Anhui Agric. Sci. 2012, 40, 6501–6503, 6540. [Google Scholar] [CrossRef]
  31. Hu, Y.; Chen, M.; Yang, Z.; Abulaizi, M.; Tian, Y.; Jia, H.; Kou, T.; Jia, Y. Effect of Snow Removal on Stability of Soil Organic Carbon Pool During Freeze-Thaw Period in Bayinbuluk Alpine Wetland. Bull. Soil Water Conserv. 2024, 44, 326–334. [Google Scholar] [CrossRef]
  32. Soong, J.; Fuchslueger, L.; Marañon-Jimenez, S.; Torn, M.; Janssens, I.; Penuelas, J.; Richter, A. Microbial carbon limitation: The need for integrating microorganisms into our understanding of ecosystem carbon cycling. Global Change Biol. 2020, 26, 1953–1961. [Google Scholar] [CrossRef] [PubMed]
  33. Pathy, A.; Ray, J.; Paramasivan, B. Biochar amendments and its impact on soil biota for sustainable agriculture. Biochar 2020, 2, 287–305. [Google Scholar] [CrossRef]
  34. Yang, S.; Tang, F.; Yang, H.; Zhang, Y.; Peng, X.; Huang, Y. Effects of peach tree planting patterns on soil organic carbon fractions and carbon pool management index in southern Yunnan. Acta Ecol. Sin. 2023, 43, 14. [Google Scholar]
  35. Jeffery, S.; Voorde, T.; Harris, W.; Mommer, L.; Groenigen j Deyn, G.; Ekelund, F.; Briones, M.; Bezemer, T. Biochar application differentially affects soil micro-, meso-macro-fauna and plant productivity within a nature restoration grassland. Soil Biol. Biochem. 2022, 174, 108789. [Google Scholar] [CrossRef]
  36. Wu, H.; Cui, H.; Fu, C.; Li, R.; Qi, F.; Liu, Z.; Yang, G.; Xiao, K.; Qiao, M. Unveiling the crucial role of soil microorganisms in carbon cycling: A review. Sci. Total Environ. 2023, 909, 168627. [Google Scholar] [CrossRef]
  37. Ma, H.; Li, X.; Ma, X.; Gong, L. Characteristics and Driving Factors of Soil Organic Carbon Fractions under Different Vegetation Types of the mid-Northern Piedmont of the Tianshan Mountains, Xinjiang. Ecol. Environ. Sci. 2022, 31, 1124–1131. [Google Scholar] [CrossRef]
  38. Xu, S.; Zhao, R.; Sun, J.; Sun, Y.; Xu, G.; Wang, F. Microplastics change soil properties, plant performance, and bacterial communities in salt-affected soils. J. Hazard. Mater. 2024, 471, 134333. [Google Scholar] [CrossRef]
  39. Xing, J.; Li, X.; Li, Z.; Wang, X.; Hou, N.; Li, D. Remediation of soda-saline-alkali soil through soil amendments: Microbially mediated carbon and nitrogen cycles and remediation mechanisms. Sci. Total Environ. 2024, 924, 171641. [Google Scholar] [CrossRef]
  40. Song, X.; Wang, P.; Zwieten, L.; Wang, H.; Li, X.; Cheng, K.; Yang, Y.; Wang, M.; Liu, T.; Li, F. Towards a better understanding of the role of Fe cycling in soil for carbon stabilization and degradation. Carbon Res. 2022, 1, 5. [Google Scholar] [CrossRef]
  41. Belenguer-Manzanedo, M.; Rochera, C.; Alcaraz, C.; Martínez-Eixarch, M.; Camacho, A. Disentangling drivers of soil organic carbon storage in deltaic rice paddies from the Ebro Delta. Catena 2023, 228, 107131. [Google Scholar] [CrossRef]
Figure 1. Experimental design.
Land 14 01018 g001
Figure 2. Dynamic changes in SOC content in field in situ experiments. Different lowercase letters represent significant differences (p < 0.05) between different treatments during the same period, n = 3, the same below. T1: 0~0.25 mm/1%; T2: 0~0.25 mm/2%; T3: 0~0.25 mm/4%; T4: 0.25~1 mm/1%; T5: 0.25~1 mm/2%; T6: 0.25~1 mm/4%; T7: 1~2 mm/1%; T8: 1~2 mm/2%; T9: 1~2 mm/4%; CK: No biochar added.
Land 14 01018 g002
Figure 3. Relationship between organic carbon components and soil organic carbon in LD areas during field in situ test.
Land 14 01018 g003
Figure 4. Relationship between organic carbon components and soil organic carbon in SD areas during field in situ test.
Land 14 01018 g004
Figure 5. Structural equation modeling of biochar addition and plant, soil, and carbon pool activity in different ((a) lightly degraded area; (b) heavily degraded area) degraded area. *: p < 0.05; **: p < 0.01; ***: p < 0.001.
Land 14 01018 g005
Table 1. Overview of degraded areas.
Degradation LevelDominant SpeciesPioneer SpeciesDegradation Indicator SpeciesSoil Organic CarbonTotal NitrogenSoil Sand ContentGrassland Degradation Index
Relative CoverRelative CoverRelative Cover
ND0.610.270.123.550.47120.96
LD0.440.350.212.30.31340.68
SD0010.040.09760.25
Table 2. Physical and chemical properties of soil in different degraded areas.
pHElectrical Conductivity
(EC)
Soil Water Content
(WC)
Soil Organic Carbon
(SOC)
Total Nitrogen
(TN)
Available Nitrogen
(AN)
Available Phosphorus
(AP)
Available Potassium
(AK)
(μS/cm)(%)(g/kg)(g/kg)(mg/kg)(mg/kg)(mg/kg)
ND7.26 ± 0.18 b619.36 ± 8.15 a54.75 ± 0.72 a35.48 ± 1.70 a4.67 ± 0.21 a66.93 ± 0.77 a18.14 ± 1.21 b236.67 ± 12.34 a
LD7.48 ± 0.05 b513.87 ± 24.27 b30.85 ± 1.97 b23.42 ± 0.35 b3.13 ± 0.10 b41.99 ± 2.26 b21.87 ± 0.69 a190.93 ± 9.95 b
SD8.34 ± 0.09 a282.45 ± 8.46 c10.74 ± 0.53 c4.01 ± 0.08 c0.94 ± 0.03 c19.77 ± 1.28 c6.25 ± 1.13 c79.03 ± 8.10 c
Note: Different lowercase letters in the same column represent significant differences between treatments (p < 0.05), n = 3, below.
Table 3. Design of biochar addition treatment.
Application Rate and Particle Size1%2%4%0
0~0.25 mmT1T2T3CK
0.25~1 mmT4T5T6
1~2 mmT7T8T9
Table 4. Incremental effect of biochar addition on carbon storage of degraded grasslands.
Soil Organic Carbon Accumulation
(kg/m2)
Above-Ground Plant Organic Carbon Accumulation
(kg/m2)
Grassland Organic Carbon Stocks
(kg/m2)
Carbon Stock Enhancement
(kg/m2)
LDSDLDSDLDSDLDSD
T14.041.380.060.014.101.241.860.78
T24.141.230.070.014.201.561.960.64
T33.991.550.060.014.050.731.810.95
T43.50.720.060.013.561.011.320.12
T54.21.000.070.014.271.82.030.40
T63.431.790.070.013.510.691.271.19
T73.520.690.080.013.600.771.360.09
T83.540.760.070.013.610.881.370.16
T93.370.870.090.083.462.571.220.28
ND2.502.500.08<0.012.570.610.331.97
TCK2.190.600.050.052.242.24
Table 5. Soil carbon component content in LD areas of field in situ experiments (g/kg).
T1T2T3T4T5T6T7T8T9CK
Apr.F15.43 ± 0.23 a5.23 ± 0.07 a5.61 ± 0.09 a5.45 ± 0.16 a5.61 ± 0.07 a5.64 ± 0.20 a5.74 ± 0.15 a5.38 ± 0.72 a5.84 ± 0.27 a5.41 ± 0.17 a
F22.05 ± 0.15 a2.23 ± 0.22 a2.19 ± 0.18 a2.5 ± 0.26 a2.38 ± 0.24 a2.32 ± 0.23 a2.28 ± 0.17 a2.24 ± 0.2 a2.11 ± 0.22 a2.4 ± 0.1 a
F30.91 ± 0.15 a0.97 ± 0.11 a1.17 ± 0.16 a1.03 ± 0.33 a0.94 ± 0.23 a1.05 ± 0.09 a1.06 ± 0.21 a1.02 ± 0.21 a0.94 ± 0.07 a1.17 ± 0.11 a
F414.85 ± 0.37 a14.29 ± 0.26 a14.85 ± 0.47 a14.63 ± 0.72 a14.12 ± 0.79 a13.91 ± 0.78 a13.94 ± 1.49 a14.3 ± 0.66 a14.03 ± 0.76 a14.43 ± 0.49 a
Jul.F113.52 ± 1.24 bc17.29 ± 0.65 ab18.92 ± 1.47 a14.7 ± 1 bc13.37 ± 1.45 bc16.68 ± 1.38 ab11.36 ± 1.68 c13.52 ± 1.19 bc13.75 ± 0.53 bc5.51 ± 0.46 d
F23.94 ± 0.52 bc5.56 ± 0.65 ab6.97 ± 0.55 a5.22 ± 0.53 b3.07 ± 0.56 c5.46 ± 0.86 ab2.61 ± 0.19 c2.82 ± 0.11 c4.36 ± 0.75 bc2.63 ± 0.16 c
F31.52 ± 0.58 bc3.08 ± 1.07 abc3.21 ± 0.47 ab3.76 ± 0.59 a1.55 ± 0.47 bc2.13 ± 0.76 abc1.93 ± 0.41 abc1.81 ± 0.82 abc1.96 ± 0.08 abc1.1 ± 0.08 c
F418.95 ± 1.42 abc19.34 ± 1.9 abc18.52 ± 0.57 bc16.54 ± 0.85 c15.97 ± 0.9 c23.06 ± 2.73 a18.51 ± 0.85 bc21.44 ± 1.14 ab21.28 ± 0.95 ab11.51 ± 1.38 d
Sep.F113.63 ± 0.86 d19.72 ± 1.23 abc20.2 ± 1.5 ab15.28 ± 1.37 cd13.03 ± 1.35 d19.57 ± 0.89 abc15.72 ± 1.74 bcd19.18 ± 2 abc20.49 ± 1.89 abc6.07 ± 0.31 e
F24.4 ± 0.35 b6.87 ± 1.03 a5.79 ± 0.13 ab5.58 ± 0.79 ab4.91 ± 0.79 ab6.76 ± 0.51 a4.15 ± 0.68 b4.6 ± 0.67 b6.12 ± 0.7 ab1.53 ± 0.16 c
F32.52 ± 0.09 abc3.14 ± 0.46 ab3.38 ± 0.36 a1.82 ± 0.19 c2.93 ± 0.42 ab1.9 ± 0.11 c2.82 ± 0.14 ab2.38 ± 0.2 bc2.8 ± 0.24 ab0.9 ± 0.12 d
F412.09 ± 1.7 de16.86 ± 1.65 bc11.19 ± 0.99 e16.41 ± 1.78 bcd22.11 ± 2.11 a17.3 ± 1.24 b12.2 ± 1.49 cde16.01 ± 0.92 bcd15.32 ± 0.84 bcde10.64 ± 1.05 e
Nov.F112.86 ± 1.86 b15.59 ± 2.6 ab16.9 ± 1.28 ab13.76 ± 1.51 ab18.38 ± 1.16 a15.63 ± 0.91 ab14.55 ± 0.52 ab15.01 ± 1.84 ab14.24 ± 0.76 ab6.07 ± 0.22 c
F24.27 ± 0.43 a5.46 ± 0.48 a5.51 ± 1.32 a3.4 ± 0.21 a4.53 ± 1.09 a5.96 ± 1.02 a4.19 ± 0.96 a5.4 ± 2.18 a5.21 ± 0.15 a2.7 ± 0.17 a
F31.11 ± 0.56 bc2.5 ± 0.35 a1.97 ± 0.32 ab1.62 ± 0.23 abc1.58 ± 0.31 abc1.28 ± 0.13 bc1.47 ± 0.31 bc1.95 ± 0.13 ab1.78 ± 0.36 abc0.87 ± 0.08 c
F418.63 ± 1.3 a15.18 ± 1.87 ab15.15 ± 0.69 ab14.92 ± 1.88 ab16.4 ± 2.62 ab13.13 ± 1.47 bc15.24 ± 1.79 ab12.5 ± 0.37 bc12.16 ± 1.16 bc8.58 ± 1.18 c
Note: Different lowercase letters represent significant differences between different components (p < 0.05), n = 3, the same below. T1: 0~0.25 mm/1%; T2: 0~0.25 mm/2%; T3: 0~0.25 mm/4%; T4: 0.25~1 mm/1%; T5: 0.25~1 mm/2%; T6: 0.25~1 mm/4%; T7: 1~2 mm/1%; T8: 1~2 mm/2%; T9: 1~2 mm/4%; CK: No biochar added, F1: very labile organic carbon fraction, F2: labile organic carbon fraction, F3: less labile organic carbon fraction, and F4: recalcitrant organic carbon fraction.
Table 6. Carbon component content of soil in SD areas through field in situ testing (g/kg).
T1T2T3T4T5T6T7T8T9CK
Apr.F11.16 ± 0.1 a1.16 ± 0.12 a1.19 ± 0.19 a1.44 ± 0.05 a1.35 ± 0.01 a1.54 ± 0.02 a1.4 ± 0.15 a1.25 ± 0.14 a1.34 ± 0.11 a1.43 ± 0.09 a
F20.56 ± 0.0 de0.59 ± 0.05 cde0.49 ± 0.06 e0.63 ± 0.02 bcd0.68 ± 0.02 abc0.73 ± 0.03 ab0.78 ± 0.05 a0.62 ± 0.04 bcd0.65 ± 0.03 bcd0.74 ± 0.01 ab
F30.43 ± 0.05 ab0.42 ± 0.05 b0.43 ± 0.08 ab0.49 ± 0.04 ab0.6 ± 0.05 a0.57 ± 0.02 ab0.54 ± 0 ab0.51 ± 0.05 ab0.51 ± 0.09 ab0.59 ± 0.02 ab
F41.04 ± 0.11 ab0.96 ± 0.05 b0.99 ± 0.03 ab1.2 ± 0.16 ab1.4 ± 0.15 a1.36 ± 0.17 ab1.33 ± 0.15 ab1.33 ± 0.14 ab1.3 ± 0.14 ab1.26 ± 0.03 ab
Jul.F15.09 ± 0.35 b6.16 ± 0.41 ab6.86 ± 0.87 a3.37 ± 0.2 c5.33 ± 0.42 b7.3 ± 0.64 a3.21 ± 0.22 c2.65 ± 0.24 cd5.18 ± 0.79 b1.31 ± 0.09 d
F21.42 ± 0.13 bc2.03 ± 0.08 a1.76 ± 0.33 ab0.94 ± 0.03 cde1.38 ± 0.15 bcd2.08 ± 0.23 a0.89 ± 0.12 de0.65 ± 0.09 e1.29 ± 0.06 bcd0.59 ± 0.06 e
F30.56 ± 0.11 abcd0.56 ± 0.21 abcd0.82 ± 0.2 ab0.49 ± 0.1 abcd0.92 ± 0.11 a0.8 ± 0.15 ab0.47 ± 0.04 bcd0.29 ± 0.07 cd0.66 ± 0.12 abc0.14 ± 0.06 d
F42.77 ± 0.19 bc3.41 ± 0.73 ab3.03 ± 0.44 ab1.75 ± 0.1 cde2.71 ± 0.19 bc3.91 ± 0.37 a1.89 ± 0.34 cde1.53 ± 0.16 de2.57 ± 0.23 bcd1.47 ± 0.09 e
Sep.F14.73 ± 0.31 c5.19 ± 0.36 c7.94 ± 0.7 a3.2 ± 0.5 d4.52 ± 0.22 c6.78 ± 0.34 b3.14 ± 0.35 d2.48 ± 0.39 d4.7 ± 0.05 c1.25 ± 0.09 e
F21.46 ± 0.27 cde1.71 ± 0.16 abc2.27 ± 0.41 a1.08 ± 0.2 def1.65 ± 0.14 bcd2.17 ± 0.1 ab0.89 ± 0.12 efg0.8 ± 0.06 fg1.47 ± 0.08 cde0.35 ± 0.04 g
F30.57 ± 0.13 bc0.73 ± 0.1 bc1.22 ± 0.21 a0.34 ± 0.03 cd0.52 ± 0.12 bc0.76 ± 0.19 b0.34 ± 0.04 cd0.44 ± 0.08 bcd0.72 ± 0.1 bc0.13 ± 0.02 d
F42.52 ± 0.35 ab3.5 ± 1.53 a1.97 ± 0.26 ab1.71 ± 0.37 ab2.64 ± 0.36 ab3.56 ± 0.37 a1.76 ± 0.24 ab1.53 ± 0.27 b2.45 ± 0.28 ab1.49 ± 0.1 b
Nov.F14.43 ± 0.57 c4.6 ± 0.42 bc5.68 ± 0.39 ab2.32 ± 0.42 de2.94 ± 0.43 de6.07 ± 0.6 a2.37 ± 0.27 de2.67 ± 0.31 de3.13 ± 0.13 d1.67 ± 0.11 e
F21.24 ± 0.2 bc1.11 ± 0.14 bcd1.32 ± 0.13 b0.76 ± 0.17 de0.88 ± 0.14 cde2.05 ± 0.03 a0.69 ± 0.04 e0.81 ± 0.07 de1.09 ± 0.01 bcd0.59 ± 0.01 e
F30.46 ± 0.03 ab0.24 ± 0.06 bc0.36 ± 0.12 abc0.32 ± 0.03 bc0.34 ± 0.08 bc0.59 ± 0.13 a0.38 ± 0.03 abc0.41 ± 0.08 abc0.44 ± 0.07 abc0.2 ± 0.02 c
F43.7 ± 0.07 ab3.24 ± 0.46 b4.06 ± 0.4 a1.69 ± 0.12 c3.17 ± 0.26 b4.43 ± 0.21 a1.49 ± 0.31 c1.69 ± 0.1 c1.76 ± 0.21 c1.38 ± 0.06 c
Different lowercase letters represent significant differences between different components (p < 0.05), n = 3, the same below. Note: T1: 0~0.25 mm/1%; T2: 0~0.25 mm/2%; T3: 0~0.25 mm/4%; T4: 0.25~1 mm/1%; T5: 0.25~1 mm/2%; T6: 0.25~1 mm/4%; T7: 1~2 mm/1%; T8: 1~2 mm/2%; T9: 1~2 mm/4%; CK: No biochar added, F1: very labile organic carbon fraction, F2: labile organic carbon fraction, F3: less labile organic carbon fraction, and F4: recalcitrant organic carbon fraction.
Disclaimer/Publisher’s Note: The statements, opinions and data contained in all publications are solely those of the individual author(s) and contributor(s) and not of MDPI and/or the editor(s). MDPI and/or the editor(s) disclaim responsibility for any injury to people or property resulting from any ideas, methods, instructions or products referred to in the content.

