Abstract
The study assesses coastal evolution and the vulnerability of archaeological sites in Southeastern Crete. Shoreline dynamics since the 1940s were examined through the interpretation of high-resolution aerial photographs and satellite images. A set of climatic variables, as well as data on geomorphological and geological factors obtained from fieldwork, images interpretation, archives, and open-source datasets, were analysed. The influence of these variables on coastal dynamics was evaluated using regression analysis, correlating their spatial distribution with rates of shoreline retreat/advance. Based on this, variables for the Coastal Vulnerability Index (CVI) calculation were selected, and the weighting for the weighted CVI (CVIw) was determined. The classical CVI identified 13.7% of the study area’s coastline as having very high vulnerability to coastal hazards, 15.5% as highly vulnerable. In the case of CVIw, 17.5% of the coasts of the area were classified as having very high level of vulnerability, 39.6%—as highly vulnerable. Both approaches, the CVI and the weighted CVI, highlighted the most vulnerable areas in the north, east, and southeast of Koufonisi Island, as well as the north and east of Chrisi Island. The least vulnerable areas include the wide beaches in enclosed bays, such as Gra Lygia, Ierapetra, and Ferma, along with rocky capes east of Ierapetra. Among the five archaeological sites examined, two (Lefki Roman Town and Stomio Roman Villa) fall within zones of high or very high coastal vulnerability. This study provides the first in-depth analysis of coastal dynamics and vulnerability of Southeastern Crete, a region with significant cultural heritage yet previously under-researched.
1. Introduction
Coastal areas are among the most densely populated on Crete and serve as major tourist destinations, attracting a substantial number of visitors annually, a trend expected to increase [1]. Additionally, a noteworthy proportion of archaeological sites are concentrated within the coastal zone of the island [2]. Coastal processes, such as coastal erosion and flooding, pose potential threat to both infrastructure and cultural heritage, particularly in the Mediterranean region [3]. Across the European Mediterranean coast, more than 18% of its total length is affected by erosion [4]. In Greece, over 28% of the coastline is undergoing erosion, with sandy and pebble beaches being the most affected [5,6]. Future projections indicate that under high IPCC estimates, nearly 99% of these beaches could retreat by more than 20% of their maximum width, with approximately 72% experiencing a retreat exceeding 50%, and 20% potentially disappearing entirely [7].
A comprehensive understanding of coastal processes is essential for effective coastal management and the mitigation of climate change and sea-level rise impacts. Numerous studies on coastal dynamics have being conducted worldwide at global, regional and local scales. Rosendahl Appelquist and Halsnæs [8], introduced the Coastal Hazard Wheel (CHW), a tool designed for coastal hazard assessment and management. This system automates the evaluation of primary coastal hazards (including ecosystem disruption, gradual inundation, saltwater intrusion, erosion, and flooding), for selected coastal locations worldwide. However, a key limitation of this system lies in the low resolution and reliability of input data, which affects the accuracy of its output results. In a complementary effort, Prémaillon et al. [9] developed the GlobR2C2 (Global Recession Rates of Coastal Cliffs), compiling data from various local studies to evaluate links between erosion rates and marine, climatic, and lithological factors.
Studies of coastal processes aimed at understanding the underlying mechanisms of erosional processes, the influence of various natural and anthropogenic drivers on them, and forecasting of coastal evolution, often rely on numerical simulations and analyses considering multiple oceanographic, meteorological, geomorphological, and geological parameters [10,11,12,13]. Other studies assess coastal vulnerability without complex modelling by combining available meteorological, oceanographic, and geological data [3,9,14,15].
One widely adopted method for assessing vulnerability to coastal processes, such as sea-level rise, erosion, or inundation, is the Coastal Vulnerability Index (CVI). Initially developed and applied by Gornitz et al. [16] for the eastern U.S. coast of, the CVI has since been widely applied by coastal scientists worldwide [17,18,19,20], and particularly in the Mediterranean region [21,22,23], including Greece [24,25,26], and Crete [7,11]. The CVI integrates multiple parameters affecting coastal vulnerability, with included variables varying depending on the study area, scope, and data availability.
Typically, CVI and its variations incorporate 6–10 variables, including various geomorphological (coastal slope, cliff height, beach width, exposure to winds and waves), geological (resistance of sediments composing cliff/beach to wave erosion, tectonic uplift/subsidence), oceanographic (sea-level change, wave height, tidal range), and meteorological (wind patterns, temperature) factors. Rates of historical shoreline retreat/advance are also considered. CVI has served as the foundation for the development of various adapted coastal vulnerability indices tailored to specific regions and research objectives. Some studies apply a weighted CVI, which assigns different weights to variables, usually based on expert assessments [17,18,27,28].
Limited research has been conducted regarding the correlations between various factors and rates of coastal retreat, yielding somewhat contradictory findings [9,29,30,31]. Puig et al. [29] investigated the impact of storms on coastal retreat in Spain, finding a limited dependence between storm events and coastal erosion rates. According to the analysis of factors controlling erosion processes by Jarmalavičius et al. [30] the scale of erosion is primarily influenced by coastal morphology and sand composition rather than storm parameters. Asoni et al. [31] correlated change over time rates of coastal retreat, geotechnical rocks properties, and precipitation in the UK, and identified that erosion was higher during periods of prolonged increased precipitation. Based on the compiled database, containing 58 publications, Prémaillon et al. [9] merged rocks by their resistance to coastal erosion and revealed that among climatic factors, only the number of frost days for weak rocks exhibited a significant correlation with erosion rates, while other climatic and marine forcings did not demonstrate a clear or significant relationship with cliff retreat rates.
Coastal vulnerability assessments have been applied to archaeological sites across various regions of Europe [32,33,34] and the United States [19], utilising diverse methodologies tailored to regional contexts. The use of Copernicus Climate Change Service data has facilitated the evaluation of UNESCO World Heritage Sites’ vulnerability to projected sea-level rise in the Mediterranean [35]. However, no comprehensive study has yet examined coastal hazards specifically affecting the archaeological sites of Southeastern Crete.
The purpose of the present research is to assess the vulnerability of archaeological sites of Southeastern Crete to coastal hazards. Following the Intergovernmental Panel on Climate Change definition [36], vulnerability is “the degree to which a system is susceptible to and unable to cope with adverse effects of climate change, including climate variability and extremes”. In this study, coastal vulnerability is defined as the susceptibility of coasts to erosion, considering only natural factors. Social and infrastructural factors were not included in the CVI calculation but were treated as elements exposed to erosion. The calculated CVI values were specifically applied to archaeological sites located within the study area’s coastal zone to assess the potential impact of coastal hazards on these cultural heritage sites. Additionally, weighting was performed based on the results of correlation of spatial distribution of the factors of coastal dynamics with historical shoreline changes.
2. The Study Area
The study focuses on the southeastern coast of Crete, located in the eastern Mediterranean Sea. Specifically, it examines three key areas: (1) a 20 km length section of the coast of Crete near Ierapetra; (2) the coast of Koufonisi island (14 km long), located approximately 35 km southeast of Ierapetra; and (3) the coast of the island of Chrisi (14.5 km long), located approximately 15 km south of Ierapetra (Figure 1). Five major archaeological sites within these areas are considered (Figure 1): the Roman Villa of Stomio, the Venetian Fort of Ierapetra (Kales), the Roman Fish Tank of Ferma in the area of Ierapetra, the Roman Town of Lefki on Koufonisi, and the Minoan Settlement of Chrisi on Chrisi.

Figure 1.
Location of the areas of study and archaeological sites (a) local scale, (b) regional scale.
2.1. Geology and Tectonic Setting
Crete is a highly tectonically active region, situated within the fore-arc of the Hellenic subduction zone, which formed due to the convergence of the African and Eurasian tectonic plates commencing in the Late Jurassic period [37,38]. This region is characterised by ongoing tectonic activity, as evidenced by recent ground deformations, with relative movements between the Aegean microplate and Africa exceeding 3–4 cm per year [39,40]. Over the past decades, numerous studies have examined the coastal areas of Crete, primarily to constrain its vertical tectonic motion [41,42]. The western part of Crete is characterised by a co-seismic uplift occurred during the AD 365 earthquake, up to 9 m, while the eastern part of the island remained stable during that event [43,44]. The area of study predominantly lies within the Ierapetra sedimentary basin filled with Miocene marls and Quaternary alluvium-marine deposits [43,45]. Pre-Neogene Alpine basement outcrops are found only on Chrisi Island. Despite the high seismic activity of the Aegean region no significant tsunamis have impacted the Crete island apart from a few micro-tsunamis recorded like the one back to 2020 [46]. The amplitudes (≤35 cm) were not significant enough to cause notable shoreline change. The studies on tsunami hazards state that there is no reliable basis for a probabilistic assessment of this hazard for the region, especially for the shallow depth water (less than 50 m) [46,47,48].
2.2. Climate and Sea State
Crete is located within two climatic zones: the Mediterranean and the North African. Its climate is characterised by hot, arid summers and mild, rainy winters [49]. Archival data from the weather station in Ierapetra [50] indicate an average daily temperature of 23 °C in July and 9 °C in January. Average precipitation is 0.2 mm in July and 100 mm in January, with an annual average of 440 mm. During summer, prevailing winds in the region originate from the northwest (NW) and west (W), while in winter, they typically come from the west (W) and north-northwest (NNW). Mean wind speeds are approximately 3 m/s in Ierapetra and 3.5 m/s on the islands during summer, increasing to around 4 m/s in Ierapetra and 4.5 m/s on Chrisi, and 5 m/s on Koufonisi during winter. The mean significant wave height is approximately 0.45 m in the Ierapetra area, 0.6 m in Chrisi, and 0.7 m in Koufonisi in summer, rising to approximately 1 m, 1.1 m, and 1.2 m, respectively, in winter [51]. Finally, the mean tide range is negligible in the region (<10 cm), like in most of the Mediterranean region [52].
2.3. Archaeological Settings
The island boasts a plethora of significant archaeological sites, reflecting its rich tangible heritage. Approximately thirty archaeological sites of various epochs are located in the southeastern region of Crete [2,53,54], however this study is focused on the five major ones (Figure 1).
Ierapetra: The city of Ierapetra (ancient Hierapytna) was founded during the Classical period (480–323 BC), with its establishment likely occurring in the 5th century BC. However, archaeological evidence from this era is limited [55]. The city’s prosperity appears to have been closely linked to the repopulation of the Chrisi Islet, which had been abandoned at the conclusion of the Neopalatial period. During the Venetian period (1205–1669 AD), Ierapetra, then referred to as Gerapetra, became the administrative capital of the region [56]. Shortly after the Venetians assumed control, the construction of the coastal fortress of Kales commenced. This fortress underwent several phases of construction and repair, as did the adjacent Roman harbour. In 1647, Ierapetra fell under Ottoman occupation, and over time, the town gradually diminished in significance [57].
Stomio: Human activity in the Stomio area can be traced back to the Neopalatial period of the Bronze Age (MIB–YMII, 1750/1720–1390/1370 BC). During the Roman period (67 BC–330 AD), a small settlement was established in the area [54], which included the villa, one of the key sites of the study.
Ferma: The fish tank at Ferma was constructed (carved into natural rock) during the Roman period and remained in use until the beginning of the Early Byzantine period and it should be noted that is not always clear whether they are fishtanks (for fish farming) or fish traps [58,59,60].
Lefki: The Lefki Islet/Koufonisi provides evidence of human settlement during the Neopalatial and Hellenistic periods (323–67 BC). However, it reached its peak primarily during the Roman period [61]. Excavations in the northwestern part of the islet have uncovered a permanent settlement, which includes a theatre, villas, baths, and a water supply system, all of which highlight the area’s prosperity and significance. The site remained occupied until at least the 4th century AD, marking the transition to the Early Byzantine period (330–824/6 AD). By the end of the 4th century, however, the settlement was abandoned [62].
Chrisi: Human presence on the northern coast of Chrisi Islet/Gaidouronisi dates back to the Prepalatial (EMI–MMIA, 3100/3000–1900 BC) and Protopalatial (MMIB–MMIIIA, 1900–1750 BC) periods. A small Roman-Early Byzantine settlement has also been identified on the islet. Chrisi appears to have been abandoned around the same time as Lefki, although activity resumed relatively soon afterward, likely at a more subdued and seasonal level [63].
2.4. Coastal Erosion
The majority of coasts within the study region primarily consist of solid rock formations, making them relatively stable compared to global erosion trends [9,64]. However, certain sections of the studied coasts are rather vulnerable. Coastal erosion is particularly evident in the western part of the Ierapetra area. The ruins of the Roman-era structure near Stomio, which was on land in the middle of the previous century, are now submerged (Figure 1 and Figure 2). The Roman-period town of Lefki, located on the northern coast of Koufonisi island (Figure 1), has been severely impacted by coastal erosion. Buildings of the town have been gradually destroyed over time, as evidenced by numerous ruins found in the shallow waters of the area (Figure 3).
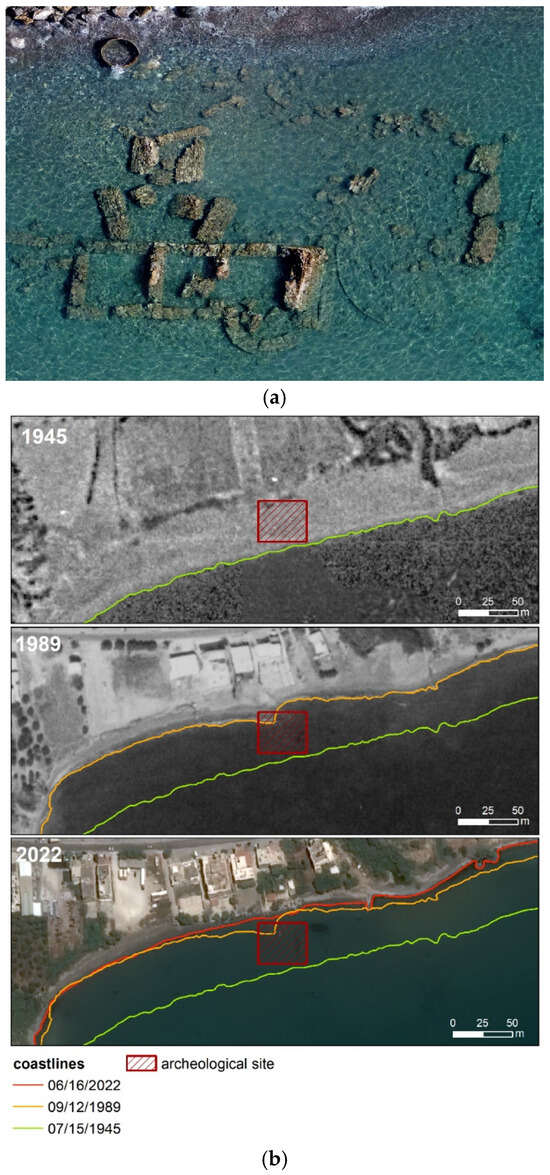
Figure 2.
Coastal erosion in the area of Stomio Roman villa: (a) modern view from drone, 2023, (b) coastal dynamics from aerial/satellite images.
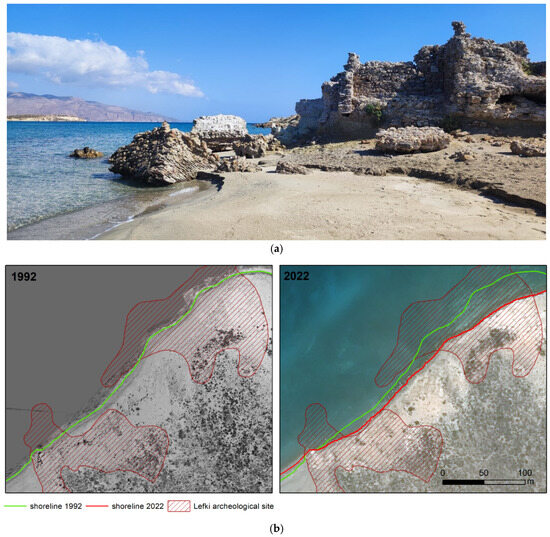
Figure 3.
Archaeological site of Lefki on Koufonisi island: (a) field view, 2023, (b) coastal dynamics (on the left—orthophoto mosaic from aerial images of 1992, on the right—Pleiades image of 2022). The blue arrow shows the location of the photo (a) shooting.
3. Materials and Methods
To assess the coastal hazards affecting the archaeological sites of the area, a modified Coastal Vulnerability Index (CVI) [16] was acknowledged. The following factors of coastal vulnerability were analysed: (a) rate of shoreline changes in previous years, (b) height of the cliff/beach, (c) coastal slope, (d) width of the beach, (e) lithology, (f) presence of beachrock, (g) vertical ground motions, (h) average speed of winds from wave generating directions, (i) average significant waves heights, (j) wind–wave effect, (k) sea-level change. The spatial distribution of these variables was meticulously analysed and correlated. Based on these correlations of different variables with rates of coastal retreat/advance, and on a comprehensive literature review, the set of variables influencing the coastal dynamics of the area most were the ones selected for the CVI calculation (Figure 4).
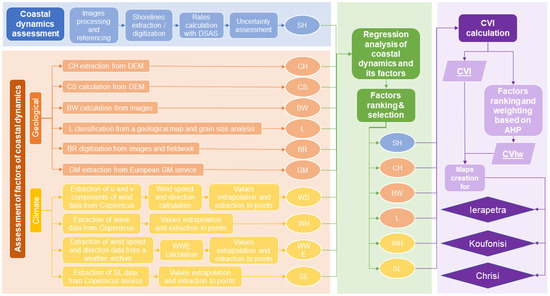
Figure 4.
Flowchart of the methodology of the study. SH—rates of shoreline changes in previous years, CH—height of the cliff/beach, CS—coastal slope, BW—width of the beach, L—lithology, BR—presence of beachrock, GM—vertical ground motions, WS—average speed of winds from wave generating directions, WH—average significant waves heights, WWE—wind–wave effect, SL—sea-level changes.
Additionally, a weighted CVI was calculated to account for the varying impacts of different variables on coastal erosion. The weighting of parameters was performed using the Analytic Hierarchy Process (AHP) [22,65], a multi-criteria decision analysis tool that applies pairwise comparison between decision elements to rank them based on their relative importance. The method has already been successfully applied for the assessment of various natural hazards [66,67,68], and, in particular,, for coastal vulnerability [22,23,69].
3.1. Analysis of Coastal Vulnerability Factors
3.1.1. Rates of Shoreline Movements
The rates of shoreline movements (SH) were assessed through the interpretation of multi-temporal, very high-resolution (0.2–0.6 m) images: four mosaics of aerial images (from 1945, 1966, 1989, and 2005), and one modern Pleiades satellite image of 2022 for Ierapetra, aerial images of 1992 and Pleiades of 2022 for Koufonisi, and aerial images of 1967 and 1992 and Pleiades image of 2022 for Chrisi (Table 1, Figure 2 and Figure 3). Digital Elevation Models (DEMs) and orthophoto mosaics were created from stereo pairs of aerial images using Metashape software 2024. The images were georeferenced in ArcGIS 10.8 software with a set of ground control points collected during fieldworks in June of 2023 in the Ierapetra area and in November 2023 on Koufonisi island using a DGPS (Javad Triumph in RTK mode). The Chrisi aerial images were referenced to the modern Pleiades image simply with tie points due to the absence of field ground control points.

Table 1.
Aerial/satellite images used in the study.
The shoreline (sea–land boundary) for each area was initially extracted from the Pleiades images with the use of the Normalised Difference Water Index (NDWI) [70,71] in ArcGIS 10.8, calculated as follows in Equation (1):
where Green represents the green band value, and NIR is the near-infrared band value for each pixel of the image.
Subsequently, the shoreline was manually corrected in sections where the NDWI technique did not accurately defined it. For each aerial image, the shoreline was manually digitised. The shoreline was considered the line of wet sand on beaches and the bottom line of the cliffs where no beach was present.
For the calculation of the rates of shoreline movements ArcGIS extension DSAS (Digital Shoreline Analysis System) [72] was employed. A total of 506 transects were established along the coastal lines of the study areas: 281 transects (every 50 m) at Koufonisi, 290 transects (every 50 m) at Chrisi and 216 transects (every 100 m due to larger extent area) in the Ierapetra area. The rates of shoreline movements were calculated as endpoint rates (EPR), defined as the distance between the latest and the earliest shorelines divided by the time span between them. These calculations were performed for every transect for different periods (1945–1966, 1966–1989, 1989–2005, 2005–2022) for the Ierapetra area, and for entire periods of study 1945–2022 for the Ierapetra area and 1992–2022 for Koufonisi and Chrisi.
3.1.2. Height of the Cliff/Beach
The height of the cliff/beach (CH) was derived from the DEM of LSO project (5 m spatial resolution) [73]. For each transect, measurements were taken 20 m inland from the shoreline on beaches and 10 m from the top line of cliffs on rocky coasts.
3.1.3. Coastal Slope
The coastal slope (CS) was calculated using the DEM of LSO project (5 m) [73]. Contours at 0 m and 2 m were extracted, and distances between them were calculated along the transects built on the previous step. Subsequently, the elevation (at 2 m) was divided by these distances for each transect, with results multiplied by 100 to express the slopes as percentages.
In some studies, bathymetry is also considered for CVI [21,24]. However, no freely available bathymetry model with sufficient spatial resolution exists for this region. EMODnet bathymetric datasets [74] and satellite-derived [75] bathymetry were tested, but their spatial resolution and quality were insufficient for reliable correlations and analysis. Moreover, the underwater portion of the coast often corresponds to the adjacent land area, which is why only the coastal slope of the land was used.
3.1.4. Beach Width
The width of the beach (BW) along the transects, was calculated as the length of each transect segment crossing beach polygons traced from the Pleiades satellite images.
3.1.5. Lithology
A lithological classification (L) from the digitised geological map of Crete with the scale 1:50,000 was used for the analysis. The resistance of different sediment groups to coastal erosion was evaluated based on correlations with past retreat rates and the literature [9,10,28,76,77]. It is assumed that coasts composed of rocky cliffs are less vulnerable to erosion than coasts composed of beaches. Consequently, three classes of cliffs based on their rock strength and two classes of beaches were distinguished.
Additionally, during fieldwork conducted in the Ierapetra area, 19 sediment samples were collected from every beach of the area from the most representative segment of every beach (from the berm—the highest point of the beach, dividing foreshore and backshore). Grain-size analysis was performed at the Technical University of Crete using a standard sieving method with a mechanical sieve shaker, employing a series of mesh sizes ranging from 0.106 mm to 16 mm. Prior to sieving, the samples were air-dried to eliminate moisture content, and fines were removed through washing to ensure accurate results [78]. Grain size classification adhered to the Wentworth scale [79], which categorises sediments into gravel, sand, silt, and clay based on particle size. To establish a quantitative correlation with rates of retreat/advance, the average grain size of each sample was assessed by calculating volume, mass, and particle count for each sieve fraction.
3.1.6. Beachrocks
Beachrocks (BR) are hard sedimentary formations that are relatively rapidly created in distinct bands or layers along the shorelines of coastal areas during stillstands or minor regressions [80] and they are widespread in the studied region. They often develop in intertidal zone and are typically composed of consolidated sediments, particularly the sand and gravel of biogenic and clastic origin cemented by carbonate precipitation due to various biogeochemical processes, which could include wave energy [80,81]. It is assumed that the presence of beachrock may provide some degree of protection against wave erosion [80]. The beachrocks were spotted and investigated both through field surveys and satellite imagery analysis.
3.1.7. Ground Motions
Ground motions (GM) in the study area are generally considered uniform [43,44]. To verify this, data on vertical ground motions generated by analysing long time series (for the last 5 years: 2018–2022) of Sentinel-1 radar satellite images [82] were considered for the Ierapetra area. Due to low data accuracy, point data varied significantly in time and space; however, averaging multiple points over time provided a reliable trend. A 500 m buffer area from the coastline was created and the average rate for each transect within this buffer zone was calculated.
3.1.8. Average Speed of Winds from Wave-Generating Directions
The average speed of winds from wave-generating directions (WS) was calculated based on the Reanalysis data from the Copernicus tool ‘ERA5 hourly data on single levels’ [51]. This tool provides data for a grid of points (0.25° × 0.25°). The 10 m u and v components of winds spanning the period from 2010 to 2020 were used.
Data were exported from the website and processed with a Python script. Wind speed (V) (Equation (2)) and directions (ϕ) (Equation (3)) were calculated from u and v components according to the following formulas [83]:
ϕ = (180 + 180/π × tan−1 (v/u) mod 360
The coastal line of every area was divided into segments of various azimuth and, accordingly, exposure to the winds and waves of various directions. Consequently, specific wind directions for each part of coastal line were accounted for. Average values for the studied period were calculated for each point of the grid. Subsequently, these values were extrapolated in ArcGIS using the Kernel Interpolation With Barriers tool (Figure 5). From the resulting raster, data were extracted to the points of coastal transects.

Figure 5.
Grid of points with averaged values of wind speed and a raster built on these data.
3.1.9. Average Significant Wave Heights
Average significant wave heights (WH) were calculated based on the data from the product ‘Mediterranean Sea Waves Reanalysis’ of the Copernicus Marine Service, containing the dataset of hourly wave parameters, covering the period from January 1993 until 1 month before the present, at 1/24° horizontal resolution [84]. Data for Southeastern Crete were extracted, processed, and averaged using Python (Version 2.7.18). After, the Kernel Interpolation With Barriers tool of ArcGIS 10.8 software was used to interpolate data from points to raster (Figure 6). From this raster, the values were then extracted to the points of coastal transects.
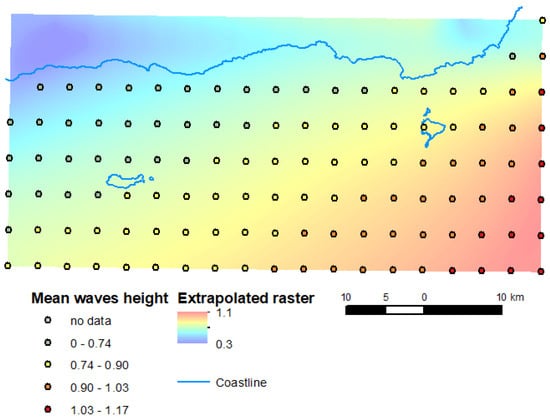
Figure 6.
Grid of points with averaged values of significant waves height, and a raster built on these data.
Detailed data on storm surges and extreme weather events are only available from the Ierapetra station archive and were accounted for in the wind–wave effect calculation (Section 3.1.10).
3.1.10. The Average Wind–Wave Effect
The average wind–wave effect (WWE) on the coast was calculated for the Ierapetra area using the Popov–Sovershaev method [85,86]. This method is based on wave energy theory and the correlations between wind speed and parameters of wind-induced waves. WWE is expressed as the water mass approaching the coast per year (tons/year) and is proportional to the wind speed (V) to the power of three, the duration of action of wave-generating winds (d), and wave fetch (x) (Equation (4)):
where ρ represents the density of the water (t/m3), g denotes the gravitational acceleration (m/s2), V signifies the wind speed of the specific direction at the height of 10 m above sea level (m/s), d is the duration of the wind of the current direction for the period of the study (s), x indicates the length of the fetch of the current wind direction (m), and t is the duration of studied period (years in s).
Wind directions and speeds were obtained from the archive of the Ierapetra weather station (35.010189 N, 25.748991 E) [87]. The directions of winds, inducing waves, influencing the studied coasts, were considered (SW, SSW, S, SSE, SE). WWE calculation was performed using Python (https://github.com/anchousina/wind-wave_effect_on_coasts_Popov-Sovershaev, accessed on 14 April 2025). Winds with speeds from 5 m/s or greater were used since the effect of weaker winds is negligible for the coasts [85]. WWE values were averaged over the period of study (divided by its duration—10 years).
3.1.11. Sea-Level Change
Sea-level change (SL) data were extracted from the ‘Water level changes in Europe’ product by Copernicus Climate Change Service [88]. The mean sea-level data projected for the end of the century was used, according to the RCP 4.5 scenario (as an intermediate scenario), which was modelled based on ERA5 Reanalysis (1979–2017) data. The data for Southeastern Crete were extracted from this dataset, processed, and averaged using Python. The Kernel Interpolation With Barriers tool of ArcGIS software was used to interpolate data from points into a raster (Figure 7), from which sea-level changes values were extracted to the points of coastal transects.
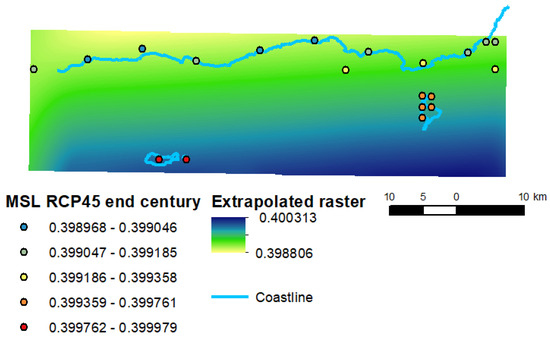
Figure 7.
Grid of points with averaged values of sea-level change by the end of the century, and a raster built on these data.
The mean tide range was not considered in the study, as tides are negligible in the region (<10 cm) [52]. Based on the Ierapetra tide gauge station the tide levels are approximately 0 m a.s.l. during the acquisition of the Pleiades satellite imageries used in this study [89]. This approach aligns with most coastal vulnerability studies in the area [7,11,14].
3.2. Uncertainty Assessment
The accuracy of shoreline positions and rates of shoreline movements was estimated based on [90,91,92] with adaptations. The following sources of uncertainty were considered:
- spatial resolution of the imagery (δs);
- georeferencing to an absolute coordinate system (δa);
- relative georeferencing of two datasets (δr);
- topography-induced horizontal displacement (δt, δot);
- sea-level fluctuations (δf).
Data on the spatial resolution (δs) of satellite images are provided by the distributor, and for Pleiades images it was 0.5 m (Table 1 and Table 2). The spatial resolution of aerial images was estimated after scanning and referencing of the images by measuring the pixel size of these images (0.2–0.7 m). The absolute georeferencing error (δa) for Pleiades images of Ierapetra (2.8 m) and Koufonisi (1.5 m) areas was determined after referencing them with the DGPS GCPs as the total RMSE (root mean square error) in the link table. A recent image for Chrisi has no absolute referencing, as no fieldwork with DGPS surveys was conducted there. The relative georeferencing uncertainty between two datasets (δr) was calculated as the RMSE of these datasets’ referencing (0.5–2.1 m).
Table 2.
Assessment of the uncertainty of the rates of shoreline retreat/advance.
The topography-induced error (δt) was calculated only for Pleiades images, as the necessary metadata (spacecraft tilt angle) was provided for this dataset but not for the aerial images. The calculation was performed using the following formula (Equation (5)):
where α is the tilt angle of the spacecraft and h is the maximum relative height within the area captured by the image. It varies from 3.64 m for the low-lying Chrisi area to 18.18 m for Koufonisi, which has the highest cliffs (Table 2). To address these distortions caused by relief, orthorectification of the images was performed using the DEM from the LSO project [73]. The topography-induced uncertainty after orthorectification (δot) was calculated as (Equation (6)):
where α is the tilt angle of the spacecraft and z is the vertical accuracy of the DEM used for ortho correction. This accuracy was assessed by comparing the DEM with DGPS GCPs, yielding an approximate value of 1 m.
Uncertainty due to sea-level fluctuations (δf) was also considered, as periodic changes in sea level caused by storms, surges, or tides can significantly influence shoreline positions on flat beaches. It was calculated as (Equation (7)):
where f represents the maximum sea-level fluctuation in the area during the relevant period of the year (it was estimated at approximately 20 cm based on the archives of Ierapetra weather [87] and tide gauge [89] stations); CS is the average coastal slope of the area, derived from the DEM of LSO project [73] (Table 2). The resulting uncertainty were 2.4 m for the Ierapetra area, 0.4 m for Koufonisi, and 1.6 m for Chrisi (Table 2).
Topography-induced and sea level fluctuation uncertainties were calculated using the metadata of Pleiades images, as all other datasets were eventually referenced to Pleiades images.
The total uncertainty of shoreline position δx was calculated as the quadratic sum of these errors, as independent sources (Equation (8)):
The uncertainty of the rate of shoreline movement between position x1 and x2 over the period from t1 to t2 was calculated using the following formula (Equation (9)):
3.3. Statistical Analysis
To evaluate the influence of different variables on coastal dynamics, regression analysis was conducted to correlate the change in numerical parameters along the coast with the change in rates of coastal retreat/advance in the past.
The contribution of such qualitative parameters as lithological composition and beachrock presence to coastal erosion is more difficult to estimate. To address this, box and whiskers charts were constructed to compare the average values of retreat for each type of lithology (for cliffs transects) and transects with/without beachrocks. The analysis accounted for values of coastal slope, coastal height, beachrock presence, wind–wave effect, wind speed, wave height, and sea-level changes across all the transects. Beach width was calculated only for transects, where a beach was present, and lithology was considered exclusively for cliffs (excluding beaches).
The aim of the statistical analysis is to select the most representative factors to be included in the modified CVI in this process; the existing literature data and sources were also used. The resulting rates of coastal retreat/advance, along with the values of other coastal variables, were classified in ArcGIS 10.8 as Natural Breaks in five ranks ranging from 1 (indicating very low hazard for coastal erosion) to 5 (indicating very high hazard).
3.4. CVI Calculation
CVI was calculated for each transect, according to the widely used formula [11,18,22,25,93], including the selected variables identified in the previous stage (Equation (10)):
where xn represents the rank of the variable n, n denotes the number of selected variables.
To account for the unequal contributions of various parameters to coastal dynamics we proposed the weights of these parameters and calculated the weighted CVI (CVIw), according to Equation (11), based on [18,93]:
where wj is the weight of criterion j, vij is the vulnerability score of transect i under criterion j, and n is the total number of criteria.
In the majority of the previous studies the criteria of CVI were weighted based on the experts’ opinions only [17,18,27,28], while the present study attempts to weight variables according to their influence on coastal dynamics of previous years estimated with regression analysis.
3.5. Analytical Hierarchical Process
The weights of the selected variables for calculation of CVIw were assessed based on the Analytical Hierarchical Process (AHP). This involved constructing a preference matrix where the influence of each selected parameter on coastal vulnerability is compared pairwise. The relative dominance of every parameter over all the others was rated using values ranging from 1 to 9 [65], thereby transforming qualitative evaluations into quantitative assessments. To evaluate the consistency of the derived matrix, the consistency ratio CR is computed according to Formula (12):
where CI represents the consistency index and RI is a random index.
CR = CI/RI
The consistency index CI was calculated as (13)
where λmax denotes the principal eigenvalue of the matrix and n is the order of the matrix.
The RI values for different values of n are given in [65].
In the case of CR < 0.10, the matrix is considered consistent. However, if CR > 0.10 the pairwise comparisons matrix needs to be re-evaluated and tested again.
The weights of the factors were determined by calculating the values of each row of the normalised matrix, where each value was divided by the total of its respective column. The calculations were performed in Excel and Python 2024.
4. Results
4.1. Spatial Distribution of Coastal Variables
4.1.1. Shoreline Change
The coastal dynamics across all three areas are moderate (with average rates of shoreline changes hovering around 0, slightly negative (Figure 8a). Generally, the coasts of the Ierapetra area demonstrate greater stability compared to those of the Koufonisi and Chrisi islands, albeit certain beaches are under severe erosion. The highest rates of retreat (about −1 m/yr) are recorded at the northern cape of Koufonisi island (Figure 8a). The most substantial advance of the coastal line took place at the areas of coastal protection construction in Ierapetra town (the port and the embankment, about 1 m/yr).
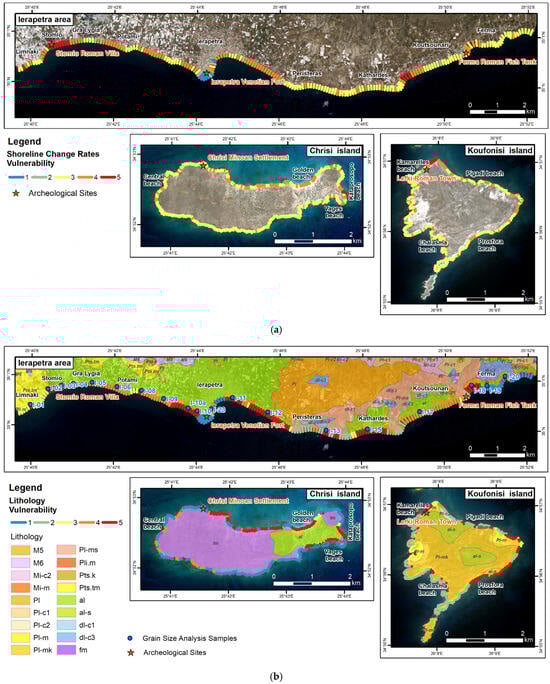
Figure 8.
Vulnerability classification based on (a) shoreline change rates; (b) lithology (for description, see in the text).
In the Ierapetra area, the maximal rates of retreat (up to −0.8 m/yr) are observed in the area of Stomio (Figure 2 and Figure 8a). Here, a formerly wide beach was reduced by nearly 50 m over a span of 44 years (from 1945 to 1989), followed by a continued but decelerated retreat. Such pronounced erosion could be triggered by the disturbance of sediment balance in the coastal zone resulting from the construction of the Bramiana (Mpramianon) dam in 1985 in the upper course of the river to the east of Gra Lygia for irrigation purposes [94]. Considerable reduction in the water flow led to a reduced amount of sediments supplying the coastal zone, which apparently triggered coastal erosion in this area.
Intensive erosion (approximately −0.5 m/yr) is also observed to the east of the Kathardes settlement in the western segment of Koutsounari/Megali beach (Figure 8a). This phenomenon is likely related to the natural trend of coastal evolution. Also, it could be due to sediment excavation from the coastal zone for construction purposes during the land development in the period of study, which is suggested by the aerial/satellite images interpretation. The shoreline was retreating as well in the areas of the beaches to the west and to the east of Ierapetra. Most of the rocky coast remained stable or slightly (up to −0.1 m/yr) retreated. Among the high coasts, the most actively retreated (about −0.2 m/yr) were cliffs of marine conglomerates with arenaceous marls in the area of Limnaki and white/yellowish sandy marls of sandy texture close to Peristeras (Figure 8b).
The most significant shoreline advancement (up to 2.2 m/yr) is observed in the vicinity of the Ierapetra port, primarily attributed to the construction of the pier between 1966 and 1989. Similarly, other cases of shoreline progradation are usually also linked to human interventions such as coastal protection or beach nourishment projects, e.g., the expansion of Kakkos beach by approximately ~35 m during the period between 1989 and 2005, based on our analysis.
As previously noted, Koufonisi island is experiencing the most intensive erosion (−1 m/yr) along its northern coast, particularly near the Lefki archaeological site (Figure 3 and Figure 8a). Here, a low cliff composed of soft white marls (Figure 8b) is subject to erosion from high waves generated by the predominant northern winds. Sediment transport by these waves along the coast towards the southwest leads to slight progradation at Kamarelles beach (0.4–0.5 m/yr). Other segments of the coastal line of the island are retreating as well: Anemertia beach at the NE of the island (−0.3–−0.4 m/yr), the eastern cape of the island (−0.2–−0.3 m/yr), Prosfora beach (~−0.2 m/yr), some of the western capes and beaches (−0.1–−0.2 m/yr). However, most of the coasts of Koufonisi are very high and, accordingly, are harder to be destroyed by the waves, especially compared to the Chrisi coasts.
Across Chrisi island, the northern and eastern coasts predominantly exhibit retreat, while the southern coasts remain relatively stable (Figure 8a). Notable erosion (−0.3 to −0.5 m/yr) is concentrated in the eastern part of the island, particularly south of Kataprosopo beach, with limited evidence of coastal advancement in this area.
4.1.2. Coastal Height
The average height of the coast is about 10 m at Koufonisi and in the Ierapetra area, and about 3 m at Chrisi (Figure 9a). Notably, the highest coasts are situated in the southern part of Koufonisi, reaching elevations of 30–45 m. In the Ierapetra area, the coast has a medium elevation (about 10–15 m) in the western part (to the west of Ierapetra), mainly low (about 5 m)—in its central part (excepting the high capes), and high (more than 20 m)—at the east (Figure 9a). Koufonisi is highest at the south (30–45 m cliffs), medium at the west (10–15 m), and lowest at the north and northeast (2–5, up to 10 m). Conversely, the coasts of Chrisi generally do not surpass 10 m, with the highest elevations observed in the northeast.

Figure 9.
Vulnerability classification based on (a) coastal height; (b) beach width.
4.1.3. Coastal Slope
The slope of the coast varies substantially across the studied area, especially at Koufonisi. Koufonisi demonstrates the steepest slopes, averaging 44%, especially pronounced at its southern and western peninsulas, where slopes can reach up to 400%. Conversely, the northern coast of Chrisi island and the extensive beaches to the east of the Ierapetra area feature the lowest slopes, ranging from 1% to 5%.
In the Ierapetra area the coast is steepest (up to 40%) on the capes of high rocky coasts of the eastern part, as well as on some narrow steep beaches apparently subjected to erosion in the western and central part of the area. In contrast, the flattest (up to 1%) coasts are the large beaches of the eastern area (Kathardes, Koutsounari/Megali). Koufonisi’s coastlines vary significantly, characterised by sheer cliffs on its peninsulas and relatively flat, albeit not overly wide, beaches within its gulfs. The widest and flattest beaches are located to the southwest and the southeast of the northern peninsula. Overall, the coasts of Chrisi, in general, are not steeper than 30% with an occasional segment of 30–40% steep in the eastern and southeastern parts of the island.
4.1.4. Beach Width
The Ierapetra area has the widest beaches (averaging 18 m in width) (Figure 9b). Among these, the most expansive is Megali beach in the Koutsounari region, spanning 70–80 m in width and extending 2.4 km in length. The majority of the coasts of the Ierapetra area are presented by beaches with widths from 3 to 80 m (Figure 9b). Though a considerable part (about 40%) has no clear beach zone: rocky coasts at the west and the east of the areas, capes in its central part, and technogenic coasts in the area of Ierapetra town. Notably, Megali beach stands out as the widest, while smaller pocket beaches, approximately 5 m in width, are scattered between rocky capes in the eastern sector and eroded beaches in the western areas near Stomio and Gra Lygia. In contrast, Koufonisi exhibits the smallest percentage of beachy coasts (24%) and the smallest average width of the beaches (5 m). The largest beach on Koufonisi measures 50–100 m in width and spans approximately 200 m in length at Kamarelles beach, while other beaches are considerably smaller and narrower. Chrisi Island features a greater number of beaches, accounting for about 37% of its coastline, albeit they tend to be narrow and short. The largest among them, Golden beach, stretches 50 m in width and spans 730 m in length.
4.1.5. Lithology
The influence of the lithological composition of the coasts on their erodibility must be considered separately—for the rocky coasts, where the wave erosion affects the cliff; and for the flat beaches, due to conceptually different mechanisms of erosion. The destruction of unlithified mostly fine-grained sediments of the beaches is usually easier for the waves than for the solid rocky cliffs, which is why we related the first three ranks of vulnerability classification (1, 2, 3) to cliffs, and the last two (4, 5) to beaches. Technogenic coasts in some parts of the Ierapetra area composed of concrete embankments, jetties, pierces and other protection structures, were classified with the 1 (very low) class of vulnerability. Following fieldwork inspections, correlation analysis with historical rates of retreat, and referencing the relevant literature, we propose the following resistance levels to coastal erosion for the sediments comprising the area’s cliffs.
Ierapetra: In the Ierapetra region, the Marine Upper Pleistocene terraces primarily conglomerates interspersed with arenaceous marls (Pts.tm), forming the capes west of the study area near Limnaki (Figure 8b), exhibit a resistance level ranging from moderate to low, indicating high vulnerability to erosion. Alluvial Pleistocene–Holocene loose sandy-clayed sediments (al), exposed at some cliffs to the west of Ierapetra, mainly exhibit a low resistance to erosion. Pliocene white or yellowish marls of sandy texture (Pl-ms) are the least resistant to erosion among all the cliffs of the area. However, in the eastern part of the area (close to Koutsounari), they have a more solid structure and were classified as medium-resistant. Marine Pleistocene conglomerates (dl-c1), presented at a very small section of the coast around the Peristeras beach, are also relatively low-resistant (closer to medium). The Lower-Middle Pliocene Finikia formation, comprising sea and brackish water deposits (interbedded marls, clays, sands, sandstones, conglomerates) (Pl), composing the most eastern part of the coast, has high resistance. Fluvial torrential deposits of boulders, gravels, and pebbles, as well as red–grey sands, along with other materials of the Pleistocene age (dl-c3), exhibit the highest resistance among the studied sediments.
Building upon the findings of grain-size analysis, field observations, and image interpretations, all beaches were categorised into two main types: predominantly gravel/pebble (more resistant) and predominantly sandy (less resistant). Approximately half of the beaches in the area consist mostly of sandy sediments (Stomio, Western and Eastern Ierapetra, Kathardes, Kakkos), while the remaining half feature gravel/pebble compositions (Gra Lygia-Potami, Koutsounari).
Koufonisi: The northern region of the island, as well as the eastern cape and two gulfs of the western coast (Figure 8b) are predominantly composed of Pliocene white marls (of Koufonisi) (Pl-m), which are weak in terms of resistance to coastal erosion. It is these sediments that the Lefki site stands on (Figure 3). Pliocene conglomerates within the aforementioned marls, pebbles mainly of limestone (Pl-c2) at the northeastern part of the island have a moderate strength. Holocene recent littoral deposits containing sand (al-s), outcropping in two segments of the coast, are softer, but still rather resistant (medium resistance, low vulnerability). Pliocene marls-marly limestones (thin to medium-bedded, white-yellow, homogeneous with locally travertine structure, Pl-mk) are mainly distributed on the island and considered as moderate resistant to coastal erosion. A small section of Miocene white or grey marls, sometimes containing lenticular conglomerate intercalations (Mi-m) at the northeast of the island is probably the highest on the island, albeit still classified as medium resistance considering the lithological composition across all regions. The majority of the island’s beaches consist of sandy sediments.
Chrisi: The predominant geological composition of Chrisi island consists of robust Pre-middle Miocene flysch mélange sediments (fm). In the eastern part of the island, weaker Pleistocene–Holocene alluvial loose sandy-clayed deposits are evident in cliff exposures. Sandy beaches predominate on the island (northern, eastern, and southeastern beaches), while western and southwestern beaches comprise mostly gravel/pebble materials.
4.1.6. Beachrocks
Approximately 90 beachrocks were identified within the study area. They are most prevalent along the coastlines of Chrisi, encompassing 69% of the island’s shoreline, while their occurrence is the least frequent along the coasts of Koufonisi, comprising only 8% of the island’s coastal extent. Within the Ierapetra area, approximately 31% of the coastline features beachrocks. Notably, in the Ierapetra region, the majority of beachrocks, including the largest formations, were observed in the segment between Potami and Ierapetra, as well as along the eastern beaches of Ierapetra. Koufonisi exhibits several smaller beachrock formations along its eastern coastline. Conversely, Chrisi boasts numerous extensive beachrocks encircling its shores, with few exceptions along certain eastern coastal stretches.
4.1.7. Vertical Ground Motions
In general, the coast of Ierapetra has been subsiding across the past five years [82]. The most intensive subsidence (up to 2 mm) occurred in the central part of the area (between Potami and Ierapetra, and in the area of Peristeras). The eastern portion of the area, particularly around Ferma, either remained relatively stable or exhibited a slight uplift.
4.1.8. Wind Speed
According to the Copernicus Reanalysis data, the average intensity of the winds grows gradually from the W (average multiannual speed is about 4 m/s) to the E (about 6 m/s). The strongest winds are the northern ones. The average wind speeds recorded at the coasts of the islands are higher than at the coasts of the Ierapetra area. Koufonisi is exposed to the strongest winds compared to the other two areas.
4.1.9. Wave Heights
The multi-annual average values of significant wave heights across the area rise evenly from the northwest to the southeast (Figure 10a). The highest wave heights (about 0.87 m) are observed at the eastern coast of Koufonisi, exposed mostly to the waves from the open sea. Conversely, the Ierapetra area, particularly its western section, records the lowest average wave heights, measuring around 0.43 m.
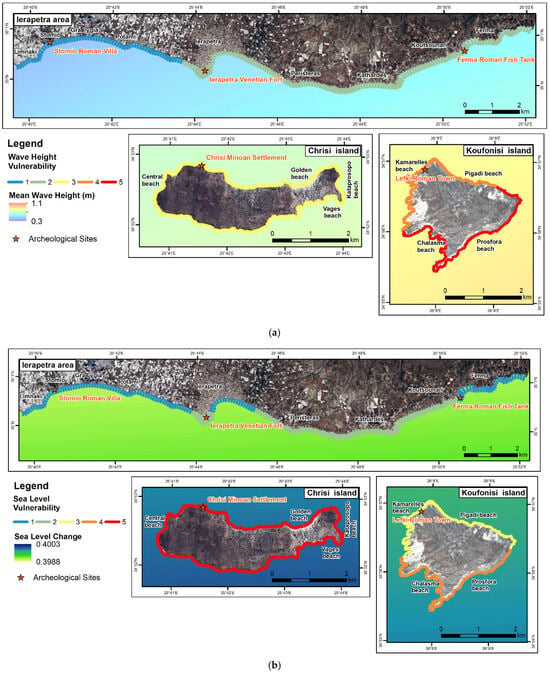
Figure 10.
Vulnerability classification based on (a) wave height; (b) sea-level change.
4.1.10. Wind–Wave Effect
According to our calculations, WWE in the Ierapetra area is the most pronounced on the capes (such as those at Ierapetra and Peristeras–Kathardes) and the coasts exposed to the S and SE winds: Eastern Ierapetra and Kousounari beaches (the highest values—up to 45,960 kt/yr—are in the eastern part of Koutsounari beach). The lowest WWE took place in the small, closed gulf at the east of the area around Ferma and the area of Gra Lydia–Potami (these coasts are subjected to lower wave impact as far as they are particularly protected from the open sea waves by Chrisi island).
4.1.11. Sea Level
According to the results of modelling of Copernicus Marine Service of mean sea-level data based on the ICPP RCP4.5 scenario by the end of the century, sea level in the area will rise by approximately 39–40 cm (Figure 10b). The highest rise is anticipated at Chrisi island, moderate at Koufonisi, and the lowest at Ierapetra. In the Ierapetra area, the capes shooting forth into the sea (Peristeras–Kathardes and Ierapetra port areas) will experience sea-level rise the most. Conversely, the impact is expected to be relatively lower in the bays, including Stomio–Gra Lygia–Potami, Ierapetra East, and the eastern bays.
4.2. Relations Between Different Variables and Rates of Shoreline Changes
Regression analysis of all numerical variables together provided the following results (Table 3). The regression models are very weak (R2 < 0.5) reflecting the complexity of the models, the inability to include all factors, and the high uncertainty of some types of the data (slope and elevation from DEMs, weather data from ERA5 Reanalysis, and others). Across all coasts of all the areas, the correlation is statistically significant (p-value < 0.05) for the wave height and sea-level changes only. For beach transects, the regression model performs better (R2 = 0.2790). Here, the correlation is significant for coastal height, beach width, and sea-level changes. Coastal variables for rocky coasts (cliffs) showed a very low correlation to the rates of shoreline changes (R2 = 0.0902), although coastal height, coastal slope, wind speed, and sea level are presumed to influence coastal dynamics in these areas. Among the three areas, the regression model for Koufonisi showed the best agreement (R2 = 0.2143), and for Chrisi—the worst (R2 = 0.0882). For different areas, different variables contributed the most to coastal dynamics, but the best correlated were coastal height, wave height, and sea level. No clear correlation was discerned for lithology of cliffs (Figure 11a) and beachrock presence (Figure 11b). However, comparison with the rates of shoreline changes in grain size of beach sediments of Ierapetra showed a good correlation (R = 0.45): the coarser the sediments, the weaker erosion is (Figure 11c,d).
Table 3.
Results of regression analysis. Significant values are shaded green.
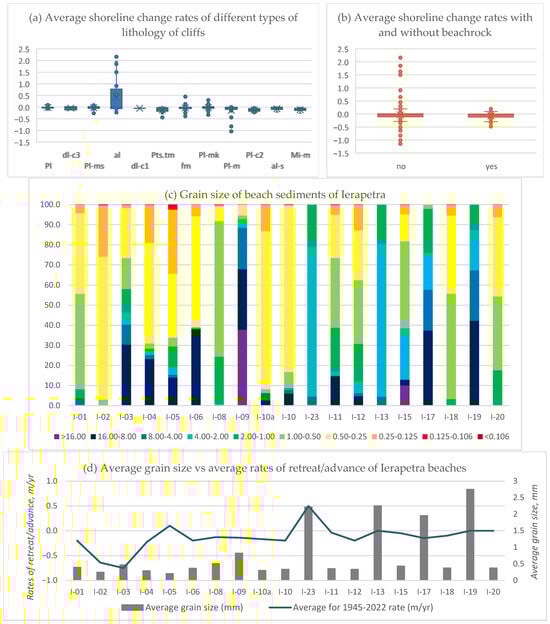
Figure 11.
Correlation of rates of shoreline changes with lithology and beachrock variables: (a) Average rates of shoreline retreat of different types of cliff rocks (see description in Table 5); (b) Average rates of shoreline retreat of the coasts with (yes) and without (no) beachrocks; (c) Grain size (percentage content of different fraction) of beach sediments of the Ierapetra area (see samples location at Figure 8a); (d) Average grain size of every sample and average shoreline change rate in its location.
4.3. Selection, Weighting, and Ranking Variables for CVI Calculation
Based on our statistical analysis and literature review, the following set of variables for CVI calculation have been selected and weighted (Table 4). The rate of shoreline retreat in previous decades is considered the most reliable indicator of coastal dynamics, based on the principle of uniformitarianism and the robustness of data on the shoreline movements (compared to the data on the other factors). Therefore, this criterion was assigned the highest score (Table 4). Regression analysis revealed that coastal erosion in the area in the studied period is primarily correlated with variables such as sea-level changes, wave height, and wind speed, followed by coastal height, beach width, and coastal slope, and least correlated with ground vertical motions and the wind–wave effect (Table 3).
Table 4.
Pairwise comparison matrix of variables selected for the CVI calculation.
According to our analysis, hydrometeorological variables (WS, WH, WWE, and SL), appear to be more closely related to the spatial distribution of rates of coastal erosion in the region than geomorphological variables, which is why they were ranked with higher scores. Wind speed, wave height, and wind–wave effect variables present the same factor—the energy of the waves eroding the coast. Among them, wave height was chosen for further analysis, since it showed the best correlation with rates of coastal retreat/advance (Table 3).
According to several publications [9,30], coastal morphology and sediment composition influence coastal erosion more than climatic factors, thus it was important to take geological factors into account. Coastal height and coastal slope are similar parameters by their influence on coastal dynamics. However, due to the lack of reliable underwater bathymetry and poorer correlation of coastal slope values with rates of coastal retreat/advance (Table 3) coastal height was chosen for CVI calculation. The lithological indicators for cliffs sections have not revealed strict relations with specific shoreline change intervals (Figure 11a); however, the grain size of sediments has some impact on dynamics of beaches (Figure 11c,d). Moreover, it is important to take lithology into account for the coastal vulnerability assessment [9,10,18,22,77]; hence, this parameter was used but ranked with a smaller score (Table 4). Beachrock presence has no evident influence on coastal dynamics according to our data (Figure 11b) and was not used in our assessment. Ground motions showed no reliable correlation to coastal dynamics (Table 3); in addition, it is partially included in the relative sea-level rise variable; therefore, this variable was not included in the CVI calculation.
The selected variables were ranked for CVI calculation as follows (Table 5).
Table 5.
Ranking vulnerability of the variables selected for the CVI calculation.
5. Discussion
5.1. Coastal Vulnerability Index
5.1.1. CVI
Based on the Coastal Vulnerability Index (CVI) assessment conducted in this study, 13.7% of the coastline in the study area is classified as having very high vulnerability to coastal hazards, 15.5% as high vulnerability, 37.2% as moderate vulnerability, 19.8% as low vulnerability, and 13.7% as very low vulnerability (Figure 12a, Table 6). The most erosion-prone sites are located in the north, east, and southeast of Koufonisi island, as well as in the north, east, and southeast of Chrisi. In contrast, the Ierapetra area is relatively less affected by coastal erosion (Figure 12a).
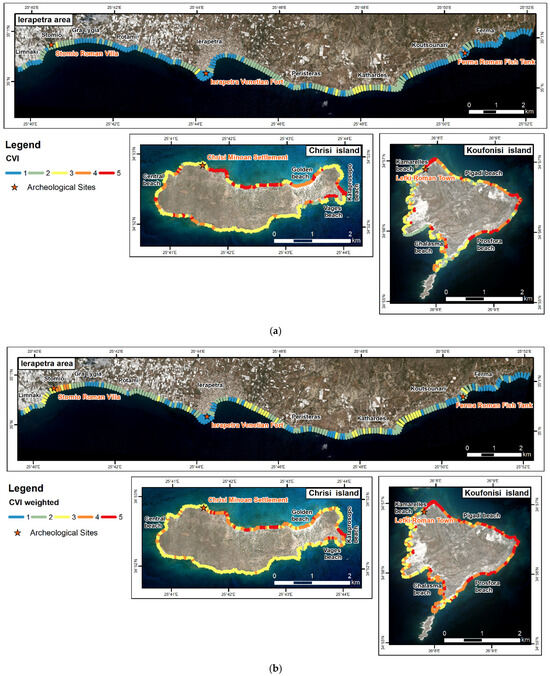
Figure 12.
(a) Coastal vulnerability index, (b) Weighted coastal vulnerability index for Southeastern Crete.
Table 6.
Ratio of coasts of different CVI and CVIw.
Within the Ierapetra area, the most vulnerable sites are the beaches of Stomio, where the Roman villa is located (Figure 2a and Figure 12a, Table 7), and Kathardes. Stomio beach has experienced ongoing erosion over recent decades, a trend expected to continue due to its geomorphological characteristics, such as low elevation, narrow beach width, and lithological composition. While Kathardes beach has not suffered severe erosion in previous decades (Figure 8a), it is projected to face the most intensive in the area due to sea-level rise (Figure 10b) and wave erosion (Figure 10a) in the coming decades. Moreover, its geological characteristics (low height and slope, as well as predominately sandy composition) make it particularly susceptible to coastal erosion in near future. Additionally, Western Ierapetra, Eastern Ierapetra, Livadi, and Koutsonari beaches are at higher risk due to their historical trends, and a combination of geological and climatic factors. Conversely, the least vulnerable to erosion are high steep rocky coasts at the west and the east of the study area, technogenic coasts (with protective structures), and beaches in enclosed bays (in the areas of Gra Lygia, Ierapetra, Ferma) (Figure 12a). The Ferma Roman fish tank archaeological site is located within the area of low CVI, while Ierapetra Fort is in an area of very low CVI (Table 7).
Table 7.
Vulnerability of archaeological sites of Southeastern Crete to coastal erosion.
The islands’ coasts are generally more susceptible to erosion due to their exposure to the higher waves (Figure 10a), and the absence of wide beaches, which are more common in the Ierapetra area (Figure 9b). The northern and eastern capes of Koufonisi are relatively low-lying (especially in the northern cape), composed of soft marls, and susceptible to strong waves are among the most vulnerable in the area. The Lefki archaeological site is located in areas of moderate (in the west), high (in the middle), and very high (in the east) risk in terms of coastal erosion (Table 7). Similarly, the southeastern coast of Koufonisi, including cliffs, despite its high elevation, and Prosfora beach, are also very vulnerable due to their exposure to the strongest waves in the area. The northwestern coast is the most stable (moderate vulnerability).
The coasts of Chrisi island are classified as highly vulnerable due to their low elevation and greater exposure to waves and rising sea-levels. The northern coast of the island has historically undergone significant retreat (Figure 8a), and, given its flatness, exposure to northern waves, fine-grained beach sediments, and sea-level rise, this retreat is likely to accelerate in the future. The Chrisi Minoan settlement is located in a medium-risk area (Table 7). Beaches on the southeast of the island, such as Kataprosopo and Vages beaches, are also prone to retreat due to a combination of geomorphological and meteorological factors. In contrast, the western and southern coasts, as well as the northeastern peninsula, exhibit greater stability due to their lithological composition, which consists of more resistant flysch sediments.
When compared to other Mediterranean regions assessed using the CVI method, the study area as a whole demonstrates an average level of vulnerability. The majority of the coastline (37%) is classified as moderately vulnerable, while 34% falls into the low or very low vulnerability category, and 29% is classified as highly or very highly vulnerable. In contrast, the Nador Lagoon in Morocco has a higher vulnerability, with only 4% in the low categories, 54% classified as moderate, and 42% in the high categories [95]. Similarly, along the northern Peloponnese, highly vulnerable coasts are predominant, with 36% classified as low, 35% as moderate, and 39% as high [96]. On the other hand, many study areas exhibit a predominance of low vulnerability, such as the Stara Baška Lagoon on Krk Island in the northern Adriatic, where 60% of the coastline is classified as low vulnerability, 15% as moderate, and 25% as high [97]. According to [25], on Rhodes Island, both low and high vulnerability classes account for a significant proportion of the coastline (40% and 39%, respectively), while the moderate class represents only 20%. However, when considering the three study sites separately, Ierapetra has a lower risk than the regional average, whereas the islands are at a higher risk than the regional average.
5.1.2. CVI Weighted
According to the weighted CVI assessment, 17.5% of the coasts of the area has a very high level of vulnerability to coastal erosion, 39.6%—high, 28.1%—moderate, 11.3%—low, and 3.4%—very low (Figure 12b, Table 6). CVIw values are also higher on the islands than in the Ierapetra area (Figure 12b). The most vulnerable locations remain similar to those in the original CVI assessment (Stomio and Kathardes beaches in the Ierapetra area, northern, eastern, southeastern coasts of Koufonisi, northern and eastern coasts of Chrisi—Figure 12a); however, their areas are mainly larger (especially at Koufonisi), due to amplifications of contribution of main factors of erosion (waves height and coastal elevation), which have high vulnerability indexes. The most vulnerable areas in the case of weighted CVI assessment are the northern and the eastern capes of Koufonisi and the eastern cape of Chrisi (around Kataprosporo beach). The least vulnerable segments are the central (protected coast within the area of Ierapetra town) and the eastern parts of the Ierapetra area.
The amplification of geomorphological criteria, particularly coastal elevation and beach width, highlights the vulnerability of several sites within the Ierapetra area, especially Stomio beach, where the archaeological site is situated (Figure 2a, Table 7). Additionally, Eastern Ierapetra, Koutsounari, and the west of Kathardes beaches show increased risk of coastal erosion due to their shoreline change history and exposure to open sea waves. The least sensitive to erosion remain sheltered bays (Gra Lygia, Ierapetra, Ferma), the technogenic coasts of Ierapetra town, and the rocky cliffs east of Ferma.
Despite the high elevation of most Koufonisi coasts, they are still classified as highly vulnerable according to the CVIw assessment due to the high values of vulnerability indexes of all the other variables (especially wave height, beach width, lithology, and sea-level change). The vulnerability of the Chrisi coasts slightly decreases with the application of CVIw due to the lowest historical rates of shoreline retreat here, and due to smaller wave impacts on this coast if compared to Koufonisi. However, most of the coasts of the island remains moderately or highly sensitive to coastal erosion, according to the CVIw assessment.
Comparing our CVIw results with other areas is more challenging due to the limited number of studies using this approach (Section 1). Additionally, direct comparisons are less relevant, as researchers apply different factor weightings. However, to provide a general perspective, our classification indicates a slightly higher proportion of high vulnerability categories compared to other studies. In this study, 15% of the coastline falls into the low vulnerability categories, 28% into the moderate category, and 57% into the high categories. For comparison, in the Gulf of Patras (Western Greece), [28] classified 40% of the coastline as low vulnerability, 20% as moderate, and 40% as high. Similarly, according to the CVIw classification of the Lithuanian coast of the Baltic Sea conducted by [18], 41% of the coastline was categorised as low vulnerability, 22% as moderate, and 32% as high.
5.2. Limitations of the Study
The main limitations of this study stem from data availability. Given the regional scale of the analysis and the time and budget constraints of the project, obtaining high-resolution, comprehensive data on all landscape components influencing coastal dynamics was not feasible. Nevertheless, data on the key factors driving coastal erosion were collected, processed, and analysed, enabling a foundational approximation of coastal vulnerability. Future research could improve upon this by incorporating higher-resolution data and additional variables, such as coastal underwater slope, hydrometeorological extremes (e.g., storm events and surges), longshore currents, and micro-tsunamis.
A significant challenge remains the lack of freely available bathymetric models with adequate spatial resolution for the study region. While we tested EMODnet [74] and satellite-derived [75] bathymetry, their resolution and accuracy were insufficient for robust correlation and analysis. Consequently, our study considered only the coastal land slope.
Another limitation relates to the use of global reanalysis wave data, such as ERA5, which is less reliable in nearshore zones due to complex bathymetry and wave transformation processes, including reflection, shoaling, refraction, diffraction, and wave–wave and wave–current interactions [98,99]. Coastal numerical modelling could enhance future studies by propagating waves from intermediate and deep waters to the coastal zone [100,101].
Additionally, higher-resolution and higher-frequency imagery, such as that obtained from drone surveys, could improve hindcast analysis and enhance shoreline movement forecasts over time.
6. Conclusions
The study presents the detailed and comprehensive assessment of the coastal evolution and coastal vulnerability of Southeastern Crete, where numerous cultural heritage sites are located. The Coastal Vulnerability Index (CVI), which combines the contribution of different factors of coastal dynamics, is calculated—both, considering the equal contribution of all factors to coastal erosion (CVI), and with the application of different weights (CVIw).
The study attempts to estimate weights of the factors based on their correlation with historical shoreline change. However, the outcomes of the previous studies on the coastal factors are also considered when weighting. Regression analysis aimed at detecting the impact of various variables on rates of coastal line movements in previous decades yielded limited results for the studied area. Predominantly, rates of shoreline retreat correlate with factors such as sea-level change, wave height, wind speed, coastal height, and to a lesser extent, width of the beach, coastal slope, lithology, and wind–wave energy. Other parameters, such as vertical ground movements and the presence of beachrock, showed no reliable correlation with the spatial distribution of coastal dynamics. Based on this statistical analysis, the following variables were selected for the CVI calculation: shoreline change rates, coastal height, beach width, lithology, waves height and sea-level changes.
According to both approaches (CVI and weighted CVI), the most vulnerable areas are located in the north, east, and southeast of Koufonisi, and the north and east of Chrisi. The least vulnerable areas are the wide beaches in the enclosed bays in the areas of Gra Lygia, Ierapetra, and Ferma, alongside the rocky capes at the east of the Ierapetra area. The weighted CVI assessment underscores the heightened vulnerability of the majority of Koufonisi’s coastal stretches, classified as highly or very highly vulnerable, while Chrisi’s coastlines predominantly fall within the medium to high vulnerability range. In contrast, the majority of Ierapetra’s coastal areas demonstrate low or very low vulnerability. Two out of the five archaeological sites of the area (namely Lefki Roman Town and Stomio Roman Villa) are located within zones with high or very high coastal erosion vulnerability.
The overall method proposed can provide critical insights for decision makers to determine the needs to be acknowledged in the future for effective mitigation activities of the adverse effects of coastal erosion to safeguard the region’s invaluable cultural assets. Thus, the implementation of coastal protection structures, beach nourishment, and other erosion control measures in high-risk areas, in conjunction with continuous monitoring of shoreline changes and coastal processes based on high-resolution remote sensing data and field surveys, can ensure that the rich cultural heritage of Southeastern Crete is protected for future generations.
Future research should focus on refining the weighting approach for CVI variables by integrating machine learning techniques and longer-term temporal datasets to improve predictive accuracy. Additionally, further investigation into the role of subsidence and tectonic activity in coastal dynamics is needed, along with the influence of extreme weather events and longshore currents on shoreline evolution. Expanding the study to include biological factors, such as coastal vegetation (e.g., seagrass) and coral reefs, could enhance understanding of natural coastal resilience. Finally, interdisciplinary research combining archaeological assessments with coastal vulnerability studies could provide more holistic strategies for preserving cultural heritage sites in erosion-prone areas. Those could include the deployment of artificial offshore reefs in the proximity of CH marine archaeological sites to protect shorelines and reduce coastal erosion from the impact of strong waves and storm surges. Thus, implementing coastal protection structures, beach nourishment, and other erosion control measures in high-risk areas, in conjunction with continuous monitoring of shoreline changes using high-resolution remote sensing data and field surveys, can ensure the long-term preservation of Southeastern Crete’s rich cultural heritage.
Author Contributions
A.V.N., N.P., A.V.A. and G.A. contributed to the study conception and design. N.P. provided the funding. A.V.N., N.P. and N.C.A. collected the field data. N.C.A. performed grain-size analysis. A.V.N. and A.V.A. conducted remote sensing data analysis. A.V.N. performed calculations, and statistics, and created the maps. The initial draft of the manuscript was written by A.V.N. and all authors commented on previous versions of the manuscript. All authors have read and agreed to the published version of the manuscript.
Funding
This work received funding from the project: “ClepsYdra: Translating submerged and buried cultural heritage from shallow water to digital environment with geoinformatics”, supported by the Hellenic Foundation for Research and Innovation (H.F.R.I.) under the “2nd Call for H.F.R.I. Research Projects to support Faculty Members and Researchers” (Project Number: 3339).
Data Availability Statement
Datasets generated during the current study are available from the corresponding author on request.
Acknowledgments
We would like to acknowledge the Laboratory of Ore Processing, School of Mineral Resources Engineering, Technical University of Crete for providing the laboratory and the equipment necessary for the grain-size analysis. We are grateful to Charikleia Oikonomou from the Hellenic Centre for Marine Research (HCMR) for providing a basic script for ERA5 wind data processing. We are also grateful to Mikhail Drugov and Egor Zelenin for their assistance in analysing climate and geological data in Excel, Python, and ArcGIS. We thank Bilio Markasioti and Gianluca Cantoro for their assistance during the fieldworks.
Conflicts of Interest
The authors declare no conflicts of interest.
References
- Goumas, S.K.; Kontakos, S.; Mathheaki, A.G.; Xristoforidis, S. Modeling and forecasting of tourist arrivals in Crete using statistical models and models of computational intelligence: A comparative study. Int. J. Oper. Res. Inf. Syst. (IJORIS) 2021, 12, 58–72. [Google Scholar] [CrossRef]
- Sarris, A.; Peraki, E.; Chatzoyiannaki, N.; Elvanidou, M.; Kappa, E.; Kakoulaki, G.; Karimali, E.; Katifori, M.; Kouriati, K.; Papadakis, G.; et al. Technology and Methodology for Archaeological Practice: Practical applications for the past reconstruction. In Proceedings of the XVth Congress of the UISPP, Time Drilling Through the Past of the Island of Crete, Colloqium C04, Lisbon, Portugal, 4–9 September 2006. [Google Scholar]
- Reimann, L.; Vafeidis, A.T.; Brown, S.; Hinkel, J.; Tol, R.S.J. Mediterranean UNESCO World Heritage at risk from coastal flooding and erosion due to sea-level rise. Nat. Commun. 2018, 9, 4161. [Google Scholar] [CrossRef]
- Salman, A.; Lombardo, S.; Doody, P. Living with Coastal Erosion in Europe: Sediment and Space for Sustainability. Part II: Maps and Statistics; Directorate General Environment, European Commission: Brussels, Belgium, 2004; p. 25. [Google Scholar]
- Alexandrakis, G.; Karditsa, A.; Poulos, S.E.; Ghionis, G.; Kampanis, N.A. Vulnerability assessment for the erosion of the coastal zone due to a potential sea level rise: The case of the Aegean Hellenic Coast. Environ. Syst. 2010, 3, 324. [Google Scholar]
- Alexandrakis, G.; Ghionis, G.; Poulos, S.E.; Kampanis, N.A. Greece. In Coastal Erosion and Protection in Europe, 1st ed.; Pranzini, E., Williams, A., Eds.; Routledge: London, UK, 2013; pp. 355–377. [Google Scholar] [CrossRef]
- Monioudi, I.N.; Karditsa, A.; Chatzipavlis, A.; Alexandrakis, G.; Andreadis, O.P.; Velegrakis, A.F.; Poulos, S.; Ghionis, G.; Petrakis, S.; Sifnioti, D.; et al. Assessment of vulnerability of the eastern Cretan beaches (Greece) to sea level rise. Reg. Environ. Change 2014, 16, 1951–1962. [Google Scholar] [CrossRef]
- Rosendahl Appelquist, L.; Halsnæs, K. The Coastal Hazard Wheel system for coastal multi-hazard assessment and management in a changing climate. J. Coast. Conserv. 2015, 19, 157–179. [Google Scholar] [CrossRef]
- Prémaillon, M.; Regard, V.; Dewez, T.J.; Auda, Y. GlobR2C2 (Global Recession Rates of Coastal Cliffs): A global relational database to investigate coastal rocky cliff erosion rate variations. Earth Surf. Dyn. 2018, 6, 651–668. [Google Scholar] [CrossRef]
- Valvo, L.M.; Murray, A.B.; Ashton, A. How does underlying geology affect coastline change? An initial modeling investigation. J. Geophys. Res. Earth Surf. 2006, 111, F2. [Google Scholar] [CrossRef]
- Alexandrakis, G.; Ghionis, G.; Poulos, S. The effect of beach rock formation on the morphological evolution of a beach. The case study of an Eastern Mediterranean beach: Ammoudara, Greece. J. Coast. Res. 2013, 69, 47–59. [Google Scholar] [CrossRef]
- Monioudi, I.N.; Velegrakis, A.F.; Chatzipavlis, A.E.; Rigos, A.; Karambas, T.; Vousdoukas, M.I.; Hasiotis, T.; Koukourouvli, N.; Peduzzi, P.; Manoutsoglou, E.; et al. Assessment of island beach erosion due to sea level rise: The case of the Aegean archipelago (Eastern Mediterranean). Nat. Hazards Earth Syst. Sci. 2017, 17, 449–466. [Google Scholar] [CrossRef]
- Toimil, A.; Camus, P.; Losada, I.J.; Le Cozannet, G.; Nicholls, R.J.; Idier, D.; Maspataud, A. Climate change-driven coastal erosion modelling in temperate sandy beaches: Methods and uncertainty treatment. Earth-Sci. Rev. 2020, 202, 103–110. [Google Scholar] [CrossRef]
- Tzoraki, O.; Monioudi, I.N.; Velegrakis, A.F.; Moutafis, N.; Pavlogeorgatos, G.; Kitsiou, D. Resilience of touristic island beaches under sea level rise: A methodological framework. Coast. Manag. 2018, 46, 78–102. [Google Scholar] [CrossRef]
- Depountis, N.; Apostolopoulos, D.; Boumpoulis, V.; Christodoulou, D.; Dimas, A.; Fakiris, E.; Leftheriotis, G.; Menegatos, A.; Nikolakopoulos, K.; Papatheodorou, G.; et al. Coastal erosion identification and monitoring in the Patras Gulf (Greece) using multi-discipline approaches. J. Mar. Sci. Eng. 2023, 11, 654. [Google Scholar] [CrossRef]
- Gornitz, V. Global coastal hazards from future sea level rise. Palaeogeogr. Palaeoclimatol. Palaeoecol. 1991, 89, 379–398. [Google Scholar] [CrossRef]
- Yin, J.; Yin, Z.; Wang, J.; Xu, S.Y. National assessment of coastal vulnerability to sea-level rise for the Chinese coast. J. Coast. Conserv. 2012, 16, 123–133. [Google Scholar] [CrossRef]
- Bagdanavičiūtė, I.; Kelpšaitė, L.; Soomere, T. Multi-criteria evaluation approach to Coastal Vulnerability Index development in micro-tidal low-lying areas. Ocean. Coast. Manag. 2015, 104, 124–135. [Google Scholar] [CrossRef]
- Reeder-Myers, L.A. Cultural Heritage at Risk in the Twenty-First Century: A Vulnerability Assessment of Coastal Archaeological Sites in the United States. J. Isl. Coast. Archaeol. 2015, 10, 436–445. [Google Scholar] [CrossRef]
- Noor, N.M.; Maulud, K.N.A. Coastal Vulnerability: A Brief Review on Integrated Assessment in Southeast Asia. J. Mar. Sci. Eng. 2022, 10, 595. [Google Scholar] [CrossRef]
- Alexandrakis, G.; Poulos, S. An holistic approach to beach erosion vulnerability assessment. Sci. Rep. 2014, 4, 6078. [Google Scholar] [CrossRef]
- De Serio, F.; Armenio, E.; Mossa, M.; Petrillo, A.F. How to define priorities in coastal vulnerability assessment. Geosciences 2018, 8, 415. [Google Scholar] [CrossRef]
- Sekovski, I.; Del Río, L.; Armaroli, C. Development of a Coastal Vulnerability Index using analytical hierarchy process and application to Ravenna province (Italy). Ocean. Coast. Manag. 2020, 183, 104982. [Google Scholar] [CrossRef]
- Andreadis, O.; Chatzipavlis, A.; Hasiotis, T.; Monioudi, I.; Manoutsoglou, E.; Velegrakis, A. Assessment of and adaptation to beach erosion in islands: An integrated approach. J. Mar. Sci. Eng. 2021, 9, 859. [Google Scholar] [CrossRef]
- Vandarakis, D.; Panagiotopoulos, I.P.; Loukaidi, V.; Hatiris, G.A.; Drakopoulou, P.; Kikaki, A.; Gad, F.K.; Petrakis, S.; Malliouri, D.I.; Chatzinaki, M.; et al. Assessment of the coastal vulnerability to the ongoing sea level rise for the exquisite Rhodes Island (SE Aegean Sea, Greece). Water 2021, 13, 2169. [Google Scholar] [CrossRef]
- Filippaki, E.; Tsakalos, E.; Kazantzaki, M.; Bassiakos, Y. Forecasting impacts on vulnerable shorelines, Vulnerability assessment along the coastal zone of Messolonghi area-Western Greece. Climate 2023, 11, 24. [Google Scholar] [CrossRef]
- Duriyapong, F.; Nakhapakorn, K. Coastal vulnerability assessment: A case study of Samut Sakhon coastal zone. Songklanakarin J. Sci. Technol. 2011, 33, 469–476. Available online: https://api.semanticscholar.org/CorpusID:54792678 (accessed on 27 March 2025).
- Boumboulis, V.; Apostolopoulos, D.; Depountis, N.; Nikolakopoulos, K. The importance of geotechnical evaluation and shoreline evolution in Coastal Vulnerability Index calculations. J. Mar. Sci. Eng. 2021, 9, 423. [Google Scholar] [CrossRef]
- Puig, M.; del Rio, L.; Plomaritis, T.A.; Benavente, J. Influence of storms on coastal retreat in SW Spain. J. Coast. Res. 2014, 70, 193–198. [Google Scholar] [CrossRef]
- Jarmalavičius, D.; Šmatas, V.; Stankūnavičius, G.; Pupienis, D.; Žilinskas, G. Factors controlling coastal erosion during storm events. J. Coast. Res. 2016, 75, 1112–1116. [Google Scholar] [CrossRef]
- Asoni, S.G.; Stavrou, A.; Lawrence, J.A.; Preene, M.; Lawrence, U.L.; Buckley, R. Erosion of the chalk coastal cliffs at Birling Gap, Sussex, UK. Correlation between rate of coastal retreat, geotechnical rocks properties and precipitation. In Proceedings of the Engineering in Chalk 2018 Conference, London, UK, 17–18 September 2018; pp. 361–367. [Google Scholar] [CrossRef]
- Daire, M.Y.; Lopez-Romero, E.; Proust, J.N.; Regnauld, H.; Pian, S.; Shi, B. Coastal Changes and Cultural Heritage (1): Assessment of the Vulnerability of the Coastal Heritage in Western France. J. Isl. Coast. Archaeol. 2012, 7, 168–182. [Google Scholar] [CrossRef]
- Di Luccio, D.; Benassai, G.; Di Paola, G.; Rosskopf, C.M.; Mucerino, L.; Montella, R.; Contestabile, P. Monitoring and Modelling Coastal Vulnerability and Mitigation Proposal for an Archaeological Site (Kaulonia, Southern Italy). Sustainability 2018, 10, 2017. [Google Scholar] [CrossRef]
- Mattei, G.; Rizzo, A.; Anfuso, G.; Aucelli, P.P.C.; Gracia, F.J. A tool for evaluating the archaeological heritage vulnerability to coastal processes: The case study of Naples Gulf (southern Italy). Ocean. Coast. Manag. 2019, 179, 104876. [Google Scholar] [CrossRef]
- UNESCO World Heritage: Vulnerability of UNESCO World Heritage Sites to Projected Sea Level Rise in the Mediterranean Sea 2023. Available online: https://stories.ecmwf.int/risks-to-world-heritage-sites-across-the-mediterranean-from-rising-sea-levels-under-climate-change/index.html (accessed on 27 March 2025).
- Climate Change 2007: Working Group II: Impacts, Adaptation and Vulnerability. Available online: https://archive.ipcc.ch/publications_and_data/ar4/wg2/en/frontmattersg.html (accessed on 27 March 2025).
- Kissel, C.; Laj, C. The Tertiary geodynamical evolution of the Aegean arc: A paleomagnetic reconstruction. Tectonophysics 1988, 146, 183–201. [Google Scholar] [CrossRef]
- Ben-Avraham, Z.; Woodside, J.; Lodolo, E.; Gardosh, M.; Grasso, M.; Camerlenghi, A.; Vai, G.B. Eastern Mediterranean basin systems. Geol. Soc. Lond. Mem. 2006, 32, 263–276. [Google Scholar] [CrossRef]
- Makris, J. Geophysical Investigations of the Hellenides; Hamburger Geophys Einzelschriften 34; Wittenborn Söhne: Hamburg, Germany, 1977; p. 34. [Google Scholar]
- Le Pichon, X.; Angelier, J. The Hellenic arc and trench system: A key to the neotectonic evolution of the eastern Mediterranean area. Tectonophysics 1979, 60, 1–42. [Google Scholar] [CrossRef]
- Pirazzoli, P.; Thommeret, J.; Thommeret, Y.; Laborel, J.; Montag-Gioni, L. Crustal block movements from Holocene shorelines: Crete and Antikythira (Greece). Tectonophysics 1982, 86, 27–43. [Google Scholar] [CrossRef]
- Strobl, M.; Hetzel, R.; Fassoulas, C.; Kubik, P.W. A long-term rock uplift rate for eastern Crete and geodynamic implications for the Hellenic subduction zone. J. Geodyn. 2014, 78, 21–31. [Google Scholar] [CrossRef]
- Roberts, G.G.; White, N.J.; Shaw, B. An uplift history of Crete, Greece, from inverse modeling of longitudinal river profiles. Geomorphology 2013, 198, 177–188. [Google Scholar] [CrossRef]
- Mourtzas, N.; Kolaiti, E.; Anzidei, M. Vertical land movements and sea level changes along the coast of Crete (Greece) since Late Holocene. Quat. Int. 2015, 401, 43–70. [Google Scholar] [CrossRef]
- Ten Veen, J.H.; Postma, G. Neogene tectonics and basin fill patterns in the Hellenic outer-arc (Crete, Greece). Basin Res. 1999, 11, 223–241. [Google Scholar] [CrossRef]
- Papadopoulos, G.A.; Lekkas, E.; Katsetsiadou, K.-N.; Rovythakis, E.; Yahav, A. Tsunami Alert Efficiency in the Eastern Mediterranean Sea: The 2 May 2020 Earthquake (Mw6.6) and Near-Field Tsunami South of Crete (Greece). GeoHazards 2020, 1, 44–60. [Google Scholar] [CrossRef]
- England, P.; Howell, A.; Jackson, J.; Synolakis, C. Palaeotsunamisand tsunami hazards in the eastern Mediterranean. Philos. Trans. R. Soc. A Math. Phys. Eng. Sci. 2015, 373, 20140374. [Google Scholar] [CrossRef]
- Triantafyllou, I.; Agalos, A.; Samaras, A.G.; Karambas, T.V.; Papadopoulos, G.A. Strong earthquakes and tsunami potentialin the Hellenic subduction zone. J. Geodyn. 2024, 159, 102021. [Google Scholar] [CrossRef]
- Rackham, O.; Moody, J. The Making of the Cretan Landscape; Manchester University Press: Manchester, UK, 1996. [Google Scholar]
- Hellenic National Meteorological Service. Available online: http://newportal.hnms.gr/emy/en/climatology/climatology_city?perifereia=Crete&poli=Ierapetra (accessed on 27 March 2025).
- Hersbach, H.; Bell, B.; Berrisford, P.; Biavati, G.; Horányi, A.; Muñoz Sabater, J.; Nicolas, J.; Peubey, C.; Radu, R.; Rozum, I.; et al. ERA5 Hourly Data on Pressure Levels from 1940 to Present. Copernicus Climate Change Service (C3S) Climate Data Store (CDS). 2023. Available online: https://cds.climate.copernicus.eu/datasets/reanalysis-era5-pressure-levels?tab=overview (accessed on 14 April 2025).
- Tsimplis, M.N.; Shaw, A.G.P. Seasonal sea level extremes in the Mediterranean Sea and at the Atlantic European coasts. Nat. Hazards Earth Syst. Sci. 2010, 10, 1457–1475. [Google Scholar] [CrossRef]
- Fragkopoulou, T. The Evolution of the Coastal and Maritime Cultural Landscape of South Central and Southeast Crete (Late Final Neolithic to Roman Period). Ph.D. Thesis, University of Sassari, Sassari, Italy, 2016. [Google Scholar]
- Papadopoulos, N. ClepsYdra: Translating submerged archaeological remains from shallow water to digital environment with geoinformatics. In Advances in on- and Offshore Archaeological Prospection, Proceedings of the 15th International Conference on Archaeological Prospection (ICAP), Kiel, Germany, 28 March–1 April 2023; Kiel University Publishing: Kiel, Germany, 2023; pp. 61–64. [Google Scholar] [CrossRef]
- Sofianou, C.; Gallimore, S. Recent Excavations at the Small Theater in Ancient Hierapytna. KENTRO Newsl. INSTAP Study Cent. East Crete 2019, 22, 13–15. Available online: https://instapstudycenter.net/2019/09/01/kentro-volume-22-fall-2019/ (accessed on 14 April 2025).
- Coutsinas, N.; Katifori, M.; Roussos, K.; Argyriou, A. The settlement patterns of the Ierapetra isthmus (East Crete) from the Archaic to the Venetian periods, as revealed through the Settle In Eastern Crete Program. J. Greek Archaeol. 2022, 7, 369–412. [Google Scholar] [CrossRef]
- Papadakis, Ν.P. Ierapetra. In The Nymph of the Libyan Sea. A Guide to Its History, Archaeology, and Culture; [Ιεράπετρα. H νύμφη του Λιβυκού. Oδηγός για την ιστορία, αρχαιολογία και τον πολιτισμό της]; Publication of the Municipality of Ierapetra: Crete, Greece, 1982. (In Greek) [Google Scholar]
- Davaras, C. Carved Fish Tank at Ferma, Ierapetra. [Λαξευτή ιχθυοδεξαμενή στα Φέρμα Ιεράπετρας]; Annual of the Archaiologicon Deltion; Chronika: Sofia, Bulgaria, 1978; Volume B2, pp. 149–154. (In Greek) [Google Scholar]
- Chronaki, D. The Lasithi Prefecture during the Byzantine period. The Lasithi Prefecture and Its History [O νομός Λασιθίου κατά τη Βυζαντινή περίοδο. O νομός Λασιθίου και η ιστορία του]. Aghios Nikolaos Soc. Lett. Arts East. Crete 2016, 1, 285–333. (In Greek) [Google Scholar]
- Theodoulou, T.; Tourtas, A.; Tsimpoukis, G. Underwater Archaeological Survey in the Ierapetra Region. In ClepsYdra. Translating Submerged and Buried Cultural Heritage from Shallow Water to Digital Environment with Geoinformatics; Papadopoulos, N., Ed.; Institute for Mediterranean Studies—Foundation of Research and Technology (IMS-FORTH): Rethymno, Greece, 2024; Available online: https://clepsydra.ims.forth.gr/uploads/book/ClepsYdra_Booklet_2024.pdf (accessed on 14 April 2025).
- Coutsinas, N.; Guy, M.; Kelly, A. Kouphonisi (Greece): A briefly vibrant Roman harbourage between Crete and Africa. In Géoarchéologie des îles de Méditerranée; Ghilardi, M., Ed.; CNRS: Paris, France, 2016; pp. 333–344. [Google Scholar]
- Papadakis, Ν. Koufonisi: The “Delos” of the Libyan Sea [Κουφονήσι: η “Δήλος” του Λιβυκού]. Archaeol. Arts [Aρχαιολογία και Τέχνες] 1983, 6, 58–65. (In Greek) [Google Scholar]
- Chalikias, K. Living on the Margin: Chryssi Island and the Settlement Patterns of the Ierapetra Area; BAR International Series 2549; British Archaeological Reports Ltd.: Oxford, UK, 2013. [Google Scholar]
- Donchyts, G.; Baart, F.; Winsemius, H.; Gorelick, N.; Kwadijk, J.; van de Giesen, N. Earth’s surface water change over the past 30 years. Nat. Clim. Change 2016, 6, 810–813. [Google Scholar] [CrossRef]
- Saaty, T.L.; Vargas, L.G. Prediction, Projection, and Forecasting: Applications of the Analytic Hierarchy Process in Economics, Finance, Politics, Games, and Sport; Springer Science+Business Media BV: Dordrecht, The Netherlands, 1991. [Google Scholar]
- Bhatt, R.; Macwan, J.E.M.; Bhatt, D.; Patel, V. Analytic hierarchy process approach for criteria ranking of sustainable building assessment: A case study. World Appl. Sci. J. 2010, 8, 881–888. Available online: https://api.semanticscholar.org/CorpusID:16009856 (accessed on 27 March 2025).
- Phukon, P.; Chetia, D.; Das, P. Landslide susceptibility assessment in the Guwahati city, Assam using analytic hierarchy process (AHP) and geographic information system (GIS). Int. J. Comput. Appl. Eng. Sci. 2012, 2, 1–6. Available online: https://api.semanticscholar.org/CorpusID:15967952 (accessed on 27 March 2025).
- Argyriou, A.V.; Teeuw, R.M.; Rust, D.; Sarris, A. GIS multi-criteria decision analysis for assessment and mapping of neotectonic landscape deformation: A case study from Crete. Geomorphology 2016, 253, 262–274. [Google Scholar] [CrossRef]
- Le Cozannet, G.L.; Garcin, M.; Bulteau, T.; Mirgon, C.; Yates, M.L.; Méndez, M.; Baills, A.; Idier, D.; Oliveros, C. An AHP-derived method for mapping the physical vulnerability of coastal areas at regional scales. Nat. Hazards Earth Syst. Sci. 2013, 13, 1209–1227. [Google Scholar] [CrossRef]
- Bishop-Taylor, R.; Sagar, S.; Lymburner, L.; Alam, I.; Sixsmith, J. Sub-pixel waterline extraction: Characterising accuracy and sensitivity to indices and spectra. Remote Sens. 2019, 11, 2984. [Google Scholar] [CrossRef]
- Alcaras, E.; Falchi, U.; Parente, C.; Vallario, A. Accuracy evaluation for coastline extraction from Pléiades imagery based on NDWI and IHS pan-sharpening application. Appl. Geomat. 2022, 15, 595–605. [Google Scholar] [CrossRef]
- Himmelstoss, E.A.; Henderson, R.E.; Kratzmann, M.G.; Farris, A.S. Digital Shoreline Analysis System (DSAS) Version 5.1. гser Guide; U.S. Geological Survey Open-File Report No 2021–1091; U.S. Geological Survey: Reston, VA, USA, 2021; 104p. [CrossRef]
- Geospatial Data INSPIRE Geoportal of the “Hellenic Cadastre”. Available online: https://www.ktimanet.gr/geoportal/catalog/main/home.page;jsessionid=8C59F8A2883C690CBDB247920E300741 (accessed on 27 March 2025).
- European Marine Observation and Data Network (EMODnet). Available online: https://emodnet.ec.europa.eu/en (accessed on 27 March 2025).
- Lassak, D.; Novikova, A.; Argyriou, A.; Papadopoulos, N. Satellite-Derived Bathymetry for the Islands of South-Eastern Crete. In Proceedings of the IMEKO TC4 International Conference on Metrology for Archaeology and Cultural Heritage, Rome, Italy, 19–21 October 2023; Available online: https://www.imeko.org/index.php/proceedings/9348-satellite-derived-bathymetry-for-the-islands-of-south-eastern-crete (accessed on 14 April 2025).
- Sunamura, T. Geomorphology of Rocky Coasts; J. Wiley: Hoboken, NJ, USA, 1992; 302p. [Google Scholar]
- Boye, C.B.; Fiadonu, E.B. Lithological effects on rocky coastline stability. Heliyon 2020, 6, e03539. [Google Scholar] [CrossRef]
- López, G.I. Grain Size Analysis. In Encyclopedia of Geoarchaeology. Encyclopedia of Earth Sciences Series; Gilbert, A.S., Ed.; Springer: Berlin/Heidelberg, Germany, 2017. [Google Scholar] [CrossRef]
- Wentworth, C.K. A Scale of Grade and Class Terms for Clastic Sediments. J. Geol. 1922, 30, 377–392. [Google Scholar] [CrossRef]
- Vousdoukas, M.I.; Velegrakis, A.F.; Plomaritis, T.A. Beachrock occurrence, characteristics, formation mechanisms and impacts. Earth-Sci. Rev. 2007, 85, 23–46. [Google Scholar] [CrossRef]
- Higgins, C.G. Beachrock. In Geomorphology. Encyclopedia of Earth Science; Charles, W., Finkl, C.V., Fairbridge, R.W., Eds.; Springer: Berlin/Heidelberg, Germany, 1968. [Google Scholar] [CrossRef]
- European Ground Motion Service. Available online: https://egms.land.copernicus.eu/ (accessed on 27 March 2025).
- ERA5: How to Calculate Wind Speed and Wind Direction from u and v Components of the Wind? Available online: https://confluence.ecmwf.int/pages/viewpage.action?pageId=133262398 (accessed on 27 March 2025).
- Mediterranean Sea Waves Reanalysis. Available online: https://data.marine.copernicus.eu/product/MEDSEA_MULTIYEAR_WAV_006_012/description (accessed on 27 March 2025).
- Popov, B.A.; Sovershaev, V. A Some features of the coastal dynamics in the Asian Arctic. Probl. Geogr. (Вoпрoсы Геoграфии) 1982, 119, 105–116. (In Russian) [Google Scholar]
- Shabanova, N.; Ogorodov, S.; Shabanov, P.; Baranskaya, A. Hydrometeorological forcing of western Russian Arctic coastal dynamics: XX-century history and current state. Geogr. Environ. Sustain. 2018, 11, 113–129. [Google Scholar] [CrossRef]
- Lagouvardos, K.; Kotroni, V.; Bezes, A.; Koletsis, I.; Kopania, T.; Lykoudis, S.; Mazarakis, N.; Papagiannaki, K.; Vougioukas, S. The automatic weather stations NOANN network of the National Observatory of Athens: Operation and database. Geosci. Data J. 2017, 4, 4–16. [Google Scholar] [CrossRef]
- Yan, K.; Muis, S.; Irazoqui, M.; Verlaan, M. Water Level Change Time Series for the European Coast from 1977 to 2100 Derived from Climate Projections. Copernicus Climate Change Service (C3S) Climate Data Store (CDS). Available online: https://cds.climate.copernicus.eu/datasets/sis-water-level-change-timeseries?tab=overview (accessed on 27 March 2025). [CrossRef]
- Sea Level Station Monitoring Facility. Available online: https://www.ioc-sealevelmonitoring.org/station.php?code=iera (accessed on 27 March 2025).
- Toutin, T. Geometric processing of remote sensing images: Models, algorithms and methods. Int. J. Remote Sens. 2004, 25, 1893–1924. [Google Scholar] [CrossRef]
- Günther, F.; Overduin, P.; Sandakov, A.V.; Grosse, G.; Grigoriev, M.N. Short- and long-term thermo-erosion of ice-rich permafrost coasts in the Laptev Sea region. Biogeosciences 2013, 10, 4297–4318. [Google Scholar] [CrossRef]
- Novikova, A.; Belova, N.; Baranskaya, A.; Aleksyutina, D.; Maslakov, A.; Zelenin, E.; Shabanova, N.; Ogorodov, S. Dynamics of permafrost coasts of Baydaratskaya Bay (Kara Sea) based on multi-temporal remote sensing data. Remote Sens. 2018, 10, 1481. [Google Scholar] [CrossRef]
- Ramieri, E.; Hartley, A.; Barbanti, A.; Santos, F.D.; Gomes, A.; Hilden, M.; Laihonen, P.; Marinova, N.; Santini, M. Methods for Assessing Coastal Vulnerability to Climate Change. ETC CCA Tech. Pap. 2011, 1, 1–93. Available online: https://www.eionet.europa.eu/etcs/etc-cca/products/etc-cca-reports/1 (accessed on 14 April 2025).
- Apostolakou, V.; Brogan, T.; Betancourt, P. Bramiana: Salvaging Information from a Destroyed Minoan Settlement in Southeast Crete. 2021, pp. 1–210. Available online: https://www.torrossa.com/it/resources/an/5084270 (accessed on 14 April 2025).
- Maanan, M.; Maanan, M.; Rueff, H.; Adouk, N.; Zourarah, B.; Rhinane, H. Assess the human and environmental vulnerability for coastal hazard by using a multi-criteria decision analysis. Hum. Ecol. Risk Assess. Int. J. 2018, 24, 1642–1658. [Google Scholar] [CrossRef]
- Karymbalis, E.; Chalkias, C.; Chalkias, G.; Grigoropoulou, E.; Manthos, G.; Ferentinou, M. Assessment of the sensitivity of the southern coast of the Gulf of Corinth (Peloponnese, Greece) to sea-level rise. Cent. Eur. J. Geosci. 2012, 4, 561–577. [Google Scholar] [CrossRef]
- Ružić, I.; Dugonjić Jovančević, S.; Benac, Č.; Krvavica, N. Assessment of the Coastal Vulnerability Index in an Area of Complex Geological Conditions on the Krk Island, Northeast Adriatic Sea. Geosciences 2019, 9, 219. [Google Scholar] [CrossRef]
- Cavaleri, L.; Abdalla, S.; Benetazzo, A.; Bertotti, L.; Bidlot, J.R.; Breivik, Ø.; Carniel, S.; Jensen, R.E.; Portilla-Yandun, J.; Rogers, W.E.; et al. Wave modelling in coastal and inner seas. Prog. Oceanogr. 2018, 167, 164–233. [Google Scholar] [CrossRef]
- Wang, J.; Wang, Y. Evaluation of the ERA5 significant wave height against NDBC buoy data from 1979 to 2019. Mar. Geod. 2022, 45, 151–165. [Google Scholar] [CrossRef]
- Bellotti, G.; Franco, L.; Cecioni, C. Regional Downscaling of Copernicus ERA5 Wave Data for Coastal Engineering Activities and Operational Coastal Services. Water 2021, 13, 859. [Google Scholar] [CrossRef]
- Roome, E.; Christie, D.; Neill, S. Predicting coastal wave conditions: A simple machine learning approach. Appl. Ocean. Res. 2024, 153, 104282. [Google Scholar] [CrossRef]
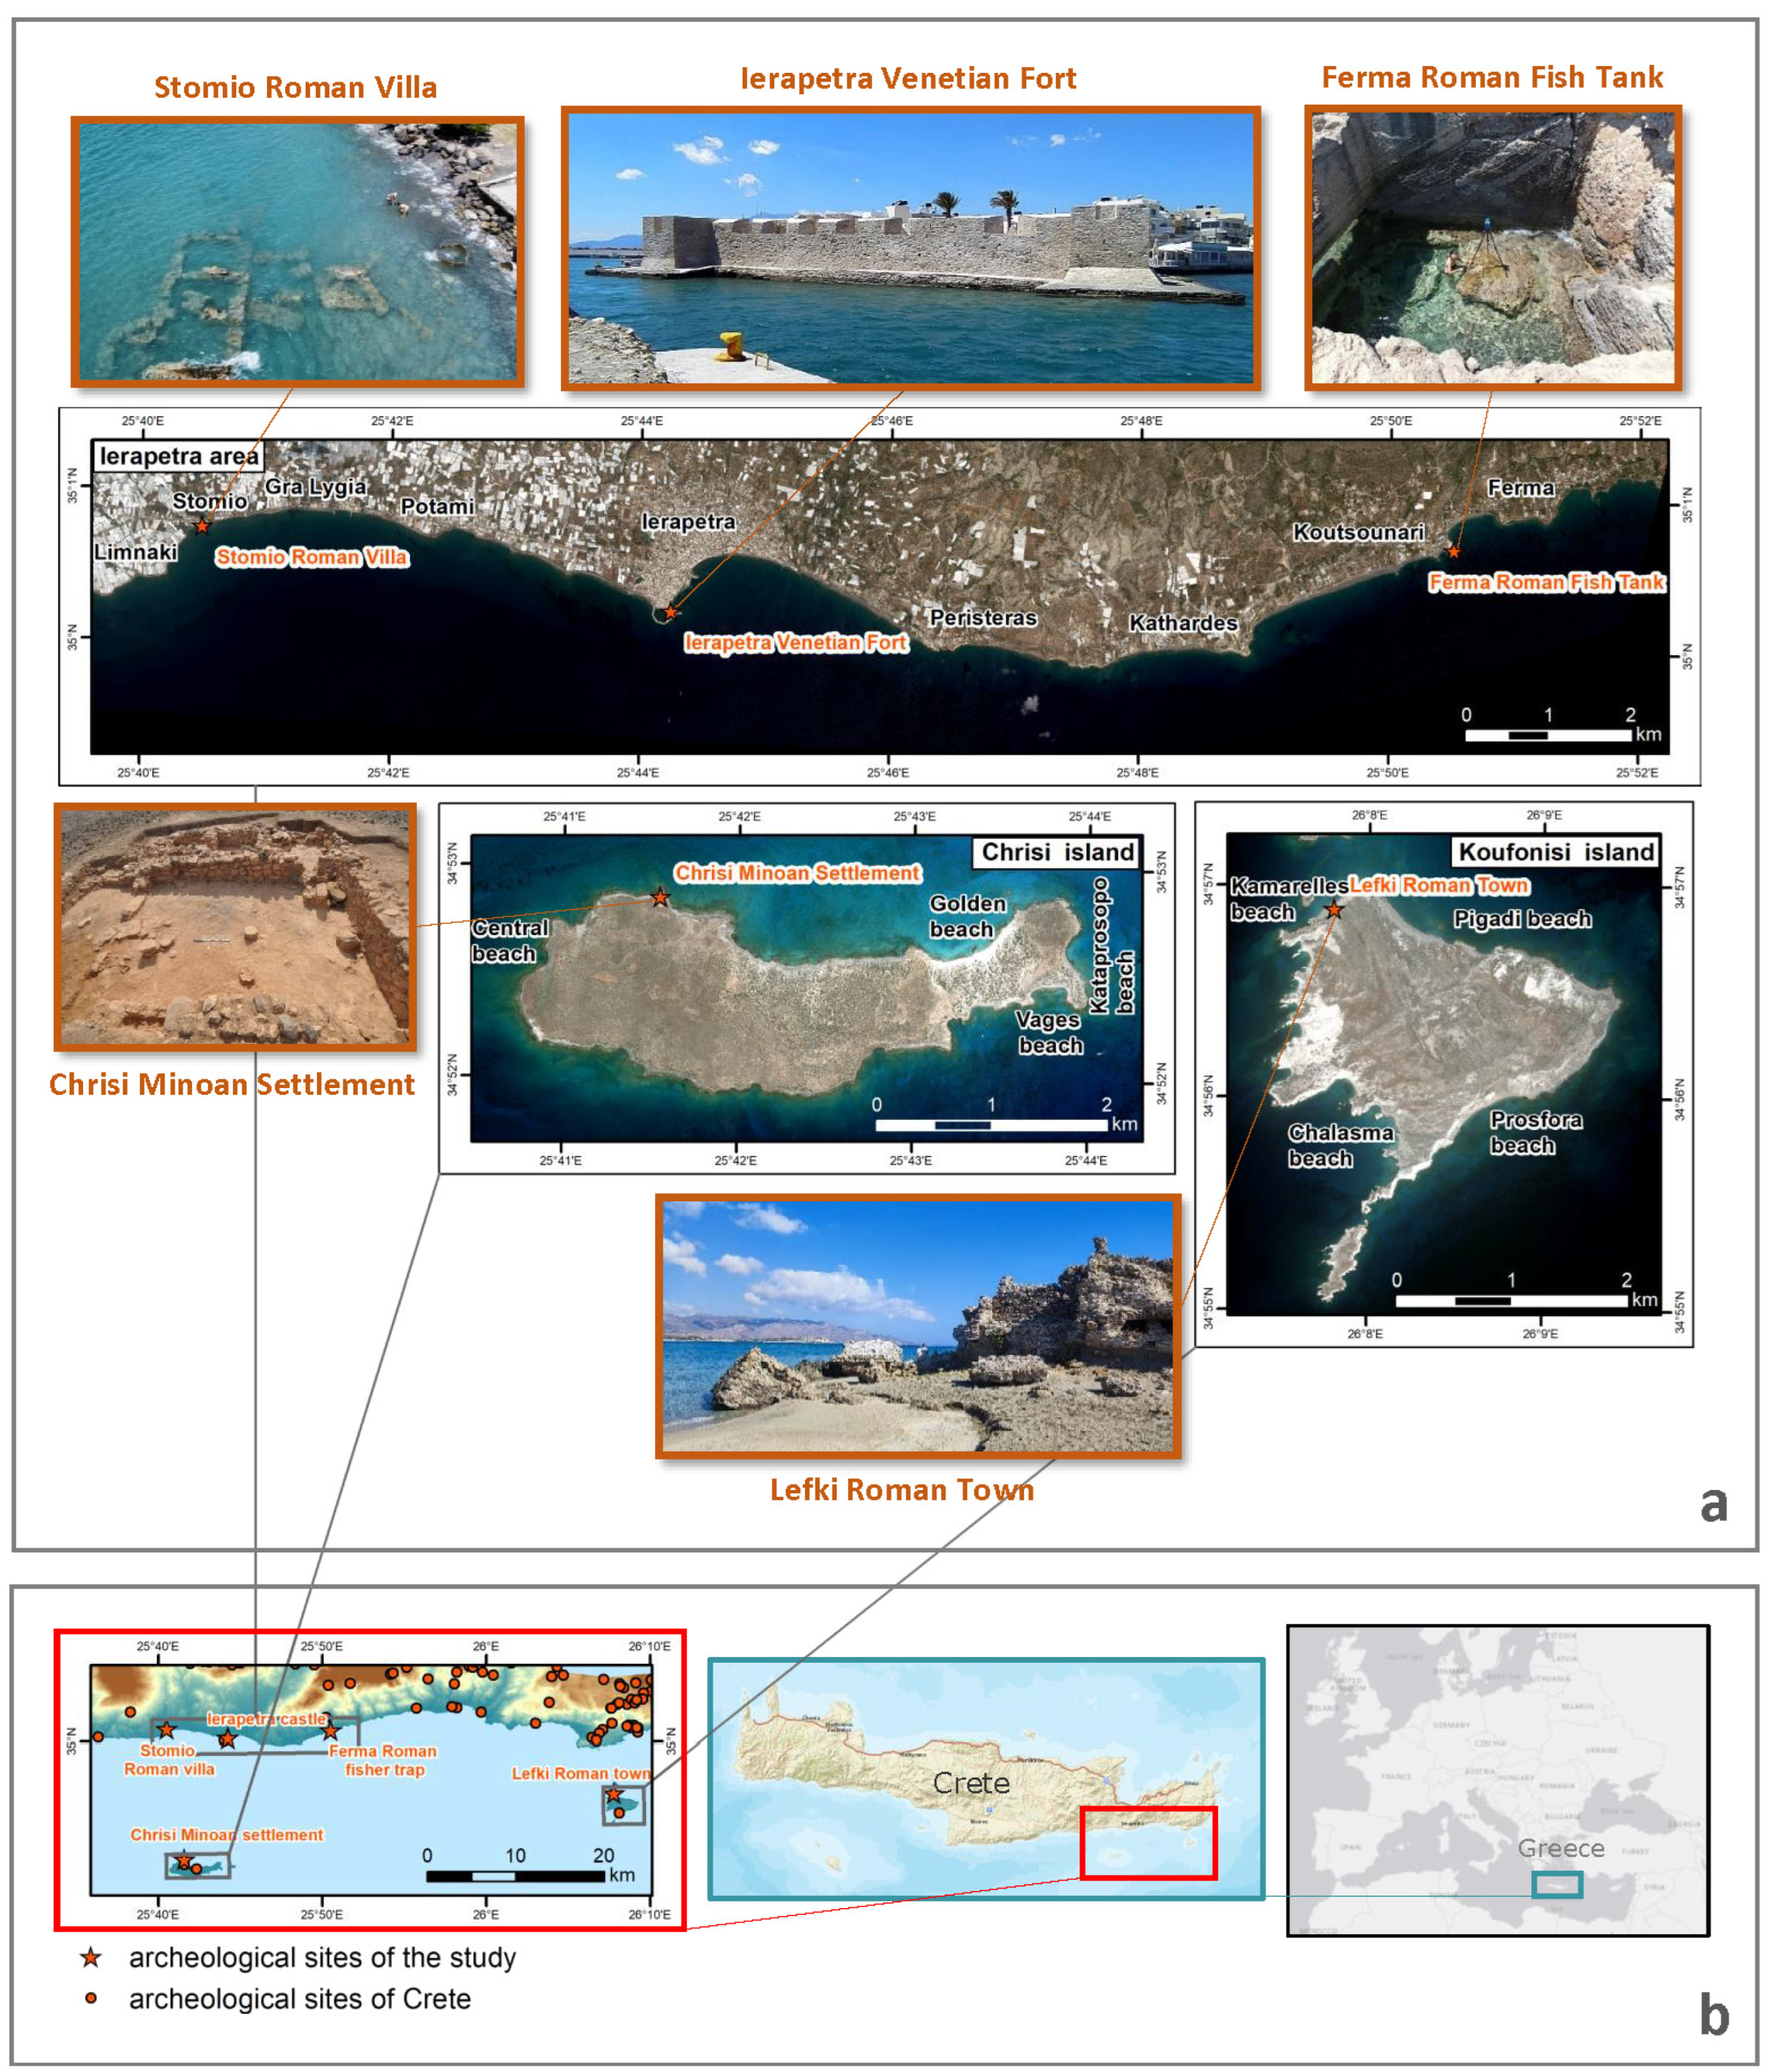
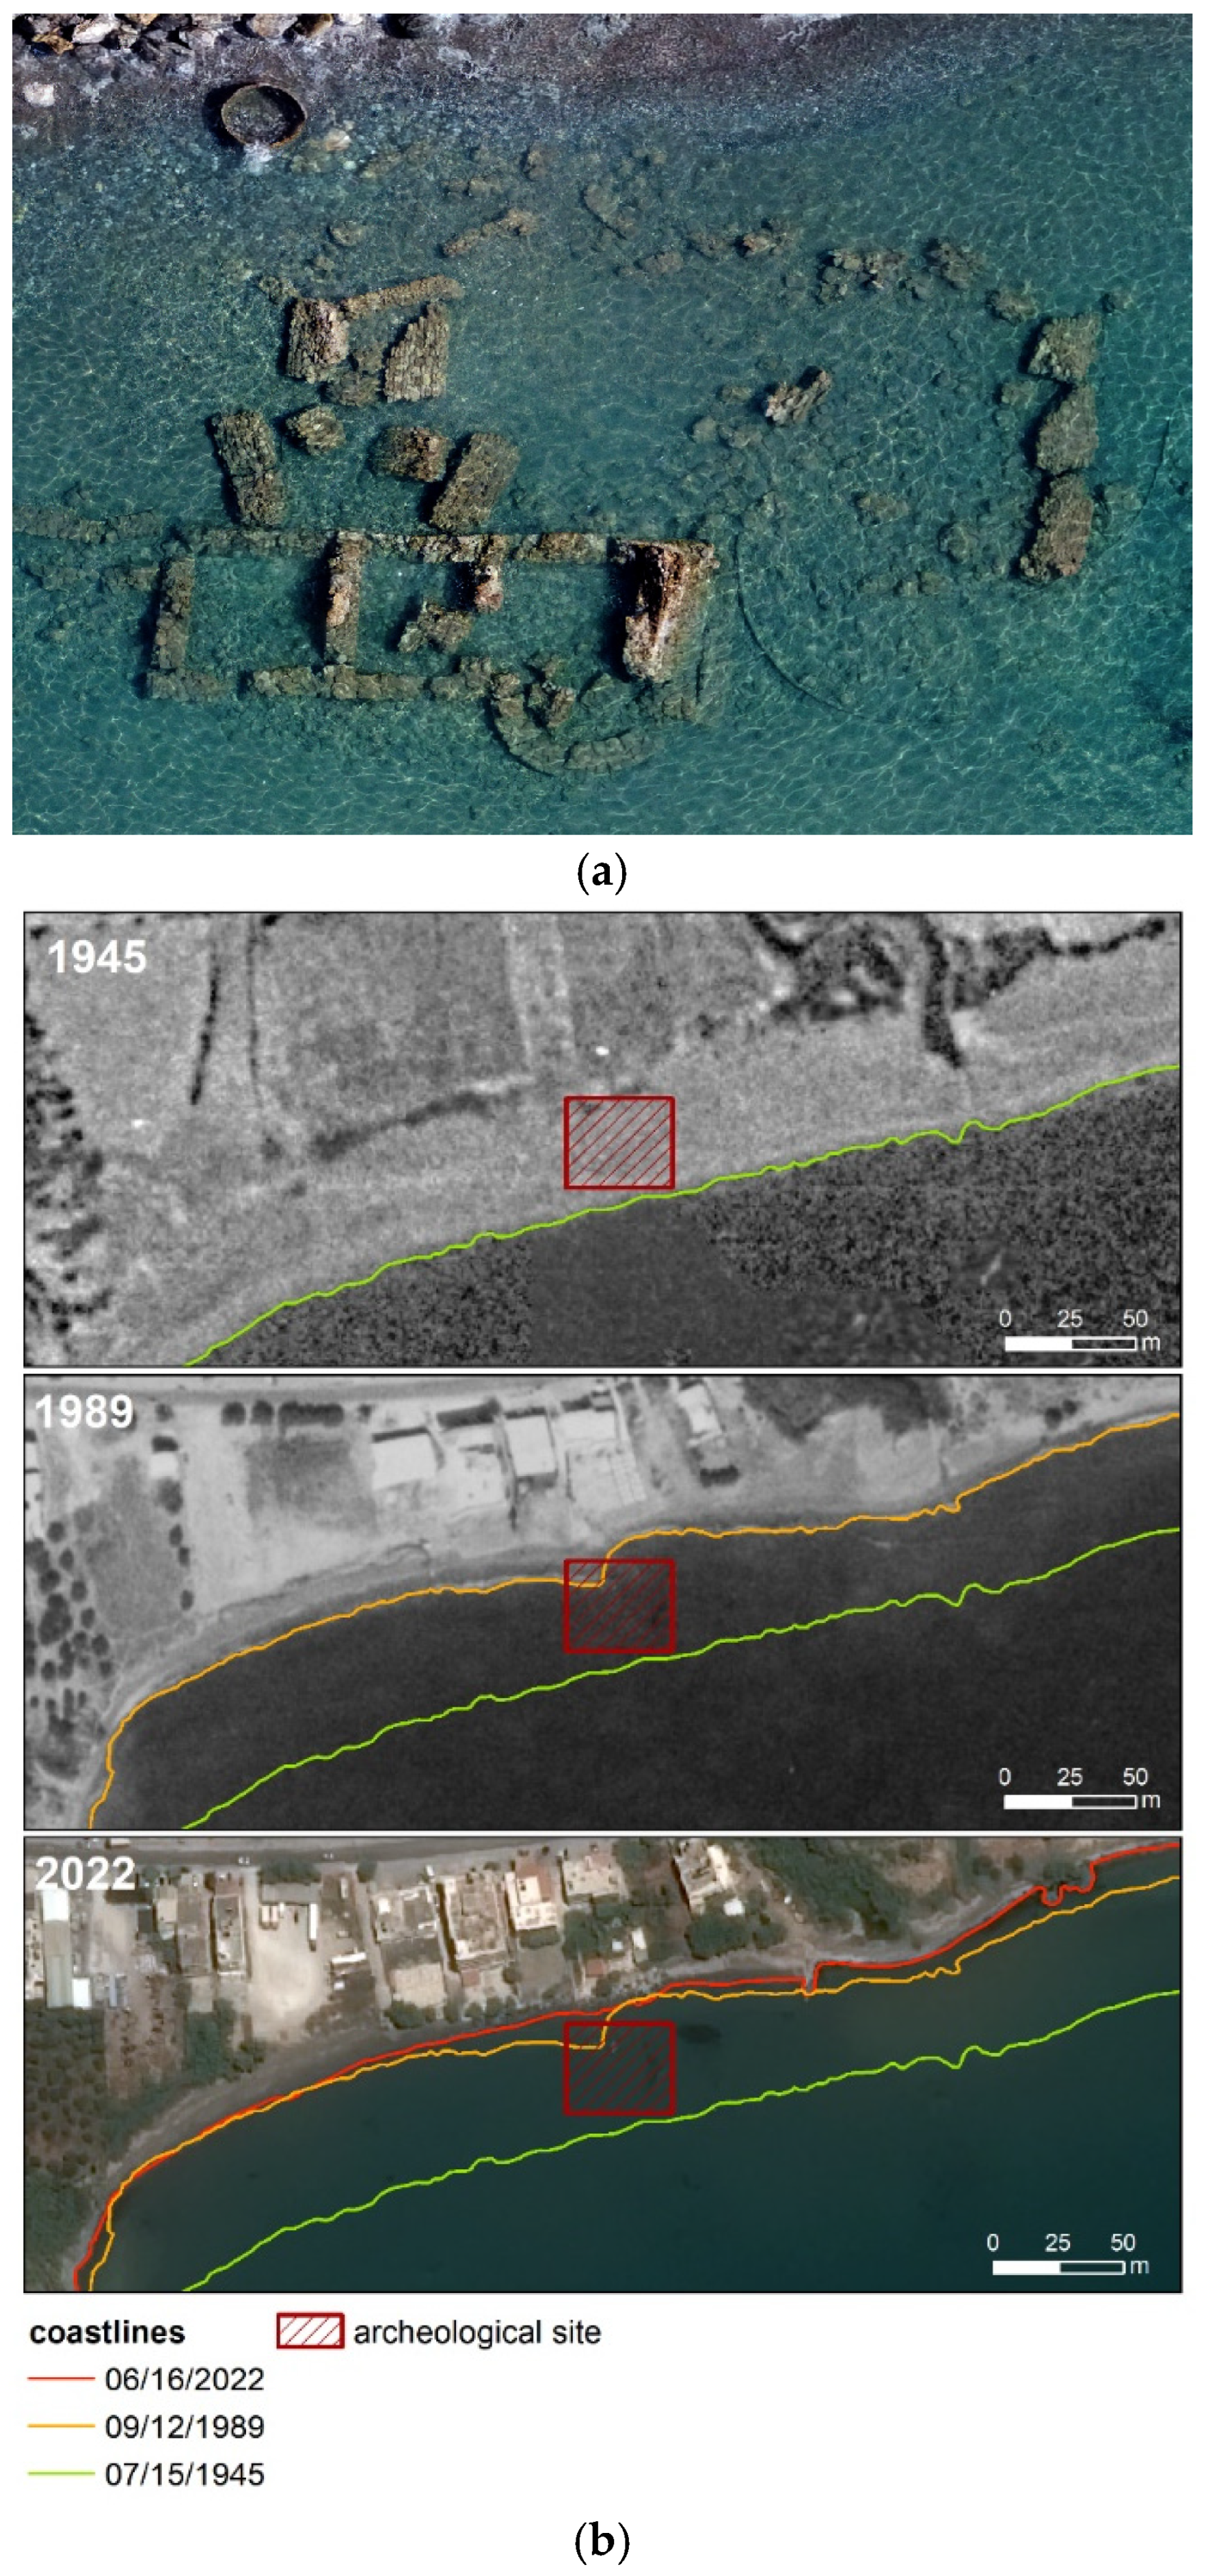
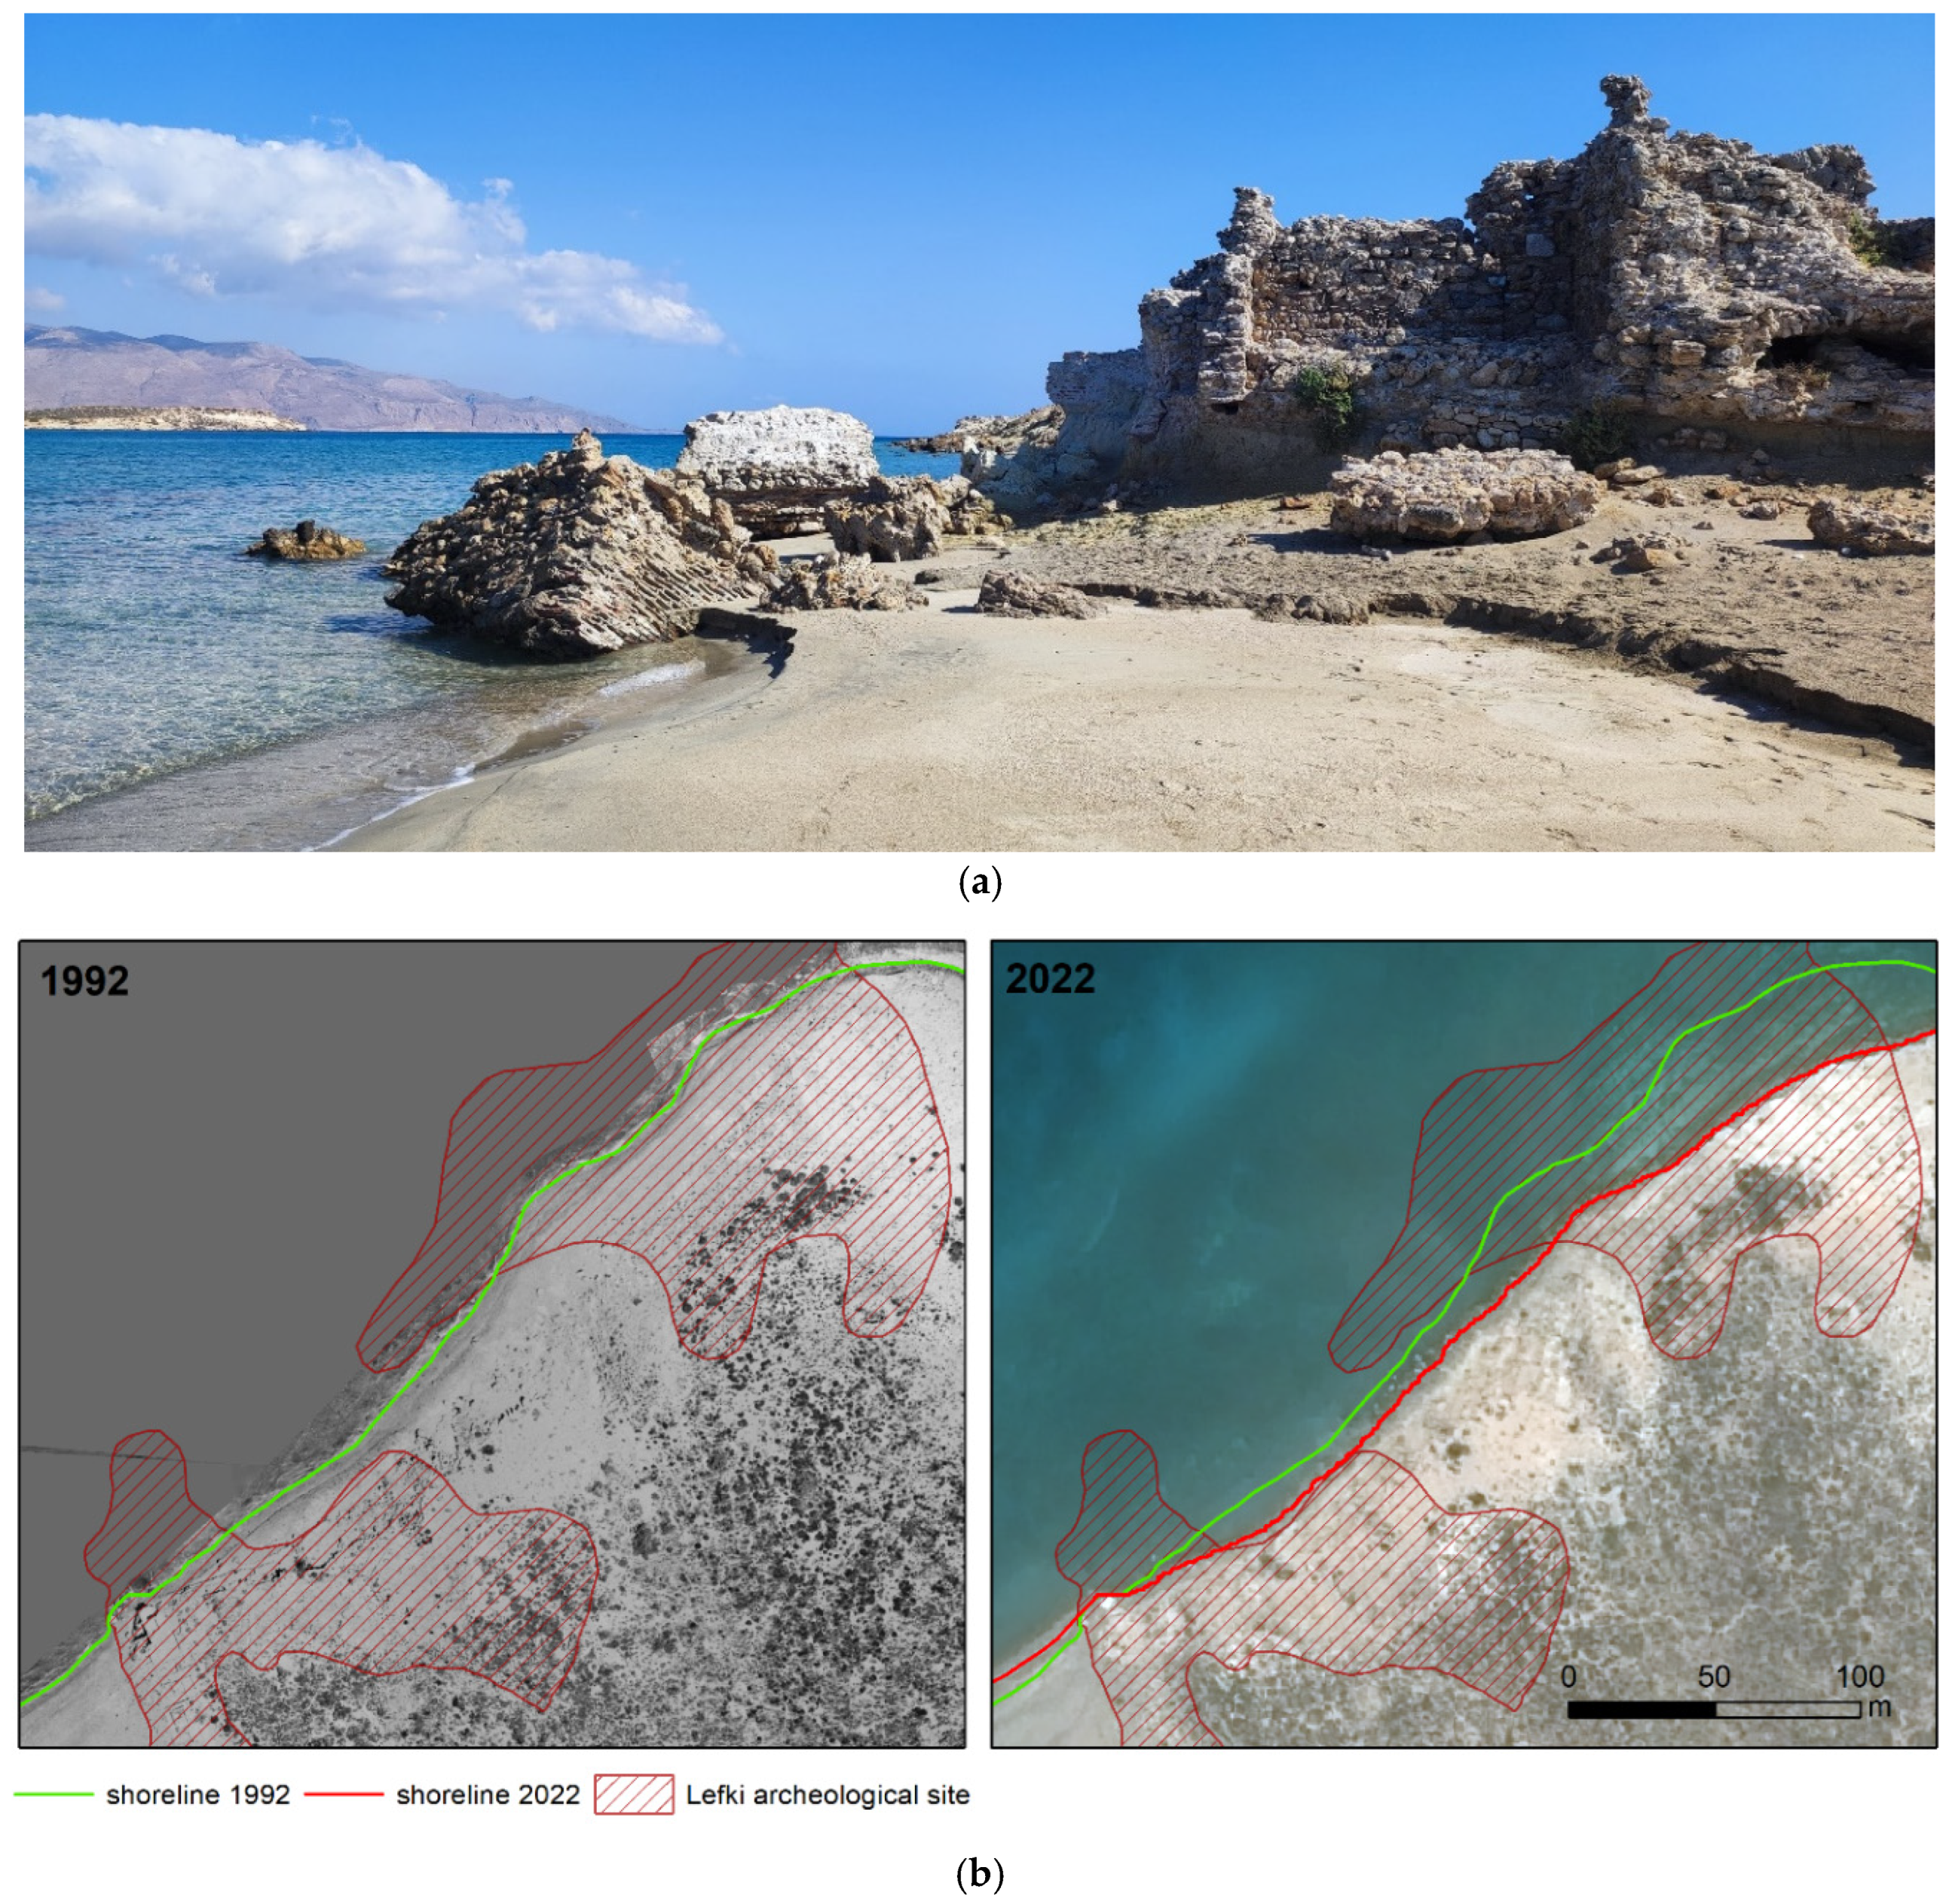
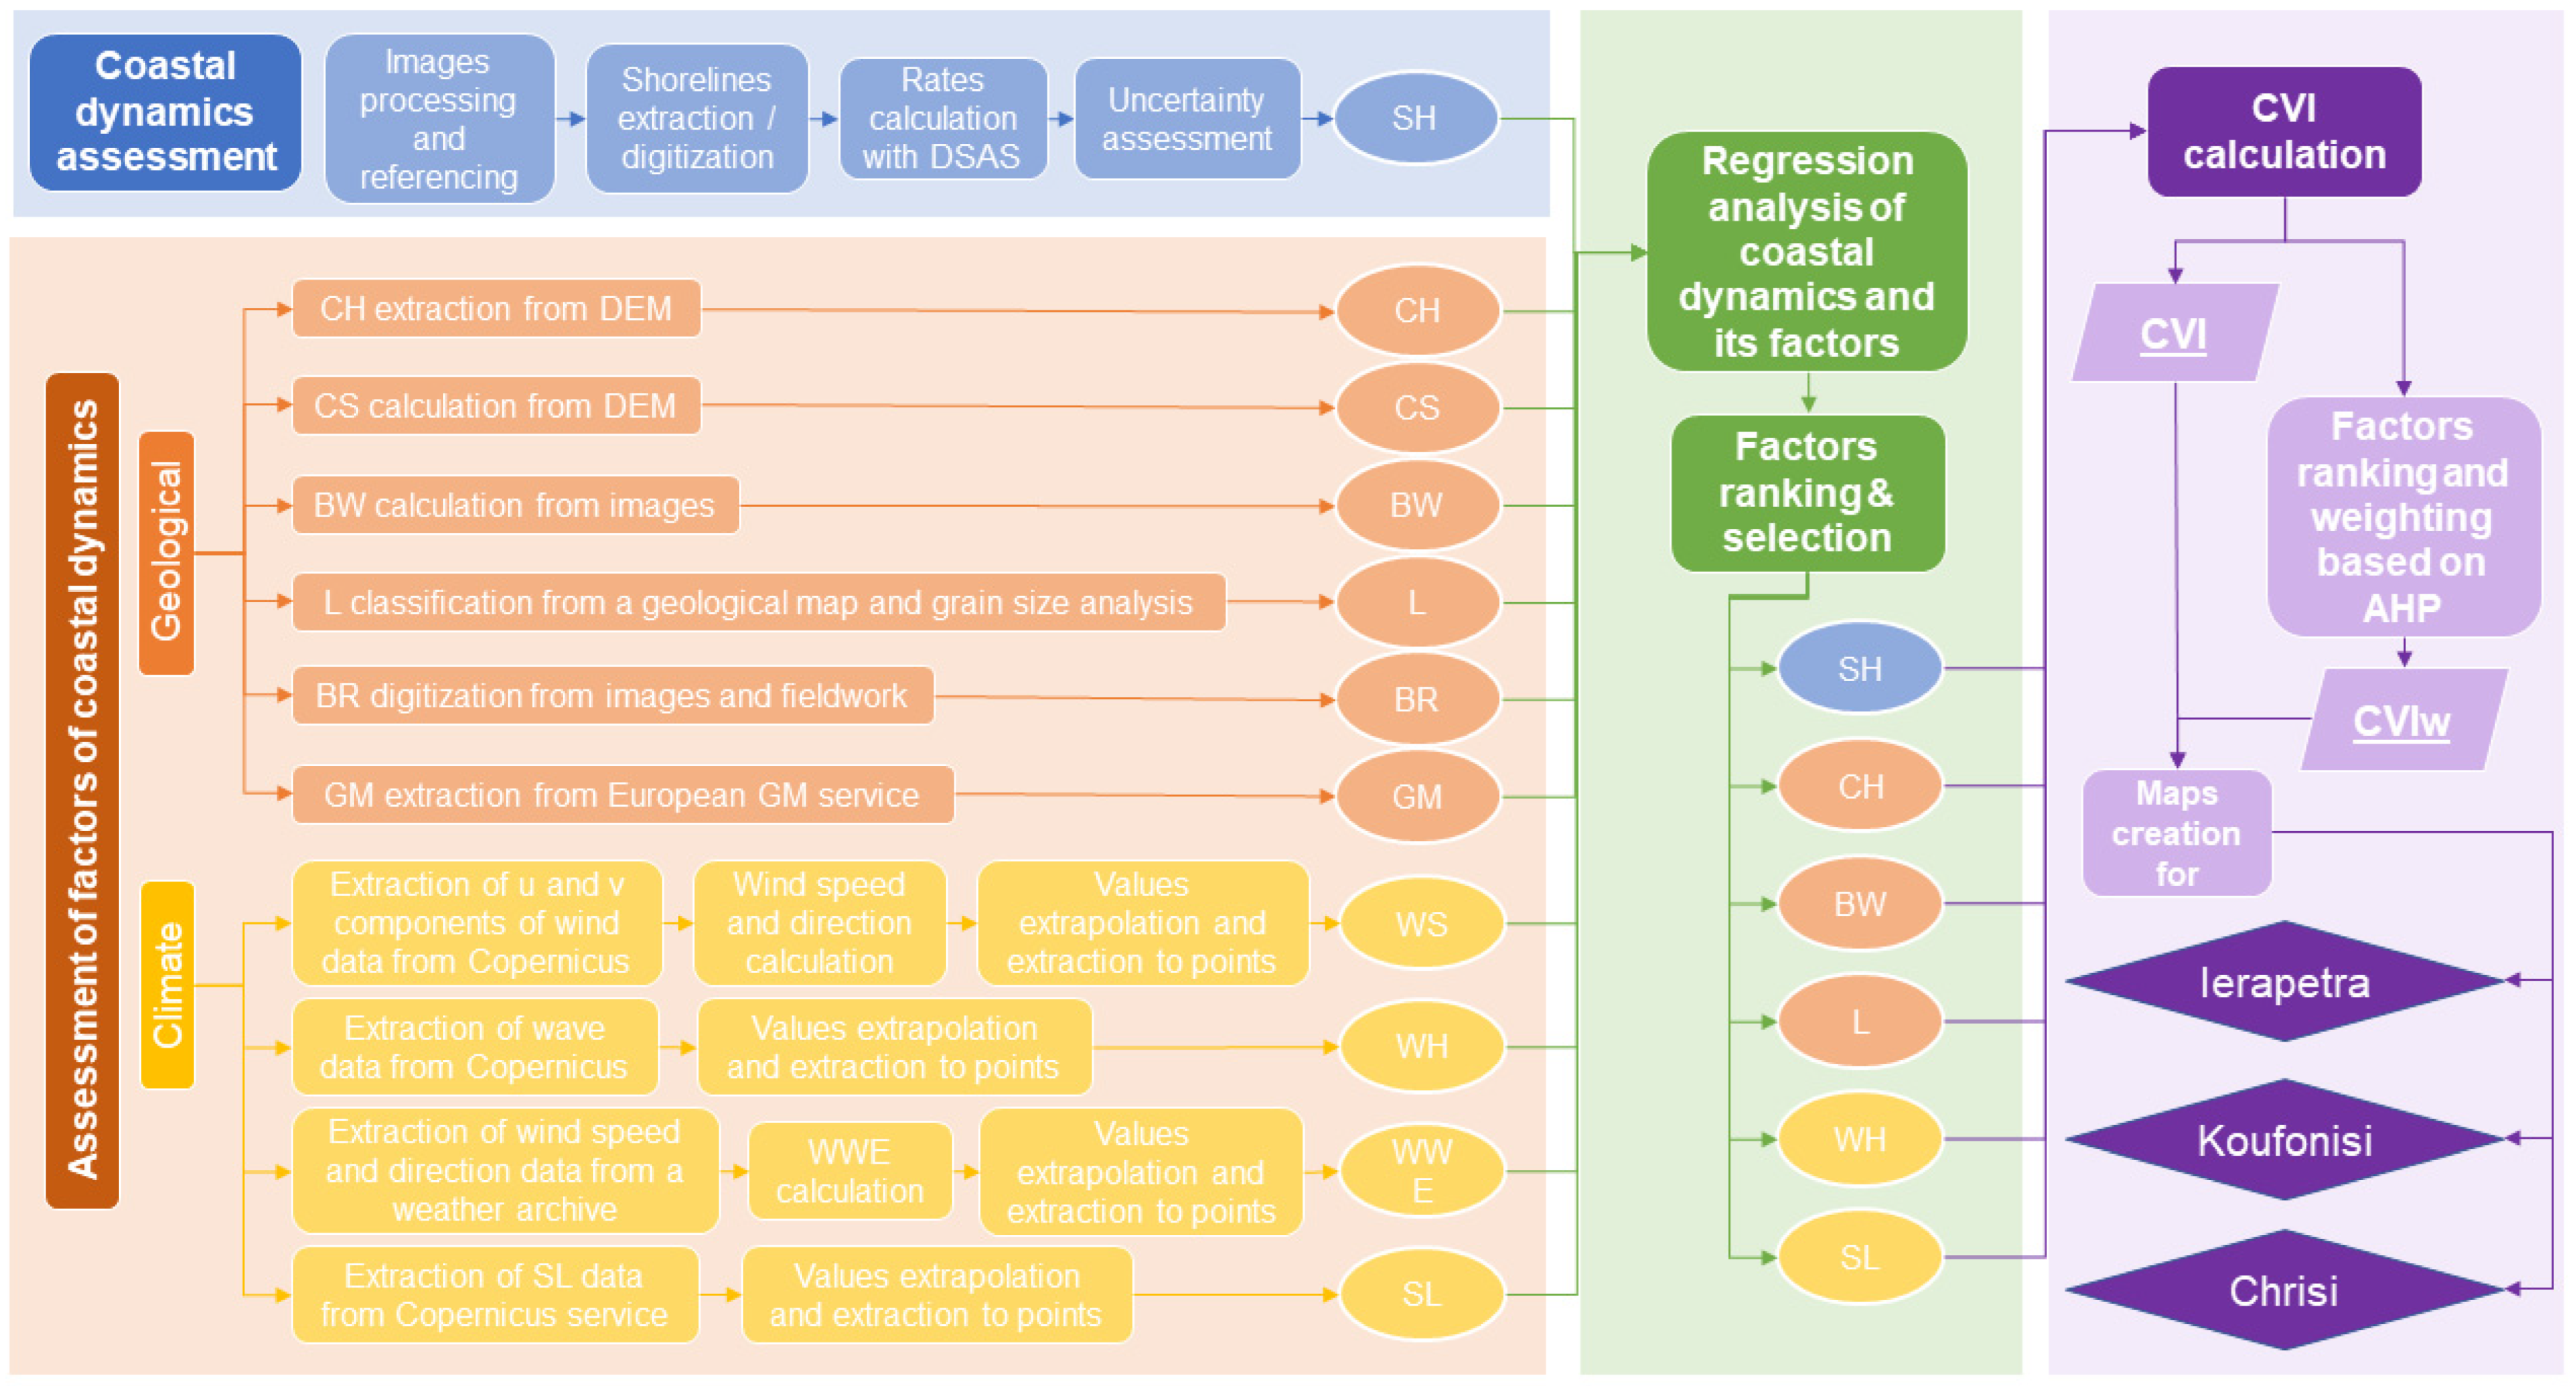
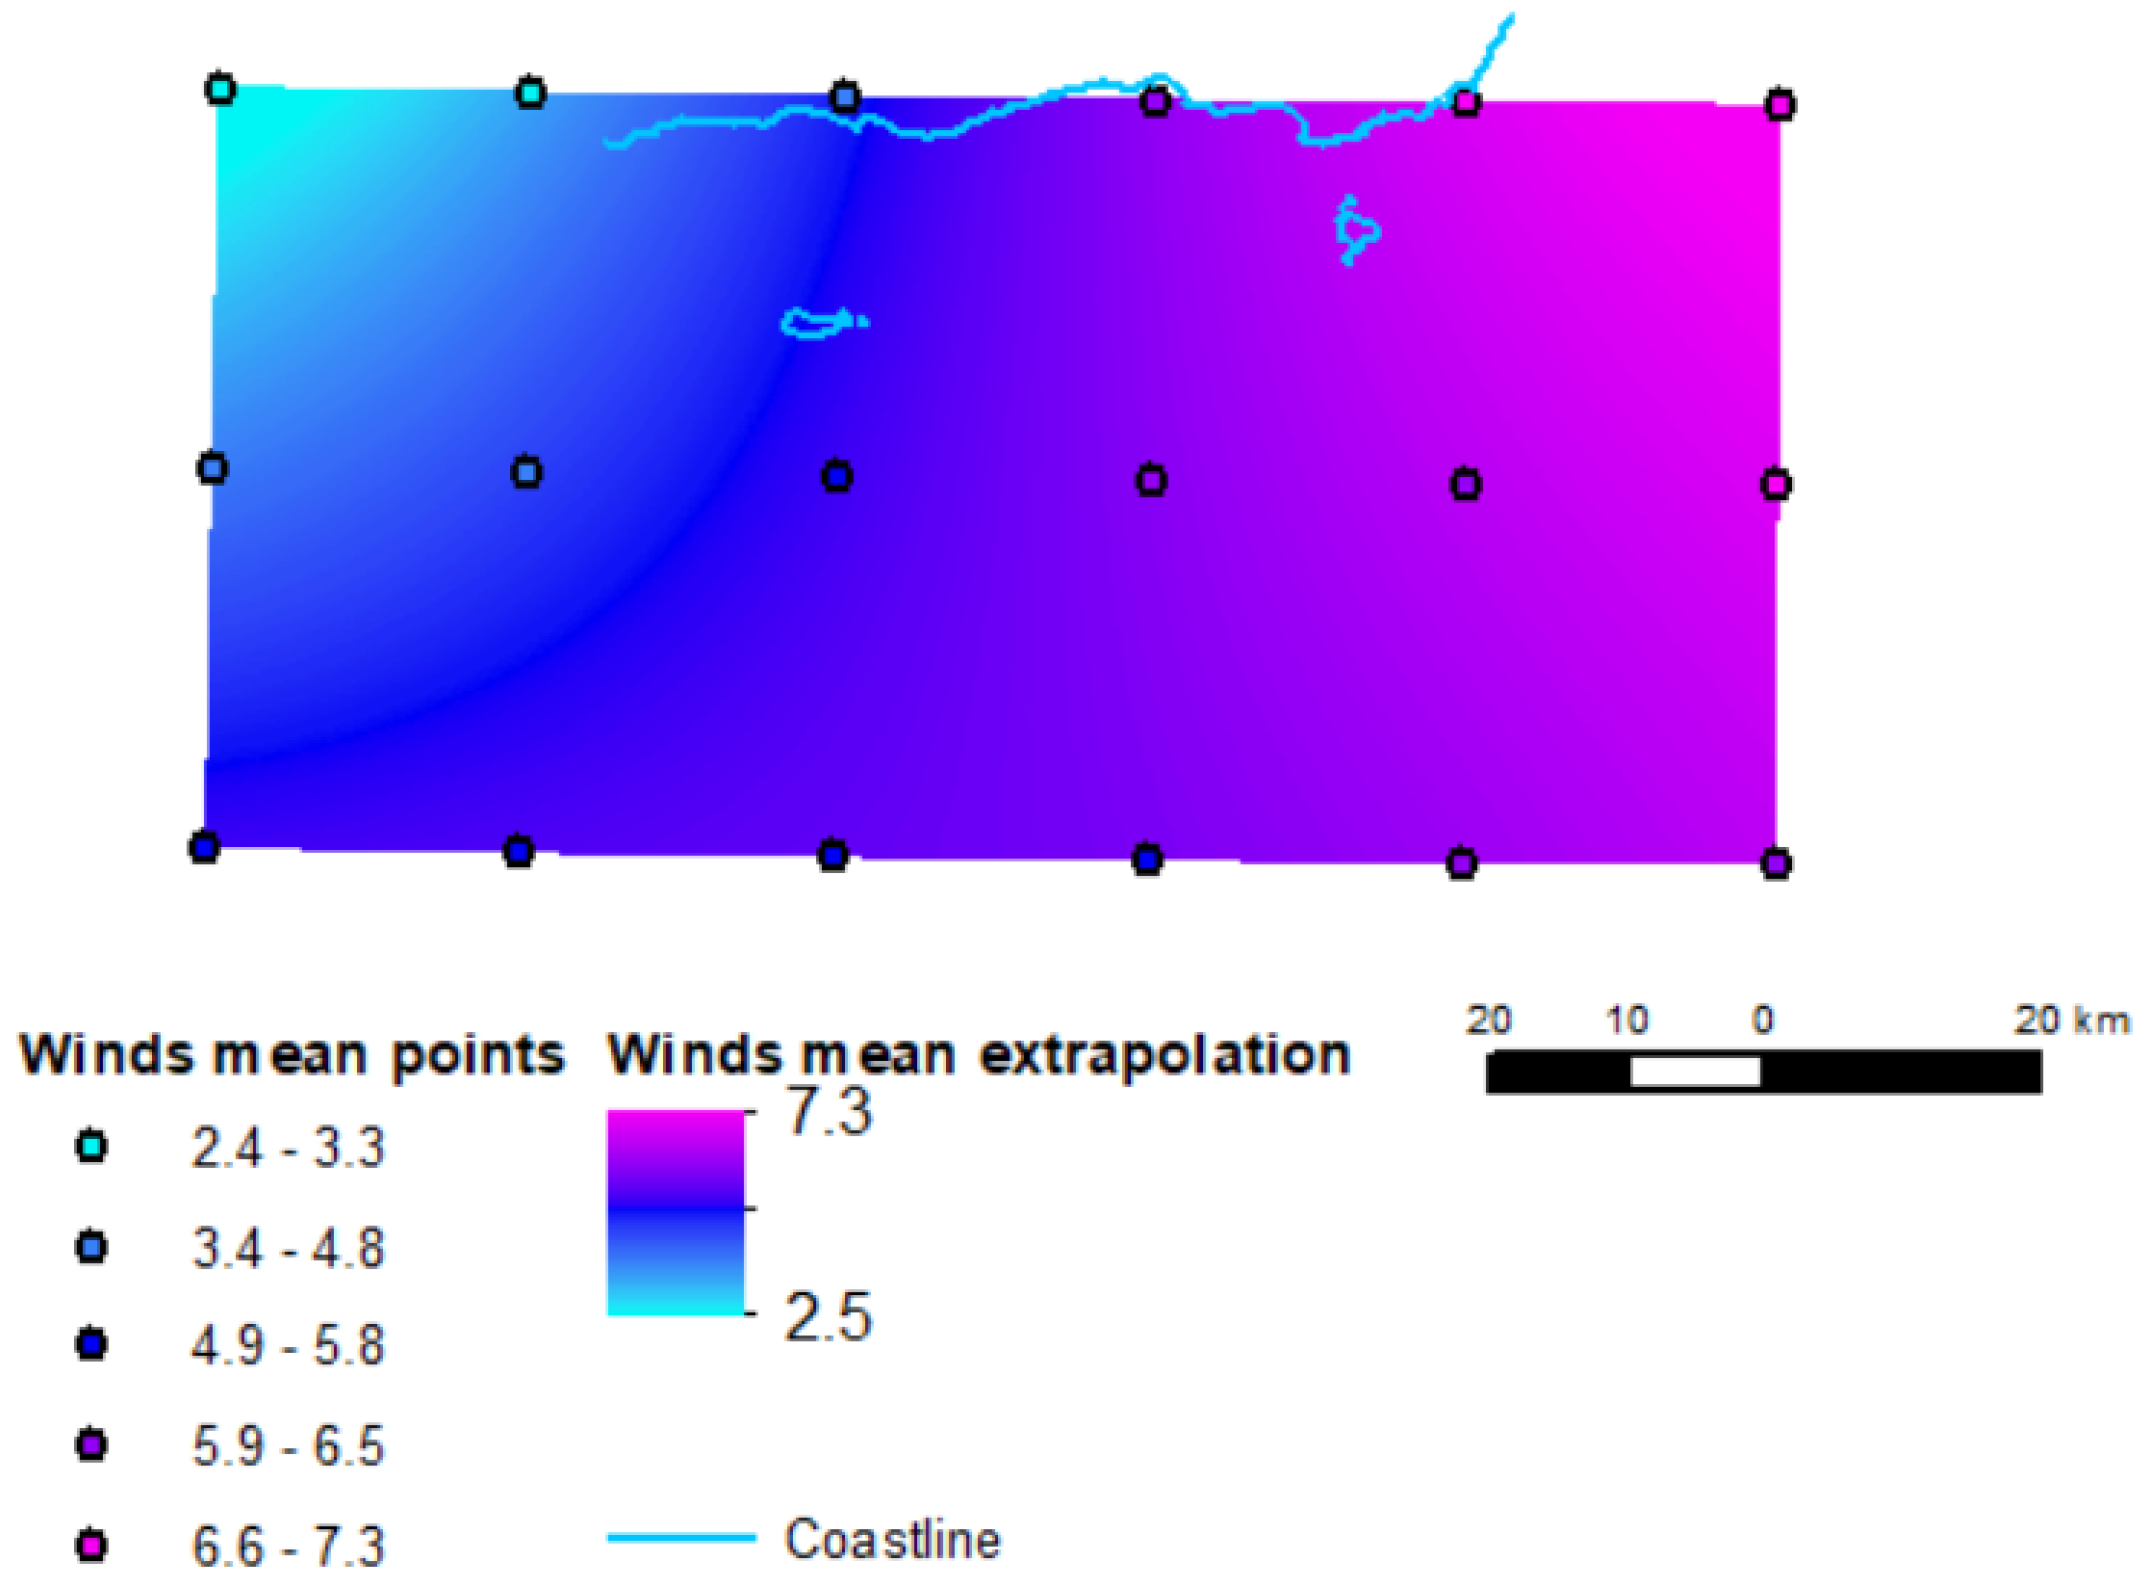


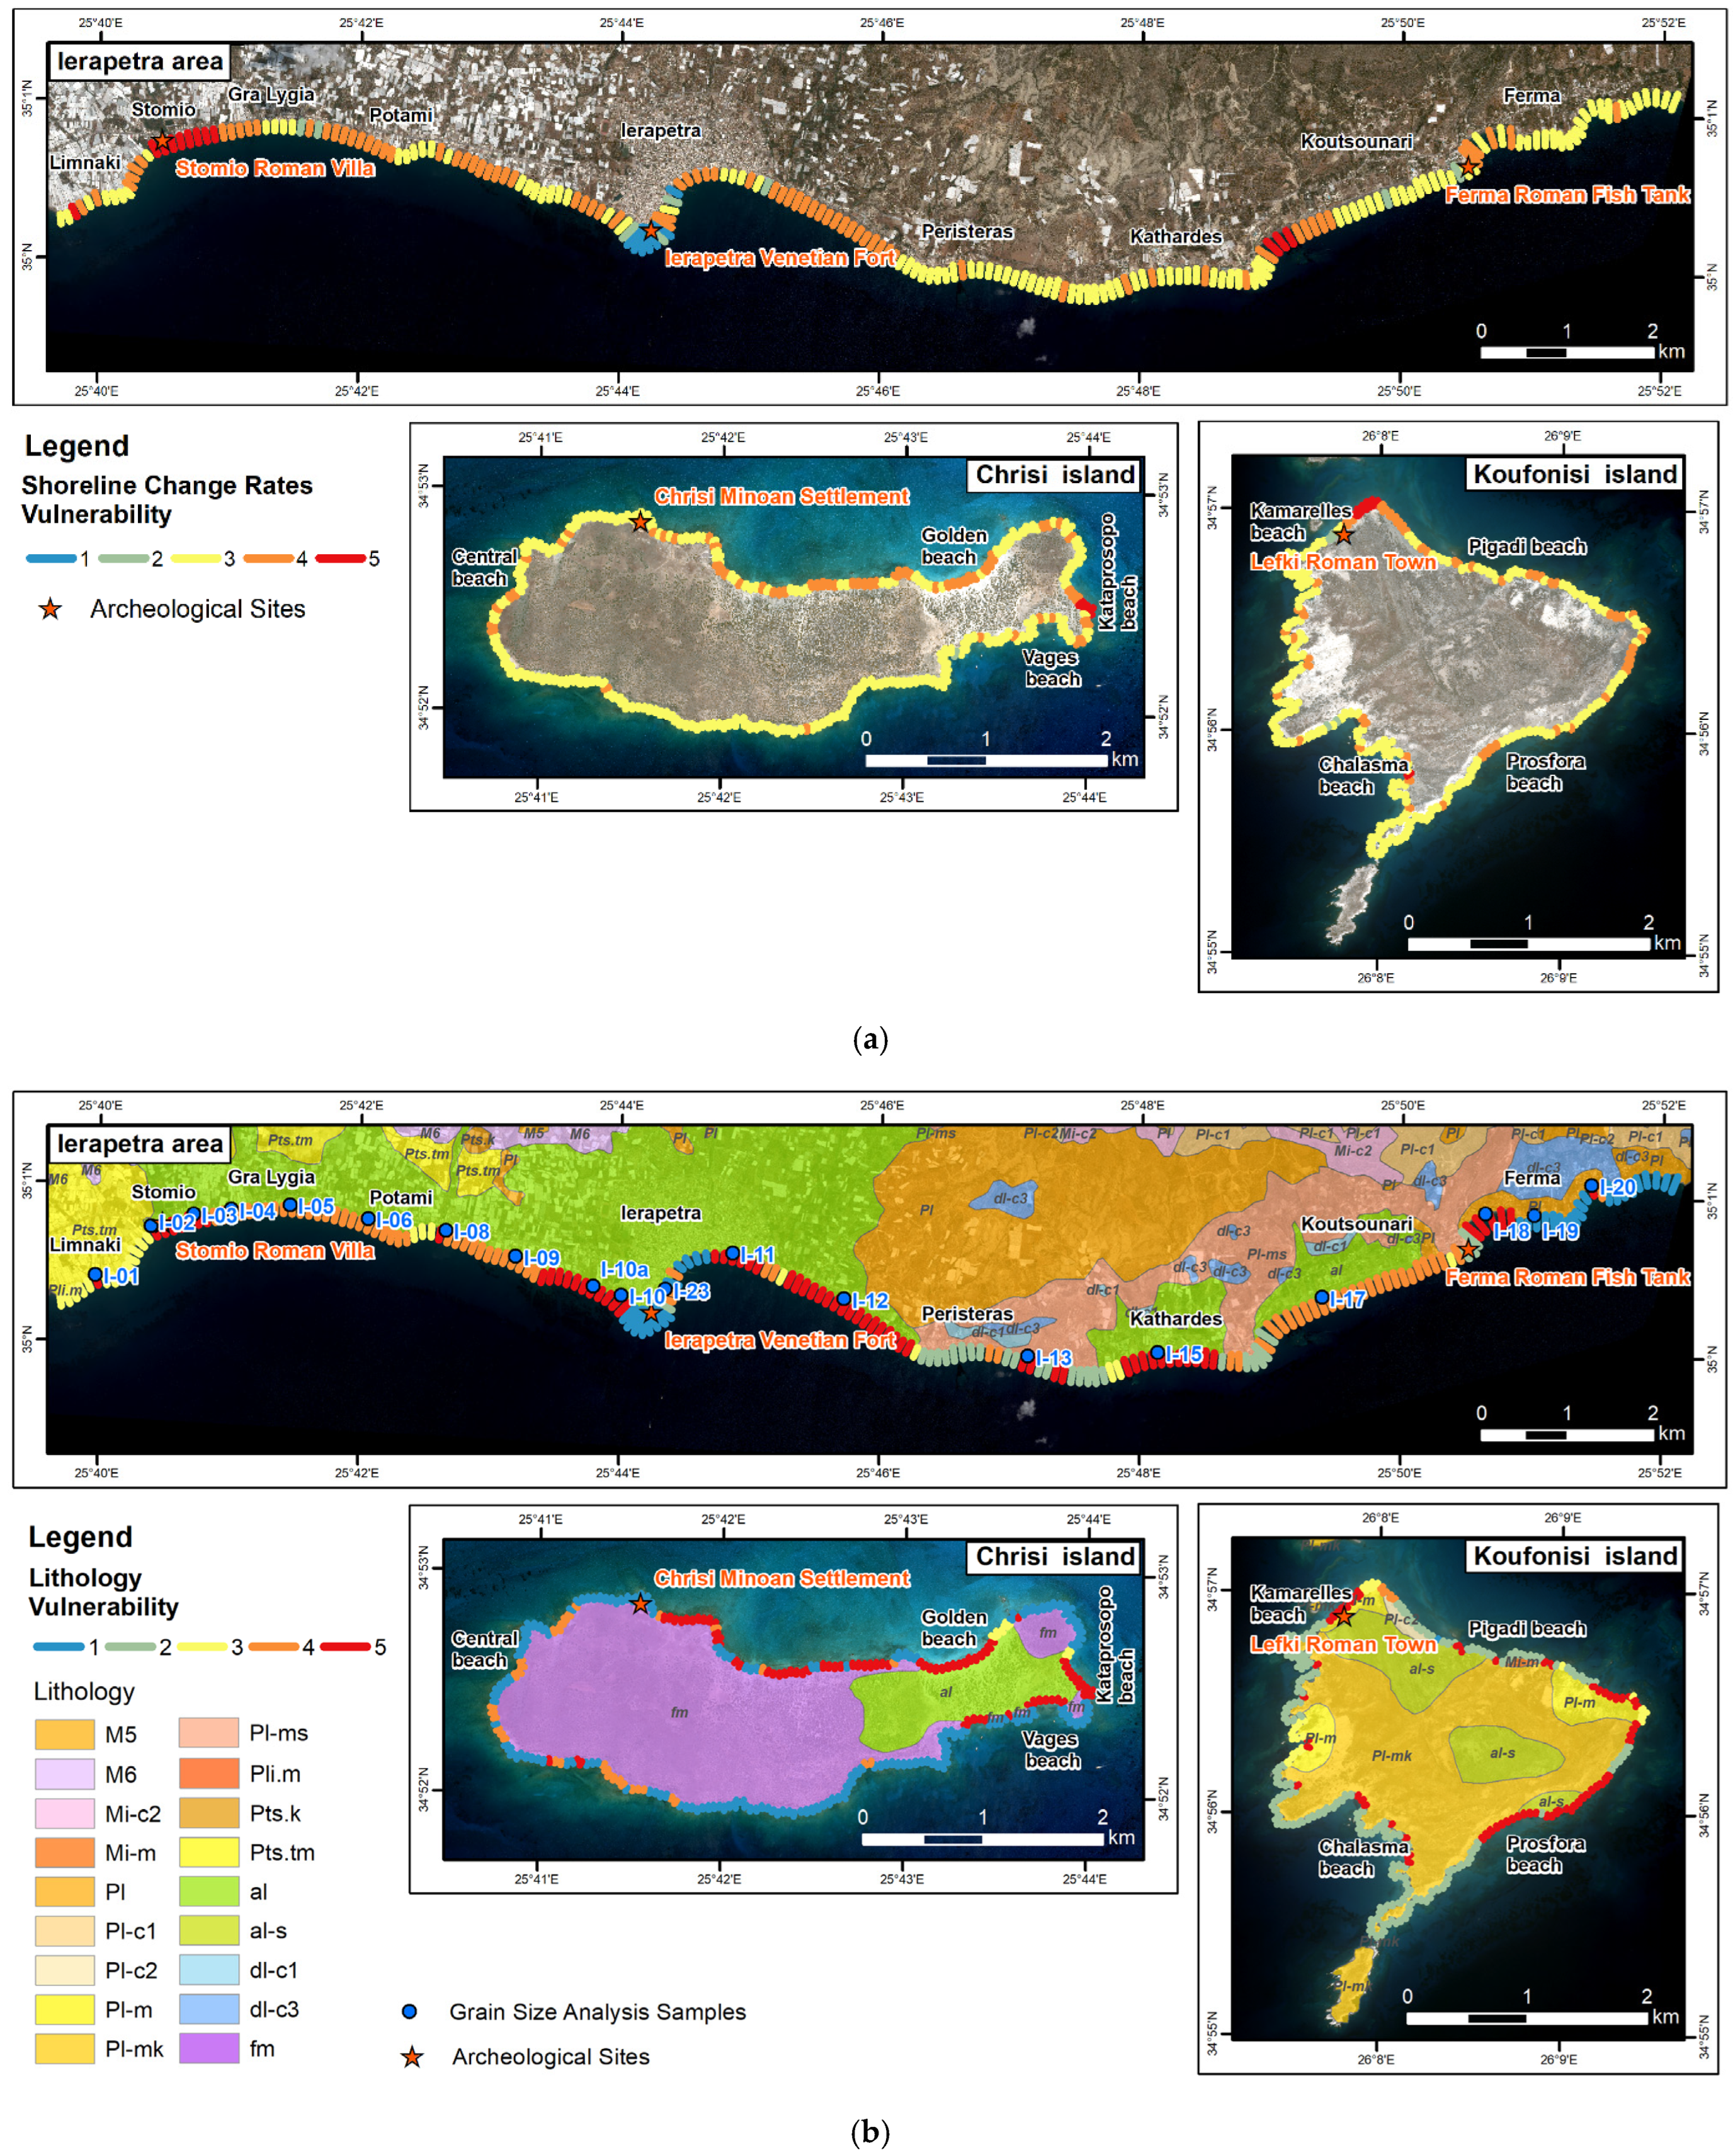
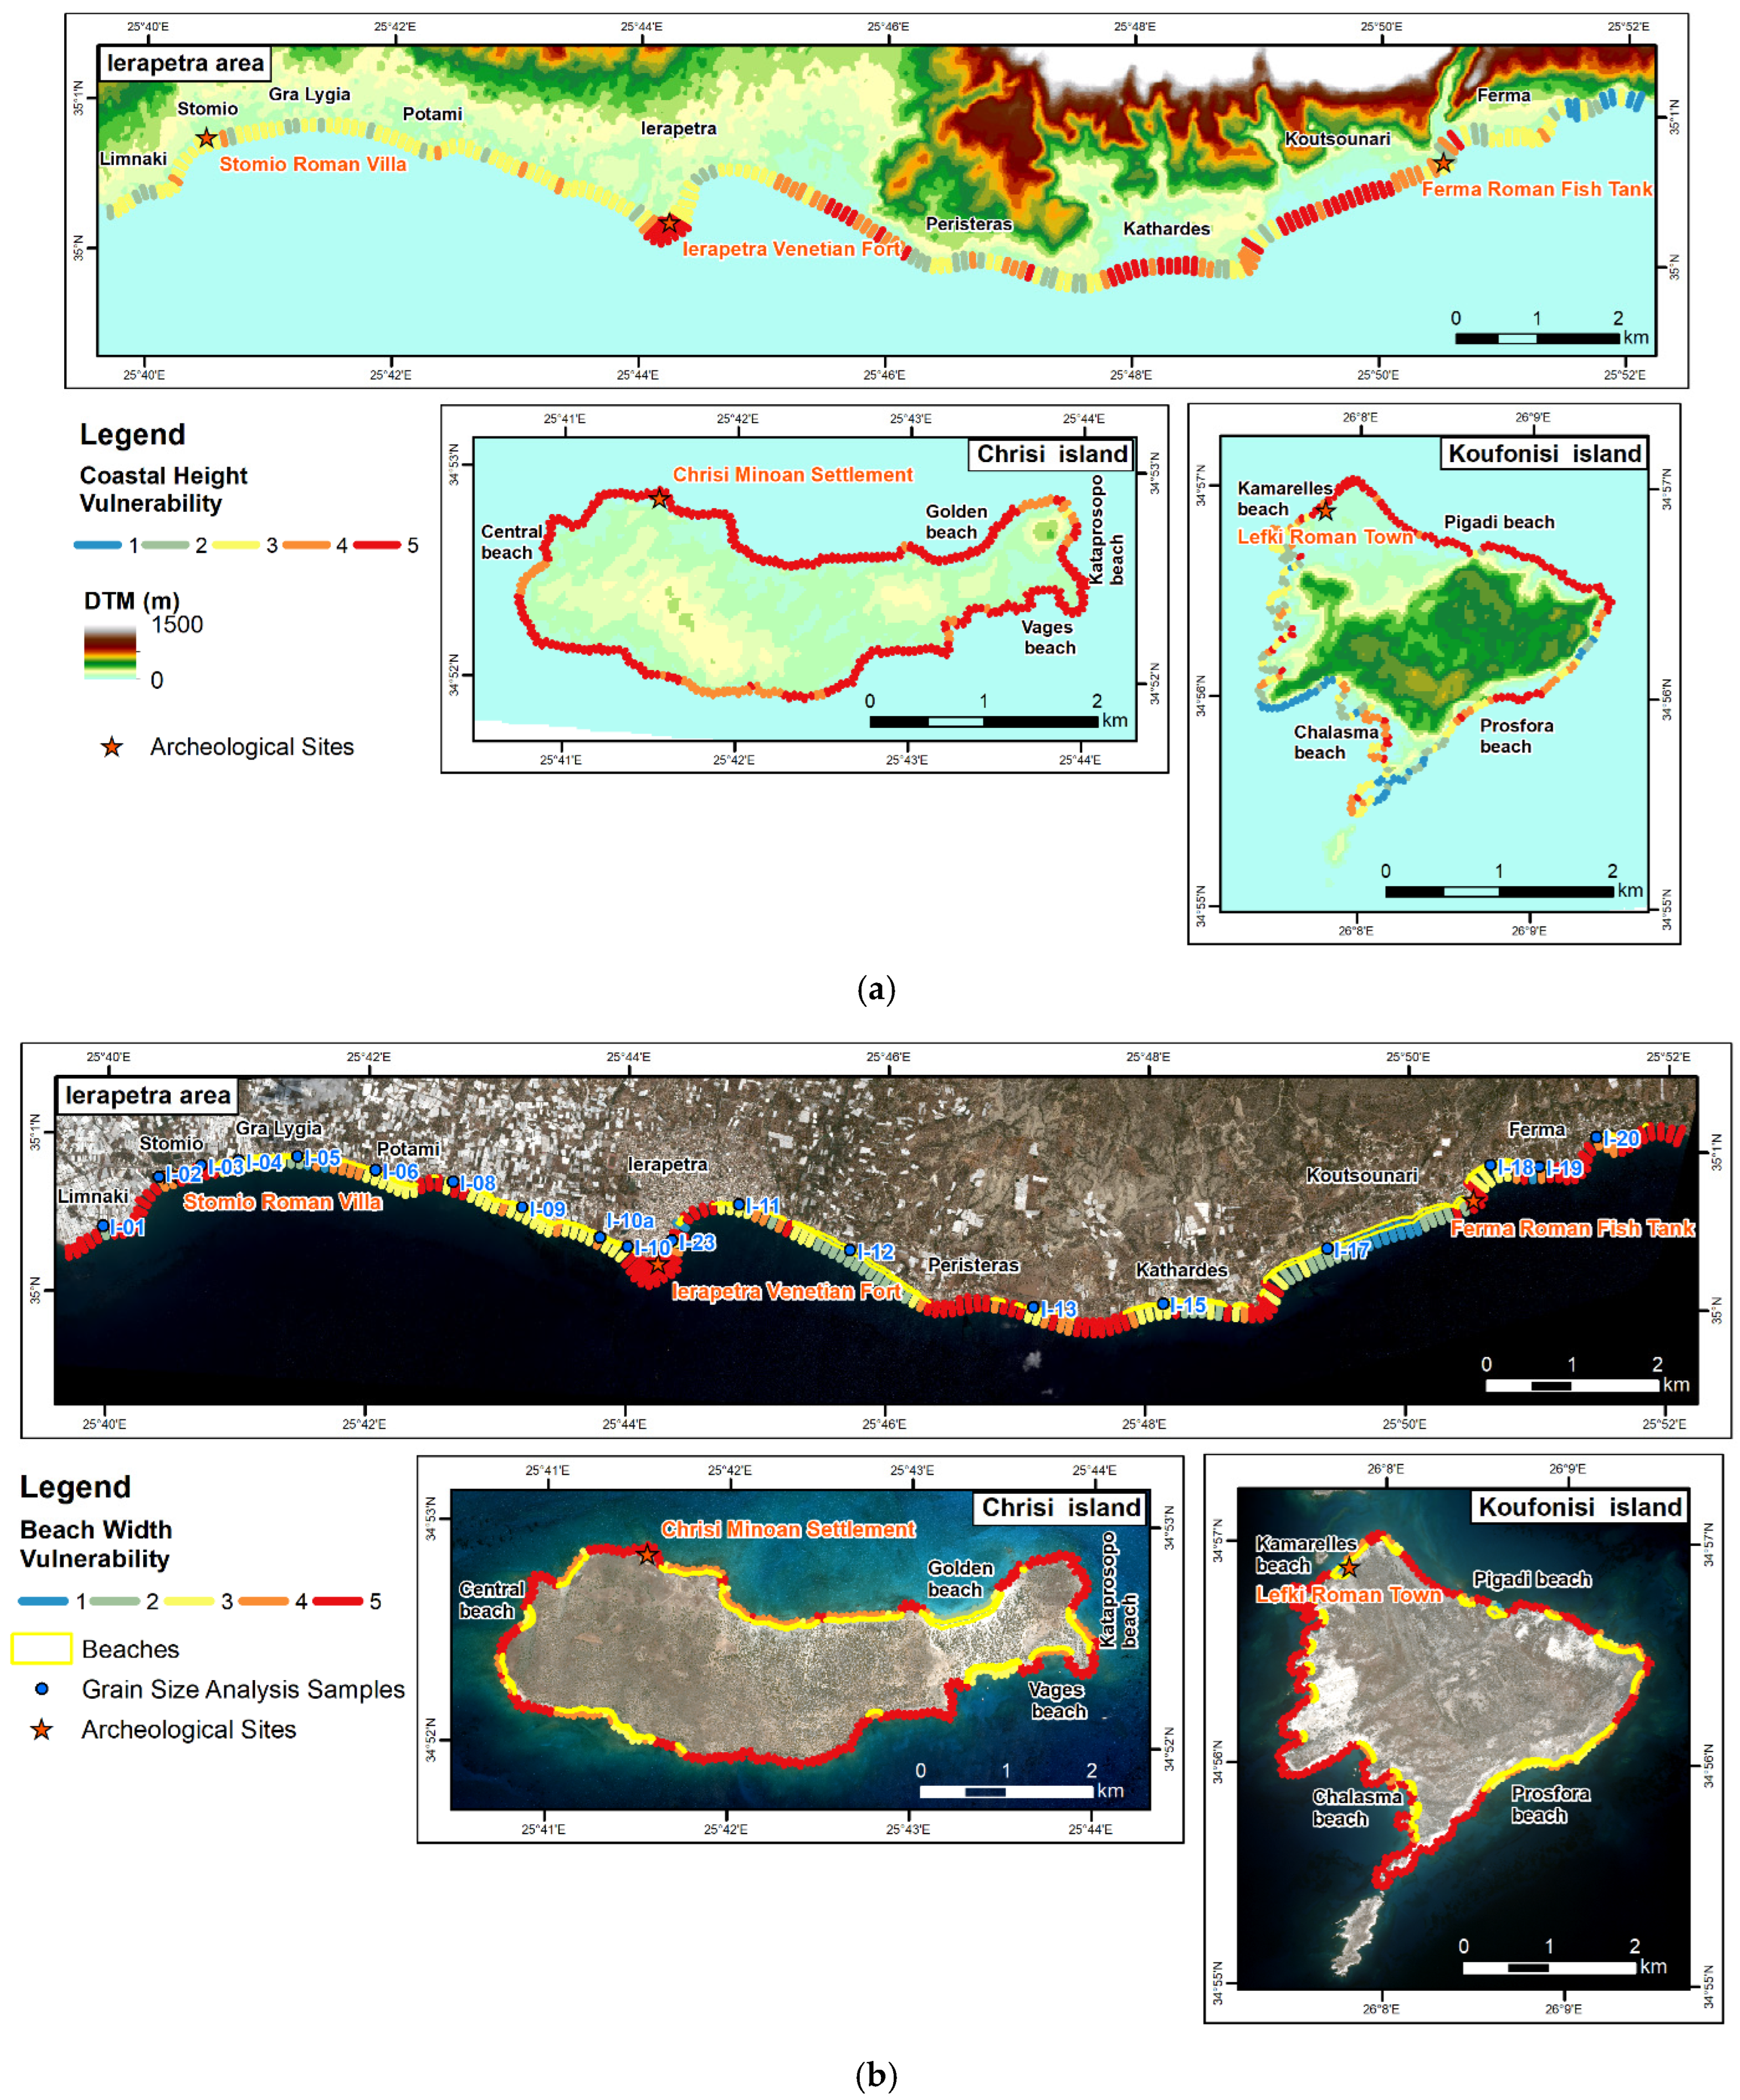
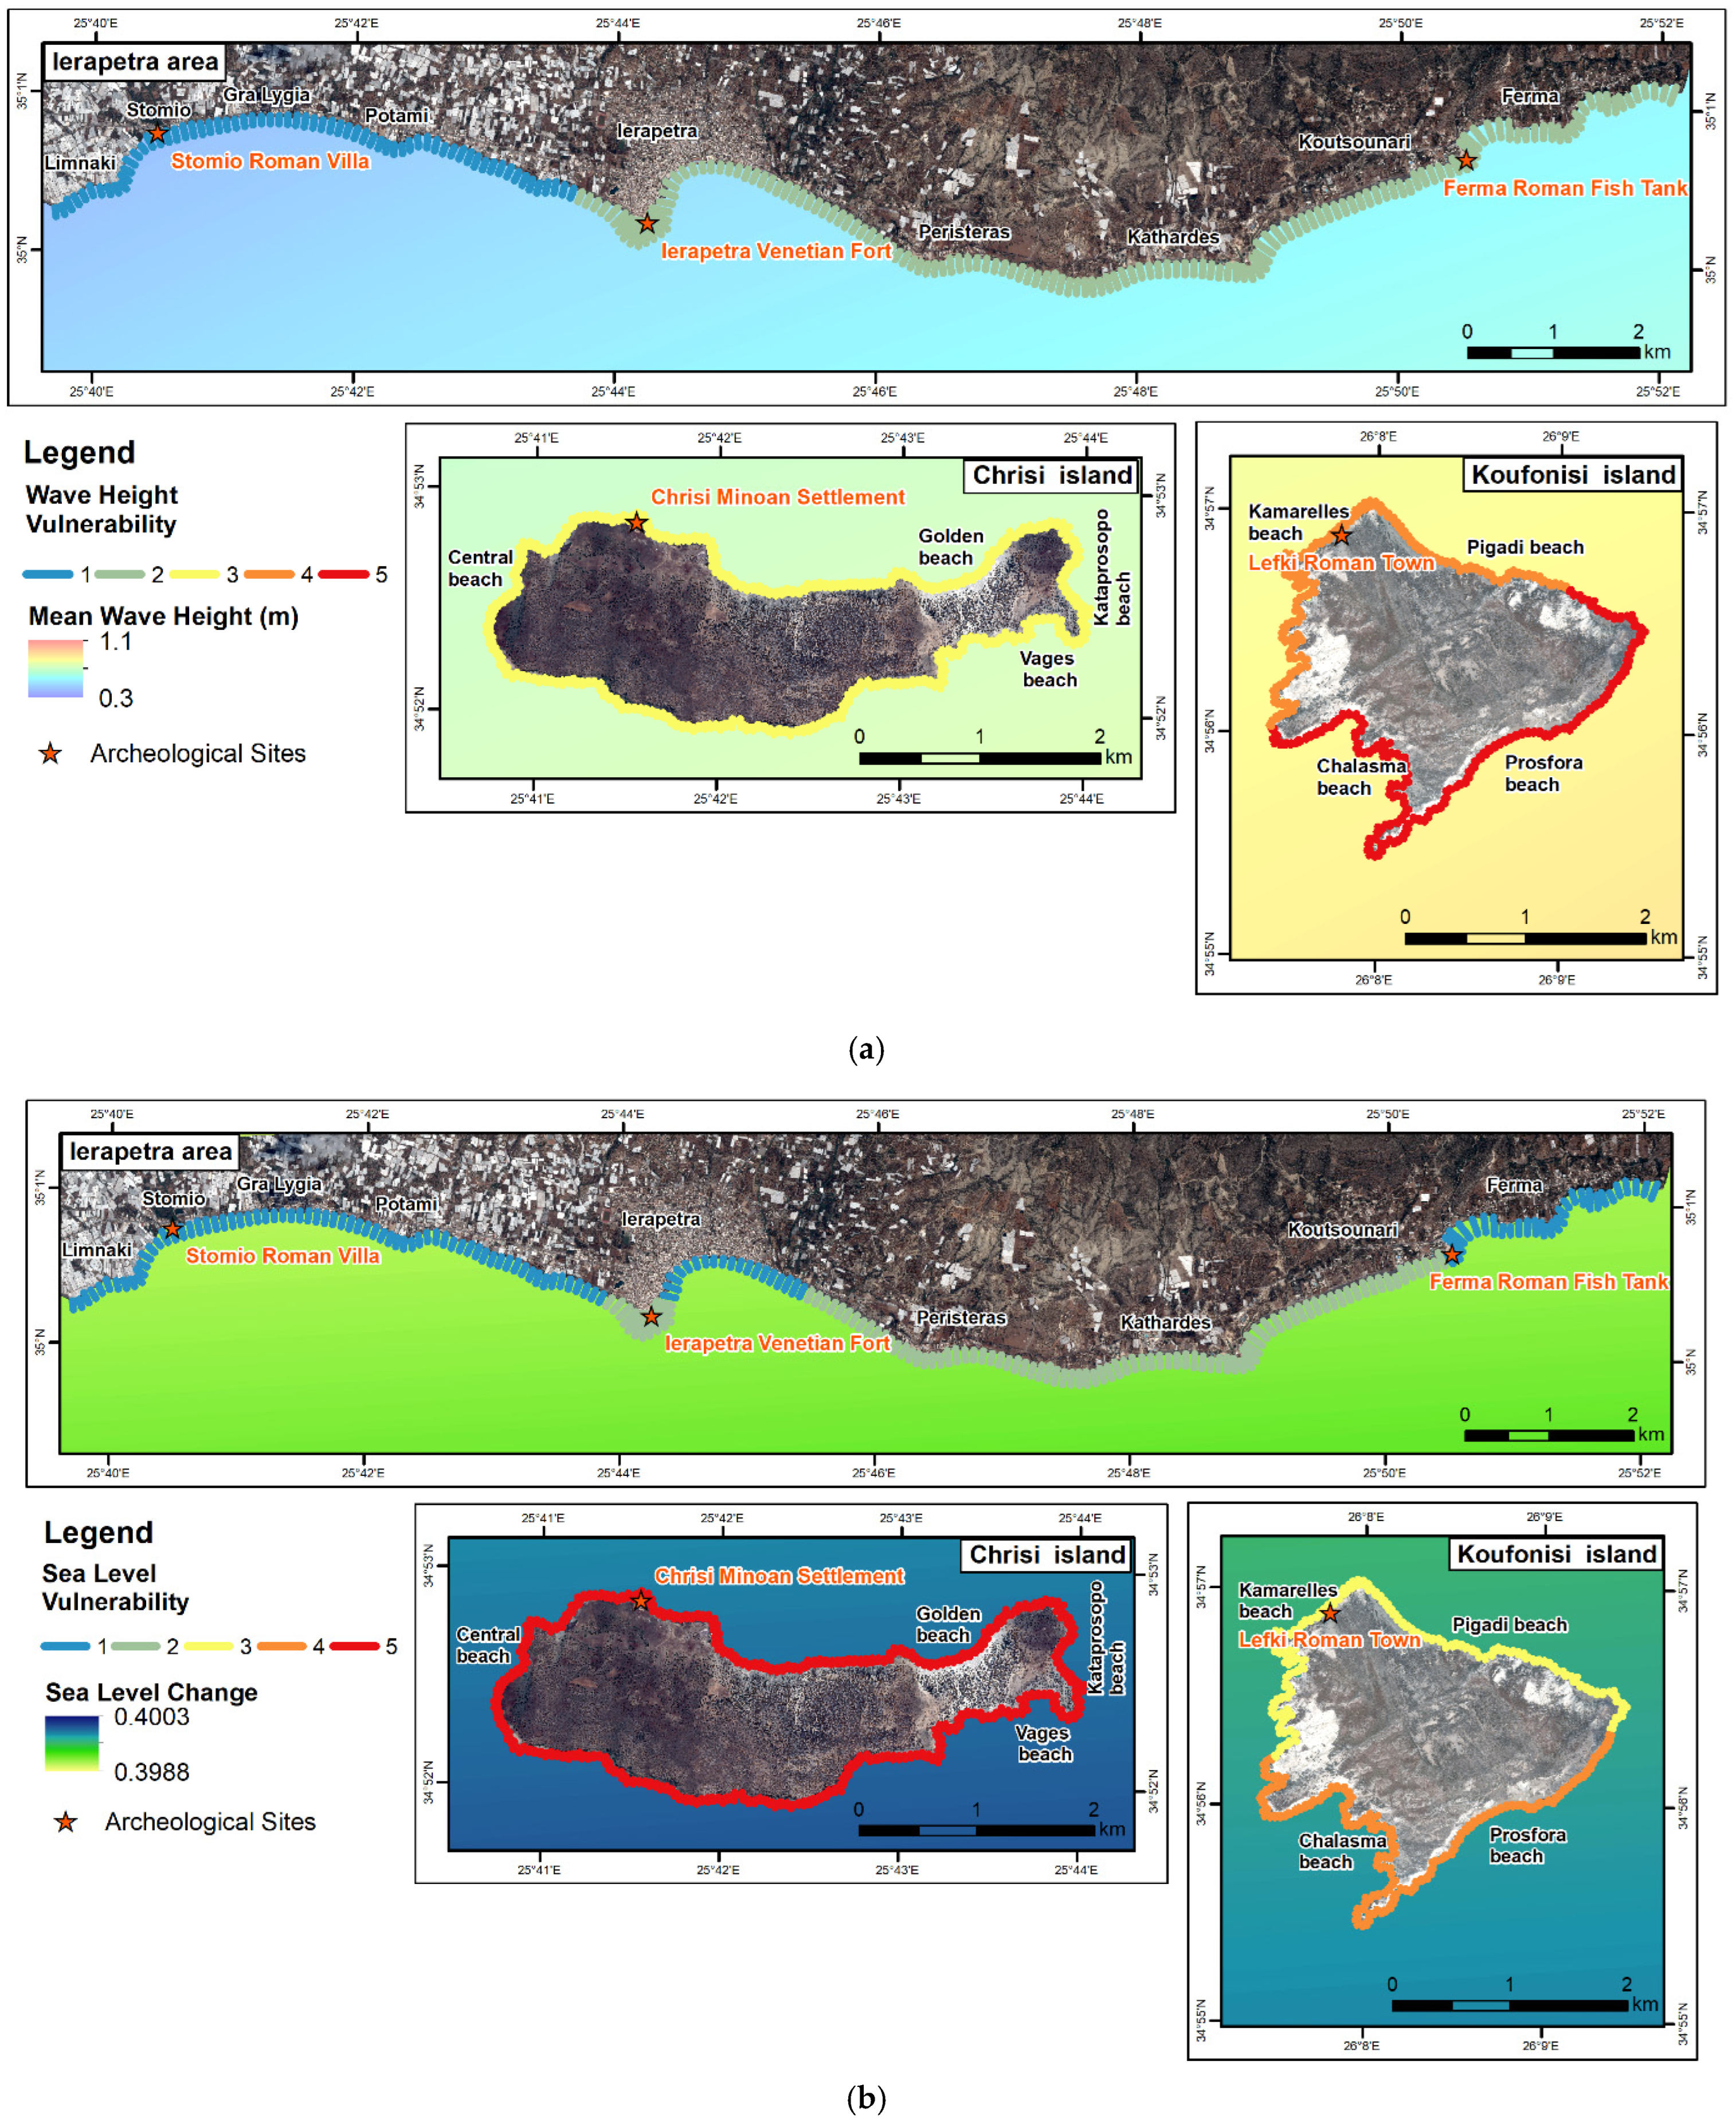
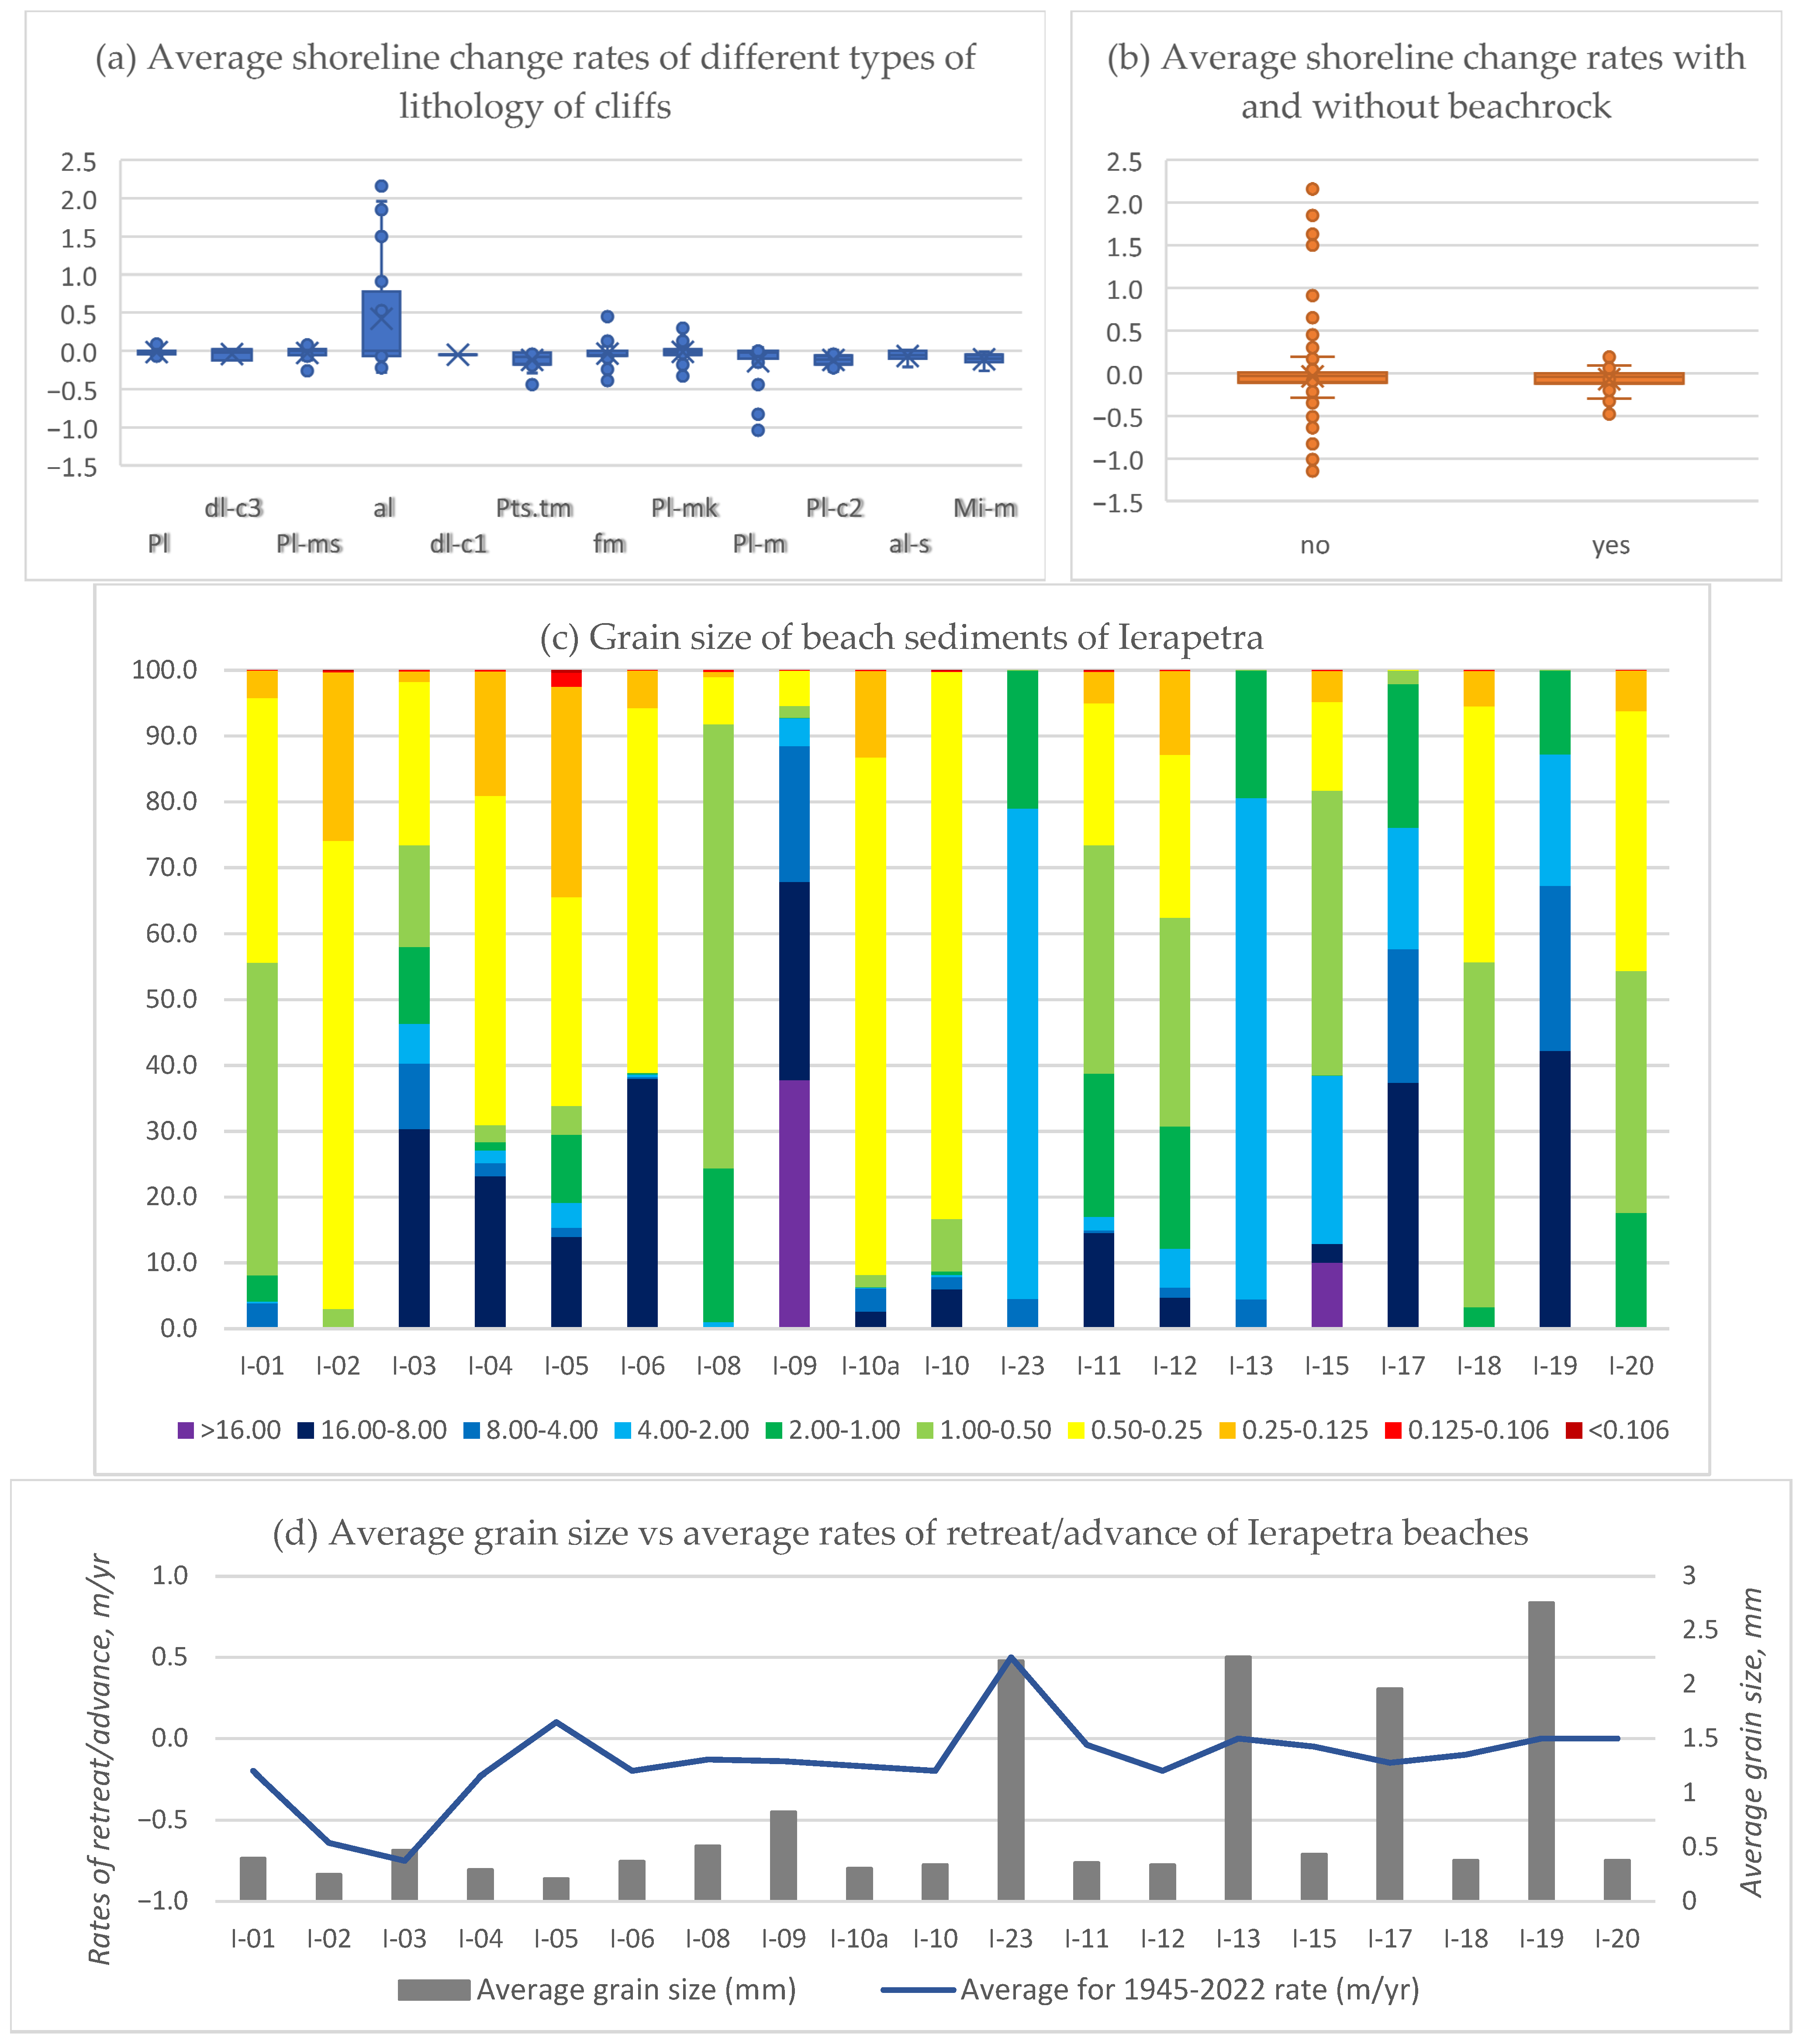
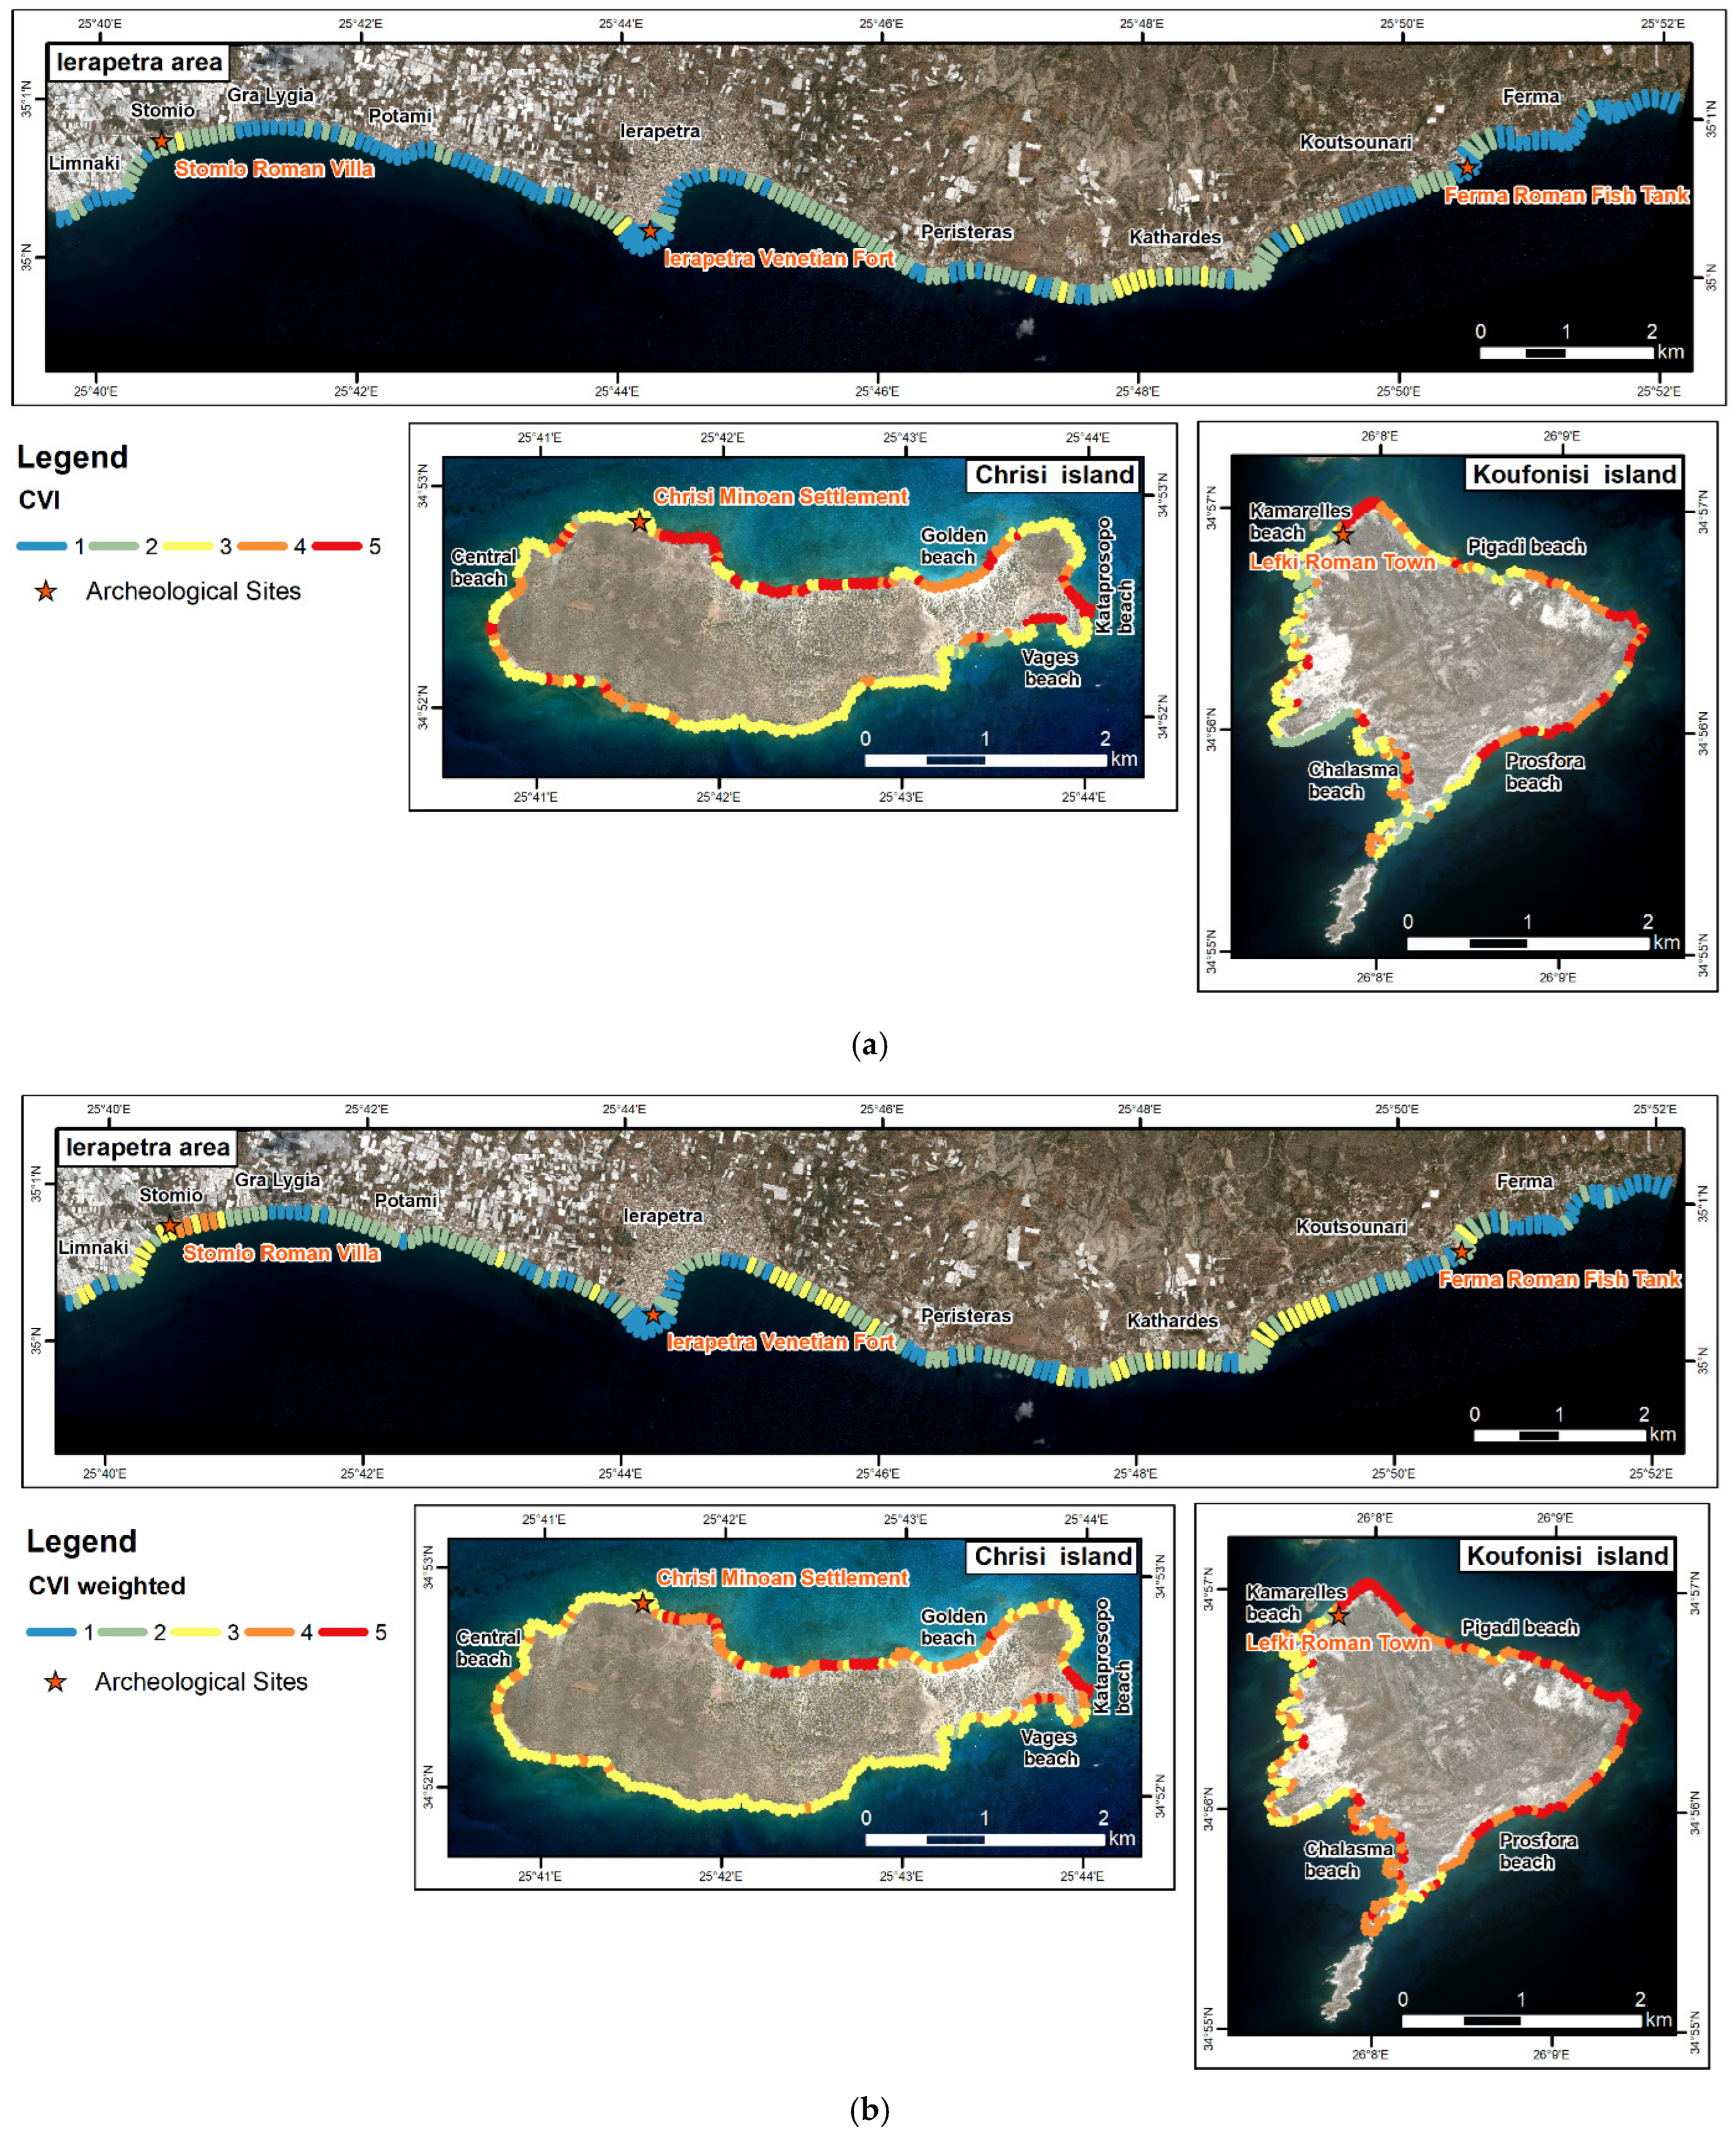
Disclaimer/Publisher’s Note: The statements, opinions and data contained in all publications are solely those of the individual author(s) and contributor(s) and not of MDPI and/or the editor(s). MDPI and/or the editor(s) disclaim responsibility for any injury to people or property resulting from any ideas, methods, instructions or products referred to in the content. |
© 2025 by the authors. Licensee MDPI, Basel, Switzerland. This article is an open access article distributed under the terms and conditions of the Creative Commons Attribution (CC BY) license (https://creativecommons.org/licenses/by/4.0/).