Abstract
Existing studies on eco-efficiency evaluation often neglect the social and ecological benefits of land use, as well as the spatial heterogeneity in the effects of natural factors. This study aims to establish a systematic eco-efficiency evaluation framework and examine the dynamic impacts of various factors on land use eco-efficiency at the county scale. An evaluation framework integrating economic, ecological, and social outputs was constructed using multi-source remote sensing data. The super-efficiency Slack-Based Measure model and exploratory spatial data analysis method were employed to analyze the land use eco-efficiency and its spatiotemporal characteristics in the Huaihai Economic Zone from 2000 to 2022. Furthermore, the enhanced Geographically and Temporally Weighted Regression model was applied to examine the spatiotemporal heterogeneity of industrial structure, ecological background, land use, and other factors influencing land use eco-efficiency. The results indicated the following: (1) The average land use eco-efficiency in the Huaihai Economic Zone followed a pronounced “U-shaped” pattern, initially decreasing before increasing. At the county level, efficiency values generally showed an upward trend, with municipal districts or county-level cities accounting for more than half of the areas. (2) A weak positive spatial agglomeration of land use eco-efficiency was observed at the county level. High-efficiency areas shifted from a dispersed pattern to a “T-shaped” spatial distribution, while low-efficiency areas gradually converged toward the southern regions, evolving from an “H-shaped” cluster. (3) The influence of industrial structure, urbanization, environmental regulation, ecological factors, and land use on ecological efficiency exhibited clear spatial and temporal heterogeneity. The multi-dimensional land use eco-efficiency evaluation offers an effective tool for comprehensively assessing ecological conservation, environmental sustainability, and socio-economic development. It also provides valuable insights for improving land use eco-efficiency at the county level.
1. Introduction
Land Use Ecological Efficiency (LUEE) indicates the spatial representation of input factors and generates outputs in urban and rural land use processes under specific technical conditions [1]. As a practical framework for assessing the relationship between ecological environmental conservation and economic development, it emphasizes the sustainability of social and economic development and the coordination of resources and the environment, and it quantifies the trade-off between regional economic advancement and environmental deterioration. This concept has emerged as a crucial approach for ensuring ecological environmental protection and sustainable development [2]. In the context of widespread global resource consumption and environmental degradation, achieving the coordination of resources, environment, and economy has become a strategic goal for development in the modern era. Improving LUEE provides a basis for optimizing regional resource allocation and supports regional sustainable development. The concept of eco-efficiency, proposed in 1990 by [3], focuses on generating more value with reduced resource input and environmental impact [4]. This concept integrates social and economic development with resource and environmental protection and has since gained widespread recognition and acceptance. In international studies, scholars have applied eco-efficiency assessments to enterprise operations, transportation development, and farm management based on conceptual analysis. Examples include research on iron and steel production [5], urban transportation [6], and farm eco-efficiency [7], which have significantly advanced the theoretical application of eco-efficiency. Since its introduction to China, scholars have conducted extensive research on quantitative measurement, spatiotemporal evolution, and influencing mechanisms, drawing on international experience. These studies primarily focus on regional development [8], the tourism industry [9], and industrial or agricultural processes, providing empirical insights into balancing economic efficiency with minimal environmental disturbance. Research on LUEE has been predominantly carried out in China, particularly in relation to cultivated land [10,11] and construction land [12]. Scholars have adopted the concept of LUEE as a strategy to overcome challenges in land resource protection and security, addressing key issues such as resource consumption, economic development, and pollution emissions in land use. Over the past decade, research on LUEE has primarily focused on conceptual definitions and efficiency measurement. Some scholars have examined the ecological and environmental costs of land use per unit area, while others have explored strategies to maximize benefits while minimizing pollution in land use processes [13]. As research on LUEE has advanced, scholars have increasingly shifted their focus from efficiency measurement to mechanism analysis. Most studies employ spatial econometric methods to examine the effects of urbanization, foreign capital utilization, and industrial structure on LUEE. Due to China’s status as a major agricultural country, research on the ecological efficiency of cultivated land use far exceeds that on other land types. This focus is reflected in the selection of evaluation indicators, leading to a wealth of applicable conclusions spanning national, provincial, city, county, and individual farmer levels. However, studies on the ecological efficiency of comprehensive regional land use remain limited, with most existing research still centered on the use of cultivated or construction land. This is not conducive to the formation of a systematic and comprehensive understanding of the concept of LUEE.
In measuring LUEE, the neoclassical economic production function has been widely applied due to its maturity. This approach allows land to be incorporated as an independent variable in models, facilitating the assessment of its marginal contribution to total output. As a result, most scholars construct an input–output system using production factors such as land, labor, and capital to evaluate eco-efficiency [14]. The stochastic frontier method and data envelopment analysis (DEA) are two commonly used efficiency evaluation methods. Among them, DEA has progressively reshaped efficiency evaluation approaches [15]. It can assess the relative effectiveness of decision-making units under multiple inputs and outputs without requiring a predefined functional form and is capable of considering both expected and undesired outputs [16]. DEA has been extensively applied in eco-efficiency evaluation. Additionally, derivative improvement methods, including the improved Slack-Based Measure (SBM) model [17], super-efficiency SBM model [18], super-efficiency Epsilon-Based Measure (EBM) model [19], and Malmquist–Luenberger index [20,21], are employed to address efficiency evaluation challenges across various scenarios. The EBM model adjusts radial and non-radial weights using parameters, providing high flexibility. However, parameter selection is significantly influenced by subjectivity [19]. Among these models, the super-efficiency SBM model is frequently used for evaluating LUEE. It accounts for input and output relaxation variables and mitigates the biases associated with radial models. With the advancement of computer technology, the DEA model integrated with machine learning algorithms and multi-objective optimization models has been applied to urban ecological efficiency and land-use carbon emission efficiency [22,23,24]. This combination effectively addresses efficiency value prediction and the differentiation of withdrawn or invalid units. However, its application and promotion face technical challenges, and large-scale research has yet to be established. Existing studies have combined logical reasoning and econometric models to investigate the factors influencing LUEE, including urbanization and economic development [20,21], industrial structure upgrading [25], environmental regulation constraints [26,27], and internet benefits [28]. These factors influence LUEE in different directions and to varying degrees.
Land use is a complex process involving multiple factors, diverse stakeholders, and a variety of benefits. Existing studies primarily focus on the impact of socio-economic factors on LUEE, with limited attention given to regional natural conditions, ecological status, or land use [29,30]. Most studies rely on traditional indicators, such as GDP, to characterize the positive economic externalities of land use, often due to administrative boundaries of evaluation units and a focus on regional economic development. This approach undervalues the ecological and social dimensions of land use, leading to an incomplete assessment of regional resource efficiency and sustainability [31]. Most existing county-scale studies focus on provinces, cities, or urban agglomerations in developed regions [32], such as the Beijing–Tianjin–Hebei region [33], the Yangtze River Economic Belt [16,34], the Pearl River Delta [35], and the eastern provinces [32]. The county seat serves as the fundamental administrative unit in China for implementing spatial planning and guiding land use. However, due to data limitations in availability and continuity, research at the county scale remains relatively scarce. To address these gaps, this study examines 77 counties in 10 core cities in the Huaihai Economic Zone (HEZ). The study constructs a multi-benefit output evaluation system using multi-source remote sensing data and socio-economic statistics. It employs methods such as the super-efficient SBM model, exploratory spatial data analysis (ESDA), and improved Geographically and Temporally Weighted Regression (GTWR) to analyze the spatiotemporal characteristics of LUEE. It explores the spatiotemporal heterogeneity of various influencing factors and seeks to identify effective strategies for improving LUEE. This study provides a reference for advancing ecological environmental protection and promoting the sustainable development of the HEZ.
The potential marginal contributions of this study are as follows: (1) A comprehensive efficiency evaluation system is established by considering the economic, social, and ecological benefits of land use. (2) The spatial heterogeneity of the impact of natural factors, such as ecological background and land use, on LUEE is examined. (3) Focusing on county-level evaluation in inter-provincial border zones enriches empirical research on LUEE.
2. Materials and Methods
2.1. Study Area
Based on the core city scope defined in the Huaihe River Ecological Economic Belt Development Plan (https://www.gov.cn/zhengce/zhengceku/2018-12/31/content_5434891.htm, accessed on 14 April 2025), approved by the State Council in 2018, the study area includes 10 prefecture-level cities and 77 county-level administrative units (including counties, county-level cities, and municipal districts) across the provinces of Jiangsu, Shandong, Henan, and Anhui (Figure 1). Figure 1 illustrates the geographical location of the study area on the left and depicts its elevation along with the administrative boundaries of cities and counties on the right.
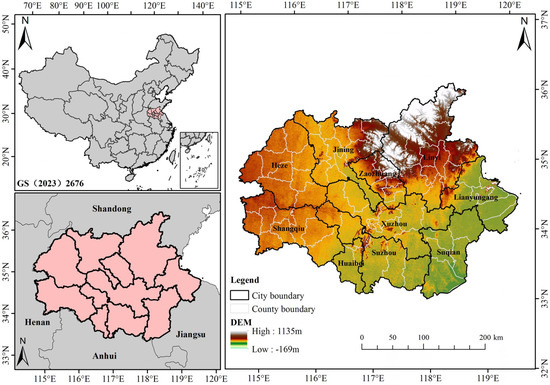
Figure 1.
Location of the HEZ.
First, the HEZ is a border region that spans Jiangsu, Shandong, Henan, and Anhui provinces, serving as a marginal zone for economic development along China’s eastern coast. The region is characterized by a large population, a high proportion of traditional industries, and slow economic growth. Secondly, the region is located at the southern end of the Huang–Huai–Hai Plain, a key eco-economic zone in China’s north–south climate transition zone. Its unique geographical location and natural conditions result in significant regional disparities, making it ideal for exploring the spatial heterogeneity of ecological efficiency in ecologically complex regions. Thirdly, counties play a key role in territorial spatial planning as an important grassroots administrative unit in China. Its relatively complete administrative function system allows evaluation results to be directly translated into local governance measures, facilitating policy adjustments and planning development, and enhancing the practicality and implementation of research findings.
2.2. Methods
2.2.1. The Super-SBM Model
The classical DEA model is radial and angular in measurement, which introduces the issue of element relaxation. The non-radial, non-angular Super-SBM model, based on relaxation variables, addresses the issue that the traditional DEA model cannot effectively compare decision-making units [36]. The Super-SBM model is widely used in existing studies [14], especially for handling undesired outputs. In this study, we use the Super-SBM model, considering undesirable outputs and constant returns to scale from the input perspective, to evaluate LUEE in the HEZ, as shown in Formulas (1) and (2):
The theoretical model was constructed as follows. The model assumes that there are Decision-Making Units (DMUs), and each DMU has kinds of input elements, kinds of expected outputs, and kinds of unexpected outputs. , , and serve as the slack variables of the input factors, expected outputs, and unexpected outputs, respectively. represents a weight vector. represents LUEE in the county.
2.2.2. GTWR Model
As an extension of Geographically Weighted Regression (GWR) [37], GTWR accounts for temporal nonstationarity by constructing a space-dependent local model to capture spatial nonstationarity, thereby providing a more accurate description of spatiotemporal data variations [38]. In this study, GTWR was used to incorporate the temporal dimension and construct a spatiotemporal-dependent local model to explain the spatial heterogeneity of LUEE at the county level, as shown in Formula (3):
where is the explanatory variable. and are the spatial coordinates of sample point (i.e., longitude and latitude), respectively. represents the time series of the point . represents the spatiotemporal coordinates of the point . denotes the regression constant. represents the regression parameter of the -th observation in the -th independent variable, i.e., the weight coefficient of variable in the spatiotemporal position . is the value of the independent variable at the -th observation, i.e., the explanatory variable in the GTWR. When > 0, it means that the explanatory variable is positively correlated with the explanatory variable, and vice versa. represents the residuals of the model.
The spatial weight matrix of GTWR provides an estimate of for each observation and the independent variable for each spatiotemporal location, i.e.,
where is the estimated value of . is the spatiotemporal weight matrix. is a matrix composed of independent variables. is the transpose of the matrix. is the matrix of the explanatory variables. In existing studies, the Gaussian distance function and Euclidean distance function are often used to construct spatiotemporal weight matrices.
2.2.3. Exploring Spatial Data Analysis
Spatial data analysis can reveal the aggregation characteristics of research objects in the spatial dimension [39]. This study calculates the global Moran’s I index of LUEE in the HEZ using an adjacent spatial weight matrix, describing the overall aggregation pattern of LUEE, which provides a foundation for the subsequent GTWR analysis.
2.3. Indicator Selection and Data Acquisition
2.3.1. Indicator Selection
- (1)
- Indicators of LUEE
The choice of evaluation indicators in the SBM model directly impacts the evaluation results, with different indicators and datasets leading to varying degrees of deviation. Based on Douglas’s production function [40,41], this paper selects land, capital, resource, and labor input as input indicators [13]. The expected output is characterized by three dimensions, economic, social, and ecological, while undesired outputs include negative environmental indicators (Table 1).

Table 1.
Evaluation index of LUEE.
Input indicators: Given that agriculture constitutes a significant portion of the industrial structure in the study area, and the secondary industry is primarily driven by the traditional energy sector, land input mainly comprises cultivated land for agricultural production and construction land for development [42]. Capital input is represented by investment in fixed assets per unit area of land. Based on existing research, the “perpetual inventory method” was used to calculate regional capital stock [43], with 2000 as the base year. Resource input is estimated using nighttime light data, which has been shown to have a significant linear relationship with energy consumption based on DMSP/OLS nighttime light data [44]. Thus, the total radiant pixel value of the average nighttime light data is used to represent energy resource input in the study area. Labor input is measured by the number of employees at the end of the year [45].
Expected outputs: Eco-efficiency is typically defined as the ratio of economic value to environmental impact in production activities, with economic value representing the expected output in land use. Land use benefits are generally evaluated based on the principle that “economic, ecological, and social benefits of land use are organically unified”. Economic growth, represented by a GDP increase, may lead to deviations in economic value accounting, while social development should focus on total welfare growth [46]. This study measures the economic value of land use from three aspects: economic, ecological, and social benefits. It uses the total GDP per unit area of land for economic benefits, ecosystem service value per unit area for ecological benefits [47], and local fiscal general public budget revenue per unit area for social benefits.
Undesired outputs: Most existing studies have identified environmental pollutants, including industrial waste discharge, carbon emissions, and agricultural pollution, as undesired outputs. Given the predominance of traditional industries in the secondary sector of the HEZ and the availability of county-level data, this study selects per-capita industrial wastewater discharge, per-capita industrial sulfur dioxide emissions, and per-capita industrial soot emissions [32] as specific indicators of undesired outputs. Due to the limited availability of county-level pesticide and fertilizer data, agricultural pollution output is excluded. The selection of industrial waste emissions, rather than carbon emissions, provides a more accurate reflection of the industrial structure and land use characteristics of the study area.
- (2)
- Indicators of influencing factor
Based on existing research, this paper constructs an index system for the influencing factors of LUEE at the county level, considering six aspects: industrial structure, technological innovation, urbanization level, environmental regulation, ecological background, and land use. Regarding industrial structure, due to the high proportion of traditional industries in the HEZ, the added value of the secondary/tertiary industry was selected to characterize the industrial structure level [48]. Regarding technological innovation, existing studies often use indicators such as R&D expenditure, R&D personnel, and the number of patents [49]. Due to the lack of R&D data at the county level, this study used the number of publicly published patents in each region [50]. Urbanization level is represented by the proportion of urban population to total population [50], while regional road density is used to measure infrastructure construction [51]. Regarding environmental regulation, the amount of investment in environmental pollution control was used as an indicator [43]. Regarding ecological background, most studies use NDVI to explore its impact on regional ecological efficiency [52]. However, previous research suggests that NDVI alone is not comprehensive enough [53]. Thus, this study uses the Risk-Screening Environmental Index (RSEI), which includes four components to assess regional ecological background: greenness, humidity, dryness, and heat [54]. Additionally, the green coverage area of built-up areas reflects the level of regional greening and is also included as an indicator. Land use is a key factor influencing ecological efficiency. Existing studies typically use land input area or land area proportion as input indicators, though few have explored the relationship between land use and ecological efficiency. This study uses the composite index of land use degree [55] (representing the impact of human activities on regional land use change) and the Simpson index of land use structure [29] (representing land use equilibrium) to characterize land use.
2.3.2. Data Source
Remote sensing image data offer high objectivity and temporal stability, addressing the lack of statistical data for certain indicators at the county scale. Therefore, this study used multi-source data to evaluate LUEE and its influencing factors (Table 2).
Table 2.
Indicators of influencing factors and data sources.
The statistical data used in this study were sourced from the China County Statistical Yearbook, the China City Statistical Yearbook, county and district statistical yearbooks, and the Statistical Bulletin of National Economic and Social Development. Missing data for certain years were estimated using linear interpolation. County Patent data were obtained from the official website of the China National Intellectual Property Administration. Ecosystem service value data were calculated using the CLCD from the National Ecological Science Data Center [56] and the ecosystem service equivalent factor table (factors such as rainfall, soil erosion, and transportation accessibility were considered for spatial correction) from [57]. The nighttime light data were sourced from the National Earth System Science Data Center. Most existing studies use nighttime light to simulate population density or economic development [44]. This paper used the relationship between nighttime light and energy consumption identified in previous studies to measure energy resource input in the study area [44]. Road density data from 2000 to 2010 were sourced from Google Maps, and road data from 2015 to 2022 were sourced from OpenStreetMap (https://www.openstreetmap.org/, accessed on 14 April 2025). RSEI data were derived from Landsat data downloaded from the GEE platform. The RSEI is a comprehensive measure integrating NDVI, dryness, humidity, and other factors, commonly used to assess regional ecological status. Existing studies have established a relationship between NDVI and LUEE. This paper selected RSEI as an influencing factor to contribute to understanding the driving mechanism of LUEE. Based on previous studies [54], the principal component analysis (PCA) method was employed to integrate the four indicators—greenness, dryness, humidity, and heat—into a standardized index ranging from 0 to 1. The land use degree composite index and the Simpson index were calculated [29] using the CLCD from the National Ecological Science Data Center. CLCD is China’s annual land cover dataset developed by Wuhan University using Google Earth Engine Landsat data. It provides 30 m resolution land use information from 1985 to 2020, with an overall accuracy rate of 80% [29].
3. Results
3.1. Results of LUEE
3.1.1. Temporal Evolution of LUEE
Table 3 presents the LUEE in the HEZ and each county from 2000 to 2022, highlighting efficiency changes in both overall and local stages during the study period. The trend in efficiency values indicates that the average efficiency of the HEZ and each county first decreased and then increased, following a “U-shaped” pattern.
Table 3.
Statistical table of LUEE changes in the HEZ and its counties.
Overall, the average regional efficiency of the HEZ has remained above 0.5 throughout the years, but has not exceeded 1. The efficiency remains relatively low, showing a pattern of first decreasing and then increasing. Between 2000 and 2004, the mean regional efficiency decreased from 0.71 to 0.58. From 2005 to 2009, the mean regional efficiency continued to decline, from 0.58 to 0.52. Between 2010 and 2014, the average value increased from 0.51 to 0.54. From 2015 to 2019, the efficiency continued to increase, from 0.57 to 0.67. By 2022, the average efficiency had continued to rise, from 0.79 in 2020 to 0.84 in 2022.
At the county level, efficiency values fluctuate significantly, but overall, most counties show an upward trend. Between 2000 and 2022, 63.64% of counties saw an increase in efficiency, compared to 55.10% with a decrease. Of the counties with increased efficiency, 55.10% were municipal districts or county-level cities, while 36.36% of those with decreased efficiency were also from municipal districts or county-level cities. Between 2000 and 2004, 26 counties (33.77% of the total) saw an increase in efficiency, including 13 from municipal districts or county-level cities. Meanwhile, 52 counties had a decrease in efficiency, with 22 from municipal districts or county-level cities. Between 2005 and 2009, 38 counties (49.35% of the total) experienced an increase in efficiency, including 19 from municipal districts or county-level cities. At the same time, 39 counties had a decrease in efficiency, including 16 from municipal districts or county-level cities. Between 2010 and 2014, 48 counties (62.34% of the total) saw an increase in efficiency, including 19 from municipal districts or county-level cities. In contrast, 29 counties experienced a decrease in efficiency, with 16 from municipal districts or county-level cities. Between 2015 and 2019, 58 counties (75.32% of the total) showed an increase in efficiency, including 30 from municipal districts or county-level cities. In contrast, 19 counties had a decrease in efficiency, with 5 from municipal districts or county-level cities. Between 2020 and 2022, 56 counties (72.73% of the total) showed an increase in efficiency, including 30 from municipal districts or county-level cities. Meanwhile, 21 counties had a decrease in efficiency, with 5 from municipal districts or county-level cities.
3.1.2. Spatial Pattern of LUEE
- (1)
- Global spatial autocorrelation
From 2000 to 2022, the global Moran’s I values of LUEE in the HEZ were consistently positive and all passed the 0.05 significance test (Table 4). The study period is divided into five-year intervals, with the average efficiency calculated for spatial autocorrelation analysis. This approach avoids redundancy while capturing the overall efficiency trends during the study period.
Table 4.
Global spatial autocorrelation of LUEE.
During the study period, Moran’s I initially increased from 0.1197 to 0.2707 before decreasing to 0.1681, remaining below 0.3. As shown in Figure 2, high- and low-efficiency areas exhibited a clear shift from dispersion to agglomeration. Additionally, second-high-efficiency and sub-low-efficiency areas formed localized clusters, indicating a weak positive spatial agglomeration trend in LUEE within the study area.
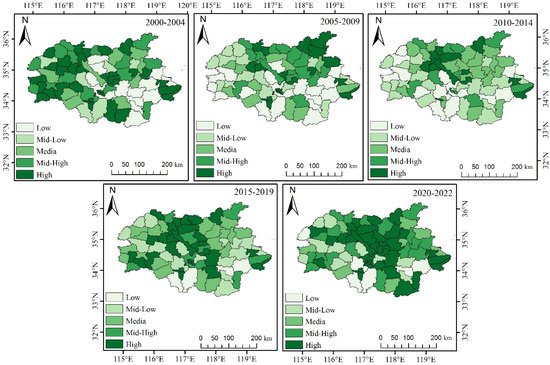
Figure 2.
Spatial distribution of LUEE at the county level.
- (2)
- Results of spatiotemporal differentiation
Based on the county-level LUEE data from 2000 to 2022, a spatial distribution map of the average county LUEE in the HEZ was generated using ArcGIS for visualization analysis (Figure 2). To ensure comparability across different time periods, the efficiency values from the middle of the study period (2010–2014) were categorized into five levels—“low”, “mid-low”, “medium”, “mid-high”, and “high”—using the Jenks natural break method. This classification standard was then applied to other study periods, accommodating variations in efficiency value ranges across different stages.
Overall, the spatial distribution of high-efficiency counties has followed a clear pattern of dispersion and agglomeration, whereas low-efficiency counties have gradually clustered from the southeast to the south. Medium-efficiency counties, which showed a broader distribution during the periods of 2010–2014 and 2015–2019, were mainly concentrated in the northeastern and northwestern regions of the HEZ.
Between 2000 and 2004, high-efficiency counties were distributed discretely across the study area, characterized by central agglomeration with peripheral ring distribution. Low-efficiency counties were primarily located in the central and southeastern regions, forming an “H-shaped” pattern. Medium-efficiency counties were concentrated in the southern part. The proportions of mid-high- and mid-low-efficiency counties were small, showing no clear spatial distribution pattern.
Between 2005 and 2009, high-efficiency counties relocated to the northeastern region of the study area, primarily affecting the eastern and northern parts of Linyi City, as well as scattered areas in the central region. Based on the initial distribution, low-efficiency counties expanded into the western part of the study area, reinforcing the “H-shaped” pattern. This expansion primarily affected the southeastern, central, and southwestern regions. No distinct distribution pattern was observed for medium-efficiency counties. Mid-low-efficiency counties gradually expanded into the western part of the study area, predominantly affecting the northwest and central regions. Mid-high-efficiency counties progressively converged in the northern part of the study area.
Between 2010 and 2014, high-efficiency counties began to converge in the central and northern regions of the study area, primarily affecting the southern part of Zaozhuang, the southern and northern parts of Jining, the southern part of Lianyungang, and the northern part of Linyi. Low-efficiency counties contracted to the central and southern regions, primarily concentrated in the southern part of the study area. Medium-efficiency counties gradually expanded northeastward, predominantly covering most areas of Linyi City. Mid-low-efficiency counties shifted to the central and southern regions. Mid-high-efficiency counties contracted further, primarily in the northern part of the study area.
Between 2015 and 2019, high-efficiency counties expanded further into the central, northern, and western regions of the study area, establishing a “T-shaped” distribution pattern. Low-efficiency counties contracted southward, primarily affecting the southern parts of Huaibei and Suzhou and the northern part of Suqian. Medium-efficiency counties further expanded westward from their original distribution. Mid-low-efficiency counties contracted to the southwest and southeast. The distribution of mid-high-efficiency counties was further restricted, primarily in the central part of the study area.
Between 2020 and 2022, high-efficiency counties expanded further to the north and south of the study area, reinforcing the “T-shaped” distribution pattern. Low-efficiency counties maintained the original distribution, remaining concentrated in the southern part of the study area. Medium-efficiency counties continued to contract, predominantly found in the peripheral regions of the study area. Mid-high-efficiency counties expanded eastward, based on their original distribution. Mid-low-efficiency counties converged in the western part of the study area.
3.2. Analysis of Factors Influencing the LUEE
3.2.1. Classical Regression Model Test and Collinearity Test
Based on existing research [37], traditional multiple linear regression using Ordinary Least Squares (OLS) was first conducted to examine the impact of various factors on LUEE in counties within the HEZ. A collinearity test was then performed (Table 5) before applying spatiotemporal Geographically Weighted Regression. This step aims to exclude highly collinear factors based on the Variance Inflation Factor (VIF) values obtained from multiple linear regression results. A VIF value greater than 5 is generally considered to indicate strong collinearity between variables, which can significantly affect the model’s simulation results [58].
Table 5.
Multiple linear regression and collinearity test.
Six factors—specifically, the added value of the secondary/tertiary industries (X1), the proportion of the urban population to the total population (X3), regional road density (X4), environmental pollution control investment (X5), the RSEI (X6), and the Simpson index of land use structure (X9)—exert a significant influence on the LUEE within the HEZ. Furthermore, the VIF values for these factors are below 5, indicating an acceptable level of multicollinearity [58]. In contrast, three variables—namely, the number of publicly published patents (X2), the green coverage area of built-up areas (X7), and the composite index of land use degree (X8)—did not pass the significance test. Therefore, these three variables were excluded from the subsequent GTWR analysis.
3.2.2. GTWR Model Estimation
To further validate the rationale of the research model, the GWR, GTWR, and OLS models with the same variables were constructed for a comparative analysis of fit and variance (Table 6).
Table 6.
Comparison of model fit for regression.
The comparison results indicate that the adjusted R2 of the GTWR model is higher than that of the GWR and OLS models, suggesting that the GTWR model provides a more accurate representation of the variable results, making it the more reasonable choice.
As demonstrated in the previous analysis, population and industrial changes significantly impact the LUEE. Based on the GTWR model estimation in this section, the coordinates of the county government station, county GDP center of gravity, and county population center of gravity are used to explore the optimal spatial coordinate selection for model fitting. The fixed Gaussian function serves as the weight function, and the AICc criterion is employed to determine the bandwidth [59]. Table 7 presents the goodness-of-fit of the GTWR model under three different coordinate choices. The GDP center of gravity coordinate-based GTWR model has the highest adjusted R2. Therefore, this study adopts this model to examine the spatiotemporal variations in influencing factors.
Table 7.
Comparison of model fit for GTWR with different coordinates.
3.2.3. Results of GTWR Model
The regression results of various influencing factors in the GDP center-of-gravity-GTWR model are visualized using ArcGIS, revealing the spatial distribution of regression coefficients. This allows for the exploration of spatial heterogeneity in the impacts of various factors on county-level LUEE in the HEZ.
- (1)
- Industrial structure
Throughout the study period, the influence coefficients of the added value of the secondary/tertiary industries (X1) on LUEE were mostly negative, suggesting that an increase in the proportion of secondary production or a decrease in tertiary production hindered the improvement in LUEE in the HEZ. Spatially, high-value areas of the influence coefficient gradually converged from the western and south-central regions to the southeastern regions, while low-value areas were primarily concentrated in the central and northern regions (Figure 3). The proportion of traditional industries in the HEZ is relatively high, along with a significant presence of resource-based cities and counties. The reliance on resource exploitation for economic development has resulted in substantial pollutant discharge. Therefore, timely adjustment of the industrial structure, the adoption of new technologies, and the promotion of green industry models are critical for the HEZ’s future development.

Figure 3.
The impact of the added value of the secondary/tertiary industry (X1) on LUEE.
- (2)
- Urbanization level
The urbanization level includes two influencing factors: the proportion of the urban population in the total population (X3) and regional road density (X4). The impact of the proportion of the urban population in the total population (X3) on LUEE varied in direction and intensity across different districts and counties in the HEZ. During the study period, the high-value area of positive influence shifted from a north–south to a concentrated and continuous north–south distribution. Highly negative influence areas were consistently located in the western part of the study area, exhibiting a gradual convergence trend (Figure 4). This is due to the gradual increase in the urbanization level of HEZ over time, where favorable living conditions and superior employment opportunities have attracted a large labor force to the city. This influx has not only stimulated regional employment but also promoted sectors such as education, healthcare, and market consumption, contributing to steady social and economic development.
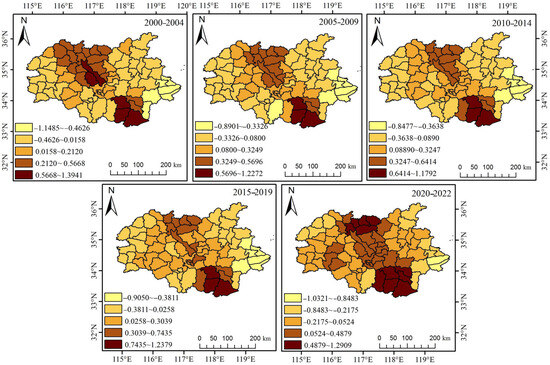
Figure 4.
The impact of the proportion of urban population in the total population (X3) on LUEE.
Regional road density (X4) had a positive effect on LUEE in most regions. During the study period, the positive influence area gradually shifted from the eastern to the northwestern part of the study area, while the negative influence area, initially concentrated in the southwest, expanded toward the northeast. This shift indicated an increase in the positive influence area and a decrease in the negative influence area (Figure 5). In the early stages of the study, rapid urbanization led to the continuous expansion of urban areas, and accelerated infrastructure development, while economic growth slightly lagged behind road construction. In the middle and later stages, urbanization stabilized and improved, with road construction facilitating the flow of factors and transportation of resources, which contributed to the improvement in LUEE.
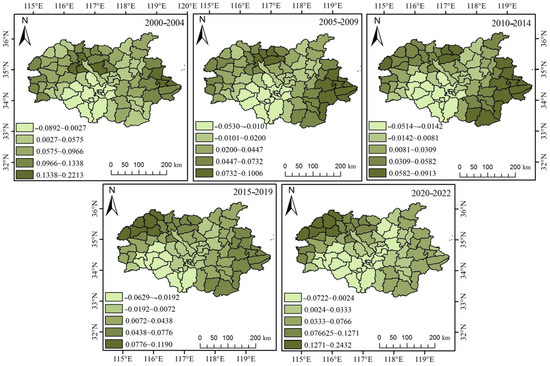
Figure 5.
The impact of regional road density (X4) on LUEE.
- (3)
- Environmental regulation
The effect of environmental pollution control investment (X5) on LUEE varies across regions. During the study period, the LUEE in most regions showed a negative response to environmental pollution control investment (X5), while the positive impact in high-value areas spread primarily from the center to the eastern part of the study area (Figure 6). The HEZ, where coal energy dominates industry, has depended on energy extraction for regional economic development. However, this reliance has resulted in substantial industrial pollution emissions. In areas with slower economic growth, excessive investment in environmental pollution control burdens local governments and businesses, raising production costs. This can also lead to system failures, reducing the effectiveness of pollution control.
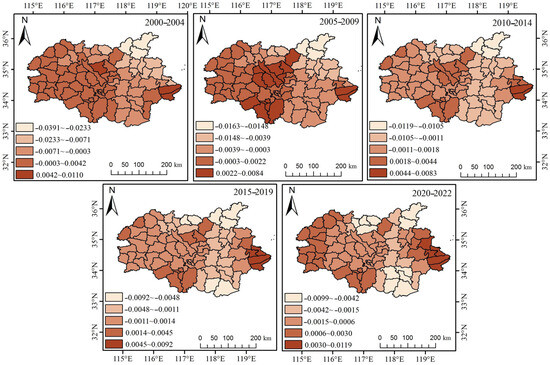
Figure 6.
The impact of environmental pollution control investment (X5) on LUEE.
- (4)
- Ecological background
The RSEI (X6) negatively impacted the ecological efficiency of land use in most areas of the study region. During the study period, areas with positive or negative responses exhibited a stable spatial pattern. Positive-regression-coefficient areas were primarily located in the northern region and a few southern districts of the HEZ, while highly negative-regression-coefficient areas were concentrated in the western part, gradually shifting eastward (Figure 7). The RSEI is a key indicator for assessing ecological quality. A higher RSEI value signifies better ecological conditions. It also suggests that the intensity of development and construction in the area is relatively low, or the development is uneven, leading to minimal disruption of the ecological environment. Since most areas of the HEZ are situated in an economic development trough in China’s eastern coastal region, with relatively underdeveloped industries and substantial growth potential, future efforts should focus on boosting economic construction.
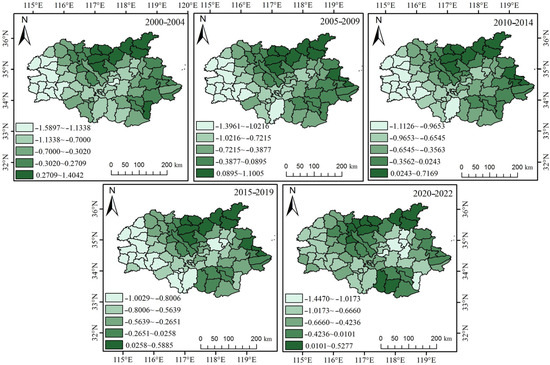
Figure 7.
The impact of RSEI (X6) on LUEE.
- (5)
- Land use
The Simpson index of land use structure (X9) had varying effects on LUEE across regions. During the study period, high-value positive areas were mainly located in the southern part of the study area and gradually expanded northward, while high-impact negative areas were concentrated in the western part and expanded continuously (Figure 8). This contrasts with the findings of [4,29], who studied the relationship between land use structure and ecological efficiency in shrinking cities. In the HEZ, most areas are still experiencing population growth and urban expansion. An increase in the Simpson index indicates a closer balance between construction land for residential and industrial use, cultivated land for agriculture, and ecological land such as forests, grasslands, and water. The reduction in the proportion of land with higher economic value hinders LUEE improvement. In economically developed areas, an increase in land for residential and construction purposes has raised economic value, but it also impacts ecological service provision and environmental pollution control.
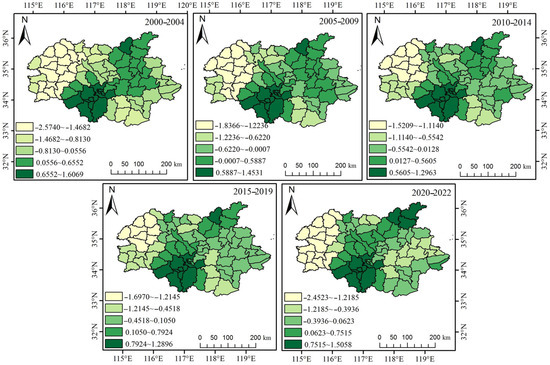
Figure 8.
The impact of the Simpson index of the land use structure (X9) on LUEE.
4. Discussion
- (1)
- This study concludes that land use structure significantly affects LUEE at the county level. This conclusion aligns with the finding of [58,60], who suggest that optimizing land use structure—considering the scale effect of moderate land agglomeration, the spatial allocation effect of patch combinations, and the synergistic effect of different spatial functions—can balance ecological and economic outcomes while reducing regional management costs, thereby enhancing LUEE. However, this conclusion differs from the results of [4,29] on the relationship between shrinking urban land use structure and ecological efficiency. Most regions in the study area are still experiencing population growth and urban expansion. Optimizing land use structure involves balancing production land with residential and ecological land. While reducing production land decreases ecological disturbance, it does not fully capitalize on the economic benefits of urban expansion. As a result, although ecological disturbance is minimized, it does not promote the improvement in LUEE. Furthermore, some studies indicate that increased enterprise pollution and a reduction in the rationalization of industrial structure can worsen LUEE in counties [58]. This supports the discussion in this paper regarding the relationship between industrial structure, urbanization level, environmental regulation, and LUEE, highlighting its broader relevance. In comparison with existing studies [61], when analyzing the factors influencing LUEE at the county level, it is important to consider different time series for various stages of regional development. This approach helps in understanding the temporal heterogeneity of factors affecting LUEE.
- (2)
- Based on land economics and ecological economics theories, this study characterized land use’s economic value from an economic–social–ecological perspective. This characterization was incorporated into the super-SBM model to measure LUEE at the county scale, accounting for the negative output of environmental pollutants. The results aligned with the development stage of most cities in China, but did not reflect the economic development levels of cities and counties in the study area. The study period from 2000 to 2011 was in the rapid-growth stage of China’s economic development. The urban agglomeration effect became more pronounced. A large influx of people into towns coincided with the continued expansion of urban areas. During this period, regional development prioritized economic growth and construction, while the concept of green environmental protection was not fully emphasized. Consequently, rapid economic growth exacerbated environmental problems. During this period, LUEE in all regions trended downward. After 2012, the 18th National Congress of the Communist Party of China emphasized a shift toward high-quality regional economic development, focusing more on innovation-driven and green development.
From the perspective of urban GDP development, Xuzhou and Linyi have the highest total GDP and growth rates in the Huaihai Economic Zone. However, the average Land Use Ecological Efficiency of the counties under their jurisdiction ranks among the lowest. In contrast, cities such as Lianyungang, Zaozhuang, and Jining ranked low in total GDP and growth rate, yet by the end of the study period, the average ecological efficiency of their counties ranked relatively high. These results indicate that regional LUEE does not necessarily improve with GDP growth. This underscores the limitations of relying solely on GDP to assess income inequality, natural capital depletion, and pollution control activities. Therefore, future measurements of regional LUEE should incorporate multi-dimensional economic benefit indicators or green GDP to provide a more comprehensive evaluation [62].
- (3)
- During the measurement stage of LUEE, this study used land, capital, and resources as input indicators based on the production function, with the pixel value of night light data serving as the primary representation of resource input. Given that many cities in the HEZ, including Xuzhou, Suqian, Suzhou, Huaibei, Linyi, Zaozhuang, and Jining, are resource-based, future studies could incorporate indicators such as proven resource reserves, employment in the resource sector, and the output value of the resource industry. These indicators would better reflect regional resource endowments and energy consumption, enabling more accurate evaluations of regional LUEE. In the efficiency calculation and analysis stage, referencing the classification list of resource-based cities in the National Sustainable Development Plan for Resource-based Cities (2013–2020) (https://www.gov.cn/zfwj/2013-12/03/content_2540070.htm, accessed on 14 April 2025), comparative analyses can be conducted between resource-based and non-resource-based cities. Further, categorizing cities into growth-oriented, mature, declining, and renewable resource-based types could provide clearer insights into the heterogeneity of LUEE and its influencing factors across spatiotemporal dimensions in areas dominated by the resource and energy industries.
- (4)
- This study analyzed the influencing factors of LUEE, including industrial structure, urbanization level, technological innovation, environmental regulation, ecological background, and land use. The relationship between technological innovation and LUEE could not be examined, as the technological innovation index failed the model test. According to endogenous growth theory, scientific innovation is an intrinsic factor crucial for development [63]. Existing research has demonstrated both linear and nonlinear relationships between technological innovation and ecological efficiency [64,65]. Future research should explore additional indicators of scientific and technological investment, such as R&D expenditure, internal funding, or the number of R&D personnel, to better capture its impact. Furthermore, the lack of quantitative standards for regional policies and government management has led most studies to substitute policy analysis with evaluations of economic growth and environmental protection. This study has certain limitations in considering the impact of natural factors and policy support. The study area is located at the junction of four provinces, exhibiting significant differences in natural conditions, regional economic development strategies, and government management approaches. Therefore, future research should focus on examining how natural factors and variations in policy implementation affect the ecological efficiency of land use in inter-provincial border areas, as well as the impact pathways of different factors at various scales.
5. Conclusions
This paper constructs an evaluation system for economic–ecological–social multi-dimensional outputs using multi-source remote sensing data and socio-economic statistics. The LUEE of 77 county-level units in the HEZ was assessed over several consecutive years using the Super-SBM model, which accounts for undesired outputs. Exploratory spatial data analysis was used to examine the spatiotemporal evolution of LUEE in the HEZ. The spatiotemporal heterogeneity of the effects of industrial structure, urbanization level, environmental regulation, ecological background, and land use on LUEE was further analyzed using the improved GDP gravity-GTWR model. The multi-dimensional output evaluation system developed in this study offers a more comprehensive and systematic assessment of LUEE at the county scale. Analyzing the influence of the RSEI and the land use Simpson index provides a scientific basis for exploring pathways to improve LUEE in the HEZ. The main conclusions are as follows:
- (1)
- During the study period, the average LUEE in the HEZ exhibited a clear “U-shaped” trend, initially decreasing and then increasing. At the county level, the ecological efficiency of land use fluctuated significantly during certain periods. However, overall, most counties exhibited an upward trend. Counties with increased efficiency accounted for 63.64% of the total, of which 55.10% were municipal districts or county-level cities, while 36.36% of counties showed decreased efficiency, with 28.57% being municipal districts or county-level cities.
- (2)
- The global Moran’s I of the mean LUEE in the HEZ first increased and then decreased, with values ranging from 0 to 0.3. This indicates a weak positive spatial autocorrelation in the study area, where the spatial distribution of high-efficiency county units evolved from a dispersed pattern to a “T-shaped” agglomeration, while low-efficiency county units shifted from a southeastern “H-shaped” aggregation to the southern region.
- (3)
- The influence of industrial structure, urbanization, environmental regulation, ecological factors, and land use on ecological efficiency exhibits clear spatial and temporal heterogeneity. Based on the impact of various factors on LUEE, it is evident that the primary constraints hindering its improvement in counties within the HEZ in this stage include the dominance of traditional industries, lagging urban infrastructure, negative externalities from environmental pollution control, insufficient economic development balance, and land use structure imbalances.
Author Contributions
G.T.: Writing—Original Draft Preparation, Methodology, Writing—Review and Editing. L.C.: Data Curation, Software, Conceptualization, Supervision, Writing—Review and Editing, Funding Acquisition. T.Z.: Data Curation, Software. L.L.: Formal Analysis, Methodology. J.X.: Data Curation. L.M.: Data Curation. All authors have read and agreed to the published version of the manuscript.
Funding
This research was funded by the Jiangsu Province Graduate Research and Practice Innovation Program (Grant No. KYCX24_2971); The Natural Resources Research Project of Jiangsu Province (Grant No. 2024042); and The Scientific Research Project of the “521 High-level Talent Cultivation Project” of Lianyungang City (Grant No. LYG065212024107).
Data Availability Statement
The data presented in this study are available on request from the corresponding author. The data are not publicly available due to privacy or ethical restrictions.
Conflicts of Interest
The authors declare no conflicts of interest.
References
- Jiang, X.; Hou, J.; Lu, X. Research on the Effects of Low-carbon Pilot Policies on Green Urban Land Use: An Empirical Study Based on the DID Model. China Land Sci. 2023, 37, 80–89. [Google Scholar]
- Ren, W.; Lu, X.; Yang, J.; Ke, S. Influencing Mechanism of Energy Utilization on Urban Land Green Utilization Efficiency: A Spatial Econometric Analysis Based on the Yangtze River Economic Belt. Resour. Environ. Yangtze Basin 2024, 33, 525–536. [Google Scholar]
- Schaltegger, S.; Sturm, A. Ökologische Rationalität (German/in English: Environmental Rationality). Die Unternehm. 1990, 4, 117–131. [Google Scholar]
- Sun, J.; Zhou, T. Urban Shrinkage and Eco-Efficiency: The Mediating Effects of Industry, Innovation and Land-Use. Environ. Impact Assess. Rev. 2023, 98, 106921. [Google Scholar] [CrossRef]
- Kharel, G.P.; Charmondusit, K. Eco-Efficiency Evaluation of Iron Rod Industry in Nepal. J. Clean. Prod. 2008, 16, 1379–1387. [Google Scholar] [CrossRef]
- Kuosmanen, T.; Kortelainen, M. Measuring Eco-Efficiency of Production with Data Envelopment Analysis. J. Ind. Ecol. 2005, 9, 59–72. [Google Scholar] [CrossRef]
- Wang, B.; Wang, P.; He, H.; Zorn, C.; Guo, W.; Wu, J.; Yu, C.; Huang, X. Livestock–Cropland Re-Coupling and Intensive Farming: Strategies for Enhancing Greenhouse Gas Mitigation and Eco-Efficiency in Wheat–Maize Production in North China Plain. Environ. Res. Lett. 2024, 20, 014032. [Google Scholar] [CrossRef]
- Lu, X.; Li, J.; Liu, C.; Kuang, B.; Cai, D.; Hou, J. Driving factors and spatial differentiation of urban land green use efficiency in China. Sci. Geogr. Sin. 2022, 42, 611–621. [Google Scholar] [CrossRef]
- Lai, S.; Zhang, M.; Su, Z. Optimizing Tourism Ecological Security: A Study Based on NCA and FsQCA Methods. Environ. Dev. Sustain. 2024. [Google Scholar] [CrossRef]
- Wang, J.; Su, D.; Wu, Q.; Li, G.; Cao, Y. Study on Eco-Efficiency of Cultivated Land Utilization Based on the Improvement of Ecosystem Services and Emergy Analysis. Sci. Total Environ. 2023, 882, 163489. [Google Scholar] [CrossRef]
- Feng, L.; Lei, G.; Nie, Y. Exploring the Eco-Efficiency of Cultivated Land Utilization and Its Influencing Factors in Black Soil Region of Northeast China under the Goal of Reducing Non-Point Pollution and Net Carbon Emission. Environ. Earth Sci. 2023, 82, 94. [Google Scholar] [CrossRef]
- Zhang, Y.; Cao, W. Spatial effects of industrial agglomeration and environmental regulation on the green efficiency of urban construction land. Sci. Geogr. Sin. 2023, 43, 1729–1739. [Google Scholar] [CrossRef]
- Yu, J.; Zhou, K.; Yang, S. Land Use Efficiency and Influencing Factors of Urban Agglomerations in China. Land Use Policy 2019, 88, 104143. [Google Scholar] [CrossRef]
- Xu, T.; Umair, M.; Cheng, W.; Hakimova, Y.; Mang, G. Evaluating Eco-Efficiency as a Metric for Sustainable Urban Growth: A Comparative Study of Provincial Capital Cities in China. Ecol. Indic. 2024, 169, 112959. [Google Scholar] [CrossRef]
- Naseem, S.; Hu, X.; Sarfraz, M.; Mohsin, M. Strategic Assessment of Energy Resources, Economic Growth, and CO2 Emissions in G-20 Countries for a Sustainable Future. Energy Strategy Rev. 2024, 52, 101301. [Google Scholar] [CrossRef]
- Yin, Y.; Hou, X.; Liu, J.; Zhou, X.; Zhang, D. Detection and Attribution of Changes in Cultivated Land Use Ecological Efficiency: A Case Study on Yangtze River Economic Belt, China. Ecol. Indic. 2022, 137, 108753. [Google Scholar] [CrossRef]
- Ke, X.; Zhang, Y.; Zhou, T. Spatio-Temporal Characteristics and Typical Patterns of Eco-Efficiency of Cultivated Land Use in the Yangtze River Economic Belt, China. J. Geogr. Sci. 2023, 33, 357–372. [Google Scholar] [CrossRef]
- Li, M.; Tan, L.; Yang, X. The Impact of Environmental Regulation on Cultivated Land Use Eco-Efficiency: Evidence from China. Agriculture 2023, 13, 1723. [Google Scholar] [CrossRef]
- Wei, F.; Peng, F.; Liu, M.; Jiang, R. Carbon Productivity Growth in China’s Thermal Power Industry: Empirical Evidence Using a Bootstrapped Malmquist-Luenberger Productivity Index Approach with Fixed-Sum Undesirable Outputs. Energy 2024, 304, 132034. [Google Scholar] [CrossRef]
- Chen, H.; Zhang, C.; Li, J. Research on Influence and Spatial Effect of New-type Urbanization on Urban Land Green Use Efficiency in the Yangtze River Delta Region. Resour. Environ. Yangtze Basin 2024, 33, 1382–1396. [Google Scholar]
- Amowine, N.; Li, H.; Boamah, K.B.; Zhou, Z. Towards Ecological Sustainability: Assessing Dynamic Total-Factor Ecology Efficiency in Africa. Int. J. Environ. Res. Public Health 2021, 18, 9323. [Google Scholar] [CrossRef] [PubMed]
- Dai, Q.; Liu, X.; Sun, F.; Ren, F. Ensemble Intelligence Prediction Algorithms and Land Use Scenarios to Measure Carbon Emissions of the Yangtze River Delta: A Machine Learning Model Based on Long Short-Term Memory. PLoS ONE 2024, 19, e0311441. [Google Scholar] [CrossRef] [PubMed]
- Sun, Y.; Gao, C.; Li, J.; Gao, M.; Ma, R. Assessing the Cooling Efficiency of Urban Parks Using Data Envelopment Analysis and Remote Sensing Data. Theor. Appl. Clim. 2021, 145, 903–916. [Google Scholar] [CrossRef]
- Angulo-Meza, L.; González-Araya, M.; Iriarte, A.; Rebolledo-Leiva, R.; Soares de Mello, J.C. A Multiobjective DEA Model to Assess the Eco-Efficiency of Agricultural Practices within the CF + DEA Method. Comput. Electron. Agric. 2019, 161, 151–161. [Google Scholar] [CrossRef]
- Song, Y.; He, C.; Yeung, G.; Xu, Y. Industrial structure upgrading and urban land use efficiency: Evidence from 115 resource-based cities in China, 2000–2019. Geogr. Res. 2023, 42, 86–105. [Google Scholar]
- Gao, H.; He, M.; Xu, Y.; Nie, A. Impact of environmental target constraints on high-quality economic development of resource-based cities. Resour. Sci. 2024, 46, 1976–1995. [Google Scholar]
- Chen, P.; Xie, R.; Lu, M.; Huang, Z. The Impact of the Spatio-Temporal Neighborhood Effect on Urban Eco-Efficiency in China. J. Clean. Prod. 2021, 285, 124860. [Google Scholar] [CrossRef]
- Lun, R.; Sauer, J.; Gao, M.; Yang, Y.; Luo, Q.; Li, G. Does Internet Use Improve Eco-Efficiency of Agricultural Production? Evidence from Potato Farmers in China. J. Clean. Prod. 2024, 477, 143794. [Google Scholar] [CrossRef]
- Song, X.; Feng, Q.; Xia, F.; Li, X.; Scheffran, J. Impacts of Changing Urban Land-Use Structure on Sustainable City Growth in China: A Population-Density Dynamics Perspective. Habitat. Int. 2021, 107, 102296. [Google Scholar] [CrossRef]
- Baser, U. Determination of Eco-Efficiency and Optimization of Input Utilization in Hazelnut Production of Türkiye. Environ. Dev. Sustain. 2024, 27, 665–680. [Google Scholar] [CrossRef]
- Khalid, M. Smart Grids and Renewable Energy Systems: Perspectives and Grid Integration Challenges. Energy Strategy Rev. 2024, 51, 101299. [Google Scholar] [CrossRef]
- Huang, Y.; Li, L.; Yu, Y. Do Urban Agglomerations Outperform Non-Agglomerations? A New Perspective on Exploring the Eco-Efficiency of Yangtze River Economic Belt in China. J. Clean. Prod. 2018, 202, 1056–1067. [Google Scholar] [CrossRef]
- Zhao, Z.; Bai, Y.; Wang, G.; Chen, J.; Yu, J.; Liu, W. Land Eco-Efficiency for New-Type Urbanization in the Beijing-Tianjin-Hebei Region. Technol. Forecast. Soc. Change 2018, 137, 19–26. [Google Scholar] [CrossRef]
- Ma, Y.; Tong, J.; Ren, J. Calculation and robustness test of county-scale ecological efficiency based on multi-source remote sensing data: Taking the urban agglomeration in the Middle Reaches of Yangtze River as an example. J. Nat. Resour. 2019, 34, 1196–1208. [Google Scholar]
- Song, J.; Chen, S. Impact of economic agglomeration on land use eco-efficiency of three major urban agglomerations in China. J. Nat. Resour. 2021, 36, 2865–2877. [Google Scholar] [CrossRef]
- Tone, K. A Slacks-Based Measure of Efficiency in Data Envelopment Analysis. Eur. J. Oper. Res. 2001, 130, 498–509. [Google Scholar] [CrossRef]
- Basu, T.; Das, A. Urbanization Induced Changes in Land Use Dynamics and Its Nexus to Ecosystem Service Values: A Spatiotemporal Investigation to Promote Sustainable Urban Growth. Land Use Policy 2024, 144, 107239. [Google Scholar] [CrossRef]
- Wang, Z.; Xie, J. Spatiotemporal coupling relationship and influencing factors of China’s tourism industry organization. Acta Geogr. Sin. 2023, 78, 961–979. [Google Scholar]
- Lu, S.; Xiong, J. Spatial and temporal variation and influencing factors of agricultural green efficiency in the Yangtze River Economic Belt based on GWR. Sci. Geogr. Sin. 2023, 43, 337–348. [Google Scholar]
- Wang, Z.; Ma, D.; Tang, J. Asymmetric Fiscal Policies and Digital Economy Development: An Empirical Analysis Based on the Global Digital Value Chain Perspective. Int. Rev. Financ. Anal. 2024, 96, 103556. [Google Scholar] [CrossRef]
- Butsic, V.; Radeloff, V.C.; Kuemmerle, T.; Pidgeon, A.M. Analytical Solutions to Trade-Offs between Size of Protected Areas and Land-Use Intensity. Conserv. Biol. 2012, 26, 883–893. [Google Scholar] [CrossRef] [PubMed]
- Yu, H.; Zheng, C. Environmental Regulation, Land Use Efficiency and Industrial Structure Upgrading: Test Analysis Based on Spatial Durbin Model and Threshold Effect. Heliyon 2024, 10, e26508. [Google Scholar] [CrossRef] [PubMed]
- Dong, F.; Zhang, Y.; Zhang, X. Applying a Data Envelopment Analysis Game Cross-Efficiency Model to Examining Regional Ecological Efficiency: Evidence from China. J. Clean. Prod. 2020, 267, 122031. [Google Scholar] [CrossRef]
- Wu, J.; Niu, Y.; Peng, J.; Wang, Z.; Huang, X. Research on energy consumption dynamic among prefecture-level cities in China based on DMSP/OLS Nighttime Light. Geogr. Res. 2014, 33, 625–634. [Google Scholar]
- Zheng, H.; Wu, Y.; He, H.; Delang, C.O.; Qian, J.; Lu, J.; Yao, Z.; Li, G. Urban Land Use Eco-Efficiency and Improvement in the Western Region of China. J. Clean. Prod. 2023, 412, 137385. [Google Scholar] [CrossRef]
- Krall, L.; Gowdy, J.M. Dialectics and Evolutionary Materialism: Expanding Methodological Pluralism in Ecological Economics. Ecol. Econ. 2025, 230, 108487. [Google Scholar] [CrossRef]
- Su, Q.; Jiang, X. Evaluate the Economic and Environmental Efficiency of Land Use from the Perspective of Decision-Makers’ Subjective Preferences. Ecol. Indic. 2021, 129, 107984. [Google Scholar] [CrossRef]
- Wu, H.; Hao, Y.; Weng, J.-H. How Does Energy Consumption Affect China’s Urbanization? New Evidence from Dynamic Threshold Panel Models. Energy Policy 2019, 127, 24–38. [Google Scholar] [CrossRef]
- Su, Y.; Fan, Q. Renewable Energy Technology Innovation, Industrial Structure Upgrading and Green Development from the Perspective of China’s Provinces. Technol. Forecast. Soc. Change 2022, 180, 121727. [Google Scholar] [CrossRef]
- Yasmeen, H.; Tan, Q.; Zameer, H.; Tan, J.; Nawaz, K. Exploring the Impact of Technological Innovation, Environmental Regulations and Urbanization on Ecological Efficiency of China in the Context of COP21. J. Environ. Manag. 2020, 274, 111210. [Google Scholar] [CrossRef]
- Ma, Y.; Zhang, R.; Ren, J. Spatial and Temporal Dynamics and Its Driving Mechanism of County-scale Eco-efficiency in Urban Agglomeration in Middle Reaches of Yangtze River. Resour. Environ. Yangtze Basin 2022, 31, 1467–1481. [Google Scholar]
- Yan, N.; Zhang, J.; Xia, B.; Li, S.; Yang, W. How Can the Natural Background and Ecological & Environment Promote the Green and Sustainable Development of Chinese Tourist Attractions? Ecol. Indic. 2024, 169, 112813. [Google Scholar] [CrossRef]
- Zelený, J.; Mercado-Bettín, D.; Müller, F. Towards the Evaluation of Regional Ecosystem Integrity Using NDVI, Brightness Temperature and Surface Heterogeneity. Sci. Total Environ. 2021, 796, 148994. [Google Scholar] [CrossRef]
- Xu, H. A remote sensing index for assessment of regional ecological changes. China Environ. Sci. 2013, 33, 889–897. [Google Scholar]
- Zhang, R.; Wang, Y.; Chang, X.; Li, Y. Response of land use change to human activities in the Yellow River Basin based on water resources division. J. Nat. Resour. 2019, 34, 274–287. [Google Scholar] [CrossRef]
- Yang, J.; Huang, X. The 30 m Annual Land Cover Dataset and Its Dynamics in China from 1990 to 2019. Earth Syst. Sci. Data 2021, 13, 3907–3925. [Google Scholar] [CrossRef]
- Xie, G.; Lu, C.; Leng, Y.; Zheng, D.; Li, S. Ecological Assets Valuation of the Tibetan Plateau. J. Nat. Resour. 2003, 18, 189–196. [Google Scholar]
- Wang, J.; Sun, K.; Ni, J.; Xie, D. Evaluation and Factor Analysis of the Intensive Use of Urban Land Based on Technical Efficiency Measurement—A Case Study of 38 Districts and Counties in Chongqing, China. Sustainability 2020, 12, 8623. [Google Scholar] [CrossRef]
- Wang, H.; Zhang, B.; Liu, Y.; Liu, Y.; Xu, S.; Deng, Y.; Zhao, Y.; Chen, Y.; Hong, S. Multi-dimensional analysis of urban expansion patterns and their driving forces based on the center of gravity-GTWR model: A case study of the Beijing-Tianjin-Hebei urban agglomeration. Acta Geogr. Sin. 2018, 73, 1076–1092. [Google Scholar]
- Zhao, M.; Xiao, X.; Le, Y. The Impact of City-County Mergers on Urban Land Green Utilization Efficiency: Evidence from China. Front. Environ. Sci. 2024, 12, 1418982. [Google Scholar] [CrossRef]
- Yang, X.; Wen, S. Spatial Correlation Network of Construction and Demolition Waste Management Efficiency: A Study Based on an Improved Three-Stage SBM-DEA Model in China. Buildings 2025, 15, 51. [Google Scholar] [CrossRef]
- Bernués, A.; Rodríguez-Ortega, T.; Alfnes, F.; Clemetsen, M.; Eik, L.O. Quantifying the Multifunctionality of Fjord and Mountain Agriculture by Means of Sociocultural and Economic Valuation of Ecosystem Services. Land Use Policy 2015, 48, 170–178. [Google Scholar] [CrossRef]
- Cheng, M.; Li, Q.; Wen, Z. Coupling Coordination Degree Analysis and Driving Factors of Innovation Network and Eco-Efficiency in China. Environ. Impact Assess. Rev. 2023, 99, 107008. [Google Scholar] [CrossRef]
- Xie, X.; Fu, H.; Zhao, K.; Chen, D.; Yu, Y.; Hu, S. A Systematic Approach to Optimizing Regional Industrial Networks for High Eco-Efficiency Transformation. Environ. Sci. Technol. 2025, 59, 384–395. [Google Scholar] [CrossRef]
- Ruan, X.; Ding, N.; Yang, J. Dual-Level Eco-Efficiency Analysis in Sustainable Management: An Empirical Study on Textile Manufacturers and Supply Chains in China. J. Environ. Manag. 2022, 304, 114227. [Google Scholar] [CrossRef]
Disclaimer/Publisher’s Note: The statements, opinions and data contained in all publications are solely those of the individual author(s) and contributor(s) and not of MDPI and/or the editor(s). MDPI and/or the editor(s) disclaim responsibility for any injury to people or property resulting from any ideas, methods, instructions or products referred to in the content. |
© 2025 by the authors. Licensee MDPI, Basel, Switzerland. This article is an open access article distributed under the terms and conditions of the Creative Commons Attribution (CC BY) license (https://creativecommons.org/licenses/by/4.0/).