


Spatiotemporal Evolution and Driving Factors of Desertification Sensitivity During Urbanization: A Case Study of the Beijing–Tianjin–Hebei Core Region

Abstract
1. Introduction
2. Materials and Methods
2.1. Study Area
2.2. Data Sources
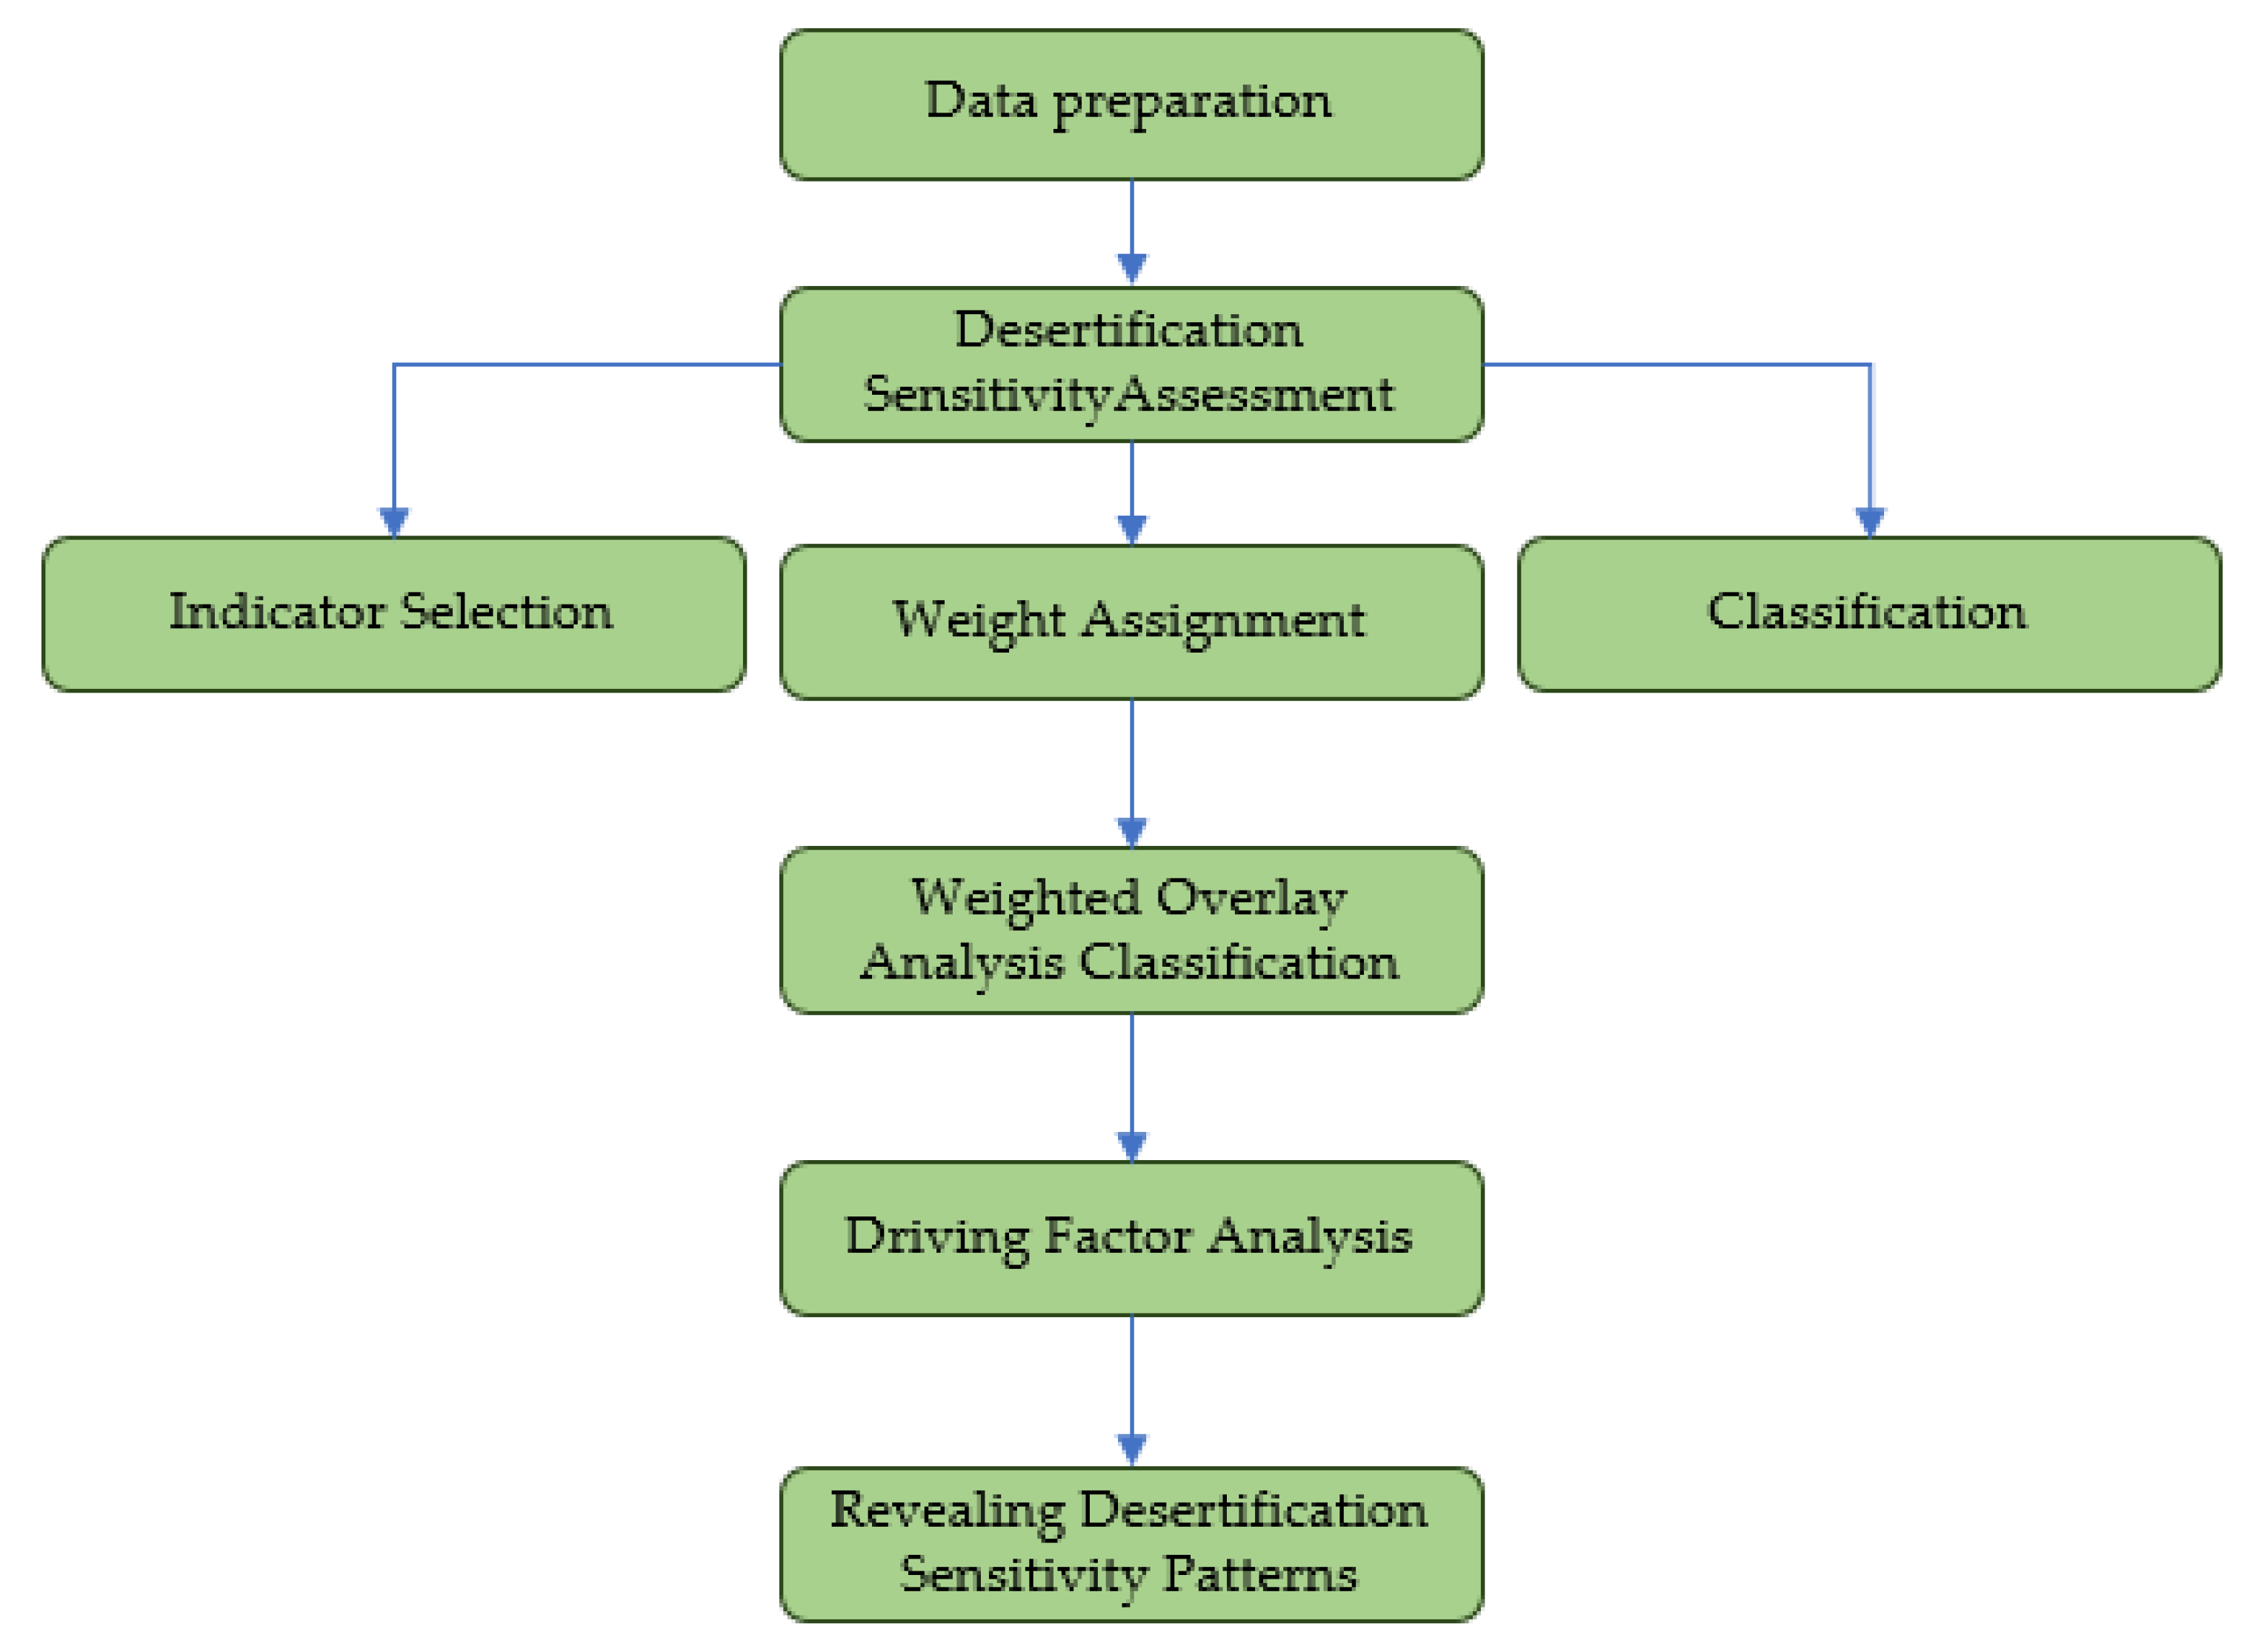
2.3. Methods
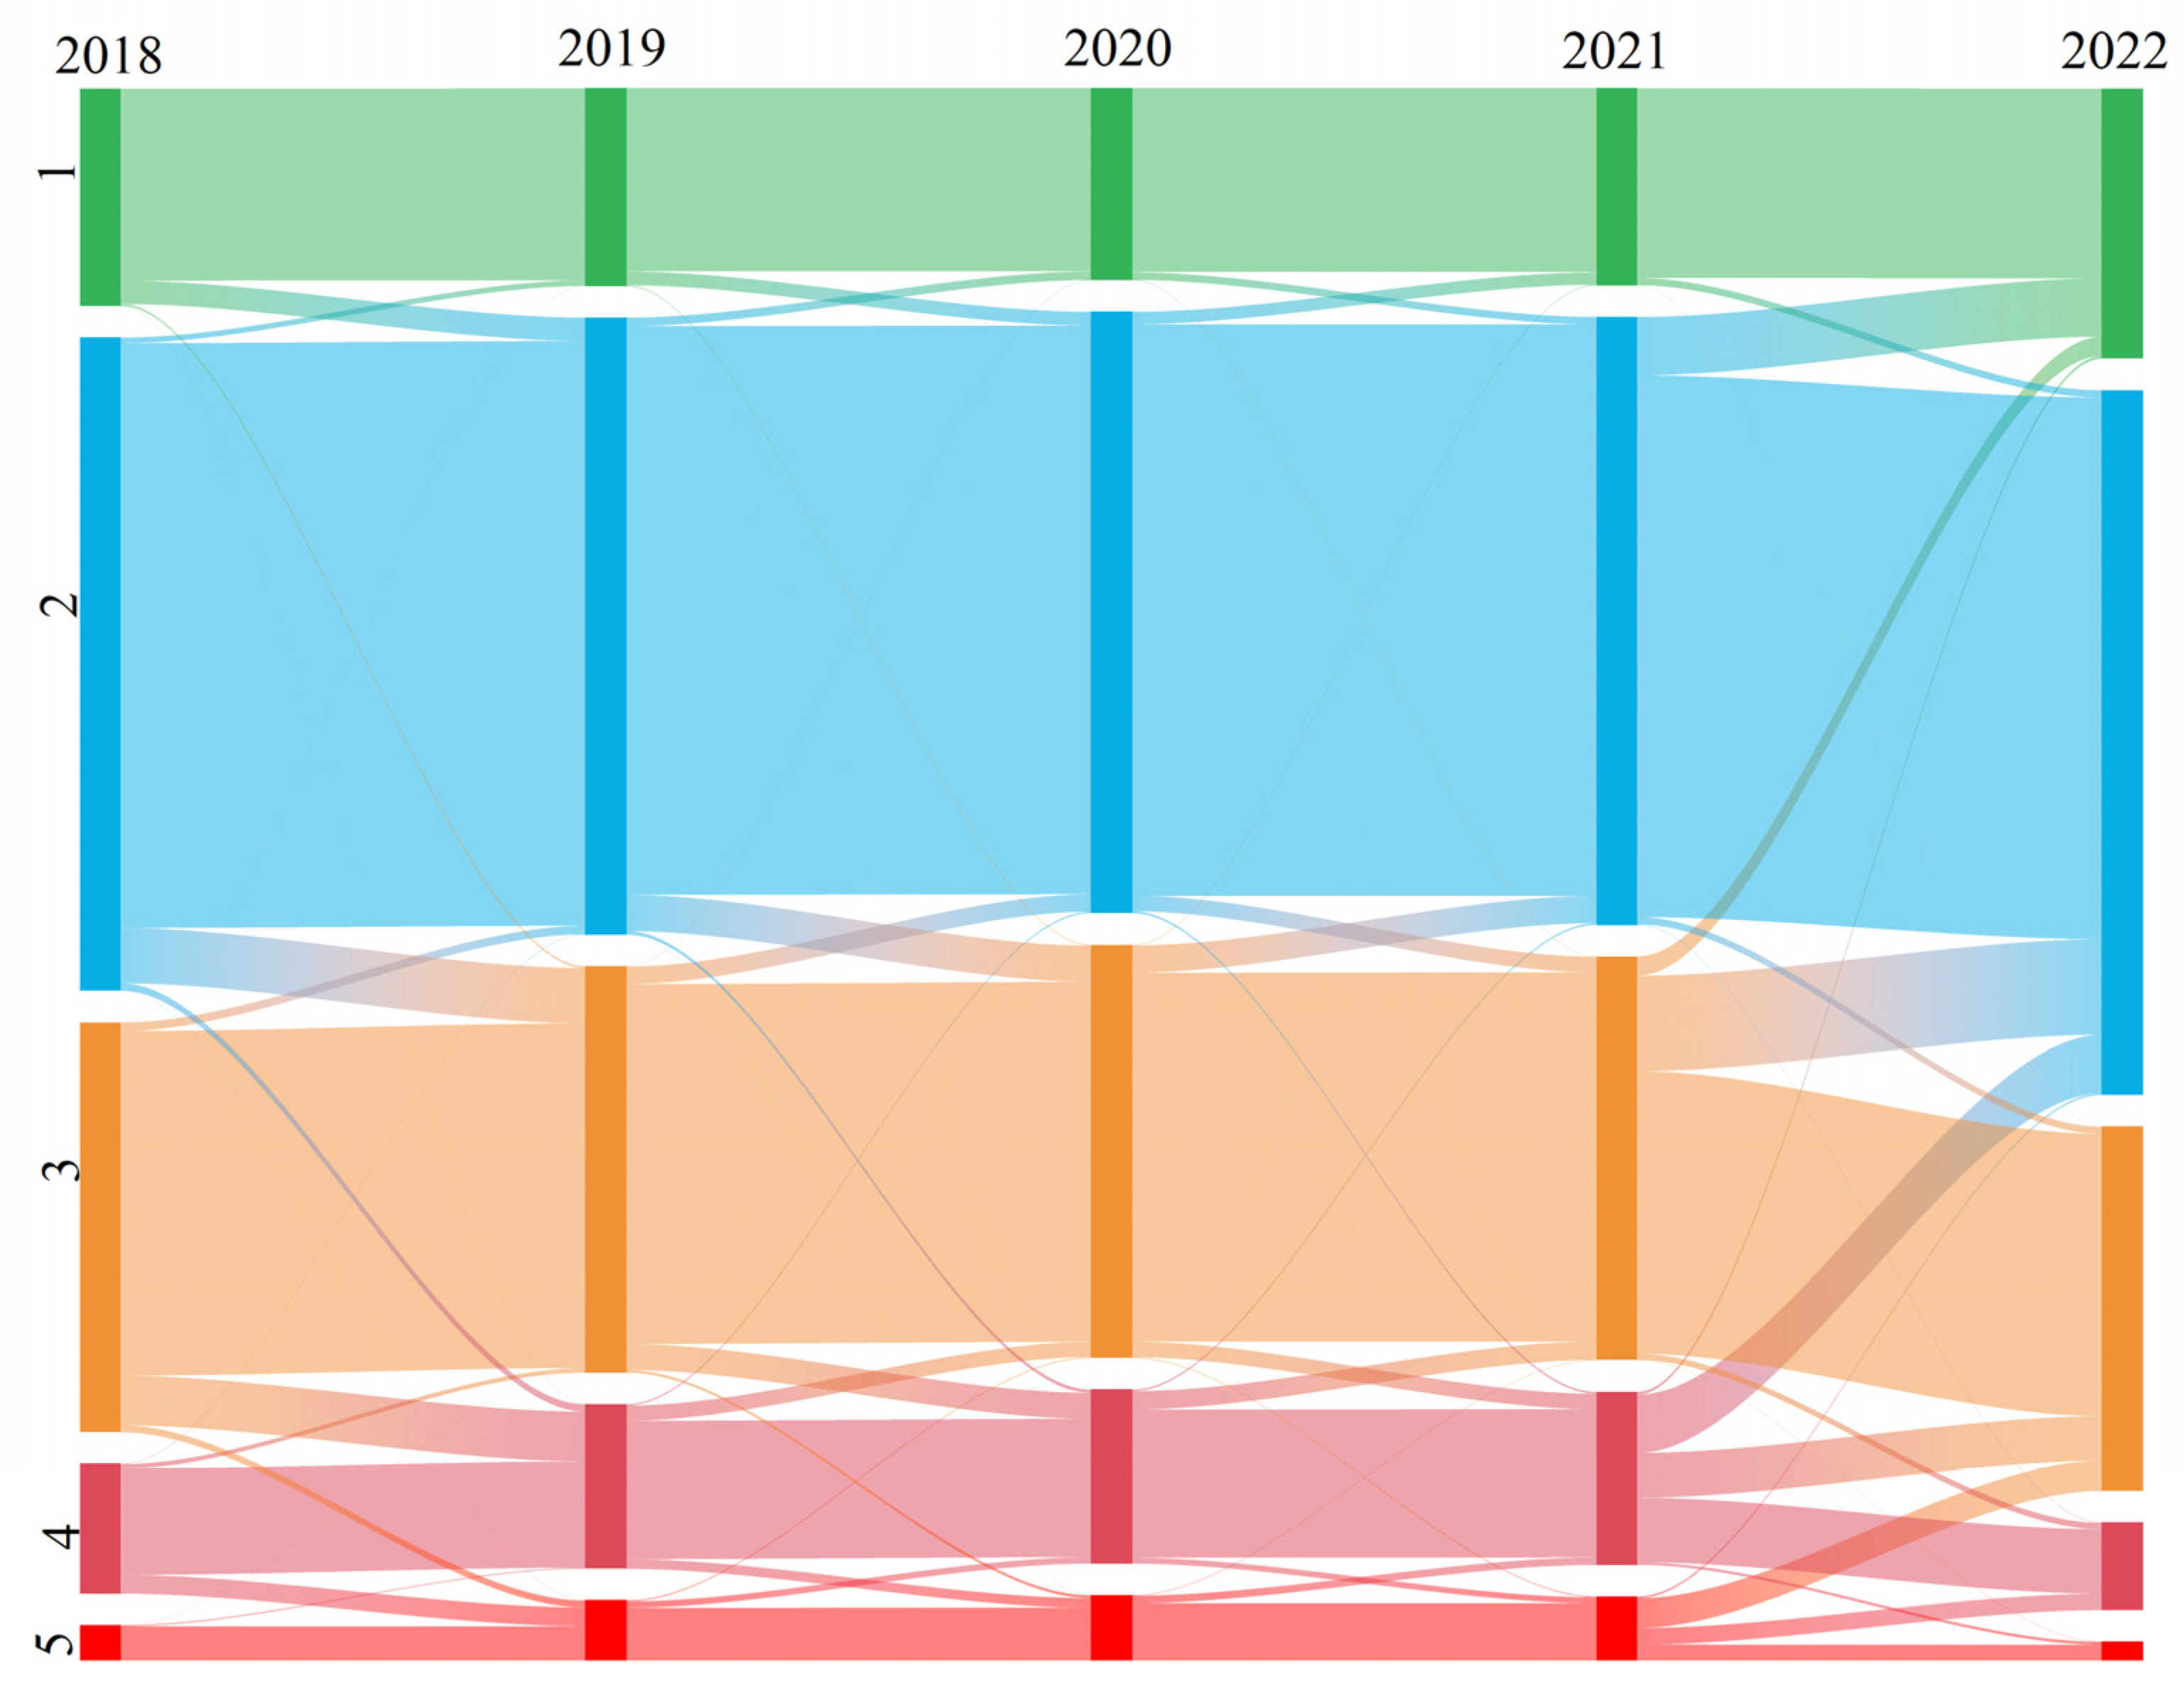
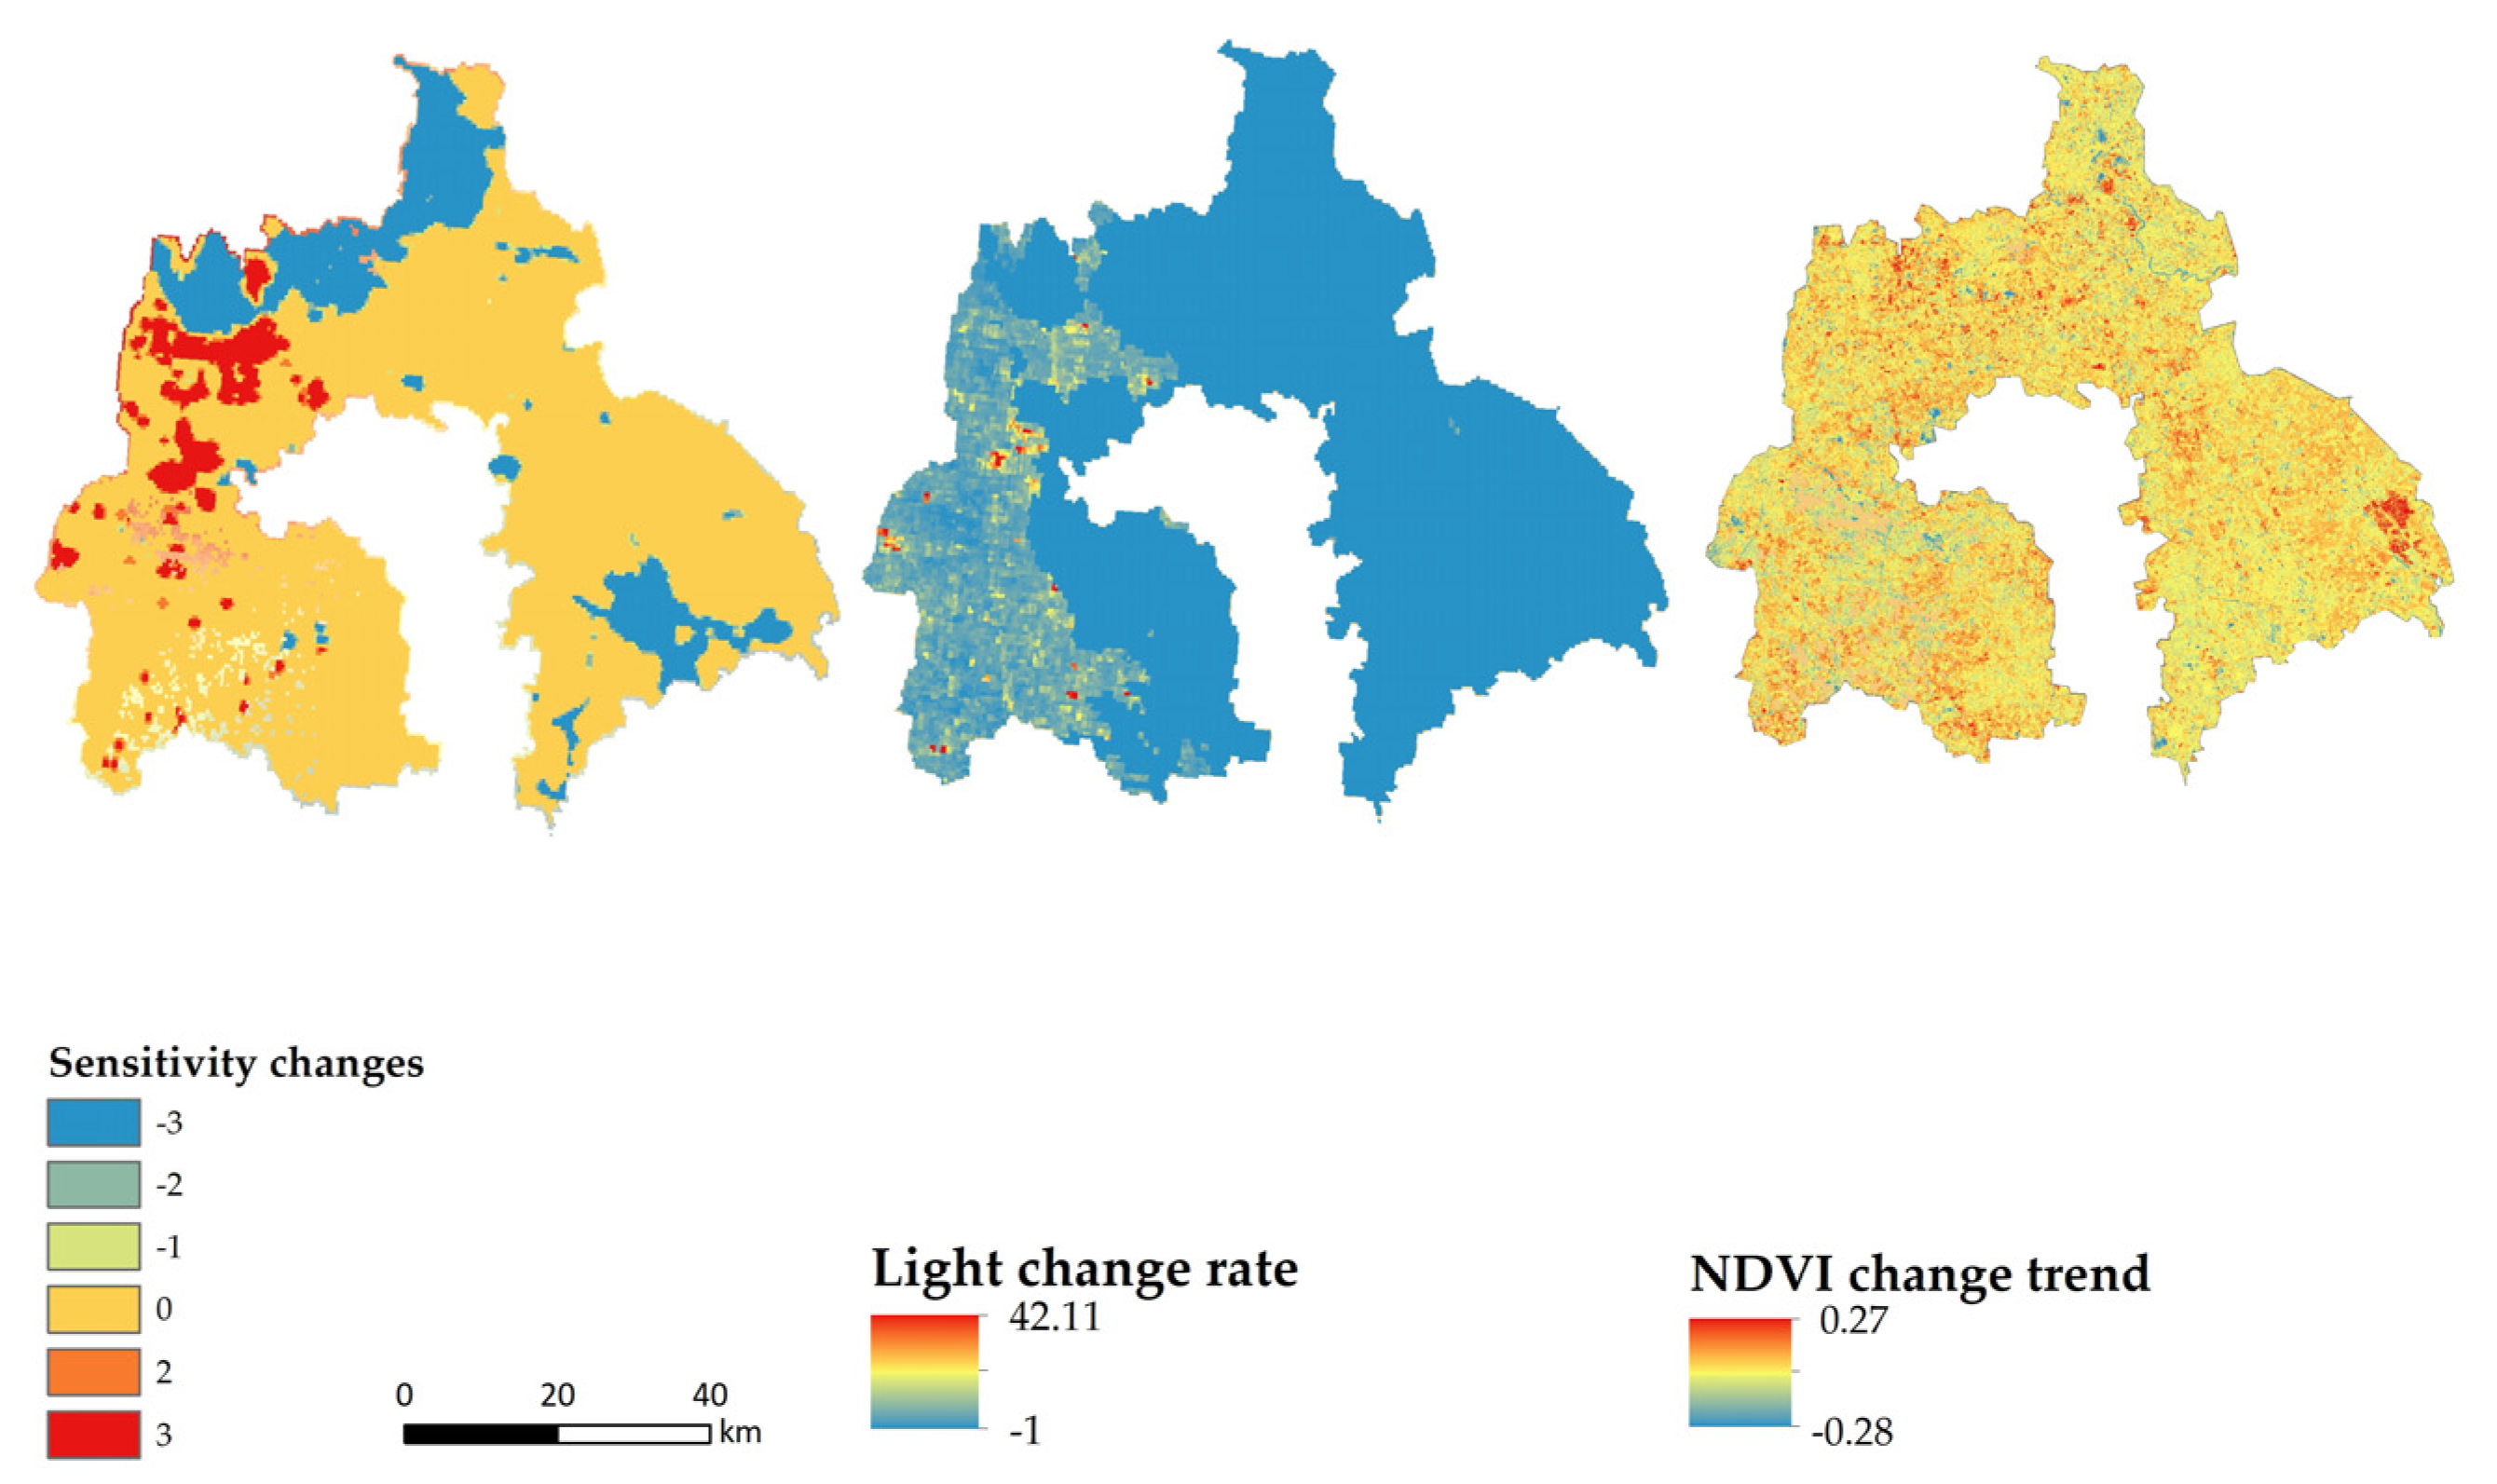
3. Results
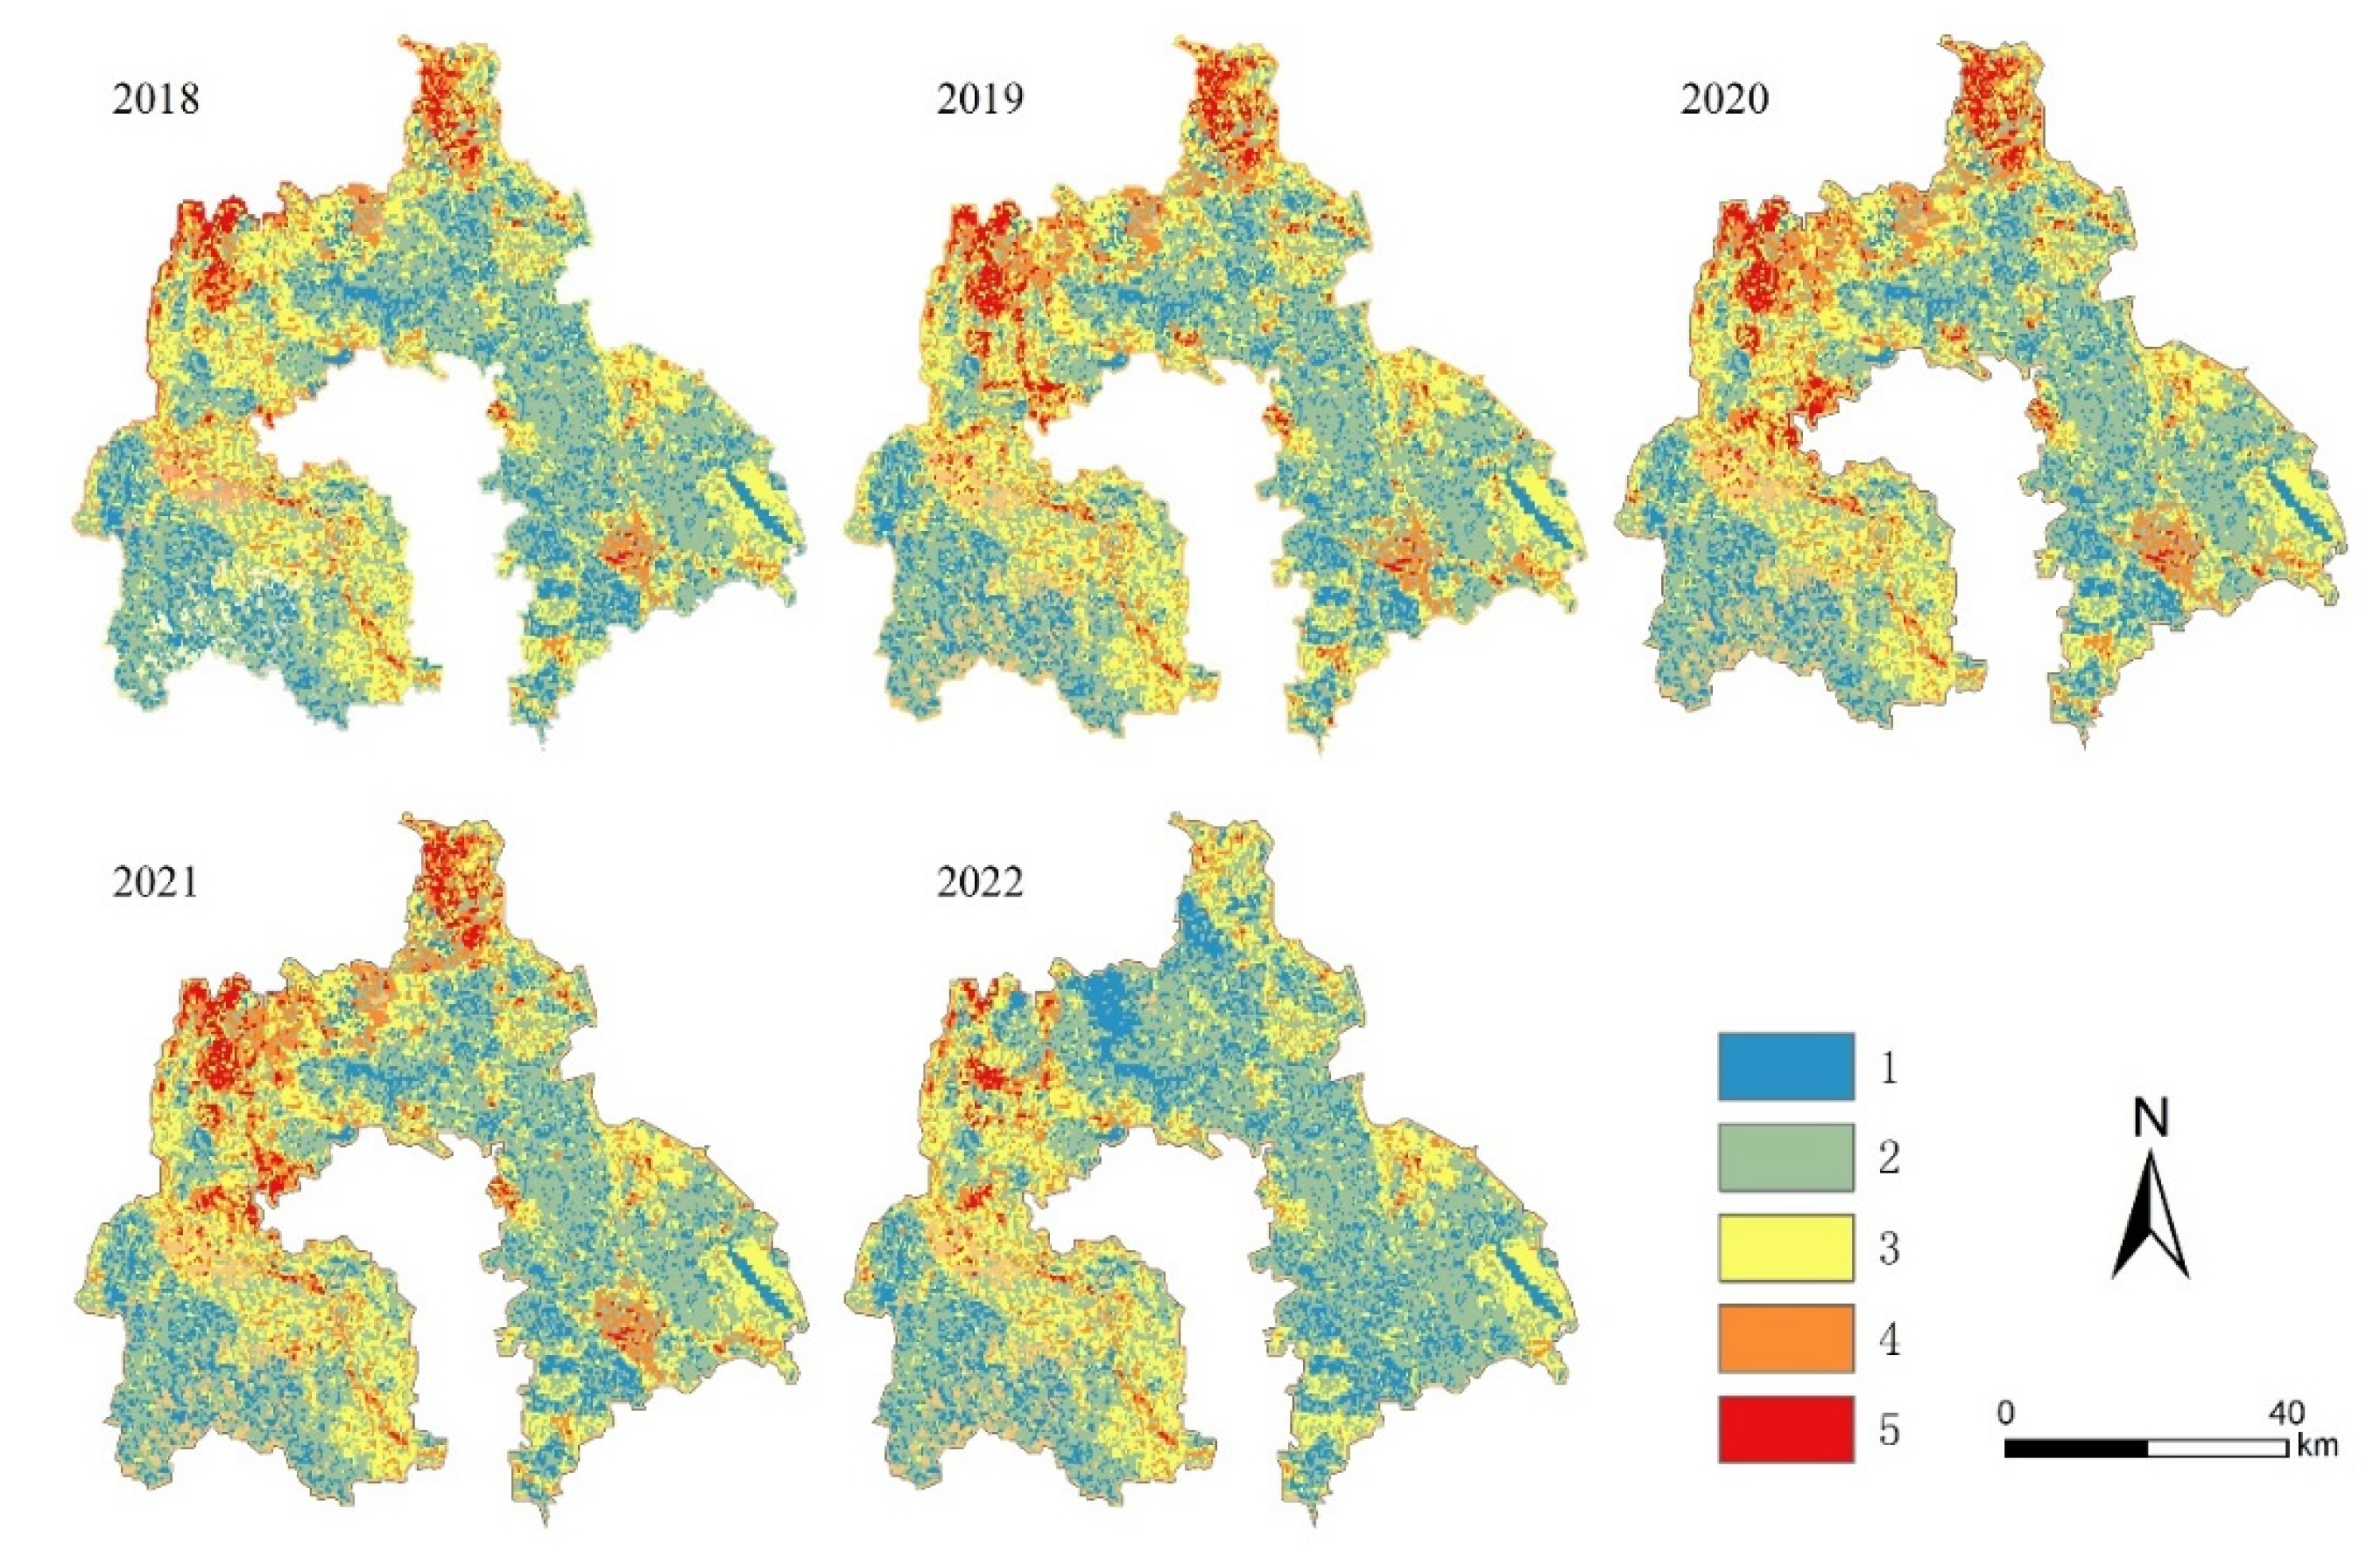
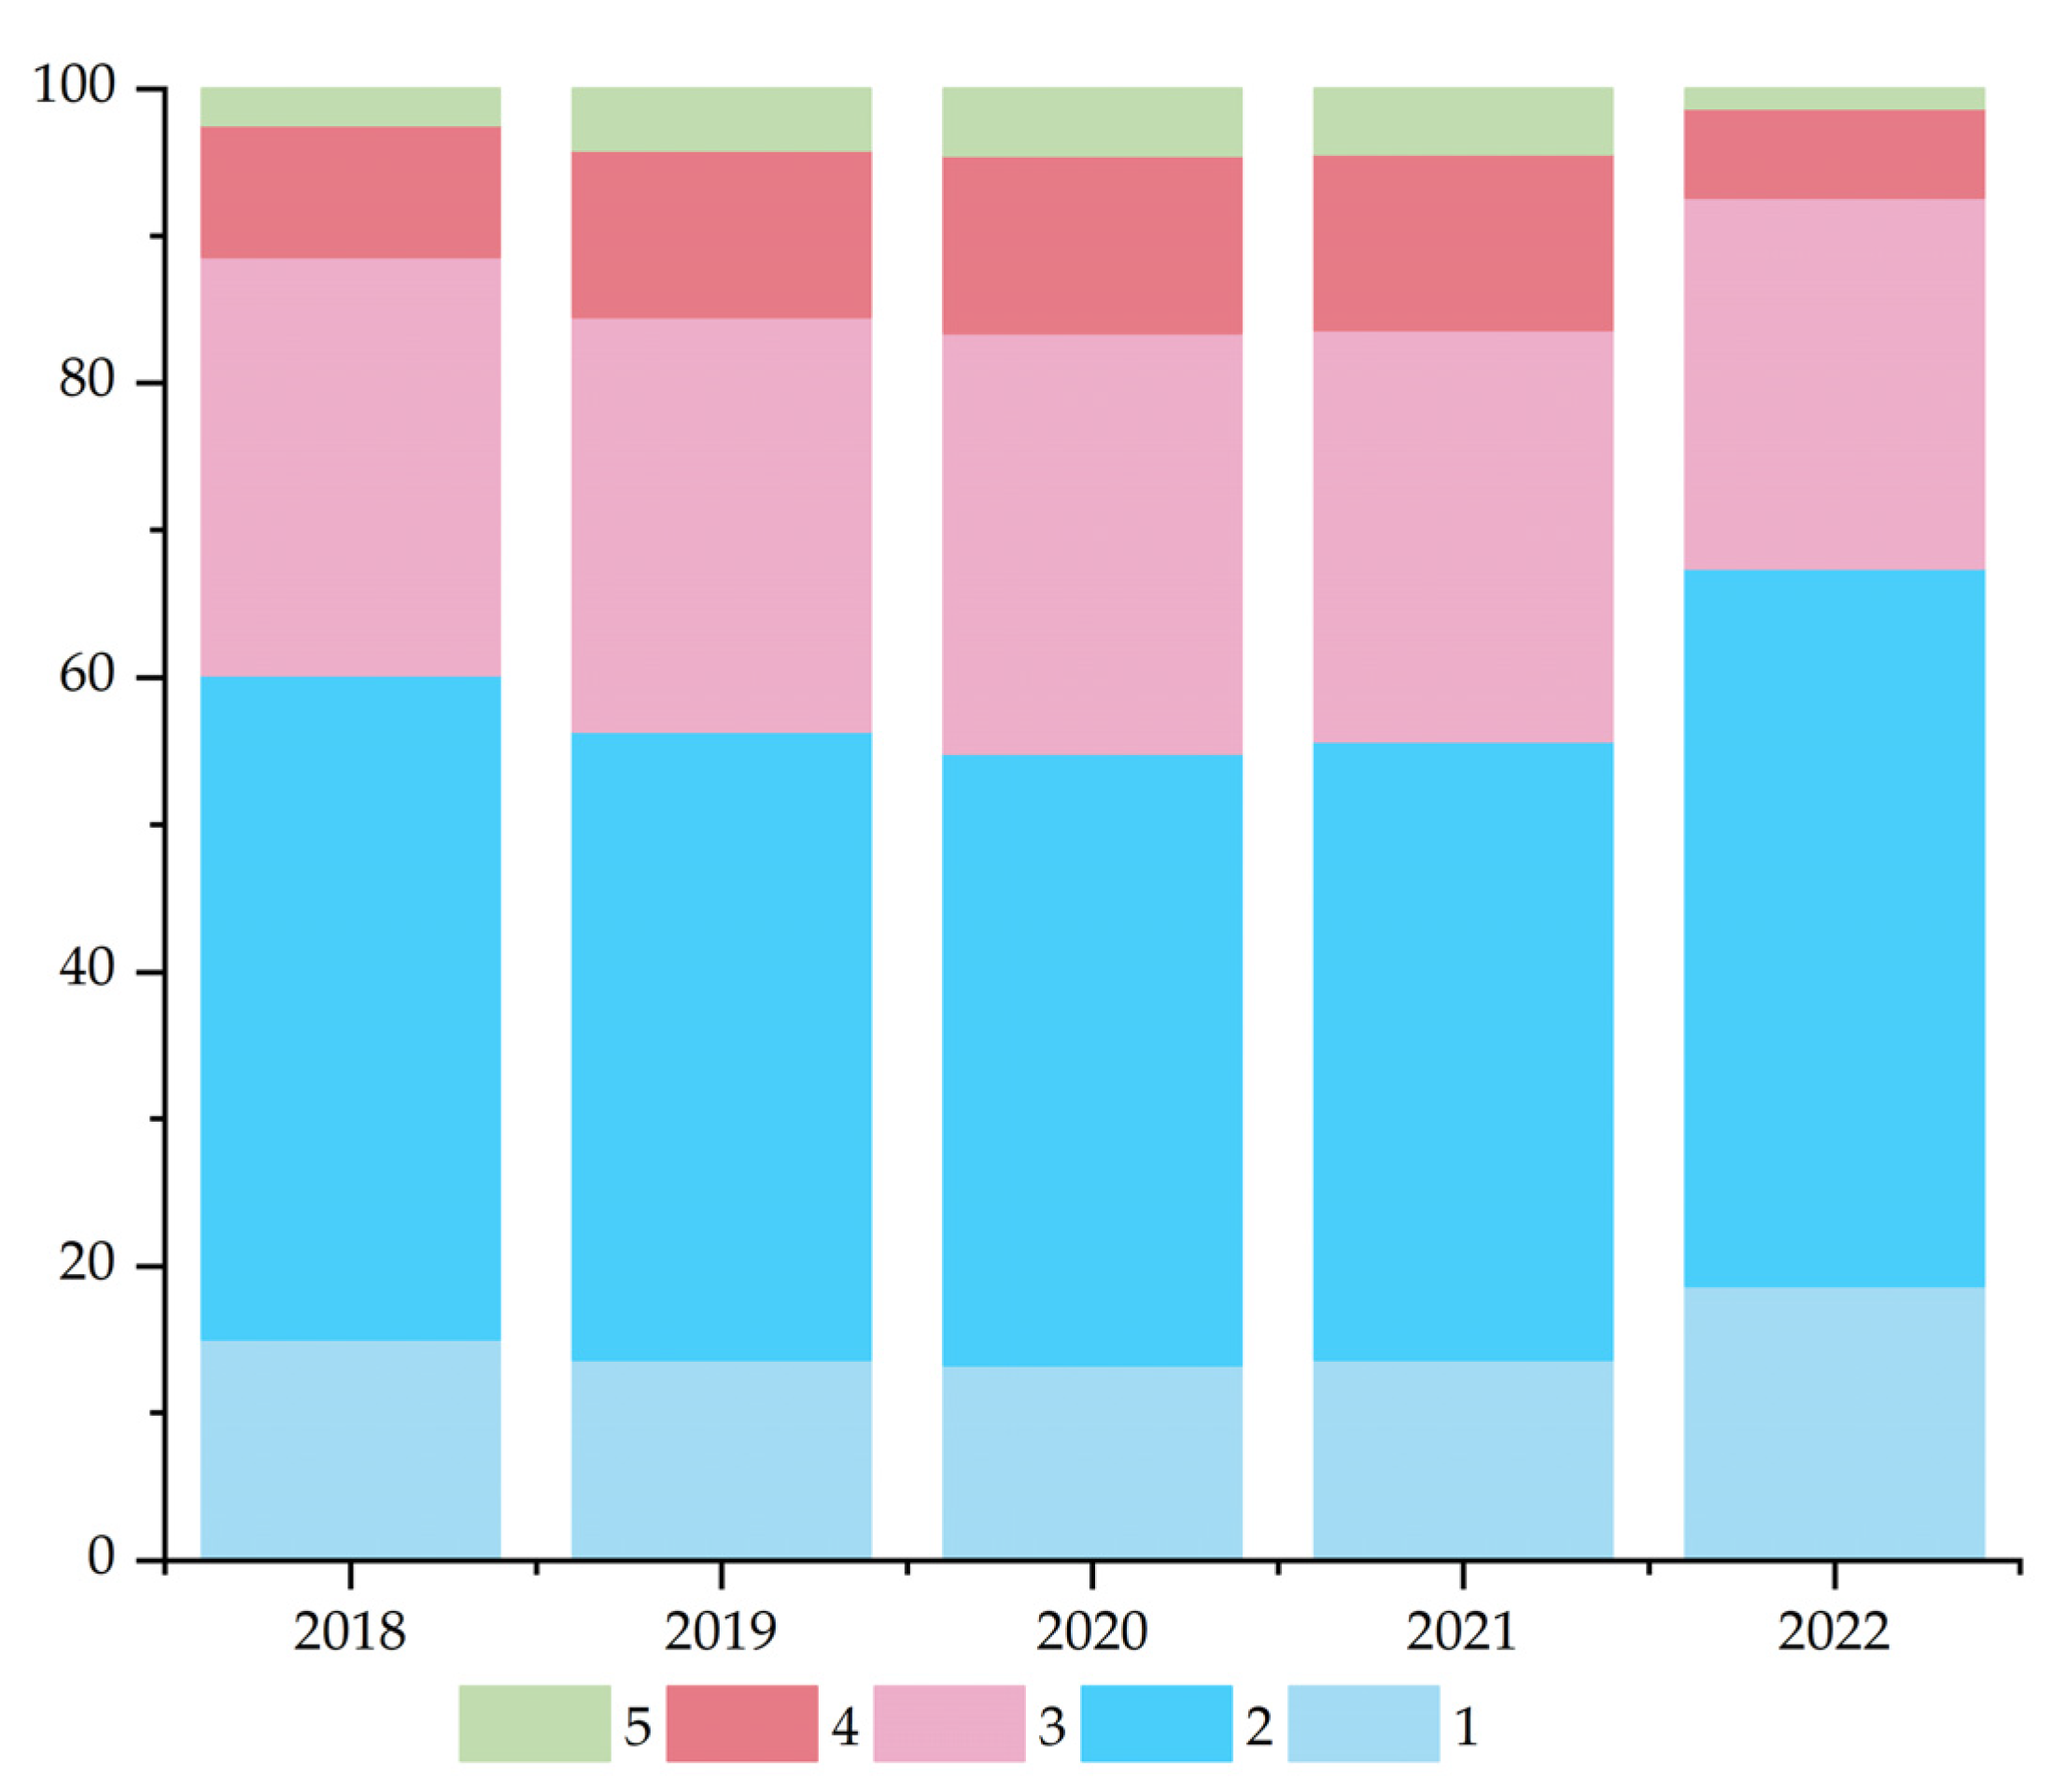
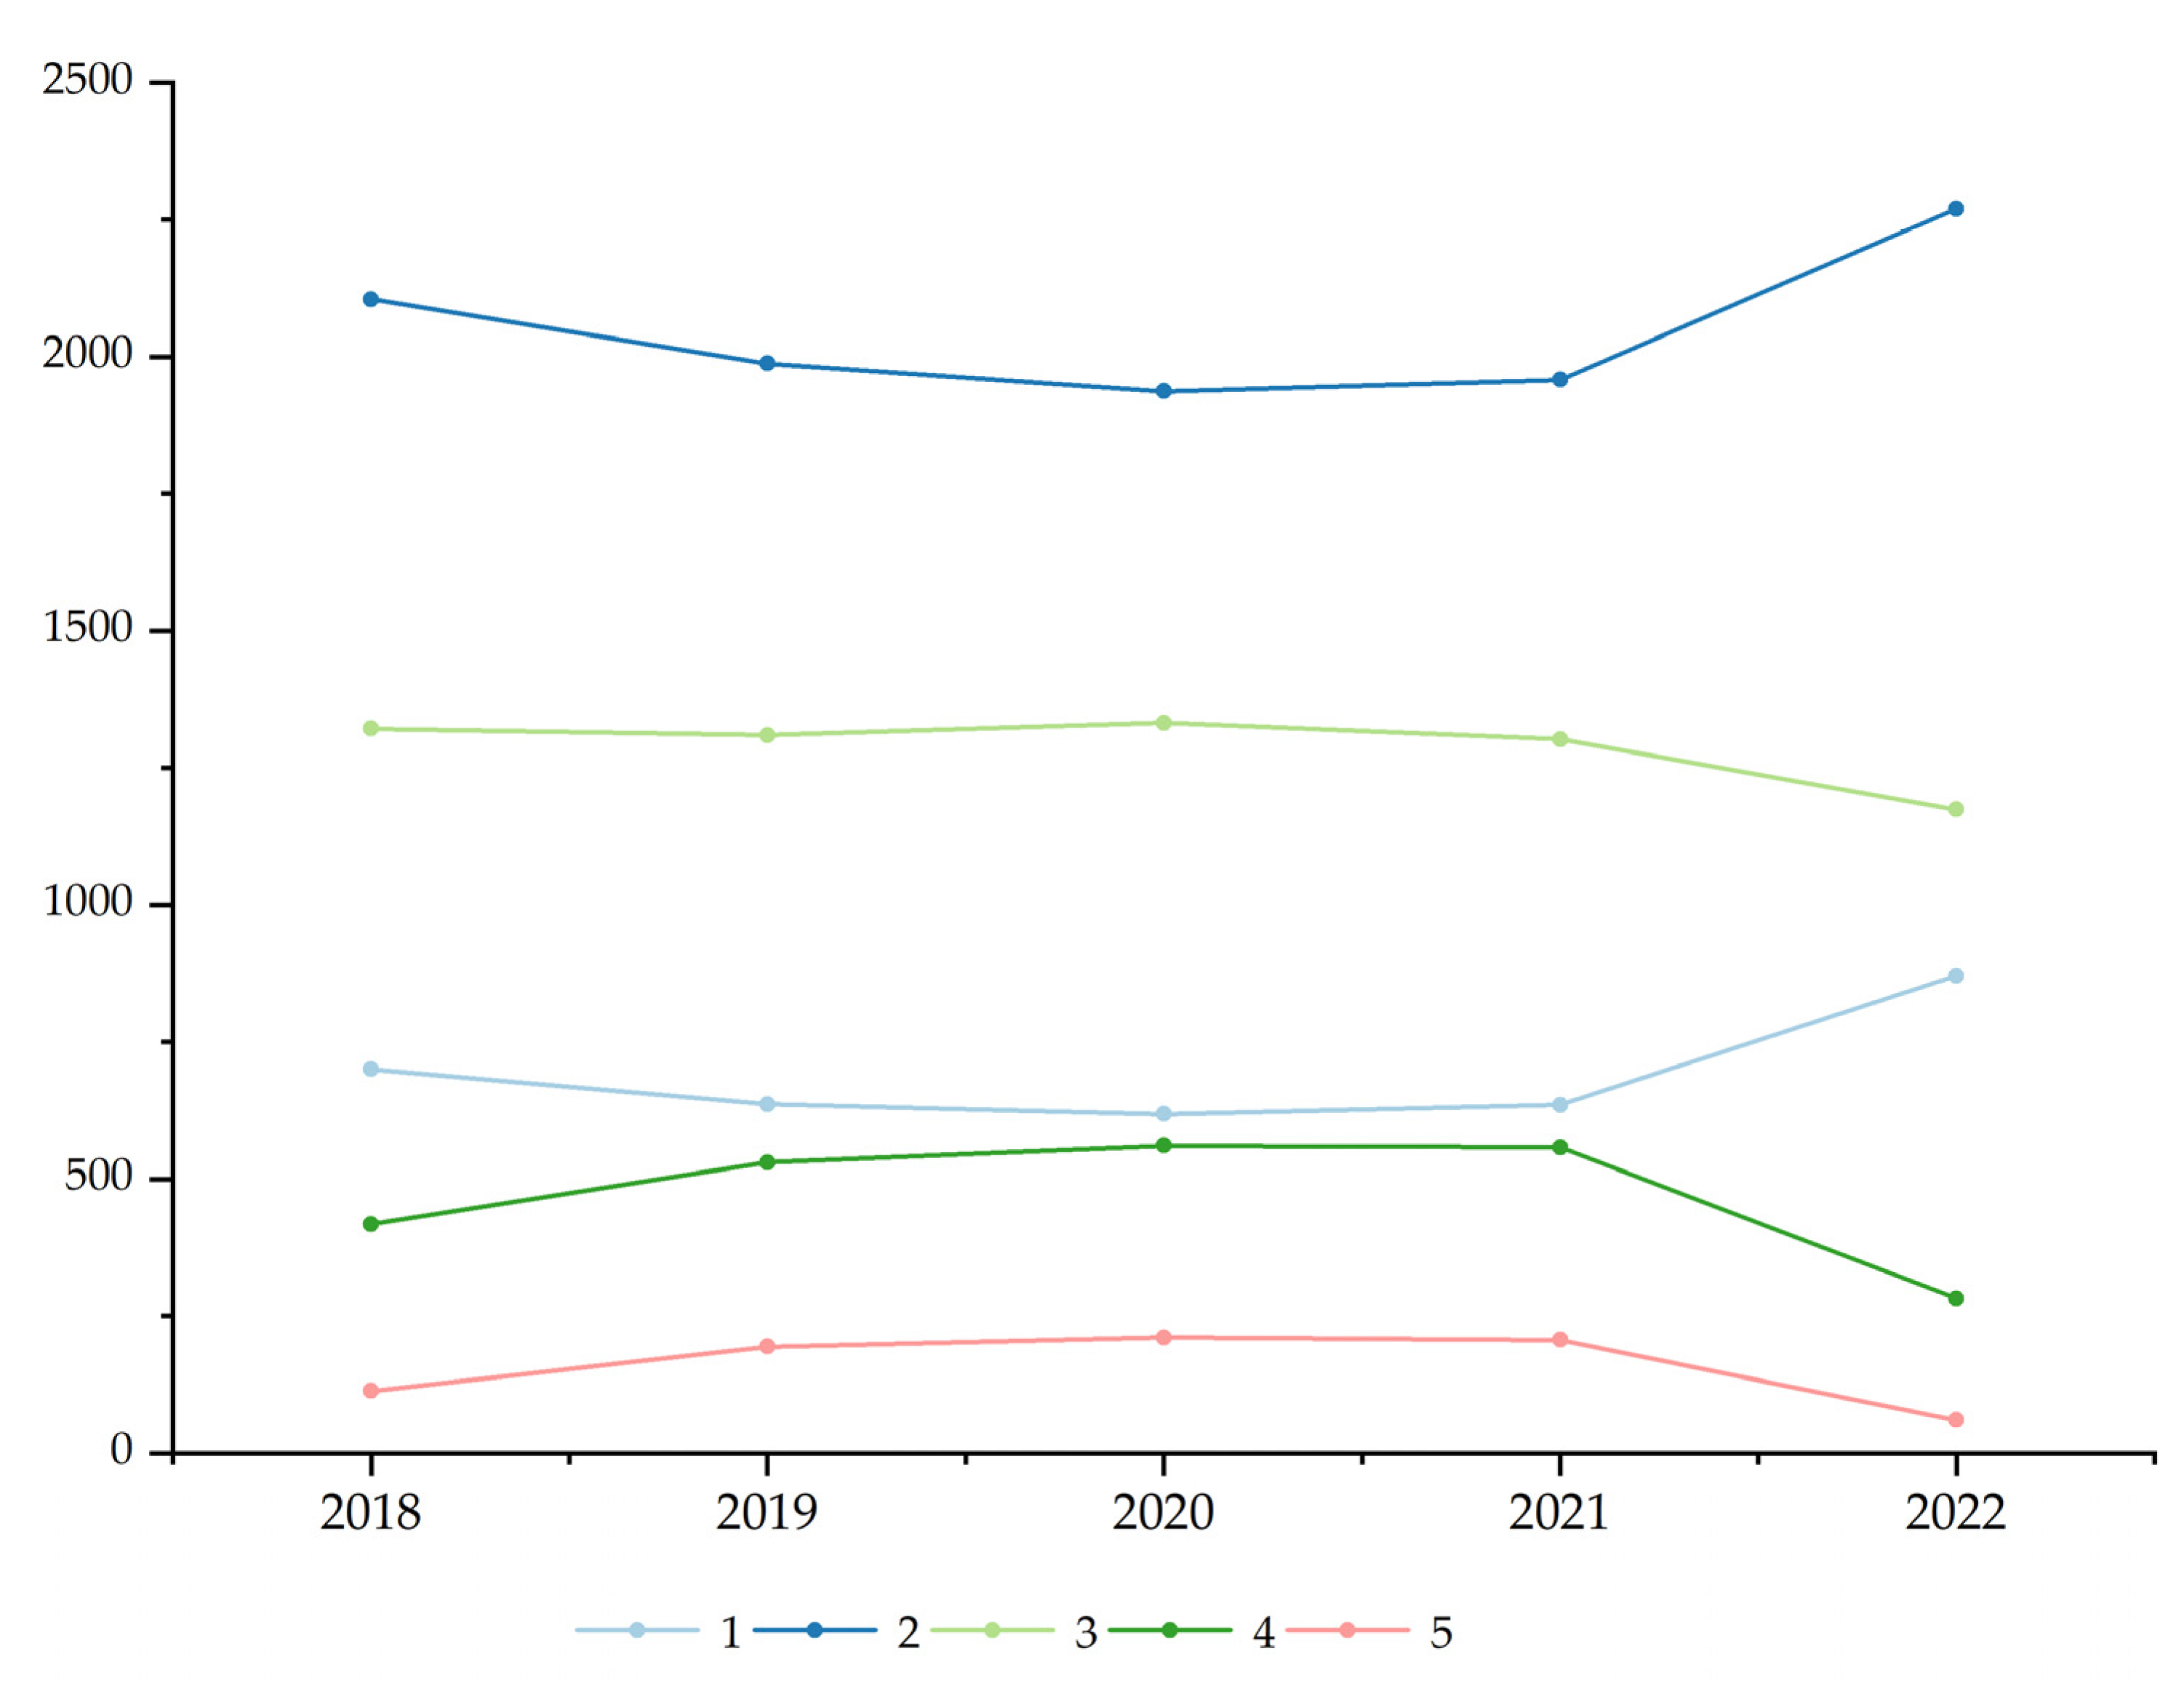
3.1. Spatiotemporal Evolution of Sensitivity
3.2. Driving Force Response Analysis
4. Discussion
5. Conclusions
Author Contributions
Funding
Data Availability Statement
Acknowledgments
Conflicts of Interest
References
- Wang, X.; Geng, X.; Chen, S.; Chen, F. How does desertification combating affect vegetation cover and incomes of farmers and herdsmen in the arid and semi-arid China? Chin. Sci. Bull.-Chin. 2023, 68, 2013–2015. [Google Scholar] [CrossRef]
- Wei, W.; Yu, X.; Zhang, M.-Z.; Zhang, J.; Yuan, T.; Liu, C.-F. Dynamics of desertification in the lower reaches of Shiyang River Basin, Northwest China during 1995–2018. Ying Yong Sheng Tai Xue Bao = J. Appl. Ecol. 2021, 32, 2098–2106. [Google Scholar] [CrossRef]
- Zhang, X.; Zhang, F.; Qi, Y.; Deng, L.; Wang, X.; Yang, S. New research methods for vegetation information extraction based on visible light remote sensing images from an unmanned aerial vehicle (UAV). Int. J. Appl. Earth Obs. Geoinf. 2019, 78, 215–226. [Google Scholar] [CrossRef]
- Fensholt, R.; Langanke, T.; Rasmussen, K.; Reenberg, A.; Prince, S.D.; Tucker, C.; Scholes, R.J.; Le, Q.B.; Bondeau, A.; Eastman, R.; et al. Greenness in semi-arid areas across the globe 1981–2007—An Earth Observing Satellite based analysis of trends and drivers. Remote Sens. Environ. 2012, 121, 144–158. [Google Scholar] [CrossRef]
- Banerjee, A.; Kang, S.; Meadows, M.E.; Sajjad, W.; Bahadur, A.; Ul Moazzam, M.F.; Xia, Z.; Mango, J.; Das, B.; Kirsten, K.L. Evaluating the relative influence of climate and human activities on recent vegetation dynamics in West Bengal, India. Environ. Res. 2024, 250, 118450. [Google Scholar] [CrossRef] [PubMed]
- Guo, Z.; Liu, S.; Kang, W.; Chen, X.; Zhang, X. Change Trend of Vegetation Coverage in the Mu Us Sandy Region from 2000 to 2015. J. Desert Res. 2018, 38, 1099–1107. [Google Scholar]
- Zhang, X.; Han, L.; Li, L.; Bai, Z. Analysis of desertification and the driving factors over the Loess Plateau. Geocarto Int. 2023, 38, 2290175. [Google Scholar] [CrossRef]
- Wu, F.; Wang, X.; Ren, Y. Urbanization's Impacts on Ecosystem Health Dynamics in the Beijing-Tianjin-Hebei Region, China. Int. J. Environ. Res. Public Health 2021, 18, 918. [Google Scholar] [CrossRef]
- Lan, G.; Jiang, X.; Xu, D.; Guo, X.; Wu, Y.; Liu, Y.; Yang, Y. Ecological vulnerability assessment based on remote sensing ecological index (RSEI): A case of Zhongxian County, Chongqing. Front. Environ. Sci. 2023, 10, 1074376. [Google Scholar] [CrossRef]
- Zhao, Y.; Qu, Z.; Zhang, Y.; Ao, Y.; Han, L.; Kang, S.; Sun, Y. Effects of human activity intensity on habitat quality based on nighttime light remote sensing: A case study of Northern Shaanxi, China. Sci. Total Environ. 2022, 851, 158037. [Google Scholar] [CrossRef]
- Li, M.; Liu, Q.; Zhang, H.; Wells, R.R.; Wang, L.; Geng, J. Effects of antecedent soil moisture on rill erodibility and critical shear stress. CATENA 2022, 216, 106356. [Google Scholar] [CrossRef]
- Chen, X.; Jia, X.; Pickering, M. A Nighttime Lights Adjusted Impervious Surface Index (NAISI) with Integration of Landsat Imagery and Nighttime Lights Data from International Space Station. Int. J. Appl. Earth Obs. Geoinf. 2019, 83, 101889. [Google Scholar] [CrossRef]
- Yang, K.; Sun, W.; Luo, Y.; Zhao, L. Impact of urban expansion on vegetation: The case of China (2000–2018). J. Environ. Manag. 2021, 291, 112598. [Google Scholar] [CrossRef]
- Paz, D.B.; Henderson, K.; Loreau, M. Agricultural land use and the sustainability of social-ecological systems. Ecol. Model. 2020, 437, 109312. [Google Scholar] [CrossRef]
- Zhang, X.; Zhong, Z.; Zhang, M.; Zhao, F.; Wu, Y.; Sun, Y.; Luo, J.; Zhang, Y.; Wang, X.; Cai, J.; et al. Analysis of anthropogenic disturbance and spatial and temporal changes of bird communities in plateau wetlands fusing bird survey and nighttime light remote sensing data. J. Environ. Manag. 2025, 375, 124349. [Google Scholar] [CrossRef] [PubMed]
- Banks-Leite, C.; Betts, M.G.; Ewers, R.M.; Orme, C.D.L.; Pigot, A.L. The macroecology of landscape ecology. Trends Ecol. Evol. 2022, 37, 480–487. [Google Scholar] [CrossRef] [PubMed]
- Zou, Y.; Chen, W.; Li, S.; Wang, T.; Yu, L.; Xu, M.; Singh, R.P.; Liu, C.-Q. Spatio-Temporal Changes in Vegetation in the Last Two Decades (2001–2020) in the Beijing–Tianjin–Hebei Region. Remote Sens. 2022, 14, 3958. [Google Scholar] [CrossRef]
- Ma, Z.; Wu, J.; Yang, H.; Hong, Z.; Yang, J.; Gao, L. Assessment of vegetation net primary productivity variation and influencing factors in the Beijing-Tianjin-Hebei region. J. Environ. Manag. 2024, 365, 121490. [Google Scholar] [CrossRef]
- Zhao, S.; Wu, X.; Zhou, J.; Pereira, P. Spatiotemporal tradeoffs and synergies in vegetation vitality and poverty transition in rocky desertification area. Sci. Total Environ. 2021, 752, 141770. [Google Scholar] [CrossRef]
- Chen, X.; Huang, X.; Wu, D.; Chen, J.; Zhang, J.; Zhou, A.; Dodson, J.; Zawadzki, A.; Jacobsen, G.; Yu, J.; et al. Late Holocene land use evolution and vegetation response to climate change in the watershed of Xingyun Lake, SW China. CATENA 2022, 211, 105973. [Google Scholar] [CrossRef]
- Xu, D.; You, X.; Xia, C. Assessing the spatial-temporal pattern and evolution of areas sensitive to land desertification in North China. Ecol. Indic. 2019, 97, 150–158. [Google Scholar] [CrossRef]
- Zhang, X.; Yuan, J.; Liu, X.; Zong, C. Vegetation restoration effectiveness with main factors in the Beijing-Tianjin sandstorm source region during 2000–2020, China. PLoS ONE 2025, 20, e0318176. [Google Scholar] [CrossRef]
- Lanorte, A.; Nolè, G.; Cillis, G. Application of Getis-Ord Correlation Index (Gi) for Burned Area Detection Improvement in Mediterranean Ecosystems (Southern Italy and Sardinia) Using Sentinel-2 Data. Remote Sens. 2024, 16, 2943. [Google Scholar] [CrossRef]
- Zhang, Q.; Liu, L.; Yang, X.; Sun, Z.; Ban, Y. Nighttime light development index: A new evaluation method for China’s construction land utilization level. Humanit. Soc. Sci. Commun. 2025, 12, 369. [Google Scholar] [CrossRef]
- Peng, D.; Wu, C.; Zhang, B.; Huete, A.; Zhang, X.; Sun, R.; Lei, L.; Huang, W.; Liu, L.; Liu, X.; et al. The Influences of Drought and Land-Cover Conversion on Inter-Annual Variation of NPP in the Three-North Shelterbelt Program Zone of China Based on MODIS Data. PLoS ONE 2016, 11, e0158173. [Google Scholar] [CrossRef] [PubMed]
- Dong, W.; Ming, Y.; Deng, Y.; Shen, Z. Recent wetting trend over Taklamakan and Gobi Desert dominated by internal variability. Nat. Commun. 2024, 15, 4379. [Google Scholar] [CrossRef]
- Zongfan, B.; Ling, H.; Xuhai, J.; Ming, L.; Liangzhi, L.; Huiqun, L.; Jiaxin, L. Spatiotemporal evolution of desertification based on integrated remote sensing indices in Duolun County, Inner Mongolia. Ecol. Inform. 2022, 70, 101750. [Google Scholar] [CrossRef]
- Sun, X.; Tang, H.; Yang, P.; Hu, G.; Liu, Z.; Wu, J. Spatiotemporal patterns and drivers of ecosystem service supply and demand across the conterminous United States: A multiscale analysis. Sci. Total Environ. 2020, 703, 135005. [Google Scholar] [CrossRef]
- Chang, Y.; Hou, K.; Li, X.; Zhang, Y. Analysis of dynamic changes in the urbanization of Xixian National New Area and its driving forces. Indoor Built Environ. 2019, 28, 1181–1189. [Google Scholar] [CrossRef]
- Xu, W.; Wang, J.; Zhang, M.; Li, S. Construction of landscape ecological network based on landscape ecological risk assessment in a large-scale opencast coal mine area. J. Clean. Prod. 2021, 286, 125523. [Google Scholar] [CrossRef]
- Libessart, G.; Franck-Néel, C.; Branchu, P.; Schwartz, C. The human factor of pedogenesis described by historical trajectories of land use: The case of Paris. Landsc. Urban Plan. 2022, 222, 104393. [Google Scholar] [CrossRef]
- Li, C.; de Jong, R.; Schmid, B.; Wulf, H.; Schaepman, M.E. Changes in grassland cover and in its spatial heterogeneity indicate degradation on the Qinghai-Tibetan Plateau. Ecol. Indic. 2020, 119, 106641. [Google Scholar] [CrossRef]
- Qiu, L.; Wu, Y.; Yu, M.; Shi, Z.; Yin, X.; Song, Y.; Sun, K. Contributions of vegetation restoration and climate change to spatiotemporal variation in the energy budget in the loess plateau of china. Ecol. Indic. 2021, 127, 107780. [Google Scholar] [CrossRef]
- Cao, Y.; Kong, L.; Ouyang, Z. Characteristics and Driving Mechanism of Regional Ecosystem Assets Change in the Process of Rapid Urbanization—A Case Study of the Beijing–Tianjin–Hebei Urban Agglomeration. Remote Sens. 2022, 14, 5747. [Google Scholar] [CrossRef]
- Li, X.; Yang, L. Accelerated Restoration of Vegetation in Wuwei in the Arid Region of Northwestern China since 2000 Driven by the Interaction between Climate and Human Beings. Remote Sens. 2023, 15, 2675. [Google Scholar] [CrossRef]
- Sun, K.; He, W.; Shen, Y.; Yan, T.; Liu, C.; Yang, Z.; Han, J.; Xie, W. Ecological security evaluation and early warning in the water source area of the Middle Route of South-to-North Water Diversion Project. Sci. Total Environ. 2023, 868, 161561. [Google Scholar] [CrossRef]


| Data Type | Database Source | Resolution | Website | Pretreatment |
|---|---|---|---|---|
| NDVI | MOD13Q1 (Collection 6), annual average for growth season (May–September, 2018–2022) | 250 m | https://search.earthdata.nasa.gov (accessed on 3 February 2025) | QA layer screening to remove clouds and low-quality pixels; resampled to 30 m resolution using bilinear interpolation method. |
| Soil texture | HWSD v2.0 Global Sand content grid (Sand%, 2018) | 1000 m | https://www.fao.org/soils-portal (accessed on 3 February 2025) | Resampled to 30 m resolution using bilinear interpolation. |
| Terrain data | ALOS World 3D DEM v3.2 (2018) | 30 m | https://www.eorc.jaxa.jp (accessed on 3 February 2025) | Void filling performed through inverse distance weighted (IDW) interpolation method, utilizing values from surrounding pixels to estimate missing elevations. |
| Human activity intensity | NPP-VIIRS Annual Stable Nighttime Light data (2018–2022) | 500 m | https://eogdata.mines.edu (accessed on 3 February 2025) | Consistency and continuity corrections applied to reduce inter-annual variability; resampled to 30 m resolution using bilinear interpolation. |
| 2018 | 2019 | 2020 | 2021 | 2022 | ||||||
|---|---|---|---|---|---|---|---|---|---|---|
| Category | Area/km2 | Proportion/% | Area/km2 | Proportion/% | Area/km2 | Proportion/% | Area/km2 | Proportion/% | Area/km2 | Proportion/% |
| 1 | 700.18 | 15.03 | 636.70 | 13.67 | 618.56 | 13.28 | 634.97 | 13.63 | 870.79 | 18.70 |
| 2 | 2104.46 | 45.19 | 1987.74 | 42.68 | 1936.96 | 41.58 | 1957.95 | 42.03 | 2269.68 | 48.73 |
| 3 | 1321.191 | 28.37 | 1309.33 | 28.11 | 1331.21 | 28.58 | 1301.69 | 27.95 | 1174.14 | 25.21 |
| 4 | 417.76 | 8.97 | 530.23 | 11.38 | 560.71 | 12.04 | 557.15 | 11.96 | 282.41 | 6.06 |
| 5 | 113.71 | 2.44 | 193.60 | 4.16 | 210.43 | 4.52 | 206.19 | 4.43 | 60.68 | 1.30 |
| Year | Light vs. Sensitivity (R) | NDVI vs. Sensitivity (R) |
|---|---|---|
| 2018–2019 | 0.68 | −0.62 |
| 2019–2020 | 0.81 | −0.37 |
| 2020–2021 | 0.61 | −0.5 |
| 2021–2022 | 0.56 | −0.57 |
| 2018–2022 | 0.63 | −0.54 |
| Quick Statistical Verification | Area/km2 | Average |
|---|---|---|
| Hot spot area (Gi_Bin = 3) | 158.427 | -- |
| Average rate of light change within the hotspot area | 158.427 | 2.014 |
| Average NDVI trend within the hotspot area | 158.427 | −0.012 |
Disclaimer/Publisher’s Note: The statements, opinions and data contained in all publications are solely those of the individual author(s) and contributor(s) and not of MDPI and/or the editor(s). MDPI and/or the editor(s) disclaim responsibility for any injury to people or property resulting from any ideas, methods, instructions or products referred to in the content. |
© 2025 by the authors. Licensee MDPI, Basel, Switzerland. This article is an open access article distributed under the terms and conditions of the Creative Commons Attribution (CC BY) license (https://creativecommons.org/licenses/by/4.0/).
Share and Cite
Xu, D.; Wu, H.; Yao, Q.; Song, F.; Su, F. Spatiotemporal Evolution and Driving Factors of Desertification Sensitivity During Urbanization: A Case Study of the Beijing–Tianjin–Hebei Core Region. Land 2025, 14, 858. https://doi.org/10.3390/land14040858
Xu D, Wu H, Yao Q, Song F, Su F. Spatiotemporal Evolution and Driving Factors of Desertification Sensitivity During Urbanization: A Case Study of the Beijing–Tianjin–Hebei Core Region. Land. 2025; 14(4):858. https://doi.org/10.3390/land14040858
Chicago/Turabian StyleXu, Deshen, Haoyu Wu, Qiusheng Yao, Fei Song, and Fangli Su. 2025. "Spatiotemporal Evolution and Driving Factors of Desertification Sensitivity During Urbanization: A Case Study of the Beijing–Tianjin–Hebei Core Region" Land 14, no. 4: 858. https://doi.org/10.3390/land14040858
APA StyleXu, D., Wu, H., Yao, Q., Song, F., & Su, F. (2025). Spatiotemporal Evolution and Driving Factors of Desertification Sensitivity During Urbanization: A Case Study of the Beijing–Tianjin–Hebei Core Region. Land, 14(4), 858. https://doi.org/10.3390/land14040858