
Three-Dimensional Ecological Footprint Assessment of Cropland in Typical Grain-Producing Regions Based on Carbon Footprint Improvement

 , ,
, ,
Abstract
1. Introduction
2. Materials and Methods
2.1. Study Area
2.2. Data Sources
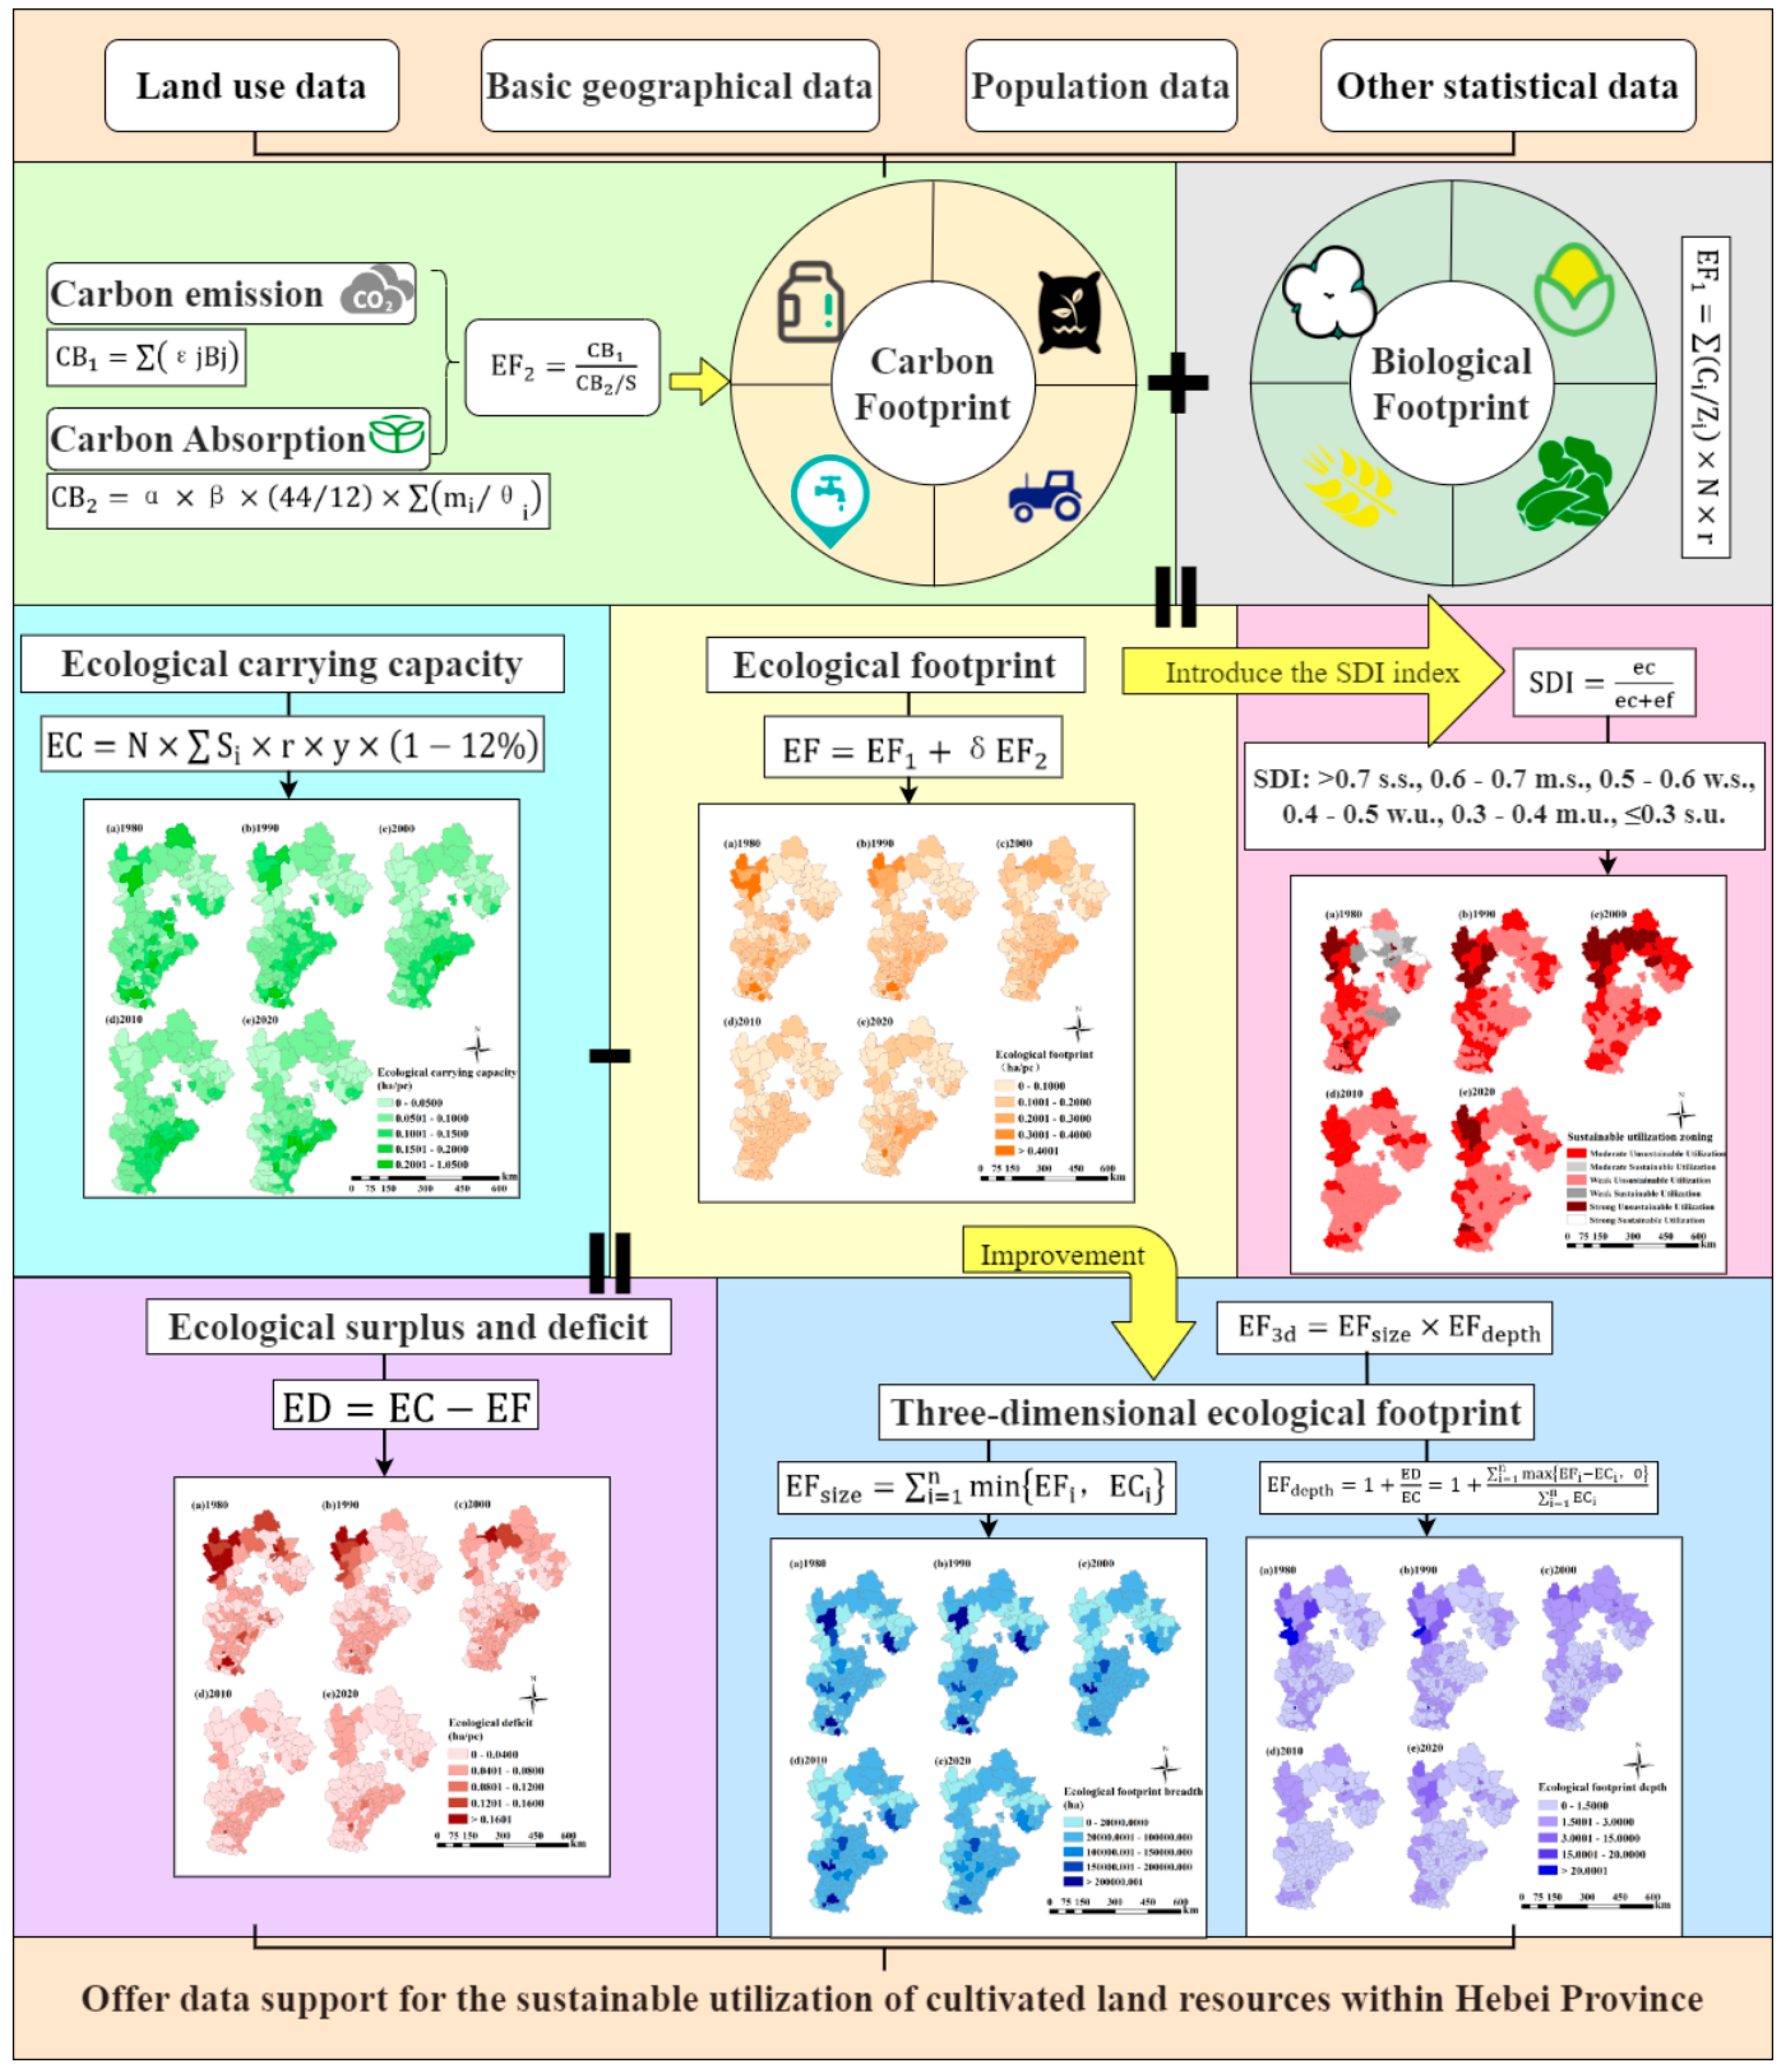
2.3. Methods
2.3.1. Cropland Carbon Footprint Calculation
2.3.2. Ecological Footprint (EF)
2.3.3. Ecological Profit and Loss of Cropland (ED)
2.3.4. Three-Dimensional Ecological Footprint (EF3d)
- (1)
- Ecological footprint breadth ()
- (2)
- Ecological footprint depth ()
- (3)
- Three-dimensional ecological footprint ()
2.3.5. Zoning for Sustainable Utilization of Cropland
3. Results
3.1. Evolution of Spatiotemporal Patterns of Carbon Emissions and Absorption
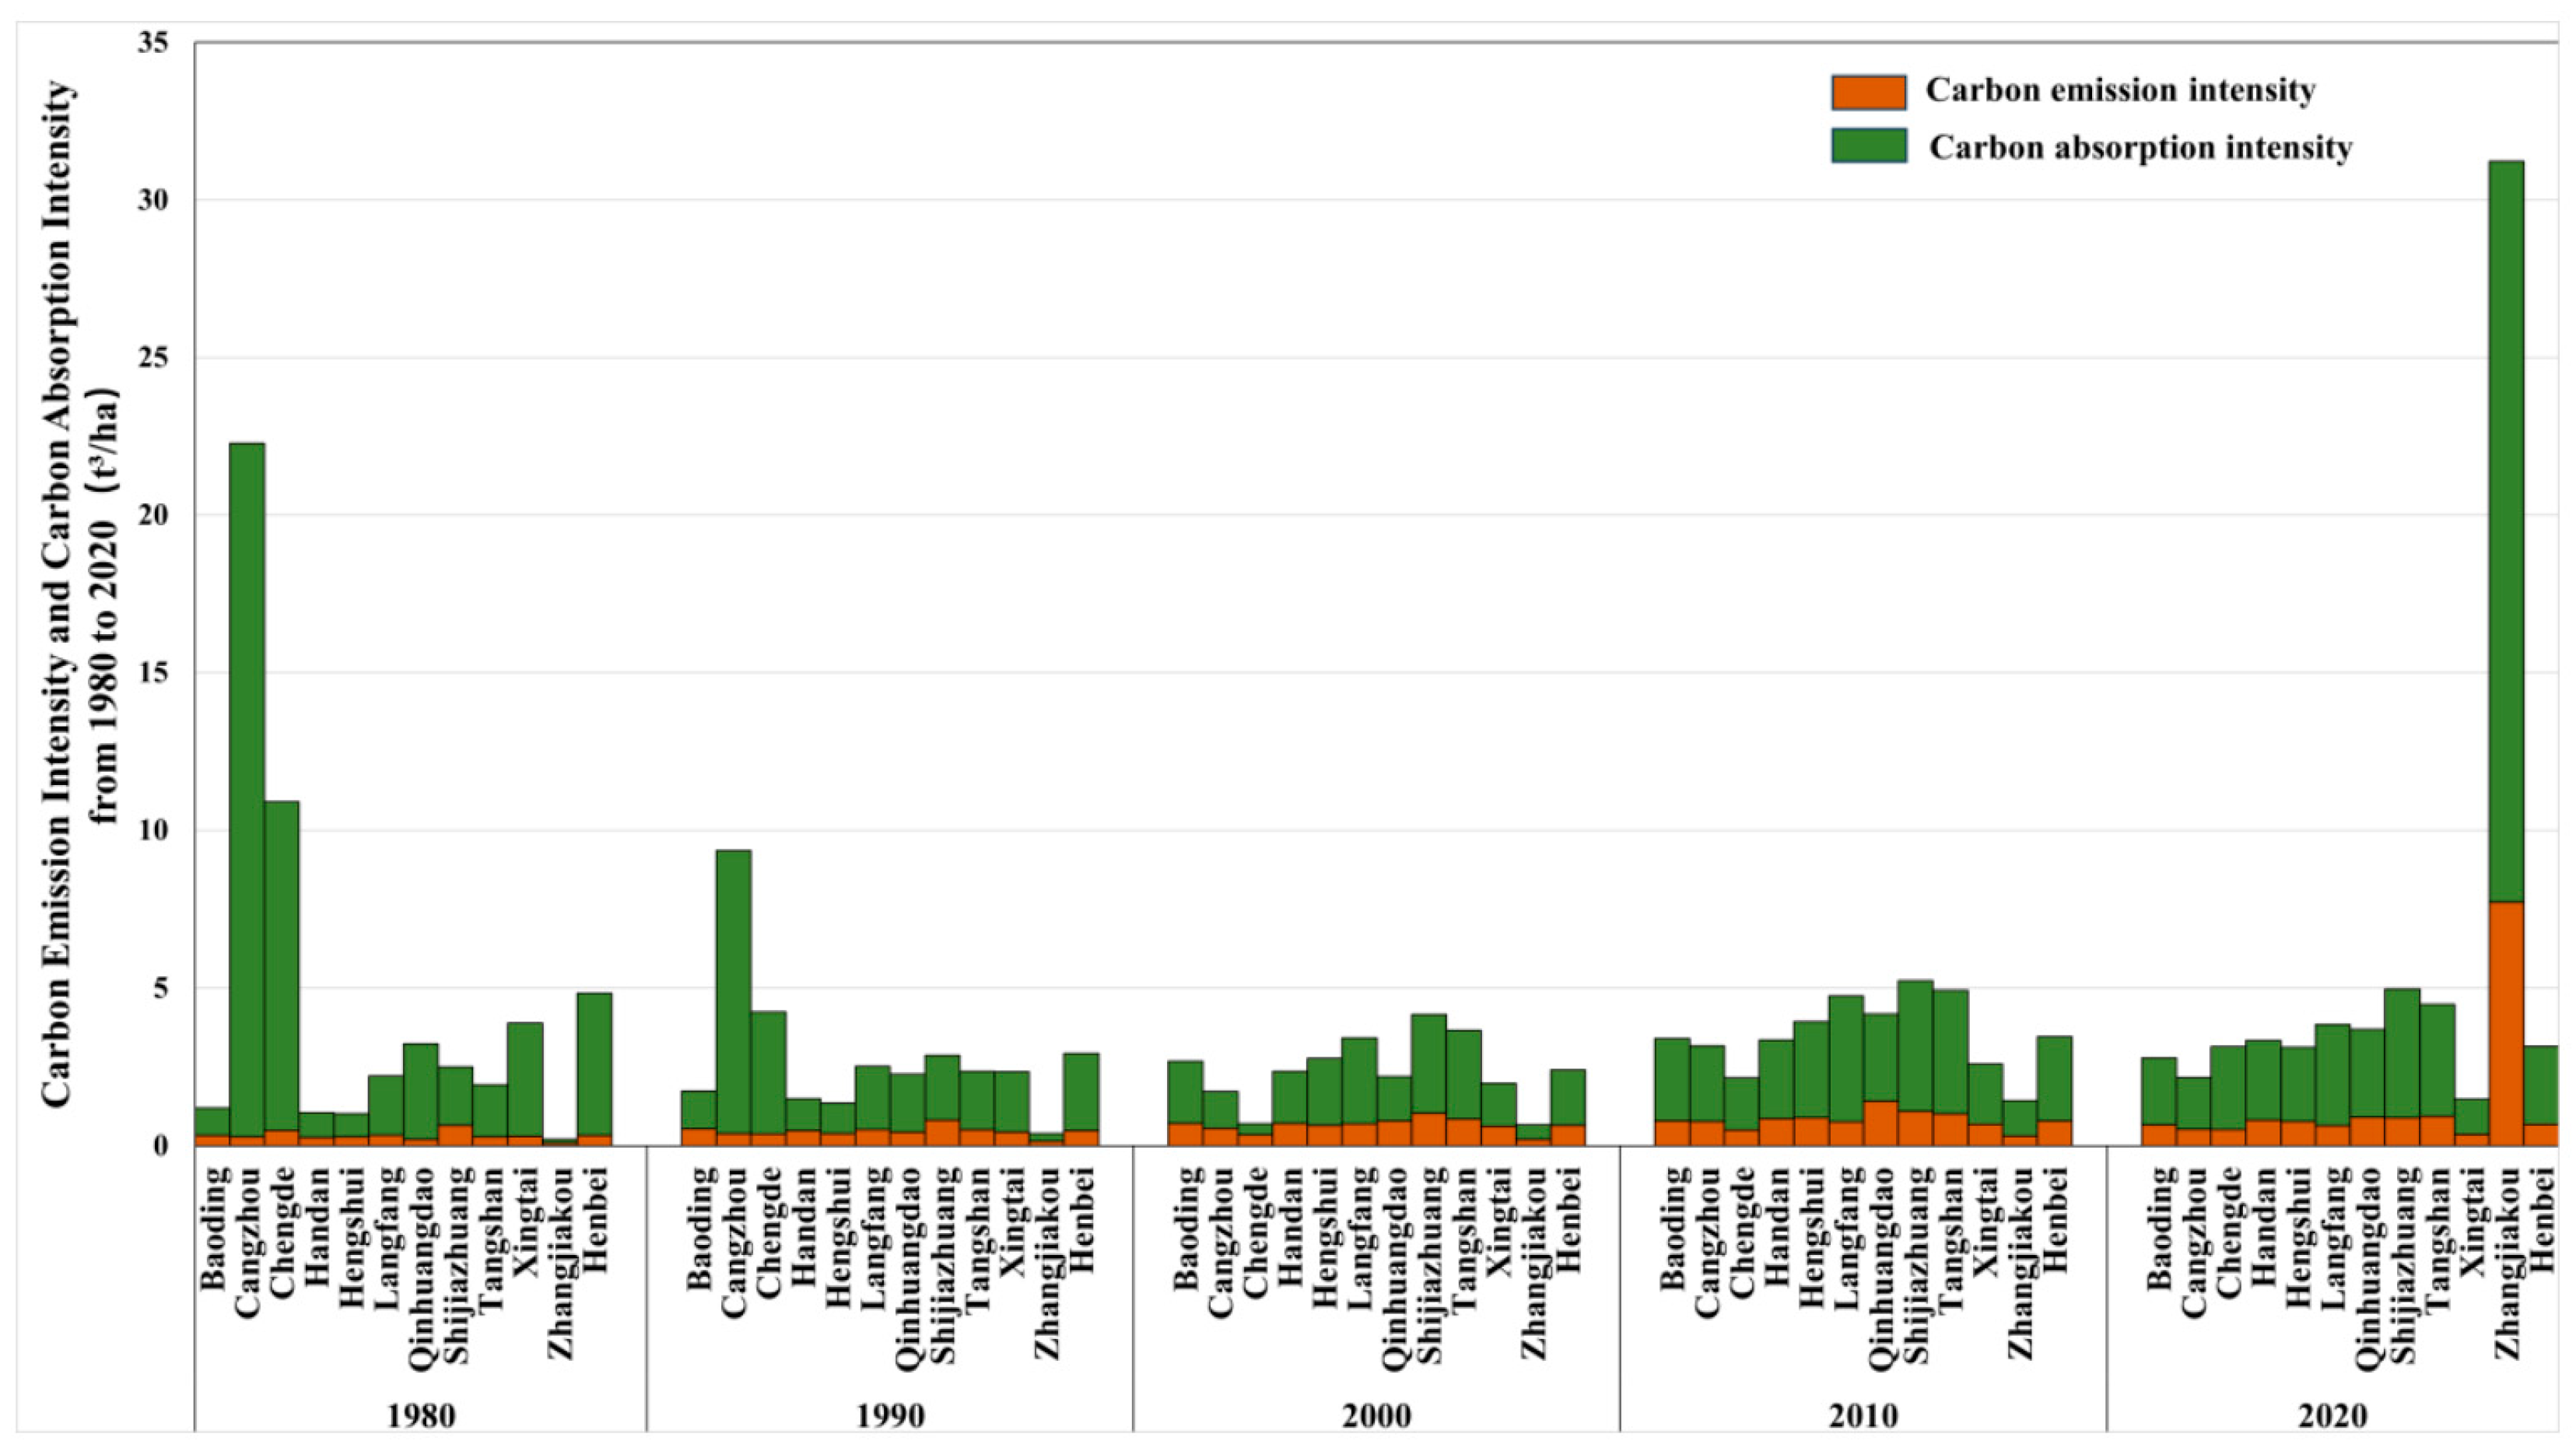
3.1.1. Time Series Analysis
- (1)
- Cropland carbon emissions
- (2)
- Carbon absorption in cropland
- (3)
- Analysis of carbon emission and absorption intensity
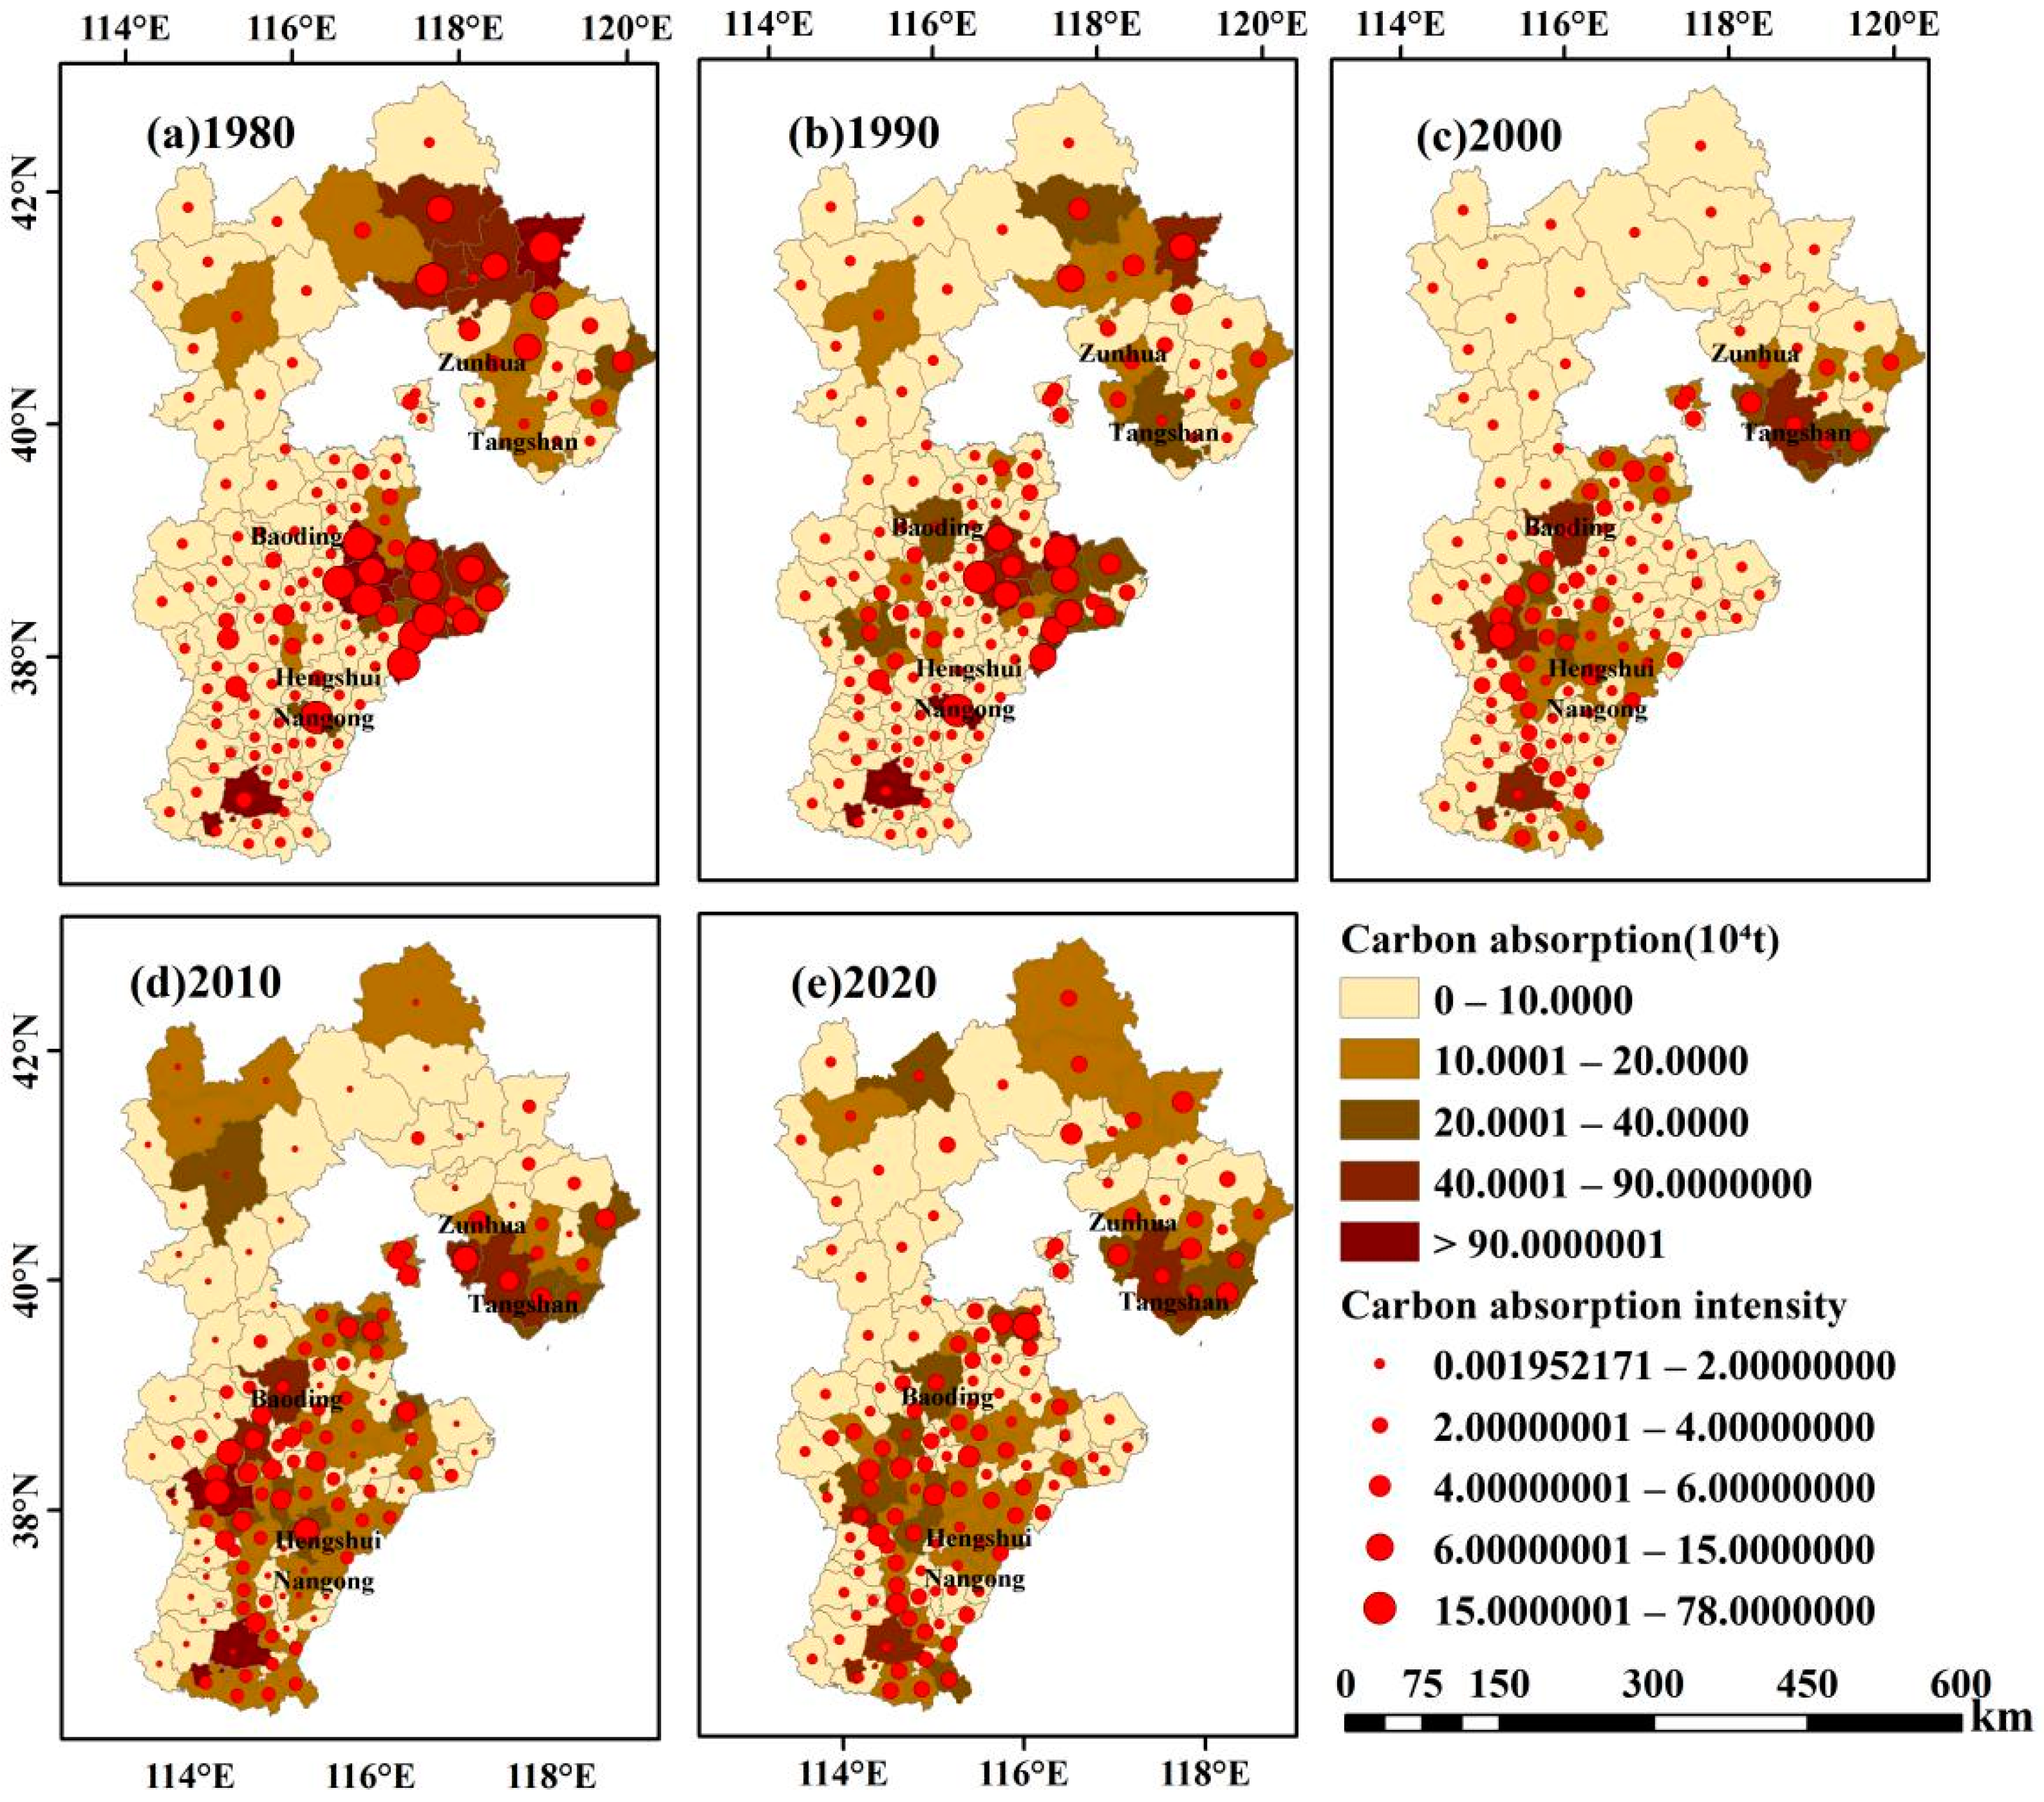
3.1.2. Spatial Variability Analysis
- (1)
- Carbon Emissions
- (2)
- Carbon absorption
3.2. Per Capita Ecological Footprint (EF) and Ecological Balance (Surplus/Deficit)
3.2.1. Changes in Hebei Province and Different Prefecture-Level Cities
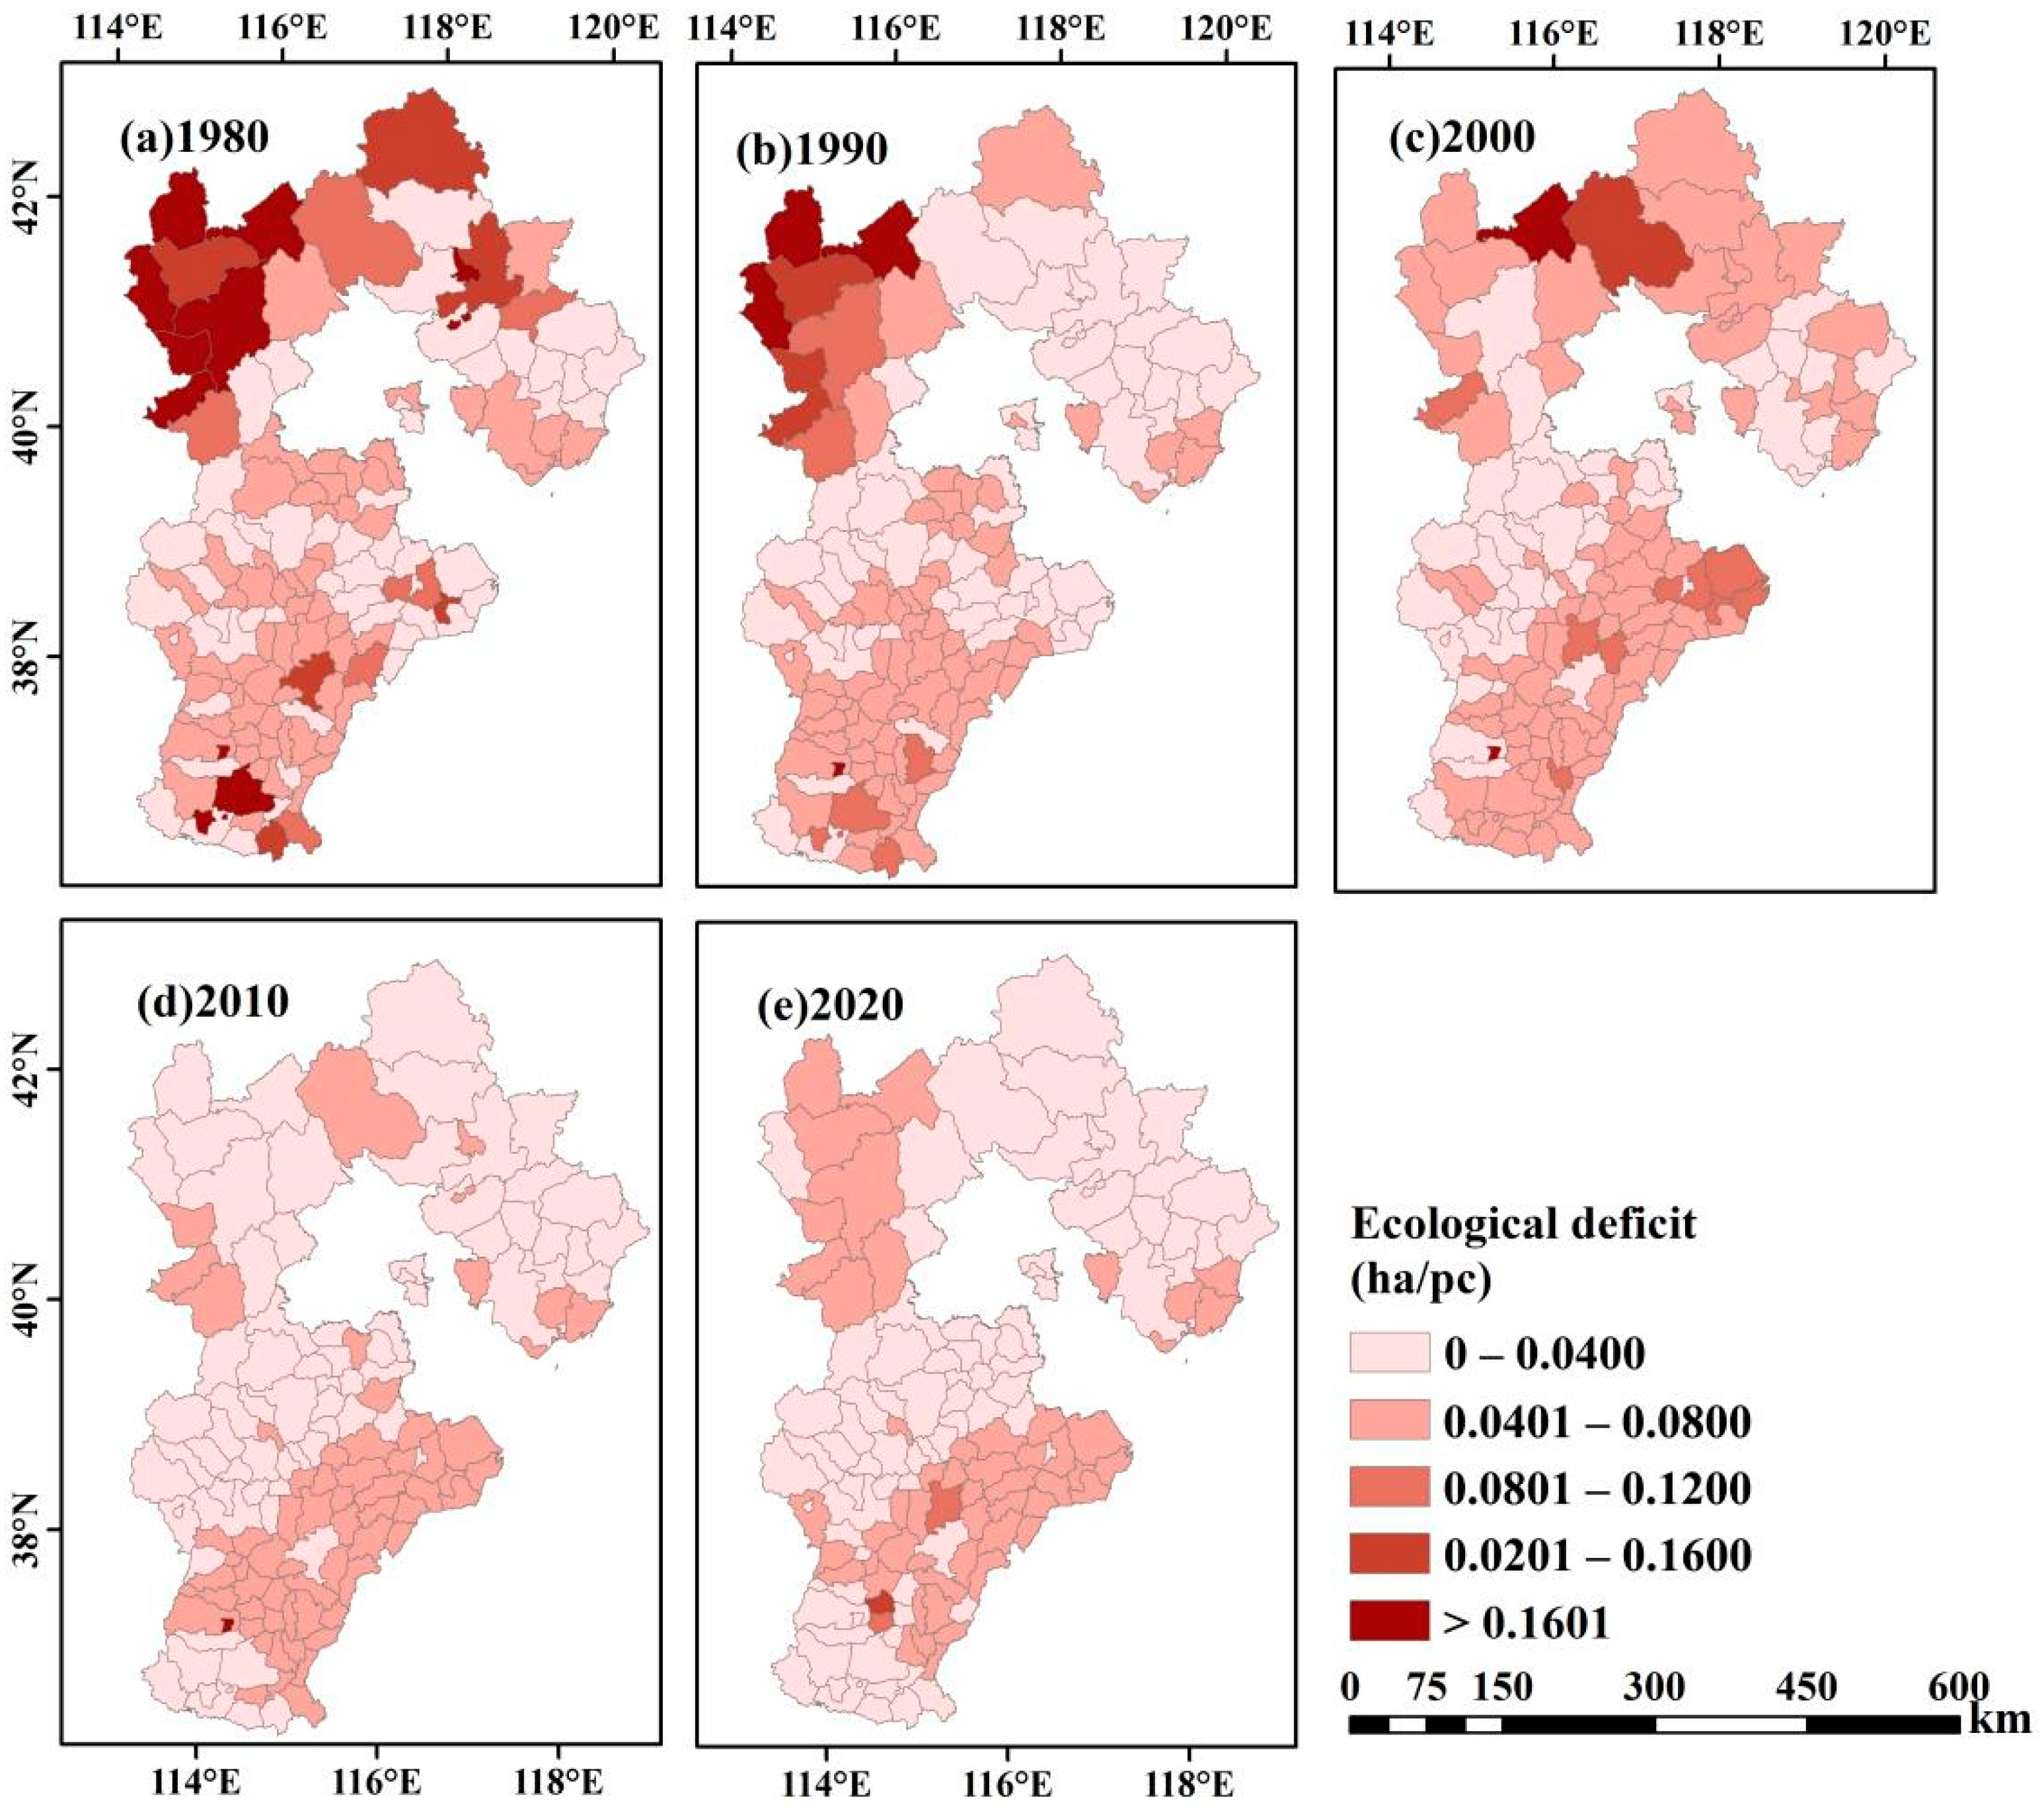
3.2.2. Changes in the County-Level Spatial Pattern
- (1)
- The per capita EF and ecological deficit
- (2)
- Spatial characteristics of the per capita cropland ecological deficit
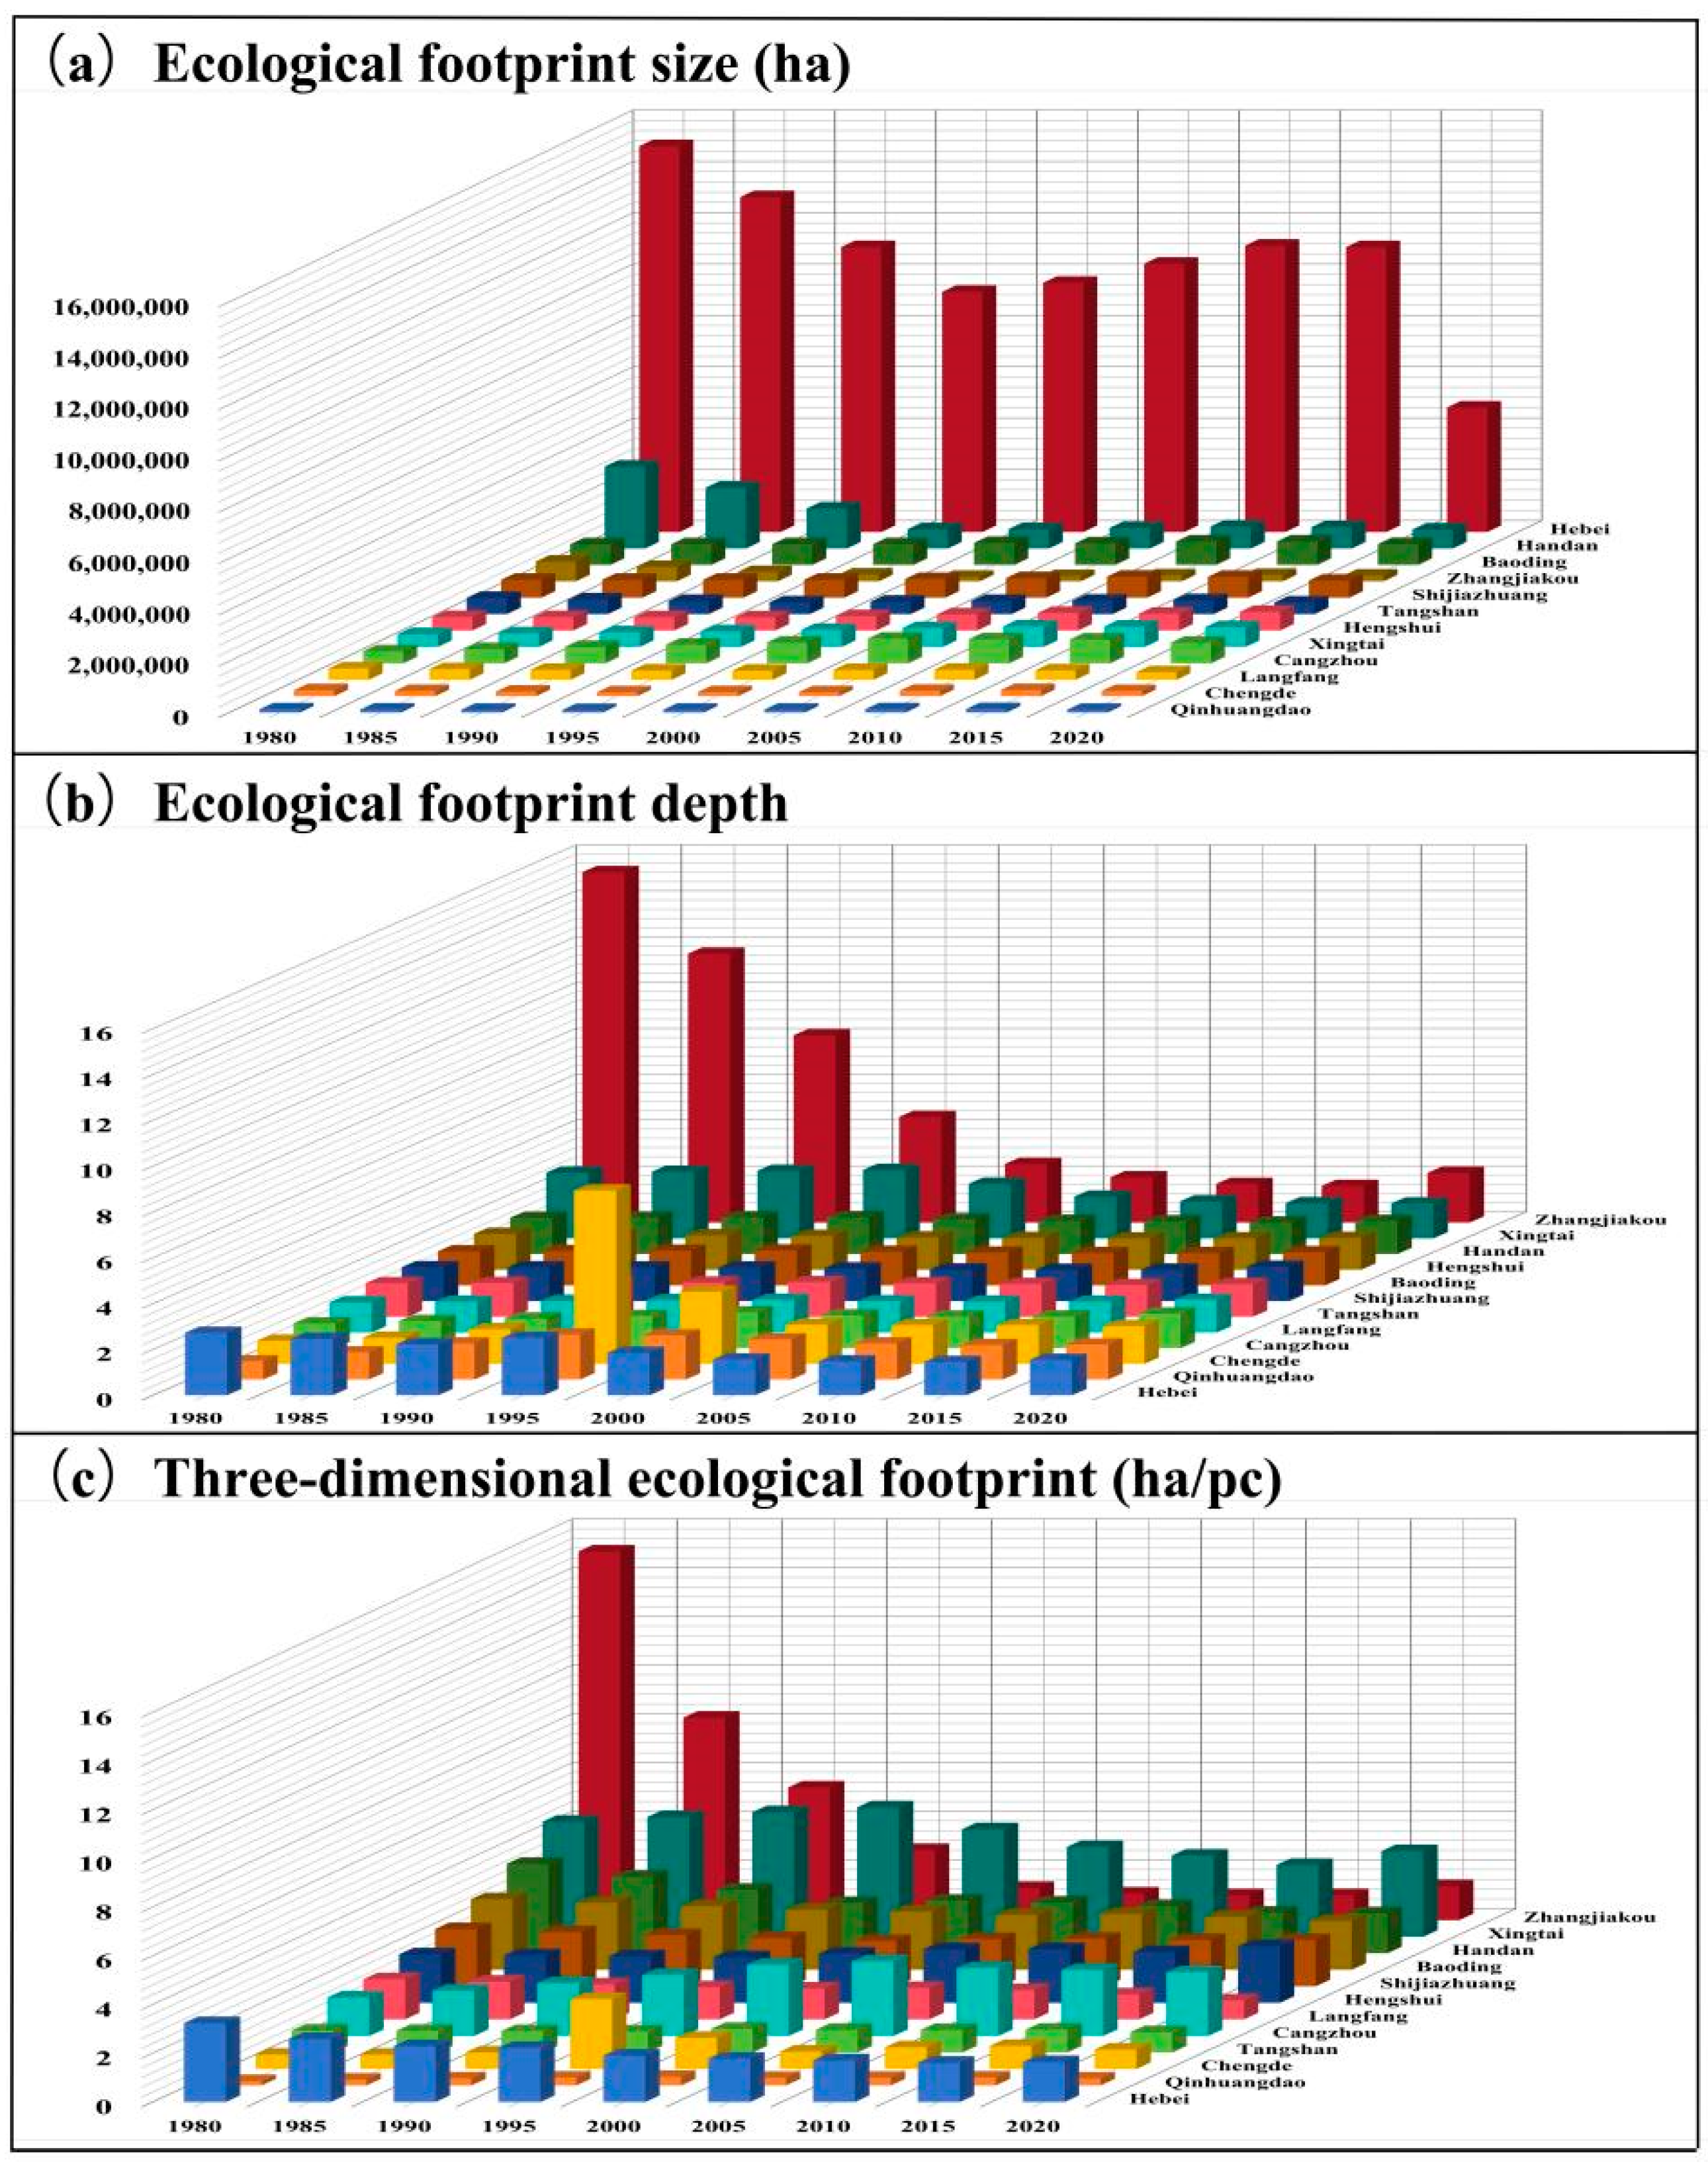
3.3. EF3d of Cropland
3.3.1. Temporal Pattern of Variation
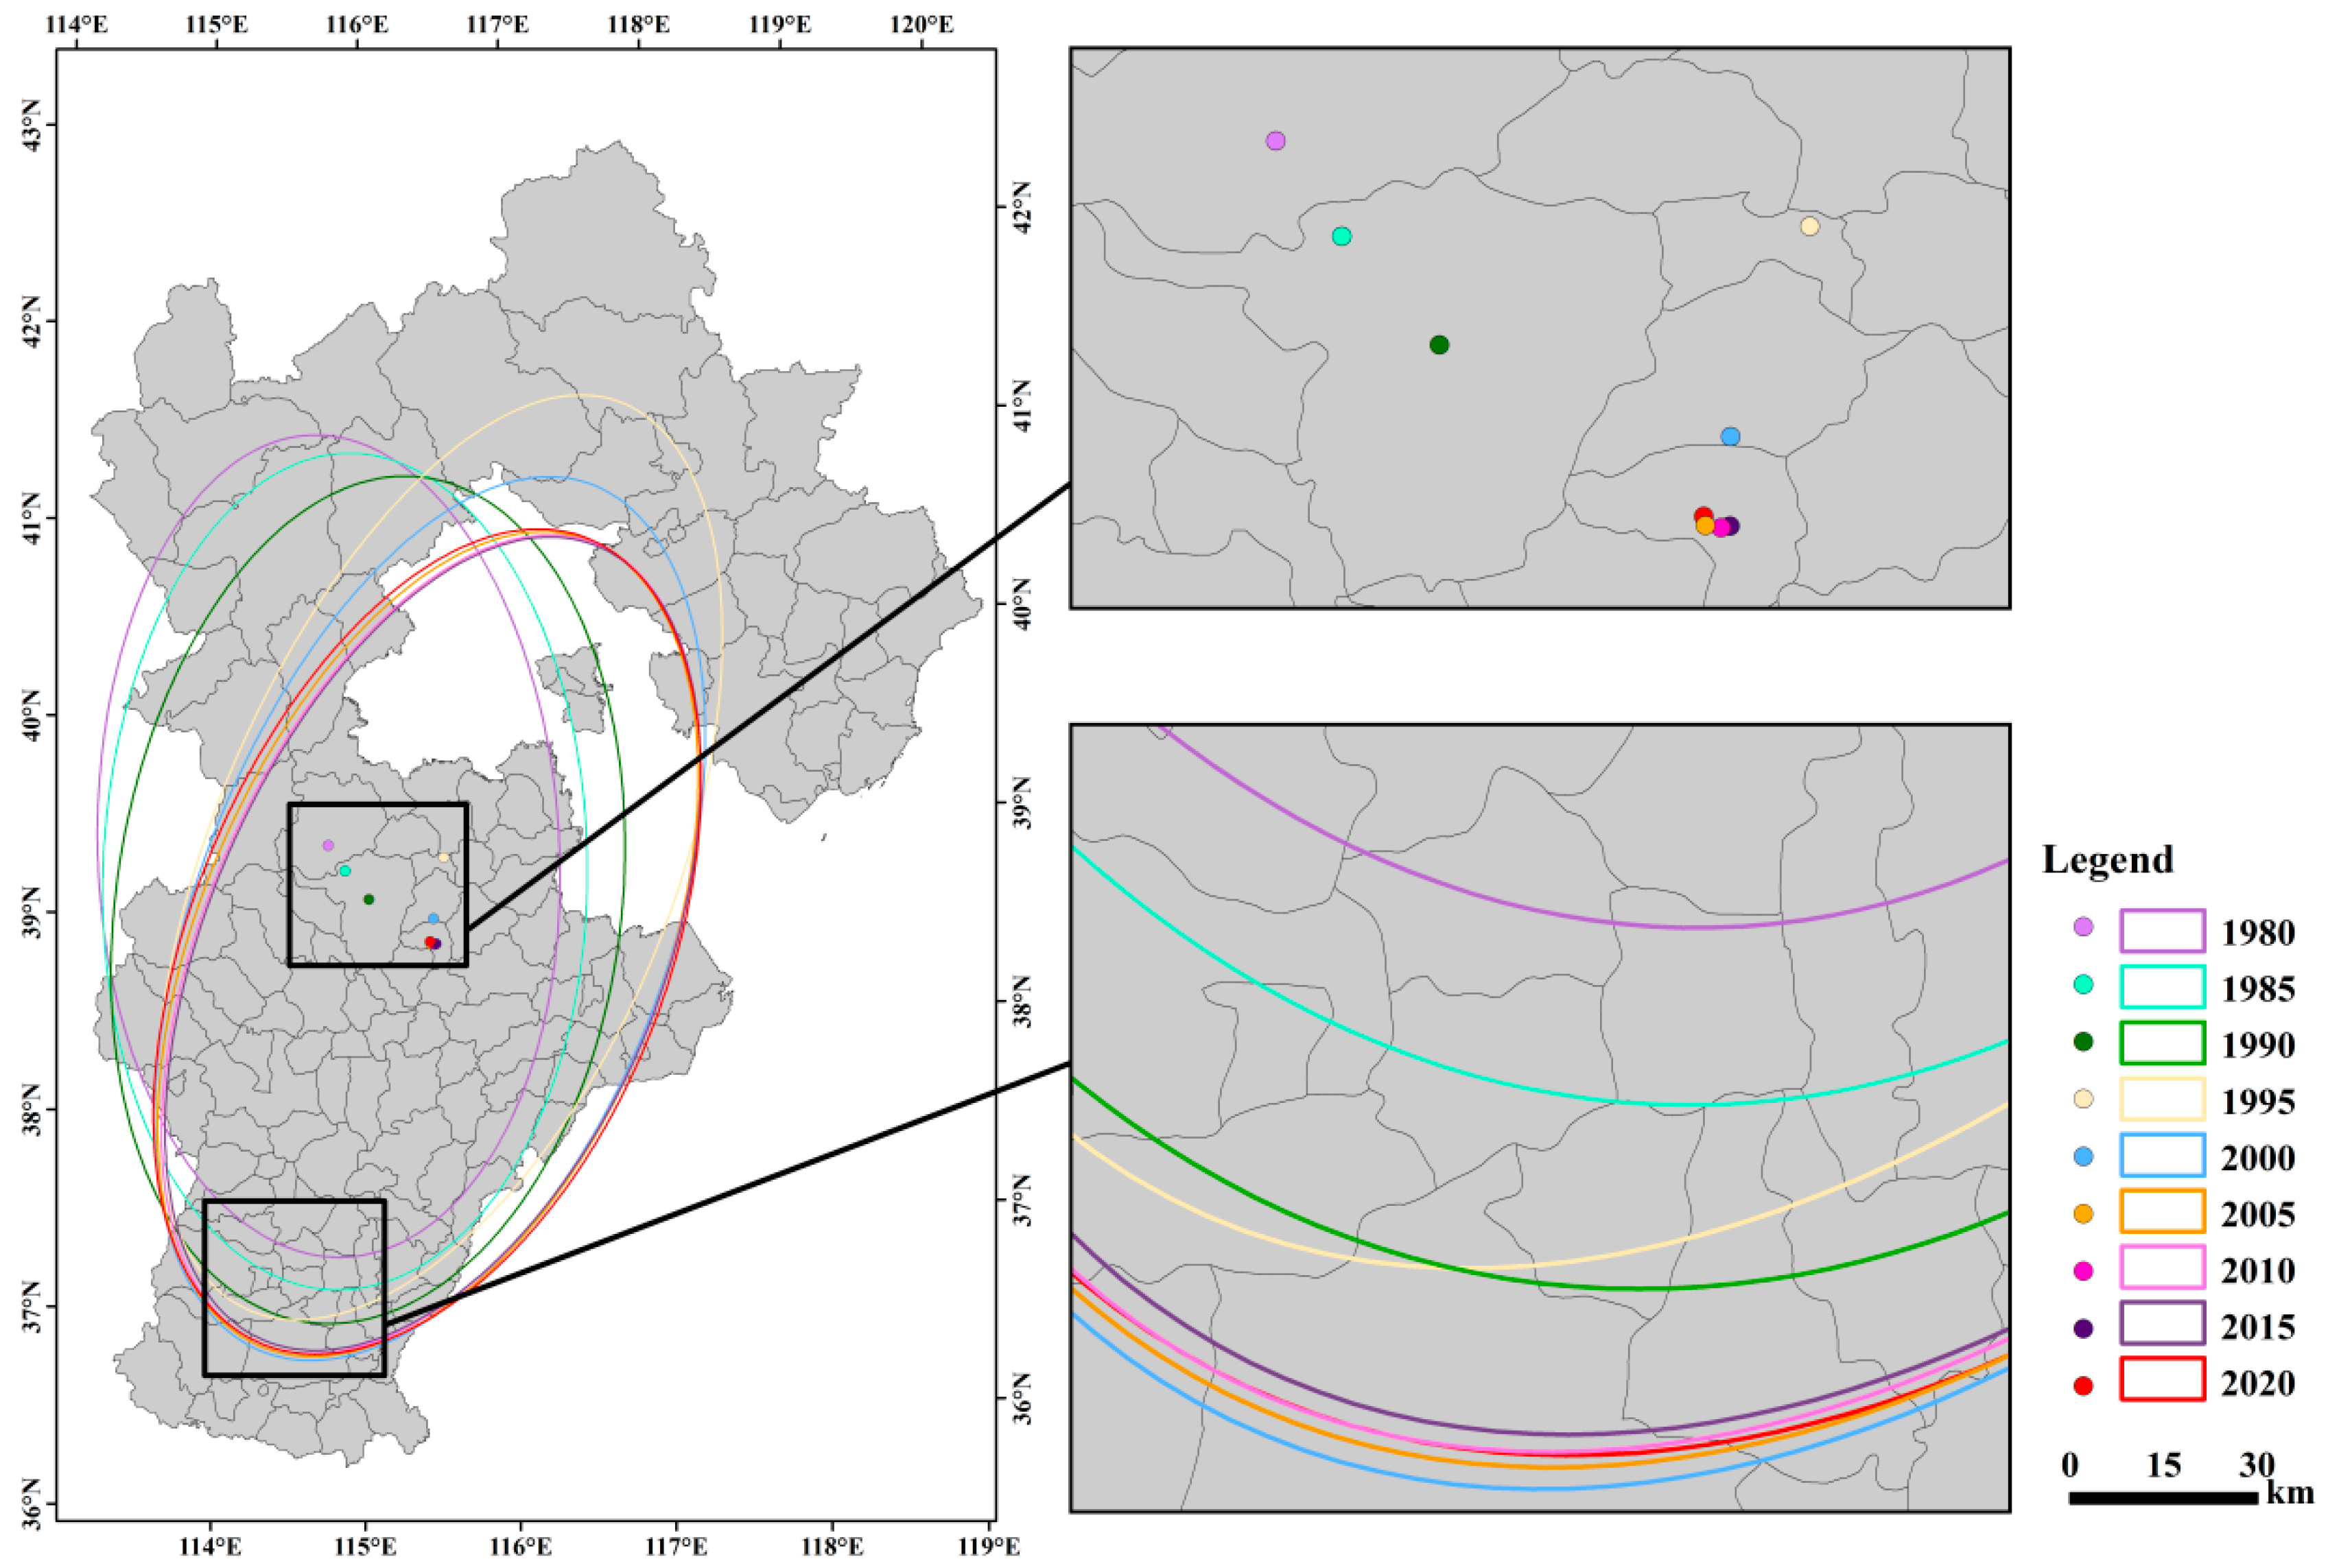
3.3.2. Spatial Pattern of Variation
- (1)
- Spatial distribution characteristics of different counties
- (2)
- The per capita cropland EFDepth spatial transfer process
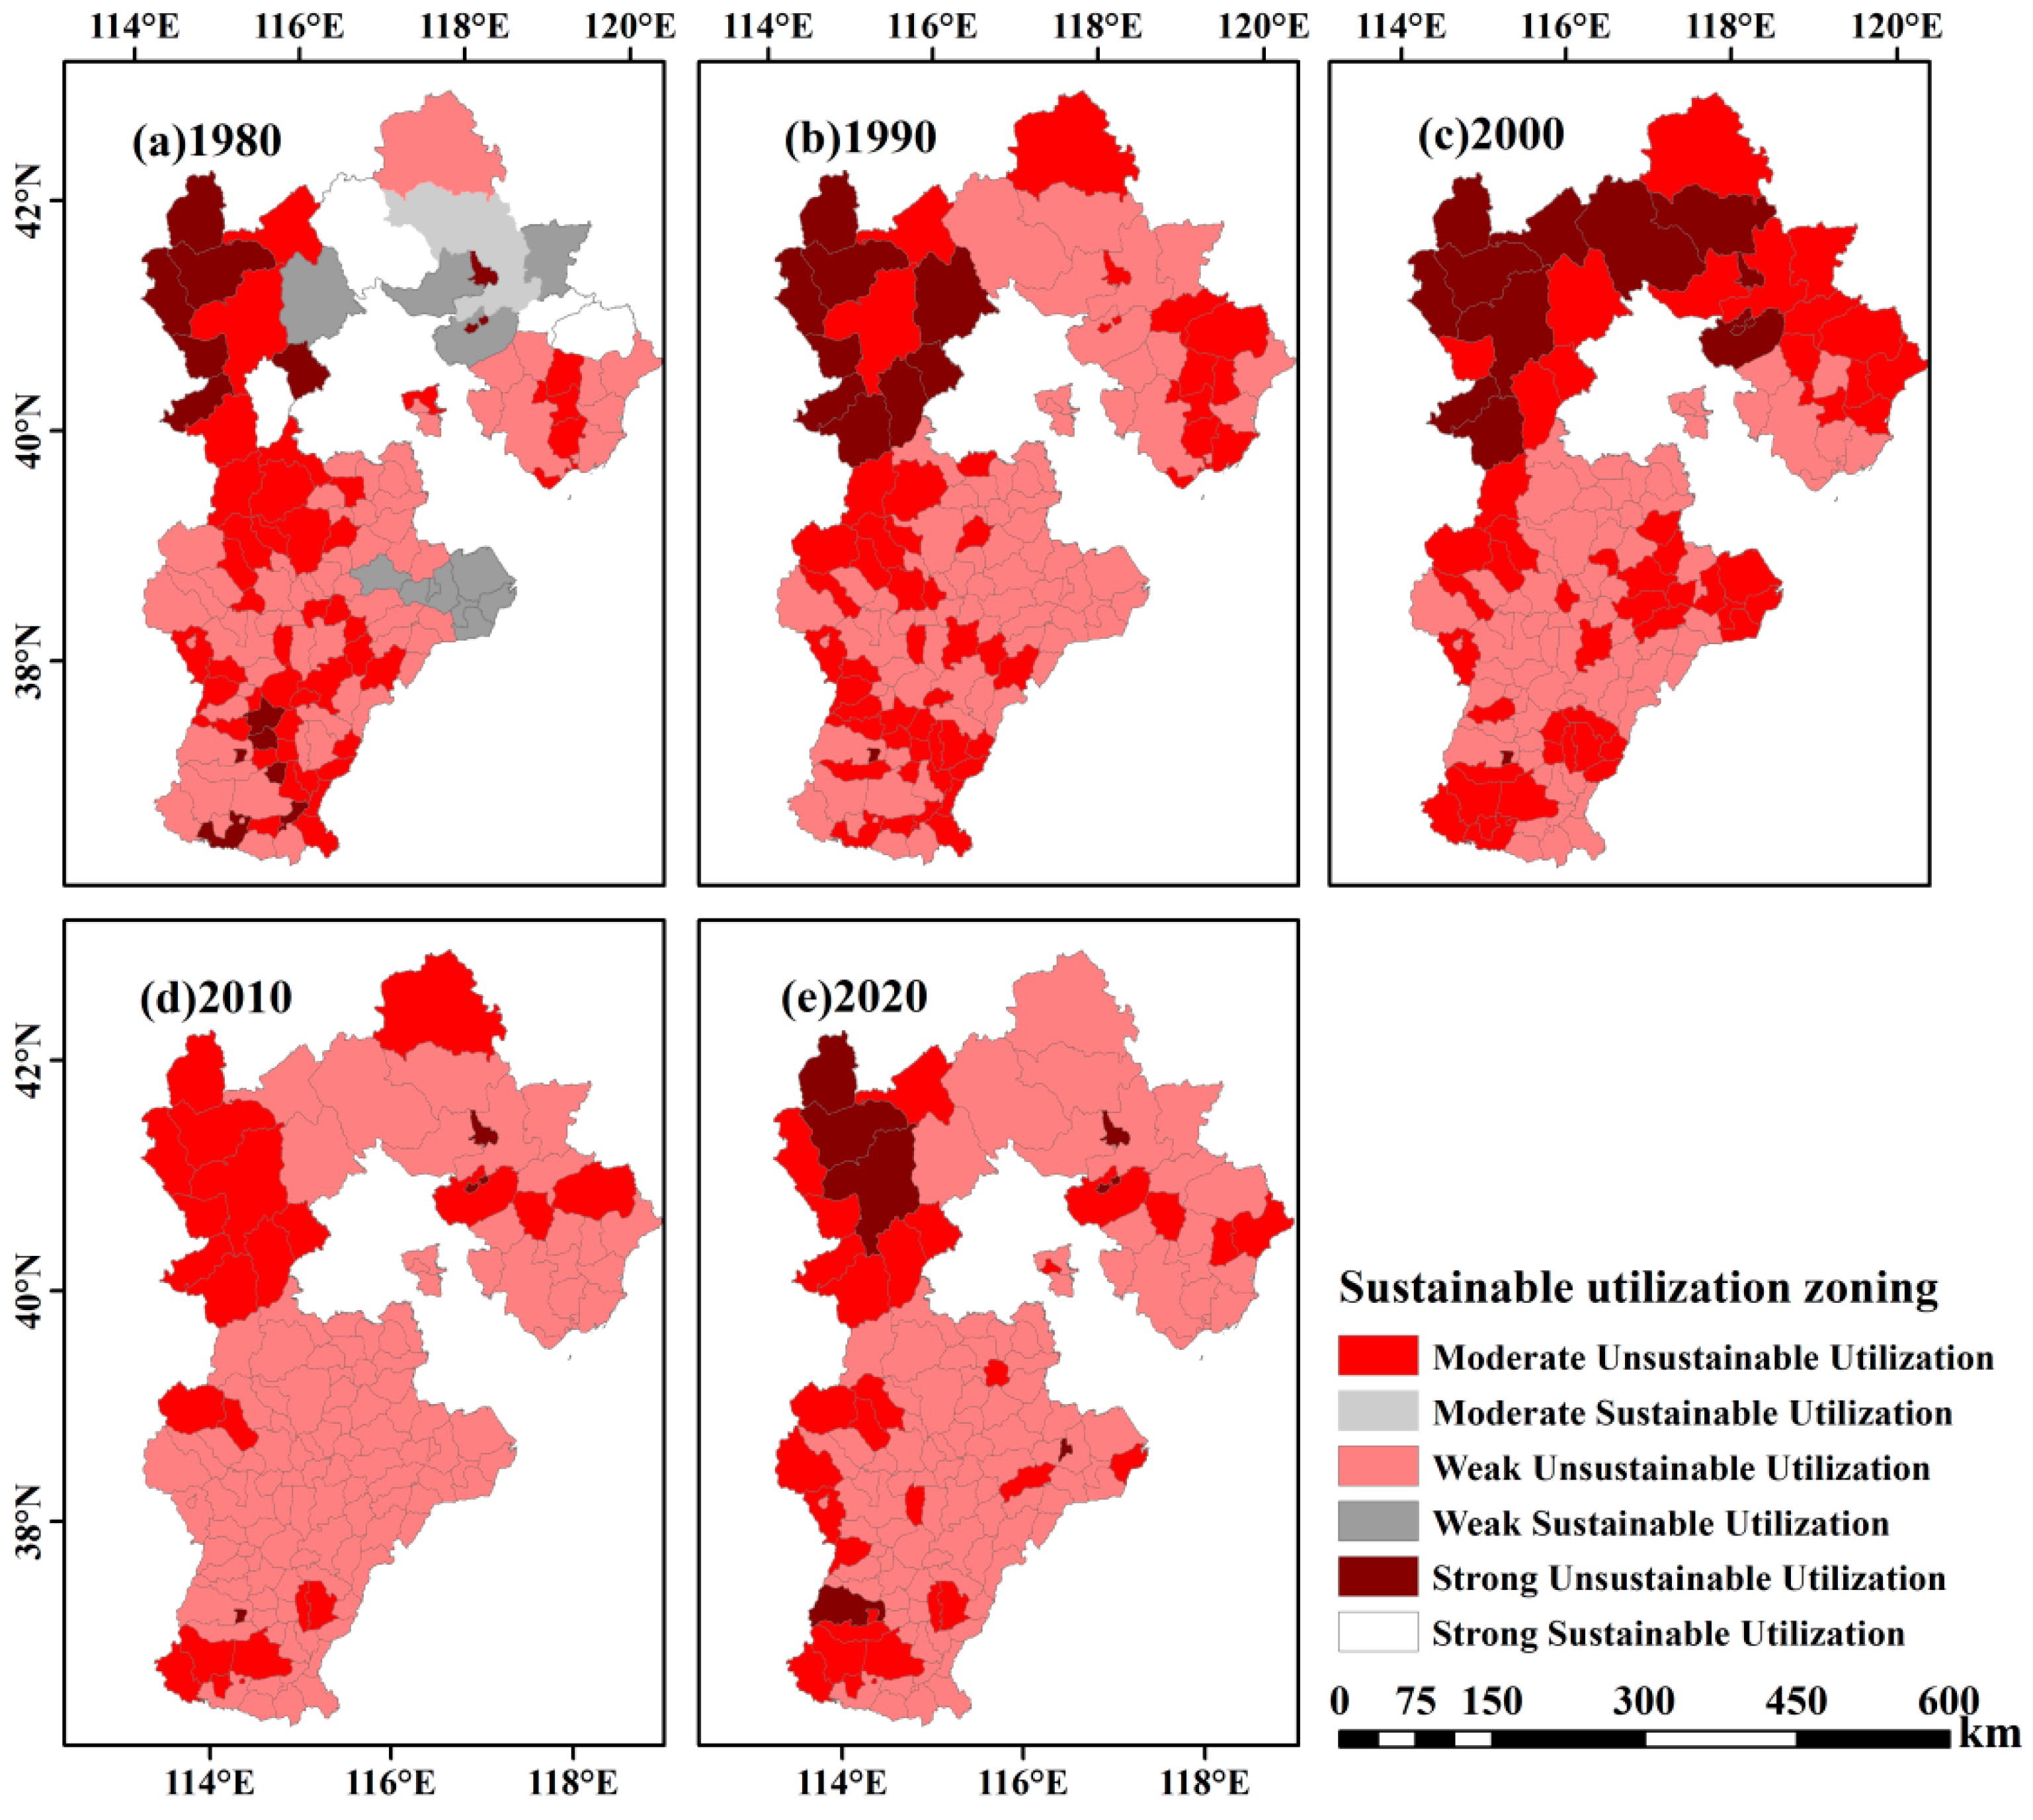
3.4. Zoning for Sustainable Utilization of Cropland
4. Discussion
4.1. Comparison with Related Research Findings
4.2. Improving the EF3d with Carbon Footprint Enables More Accurate Evaluation of Cropland Use’s Effects on Ecosystem Security
4.3. Policy Implications from Challenges in Cropland Ecological Security and Sustainable Use in Hebei Province
4.4. Limitations
5. Conclusions
Author Contributions
Funding
Data Availability Statement
Conflicts of Interest
References
- Liu, M.; Zhang, A.; Wen, G. Regional differences and spatial convergence in the ecological efficiency of cultivated land use in the main grain producing areas in the Yangtze Region. J. Nat. Resour. 2022, 37, 477–493. [Google Scholar] [CrossRef]
- Kang, L.; Wu, K. Impact of spatial evolution of cropland pattern on cropland suitability in black soil region of northeast China, 1990–2020. Agronomy 2025, 15, 172. [Google Scholar] [CrossRef]
- Ke, X.; Chen, J.; Zuo, C.; Wang, X. The cropland intensive utilisation transition in China: An induced factor substitution perspective. Land Use Policy 2024, 141, 107128. [Google Scholar] [CrossRef]
- Sheng, Y.; Liu, W.; Xu, H. Study on Spatial Differentiation Characteristics and Driving Mechanism of Sustainable Utilization of Cultivated Land in Tarim River Basin. Land 2024, 13, 2122. [Google Scholar] [CrossRef]
- Xiong, Y.; Ai, G.; Zhou, C.; Yao, Y.; Xie, Q. Temporal and spatial evolution of ecological sustainability in Dongting Lake area based on the improved three-dimensional ecological footprint model. Acta Ecol. Sin. 2022, 42, 1165–1179. [Google Scholar]
- Wackernagel, M.; Onisto, L.; Bello, P.; Linares, A.C.; Falfán, I.S.L.; García, J.M.; Guerrero, A.I.S.; Guerrero, M.G.S. National natural capital accounting with the ecological footprint concept. Ecol. Econ. 1999, 29, 375–390. [Google Scholar] [CrossRef]
- Xu, Q.; Yan, F.; Ding, Z.; Tang, X.; Yao, L. Dynamic assessment of ecological security in the Yangtze River Economic Belt based on three-dimensional ecological footprint. Prog. Geogr. 2024, 43, 1184–1202. [Google Scholar]
- Chen, X.; Meng, X.; Fang, K. Assessing Land Footprint of Urban Agglomeration and Underlying Socioeconomic Drivers. Land 2025, 14, 580. [Google Scholar] [CrossRef]
- Jiao, Y.; Li, M. A study on sustainable development of island economy based on ecological footprint approach—A case study of Changhai county, Liaoning province. IOP Conf. Ser. Earth Environ. Sci. 2022, 966, 012020. [Google Scholar] [CrossRef]
- Xu, Z.; Cheng, G.; Zhang, Z. Measuring sustainable development with the ecological footprint method—Take Zhangye prefecture as an example. Acta Ecol. Sin. 2001, 21, 1484–1493. [Google Scholar]
- Zhao, G.; Ding, R.; Hu, X. Evaluation of ecological security in Qinghai province based on net primary productivity—Ecological footprint approach. Int. Theory Pract. Hum. Soc. Sci. 2025, 2, 40–55. [Google Scholar]
- Jing, P.; Sheng, J.; Wang, Y.; Hu, T.; Guo, L.; Zhu, R.; Dong, K.; Mahmoud, A.; Liu, Y.; Li, X. Assessing the ecological security of the Three Gorges reservoir complex ecosystem based on the improved three-dimensional emergy ecological footprint model. Sci. Total Environ. 2024, 933, 173086. [Google Scholar] [CrossRef]
- Wang, S.; Mao, H.; Wang, Z. Progress in research of ecological footprint all over the world. J. Nat. Resour. 2002, 17, 776–782. [Google Scholar]
- Jin, X.; Liu, Q. Evolution of ecological footprint models for natural resources accounting. J. Nat. Resour. 2017, 32, 163–176. [Google Scholar]
- Rees, W.E. Ecological footprints and appropriated carrying capacity: What urban economics leaves out. Urbanisation 2017, 2, 66–77. [Google Scholar] [CrossRef]
- Xun, F.; Hu, Y. Evaluation of ecological sustainability based on a revised three-dimensional ecological footprint model in Shandong Province, China. Sci. Total Environ. 2019, 649, 582–591. [Google Scholar] [CrossRef]
- Zheng, H.; Huang, Y. Analysis and evaluation of sustainable utilization of cultivated land in China’s black soil region based on open three-dimensional ecological footprint. Resour. Sci. 2024, 46, 1018–1031. [Google Scholar]
- Niccolucci, V.; Bastianoni, S.; Tiezzi, E.B.P.; Wackernagel, M.; Marchettini, N. How deep is the footprint? A 3d representation. Ecol. Model. 2009, 220, 2819–2823. [Google Scholar] [CrossRef]
- Fang, K.; Gao, K.; Li, H. International comparison of natural capital use: A three-dimensional model optimization of ecological footprint. Geogr. Res. 2013, 32, 1657–1667. [Google Scholar]
- Zheng, D.; Liu, X.; Wang, Y.; Lv, L. Spatiotemporal evolution and driving forces of natural capital utilization in China based on three-dimensional ecological footprint. Resour. Sci. 2018, 37, 1328–1339. [Google Scholar]
- Chen, G.; Li, Q.; Peng, F.; Karamian, H.; Tang, B. Henan ecological security evaluation using improved 3d ecological footprint model based on emergy and net primary productivity. Sustainability 2019, 11, 1353. [Google Scholar] [CrossRef]
- Shen, W.; Xu, H. Study of ecological carrying capacity index based on three-dimension ecological footprint model—A case study of Hebei Province. Chin. J. Eco-Agric. 2018, 26, 505–515. [Google Scholar]
- Li, S.; Wang, S.; Zhang, Z.; Chen, X. Evolution and driving factors of sustainable utilization of natural capital in in Jiangxi province form the perspective of three-dimensional ecological footprint model. Chin. J. Agric. Resour. Reg. Plan. 2022, 43, 110–123. [Google Scholar]
- Jin, X.; Li, X.; Zhang, H.; Zhang, N.; Feng, Z. Dynamic evaluation of natural capital in Zhejiang Province based on the three-dimensional ecological footprint extension model. Chin. J. Ecol. 2019, 38, 2177–2183. [Google Scholar]
- Li, P.; Zhang, R.; Xu, L. Three-dimensional ecological footprint based on ecosystem service value and their drivers: A case study of Urumqi. Ecol. Indic. 2021, 131, 108117. [Google Scholar] [CrossRef]
- Liu, H.; Cheng, Q.; Wei, J.; Huang, X. Dynamics of natural capital in Shenyang based on improved three-dimensional ecological footprint. Chin. J. Appl. Ecol. 2017, 28, 4067–4074. [Google Scholar]
- Li, P.; Xu, L.; Zhang, J.; Jin, M.; Zhang, R. Spatio-temporal changes of three-dimensional ecological footprint in inland river basins in Arid Region: A case study of the Manas River Basin. Acta Ecol. Sin. 2020, 40, 6776–6787. [Google Scholar]
- Li, Z.; Deng, X.; Long, A.; Chen, F.; Zhang, L.; Gao, H. Evaluation of soil, water resources and ecological carrying status of the Tarim River Basin from the perspective of three-dimensional ecological footprint model. Environ. Eng. 2022, 40, 286–294. [Google Scholar]
- Yang, Y.; Lu, H.; Liang, D.; Chen, Y.; Tian, P.; Xia, J.; Wang, H.; Lei, X. Ecological sustainability and its driving factor of urban agglomerations in the Yangtze River Economic Belt based on three-dimensional ecological footprint analysis. J. Clean. Prod. 2022, 330, 129802. [Google Scholar] [CrossRef]
- Shi, K.; Diao, C.; Sun, X.; Zuo, T. Ecological balance between supply and demand in Chongqing City based on cultivated land ecological footprint method. Acta Ecol. Sin. 2013, 33, 1872–1880. [Google Scholar]
- Zhang, C. Dynamic evaluation of agricultural ecological carrying capacity in Henan province based on ecological footprint model. Chin. J. Agric. Resour. Reg. Plan. 2020, 41, 246–251. [Google Scholar]
- Jin, Y.; Liu, Q.; Li, C. Evaluation of cultivated land carrying capacity based on an improved three-dimension ecological footprint model: A case study of Jiangsu province. China Land Sci. 2020, 34, 96–104. [Google Scholar]
- Li, M.; Zhou, Y.; Wang, Y.; Singh, V.P.; Li, Z.; Li, Y. An ecological footprint approach for cropland use sustainability based on multi-objective optimization modelling. J. Environ. Manag. 2020, 273, 111147. [Google Scholar] [CrossRef]
- Zhang, H.; Zhu, D.-L.; Zhang, Y. Natural capital accounting of cultivated land based on three-dimensional ecological footprint model—A case study of the Beijing-Tianjin-Hebei region. Front. Environ. Sci. 2022, 10, 1060527. [Google Scholar] [CrossRef]
- Chen, Y.; Lu, H.; Yan, P.; Yang, Y.; Li, J.; Xia, J. Analysis of water–carbon–ecological footprints and resource–environment pressure in the Triangle of Central China. Ecol. Indic. 2021, 125, 107448. [Google Scholar] [CrossRef]
- East, A.J. What is a carbon footprint? An overview of definitions and methodologies. In Proceedings of the Vegetable Industry Carbon Footprint Scoping Study—Discussion Papers and Workshop, Sydney, Australia, 26 September 2008. [Google Scholar]
- Su, Z.; Yuan, G.; Zhou, W. Evaluation of land carrying capacity in Anhui province based on revised three-dimensional ecological footprint model. Res. Soil Water Conserv. 2020, 27, 256–262. [Google Scholar]
- Qian, F.; Xu, H.; Feng, R.; Wang, D.; Jia, Y.; Gu, H. Estimation and analysis of cultivated land ecological compensation in Liaoning province based on three—Dimensional ecological footprint model. Chin. J. Agric. Resour. Reg. Plann. 2023, 44, 97–109. [Google Scholar]
- Li, M.; Liu, S.; Wu, X.; Sun, Y.; Hou, X.; Zhao, S. Temporal and spatial dynamics in the carbon footprint and its influencing factors of farmland ecosystems in Yunnan Province. Acta Ecol. Sin. 2018, 38, 8822–8834. [Google Scholar]
- Duan, H.; Zhang, Y.; Zhao, J.; Bian, X. Carbon footprint analysis of farmland ecosystem in China. J. Soil Water Conserv. 2011, 25, 203–208. [Google Scholar]
- Li, L.; Pan, P.; Wang, Y.; Wang, X.; Wang, X.; Xiao, D.; Song, S. Research on the cultivated land use system resilience under a safe and just space framework. J. Environ. Manag. 2025, 380, 125006. [Google Scholar] [CrossRef]
- Wang, S. 2024 China Natural Resources Bulletin Released. China Natural Resources News, 14 March 2025; pp. 1–2. [Google Scholar]
- Zhang, X.; Wang, Y.; Wang, X.; Wang, G.; Cui, L.; Tan, X. Research on the current situation of comprehensive grain production capacity and countermeasures in Hebei province in the new era. Manag. Agric. Sci. Technol. 2024, 43, 12–15+29. [Google Scholar]
- Hang, X.; Zhang, J.; Hu, L.; Luo, J.; Ma, L.; Liao, D. Analysis of carbon footprints in farmland ecosystem of Chongqing city 2006–2015. J. Hunan Agric. Univ. (Nat. Sci.) 2018, 44, 524–531. [Google Scholar]
- Liu, M.; Li, W. Calculation of equivalence factor used in ecological footprint for china and its provinces based on net primary production. J. Ecol. Rural Environ. 2010, 26, 401–406. [Google Scholar]
- Fang, J.; Guo, Z.; Piao, S.; Chen, A. Carbon sequestration by terrestrial vegetation in China from 1981 to 2000. Sci. China Ser. D 2007, 37, 804–812. [Google Scholar]
- Cui, N.; Sheng, S.; Fang, Y. Standard quantification and mechanism construction of inter-provincial cultivated land ecological compensation from the perspective of food security. J. China Agric. Univ. 2021, 26, 232–243. [Google Scholar]
- Weidema, B.P.; Thrane, M.; Christensen, P.; Schmidt, J.; Løkke, S. Carbon Footprint. J. Ind. Ecol. 2008, 12, 3–6. [Google Scholar] [CrossRef]
- Hutama, A.B.B.; Muktiwibowo, A.K.; Widiastuti; Saputra, K.E. Carrying capacity of land in Bali based on ecological footprint. IOP Conf. Ser. Earth Environ. Sci. 2021, 903, 012014. [Google Scholar] [CrossRef]
- Zhao, X.; Pan, Y.; Wang, S.; Yao, H.; Cui, W. Dynamic analysis of sustainability of arable land resources use in Yunnan province: A new method of ecological footprint based on national hectare. Resour. Sci. 2011, 33, 542–548. [Google Scholar]
- Guan, N.; Liu, L.; Dong, K.; Xie, M.; Du, Y. Agricultural mechanization, large-scale operation and agricultural carbon emissions. Cogent Food Agric. 2023, 9, 1–23. [Google Scholar] [CrossRef]
- Zhang, X.; Zhang, A. Small-scale spatial patterns of farmland conversion based on autocorrelation analysis in Wuhan city. Resour. Environ. Yangtze Basin 2015, 24, 781–788. [Google Scholar]
- Wang, G.; Li, S.; Ma, Q. Spatial equilibrium and pattern evolution of ecological civilization construction efficiency in China. Acta Geogr. Sin. 2018, 73, 2198–2209. [Google Scholar]
- Chen, Y.; Zhang, S.; Yang, L.; Zhang, X.; Yu, K.; Li, J. Ecological footprint in Beijing-Tianjin-Hebei urban agglomeration: Evolution characteristics, driving mechanism, and compensation standard. Environ. Impact Assess. Rev. 2024, 109, 107649. [Google Scholar] [CrossRef]
- Zhang, F.; Zhu, F. Exploring the temporal and spatial variability of water and land resources carrying capacity based on ecological footprint: A case study of the Beijing-Tianjin-Hebei urban agglomeration, China. Curr. Res. Environ. Sustain. 2022, 4, 100135. [Google Scholar] [CrossRef]
- Obekpa, H.O.; Alola, A.A.; Adejo, A.M.; Echebiri, C. Examining the drivers of ecological footprint components: Is pursuing food security environmentally costly for Nigeria? Ecol. Indic. 2025, 170, 113009. [Google Scholar] [CrossRef]
- Lu, C.; Yu, Z.; Tian, H.; Hennessy, D.A.; Feng, H.; Al-Kaisi, M.; Zhou, Y.; Sauer, T.; Arritt, R. Increasing carbon footprint of grain crop production in the US Western Corn Belt. Environ. Res. Lett. 2018, 13, 124007. [Google Scholar] [CrossRef]
- Pençe, İ.; Çeşmeli, M.Ş.; Kumaş, K.; Akyüz, A.; Tuncer, A.D.; Güngör, A. Study of biocapacity areas to reduce ecological footprint deficits: A case study of Turkey. Sci. Total Environ. 2024, 932, 173018. [Google Scholar] [CrossRef]
- Guo, J. Evaluation and prediction of ecological sustainability in the upper reaches of the Yellow River based on improved three-dimensional ecological footprint model. Int. J. Environ. Res. Public Health 2022, 19, 13550. [Google Scholar] [CrossRef]


| Year | 1990 | 1995 | 2000 | 2005 | 2010 | 2015 | 2020 |
|---|---|---|---|---|---|---|---|
| Moran’s I Index | 0.3453 | 0.1816 | 0.3356 | 0.2627 | 0.3160 | 0.5399 | 0.6442 |
| Expected Index | −0.0076 | −0.0076 | −0.0076 | −0.0076 | −0.0076 | −0.0076 | −0.0076 |
| Variance | 0.0026 | 0.0028 | 0.0030 | 0.0030 | 0.0026 | 0.0032 | 0.0034 |
| Z Variance | 6.9112 | 3.6032 | 6.2898 | 4.9670 | 6.2889 | 9.7195 | 11.2614 |
| p Value | 0.0000 | 0.0003 | 0.0000 | 0.0000 | 0.0000 | 0.0000 | 0.0000 |
Disclaimer/Publisher’s Note: The statements, opinions and data contained in all publications are solely those of the individual author(s) and contributor(s) and not of MDPI and/or the editor(s). MDPI and/or the editor(s) disclaim responsibility for any injury to people or property resulting from any ideas, methods, instructions or products referred to in the content. |
© 2025 by the authors. Licensee MDPI, Basel, Switzerland. This article is an open access article distributed under the terms and conditions of the Creative Commons Attribution (CC BY) license (https://creativecommons.org/licenses/by/4.0/).
Share and Cite
Pan, P.; Yuan, X.; Jiang, Y.; Wang, Y.; Wang, X.; Cao, Y. Three-Dimensional Ecological Footprint Assessment of Cropland in Typical Grain-Producing Regions Based on Carbon Footprint Improvement. Land 2025, 14, 852. https://doi.org/10.3390/land14040852
Pan P, Yuan X, Jiang Y, Wang Y, Wang X, Cao Y. Three-Dimensional Ecological Footprint Assessment of Cropland in Typical Grain-Producing Regions Based on Carbon Footprint Improvement. Land. 2025; 14(4):852. https://doi.org/10.3390/land14040852
Chicago/Turabian StylePan, Peipei, Xiaowen Yuan, Yanan Jiang, Yuan Wang, Xinyun Wang, and Yongqiang Cao. 2025. "Three-Dimensional Ecological Footprint Assessment of Cropland in Typical Grain-Producing Regions Based on Carbon Footprint Improvement" Land 14, no. 4: 852. https://doi.org/10.3390/land14040852
APA StylePan, P., Yuan, X., Jiang, Y., Wang, Y., Wang, X., & Cao, Y. (2025). Three-Dimensional Ecological Footprint Assessment of Cropland in Typical Grain-Producing Regions Based on Carbon Footprint Improvement. Land, 14(4), 852. https://doi.org/10.3390/land14040852